Embed Size (px)
Citation preview
Inadmissible evidence: knowledge and prediction
in land and riverscapes
Graham Harrisa,*, A.L. Heathwaiteb
aUniversity of Tasmania, Sandy Bay, Hobart, Tasmania 7005, AustraliabCentre for Sustainable Water Management, The Lancaster Environment Centre, Lancaster University, Lancaster LA1 4YQ, UK
Received 30 November 2003; revised 1 May 2004; accepted 1 July 2004
Abstract
Analyses of daily water quality data from two streams draining a pair of small coastal catchments in South Devon, England
reveal that what conventionally would be thought to show random noise, has a discernable structure and is clear evidence of
process. Catchment and aquatic systems are non-equilibrium systems and climate drivers cause fluctuations in water quality
both in terms of the concentrations of individual parameters and in the correlations between parameters. The data reveal non-
linear coupling at small scales and show evidence of fractal properties both of which may be evidence of self-organised
phenomena at small scales in catchments and streams. These data show that: (a) water quality and catchment nutrient export
data may be strongly aliased, and (b) there is a fundamental degree of indeterminacy underlying the data we can collect and the
knowledge we can generate from the data. New techniques of data based modelling that use the data itself to define more
parsimonious predictive models are needed because such an approach recognises the partial nature of our knowledge and
requires adequate monitoring and adaptive management programs.
Crown Copyright q 2004 Published by Elsevier B.V. All rights reserved.
Keywords: Fractal; Catchments; Streams; Nutrients
1. Introduction
In a world of overwhelming environmental degra-
dation it is important that we get our basic assump-
tions and tools correct if we are to make progress in
reversing or at least steadying the rate of degradation
and addressing its consequences. Whether or not we
are able to perceive the environmental problems being
0022-1694/$ - see front matter Crown Copyright q 2004 Published by El
doi:10.1016/j.jhydrol.2004.07.020
* Corresponding author.
E-mail addresses: [email protected] (G. Harris), louise.
[email protected] (A.L. Heathwaite).
created, and whether or not we are able to respond
effectively will depend on what evidence we can
muster for environmental degradation, how we
explain the phenomena observed and how we predict
and plan for the outcomes of our actions and set
policy. Traditionally, prediction in landscape and
aquatic science has placed considerable reliance on
various forms of dynamical simulation models. Too
often this reliance does not question the (often built-
in) assumption that the dominant processes are
understood and that catchments, rivers and estuaries
are equilibrium systems with prediction based around
Journal of Hydrology 304 (2005) 3–19
www.elsevier.com/locate/jhydrol
sevier B.V. All rights reserved.
G. Harris, A.L. Heathwaite / Journal of Hydrology 304 (2005) 3–194
central tendencies at timescales from hours to weeks.
Nonetheless, there are some who question this
reliance (Beven, 1989, 1993, 2000; Neal, 1997,
2002, 2004).
Here it is illustrated that catchments, and the water
bodies draining them, contain much contingent small-
scale information, and as a consequence, many widely
accepted models have limited predictive ability: new
analyses of observational data are provided to back up
this proposition. For this, our work focuses on
understanding the outcomes of land use change on
the quality of receiving waters in catchments. Here we
are dealing with the interface between terrestrial and
aquatic systems. This interface is critical but complex
because as the medium changes from land to water,
different rules, rates and dynamics apply. Viewed as a
space-time matrix of possible outcomes, researchers
have assumed that space factors predominate in
terrestrial systems, and time factors are more critical
in aquatic systems. Thus attaining reliable evidence to
demonstrate change and to study pattern and process
across this interface is a challenge.
2. Landscapes and ‘riverscapes’
Catchments and basins are the natural biophysical
units in which human actions have made massive
changes in land use for agriculture and urban
development. Hydrology has been altered through
the building of dams and weirs, extracted water for
irrigation and urban use, and fragmented habitats.
Because biodiversity controls ecosystem and land-
scape function, such intervention in landscapes
changes the spatial and temporal scales of variability
and reduces biodiversity, which in turn leads to
changes in hydrology and the cycling of energy and
nutrients in catchments. It is possible to use water
quality data as indicators of catchment function and
biogeochemistry, and there is growing evidence of
close linkages between changes in land use, hydrol-
ogy, climate, water quality and the condition of our
rivers and estuaries both on contemporary (Harris,
2001; Heathwaite, 1993; Heathwaite et al., 1996;
Heathwaite and Sharpley, 1999; Williams et al., 2002)
and historical (Neal et al., 2004) timeframes. Here, the
question of scale is critical because while biogeo-
chemistry ‘sums’ processes across spatial and
temporal scales in catchments, quite clearly small
scale microbial processes dominate many large scale
patterns (Harris, 1999, 2001).
‘Riverscapes’—aquatic ecosystems within catch-
ments—are particularly useful as model ecological
systems because of the wide range of spatial and
temporal scales encountered: from the large and slow
(kilometres to decades) in catchments, to the small
and fast (micrometres to seconds) in water. Wiens
(2002) describes six central tenets of landscape
ecology which we suggest can be made in the aquatic
context for ‘riverscapes’: (1) patches differ in quality,
(2) patch boundaries affect flows, (3) patch context
matters, (4) connectivity is critical, (5) organisms are
important, and (6) scale is important. In this paper, we
explore what we might learn from these spatial and
temporal controls in the context of water quality
dynamics. For land- and riverscape restoration to be
successful there is an urgent need to better understand
and explain the linkages and pathways between land
use, soil nutrient status and water quality.
Much of what we see in catchments and their water
quality signal seems to emerge from small scale
pattern and process. For example, catchment soils and
their condition are closely linked to water quality
(Engstrom et al., 2000; Markewitz et al., 2001),
especially through small scale interactions with pore
structure and microbial processes (e.g. Harris, 1999).
Kirchner et al. (2000) noted that catchments show
fractal properties arising from the multiplicity of flow
pathways at a range of scales and that white noise
inputs in rainfall are thus turned into fractal 1/f
distributions in catchment exports. Kirchner (2003)
subsequently termed this the ‘double paradox’ of
catchment function. Bishop et al. (2004) provided one
explanation for the highly variable chemistry in
catchment runoff by invoking both vertical and
horizontal heterogeneity in flow paths and responses
to rainfall.
3. Riverscapes from a non-equilibrium viewpoint
Catchments and their aquatic signatures are not
equilibrium systems. There is much contingency and
chance in ecosystem outcomes, particularly in
response to the vagaries of previous floods, droughts
and other extreme events. Catchment systems show
G. Harris, A.L. Heathwaite / Journal of Hydrology 304 (2005) 3–19 5
variability at a wide range of scales; the choice of scale
selected for observation is usually arbitrary and often
made on the basis of either human convenience or on
the availability of research funding. Because many of
the species and processes in aquatic ecosystems are
small and things happen quickly, there are aspects of
their ecology which can be studied within reasonable
time frames from a human point of view. Thus
observations are usually carried out for short periods.
Long time series of data from catchments spanning
decades are rare and often poorly sampled (but see e.g.
Likens and Bormann, 1995). Added to observational
constraints, land and water quality data are notoriously
noisy and flout the standard statistical assumptions of
Gaussian distributions and constant means and var-
iances; this has caused problems with their measure-
ment and interpretation.
The little we do know about catchments and their
receiving waters shows that there are significant
periodicities in the climatological drivers of these
systems at inter-annual, seasonal, 40–50 days, 5–10
day, 1–2 days and diurnal scales (see Burt and
Heathwaite, 1996a; Harris, 1980, 1987; Harris et al.,
1988; Harris and Baxter, 1996; Trudgill et al., 1991).
Much of the high frequency end of the spectrum is very
poorly understood because the data we collect is
weekly at best, and often more infrequently than that.
This makes it difficult to judge the significance of small
scale disequilibrium, and we may be missing important
information here. Water quality time series in
particular show great variability (e.g. Heathwaite
et al., 1996; Johnes and Butterfield, 2002; Wood
et al., in press; Haygarth et al., in press) This variability
has usually been described as being caused by ‘noise’,
and assumed to be the consequence of sampling and
analytical errors. Harris (2003) showed that there is
much information carried in the correlation structure
within water quality data and that what was thought to
be noise was, in fact, evidence of much small scale
information.
Harris (1987) examined the water quality dynamics
of Hamilton Harbour, Ontario, generating water
quality time series ranging from scales of seconds to
years in order to compute the temporal and spatial
variance spectra for the Harbour. The data were
statistically problematical: means and variances were
not constant over the time series, and neither means nor
variances were normally distributed. Detailed analysis
of the relationships between the water quality par-
ameters (e.g. nitrate, phosphate, total N and total P,
etc.) revealed what looked like more noise; all that
appeared to be extractable from the data were variance
spectra, (geometric) means and broad trends. Problems
with the analysis and interpretation of water quality
time series means researchers often resort to using long
term means for sampling stations in catchments (e.g.
Harris, 1999, 2001). Others (e.g. Petersen et al., 2001)
have tried alternative statistical techniques such as
principal component analysis, to decompose time
series of water quality data but, other than broad
distinctions between ‘discharge modes’ and ‘biologi-
biological modes’ little progress appears to have been
made. More recently, a growing number of reports in
the literature describe important small-scale variability
in water quality data from estuaries (Hatje et al., 2001)
and coastal waters (Seuront et al., 2002). For coastal
waters, Seuront et al. (2002) suggested that ‘the
observed small-scale nutrient patches could be the
result of complex interactions between hydrodynamic
conditions, biological processes related to phytoplank-
ton populations, and the productive efficiency of
bacterial populations’.
The time series of water quality measured in rivers,
lakes and coastal waters is therefore, likely to be
influenced by a number of non-equilibrium processes
operating over a wide range of scales and arising both
in interactions between rainfall and soils in the
catchment and processes that operate in situ. These
interactions will vary depending on the relative
strengths of the catchment and in situ influences.
4. Evidence and complexity in earth surface
systems
Reliable evidence for the relationship between
catchment processes, landscape management and
water quality response plays a fundamental role in
our understanding of the way that human activity
modifies the functioning of ecological systems.
Empirical evidence is needed to inform process
understanding. Because our knowledge is partial and
our predictive powers are limited there is a real need
for rapid feedback from knowledge to response.
A downward spiral of misinformation can develop if
our assumptions regarding what we should be
G. Harris, A.L. Heathwaite / Journal of Hydrology 304 (2005) 3–196
measuring or how we should interpret the evidence
generated are flawed. It is critical to decide whether
we are dealing with equilibrium systems or not and to
learn whether this matters and at what scale.
When we work at the interface of land and water
systems, non-equilibrium and non-linear processes are
especially important owing to their impact on
dynamics, spatial and temporal heterogeneity (Wu
and Loucks, 1995), and discontinuities and multiple
equilibria at a range of scales (O’Neill, 1999). Many
properties of landscapes show fractal-like variability
across a wide range of temporal and spatial scales
(Lohle and Li, 1996; Sole et al., 1999; Li, 2000; Brown
et al., 2002). It also appears that the concentrations of
elements in stream flow show 1/f scaling properties and
memories of events at all scales (Kirchner et al., 2000;
Feng et al., 2004). While fractal properties may be used
as evidence of self-organised criticality (Bak et al.,
1988) care should be exercised in the interpretation of
apparently fractal data in ecology because pattern does
not necessarily imply process and many data sets can
show apparently fractal properties for a number of
reasons (Halley et al., 2004). Strictly speaking, data
about process should be multi-fractal rather than
fractal (Halsey and Jensen, 2004) and some of the
best data from planktonic systems which span many
scales seems to show this (Seuront et al., 1999).
However, in many cases, the amount of information
available is limited and detailed analysis to the degree
required for such an assessment is often missing:
Kirchner et al. (2004) shows using continuous
monitoring of conductivity and pH that there is
considerable information potentially available with
very fine resolution river water quality data over long
time periods, but the frequency of observation required
may be of the order of minutes to hours. Whatever the
generating mechanism, because variability in many
data can show apparently self similar properties across
a wide range of scales, prediction, particularly for
things like community composition and catchment
dynamics is a matter of some difficulty (Lawton, 1999).
As we begin to deal with and understand complexity
in all its forms, and as we develop the necessary
conceptual tools, the philosophy of scientific enquiry is
changing. We are shifting from attempts to articulate
‘theories of everything’ to more partial explanations that
recognise the intrinsic complexity and logical depth of
natural phenomena, and the necessarily partial nature
of evidence and explanation (Cartwright, 1999).
Fox Keller (2002) noted that there is a strong distinction
between the philosophy and practice—between the
status of evidence and explanation—in physics and
biology. In physics, theory has precedence; evidence is
collected to confirm or refute the fundamental theoreti-
cal basis of the science. In biology on the other hand,
evidence has precedence over theory - so that biological
explanations are contingent and may take the form of
explanations or descriptions of natural history (Gould,
1991). Our understanding of catchment dynamics is
beginning to shift away from theory laden ‘physics
envy’ to a more sensitive reliance on what the data
actually tells us (e.g. Young, 1998). Beven (2002) has
argued for a kind of philosophical realism in catchment
modelling; a recognition of the partial and incomplete
nature of our knowledge because of differences between
places and of complexity in pathways and process. Neal
(1997) argues that there is a need towards assessing
structural rather than parameter uncertainty within
hydrochemical models within the theme of emergent
properties: by exploring different structural models,
some feel for the range of potential environmental
impacts can be gained. Neal (1997) also argues that an
assessment of parameter uncertainty provides no
information of any use for deciding the overall
predictive error given the uncertainty in the model
structure for what are highly heterogeneous catchment
systems. Data gathering networks provide a baseline of
information but ‘missing variables, low resolution,
inadequate duration, temporal and spatial gaps, and
declining coverage are pervasive limitations’ (Clark et
al., 2001). In recognising that our knowledge is partial,
and that any evidence upon which catchment policy and
management action is based is partial, there is an urgent
need to fully exploit the available evidence using
appropriate tools, so we can move forward, take action,
monitor progress and learn from our experiences.
5. Water quality data from two small catchments
in England
5.1. Time series analyses of the Gara and Start
catchment data
Here, time series of water quality data from two
adjacent sub-catchments of the 46 km2 Slapton
G. Harris, A.L. Heathwaite / Journal of Hydrology 304 (2005) 3–19 7
catchment, southwest Devon, UK, are examined. The
data analysed were from the Gara and Start catch-
ments which comprise the majority of the flow into
Slapton Ley. Details of catchment hydrology, stream
water quality and nutrient exports along with long
term studies at this site may be found in Burt and
Heathwaite (1996a,b) Burt et al. (1996) and
Heathwaite, Johnes (1996) and . Daily time series of
water quality data from two adjacent catchments were
reconstructed in part from the data presented in
Heathwaite and Burt (1991) and Johnes and
Heathwaite (1997). Data presented by Burt and
Heathwaite (1996a,b) and Burt et al. (1996) showed
that the sampling period was not exceptional in terms
of temperature or rainfall in these catchments.
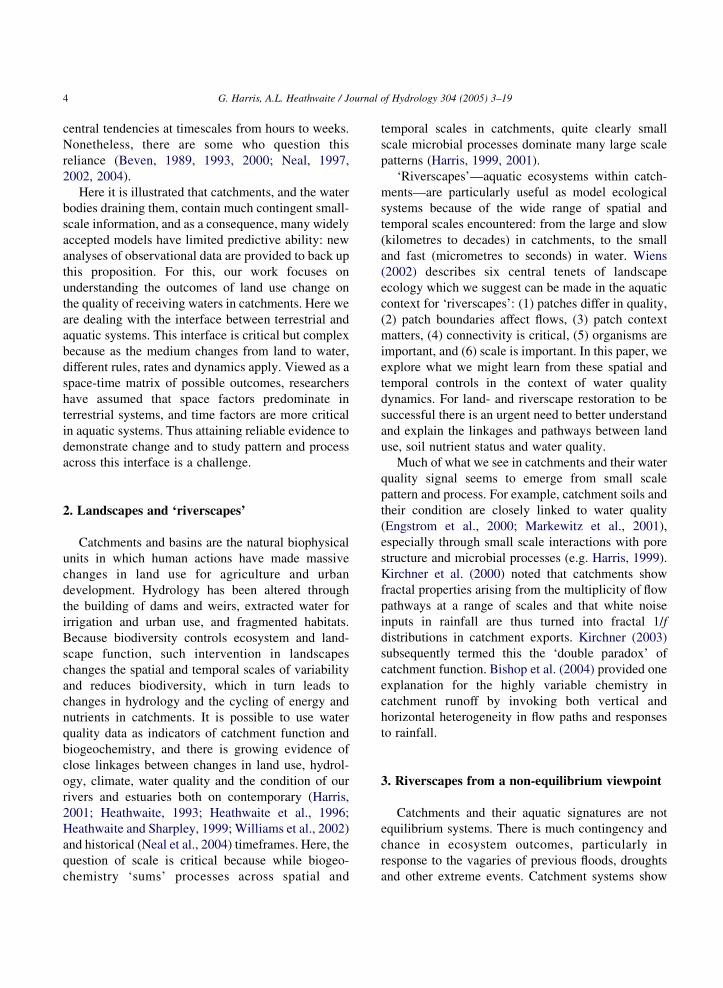
Fig. 1. Time series of discharge (m3 sK1), NO3–N (mg lK1) and PO4–P (m
Oct 1987–1 Oct 1988.
Furthermore, 1987–88 does not stand out in any of
the long term weather records for this period being of
average rainfall and evaporation (Burt and Horton,
2001).
An initial exploration of the daily water quality
data at Higher North Mill in the Gara catchment and at
Deer Bridge in the Start catchment from 1 October
1987 to 1 October 1988 was carried out using classical
time series techniques (Box and Jenkins, 1976). The
data revealed both climate driven variability through
periodic rainfall events and long term trends (Figs. 1
and 2). The data clearly showed all the usual problems
which frequentist statistical approaches must tackle
when dealing with hydrological and water quality
time series; non-Gaussian distributions, non-
g lK1) for the Start sub-catchment at Deer Bridge, Slapton, Devon, 1
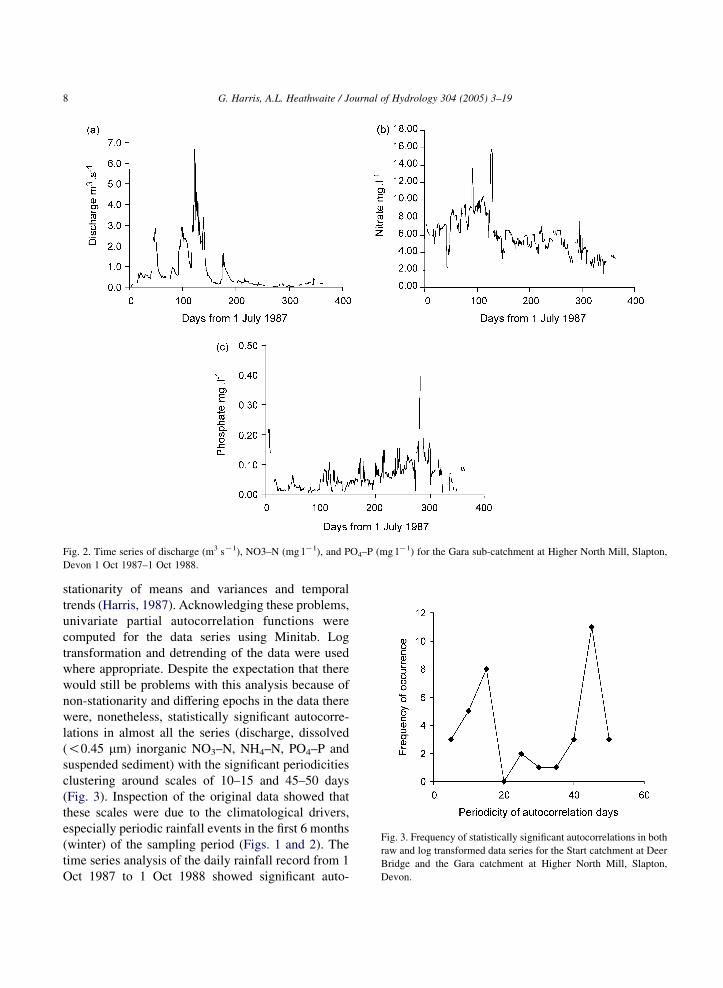
Fig. 2. Time series of discharge (m3 sK1), NO3–N (mg lK1), and PO4–P (mg lK1) for the Gara sub-catchment at Higher North Mill, Slapton,
Devon 1 Oct 1987–1 Oct 1988.
Fig. 3. Frequency of statistically significant autocorrelations in both
raw and log transformed data series for the Start catchment at Deer
Bridge and the Gara catchment at Higher North Mill, Slapton,
Devon.
G. Harris, A.L. Heathwaite / Journal of Hydrology 304 (2005) 3–198
stationarity of means and variances and temporal
trends (Harris, 1987). Acknowledging these problems,
univariate partial autocorrelation functions were
computed for the data series using Minitab. Log
transformation and detrending of the data were used
where appropriate. Despite the expectation that there
would still be problems with this analysis because of
non-stationarity and differing epochs in the data there
were, nonetheless, statistically significant autocorre-
lations in almost all the series (discharge, dissolved
(!0.45 mm) inorganic NO3–N, NH4–N, PO4–P and
suspended sediment) with the significant periodicities
clustering around scales of 10–15 and 45–50 days
(Fig. 3). Inspection of the original data showed that
these scales were due to the climatological drivers,
especially periodic rainfall events in the first 6 months
(winter) of the sampling period (Figs. 1 and 2). The
time series analysis of the daily rainfall record from 1
Oct 1987 to 1 Oct 1988 showed significant auto-
G. Harris, A.L. Heathwaite / Journal of Hydrology 304 (2005) 3–19 9
correlation at a scale of 39 days and a peak in spectral
power at 42 days.
5.2. A new approach using moving correlations
Given the character of the data series, a new
approach to the analysis of water quality data using
moving correlation windows was used to display
the inter-relationships and correlations between
bivariate time series of water quality parameters
as they change over time. The concept is similar to
moving averages, with correlation (R2) values
calculated for moving windows of defined widths,
moving stepwise along the length of time series
data. Traditionally, time series analysis assumes
that the data and the generating functions of cross-
correlations are stationary over the entire length of
the series (Box and Jenkins, 1976), so a moving
correlation approach has been used in a number of
applications where it was expected that the
magnitude or sign of the correlation between a
pair of variables would change with time. This
approach has been used in climatology (Kumar and
Dash, 2001) and in medical science (Balestreri
et al., 2004), and a similar technique involving
moving spatial windows rather than moving
temporal windows has also been published (Bolvi-
ken et al., 1997). The application of this technique
to water quality data was justified based on work
by Harris (1987) that discussed the existence of
epochs within such data where the sign of
correlations between parameters changed during
sampling periods.
Moving correlation analysis can easily be carried
out using spreadsheets. The statistical significance of
the correlation coefficients obtained by this analysis
can be found from standard tables (e.g. Bishop, 1966)
by assuming that the number of degrees of freedom is
one less than the width of the correlation window
used. To an approximation, the variance of the
correlation estimator is inversely proportional to the
bandwidth of the window used, so that the product of
bandwidth and variance is constant (Jenkins and Watt
1968). This means that moving correlation windows
with narrow bandwidths reveal short epochs of
changing signs in the data but these are noisy,
whereas windows with larger bandwidths can only
reveal longer epochs but do so with greater
confidence.
The correlations between the water quality data
over 4–6 day periods (chosen to be shorter than
the short term 10–15 day periodicity in the date
series) showed strong switches between positive
and negative correlations over the length of the
time series. (Harris (2003) examined similar trends in
water quality data from rivers, lakes and coastal
waters and came to similar conclusions). Whilst the
correlation between PO4–P and NH4–N was often
positive there were significant periods when the
correlation was strongly negative. The probability
density functions of the correlations (pdfs) were
highly non-Gaussian and decidedly non-random. By
varying the width of the moving window it was
possible to show that most time series had statisti-
cally significant patterns of variability in the band
width (moving correlation window) from 4 to 10 data
points. Below 4 data points the sample sizes were so
small as to require unrealistically high R2 values for
significance (for 3 data points R2O0.95). Above 10
data points (where the required R2 for pZ0.05 O0.602) the moving correlation averaged out signifi-
cant (and large) switches in the correlation coefficient
to the extent that statistical significance was rapidly
lost.
Water quality data appear to show decidedly non-
random correlated fluctuations between parameters
but these correlations change sign during short epochs
in the data. Here lies an explanation for the fact that
cross-correlation patterns between variables in water
quality time series that might reasonably be expected
to be statistically significant are frequently not so and
hence are dismissed as noise. Without a moving
window approach, the band width of the entire series
is usually too long to reveal the high frequency
correlation patterns in the data. Also weekly (or less
frequent) sampling of these catchments would lead to
severe aliasing problems and would also lead to the
data being dismissed as noise.
Because random time series can also show these
apparent switches in the sign of the correlation
between series when treated with moving correlation
techniques it was necessary to test for the significance
of the patterns in the cross-correlations. Kolmogorov–
Smirnoff (K–S) tests were use here to assess for
significant differences in the probability density
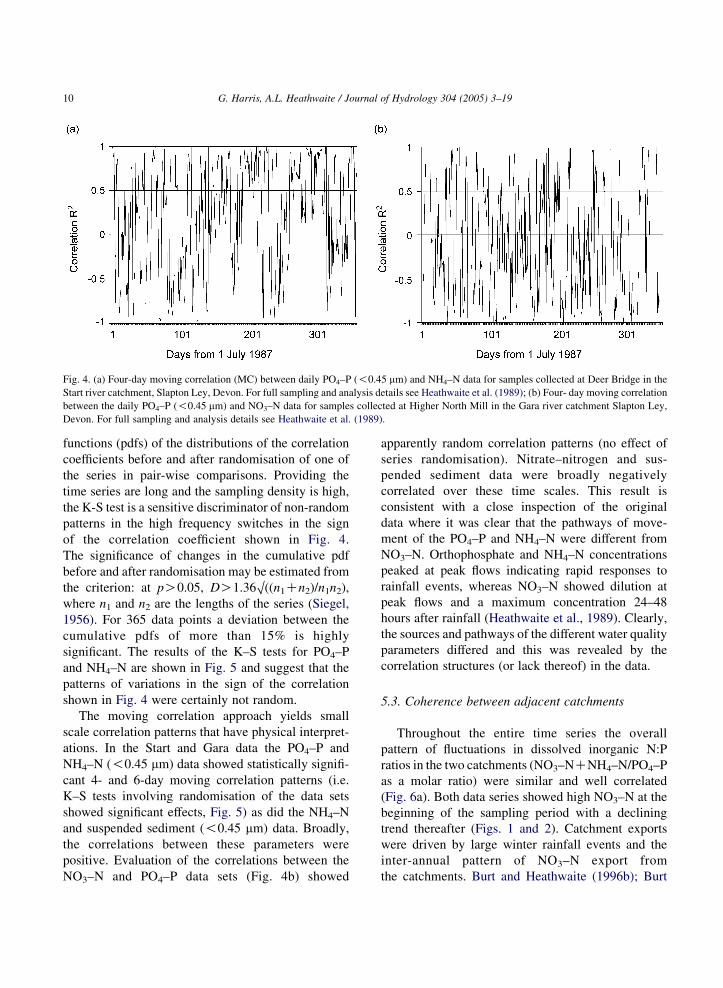
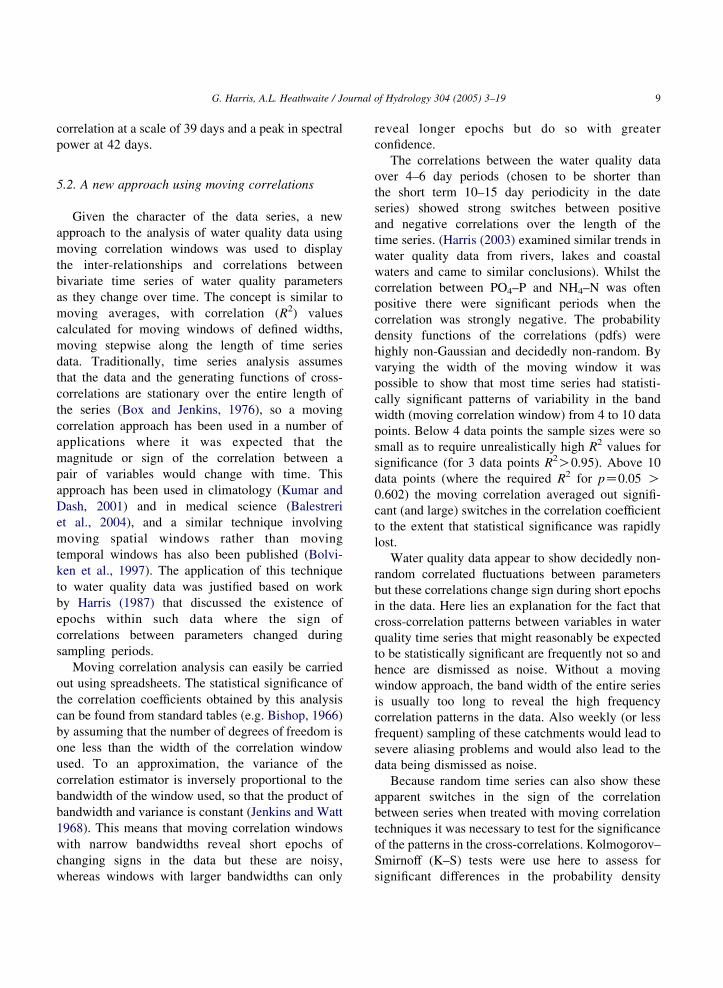
Fig. 4. (a) Four-day moving correlation (MC) between daily PO4–P (!0.45 mm) and NH4–N data for samples collected at Deer Bridge in the
Start river catchment, Slapton Ley, Devon. For full sampling and analysis details see Heathwaite et al. (1989); (b) Four- day moving correlation
between the daily PO4–P (!0.45 mm) and NO3–N data for samples collected at Higher North Mill in the Gara river catchment Slapton Ley,
Devon. For full sampling and analysis details see Heathwaite et al. (1989).
G. Harris, A.L. Heathwaite / Journal of Hydrology 304 (2005) 3–1910
functions (pdfs) of the distributions of the correlation
coefficients before and after randomisation of one of
the series in pair-wise comparisons. Providing the
time series are long and the sampling density is high,
the K-S test is a sensitive discriminator of non-random
patterns in the high frequency switches in the sign
of the correlation coefficient shown in Fig. 4.
The significance of changes in the cumulative pdf
before and after randomisation may be estimated from
the criterion: at pO0.05, DO1.36O((n1Cn2)/n1n2),
where n1 and n2 are the lengths of the series (Siegel,
1956). For 365 data points a deviation between the
cumulative pdfs of more than 15% is highly
significant. The results of the K–S tests for PO4–P
and NH4–N are shown in Fig. 5 and suggest that the
patterns of variations in the sign of the correlation
shown in Fig. 4 were certainly not random.
The moving correlation approach yields small
scale correlation patterns that have physical interpret-
ations. In the Start and Gara data the PO4–P and
NH4–N (!0.45 mm) data showed statistically signifi-
cant 4- and 6-day moving correlation patterns (i.e.
K–S tests involving randomisation of the data sets
showed significant effects, Fig. 5) as did the NH4–N
and suspended sediment (!0.45 mm) data. Broadly,
the correlations between these parameters were
positive. Evaluation of the correlations between the
NO3–N and PO4–P data sets (Fig. 4b) showed
apparently random correlation patterns (no effect of
series randomisation). Nitrate–nitrogen and sus-
pended sediment data were broadly negatively
correlated over these time scales. This result is
consistent with a close inspection of the original
data where it was clear that the pathways of move-
ment of the PO4–P and NH4–N were different from
NO3–N. Orthophosphate and NH4–N concentrations
peaked at peak flows indicating rapid responses to
rainfall events, whereas NO3–N showed dilution at
peak flows and a maximum concentration 24–48
hours after rainfall (Heathwaite et al., 1989). Clearly,
the sources and pathways of the different water quality
parameters differed and this was revealed by the
correlation structures (or lack thereof) in the data.
5.3. Coherence between adjacent catchments
Throughout the entire time series the overall
pattern of fluctuations in dissolved inorganic N:P
ratios in the two catchments (NO3–NCNH4–N/PO4–P
as a molar ratio) were similar and well correlated
(Fig. 6a). Both data series showed high NO3–N at the
beginning of the sampling period with a declining
trend thereafter (Figs. 1 and 2). Catchment exports
were driven by large winter rainfall events and the
inter-annual pattern of NO3–N export from
the catchments. Burt and Heathwaite (1996b); Burt
Fig. 5. (a–c) Probability density function plots for the 4-day moving correlations (MCs) between PO4–P and NH4–N before and after
randomisation of one of the series and the corresponding cumulative probability plots. By the Kolmogorov–Smirnoff test for data series 365
points long any difference in cumulative probability greater than 10% is likely to be significant at the 5% level.
G. Harris, A.L. Heathwaite / Journal of Hydrology 304 (2005) 3–19 11
et al. (1996) discussed the long term, inter-annual,
pattern of NO3–N dynamics in the Slapton catchments
and showed that they were largely determined by
inter-annual variability in temperature, rainfall and
evaporation with larger NO3–N export after relatively
dry years. Thus at annual scales, the two catchments
showed similar dynamics, but in detail the responses
over shorter time scales were very different.
Analysis of the relationship between the dissolved
inorganic N:P ratios in the two catchments using 6
day moving correlations showed significant period-
icities at scales of 42 days and decidedly non-random
pdfs (Figs. 6b–d) so that comparison of the original
moving correlation data series with its randomised
counterpart showed very significant changes
(Fig. 6e).
A comparison of the correlation patterns between
NH4–N and PO4–P at 4–6 day scales in these small
adjacent catchments indicated poor coherence (Fig. 7).
The combination of steep slopes, permeable soil over
impermeable bedrock, and high rainfall, encourages
the production of large volumes of subsurface runoff
(Burt and Heathwaite, 1996b). Quickflow (i.e. that
fraction of precipitation which rapidly reaches the
stream channel and is usually associated with high
discharge) accounts for a small (c. 1%) of the annual
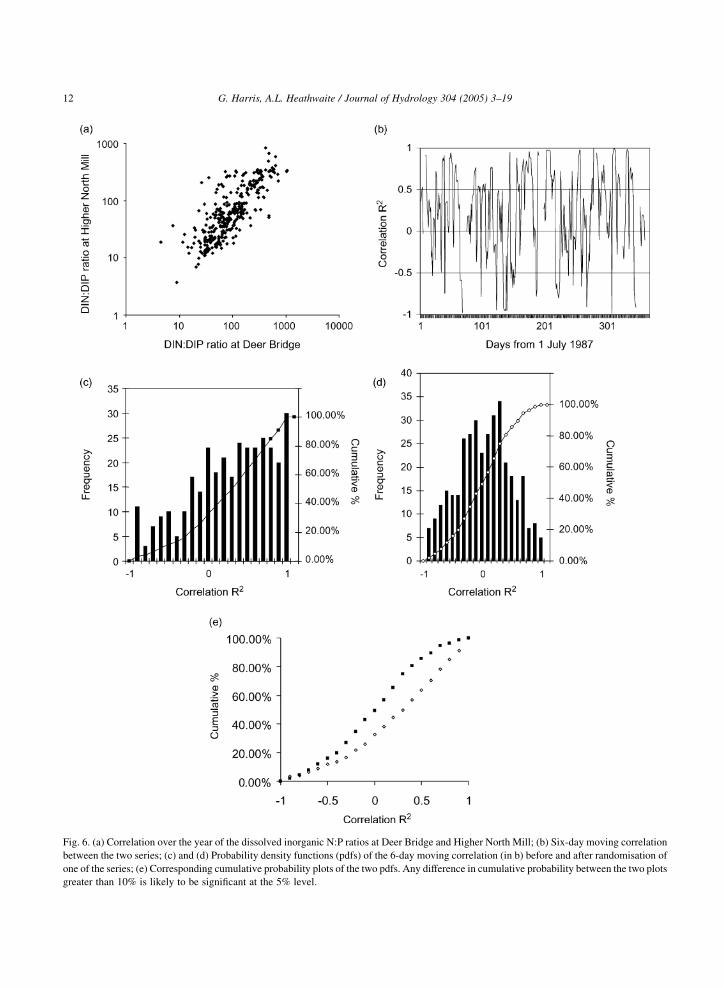
Fig. 6. (a) Correlation over the year of the dissolved inorganic N:P ratios at Deer Bridge and Higher North Mill; (b) Six-day moving correlation
between the two series; (c) and (d) Probability density functions (pdfs) of the 6-day moving correlation (in b) before and after randomisation of
one of the series; (e) Corresponding cumulative probability plots of the two pdfs. Any difference in cumulative probability between the two plots
greater than 10% is likely to be significant at the 5% level.
G. Harris, A.L. Heathwaite / Journal of Hydrology 304 (2005) 3–1912
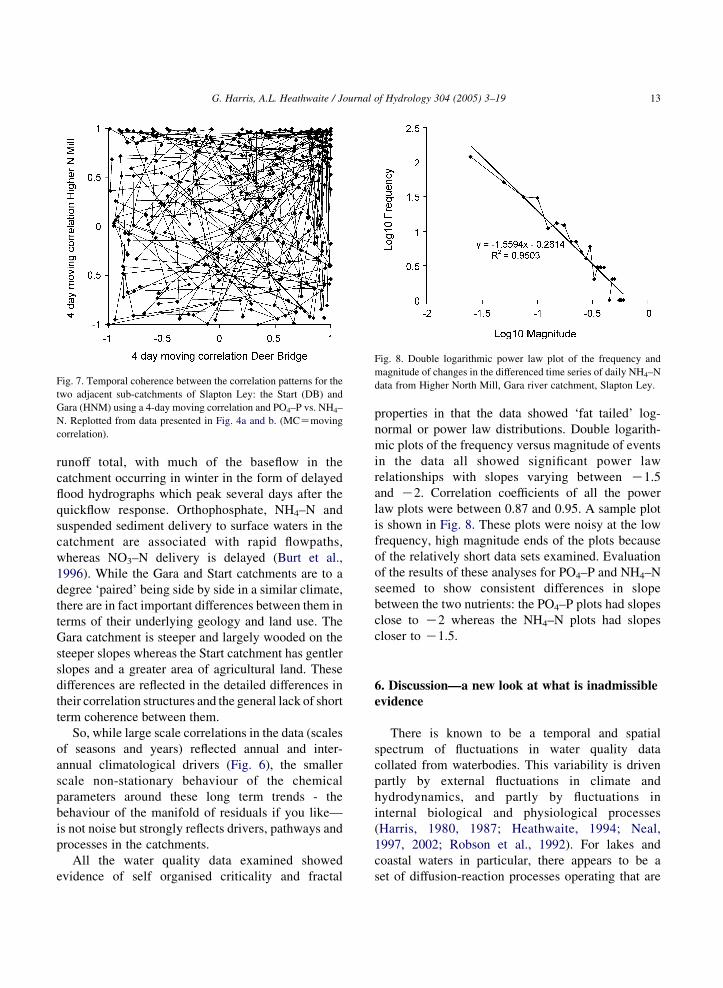
Fig. 7. Temporal coherence between the correlation patterns for the
two adjacent sub-catchments of Slapton Ley: the Start (DB) and
Gara (HNM) using a 4-day moving correlation and PO4–P vs. NH4–
N. Replotted from data presented in Fig. 4a and b. (MCZmoving
correlation).
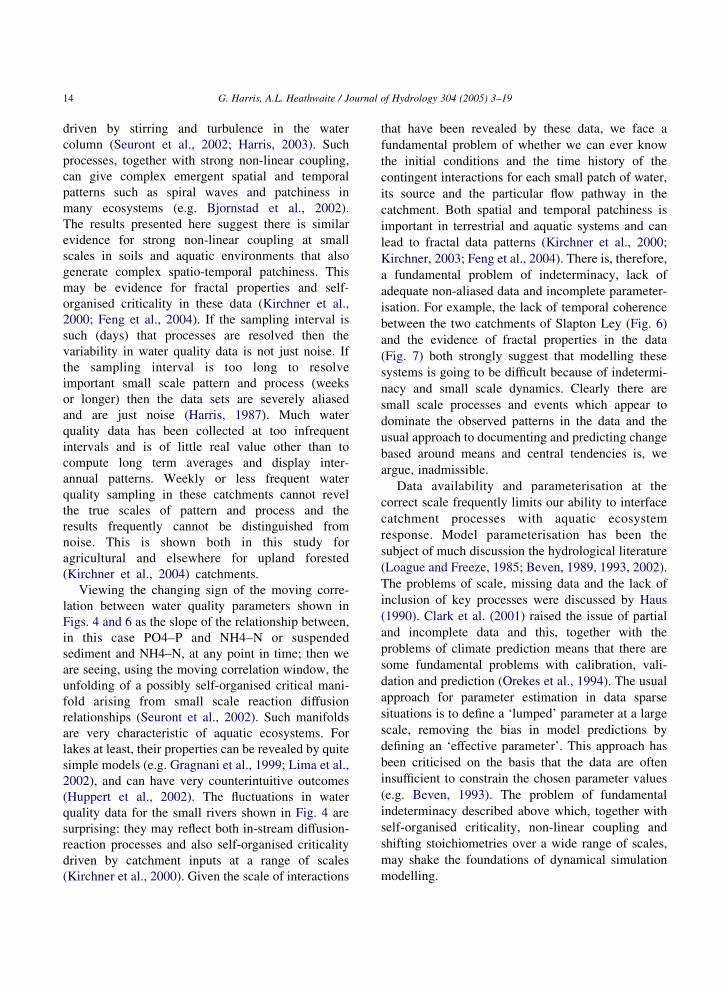
Fig. 8. Double logarithmic power law plot of the frequency and
magnitude of changes in the differenced time series of daily NH4–N
data from Higher North Mill, Gara river catchment, Slapton Ley.
G. Harris, A.L. Heathwaite / Journal of Hydrology 304 (2005) 3–19 13
runoff total, with much of the baseflow in the
catchment occurring in winter in the form of delayed
flood hydrographs which peak several days after the
quickflow response. Orthophosphate, NH4–N and
suspended sediment delivery to surface waters in the
catchment are associated with rapid flowpaths,
whereas NO3–N delivery is delayed (Burt et al.,
1996). While the Gara and Start catchments are to a
degree ‘paired’ being side by side in a similar climate,
there are in fact important differences between them in
terms of their underlying geology and land use. The
Gara catchment is steeper and largely wooded on the
steeper slopes whereas the Start catchment has gentler
slopes and a greater area of agricultural land. These
differences are reflected in the detailed differences in
their correlation structures and the general lack of short
term coherence between them.
So, while large scale correlations in the data (scales
of seasons and years) reflected annual and inter-
annual climatological drivers (Fig. 6), the smaller
scale non-stationary behaviour of the chemical
parameters around these long term trends - the
behaviour of the manifold of residuals if you like—
is not noise but strongly reflects drivers, pathways and
processes in the catchments.
All the water quality data examined showed
evidence of self organised criticality and fractal
properties in that the data showed ‘fat tailed’ log-
normal or power law distributions. Double logarith-
mic plots of the frequency versus magnitude of events
in the data all showed significant power law
relationships with slopes varying between K1.5
and K2. Correlation coefficients of all the power
law plots were between 0.87 and 0.95. A sample plot
is shown in Fig. 8. These plots were noisy at the low
frequency, high magnitude ends of the plots because
of the relatively short data sets examined. Evaluation
of the results of these analyses for PO4–P and NH4–N
seemed to show consistent differences in slope
between the two nutrients: the PO4–P plots had slopes
close to K2 whereas the NH4–N plots had slopes
closer to K1.5.
6. Discussion—a new look at what is inadmissibleevidence
There is known to be a temporal and spatial
spectrum of fluctuations in water quality data
collated from waterbodies. This variability is driven
partly by external fluctuations in climate and
hydrodynamics, and partly by fluctuations in
internal biological and physiological processes
(Harris, 1980, 1987; Heathwaite, 1994; Neal,
1997, 2002; Robson et al., 1992). For lakes and
coastal waters in particular, there appears to be a
set of diffusion-reaction processes operating that are
G. Harris, A.L. Heathwaite / Journal of Hydrology 304 (2005) 3–1914
driven by stirring and turbulence in the water
column (Seuront et al., 2002; Harris, 2003). Such
processes, together with strong non-linear coupling,
can give complex emergent spatial and temporal
patterns such as spiral waves and patchiness in
many ecosystems (e.g. Bjornstad et al., 2002).
The results presented here suggest there is similar
evidence for strong non-linear coupling at small
scales in soils and aquatic environments that also
generate complex spatio-temporal patchiness. This
may be evidence for fractal properties and self-
organised criticality in these data (Kirchner et al.,
2000; Feng et al., 2004). If the sampling interval is
such (days) that processes are resolved then the
variability in water quality data is not just noise. If
the sampling interval is too long to resolve
important small scale pattern and process (weeks
or longer) then the data sets are severely aliased
and are just noise (Harris, 1987). Much water
quality data has been collected at too infrequent
intervals and is of little real value other than to
compute long term averages and display inter-
annual patterns. Weekly or less frequent water
quality sampling in these catchments cannot revel
the true scales of pattern and process and the
results frequently cannot be distinguished from
noise. This is shown both in this study for
agricultural and elsewhere for upland forested
(Kirchner et al., 2004) catchments.
Viewing the changing sign of the moving corre-
lation between water quality parameters shown in
Figs. 4 and 6 as the slope of the relationship between,
in this case PO4–P and NH4–N or suspended
sediment and NH4–N, at any point in time; then we
are seeing, using the moving correlation window, the
unfolding of a possibly self-organised critical mani-
fold arising from small scale reaction diffusion
relationships (Seuront et al., 2002). Such manifolds
are very characteristic of aquatic ecosystems. For
lakes at least, their properties can be revealed by quite
simple models (e.g. Gragnani et al., 1999; Lima et al.,
2002), and can have very counterintuitive outcomes
(Huppert et al., 2002). The fluctuations in water
quality data for the small rivers shown in Fig. 4 are
surprising: they may reflect both in-stream diffusion-
reaction processes and also self-organised criticality
driven by catchment inputs at a range of scales
(Kirchner et al., 2000). Given the scale of interactions
that have been revealed by these data, we face a
fundamental problem of whether we can ever know
the initial conditions and the time history of the
contingent interactions for each small patch of water,
its source and the particular flow pathway in the
catchment. Both spatial and temporal patchiness is
important in terrestrial and aquatic systems and can
lead to fractal data patterns (Kirchner et al., 2000;
Kirchner, 2003; Feng et al., 2004). There is, therefore,
a fundamental problem of indeterminacy, lack of
adequate non-aliased data and incomplete parameter-
isation. For example, the lack of temporal coherence
between the two catchments of Slapton Ley (Fig. 6)
and the evidence of fractal properties in the data
(Fig. 7) both strongly suggest that modelling these
systems is going to be difficult because of indetermi-
nacy and small scale dynamics. Clearly there are
small scale processes and events which appear to
dominate the observed patterns in the data and the
usual approach to documenting and predicting change
based around means and central tendencies is, we
argue, inadmissible.
Data availability and parameterisation at the
correct scale frequently limits our ability to interface
catchment processes with aquatic ecosystem
response. Model parameterisation has been the
subject of much discussion the hydrological literature
(Loague and Freeze, 1985; Beven, 1989, 1993, 2002).
The problems of scale, missing data and the lack of
inclusion of key processes were discussed by Haus
(1990). Clark et al. (2001) raised the issue of partial
and incomplete data and this, together with the
problems of climate prediction means that there are
some fundamental problems with calibration, vali-
dation and prediction (Orekes et al., 1994). The usual
approach for parameter estimation in data sparse
situations is to define a ‘lumped’ parameter at a large
scale, removing the bias in model predictions by
defining an ‘effective parameter’. This approach has
been criticised on the basis that the data are often
insufficient to constrain the chosen parameter values
(e.g. Beven, 1993). The problem of fundamental
indeterminacy described above which, together with
self-organised criticality, non-linear coupling and
shifting stoichiometries over a wide range of scales,
may shake the foundations of dynamical simulation
modelling.
G. Harris, A.L. Heathwaite / Journal of Hydrology 304 (2005) 3–19 15
7. The implications for modelling and prediction
Research linking catchment processes and water
quality impact has traditionally been based on either
simple empirical relationships or on simulation
modelling. Empirical models have shown considerable
success - most notably the relationship between total
phosphorus export from catchments and algal biomass
response (Vollenweider, 1968). This relationship still
forms the basis of much lake management worldwide
providing probabilistic predictions of algal blooms.
Dynamical simulation models of catchments and
receiving waters replace probabilistic distributions
with deterministic equations; the resulting models are
strongly scale dependent. In catchment modelling,
this approach relies on large sets of differential
equations to describe ecological processes, major
functional groups and their interactions. The models
deterministically represent noisy, non-equilibrium
systems and average out the natural variability at a
wide range of temporal and spatial sales. No attempt
is made to represent all interactions, relying instead
on a ‘lumped’ representation of the ecosystem. These
models can either be used heuristically to synthesise
knowledge and to guide further data collection or
they can be used to predict the outcomes of
management action and other forms of human
intervention. Either way they form the basis of
explanations of catchment processes and use aver-
aged and simplified space-time distributions and
interactions.
Of course, an ability to fit the data does not, in
itself, make any definitive statement about the
adequacy of the model structure or its parameterisa-
tion (Klemes, 1986; Rykiel, 1996). So doubts remain,
and include concerns regarding the philosophical
basis of dynamical simulation modelling, first voiced
by Berlinski, 1976, and the ability to calibrate and
validate such models (Orekes et al., 1994). The latter
concern is critical given that calibration data is also
partial and noisy because any set of catchment and/or
water quality data is a sample from the normal spatial
and temporal variability encountered in natural
systems. Consequently, such data are aliased and are
sparse samples that are unrepresentative of the full
spectrum of natural variability (Clark et al., 2001). To
get round this, analysis of water quality data often
relies on mean values on the assumption that observed
variability is noise and the parameters are uncorre-
lated. Simulation models can only model the central
tendencies in such data - not the actual small scale
variability (Harris, 1999). Although dynamical simu-
lation models of water bodies can show large scale
hysteresis effects (e.g. Harris et al., 1996; Murray
and Parslow, 1999a,b) which are quite realistic (e.g.
Scheffer et al., 2001), the existence of small scale non-
linearity and cross-correlations between parameters is
of concern, and unlikely to be just ‘noise’ in most
cases. This is because our evidence is based on partial
information and our explanations rely on unrepresen-
tative, deterministic dynamical models. Observations
bear out this assertion. Magnusson et al. (1990), for
example, showed that the temporal unfolding of a
suite of properties from a group of ‘similar’ lakes was
unpredictable, and Reynolds (1986) had the same
problems with attempts at ecosystem scale ‘controls’
in large enclosures.
What the presence of small scale dynamics shows
is that hysteresis and non-linearity at small scales may
be sufficient to render the predictions of simulation
models and management interventions unsafe at
larger scales or higher levels. In the data reported
here, the molar export ratios of dissolved inorganic
N:P change over the year by more than two orders of
magnitude (O600 to ! 5, Fig. 6) and the 6 day
moving correlation series showed significant 42 day
periodicities so the Higher and Lower Ley at Slapton
is being loaded by drastically changing stoichio-
metries both at inter-annual scales and at scales of 40–
50 days - long enough to stimulate the growth of
different algal species in the lake from month to
month and from year to year. Herein must lay some
explanation for the initiation of algal blooms of
different species in receiving waters.
Systems which show evidence of self-organised
criticality and fractal properties also frequently show
emergent properties and surprising behaviours.
Clearly there are fundamental limitations to our
ability to measure and predict the variability in
catchments, rivers and estuaries. Stochastic events
can lead to hysteresis effects and state shifts in natural
ecosystems (Scheffer et al., 2001). Any predictions
had, therefore, better be probabilistic and hedged
about with uncertainty because there may be more
than one set of parameterisations and more than one
set of parameter values that can give equally
G. Harris, A.L. Heathwaite / Journal of Hydrology 304 (2005) 3–1916
acceptable predictions of the observational data
available. This is the problem of non-uniqueness, or
equifinality described by Beven (2000). As Neal
(1997) pointed out, there are issues of structural rather
than parameter uncertainty that needs to be addressed:
the point is that with parameter uncertainty, there is
the assumption that the model is in essence structu-
rally correct and this is inconsistent with the complex-
ity that is observed for the highly heterogeneous
studies being modelled. We suggest therefore, that
there is a problem, not only with the evidence
collected, but also with attempts at synthesis and
explanation.
Raupach et al. (2002) described a method for
evaluating the prediction bias in simulation models.
They suggest that the reliability of the aggregated
model depends critically on the accurate estimation of
the means, variances and co-variances of model
variables and parameters. The authors showed that
considerable bias may be introduced if the higher
order terms in models are large (i.e. if there are
significant non-Gaussian distributions in the pdfs of
the values and the co-variances are significant - as
demonstrated in the water quality data presented
here). Clearly, if estimates of the means, variances
and co-variances are not available, then attempts to
improve the performance of an aggregated model by
further measurement of only the mean variables and
parameters are: “futile, because measurements of
mean quantities cannot eliminate bias arising from the
interaction between model non-linearity and small-
scale variability” (Raupach et al., 2002). This problem
is exemplified in landscapes and riverscapes where,
for example, changes to catchment land use not only
changes the annual averaged nutrient loads to rivers
and estuaries but also changes flood frequencies and
the frequency and magnitude of events. Webster and
Harris (2004) have used simple models to show that
estuaries are surprisingly sensitive to changes in the
frequency and magnitude of nutrient loads. Annually
averaged loads of single nutrient parameters are not
sufficient to describe the response of these receiving
waters to catchment exports. Changing stoichi-
ometries over ecologically significant time scales
will only complicate the picture. A further compli-
cation arises because the underlying stochastic drivers
of catchment systems, as well as the (self-organised)
internal dynamics lead to the observed biodiversity
(Gragnani et al., 1999; Huisman and Weissing, 1999);
and we know that the biodiversity controls the overall
function, often in idiosyncratic ways (Emmerson
et al., 2001). While there are some overall patterns
of response, dynamical simulation models do not
predict the dynamics, emergence, contingency and
biodiversity of real world systems.
This analysis leads us to conclude that the
fundamental question that needs to be answered is
how often do the small scale contingency, indetermi-
nacy, non-linearity and the cross-correlations high-
lighted above generate instability at higher levels so
as to render predictions of central tendencies unsafe?
8. New technologies for data collection—the way
forward?
New technologies are now available, particularly
in the area of hydrology and water quality, which
make it possible to collect more complete and
representative data sets. Automatic sampling equip-
ment, in situ chemical analytical facilities and new
automatic probes, coupled with telemetry and data
storage for remote data acquisition make it possible
to collect high frequency data from catchments and
rivers which are more representative of the full
range of spatial and temporal scales of variability.
These technological advances mean it is viable to
shift away from arbitrarily chosen sampling
schemes to a more complete analysis of the most
significant time and space scales - and then to
optimise the sampling accordingly. This, in itself,
will produce more concrete evidence of the links
between land use and river water quality and
ecology degradation and provide a firmer baseline
for ‘evidence based’ policy development and
management interventions. Such data may be used
to derive parsimonious data-driven models upon
which to base management action and policy
development (Kokkonen et al., 2003; Young,
1998, 1999, 2000). Models may be developed
which use as much information as is available in
the data.
In a world of climate and land use change we need
to know what is changing over what time scales and
what evidence of change is required.
G. Harris, A.L. Heathwaite / Journal of Hydrology 304 (2005) 3–19 17
Acknowledgements
This paper could not have been written without key
intellectual inputs from Richard Vollenweider in
Canada whose insights and letter started it all. As
far as we know Richard Vollenweider was the first to
suggest that moving correlation approaches should be
applied to the analysis of water quality data. In
addition we want to thank Peter Young (Lancaster
University) and Phil Haygarth (IGER) who have
helped with the development of these ideas. David
Fox helped us with statistical advice.
References
Bak, P., Tang, C., Wiesenfeld, K., 1988. Self-organised criticality.
Physical Review, A 38, 364–374.
Balestreri, M., Czosnyka, M., Steiner, L.A., Schmidt, E.,
Smielewski, P., Matta, B., Pickard, J.D., 2004. Intracranial
hypertension: what additional information can be derived from
ICP waveform after head injury. Acta Neurochirurgica 146,
131–141.
Berlinski, D., 1976. On systems analysis: an essay concerning the
limitations of some mathematical models in the social, political
and biological sciences. The MIT Press, Cambridge, MA.
Beven, K., 1989. Changing ideas in hydrology—the case of
physically-based models. Journal of Hydrology 105, 157–172.
Beven, K., 1993. Prophecy, reality and uncertainty in distributed
hydrological modelling. Advances in Water Resources 16, 41–
51.
Beven, K., 2000. On model uncertainty, risk and decision making.
Hydrological Processes 14, 2605–2606.
Beven, K., 2002. Towards a coherent philosophy for modelling the
environment. Proceedings of the Royal Society of London,
Series A 458, 1–20.
Bishop, O.N., 1966. Statistics for Biology, second ed. Longman,
London.
Bishop, K., Seibert, J., Kohler, S., Laudon, H., 2004. Resolving the
double paradox of rapidly mobilised old water with highly
variable responses in runoff chemistry. Hydrological Processes
18, 185–189.
Bjornstad, O.N., Peltonen, M., Liebhold, A.M., Baltensweiler, W.,
2002. Waves of Larch Budmoth outbreaks in the European
Alps. Science 298, 1020–1023.
Bolviken, B., Nilsen, R., Ukkelberg, A., 1997. A new method for
spatially moving correlation analysis in geomedicine. Environ-
mental Geochemistry and Health 19, 143–153.
Box, G.E.P., Jenkins, G.M., 1976. Time Series Analysis: Forecast-
ing and Control. Holden-Day, San Francisco.
Brown, J.H., Gupta, V.K., Li, B-L., Milne, B.T., Restrepo, C.,
West, G.B., 2002. The fractal nature of nature: power laws,
ecological complexity and biodiversity. Philosophical Trans-
actions of the Royal Society of London, Series B 357, 619–626.
Burt, T.P., Heathwaite, A.L., 1996a. Long-term studies of the
natural environment at Slapton Ley. Field Studies 8, 533–542.
Burt, T.P., Heathwaite, A.L., 1996b. The Hydrology of the Slapton
Catchment. Field Studies 8, 543–557.
Burt, T.P., Horton, B.P., 2001. The natural history of Slapton Ley
National nature reserve XXIII: the climate of Slapton Ley. Field
Studies 10, 93–114.
Burt, T.P., Heathwaite, A.L., Johnes, P.J., 1996. Stream water
quality and nutrient export in the Slapton catchments. Field
Studies 8, 613–627.
Cartwright, N., 1999. This Dappled World: a Study of the
Boundaries of Science. Cambridge University Press,
Cambridge.
Clark, J.S., et al., 2001. Ecological forecasts: an emerging
imperative. Science 293, 657–660.
Emmerson, M.C., Solan, M., Emes, C., Paterson, D.M., Rafaelli, D.,
2001. Consistent patterns and idiosyncratic effects of biodiver-
sity in marine systems. Nature 411, 73–77.
Engstrom, D.R., Fritz, S.C., Almendinger, J.E., Juggins, S., 2000.
Chemical and biological trends during lake evolution in recently
deglaciated terrain. Nature 408, 161–166.
Feng, X., Kirchner, J.W., Neal, C., 2004. Measuring catchment-
scale chemical retardation using spectral analysis of reactive
and passive chemical tracer time series. Journal of Hydrology
292, 296–307.
Fox Keller, E., 2002. Making sense of life: explaining biological
development with models, metaphors and machines. Harvard
University Press.
Gould, S.J., 1991. Wonderful life: the Burgess shale and the nature
of history. Penguin, London.
Gragnani, A., Scheffer, M., Rinaldi, S., 1999. Top-down control of
cyanobacteria: a theoretical analysis. The American Naturalist
153, 59–72.
Halley, J.M., Hartley, S., Kallimanis, A.S., Kunin, W.E.,
Lennon, J.J., Sgardelis, S.P., 2004. Uses and abuses of fractal
methodology in ecology. Ecology Letters 7, 254–271.
Halsey, T.C., Jensen, M.H., 2004. Hurricanes and butterflies. Nature
428, 127–128.
Harris, G.P., 1980. Temporal and spatial scales in phytoplankton
ecology. Mechanisms, methods, models and management.
Canadian Journal of Fisheries and Aquatic Science 37, 877–
900.
Harris, G.P., 1987. Time series analysis of water quality data from
Lake Ontario: implications for the measurement of water quality
in large and small lakes. Freshwater Biology 18, 389–403.
Harris, G.P., 1999. Comparison of the biogeochemistry of lakes and
estuaries: ecosystem processes, functional groups, hysteresis
effects and interactions between macro- and microbiology.
Marine and Freshwater Research 50, 791–811.
Harris, G.P., 2001. The biogeochemistry of nitrogen and phos-
phorus in Australian catchments, rivers and estuaries: effects of
land use and flow regulation and comparisons with global
patterns. Marine and Freshwater Research 52, 139–149.
Harris, G.P., 2003. Ecological paradigms, change detection and
prediction, Integrative Modelling of Biophysical, Social and
Economic Systems for Resource Management Solutions
G. Harris, A.L. Heathwaite / Journal of Hydrology 304 (2005) 3–1918
Proceedings of MODSIM 2003 International Conference on
Modelling and Simulation, Townsville, July 2003, vol. 1, pp. 1–
10.
Harris, G.P., Baxter, G., 1996. Interannual variability in phyto-
plankton biomass and species composition in a subtropical
reservoir. Freshwater Biology 35, 545–560.
Harris, G.P., Davies, P., Nunez, M., Meyers, G., 1988. Interannual
variability in climate and fisheries in Tasmania. Nature 333,
754–757.
Harris, G., Batley, G., Fox, D., Hall, D., Jernakoff, P., Molloy, R.,
Murray, A., Newell, B., Parslow, J., Skyring, G., Walker, S.,
1996. Port Phillip Bay Environmental Study: final report.
CSIRO, Dickson, ACT.
Hatje, V., Rae, K., Birch, G.F., 2001. Trace metal and total
suspended solids concentrations in freshwater: the importance
of small-scale temporal variation. Journal of Environmental
Monitoring 3, 251–256.
Haus, M., 1990. Ecosystem modelling: science or technology?.
Journal of Hydrology 116, 25–33.
Haygarth, P.M., Wood, F.L., Heathwaite, A.L., Butler, T., 2004.
Phosphorus dynamics observed at increasing scales in a nested
headwater-to-river channel study. Science of the Total Environ-
ment 2004; (in press).
Heathwaite, A.L., 1993. The impact of agriculture on dissolved
nitrogen and phosphorus cycling in temperate ecosystems.
Chemistry and Ecology 8, 217–231.
Heathwaite, A.L., 1994. Chemical fractionation of lake sediments to
determine the effect of land use change on lake nutrient loading.
Journal of Hydrology 159, 395–421.
Heathwaite, A.L., Burt, T.P., 1991. Predicting the effect of land use
on stream water quality. International Association of Hydro-
logical Sciences Publication 203, 209–218.
Heathwaite, A.L., Johnes, P.J., 1996. Contribution of nitrogen
species and phosphorus fractions to stream water quality in
agricultural catchments. Hydrological Processes 10, 971–983.
Heathwaite, A.L., Sharpley, A.N., 1999. Evaluating measures to
control the impact of agricultural phosphorus on water quality.
Water Science and Technology 39, 149–155.
Heathwaite, A.L., Burt, T.P., Trudgill, S.T., 1989. Runoff, sediment,
and solute delivery in agricultural drainage basins—a scale
dependent approach. International Association of Hydrological
Sciences Publication 182, 175–191.
Heathwaite, A.L., Johnes, P.J., Peters, N.E., 1996. Trends in
nutrients and water quality. Hydrological Processes 10, 263–
293.
Huisman, J., Weissing, F.J., 1999. Biodiversity of plankton by
species oscillations and chaos. Nature 402, 407–410.
Huppert, A., Blasius, B., Stone, L., 2002. A model of phytoplankton
blooms. The American Naturalist 159, 156–171.
Jenkins, G.M., Watts, D.G., 1968. Spectral analysis and its
applications. Holden-Day, San Francisco.
Johnes, P.J., Heathwaite, A.L., 1997. Modelling the impact on water
quality of land use change in agricultural catchments. Hydro-
logical Processes 11, 269–286.
Johnes, P.J., Butterfield, D., 2002. Landscape, regional and global
estimates of N flux from land to sea: errors and uncertainties.
Biogeochemistry 57/58, 429–476.
Kirchner, J.W., 2003. A double paradox in catchment hydrology
and geochemistry. Hydrological Processes 17, 871–874.
Kirchner, J.W., Feng, X., Neal, C., 2000. Fractal stream chemistry
and its implications for contaminant transport in catchments.
Nature 403, 524–527.
Kirchner, J.W., Feng, X., Neal, C., Robson, A.J., 2004. The fine
structure of water-quality dynamics: the (high-frequency) wave
of the future. Hydrological Processes 18, 1353–1359.
Klemes, V., 1986. Dilettantism in hydrology: transition or destiny.
Water Resources Research 22, 177S–188S.
Kokkonen, T.S., Jakeman, A.J., Young, P.C., Koivusalo, H.J., 2003.
Predicting daily flows in ungauged catchments: model regiona-
lization from catchment descriptors at the Coweeta Hydrologic
Laboratory, North Carolina. Hydrological Processes 17, 2219–
2238.
Kumar, J.R., Dash, S.K., 2001. Interdecadal variations of
characteristics of monsoonal disturbances and their epochal
relationships with rainfall and other tropical features. Inter-
national Journal of Climatology 21, 759–771.
Lawton, J.H., 1999. Are there general laws in ecology?. Oikos 84,
177–192.
Li, B-L., 2000. Fractal geometry applications in description and
analysis of patch patterns and patch dynamics. Ecological
Modelling 132, 33–50.
Likens, G.E., Bormann, F.H., 1995. Biogeochemistry of a forested
ecosystem. Springer, New York.
Lima, I.D., Olson, D.B., Doney, S.C., 2002. Intrinsic dynamics and
stability properties of size-structured pelagic ecosystem models.
Journal of Plankton Research 24, 533–556.
Loague, K.M., Freeze, R.A., 1985. A comparison of rainfall-runoff
modelling techniques on small upland catchments. Water
Resources Research 21, 229–248.
Lohle, C., Li, B-L., 1996. Statistical properties of ecological and
geologic fractals. Ecological Modelling 85, 271–284.
Magnusson, J.J., Benson, B.J., Kratz, T.K., 1990. Temporal changes
in the limnology of a suite of lakes in Wisconsin, USA.
Freshwater Biology 23, 145–159.
Markewitz, D., Davidson, E.A., Figueiredo, R., de, O.,
Victoria, R.L., Krusche, A.V., 2001. Control of cation
concentrations in stream waters by surface soil processes in an
Amazonian watershed. Nature 410, 802–805.
Murray, A.G., Parslow, J.S., 1999a. Modelling of nutrient impacts
in Port Phillip Bay—a semi-enclosed marine Australian
ecosystem. Marine and Freshwater Research 50, 597–611.
Murray, A.G., Parslow, J.S., 1999b. The analysis of alternative
formulations in a simple model of a coastal ecosystem.
Ecological Modelling 119, 149–166.
Neal, C., 1997. A view of water quality from the Plynlimon
watershed. Hydrology and Earth System Science 1 (3), 743–
753.
Neal, C., 2002. From determination to fractal processing, structural
uncertainty and the need for continued long-term monitoring of
the environment: the case of acidification. Hydrological
Processes 16, 2481–2484.
Neal, C., 2004. The water quality functioning of the upper River
Severn Plynlimon, mid Wales: issues of monitoring, process
G. Harris, A.L. Heathwaite / Journal of Hydrology 304 (2005) 3–19 19
understanding and forestry. Hydrology and Earth System
Science; (in press).
Neal, C., Leeks, G.J.L., Millward, G.E., Harris, J.R.W.,
Huthnance, J.M., Rees, J.G., 2004. Land Ocean Interaction:
processes, functioning and environmental management: a UK
perspective. Science of the Total Environment 314/315/316,
801–822.
O’Neill, R.V., 1999. Recovery in complex ecosystems. Journal of
Aquatic Ecosystem Stress and Recovery 6, 181–187.
Orekes, N., Shrader-Frechette, K., Belitz, K., 1994. Verification,
validation and confirmation of numerical models in the earth
sciences. Science 263, 641–646.
Petersen, W., Bertino, L., Callies, U., Zorita, E., 2001. Process
identification by principal component analysis of river water
quality data. Ecological Modelling 138, 193–213.
Raupach, M.R., Barrett, D.J., Briggs, P.R., Kirby, J.M., 2002.
Terrestrial Biosphere models and forest-atmosphere inter-
actions, In: Vertessey, R., Elsenbeer, H. (Eds.), Forests and
Water. IUFRO press, (in press).
Reynolds, C.S., 1986. Experimental manipulations of the phyto-
plankton periodicity in large limnetic enclosures in Blelham
Tarn English Lake District. Hydrobiologia 138, 43–64.
Robson, A.J., Neal, C., Smith, C.J., HILL, S., 1992. Short term
variations in rain and stream water conductivity at a forested site
in Mid-Wales -implications for water movement. Science of the
Total Environment 119, 1–18.
Rykiel, E.J., 1996. Testing ecological models: the meaning of
validation. Ecological Modelling 90, 229–244.
Scheffer, M., Carpenter, S., Foley, J.A., Folke, C., Walker, B., 2001.
Catastrophic shifts in ecosystems. Nature 413, 591–596.
Seuront, L., Schmitt, F., Lagadeuc, Y., Schertzer, D., Lovejoy, S.,
1999. Universal multifractal analysis as a tool to characterise
multiscale intermittent patterns: example of phytoplankton
distribution in turbulent coastal waters. Journal of Plankton
Research 21, 877–923.
Seuront, L., Gentilhomme, V., Lagadeuc, Y., 2002. Small-scale
nutrient patches in tidally mixed coastal waters. Marine
Ecology-Progress Series 232, 29–44.
Siegel, S., 1956. Nonparametric statistics for the behavioural
sciences, fifth ed. McGraw-Hill, New York.
Sole, R.V., Manubria, S.C., Benton, M., Kauffman, S., Bak, P.,
1999. Criticality and scaling in evolutionary ecology. Trends in
Ecology and Evolution 14, 156–160.
Trudgill, S.T., Burt, T.P., Heathwaite, A.L., Arkell, B., 1991. Soil
nitrate sources and nitrate leaching losses. Soil Use and
Management 7 (4), 200–206.
Vollenweider, R.A., Scientific fundamentals of the eutrophication
of lakes and flowing waters, with particular reference to nitrogen
and phosphorus as factors in eutrophication. OECD, Paris,
Technical Report. 1968 DAS/SCI/6827.
Webster, I., Harris, G.P., 2004. Anthropogenic impacts on the
ecosystems of coastal lagoons: modelling fundamental biogeo-
chemical processes and management implications. Marine and
Freshwater Research 55, 67–78.
Wiens, J., 2002. Riverine landscapes: taking landscape ecology into
the water. Freshwater Biology 47, 501–515.
Williams, J., Walker, G.R., Hatton, T.J., 2002. Dryland salinization:
a challenge for land and water management in the Australian
landscape, In: Haygarth, P.M., Jarvis, S.C. (Eds.), Agriculture,
hydrology and water quality. CABI publishing, London,
pp. 457–476.
Wood, F.L., Heathwaite, A.L., Haygarth, P.M., 2004. Evaluating
the contribution of diffuse agricultural phosphorus contributions
to river fluxes at different scales in the Taw catchment, Devon,
UK. Journal of Hydrology 2004; (in press).
Wu, J., Loucks, O.L., 1995. From balance of nature to hierarchical
patch dynamics: a paradigm shift in ecology. Quarterly Review
of Biology 70, 439–466.
Young, P.C., 1998. Data-based mechanistic modelling of
environmental, ecological, economic and engineering
systems. Environmental Modelling and Software 13,
105–122.
Young, P.C., 1999. Non-stationary time series analysis and
forecasting. Progress in Environmental Science 1, 3–48.
Young, P.C., 2000. In: Fitzgerald, W.J., Walden, A., Smith, R.,
Young, P.C. (Eds.), Stochastic, dynamic modelling and
signal processing: time variable and state dependent
parameter estimation. Cambridge University Press, Cam-
bridge, pp. 74–114.