Embed Size (px)
Citation preview

Inactive Oil and Gas Wells on Federal Lands and Minerals: Potential Costs and Conflicts
Report
Prepared for:
The National Wildlife Federation
and
Public Land Solutions
Prepared by:
Grant Gardner
Western EcoSystems Technology, Inc. 415 West 17th Street, Suite 200
Cheyenne, Wyoming 82001
March 1, 2021

Inactive Oil and Gas Wells on Federal Lands and Minerals: Potential Costs and Conflicts
WEST i March 2021
EXECUTIVE SUMMARY
• The US Bureau of Land Management (BLM) is responsible for monitoring oil and gas wells on federal lands and enforcing reclamation requirements for inactive wells. Abandoned and inactive wells may present physical and environmental hazards and can be costly to reclaim, especially if well operators cannot be found or held liable.
• In 2018, the US Environmental Protection Agency (EPA) estimated 3.2 million inactive oil and gas wells in the US, 2.0 million of which are unplugged or improperly plugged. In recent years there has been an increase in both drilling and well operator bankruptcies, possibly adding more wells at risk of becoming orphaned than the BLM currently identifies.
• Using state-level well site locations and production data, we identified 8,050 inactive oil and gas wells either orphaned or at risk of being orphaned on federal lands in Colorado, Montana, New Mexico, Utah, and Wyoming. The at-risk wells were found in 88 counties across the five states but concentrated within several counties, most notably Campbell County, Wyoming.
• Based on US Government Accountability Office (GAO) estimates for high-cost reclamation scenarios, the 8,050 at-risk oil and gas wells on federal lands could cost up to $1.2 billion to fully reclaim, with only an estimated $17 million held in bonds for this purpose. Held bond amounts will be too low to fully cover modern reclamation costs.
• Two hundred sixty-three at-risk well sites are located within a mile of human populated areas, of which 194 were in Wyoming. Seventy-five at-risk well sites are located atop the High Plains-Ogallala aquifer, a critically important regional resource.
• Ninety-seven at-risk well sites are within a mile of recreation sites. Nine at-risk well sites are within a mile of National Park Service lands. Over 5,000 at-risk well sites, two-thirds of the entire dataset, are located in crucial winter range habitat or habitat restoration priority areas for big game mammals.
• Over 200 at-risk well sites are located on or near environmentally significant protected areas, including sensitive critical habitat for threatened or endangered species.
Inactive Oil and Gas Wells on Federal Lands and Minerals: Potential Costs and Conflicts
WEST ii March 2021
TABLE OF CONTENTS
EXECUTIVE SUMMARY ............................................................................................................. i
INTRODUCTION ........................................................................................................................1
STUDY AREA .............................................................................................................................2
METHODS ..................................................................................................................................4
Well Sites ................................................................................................................................4
At-risk Well Sites .....................................................................................................................6
Spatial Features ......................................................................................................................6
Population features .............................................................................................................6
Environmental features ........................................................................................................6
Recreation features .............................................................................................................7
RESULTS ...................................................................................................................................7
Well Classifications .................................................................................................................8
Population .............................................................................................................................10
Counties ............................................................................................................................10
Aquifers .............................................................................................................................11
Population Centers ............................................................................................................13
Environmental .......................................................................................................................13
Recreation ............................................................................................................................14
DISCUSSION............................................................................................................................14
REFERENCES .........................................................................................................................16
LIST OF TABLES
Table 1. Permitted wells by state on federal lands and minerals. ................................................4
Table 2.Spatial features and data sources. .................................................................................7
Table 3.Current and potential orphan oil and gas wells on federal lands and minerals by state and status classification. ..................................................................................................8
Table 4. Current and potential orphan oil and gas wells on federal minerals within the Study Area, by county. ............................................................................................................10
Table 5. Current and potential orphan oil and gas wells on federal minerals within Study Area, by aquifer. .....................................................................................................................11
Table 6. Current and potential orphan oil and gas wells on federal minerals within Study Area, on or near other population, environmental, or recreational features. ............................13
Inactive Oil and Gas Wells on Federal Lands and Minerals: Potential Costs and Conflicts
WEST iii March 2021
LIST OF FIGURES
Figure 1. Land with federal mineral ownership in the Study Area (Colorado, Montana, New Mexico, Utah, and Wyoming). ..........................................................................................3
Figure 2. Active oil and gas well sites in 2019 in relation to federal minerals within the study area. ................................................................................................................................5
Figure 3. At-risk oil and gas well sites on federal minerals in the Study Area. .............................9
Figure 4. At-risk oil and gas well sites on federal minerals in the Study Area, by aquifer or aquifer system. ..............................................................................................................12
LIST OF APPENDICES
Appendix A. Well definitions and at-risk evaluation methods. Appendix B. State at-risk oil and gas well site summary figures.
Inactive Oil and Gas Wells on Federal Lands and Minerals: Potential Costs and Conflicts
WEST 1 March 2021
INTRODUCTION
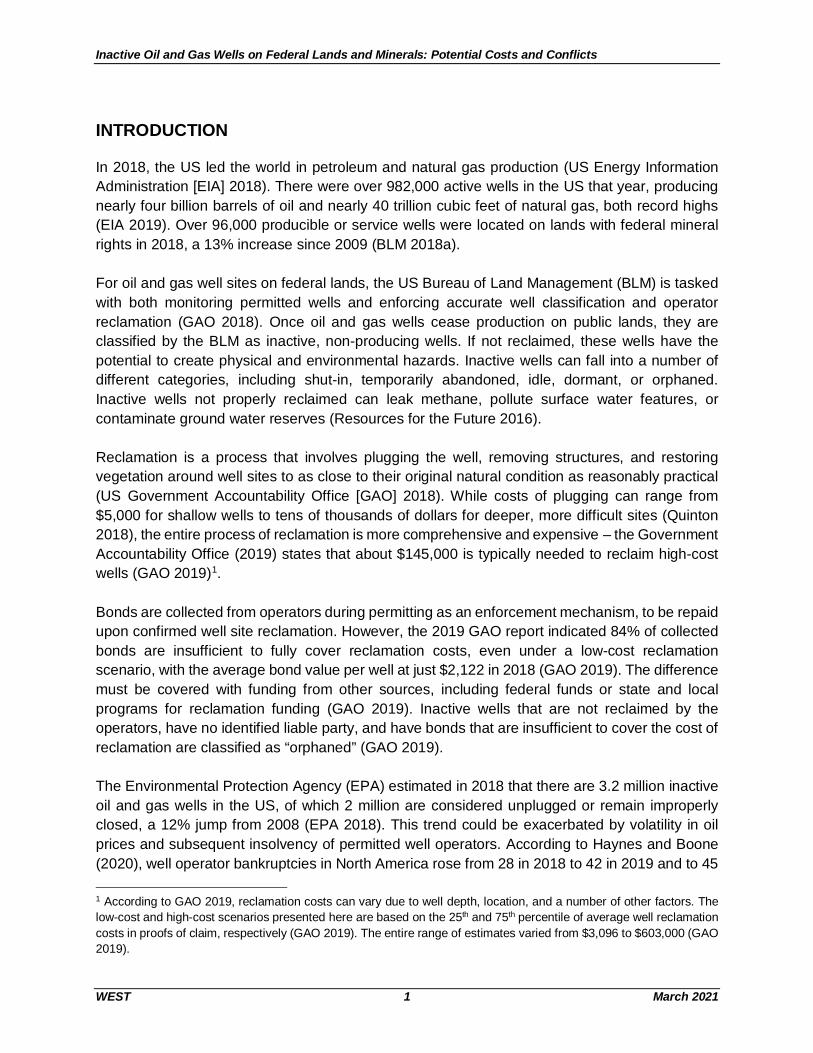
In 2018, the US led the world in petroleum and natural gas production (US Energy Information Administration [EIA] 2018). There were over 982,000 active wells in the US that year, producing nearly four billion barrels of oil and nearly 40 trillion cubic feet of natural gas, both record highs (EIA 2019). Over 96,000 producible or service wells were located on lands with federal mineral rights in 2018, a 13% increase since 2009 (BLM 2018a). For oil and gas well sites on federal lands, the US Bureau of Land Management (BLM) is tasked with both monitoring permitted wells and enforcing accurate well classification and operator reclamation (GAO 2018). Once oil and gas wells cease production on public lands, they are classified by the BLM as inactive, non-producing wells. If not reclaimed, these wells have the potential to create physical and environmental hazards. Inactive wells can fall into a number of different categories, including shut-in, temporarily abandoned, idle, dormant, or orphaned. Inactive wells not properly reclaimed can leak methane, pollute surface water features, or contaminate ground water reserves (Resources for the Future 2016). Reclamation is a process that involves plugging the well, removing structures, and restoring vegetation around well sites to as close to their original natural condition as reasonably practical (US Government Accountability Office [GAO] 2018). While costs of plugging can range from $5,000 for shallow wells to tens of thousands of dollars for deeper, more difficult sites (Quinton 2018), the entire process of reclamation is more comprehensive and expensive – the Government Accountability Office (2019) states that about $145,000 is typically needed to reclaim high-cost wells (GAO 2019)1. Bonds are collected from operators during permitting as an enforcement mechanism, to be repaid upon confirmed well site reclamation. However, the 2019 GAO report indicated 84% of collected bonds are insufficient to fully cover reclamation costs, even under a low-cost reclamation scenario, with the average bond value per well at just $2,122 in 2018 (GAO 2019). The difference must be covered with funding from other sources, including federal funds or state and local programs for reclamation funding (GAO 2019). Inactive wells that are not reclaimed by the operators, have no identified liable party, and have bonds that are insufficient to cover the cost of reclamation are classified as “orphaned” (GAO 2019). The Environmental Protection Agency (EPA) estimated in 2018 that there are 3.2 million inactive oil and gas wells in the US, of which 2 million are considered unplugged or remain improperly closed, a 12% jump from 2008 (EPA 2018). This trend could be exacerbated by volatility in oil prices and subsequent insolvency of permitted well operators. According to Haynes and Boone (2020), well operator bankruptcies in North America rose from 28 in 2018 to 42 in 2019 and to 45 1 According to GAO 2019, reclamation costs can vary due to well depth, location, and a number of other factors. The low-cost and high-cost scenarios presented here are based on the 25th and 75th percentile of average well reclamation costs in proofs of claim, respectively (GAO 2019). The entire range of estimates varied from $3,096 to $603,000 (GAO 2019).

Inactive Oil and Gas Wells on Federal Lands and Minerals: Potential Costs and Conflicts
WEST 2 March 2021
as of November 2020. Cumulatively, over 250 oil companies have filed for bankruptcy since 2015 (Haynes and Boone 2020). In a press release from earlier this year, industry research firm Rystad Energy (2020) estimated that due to low oil prices, as many as 170 additional drilling companies may need to file bankruptcy in 2021. Operator bankruptcies lead to orphaned wells when defaulted bonds are inadequate to cover reclamation costs (GAO 2019). Monitoring well status for such a high number and wide distribution of leases can be difficult. Recent government studies have found the BLM ill-suited, under-funded, and without proper policy direction to monitor and address the volume of inactive wells under its jurisdiction, an issue that dates back to before the most recent proliferation of petroleum drilling on federal lands (Office of Inspector General [OIG] 2010, OIG 2018, GAO 2018). As a consequence, there are likely more wells that are orphaned or at risk of becoming orphaned than are currently identified by the agency. A well’s ownership status and proximity to natural resources and human populated areas, are directly linked to the site’s environmental risk (Resources for the Future 2016). Orphan wells are more likely to have been drilled earlier and exhibit “lower-integrity” construction and higher deterioration (Resources for the Future 2016). Additionally, operators may focus resources on wells cheaper to reclaim, and default on bonds for wells with high plugging costs, many of which may be in relatively worse condition and pose higher environmental risk (Resources for the Future 2016). Due to the public health and safety risks associated with inactive wells, the report suggests priority should be given to monitoring wells nearer to populated areas or important groundwater deposits (Resources for the Future 2016). The purpose of this study was to: 1) to identify the number of wells either orphaned or at risk of being orphaned in the Study Area (outlined below) according to state-level production data, 2) to examine the spatial distribution of at-risk wells relative to important landscape features and populations, and; 3) to estimate potential reclamation costs of at-risk wells.
STUDY AREA
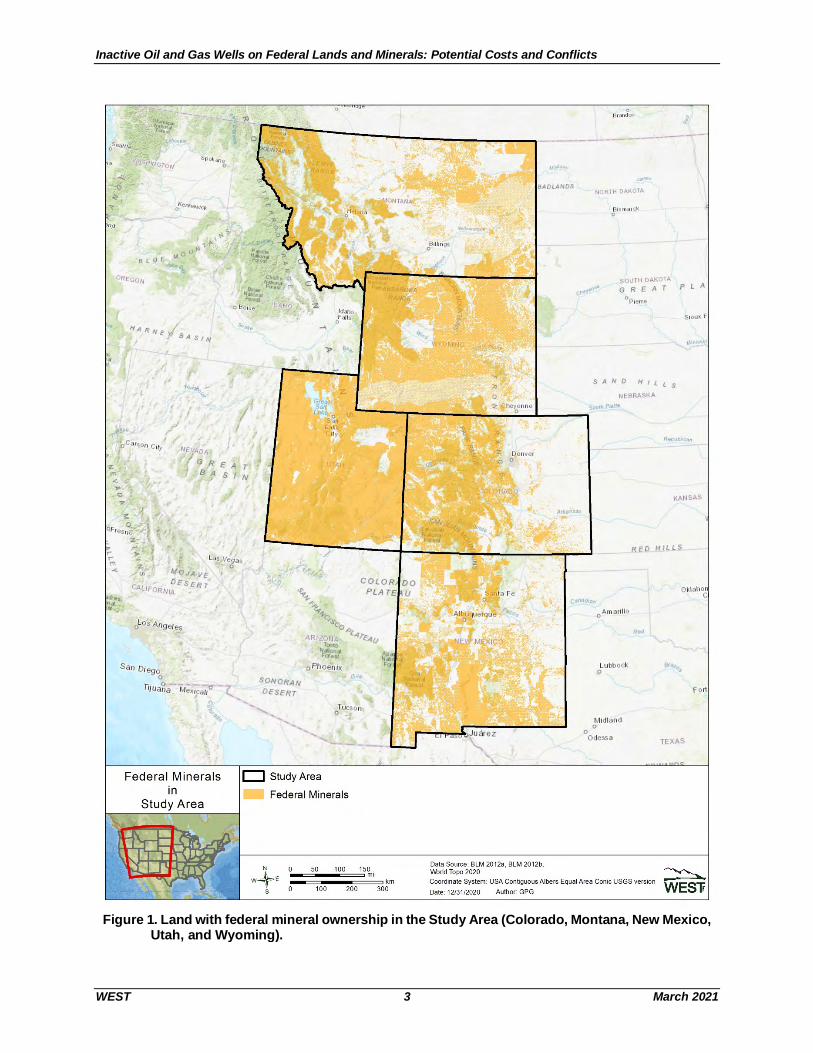
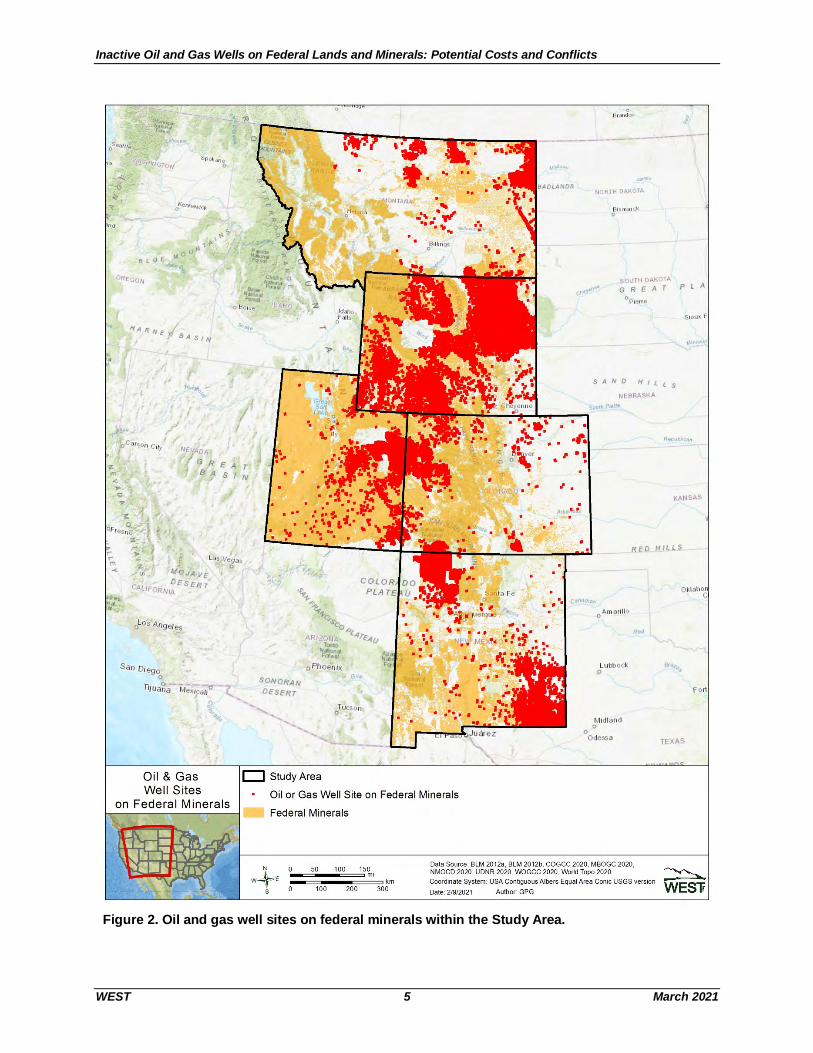
The Study Area for this analysis contains the states of Colorado, Montana, New Mexico, Utah, and Wyoming. These states are where most of the drilling on federal lands and minerals2 took place, representing over 96% of approved applications for permit to drill (APD) on federal minerals in 2018 (BLM 2018b).3 Federal lands and minerals within the five states account for over 189 million acres in the Study Area, representing over 53% of the land area (Figure 1).
2 Term “federal lands and minerals” refers to all lands with federal mineral rights/ownership. 3 Federal minerals spatial data acquired from BLM 2012. Distinctions between land rights for different types of minerals were not maintained in the dataset.
Inactive Oil and Gas Wells on Federal Lands and Minerals: Potential Costs and Conflicts
WEST 3 March 2021
Figure 1. Land with federal mineral ownership in the Study Area (Colorado, Montana, New Mexico,
Utah, and Wyoming).

Inactive Oil and Gas Wells on Federal Lands and Minerals: Potential Costs and Conflicts
WEST 4 March 2021
METHODS
Well Sites
Records on permitted oil and gas well locations were acquired from each state’s respective permitting commission (Table 1). Well site datasets included all known well sites, including active, inactive, and plugged-and-abandoned (reclaimed) sites. The datasets were first subset into only well sites classified as either oil wells or gas wells, removing service, monitor, and support wells in addition to any other minerals present. To determine where permitting and drilling efforts have been focused over the past several decades, the datasets were further subset into just active (producing) well sites, according to attributes within the state datasets. Active well sites were then plotted in a Geographic Information System (GIS) in order to determine the spatial distribution within the Study Area (Figure 2).
Table 1. Permitted wells by state on federal lands and minerals. Colorado Montana New Mexico Utah Wyoming
Data Source
Colorado Oil & Gas
Conservation Commission
Montana Board of Oil &
Gas Conservation
New Mexico Oil
Conservation Division
Utah Department of Natural
Resources Oil Gas and Mining Division
Wyoming Oil and Gas
Conservation Commission
All permitted wells1 120,313 44,664 122,432 36,967 165,823
Oil & gas wells 13,109 8,305 59,386 18,419 105,276 1Figure includes service, support, and monitor wells. Figure also includes wells marked as “plugged and
abandoned” (reclaimed).
Inactive Oil and Gas Wells on Federal Lands and Minerals: Potential Costs and Conflicts
WEST 5 March 2021
Figure 2. Oil and gas well sites on federal minerals within the Study Area.

Inactive Oil and Gas Wells on Federal Lands and Minerals: Potential Costs and Conflicts
WEST 6 March 2021
At-risk Well Sites
State oil and gas well dataset attributes were used to classify federally leased wells based on their status and production. A dataset was created of “at-risk” wells: wells classified either as orphaned or at risk of being orphaned (not reclaimed and not producing in five years or more) according to state classifications4 and production data. A five year period (2015-2019) was used to determine well inactivity, using the definition of idle described in CCST 2018.5 Further information on status definitions and dataset classification criteria is in Appendix A.
Spatial Features
Well sites within the study dataset were evaluated by proximity6 to a number of important landscape features representing population, environmental, and recreational sites. The list of spatial features considered is represented by Table 2.
Population features
The demographic distribution of at-risk well sites was examined to identify which populated areas may face greater financial, environmental, or other disruptive impacts of delayed and unfunded reclamation. In addition to county jurisdiction, the distribution of at-risk well sites was evaluated in relation to US Census Current Places7 and aquifers.
Environmental features
Public areas considered of environmental importance included National Parks (National Park Service), Wilderness Areas (US Forest Service, BLM), Areas of Critical Environmental Concern (BLM), National Wildlife Refuges (US Fish and Wildlife Service), as well as any other public areas classified in the Protected Areas Database of the United States (PAD-US) as GAP status 1 or 2.8 Other examined environmentally significant areas included USFWS threatened and endangered species active critical habitat and greater sage-grouse Priority Habitat Management Areas (PHMA), a product of the 2015 BLM Records of Decision for Greater Sage-Grouse Approved Resource Management Plan Amendments throughout the western US (BLM 2015a).
4 Well status codes differ based on state classifications, but the at-risk dataset generally encompassed wells marked as orphaned, idle, shut-in, temporarily abandoned, or active but not recently productive. A complete list is in Appendix A. 5 The BLM uses a longer time period to determine well inactivity, 7 years (GAO 2019). Estimates of at-risk wells using the BLM definition are differentiated from the CCST definition in the figures of Appendix B. 6 For a standard basis of evaluation, “close proximity” to spatial features is defined as 1 mile or less. 7 Current places include both incorporated places (as determined by the states) and Census-designated places (non-incorporated) as delineations of areas with settled concentrations of population identifiable by name (US Census 2019). 8 Status 1: An area having permanent protection from conversion of natural land cover and a mandated management plan in operation to maintain a natural state within which disturbance events (of natural type, frequency, intensity, and legacy) are allowed to proceed without interference or are mimicked through management (USGS PAD-US 2020). Status 2: An area having permanent protection from conversion of natural land cover and a mandated management plan in operation to maintain a primarily natural state, but which may receive uses or management practices that degrade the quality of existing natural communities, including suppression of natural disturbance (USGS PAD-US 2020).
Inactive Oil and Gas Wells on Federal Lands and Minerals: Potential Costs and Conflicts
WEST 7 March 2021
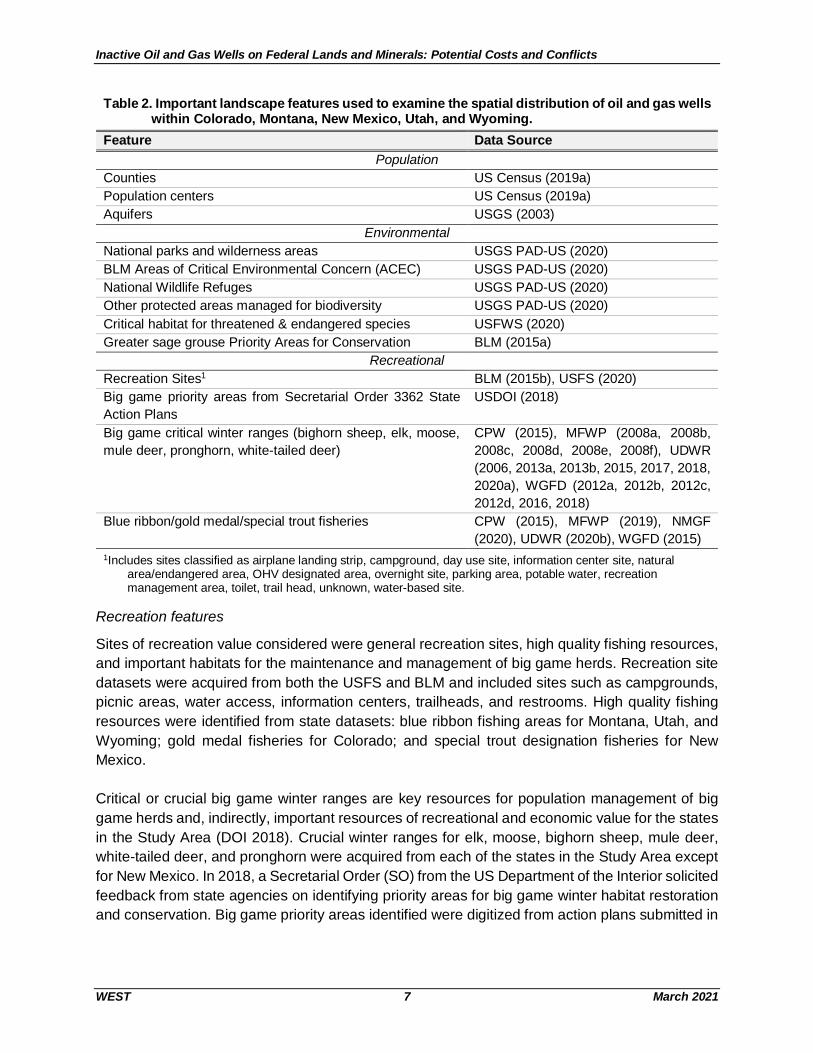
Table 2. Important landscape features used to examine the spatial distribution of oil and gas wells within Colorado, Montana, New Mexico, Utah, and Wyoming.
Feature Data Source Population
Counties US Census (2019a) Population centers US Census (2019a) Aquifers USGS (2003)
Environmental National parks and wilderness areas USGS PAD-US (2020) BLM Areas of Critical Environmental Concern (ACEC) USGS PAD-US (2020) National Wildlife Refuges USGS PAD-US (2020) Other protected areas managed for biodiversity USGS PAD-US (2020) Critical habitat for threatened & endangered species USFWS (2020) Greater sage grouse Priority Areas for Conservation BLM (2015a)
Recreational Recreation Sites1 BLM (2015b), USFS (2020) Big game priority areas from Secretarial Order 3362 State Action Plans
USDOI (2018)
Big game critical winter ranges (bighorn sheep, elk, moose, mule deer, pronghorn, white-tailed deer)
CPW (2015), MFWP (2008a, 2008b, 2008c, 2008d, 2008e, 2008f), UDWR (2006, 2013a, 2013b, 2015, 2017, 2018, 2020a), WGFD (2012a, 2012b, 2012c, 2012d, 2016, 2018)
Blue ribbon/gold medal/special trout fisheries CPW (2015), MFWP (2019), NMGF (2020), UDWR (2020b), WGFD (2015)
1Includes sites classified as airplane landing strip, campground, day use site, information center site, natural area/endangered area, OHV designated area, overnight site, parking area, potable water, recreation management area, toilet, trail head, unknown, water-based site.
Recreation features
Sites of recreation value considered were general recreation sites, high quality fishing resources, and important habitats for the maintenance and management of big game herds. Recreation site datasets were acquired from both the USFS and BLM and included sites such as campgrounds, picnic areas, water access, information centers, trailheads, and restrooms. High quality fishing resources were identified from state datasets: blue ribbon fishing areas for Montana, Utah, and Wyoming; gold medal fisheries for Colorado; and special trout designation fisheries for New Mexico. Critical or crucial big game winter ranges are key resources for population management of big game herds and, indirectly, important resources of recreational and economic value for the states in the Study Area (DOI 2018). Crucial winter ranges for elk, moose, bighorn sheep, mule deer, white-tailed deer, and pronghorn were acquired from each of the states in the Study Area except for New Mexico. In 2018, a Secretarial Order (SO) from the US Department of the Interior solicited feedback from state agencies on identifying priority areas for big game winter habitat restoration and conservation. Big game priority areas identified were digitized from action plans submitted in
Inactive Oil and Gas Wells on Federal Lands and Minerals: Potential Costs and Conflicts
WEST 8 March 2021
response to SO 3362 (Improving Habitat Quality in Western Big Game Winter Range and Migration Corridors).
RESULTS
Well Classifications
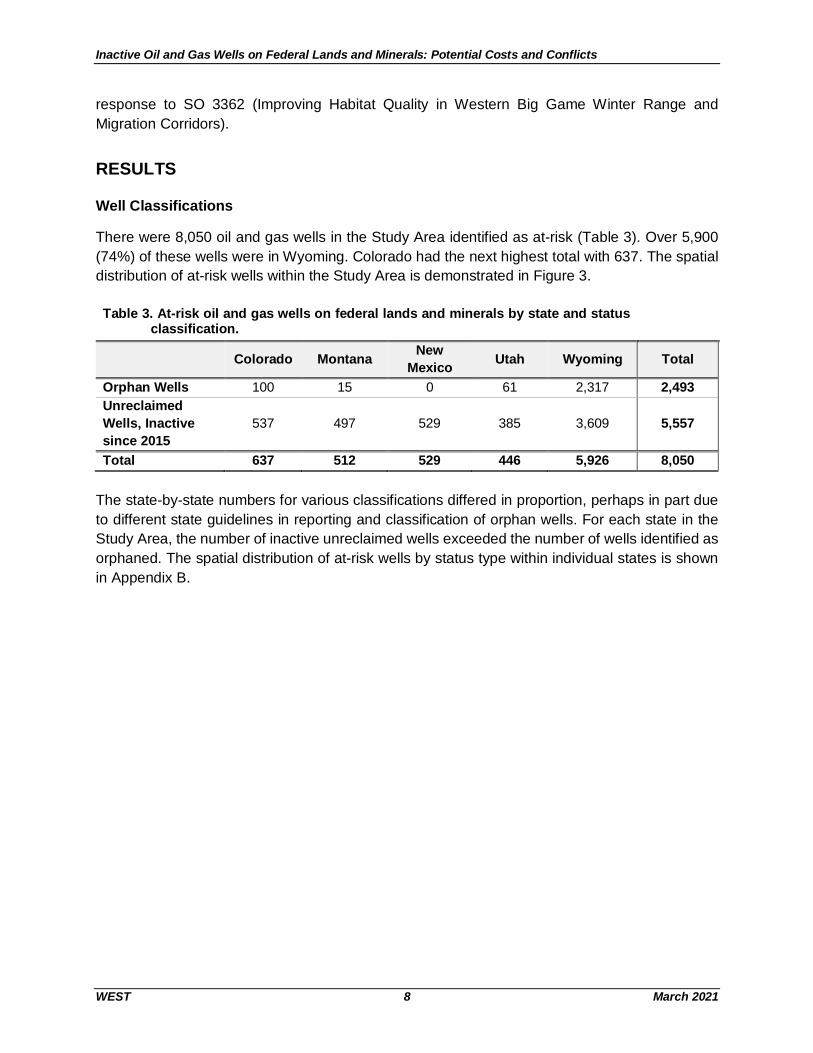
There were 8,050 oil and gas wells in the Study Area identified as at-risk (Table 3). Over 5,900 (74%) of these wells were in Wyoming. Colorado had the next highest total with 637. The spatial distribution of at-risk wells within the Study Area is demonstrated in Figure 3. Table 3. At-risk oil and gas wells on federal lands and minerals by state and status
classification.
Colorado Montana New Mexico Utah Wyoming Total
Orphan Wells 100 15 0 61 2,317 2,493 Unreclaimed Wells, Inactive since 2015
537 497 529 385 3,609 5,557
Total 637 512 529 446 5,926 8,050 The state-by-state numbers for various classifications differed in proportion, perhaps in part due to different state guidelines in reporting and classification of orphan wells. For each state in the Study Area, the number of inactive unreclaimed wells exceeded the number of wells identified as orphaned. The spatial distribution of at-risk wells by status type within individual states is shown in Appendix B.

Inactive Oil and Gas Wells on Federal Lands and Minerals: Potential Costs and Conflicts
WEST 9 March 2021
Figure 3. At-risk oil and gas well sites on federal minerals in the Study Area.

Inactive Oil and Gas Wells on Federal Lands and Minerals: Potential Costs and Conflicts
WEST 10 March 2021
Population
Counties
The spatial distribution of at-risk wells within the Study Dataset was heavily concentrated in a few counties, although 88 of the 205 counties in the Study Area contained at least one at-risk well site (Table 4). Twenty-four of the 205 counties in the Study Area contained 60 or more at-risk well sites. Figures of individual state at-risk well distributions by type are contained in Appendix B. Table 4. At-risk oil and gas wells on federal minerals within the Study Area, by county.
County1 At-risk wells County At-risk wells County At-risk wells
Campbell, WY 3,272 Rio Blanco, CO 137 Washakie, WY 85
Sheridan, WY 801 Weston, WY 133 Eddy, NM 81 Johnson, WY 489 Uintah, UT 121 Park, WY 81 Natrona, WY 379 Lea, NM 114 Mesa, CO 80 Fremont, WY 166 Sublette, WY 114 Big Horn, MT 67
La Plata, CO 157 Sheridan, MT 96 Roosevelt, NM 66
Grand, UT 143 Sweetwater, WY 92 Crook, WY 62 Chaves, NM 139 Blaine, MT 89 San Juan, NM 60 All Others
(64 counties) 1,026
1All counties with 60 or more at-risk wells listed. Campbell County, Wyoming, contained 3,272 at-risk wells, over half of the wells in Wyoming and over 40% of the entire Study dataset. Sheridan, Johnson, and Natrona counties had the next-highest total at-risk wells within the Study Area. Collectively, these four Wyoming counties contained over 61% of the total at-risk wells within the Study dataset. Fremont, Weston, Sublette, Sweetwater, Washakie, Park, and Crook counties also contained more than 60 at-risk well sites each. La Plata County contained the most at-risk well sites (157) in Colorado representing just under 25% of the total at-risk wells in the state. Rio Blanco and Mesa counties also contained more than 60 at-risk well sites each. In Utah, 143 at-risk well sites were located in Grand County, representing just 32% of the at-risk wells in Utah. Within Utah, only Grand and Uintah counties had more than 60 at-risk well sites. New Mexico’s at-risk wells were relatively evenly distributed among several counties. Chaves and Lea counties both had more than 100 at-risk well sites, while Eddy, Roosevelt, and San Juan counties each contained 60 or more sites. These five counties (Chaves, Lea, Eddy, Roosevelt, and San Juan) contained nearly 87% of the at-risk well sites in New Mexico.

Inactive Oil and Gas Wells on Federal Lands and Minerals: Potential Costs and Conflicts
WEST 11 March 2021
At-risk well sites in Montana were less concentrated into individual counties than they were in other states. Sheridan County had the most at-risk well sites (96), just 19% of the state total. Blaine, and Big Horn counties also contained more than 60 at-risk well sites each.
Aquifers
At-risk well sites within the Study Area were located atop of 11 different aquifers, aquifer systems, or general categories (Table 5, Figure 4).
Table 5. Current and potential orphan oil and gas wells on federal minerals within Study Area, by aquifer.
Aquifer Total groundwater withdrawals, fresh, in Mgal/d (USGS 2000) At-risk wells
Lower Tertiary aquifers1 101.23 5,048 Colorado Plateaus aquifers 197.66 1,418 Other rocks2 233.08 1,138 Upper Cretaceous aquifers1 101.23 252 High Plains (Ogallala) aquifer 17,480.39 75 Lower Cretaceous aquifers 310.85 65 Pecos River Basin alluvial aquifer 123.69 38 Upper Tertiary aquifers 1.61 6 Roswell Basin aquifer system 386.27 5 Denver Basin aquifer system 36.26 3 Basin and Range basin-fill aquifers 5,618.99 2 1The USGS consolidates both Lower Tertiary and Upper Cretaceous aquifers into “Northern Great Plains system”
for water-use estimates. 2Groundwater withdrawals summed only for states within study area.
Nearly 63% of at-risk well sites within the Study Area were located on Lower Tertiary aquifers, part of the Northern Great Plains system. An additional 18% of wells were located on Colorado Plateau aquifers and 14% were on Other rocks, a general category of low-permeability deposits that provided localized groundwater sources (USGS 2003). Seventy-five at-risk well sites were located on the High Plains (Ogallala) aquifer.

Inactive Oil and Gas Wells on Federal Lands and Minerals: Potential Costs and Conflicts
WEST 12 March 2021
Figure 4. At-risk oil and gas well sites on federal minerals in the Study Area, by aquifer or aquifer
system.
Inactive Oil and Gas Wells on Federal Lands and Minerals: Potential Costs and Conflicts
WEST 13 March 2021
Population Centers
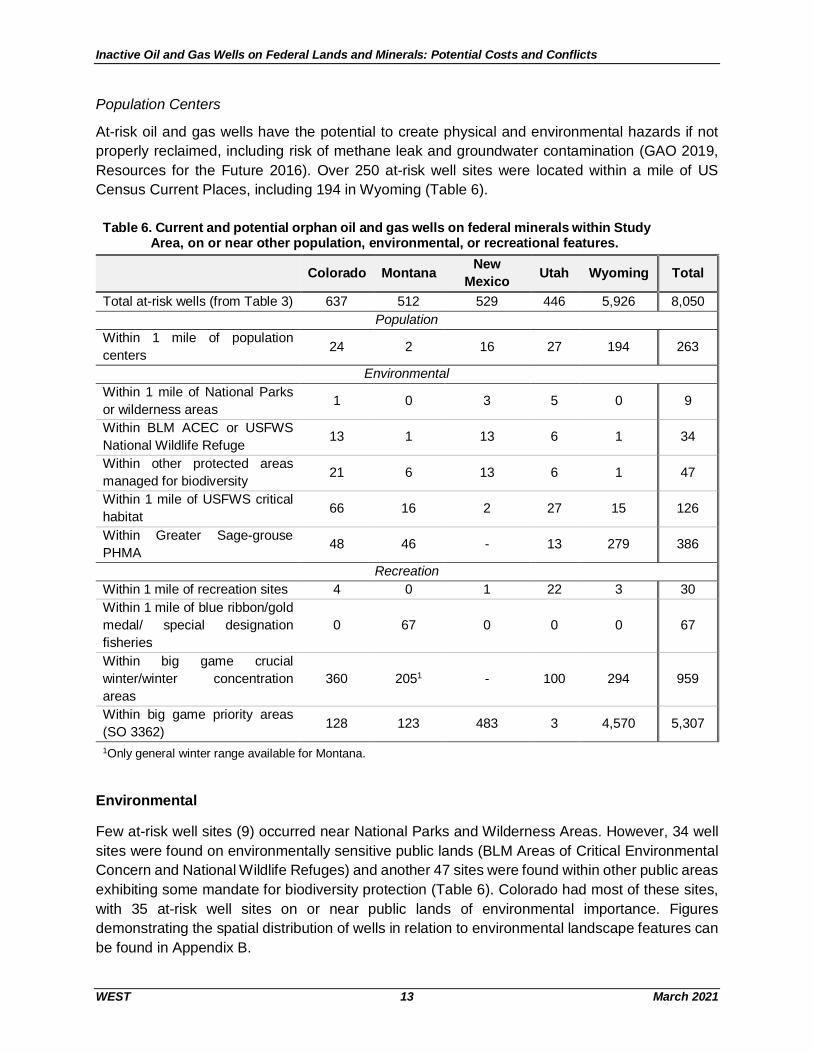
At-risk oil and gas wells have the potential to create physical and environmental hazards if not properly reclaimed, including risk of methane leak and groundwater contamination (GAO 2019, Resources for the Future 2016). Over 250 at-risk well sites were located within a mile of US Census Current Places, including 194 in Wyoming (Table 6). Table 6. Current and potential orphan oil and gas wells on federal minerals within Study
Area, on or near other population, environmental, or recreational features.
Colorado Montana New Mexico Utah Wyoming Total
Total at-risk wells (from Table 3) 637 512 529 446 5,926 8,050 Population
Within 1 mile of population centers 24 2 16 27 194 263
Environmental Within 1 mile of National Parks or wilderness areas 1 0 3 5 0 9
Within BLM ACEC or USFWS National Wildlife Refuge 13 1 13 6 1 34
Within other protected areas managed for biodiversity 21 6 13 6 1 47
Within 1 mile of USFWS critical habitat 66 16 2 27 15 126
Within Greater Sage-grouse PHMA 48 46 - 13 279 386
Recreation Within 1 mile of recreation sites 4 0 1 22 3 30 Within 1 mile of blue ribbon/gold medal/ special designation fisheries
0 67 0 0 0 67
Within big game crucial winter/winter concentration areas
360 2051 - 100 294 959
Within big game priority areas (SO 3362) 128 123 483 3 4,570 5,307
1Only general winter range available for Montana.
Environmental
Few at-risk well sites (9) occurred near National Parks and Wilderness Areas. However, 34 well sites were found on environmentally sensitive public lands (BLM Areas of Critical Environmental Concern and National Wildlife Refuges) and another 47 sites were found within other public areas exhibiting some mandate for biodiversity protection (Table 6). Colorado had most of these sites, with 35 at-risk well sites on or near public lands of environmental importance. Figures demonstrating the spatial distribution of wells in relation to environmental landscape features can be found in Appendix B.

Inactive Oil and Gas Wells on Federal Lands and Minerals: Potential Costs and Conflicts
WEST 14 March 2021
Additionally, numerous at-risk oil and gas wells were situated near or within critical and protected habitats for threatened and endangered species. There were 126 at-risk well sites within a mile of designated USFWS critical habitat, including 66 well sites in Colorado and 27 in Utah. Greater-sage grouse PHMA contained 386 at-risk well sites within four Study Area states. Wyoming had the most at-risk well sites in PHMA with 279.
Recreation
Ninety-seven oil and gas wells were within one mile of recreation sites or resources (Table 6). Utah had 22 at-risk wells were in close proximity of general recreation sites, while at-risk wells near recreation sites in the other four states combined totaled eight. Similarly, no at-risk well sites were found near highest-quality fishing locations in any state except Montana, where 67 at-risk well sites were within one mile of blue ribbon fisheries. Figures demonstrating the spatial distribution of wells in relation to recreational landscape features can be found in Appendix A. Twelve percent of at-risk wells (959) were within big game crucial winter range and two-thirds (5,307) were within priority areas identified under SO 3362. Colorado had the most with 360 at-risk well sites within crucial winter range. Wyoming had a large number of at-risk well sites within its big game priority areas (4,570), though it also submitted much larger herd unit/priority areas in its Action Plan, including two that contain nearly the entire Powder River Basin.
Reclamation Costs
Based on GAO estimates for high-cost reclamation scenarios, the 8,050 at-risk oil and gas wells on federal lands could cost up to $1.2 billion to fully reclaim, with an estimated $17 million held in bonds for this purpose.9
DISCUSSION
Orphan oil and gas wells are a recognized concern among the BLM, the state management agencies, and government oversight entities such as the US Government Accountability Office (GAO). However, as the GAO has noted (2018, 2019), the BLM has had difficulties in monitoring, classifying, and enforcing reclamation of abandoned well sites on federal lands, especially during the proliferation of new drilling in the past 10 years.10 Due to monitoring limitations and varying
9 Estimates of $145,000 per well for high-cost reclamation and $2,122 for average bond amount from GAO 2019. This study did not examine specific bond amounts associated with at-risk well sites. 10 According to GAO 2018, there are many difficulties in reviewing wells, specifically those marked as shut-in: “operators are generally not required to notify BLM when they place a well in shut-in status. As a result, officials noted that it is difficult for field offices to identify all shut-in wells in order to review them.” They also noted that identifying when a well has shut-in status is difficult unless inspectors can physically locate the well. BLM officials also indicated that even known shut-in wells are challenging to manage, due to vague and inconsistently applied operator mandates for reporting and testing, which are needed to identify whether an inactive well is environmentally sound and capable of production. For these reasons, GAO has noted that shut-in wells have traditionally represented a large portion of orphaned wells.

Inactive Oil and Gas Wells on Federal Lands and Minerals: Potential Costs and Conflicts
WEST 15 March 2021
state classification criteria, wells marked as idle, shut-in, or temporarily abandoned may actually be orphan wells or are at risk of becoming orphan wells. This study identified 8,050 of these sites. Bonds are collected from well operators during permitting but may be insufficient to fully cover the cost of reclamation (GAO 2018). Aside from Congress-appointed funds, state and local entities are often the source of making up funding differences. At-risk well sites were found in 88 counties across the 5-state Study Area, with 24 counties containing more than 60 well sites each. Four counties in Wyoming had over 300 at-risk well sites, with Campbell County, the third-most populated county in the state (US Census 2020), containing 3,272 sites within its borders alone. A further examination of specific bond amounts and well operators for identified at-risk wells would provide a clearer picture of the financial implications. Many at-risk well sites are near residences, important environmental resources, or landscapes of recreational use and economic value. Inactive wells that are not reclaimed are recognized to pose a potential physical and environmental hazard by air pollution, water pollution, soil erosion, and habitat disturbance (GAO 2019, Resources for the Future 2016). Hundreds of at-risk well sites lie near high human use areas, including census designated places, recreation sites, and National Parks or Wilderness Areas. Additionally, over 200 at-risk well sites are located on or near protected and environmentally significant areas, including sensitive critical habitat for threatened or endangered species. Several thousand at-risk well sites--66% of the total for all five states and 77% in Wyoming--are located in areas of critical big game wintering habitat and habitat restoration priority areas, recognized important landscapes within the Study Area states for environmental, recreational, and economic purposes. While further study is needed to assess the impacts of inactive wells on valued landscapes and resources, the identified at-risk well sites within proximity to these areas could be high priority targets for reclamation efforts. Groundwater contamination by methane, brine, or other pollutants is one of the risks associated with unreclaimed wells (Resources for the Future 2016). High groundwater usage within the Ogallala-High Plains Aquifer, an important source of irrigation and drinking water throughout the US Central Plains, has come under scrutiny in recent years due to both the region’s reliance on the resource and the rapidly depleting water level (US Global Change Research Program 2018). There were 75 at-risk well sites located atop the Ogallala-High Plains Aquifer. According to a 2019 report from E&E News, steps are being taken federally and by the states to address the issue of orphan wells on public lands (Richards 2019). Richards (2019) also states that there is cause for concern due to the volume of wells drilled in the last several years and the economic situation for oil and gas drilling companies that the rate of orphaned wells will continue to dramatically increase and outpace recovery efforts. The cost of per-well reclamation may also increase—wells drilled more recently are often deeper and more disruptive and may be significantly more difficult and costly to reclaim (Richards 2019). A potential increase in orphan wells and in reclamation cost per-well emphasizes the need for federal, state, and local entities to have comprehensive plans in place to address these costs.

Inactive Oil and Gas Wells on Federal Lands and Minerals: Potential Costs and Conflicts
WEST 16 March 2021
REFERENCES
Bureau of Land Management. 2012a. BLM GRSG BER: Federal Sub-Surface Mineral Rights (polygon). U.S. Department of the Interior. https://landscape.blm.gov/geoportal/catalog/search/resource/details.page?uuid=%7B90E1A295-B246-42A9-B291-80A295457CC8%7D.
Bureau of Land Management. 2012b. BLM New Mexico Mineral Ownership. U.S. Department of the Interior. https://navigator.blm.gov/api/download/257881.
Bureau of Land Management. 2015a. Record of Decision and Approved Resource Management Plan Amendments for the Rocky Mountain Region, Including the Greater Sage-Grouse Sub-Regions of Lewistown, North Dakota, Northwest Colorado, Wyoming, and the Approved Resource Management Plans for Billings, Buffalo, Cody, Hiline, Miles City, Pompeys Pillar National Monument, South Dakota, Worland. September 18, 2015. Washington, DC. Available online: https://eplanning.blm.gov/public_projects/lup/105596/143663/176863/2015_Rocky_Mountain_Region_Record_GRSG_ROD_ARMPA_508.pdf
Bureau of Land Management. 2015b. BLM National Recreation Site Points. U.S. Department of the Interior. https://data.doi.gov/dataset/blm-national-recreation-site-points.
Bureau of Land Management. 2018a. Producible Well Bores on Federal Lands. U.S. Department of the Interior. Available online: https://www.blm.gov/sites/blm.gov/files/docs/2021-01/Table9_ProducibleWellBores_2019.xlsx.
Bureau of Land Management. 2018b. Applications for Permit to Drill Status Report. U.S. Department of the Interior. Available online: https://www.blm.gov/programs/energy-and-minerals/oil-and-gas/oil-and-gas-statistics.
California Council on Science and Technology (CCST). 2018. Orphan Wells in California: An Initial Assessment of the State’s Potential Liabilities to Plug and Decommission Orphan Oil and Gas Wells. Available online: https://ccst.us/reports/orphan-wells-in-california/.
California Department of Conservation (CDOC). 2020. Idle Well Program. Available online: https://www.conservation.ca.gov/calgem/idle_well.
Colorado Parks & Wildlife (CPW). 2015. Google Earth (KMZ) Species Maps. Colorado Department of Natural Resources. https://cpw.state.co.us/learn/Pages/KMZ-Maps.aspx.
Esri. 2020. World Imagery and Aerial Photos. (World Topo). ArcGIS Resource Center. Environmental Systems Research Institute (Esri), producers of ArcGIS software. Redlands, California. Information online: http://www.arcgis.com/home/webmap/viewer.html?useExisting=1.
Haynes & Boone, LLP. 2020. Oil Patch Bankruptcy Monitor, November 30, 2020. Available online: https://www.haynesboone.com/-/media/Files/Energy_Bankruptcy_Reports/Oil_Patch_Bankruptcy_Monitor.
Montana Fish, Wildlife & Parks (MFWP). 2019. Montana Game Fish Quality – Streams. Updated 2020. https://gis-mtfwp.opendata.arcgis.com/datasets/49d580c6f1e54774b7bab7c5a3b1e117_0.
Montana Fish, Wildlife & Parks (MFWP). 2008a. Bighorn Sheep Distribution in Montana. Updated 2020. https://gis-mtfwp.opendata.arcgis.com/datasets/8571dbd4fb944052b0632fdcb848c01d_0.
Montana Fish, Wildlife & Parks (MFWP). 2008b. Elk Distribution in Montana. Updated 2020. https://gis-mtfwp.opendata.arcgis.com/datasets/04297cd92395469eb76dac99c1175074_0.

Inactive Oil and Gas Wells on Federal Lands and Minerals: Potential Costs and Conflicts
WEST 17 March 2021
Montana Fish, Wildlife & Parks (MFWP). 2008c. Moose Distribution in Montana. Updated 2019. https://gis-mtfwp.opendata.arcgis.com/datasets/04297cd92395469eb76dac99c1175074_0.
Montana Fish, Wildlife & Parks (MFWP). 2008d. Mule Deer Distribution in Montana. Updated 2020. https://gis-mtfwp.opendata.arcgis.com/datasets/c0729e6099234ce3ba5572859da360fb_0.
Montana Fish, Wildlife & Parks (MFWP). 2008e. Pronghorn Antelope Distribution in Montana. Updated 2019. https://gis-mtfwp.opendata.arcgis.com/datasets/65d096fb900e40879e173ac2e7f110ff_0.
Montana Fish, Wildlife & Parks (MFWP). 2008f. White-tailed Deer Distribution in Montana. Updated 2020. https://gis-mtfwp.opendata.arcgis.com/datasets/58ba75cf84f24465926205d7c1fd2f20_0.
New Mexico Game & Fish (NMGF). 2020. New Mexico Special Trout Waters Map. http://www.wildlife.state.nm.us/fishing/maps-and-accessibility/.
Office of Inspector General (OIG). 2010. Bureau of Land Management’s Oil and Gas Inspection and Enforcement Program. U.S. Department of the Interior. Available online: https://www.doioig.gov/sites/doioig.gov/files/CR-EV-BLM-0001-2009.pdf/.
Office of Inspector General (OIG). 2018. Bureau of Land Management’s Idle Well PRogram. U.S. Department of the Interior. Available online: https://www.doioig.gov/sites/doioig.gov/files/FinalEvaluation_BLMIdleWells_011718.pdf.
Quinton, Sophie. Why ‘Orphan’ Oil and Gas Wells Are a Growing Problem for States. Stateline Weekly, 9 July 2018. Available online: https://www.pewtrusts.org/en/research-and-analysis/blogs/stateline/2018/07/09/why-orphan-oil-and-gas-wells-are-a-growing-problem-for-states.
Resources for the Future. 2016. Plugging the Gaps in Inactive Well Policy. Available online: https://media.rff.org/archive/files/document/file/RFF-Rpt-PluggingInactiveWells.pdf.
Richards, Heather. Thousands of ‘orphan wells’ spark safety, cleanup fears. E&E News, 22 October 2019. Available online: https://www.eenews.net/stories/1061342691.
Rystad Energy. 2020. US bankruptcies and how to avoid them: The costs and benefits of saving E&Ps via royalty exemptions. May 20, 2020. Press Release. Available online: https://www.rystadenergy.com/newsevents/news/press-releases/us-bankruptcies-and-how-to-avoid-them-the-costs-and-benefits-of-saving-eps-via-royalty-exemptions/.
The Wilderness Society (TWS). 2020. The Climate Report 2020: Greenhouse Gas Emissions from Public Lands. February 12, 2020. Available online: https://www.wilderness.org/sites/default/files/media/file/TWS_The%20Climate%20Report%202020_Greenhouse%20Gas%20Emissions%20from%20Public%20Lands_new.pdf.
USA Contiguous Lambert Conformal Conic Projection. Conic map projection data. Information online: http://desktop.arcgis.com/en/arcmap/latest/map/projections/lambert-conformal-conic.htm
US Census Bureau. 2019. 2019 TIGER/Line Shapefiles (machine-readable data files). U.S. Department of Commerce. https://www.census.gov/geographies/mapping-files/time-series/geo/tiger-line-file.html.
US Census Bureau. 2020. Annual Estimates of the Resident Population for Counties in Wyoming: April 1, 2010 to July 1, 2019 (CO-EST2019-ANNRES-56). Population Division, U.S. Department of Commerce. Available online: https://www.census.gov/data/tables/time-series/demo/popest/2010s-counties-total.html.

Inactive Oil and Gas Wells on Federal Lands and Minerals: Potential Costs and Conflicts
WEST 18 March 2021
US Department of the Interior (USDOI). 2018. State Action Plans in response to Secretarial Order 3362: Improving Habitat Quality in Western Big-Game Winter Range and Migration Corridors. https://www.blm.gov/policy/ib-2019-005.
US Energy Information Administration (EIA). 2018. Total energy production from petroleum and other liquids 2018. Available online: https://www.eia.gov/international/overview/world.
US Energy Information Administration (EIA). 2019. U.S. Oil and natural Gas Wells by Production Rate. Available online: https://www.eia.gov/petroleum/wells/.
US Environmental Protection Agency (EPA). 2018. Inventory of U.S. Greenhouse Gas Emissions and Sinks 1990-2016: Abandoned Oil and Gas Wells. Available online: https://www.epa.gov/sites/production/files/2018-04/documents/ghgemissions_abandoned_wells.pdf.
US Fish and Wildlife Service (USFWS). 2020. FWS Critical Habitat. US Fish and Wildlife Service, Endangered Species Program, ECOS Join Development Team. US Department of the Interior (USDOI). https://ecos.fws.gov/ecp/report/table/critical-habitat.html.
US Forest Service (USFS). 2020. Forest Service recreational locations, offices, and facilities [FSTopo_RecFacilities_PT]. US Department of Agriculture (USDA). https://data.fs.usda.gov/geodata/edw/datasets.php
US Geological Survey (USGS). 2000. Estimated Use of Water in the United States Data Dictionary for Principal Aquifer Data for 2000. US Department of the Interior (USDOI). https://water.usgs.gov/watuse/data/2000/aquifer.html.
US Geological Survey (USGS). 2003. Principal Aquifers of the 48 Conterminous United States, Hawaii, Puerto Rico, and the U.S. Virgin Islands. US Department of the Interior (USDOI). https://water.usgs.gov/GIS/metadata/usgswrd/XML/aquifers_us.xml.
US Geological Survey Protected Areas Database of the United States (USGS PAD-US). 2020. Protected Areas Data. USGS National GAP Analysis Program (GAP) – Protected Areas Data Portal. http://gapanalysis.usgs.gov/padus/data/.
US Government Accountability Office (GAO). 2018. OIL AND GAS WELLS – Bureau of Land Management Needs to Improve Its Data and Oversight of Its Potential Liabilities. Report to Congressional Requesters. Available online: https://www.gao.gov/assets/700/691810.pdf.
US Government Accountability Office (GAO). 2019. OIL AND GAS WELLS – Bureau of Land Management Should Address Risks from Insufficient Bonds to Reclaim Wells. Report to Congressional Requesters. Available online: https://www.gao.gov/products/GAO-19-615.
Utah Division of Wildlife Resources (UDWR). 2006. Rocky Mountain Bighorn Sheep Habitat. https://dwrcdc.nr.utah.gov/ucdc/DownloadGIS/disclaim.htm.
Utah Division of Wildlife Resources (UDWR). 2013a. Desert Bighorn Sheep Habitat. https://dwrcdc.nr.utah.gov/ucdc/DownloadGIS/disclaim.htm.
Utah Division of Wildlife Resources (UDWR). 2013b. Elk Habitat. https://dwrcdc.nr.utah.gov/ucdc/DownloadGIS/disclaim.htm.
Utah Division of Wildlife Resources (UDWR). 2015. Mule Deer Habitat. https://dwrcdc.nr.utah.gov/ucdc/DownloadGIS/disclaim.htm.
Utah Division of Wildlife Resources (UDWR). 2017. California Bighorn Sheep Habitat. https://dwrcdc.nr.utah.gov/ucdc/DownloadGIS/disclaim.htm.

Inactive Oil and Gas Wells on Federal Lands and Minerals: Potential Costs and Conflicts
WEST 19 March 2021
Utah Division of Wildlife Resources (UDWR). 2018. Moose Habitat. https://dwrcdc.nr.utah.gov/ucdc/DownloadGIS/disclaim.htm.
Utah Division of Wildlife Resources (UDWR). 2020a. Pronghorn Habitat. https://dwrcdc.nr.utah.gov/ucdc/DownloadGIS/disclaim.htm.
Utah Division of Wildlife Resources (UDWR). 2020b. Blue Ribbon Fisheries. https://wildlife.utah.gov/blue-ribbon-fisheries.html.
Wyoming Game and Fish Department (WGFD). 2012a. Bighorn Sheep Crucial Range Boundaries – 2012 for Wyoming at 1:100,000. https://wgfd.wyo.gov/Wildlife-in-Wyoming/Geospatial-Data/Big-Game-GIS-Data.
Wyoming Game and Fish Department (WGFD). 2012b. Moose Crucial Range Boundaries – 2012 for Wyoming at 1:100,000. https://wgfd.wyo.gov/Wildlife-in-Wyoming/Geospatial-Data/Big-Game-GIS-Data.
Wyoming Game and Fish Department (WGFD). 2012c. Mule Deer Crucial Range Boundaries – 2012 for Wyoming at 1:100,000. https://wgfd.wyo.gov/Wildlife-in-Wyoming/Geospatial-Data/Big-Game-GIS-Data.
Wyoming Game and Fish Department (WGFD). 2012d. White-tailed Seasonal Range Boundaries – 2012 for Wyoming at 1:100,000. https://wgfd.wyo.gov/Wildlife-in-Wyoming/Geospatial-Data/Big-Game-GIS-Data.
Wyoming Game and Fish Department (WGFD). 2015. WGFD Trout Stream Classifications. State of Wyoming. https://wgfd.wyo.gov/Fishing-and-Boating/Stream-Classification.
Wyoming Game and Fish Department (WGFD). 2016. Antelope Crucial Range Boundaries – 2016 for Wyoming at 1:100,000. https://wgfd.wyo.gov/Wildlife-in-Wyoming/Geospatial-Data/Big-Game-GIS-Data.
Wyoming Game and Fish Department (WGFD). 2018. Elk Crucial Range Boundaries – 2018 for Wyoming at 1:100,000. https://wgfd.wyo.gov/Wildlife-in-Wyoming/Geospatial-Data/Big-Game-GIS-Data.
Wyoming Oil and Gas Conservation Commission (WOGCC). 2020. Rules and Regulations. Available online: http://pipeline.wyo.gov/wogcchelp/commission.html.

Appendix A. Well definitions and at-risk evaluation methods.

Well status definitions for at-risk wells Idle wells are defined by BLM (GAO 2018) as “a well that has been inactive for at least seven years and has no anticipated beneficial use during the well’s lease term.” State agencies who manage the well datasets may have different, often less lengthy, definitions of how long a well sits inactive before it is classified as “idle”: just two years for California and one year for Wyoming (California Department of Conservation 2020, Wyoming Oil and Gas Conservation Commission 2020). All definitions also stipulate that the inactive well has not yet been properly sealed and closed (plugged and abandoned). Shut-in wells are defined by GAO (2018) as “inactive wells that are physically and mechanically capable of producing oil or gas in paying quantities or capable of service use.” BLM policy directs field offices to review shut-in wells on federal minerals every five years and to ensure that shut-in wells no longer capable of production are reclaimed. Temporarily abandoned wells are defined by GAO (2018) as “not physically or mechanically capable of producing oil and gas in paying quantities but may have value for a future use.” Non-producing active wells are identified as wells that have been inactive for a period of time and have no anticipated beneficial use during the well’s lease term (GAO 2018). The period of time varies among sources: a California Council on Science and Technology (CCST) report on assessing potential orphan wells considers wells inactive if they exhibit no production during the past five years, while the BLM assesses inactive wells as not producing in seven years (CCST 2018, GAO 2018). The CCST study also considered operator solvency in their identification of “likely orphan wells.” Orphan/Orphaned wells are defined as wells not reclaimed by operators, for which there are no liable parties, and whose bonds were not sufficient to cover reclamation costs (GAO 2019). Exact terminology and status codes used to delineate well status types from state datasets are in Appendix A1.

Appendix A1. State dataset classification terms used in well status evaluation. Colorado Montana New Mexico Utah Wyoming
Data Source
Colorado Oil & Gas Conservation Commission
Montana Board of Oil & Gas Conservation
New Mexico Oil Conservation Division
Utah Department of Natural Resources Oil Gas and Mining Division
Wyoming Oil and Gas Conservation Commission
Status Field in Wells Table
FacilStat WI_Status status WellStatus STATUS
Idle Wells - - - Code “I” Code “DR” Orphaned Wells
Separate dataset
Separate dataset - - Code “GO”,
“OO” Shut-in Wells Code “SI” Code “Shut In” Code “Shut In” Code “S”, “SI” Code “SI”
Temporarily Abandoned Wells
Code “TA” Code “Temporarily Abandoned”
Code “Temporary Abandonment”, “Temporary Abandonment (expired)”
Code “TA” Code “TA”
Idle - Non-producing Active Wells definition
Active Wells Code “PR”, “AC”; oil_prod = 0
Code “Producing”, “Completed”
Code “Active” Code “A”, “P” Code “PG”, “PO”
No production in 7+ years1,2 (BLM)
oil_prod, gas_prod, water_prod = 0, 2013-2019
BBLS_OIL, MCF_ GAS. BBLS_WTR=0, 2013-2019
Last Production date before 01/01/2013
Oil, Gas, Water = 0, 2013-2019
Oil, Gas, Water = 0, 2013-2019
No production in 5+ years1,2 (CCST)
oil_prod, gas_prod, water_prod = 0, 2015-2019
BBLS_OIL, MCF_ GAS. BBLS_WTR=0, 2015-2019
Last Production date before 01/01/2015
Oil, Gas, Water = 0, 2015-2019
Oil, Gas, Water = 0, 2015-2019
1 In addition to oil and gas production, water production was used to identify active support wells. 2 Wells marked as active within the spatial dataset but absent from the production summary join tables
were also classified as non-producing for this study.

Appendix B. State at-risk oil and gas well site summary figures.

Appendix B1. At-risk oil and gas well sites on federal minerals in Colorado, by Status Category.

Appendix B2. At-risk oil and gas well sites on federal minerals in Colorado, with population and environmental features.

Appendix B3. At-risk oil and gas well sites on federal minerals in Colorado, with recreation features.

Appendix B4. At-risk oil and gas well sites on federal minerals in Montana, by status category.

Appendix B5. At-risk oil and gas well sites on federal minerals in Montana, with population and environmental features.

Appendix B6. At-risk oil and gas well sites on federal minerals in Montana, with recreation features.

Appendix B7. At-risk oil and gas well sites on federal minerals in New Mexico, by status category.

Appendix B8. At-risk oil and gas well sites on federal minerals in New Mexico, with population and environmental features
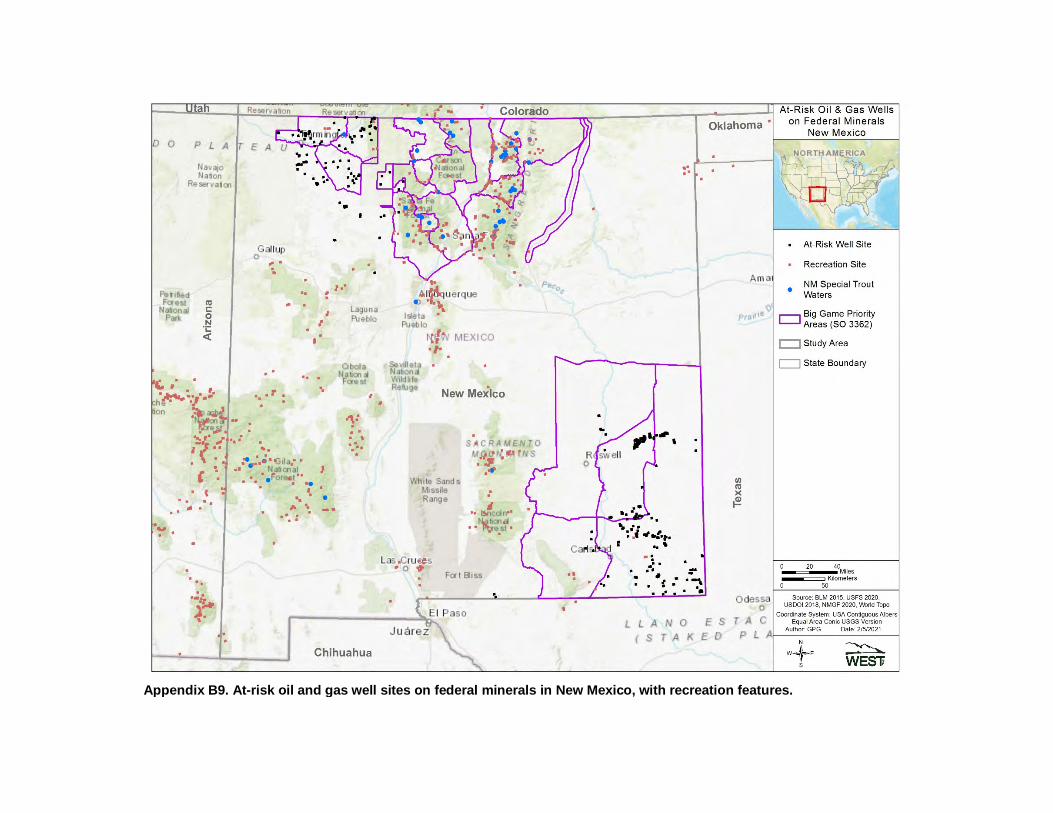
Appendix B9. At-risk oil and gas well sites on federal minerals in New Mexico, with recreation features.

Appendix B10. At-risk oil and gas well sites on federal minerals in Utah, by status category.
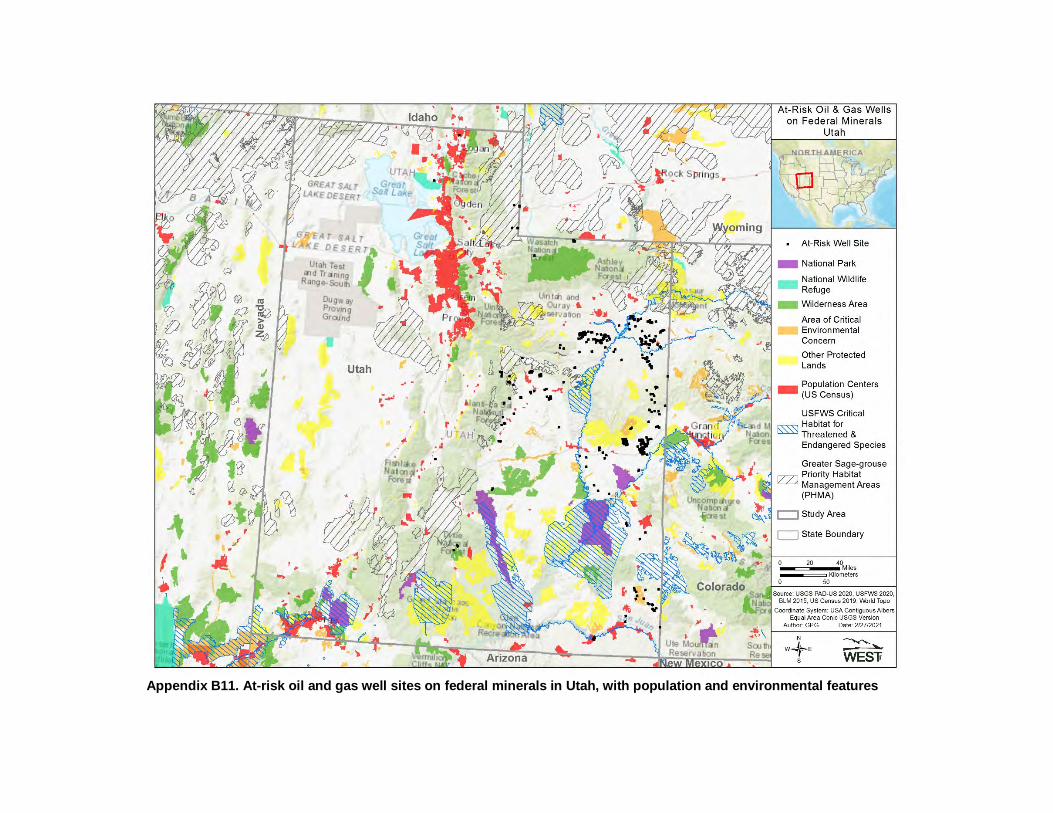
Appendix B11. At-risk oil and gas well sites on federal minerals in Utah, with population and environmental features

Figure Appendix B12. At-risk oil and gas well sites on federal minerals in Utah, with recreation features.

Appendix B13. At-risk oil and gas well sites on federal minerals in Wyoming, by status category.
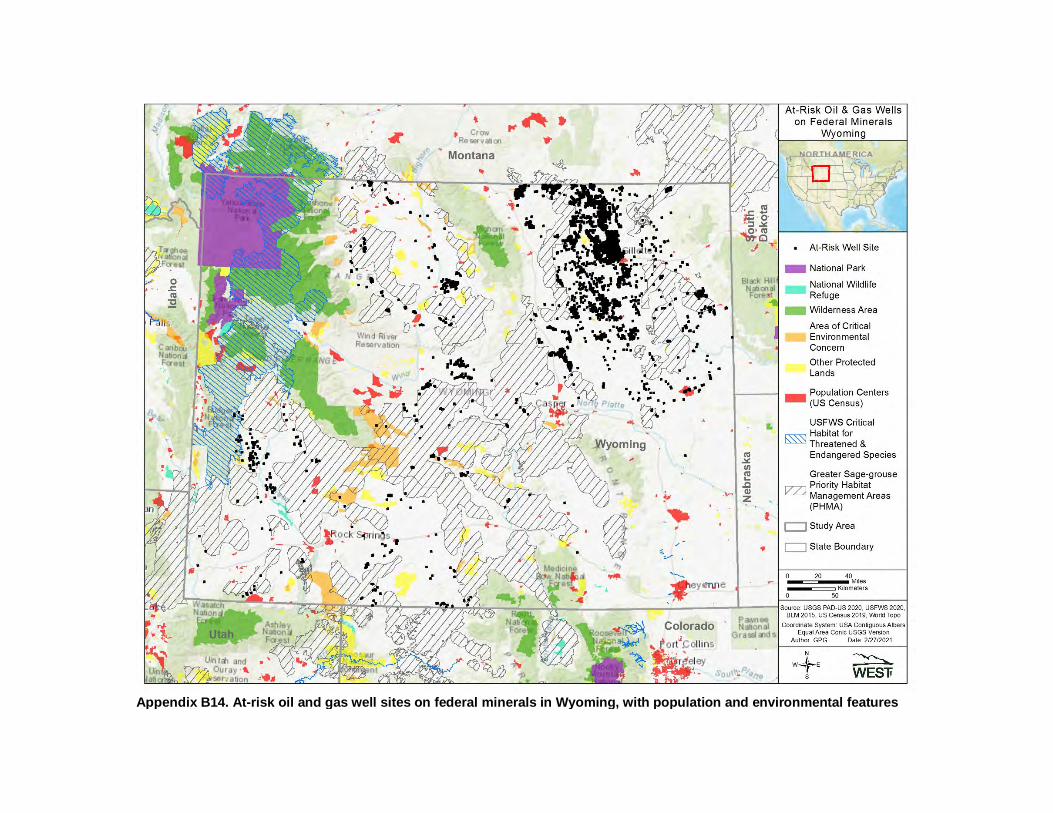
Appendix B14. At-risk oil and gas well sites on federal minerals in Wyoming, with population and environmental features

Appendix B15. At-risk oil and gas well sites on federal minerals in Wyoming, with recreation features.