Embed Size (px)
Citation preview

Inability of Exercise-Induced R Wave Changes to PredictCoronary Artery Disease
KIM FOX, MD, MRCPDIANE ENGLAND, MAANNE JONATHAN, ASCTANDREW SELWYN, MB, MRCP
London, England
From the Cardiovascular Unit, HammersmithHospital, London, England . This work was sup-ported by a grant from the British Heart Founda-tion, London, England . Manuscript received March6, 1981: revised manuscript received August 19,1981, accepted September 14, 1981 .
Address for reprints: Kim Fox, MD, Cardiovas-cular Unit, Hammersmith Hospital, Du Cane Road,London W12 OHS, England .
874 March 1982 The American Journal of CARDIOLOGY Volume 49
To determine the value of exercise-Induced R wave changes in diagnosingcoronary disease 200 patients undergoing coronary angiography werestudied with 16 lead precordial exercise mapping . R wave amplitude wascalculated before and Immediately after exercise as the sum of R In all16 leads, the sum of the R waves In the left plus the S waves In the rightprecordial leads, as well as the sum of the R waves only In those leadsthat manifested S-T segment depression . Coronary artery disease wasfound In 154 patients ; S-T depression developed in 122 (sensitivity 79percent); the sum of R increased or remained unchanged in 61 and de-creased In 93 (sensitivity 40 percent) . Forty-six patients did not havecoronary artery disease; S-T depression developed In 5 (specificity 89percent) ; the sum of R Increased or was unchanged in 30 and decreasedin 16 (specificity 35 percent) . Similar results were obtained using the othercriteria for calculating R wave amplitude . Exercise-Induced S-T depressionwas Identified in 5 .1 f 2.6 (mean f standard deviation) of the 16 pre-cordial leads and In 2 .0 f 1 .1 of the chest leads of the standard electro-cardiogram (p <0.01). Thus, electrocardiographic alterations found Inthe standard chest leads represent only a small variable proportion of thetotal projection. When the whole precordial area was analyzed, R wavechanges were so unpredictable that they could not be used In the diagnosisof coronary disease.
Although several severe limitations of exercise electrocardiography havebeen identified in recent years,' this technique is safe and probablyprovides the simplest noninvasive assessment of hemodynamically im-portant coronary artery disease . In the past, alterations of the S-T seg-ment during and after exercise have been considered the most importantelectrocardiographic sign of myocardial ischemia . 2 However, the largenumber of false positive responses, particularly in women, 3 and falsenegative responses in patients with an atypical history 4 has necessitateda search for more sensitive and specific electrocardiographic markersof myocardial ischemia. Several investigators 5-7 have suggested that Rwave changes (increased voltage) can be used to increase the diagnosticvalue of the exercise test,5-7 although others 8 '9 have not confirmed thisfinding. In this study, we used 16 lead precordial mapping to evaluatethe alterations in the QRS complex that occur on exercise and definedthe diagnostic value of these changes in relation to coronary arterialanatomy .
MethodsPatients : Two hundred consecutive patients (170 men and 30 women)
undergoing diagnostic coronary angiography were studied . They were aged 29to 69 years (mean t standard deviation 48.2 ± 8.6) . One hundred eighty-twopatients presented with chest pain ; the remaining 18 patients had no chest painand underwent angiography for diagnostic purposes .Precordial electrocardiographic mapping : All patients underwent pre-
cordial electrocardiographic mapping before, during and for 10 minutes afterexercise . 10 The 16 point precordial electrocardiogram was recorded using a di-

FIGURE 1 . The 16 electrodes are evenly distributed over the lefthemithorax and connected to a four way switch .
rect-writing ink jet Mingograf (Elema Schonander) recordingon four channels simultaneously . The 16 points were dis-tributed evenly over the left hemithorax and the boundarieswere the angle of Louis, the right sternoclavicular joint, theleft posterior axillary line and 6 cm below the xiphisternum(Fig . 1) . Disposable press stud electrodes were used and thensecured into position using adhesive tape sufficiently tight tokeep the electrodes stable without interfering with respiration .Screened electrode cable was used and the 16 electrodes wereconnected to the electrocardiograph using a four-wayswitching system . Figure 2 shows an example of a recordingmade before and immediately after exercise .Graded maximal exercise tests were performed using a
bicycle ergometer. Patients cycled at a constant speed (50revolutions/min), and the work load was increased by 25 wattseach minute. The exercise tests were limited by the appear-ance of chest pain, dyspnea, fatigue or multiple ventricularectopic complexes. Chest pain was reported during the exer-cise test in 132 of the 200 patients.
FIGURE 2 . An example of the 16 precordialleads recorded before and after exercise . 1,2, 3, 4 indicate the four horizontal sets ofelectrodes; A, B, C, D indicate the four verticalsets of electrodes shown in Figure 1 .
TABLE I
Clinical Data
R WAVE IN CORONARY ARTERY DISEASE-FOX ET AL .
46 patients (31 men, 15 women);mean age 42 ± 9 years
29 patients (25 men, 4 women) :mean age 47 ± 8 years
1892
44 patients (41 men, 3 women) ;mean age 52 ± 8 years
LAD + LCx narrowing
24LAD + RCA narrowing
20Three vessel disease
57 patients (54 men, 3 women);mean age 50 ± 10 years
24 patients (19 men, 5 women) ;mean age 49 ± 10 years
LAD = left anterior descending coronary artery ; LCx = left circumflexcoronary artery; RCA = right coronary artery .
Sixteen lead electrocardiographic recordings were madebefore exercise, immediately after exercise and 1, 3, 5, 8 and10 minutes after exercise. During exercise four leads werecontinuously monitored . The maximal heart rate achieved was111 to 175 (mean 140) beats/min, the work load was 12,000 to71,000 (mean 34,979) watt seconds . Exercise duration was 6 .0f 1.55 minutes .
Interpretation of the records : At each of the 16 positionsS-T segment depression was measured in three complexes andan average taken. In each patient either the T-P or P-Q seg-ment was used as the isoelectric line . The choice depended onwhich of these remained identifiable both before and afterexercise . S-T segment depression was measured in millimeters(mm) to the nearest 0 .5 mm. The S-T segment was considereddepressed if there was a change of 1 .0 mm or more lasting 0.08second or longer . I I Contour maps of the area of S-T segmentdepression were drawn for each precordial surface map . 10 Fiveof the 16 precordial leads covered the positions usually occu-pied by the chest leads of the standard 12 lead electrocardio-gram and the number of these leads with S-T segment de-pression was noted .'LR wave amplitude was calculated using the same isoelec-
tric line as the S-T segment . The following standard criteriawas used (all measurements in millimeters) :
Normal coronary arteries
Single vessel disease
LAD narrowingRCA narrowingLCx narrowingTwo vessel disease
Left main stem disease
March 1982 The American Journal of CARDIOLOGY Volume 49 675
Immediately After Exercise
41*
A B C D
Before Exercise
1
4
A B C D

R WAVE IN CORONARY ARTERY DISEASE-FOX ET AL .
TABLE 11Patients Whose R Wave, R Wave Index and R + SIncreased (T), Decreased (j) or Remained Unchanged inRelation to the Results of Coronary Arterlography
1 . The sum of the R wave in all 16 leads .2. The sum of the R wave plus the S-T segment depression
in all 16 leads (R wave index, A RST) .3. The sum of the R wave in leads with S-T segment de-
pression (regional R wave) .4. The sum of the R wave plus the S-T segment depression
in leads with S-T segment depression (regional R wave index,regional A RST) .
5. The sum of the R wave in the left precordial leads plusthe sum of the S waves in the right precordial leads (R +S) .
These calculations were made before exercise, immediatelyand 1 minute after exercise . All data from the exercise testswere reported before the coronary arteriograms were ob-tained.Coronary arteriography: All patients had left ventricular
angiograms and coronary arteriograms performed using theJudkins technique . The radiologists and cardiologists whoperformed the investigation also interpreted the coronaryarteriograms without knowledge of the exercise tests . Coro-nary arterial narrowing was considered significant when theluminal diameter was decreased by at least 70 percent .
ResultsSatisfactory recordings were obtained in all patients .
The clinical details, results of coronary arteriographyand left ventricular angiography are shown in Table1 .S-T segment depression : Among the 154 patients
with significant coronary arterial narrowing, S-T seg-ment depression developed in 122 (sensitivity 79 per-cent). Fifteen of the remaining 32 patients had had aprevious myocardial infarction and evidence of the in-farct was present in the resting electrocardiogram ; ex-ercise-induced S-T segment elevation developed in 12of these patients . Exercise-induced S-T segment de-pression was found in 5 of the 46 patients without cor-onary arterial narrowing (specificity 89 percent) .
TABLE IIINumber of Patients in Whom Regional R and Regional RWave Index Increased (?), Decreased (l) or RemainedUnchanged in Relation to the Results of CoronaryArterlography
Contour maps of the area of S- T segment depressionwere drawn . S-T segment depression developed in 5 .112.6 (mean ± standard deviation) of the 16 precordialleads. In contrast, when only the standard chest leadswere analyzed, S-T segment depression developed in 2 .0± 1.1 leads . The proportion of the total precordial areaof S-T depression that the standard chest leads occu-pied varied from 0 to 100 percent (mean 40.6 ± 18.4) .R wave: Tables II and III show the number of pa-
tients in whom the R wave, R wave index, R + S, re-gional R wave and regional R wave index increased,remained unchanged or decreased in relation to theircoronary arterial status . The exercise-induced peakheart rate (mean 138 ± 17 heats/min) of the 61 patientswhose R wave was unchanged or increased and who weresubsequently found to have coronary heart disease didnot differ significantly from that of the 93 patients withcoronary artery disease whose R wave diminished (mean141 ± 19 beats/min) (p >0 .05) .
Table IV shows the sensitivity and specificity of theS-T segment and R wave changes in the diagnosis ofcoronary artery disease . The calculations have beenmade on the basis that an R wave that remains un-changed or increased represents a positive response .Only the sensitivity and specificity of the regional Rwave index come close to those of the S-T segment .Combining the S-T segment and R wave data increasesthe sensitivity only at the expense of a large decrease inspecificity .
The mean R wave and R wave index (Fig . 3 and 4), R+ S (Fig. 5) and regional R wave and regional R waveindex (Fig. 6 and 7) are shown before and immediatelyafter exercise in relation to the results or coronary ar-teriography. All measurements of the R wave decreasedin both normal subjects and patients with coronary
TABLE IVSensitivity and Specificity of S-T Segment Depression (S-T y ) Versus Those of Unchanged or Increased R Wave Amplitude
S-T L
R WaveR Waveindex R+S
RegionalR Wave
RegionalR WaveIndex
S-T j +R Wave
Sensitivity 1%) 79
40 53 39 45 66 88Specificity 1%) 89
37 37 39 80 80 27
676
March 1982 The American Journal of CARDIOLOGY Volume 49
Regional R Wave Regional R Wave Index
T
Same
1 t Same 1
Normalsubjects
0 1 4 0 1 4
Patientswithcoronaryarterydisease
16 39 67 27 54 41
R Wave R Wave Index R + S
Same l T Same i T Same 1
Normal 7 22 17 7 22 17 8 20 18subjects
Patients 16 45 93 24 58 72 12 48 94withcoronaryarterydisease
140
120
100
80
60
40
20
0Single
2-Vessel
3-Vessel
Left MainNormals
Vessel
Disease
Disease
StemDisease
Disease
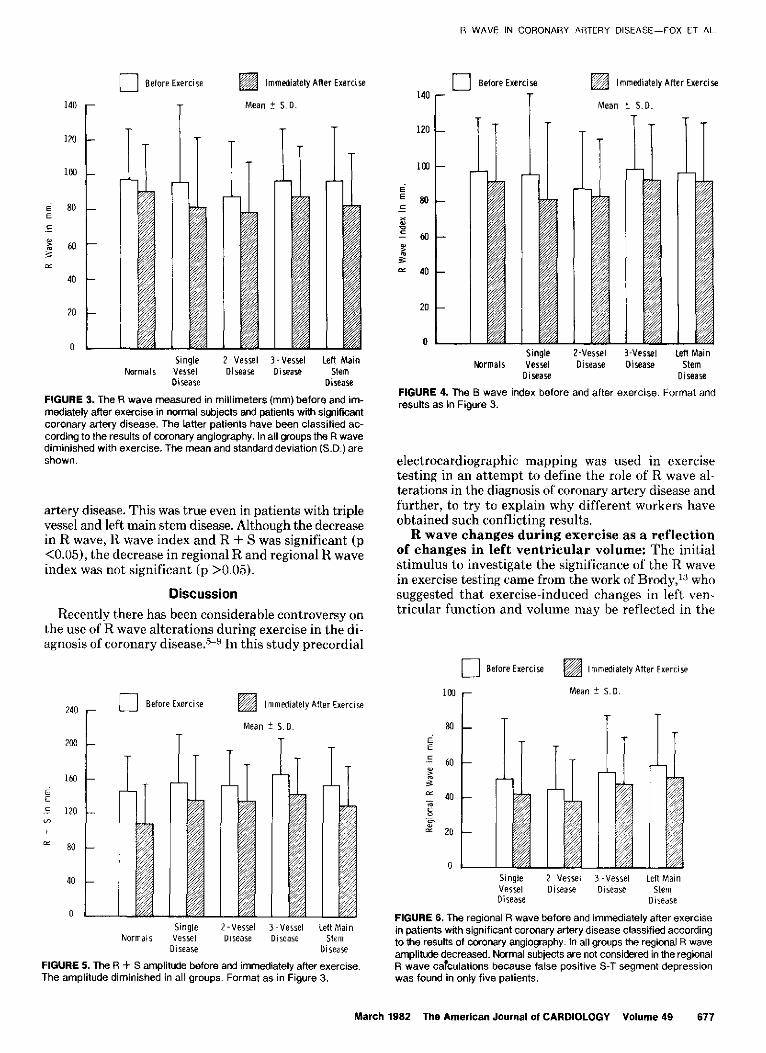
FIGURE 3. The R wave measured in millimeters (mm) before and im-mediately after exercise in normal subjects and patients with significantcoronary artery disease. The latter patients have been classified ac-cording to the results of coronary angiography . In all groups the R wavediminished with exercise . The mean and standard deviation (S.D.) areshown,
artery disease. This was true even in patients with triplevessel and left main stem disease. Although the decreasein R wave, H wave index and R + S was significant (p<0.05), the decrease in regional R and regional R waveindex was not significant (p >0.05) .
DiscussionRecently there has been considerable controversy on
the use of R wave alterations during exercise in the di-agnosis of coronary disease .5-9 In this study precordial
80
40
240 -
a Before Exercise
200
Before Exercise
r
Mean + S . D .
Immediately After Exercise
II
Immediately After Exercise
Mean *- S .D .
Normals
FIGURE 5 . The R + S amplitude before and immediately after exercise .The amplitude diminished in all groups . Format as in Figure 3 .
140
120
100
EE 80
p 40
20
0
R WAVE IN CORONARY ARTERY DISEASE-FOX ET AL .
Before Exercise
Single
2-Vessel
3-Vessel
Left MainNormals
Vessel
Disease
Disease
StemDisease Disease
FIGURE 4. The B wave index before and after exercise . Format andresults as in Figure 3 .
electrocardiographic mapping was used in exercisetesting in an attempt to define the role of R wave al-terations in the diagnosis of coronary artery disease andfurther, to try to explain why different workers haveobtained such conflicting results .R wave changes during exercise as a reflection
of changes in left ventricular volume : The initialstimulus to investigate the significance of the H wavein exercise testing came from the work of Brody,'t whosuggested that exercise-induced changes in left ven-tricular function and volume may be reflected in the
Before Exercise Immediately After Exercise
Immediately After Exercise
Mean ! S . D .
Single
2-Vessel
3-Vessel
Left MainVessel
Disease
Disease
StemDisease
Disease
FIGURE 6 . The regional R wave before and immediately after exercisein patients with significant coronary artery disease classified accordingto the results of coronary angiography . In all groups the regional R waveamplitude decreased . Normal subjects are not considered in the regionalR wave calculations because false positive S-T segment depressionwas found in only five patients .
March 1982 The American Journal of CARDIOLOGY Volume 49
677
I /iG
/3/
Single
2-Vessel
3-Vessel
Left MainVessel
Disease
Disease
StemDisease
Disease

R WAVE IN CORONARY ARTERY DISEASE-FOX ET AL .
40
20
0
1-1 Before Exercise
SingleVesselDisease
I
Immediately After Exercise
Mean ± S . D .
2-Vessel 3-Vessel
Left MainDisease
Disease
StemDisease
FIGURE 7. The regional R wave index before and after exercise inpatients with significant coronary artery disease . Format and resultsas in Figure 6 .
electrocardiogram by alterations in the QRS voltage . Inthe normal heart it is likely that there is a progressivedecrease in systolic and diastolic left ventricular vol-umes with exercise that is possibly sympatheticallymediated. However, in patients with coronary arterydisease the development of myocardial ischemia is al-most always associated with dilatation of the left ven-tricle . 14 The initial finding of a decrease in the R wavein normal subjects" and an increase in the R wave inpatients with severe coronary artery disease appearedto fit well with the Brody hypothesis . 5 Unfortunately,the theory that alterations of left ventricular functionand volume will be reflected in QRS changes in theelectrocardiogram has never been validated in humanbeings. In a recent study 8 performed with gated bloodpool imaging with simultaneous monitoring of theelectrocardiogram (level VF,) during exercise, only oneof the nine patients who manifested an increase inend-diastolic volume at peak exercise had an associatedincrease in R wave amplitude .R wave changes during exercise correlated with
coronary angiographic findings: In this study weinvestigated the R wave alterations that occurred in 200patients undergoing coronary angiography . Previousworkers used a variety of criteria to express R waveamplitude, and much of the confusion may have arisen
678
March 1982 The American Journal of CARDIOLOGY Volume 49
from these different approaches. We therefore analyzedour data using all the different criteria for calculatingR wave amplitude. When this was done, R wave and Rwave index alterations proved to be a poor guide to thepresence of coronary artery disease. Calculating thetotal left ventricular forces-that is, R wave in left chestleads and S wave in right chest leads-did not improvethe results. Only when the R wave and R wave indexwere measured in those leads that developed S-T seg-ment depression (regional R wave and regional R waveindex) was some relation found between R wave changesand coronary artery disease . Even here the results fellshort of simple analysis of the S-T segment .
It has been suggested that increase in R wave is foundto occur particularly in patients with advanced coronarydisease .', " When our own results were analyzed ac-cording to the findings at coronary angiography, pa-tients with severe coronary disease (that is, three vesselor left main stem) behaved similarly in terms of R wavealterations to those with normal coronary arteries, orwith single or two vessel narrowing .
Role of multiple precordial lead recordings : Inprevious studies several different electrocardiographicleads were used for R wave analysis ; some investigatorsused a single chest lead (V,,), others multiple chest leadsof the 12 lead electrocardiogram . Analysis of the S-Tsegment projection in our precordial maps showed thatthis electrocardiographic sign is projected to widespreadareas of the precordium ; the area varies greatly frompatient to patient. The projection of S-T segment de-pression in the chest leads represents only a variablefraction of the total precordial area of S-T segmentdepression. In these circumstances it is not surprisingthat in previous studies employing only the standardchest leads, variable and conflicting results were ob-tained. When the entire precordial area was analyzed,R wave changes were so unpredictable that they couldnot be used for the diagnosis of coronary artery disease .This can be appreciated by comparing the R wave val-ues before and immediately after exercise in Figure 2 .In several leads there was a marked decrease in R wave,R wave index and R + S immediately after exercise ; inothers, these variables were unchanged or increased .
Clinical implications : This study does not supportthe use of QRS alterations in exercise testing for thediagnosis of coronary artery disease . Although severelimitations in the use of S-T segment displacement havebeen highlighted in recent studies, this electrocardio-graphic sign still remains the most useful for the diag-nosis of patients presenting with chest pain .
seaun MF . Diagnostic value of history and maximal exerciseelectrocardiography in men and women suspected of coronaryheart disease . Circulation 1977 :56:756-61 .Bonoris PE, Greenberg PS, Castellanet MJ, Ellestad MH . Signif-icance of changes in R wave amplitude during treadmill stresstesting : angiographic correlation . Am J Cardiol 1978;41 :846-51 .Bonoris PE, Greenberg PS, Christlson GW, Castellaret MJ, El-tested MH . Evaluation of R wave amplitude changes versus S-T
References1 . Redwood DR, Borer JS, Epstein SE . Whither the S-T segment
during exercise. Circulation 1976 ;54 :703-6 .2 . Bruce RA . Exercise testing of patients with coronary heart disease .
Principles and normal standards of evaluation . Ann Clin Res 5 .1971;3:323-32,
3 . Cumming GR, Dufresne C, Kich L, Samm J. Exercise electro-cardiogram patterns in normal women . Br Heart J 1973;35 :1055--61 . 6 .
4 . Decry JMR, Kapita BM, Cosyns J, Sottlaux-Brasseur LA, Rous-

segment depression in stress testing . Circulation 1978 :57 :904-10 .
7 . Berman JL, Wynne J, Cohn PF. Multiple lead QRS changes withexercise testing . Diagnostic value and hemodynamic implications .Circulation 1980 ;61 :53-61 .
8 . Baffler A, Froelicher V, Slutsky R, Ashbum W . Relationship of QRSamplitude changes during exercise to left ventricular function andvolumes and the diagnosis of coronary artery disease . Circulation1979;60:1004-13 .
9. Wagner S, Cohn PF, Selzer A . Unreliability of exercise-inducedR wave changes as indexes of coronary artery disease . Am JCardiol 1979 ;44:1241-5 .
10. Fox KM, Selwyn AP, Shillingford JP. Precordial electrocardio-graphic mapping after exercise in the diagnosis of coronary arterydisease . Am J Cardiol 1979 ;43:541-6 .
11 . Mason RE, Llkar 1, Blem RO, Ross RS . Multiple lead exercise
R WAVE IN CORONARY ARTERY DISEASEFOX ET ALL
electrocardiography . Circulation 1967 :36:517-25 .12. Fox K, Selwyn A, Oakley D, Shlllingford JP . Relationship between
the precordial projection of S-T segment changes after exerciseand coronary angiography . Am J Cardiol 1979 ;44:1068-75 .
13. Brody DA. A theoretical analysis of intracavity blood mass on theheart-lead relationship . Circ Res 1956;4:731-8 .
14. Pasternac A, Gorlin R, Sonnerblick EH, Haft JI, Kemp HG . Ab-normalities of ventricular motion induced by atrial pacing in cor-onary heart disease . Circulation 1972 ;45:1195-205 .
15. Simoons ML, Hugenholtz PG. Gradual changes of ECG waveformduring and after exercise in normal subjects . Circulation 1975 :52:570-7 .
16. Baron DW, Ilsely C, Shleban I, Poole-Wilson PA, Richards AF .R wave amplitude during exercise relation to left ventricularfunction and coronary artery disease . Br Heart J 1980 ;44 :512-7 .
March 1982 The American Journal of CARDIOLOGY Volume 49 679