Embed Size (px)
Citation preview

The Common Agricultural Policy (CAP) is Europe’s answer to the need for a decent standard of living for 22 million farmers and agricultural workers and a stable, varied and safe food supply for its 500 million citizens. As a com-mon policy for all 28 EU countries, the CAP strengthens the competitiveness and sustainability of EU agriculture by providing Direct Payments aimed at stabilising farm revenues and finances projects responding to country-spe-cific needs through national (or regional) Rural Development Programmes, which also cover the wider rural economy.
The CAP also provides a range of market measures, including tools to address market difficulties, and other additional elements such as quality logos, promotion for EU farm products which complete CAP action to support farmers. The CAP budget fixed for the period from 2014-2020 provides a total of EUR 408.31 billion with EUR 308.73 billion intended for direct payments and market measures (the so-called First Pillar) and EUR 99.58 billion for Rural Development (the so-called Second Pillar).
CAP IN YOUR COUNTRY
Agriculture and Rural Development
September 2016
• has a population of nearly 61 million, of which just over 20 % live in rural areas.
• covers an area of 302 069 km² with a utilised agricultural area (UAA) of nearly 13 million hectares, of which almost 3 million ha (21 %) is irrigated and a further 4 million (31 %) capable of being irrigated.
• has a highly diverse agricultural sector with considerable regional variation in terms of farm structures and production; this is reflected in the number of food products registered as Geographical Indications, more than in any other Member State.
• has to deal with specific challenges facing Mediterranean areas notably with resource constraints such as water scarcity and the consequences of climate change.
ITALY

2
In the period to 2020, the new CAP is going to invest around EUR 37.5 billion1 in Italy's farming sector and rural areas. Key political priorities have been defined at European level such as: jobs and growth, sustainability, modernisation, innovation and quality. At the same time, Italy has flexibility to adapt both Direct Payments and Rural Development Programmes to its specific needs.
The new Direct Payments are to be distributed in a fairer way between Member States, and between farmers within the same Member State, getting away from allocations on the basis of "historical references". Given the difficulties of such redistribution, and due to persisting difficulties in certain ag-ricultural sectors, Member States also have more flexibility to take into account specific sectors in particular regions. The to-tal budget available for Direct Payments in Italy for the period 2014-2020 amounts to more than EUR 27 billion.
A key change in the new CAP is the application of new 'Green-ing' rules, in order to highlight the benefits farmers provide to society as a whole on issues such as Climate Change, biodi-versity loss and soil quality. Under this system, 30 % of the
Direct Payment envelope, paid per hectare, is linked to three environmentally-friendly farming practices: crop diversification, maintaining permanent grassland and conserving 5 % of areas of ecological interest or measures considered to have at least equivalent environmental benefit.
For the remaining Italian Direct Payments (after "Greening"), the Basic Payment Scheme (replacing the Single Payment Scheme) will introduce a gradual convergence of the level of payments per hectare by 2019, but not full convergence. The Italian authorities have decided to earmark 11 % of the Direct Payments envelope for voluntary coupled support (targeting dairy, beef and veal, sheep and goatmeat, protein crops, grain legumes, durum wheat, olive oil, rice, sugarbeet and tomatoes for processing). By 2017 the total amount allocated to volun-tary coupled support is foreseen to increase to 12 %. Italy also applies the Small Farmers Scheme, a flat-rate simplified system of support for the smallest beneficiaries, with a maxi-mum annual payment of EUR 1 250 per farmer. This scheme reduces the administrative burdens for these farmers, lessens the controls on cross-compliance and exempts them from greening rules. With the goal of achieving a fairer distribution of support, the Italian authorities are decreasing the amounts for the largest beneficiaries of Direct Payments (applying a 50 % reduction in Basic Payment Scheme amounts over EUR 150 000 per individual beneficiary with an upper limit of EUR 500 000).
Other changes introduced in the 2013 CAP reform include stricter rules on active farmers eligible for Direct Payments and a new 25 % aid supplement for young farmers for the first 5 years, in addition to already existing installation grants.
Fairer and greener direct payments
1 Total allocation of Direct Payments and Rural Development for the period 2014-2020 (in current prices).
INVESTING in Italy's agriculture 2014-2020
3
Supporting key priorities for Italy's rural developmentIn the period 2014-2020, with a total of around EUR 10.4 billion from the EU budget for measures benefiting agricultural producers and the economy of its rural areas (plus co-financing from public and private funds), Italy's rural development envelope has increased compared to the period 2007-2013, contrary to an overall decrease in the EU (in current prices). Rather than defining priorities under a single, national Rural Development Programme (RDP), Italy has decided to manage these funds through 21 regional RDPs, while retaining two programmes managed at national level: the Italian National Rural Network Programme and a National Programme on risk and water management and agricultural biodiversity – giving a total of 23 national and regional Rural Development Programmes for Italy.
Although there is, by definition, a variation in the RDP priority from one region to another, most of the Italian regional programmes are looking to target public support at enhancing the competitiveness of agricultural production systems and of agro-industry enterprises; supporting investments in sustainable energy; promoting climate change adaptation and protecting the environment and increasing the quality of life and economic diversification in rural areas.
Farmers at the heart of the food supply chainTo improve the balance of the food supply chain in Italy, EU instruments (such as Producer Organisations) help farmers
to get better organised and to market their products better.
Moreover, the EU organic logo helps consumers choose food produced in a sustainable way.
INVESTING in Italy's Agriculture 2014-2020
3
Rural Development projects supported by the CAP Improving olive oil quality
Much research has been done to improve olive oil quality, but production costs to obtain a high level product are not always sustainable. Furthermore, by-products deriving from the oil production process are numerous and not easy to be disposed of. Olive oil is an important product in Tuscany, in terms of volumes of production and mar-keting, therefore an olive oil mill enterprise in collaboration with a university, the region-al chamber of commerce, machinery companies and others created a partnership to test an innovative filtering prototype for olive oil production. The project, co-funded by the EU, showed the importance of the filtering process in the production of high quality olive oil, and the newly tested filtering system reduced both the environmental impact and the production costs. In addition, this project created partnerships between a local retailer company, the olive oil mill enterprise and farmers. More information.
Total budget: EUR 167 083 (EU contribution: EUR 66 356)

4
Between 2007 and 2013, the CAP invested around EUR 43.6 billion in Italy's farming sector and rural areas with the objective of stabilising farmers' income, modernising and increasing the sustainability of Italian farms and securing the supply of safe, affordable and quality food for its citizens.
Italian farmers benefit from the CAPIn recent years, Direct Payments have been a key safety net. For example, in 2014 Italian farmers received over EUR 3.9 billion in Direct Payments, benefitting some 1.16 million farm businesses, three quarters of which received a payment below EUR 2 000. Moreover, in 2014, the EU spent more than EUR 614 million on market measures in Italy, targeting mainly the wine and fruit and vegetables sector.
Fostering growth and jobs in Italy's rural areasDuring the period 2007-2013, the CAP invested nearly EUR 9 billion (plus co-funding from public and private sources) to a whole range of different activities supporting agricultural production and benefitting Italy's rural areas by helping to maintain a diversity of activities and to transform this into a feature of economic strength, cultural richness and social cohesion. In concrete terms, since 2007 Rural Development funds supported Italy's agriculture by:
• setting up young farmers: More than 16 500 young farmers were set up with a total investment (public and private) of EUR 800 million;
• providing trainings: Almost 100 000 participants were involved in vocational training and information actions, through measures aimed at promoting knowledge and improving human potential;
• modernising holdings: Great emphasis was given to the modernisation of agricultural holdings and adding value to agricultural and forestry products with a total volume of investment (public and private) of EUR 4.8 billion and EUR 2.2 billion respectively;
• supporting farms: Two important measures were agri-environment payments and payments for farmers in mountain areas characterised by natural constraints: the cumulated public expenditure for both measures amounted to EUR 2.46 billion - supporting approximately 113 000 farm holdings and covering a total area of more than 2.35 million hectares;
• developing rural areas: Recreation and tourism development in rural areas through diversification into non-agricultural activities, such as agri-tourism, were supported by total public expenditure of nearly EUR 246 million (nearly EUR 126 million from the EU budget), while the total volume of investments (public and private) was more than EUR 1 billion.
2 Total expenditure for Direct Payments, Market Measures and Rural Development (payments) for the period 2007-2013 (in current prices).
KEY ACHIEVEMENTS

5
Adding value with Quality schemesThrough the Quality Policy of the CAP, the EU provides a number of measures to help producers build on the high quality reputation of European products to sustain competitiveness and profitability. A key tool in this is the register of more than 1 300 protected food names which are classified as a Protected Designation of Origin (PDO), a Protected Geographical Indication (PGI) or a Traditional Speciality Guaranteed (TSG). In fact, Italy is the Member State with the most registered products. The production of these registered quality products contributes to diversity, development and growth in the rural areas where they are produced and protects local knowledge, skills and jobs.
At present Italy has registered 285 products of which 165 as PDO (such as Gorgonzola and Prosciutto di Parma) 118 as PGI (such as Mortadella di Prato and Melone Mantovano) and 2 as TSG.
Responding to new market difficultiesFollowing the prolongation of the Russian ban on the EU agricultural imports and the specific market conditions of the summer 2015, the European Commission adopted in October 2015 a support package worth EUR 500 million to back those farmers affected most by the market difficulties, including EUR 420 million in national envelopes to support especially dairy and livestock sectors, with flexibility to Member States to decide how to target this support. Italy opted to use all of its EUR 25 million allocation for the dairy sector.
In July 2016, the European Commission announced a further solidarity package aid worth EUR 500 million including adjust-ment aid worth EUR 350 million aimed at the dairy sector in particular, with nearly EUR 21 million earmarked for Italy.
According to the most recent Eurobarometer, published in January 2016, 69 % of the Italians think that the financial support given by the EU through the CAP is either enough or too low (only 7 % considers it "too high"). The main arguments proffered for why the EU allocates important resources to the CAP are "ensuring that agricultural products are of good quality, healthy and safe" (50 %), "developing rural areas while preserving the countryside" (46 %) and "ensuring reasonable food prices for consumers" (44 %). Moreover, 90 % is totally in favour of the greening measures taken.
The Eurobarometer survey 440 "Europeans, Agriculture and the CAP" can be consulted here.
What do the Italians think of the CAP?
KEY ACHIEVEMENTS
5
6
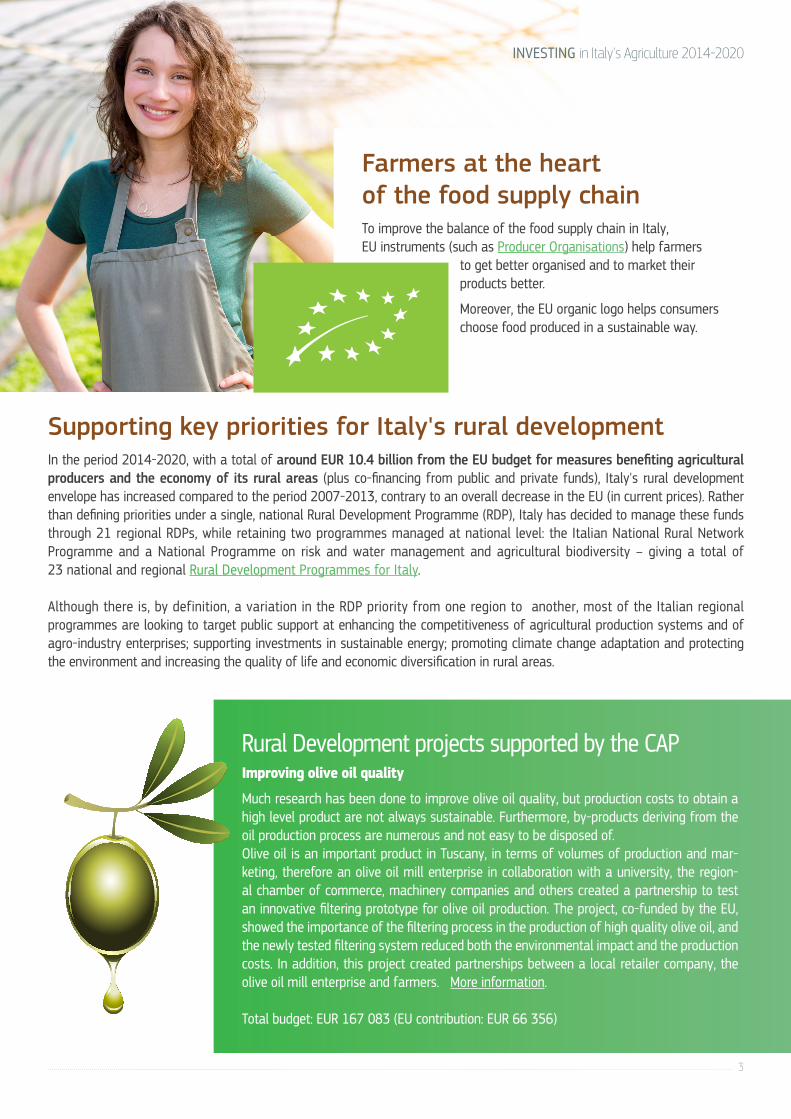
AGRICULTURE AT A GLANCEItalian agriculture is characterised by:
• small -sized farms: indeed, 58.7 % of holdings have less than 5 hectares and the average farm size of 12 ha is smaller than the average EU-28 holding with a size of 16.1 ha.
• rather old farmers (only 4.5 % of Italian farmers are under 35 years old, compared to 5.9 % in EU-28) and an ongoing rural depopulation.
• a contribution to Italy's economy amounting to 2.2 % of the total GVA (EU-28: 1.6 %) and to employment with 3.6 % of total employment (4.7 % in EU-28).
Data sources: Eurostat, Comext.
A very diversified production Agricultural trade with EU Member States is highly important for Italy (2014 data)
Farmer’s income continues to be more volatile than wages and salaries in other sectors
Importance of rural areas
Cereals 8.4%
Industrial crops 1.7%
Forage plants 3.8%
Vegetables and horticultural
products 20.4%
Potatoes 1.4%
Fruits 11.7%
Wine 12.8%
Olive oil 2.8%
Cattle 7.5% Pigs
6.2% Sheep and goats
0.5%
Poultry 5.5%
Milk 11.0%
Eggs 2.6%
Other 3.8%
45%
20% 17% 19.5%
42%
43% 41%
43.6%
13%
37% 42% 36.9%
0%
10%
20%
30%
40%
50%
60%
70%
80%
90%
100%
% Territory % Population % GVA % Employment
predominantly rural intermediate predominantly urban
0%
10%
20%
30%
40%
50%
60%
70%
80%
90%
100%
Exports to EUcountries
Exports to non-EU countries
Imports from EUcountries
Imports fromnon-EU countries
Commodities
Other primaryproductsProcessed products
Food preparations
Beverages
Non edible products
Output components (2013-2015 average); values at constant producer prices
35455565758595
105115125135145155
2004 2005 2006 2007 2008 2009 2010 2011 2012 2013 2014
Agricultural income (Indicator A) Wages and salary index - Industry
Wages and salary index - Construction Wages and salary index - Services © fo
tolia


![Sanyo EZV 19in (Atari)(TM-311 1st Printing) Part] [English]](https://img.pdfslide.us/doc/110x75/553cd56e550346bd418b4bf5/sanyo-ezv-19in-ataritm-311-1st-printing-part-english.jpg)