Embed Size (px)
Citation preview
In Vivo Genome-Wide Expression Study on Human Circulating BCells Suggests a Novel ESR1 and MAPK3 Network for
Postmenopausal Osteoporosis
Peng Xiao,1 Yuan Chen,1,2 Hui Jiang,1,2 Yao-Zhong Liu,3 Feng Pan,1,4 Tie-Lin Yang,1,4 Zi-Hui Tang,1,2
Jennifer A Larsen,1 Joan M Lappe,1 Robert R Recker,1 and Hong-Wen Deng1,2,3,4
ABSTRACT:
Introduction: Osteoporosis is characterized by low BMD. Studies have shown that B cells may participate inosteoclastogenesis through expression of osteoclast-related factors, such as RANKL, transforming growthfactor � (TGFB), and osteoprotegerin (OPG). However, the in vivo significance of B cells in human bonemetabolism and osteoporosis is still largely unknown, particularly at the systematic gene expression level.Materials and Methods: In this study, Affymetrix HG-U133A GeneChip arrays were used to identify genesdifferentially expressed in B cells between 10 low and 10 high BMD postmenopausal women. Significance ofdifferential expression was tested by t-test and adjusted for multiple testing with the Benjamini and Hochberg(BH) procedure (adjusted p � 0.05).Results: Twenty-nine genes were downregulated in the low versus high BMD group. These genes were furtheranalyzed using Ingenuity Pathways Analysis (Ingenuity Systems). A network involving estrogen receptor 1(ESR1) and mitogen activated protein kinase 3 (MAPK3) was identified. Real-time RT-PCR confirmed dif-ferential expression of eight genes, including ESR1, MAPK3, methyl CpG binding protein 2 (MECP2),proline-serine-threonine phosphatase interacting protein 1 (PSTPIP1), Scr-like-adaptor (SLA), serine/threoninekinase 11 (STK11), WNK lysine-deficient protein kinase 1 (WNK1), and zinc finger protein 446 (ZNF446).Conclusions: This is the first in vivo genome-wide expression study on human B cells in relation to osteopo-rosis. Our results highlight the significance of B cells in the etiology of osteoporosis and suggest a novelmechanism for postmenopausal osteoporosis (i.e., that downregulation of ESR1 and MAPK3 in B cellsregulates secretion of factors, leading to increased osteoclastogenesis or decreased osteoblastogenesis).J Bone Miner Res 2008;23:644–654. Published online on February 4, 2008; doi: 10.1359/JBMR.080105
Key words: osteoporosis, BMD, microarray, B cells, estrogen receptor 1, mitogen activated protein kinase 3
INTRODUCTION
OSTEOPOROSIS IS A major public health problem andmainly characterized by low BMD.(1) Low BMD re-
sults from bone resorption (by osteoclasts) exceeding boneformation (by osteoblasts). It has also been well known thatestrogen deficiency increases osteoclastic bone resorptionand bone loss in postmenopausal women.(2–5) The immunesystem is strongly related to bone metabolism by its inter-action with osteoclasts and osteoblasts.(6–8) Pathologicalbone resorption has been observed in diseases related tothe immune system, such as autoimmune arthritis, peri-odontitis, Paget’s disease, and bone tumors.(9)
As an important cell type in the immune system, B cells
may participate in osteoclastogenesis. RANKL binds to itsreceptor RANK on precursors of osteoclasts and stimulatesosteoclastogenesis.(10) Interleukin 7 (IL7) is involved in thegrowth and differentiation of hematopoietic cells, the stemcells of osteoclasts.(11) Studies have indicated that B cellspossibly promote osteoclastogenesis through direct expres-sion of RANKL(12,13) or as a consequence of IL7 stimula-tion.(14,15) Transforming growth factor � (TGFB) is knownto stimulate the proliferation of preosteoblasts, bone colla-gen synthesis, and osteoclastic apoptosis.(16) An in vitrostudy also found that peripheral blood B cells inhibit humanosteoclastogenesis through secretion of TGFB.(17) Osteo-protegerin (OPG), as a decoy receptor competing withRANK, can bind RANKL and block its effect on osteo-clastogenesis.(18) A recent study in both animal model andhumans in vivo showed that the amount of OPG producedby B cells regulates osteoclastogenesis and thus BMD.(19)The authors state that they have no conflicts of interest.
1Osteoporosis Research Center and Department of Biomedical Sciences, Creighton University, Omaha, Nebraska, USA; 2Key Labo-ratory of Protein Chemistry and Developmental Biology of Education Committee, College of Life Sciences, Hunan Normal University,Changsha, Hunan, China; 3Departments of Orthopedic Surgery and Basic Medical Sciences, University of Missouri–Kansas City, KansasCity, Missouri, USA; 4Key Laboratory of Biomedical Information Engineering of Ministry of Education and Institute of MolecularGenetics, College of Life Science and Technology, Xi’an Jiaotong University, Xi’an, Shanxi, China.
JOURNAL OF BONE AND MINERAL RESEARCHVolume 23, Number 5, 2008Published online on February 4, 2008; doi: 10.1359/JBMR.080105© 2008 American Society for Bone and Mineral Research
644
JO707385 644 654 May
TA
BL
E1.
CH
AR
AC
TE
RIS
TIC
SO
FT
HE
STU
DY
SUB
JEC
TS
Gro
ups
Spin
eZ
-sco
reSp
ine
T-s
core
Hip
Z-s
core
Hip
T-s
core
Bod
ym
ass
inde
x(k
g/m
2)
Age
(yr)
Yea
rsof
men
opas
eT
ype
ofm
enop
ause
Milk
(oz/
d)Y
ogur
t(o
z/d)
Har
dch
eese
(oz/
d)Su
pple
men
ts*
Low
BM
DL
25−
0.90
−2.
19−
0.37
−1.
3233
.68
5810
Nat
ural
30
0L
31−
1.62
−2.
76−
0.85
−1.
6924
.09
565
Nat
ural
33
1L
37−
1.30
−2.
58−
0.76
−1.
7124
.52
5825
Surg
ical
00
0C
alci
uman
dV
itD
600
mg/
dsi
nce
1990
)L
380.
16−
1.22
−0.
90−
1.92
24.5
359
8N
atur
al0
50.
6C
alci
uman
dV
itD
600
mg/
d,si
nce
2002
)L
40−
0.70
−2.
15−
0.87
−1.
8322
.51
585
Nat
ural
166
0.8
L43
−0.
20−
1.73
−0.
88−
1.96
40.6
960
15N
atur
al0
11
L48
−0.
52−
1.91
−0.
89−
1.92
27.3
559
12N
atur
al7
70.
4L
500.
30−
0.9
−0.
91−
1.79
32.0
156
19Su
rgic
al0
01.
5L
51−
2.26
−3.
63−
1.51
−2.
5316
.82
599
Nat
ural
06
0C
alci
uman
dV
itD
500
mg/
2d
sinc
e20
05)
L52
−0.
73−
1.93
−0.
85−
1.73
23.6
656
4N
atur
al4
60.
2M
ean
(SD
)−
0.78
(0.7
9)−
2.10
(0.7
8)−
0.88
(0.2
7)−
1.84
(0.3
0)26
.99
(6.7
7)57
.9(1
.5)
Hig
hB
MD
H01
2.28
1.03
1.46
0.54
31.2
557
16Su
rgic
al2
70
H03
2.37
1.11
0.97
0.04
29.9
957
10Su
rgic
al6
21
H10
1.66
0.39
1.29
0.35
25.8
157
3N
atur
al0
00.
4H
111.
910.
462.
411.
3222
.15
605
Nat
ural
80
0.2
H13
1.23
0.08
0.80
0.18
32.5
158
19Su
rgic
al0
22
H18
2.09
1.03
3.07
2.29
35.3
154
21Su
rgic
al6
10.
6H
232.
251.
22.
561.
7926
.82
541
Nat
ural
38
0.3
H26
1.84
0.52
0.57
0.02
24.8
158
6Su
rgic
al0
42
H34
2.74
1.63
1.19
0.38
30.0
855
10N
atur
al7
0.1
0.2
H80
1.94
0.62
1.93
0.95
24.2
758
7N
atur
al0
0.8
0M
ean
(SD
)2.
03(0
.42)
0.81
(0.4
7)1.
63(0
.83)
0.79
(0.7
8)28
.30
(4.1
7)56
.8(1
.9)
*N
osp
ecif
icm
edic
atio
nsha
vebe
enta
ken
byth
ere
crui
ted
subj
ects
befo
rean
ddu
ring
the
recr
uitm
ent.
MICROARRAY STUDY ON B CELLS FOR OSTEOPOROSIS 645
In addition, B-cell precursors are able to differentiateinto osteoclasts in vitro,(20,21) and estrogen deficiencystimulates B lymphopoiesis,(22) which suggests that estro-gen deficiency may enhance osteoclastogenesis by increas-ing the number of B-cell precursors with the potential forosteoclastic differentiation(19) and by stimulating B cells toproduce more factors that simulate osteoclastogenesis.
However, the role of B cells in bone metabolism andosteoporosis is still largely unknown, particularly at the sys-tematic gene expression level in humans in vivo. Microarraytechnology is a powerful tool for studying genome-widedifferential gene expression. In our previous study using themicroarray approach, we found that expression levels of thechemokine receptor 3 (CCR3), the histidine decarboxylase(HDC), and the glucocorticoid receptor (GCR) genes inblood monocytes may influence risk of osteoporosis.(23)
In this study, we applied microarray technology to freshlyisolated B cells from postmenopausal women with low orhigh BMD to identify differentially expressed genes thatmay illuminate the functions of B cells in bone metabolismand osteoporosis. This is the first genome-wide expressionstudy on in vivo human B cells relating to the etiology andmolecular genetic mechanisms of osteoporosis. A novel es-trogen receptor 1 (ESR1) and mitogen activated proteinkinase 3 (MAPK3) network in B cells was suggested for theetiology of postmenopausal osteoporosis.
MATERIALS AND METHODS
Subjects
This study was approved by the Institutional ReviewBoard, and all the subjects signed informed-consent docu-ments before entering the project. All the study subjectswere whites of European origin recruited from the vicinityof Creighton University in Omaha, NE, USA.
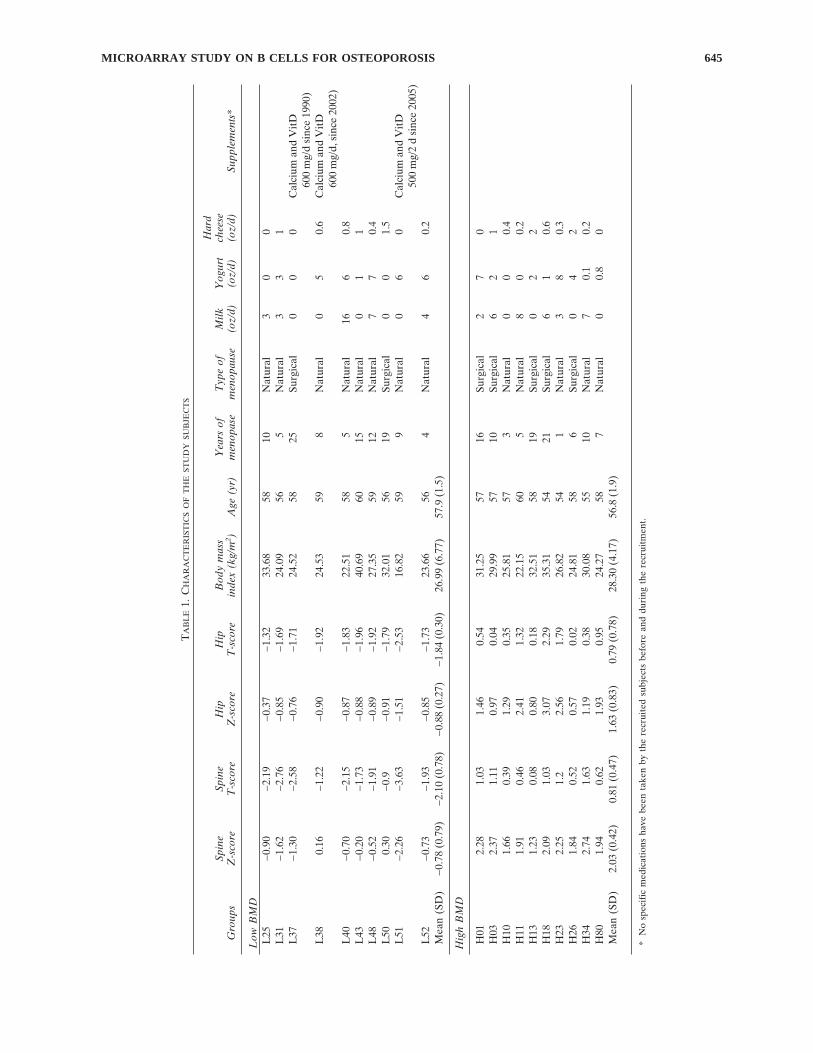
We recruited 20 unrelated postmenopausal whitewomen, 54–60 yr of age, including 10 with low and 10with high BMD. The inclusion criteria were spine or hipZ-score < −0.84 for the low BMD group (bottom 20% ofthe age-, sex-, and ethnicity-matched population) and spineor hip Z-score >0.84 for the high BMD group (top 20% ofthe age-, sex-, and ethnicity-matched population). Post-menopause is defined as the date of the last mensesfollowed by at least 12 mo of no menses. Detailed charac-teristics of the study subjects are given in Table 1.
Seventy milliliters of blood was drawn from each re-cruited woman. Information such as age, ethnicity, men-strual status, medication history, and disease history wasobtained through questionnaire. Exclusion criteria wereused to minimize potential effects of any known nongeneticfactors on bone metabolism and BMD determination.(24)
Please find the detailed exclusion criteria in the Appendix.
BMD measurement
BMD (g/cm2) for the lumbar spine (L1–L4) and total hip(femoral neck, trochanter, and intertrochanteric region)
were measured by 4500A DXA scanners (Hologic, Bed-ford, MA, USA). The machine was calibrated daily. Themeasurement precision as reflected by the CV was 0.9%and 1.4% for spine and hip BMD, respectively.
Experimental procedures
B-cell isolation: B-cell isolation from 70 ml whole bloodwas performed using a positive isolation method withDynabeads CD19 (Pan B) and DETACHaBEAD CD19(Dynal Biotech, Lake Success, NY, USA) following themanufacturer’s protocols. B-cell purity was assessed by flowcytometry (BD Biosciences, San Jose, CA, USA) with fluo-rescence-labeled antibodies: PE-CD19 and FITC-CD45.The average purity was 96.3% with <1% deviation.
Total RNA extraction: Total RNA from B cells was ex-tracted using Qiagen RNeasy Mini Kit (Qiagen, Valencia,CA, USA). Total RNA concentration and integrity weredetermined by an Agilent 2100 Bioanalyzer (Agilent, PaloAlto, CA, USA). Each RNA sample has an excellent in-tegrity number >9.0 in this study, indicating that RNA deg-radation caused by processing was minimal and negligible.
Preparation of cRNA and GeneChip hybridization: Foreach sample, 4 �g total RNA was used for the productionof cRNA. The production of cRNA, hybridization, andscanning of the HG-133A GeneChip were performed ac-cording to the manufacturer’s protocol (Affymetrix, SantaClara, CA, USA).
Real-time RT-PCR: Two-step real-time RT-PCR wasused to verify the differentially expressed genes identifiedfrom the analyses of chip experiments. The first step is RTfor synthesis of cDNA from total RNA and the second stepis real-time quantitative PCR.
The RT reaction was performed in a 100-�l reaction vol-ume, containing 10 �l 10× Taqman RT Buffer, 22 �l 25 mMMgCl2, 20 �l dNTPs, 5 �l 50 �M random hexamers, 2 �lRNase inhibitor, 2.5 �l MultiScribe reverse transcriptase, 1�g total RNA, and water to 100 �l. All the RT reagentswere supplied by Taqman Reverse Transcription Reagents(Applied Biosystems, Foster City, CA, USA). Reactionconditions were as follows: 10 min at 25°C, 30 min at 48°C,and 5 min at 95°C.
Multiplex real-time quantitative PCR was performed in a25-�l reaction volume using standard protocols on an Ap-plied Biosystems 7900HT Fast Real-time PCR System. Theprocedures were detailed in our previous study.(23)
Data analyses
Differential expression analyses: Microarray Suite 5.0(MAS 5.0; Affymetrix) software was used to generate arrayraw data in CEL files. The CEL files were imported intothe R software package (http://www.r-project.org), and theprobe level data in CEL files were converted into expres-sion measures and normalized by Robust Multiarray Algo-rithm (RMA; http://www.bioconductor.org)(25) using theAffy package(26) from Bioconductor (http://www.bioconductor.org/) in R environment.
Afterward, the RMA-transformed data were analyzed byBioconductor’s Multtest package to identify differentially
XIAO ET AL.646
expressed genes between the low and the high BMDgroups. In this package, the differential expression wastested by t-statistics. The Benjamini and Hochberg (BH)procedure(27) was used for multiple-testing adjustment, andadjusted p � 0.05 was used as the significant criterion.
Clustering and gene ontology analyses: According to thesimilarity of gene expression, the differentially expressedgenes were further clustered hierarchically in two dimen-sions at both the gene and sample levels(28,29) using Cluster(version 2.50) software.(30) To gain an overall picture ofpotential functions of the differentially expressed genes, weclassified the genes according to three organizing principles(biological process, molecular function, and cellular com-ponent) of the gene ontology (GO) database (http://www.geneontology.org/) by Onto-Express analysis (http://vortex.cs.wayne.edu/ontoexpress/).
Network and pathway analyses: The differentially ex-pressed genes were further analyzed using Ingenuity Path-ways Analysis (IPA; Ingenuity Systems, www.ingenuity.com). A data set containing Affymetrix probe set identifiersand corresponding BH-adjusted p values was uploaded intothe application. Each identifier was mapped to its corre-sponding gene object in the Ingenuity Pathways KnowledgeBase. These genes, called focus genes, were overlaid onto aglobal molecular network developed from information con-tained in the Ingenuity Pathways Knowledge Base. Net-works of these focus genes were algorithmically generatedbased on their connectivity. Using this system, we also per-formed Canonical Pathway Analysis that identified thepathways from the IPA library of canonical pathways thatwere most significant to the data set. The significance of theassociation between the data set and the canonical pathwaywas measured in two ways: (1) a ratio of the number ofgenes from the data set that map to the pathway divided bythe total number of genes that map to the canonical path-way is displayed; and (2) a Fisher’s exact test was used tocalculate a p value determining the probability that the as-sociation between the genes in the data set and the canoni-cal pathway is explained by chance alone.
Real-time RT-PCR analyses: The cycle number at whichthe reaction crossed a predetermined cycle threshold (CT)was identified for each gene, and the expression of eachtarget gene relative to the GAPDH gene was determinedusing the equation 2−�CT, where �CT � (CTTarget Gene −CTGAPDH). Based on the relative gene expression, we per-formed Student’s t-tests to validate the differentially ex-pressed genes between the two discordant BMD groups.
RESULTS
Differential expression analyses
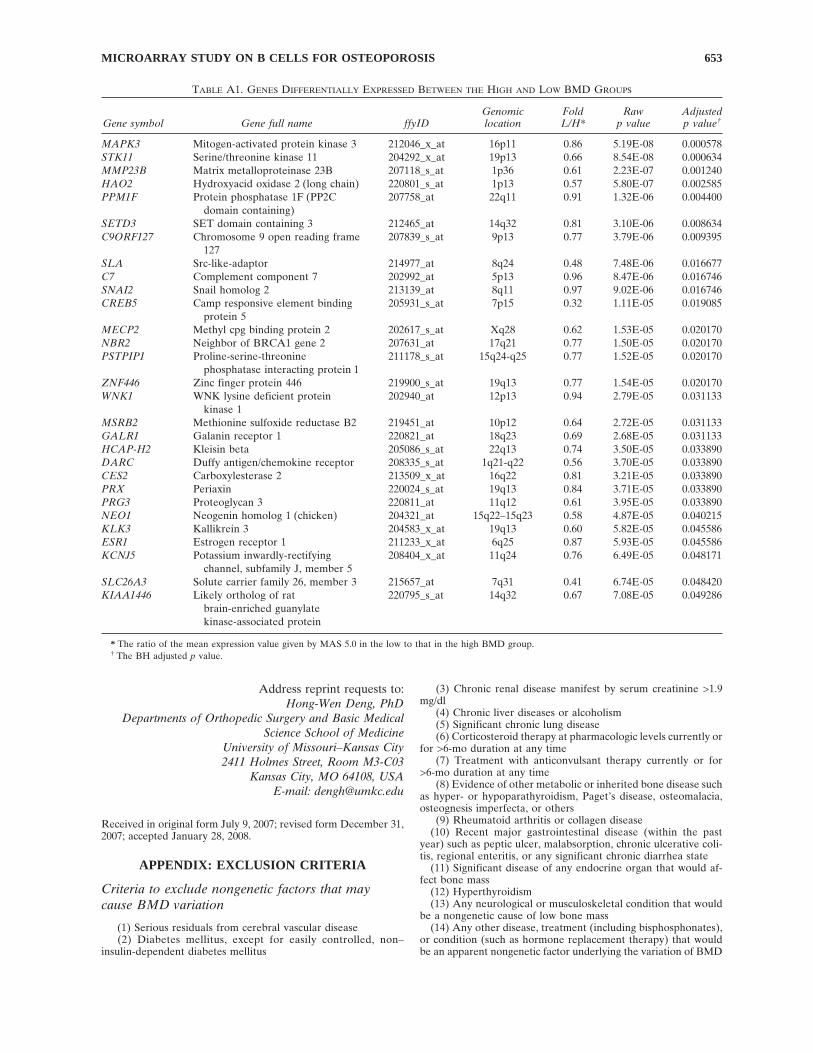
We submitted the raw data to the NCBI Gene Expres-sion Omnibus data repository with accession numberGSE7429. On average, 36.78 ± 2.03% of the total of 22,283probe sets in the array were called “present” for oursamples based on the analysis with the MAS 5.0 software.We identified 29 genes differentially expressed between thelow and high BMD groups after BH adjustment (Table
A1). Interestingly, all the 29 genes were downregulated inthe low BMD group.
Clustering and GO analyses
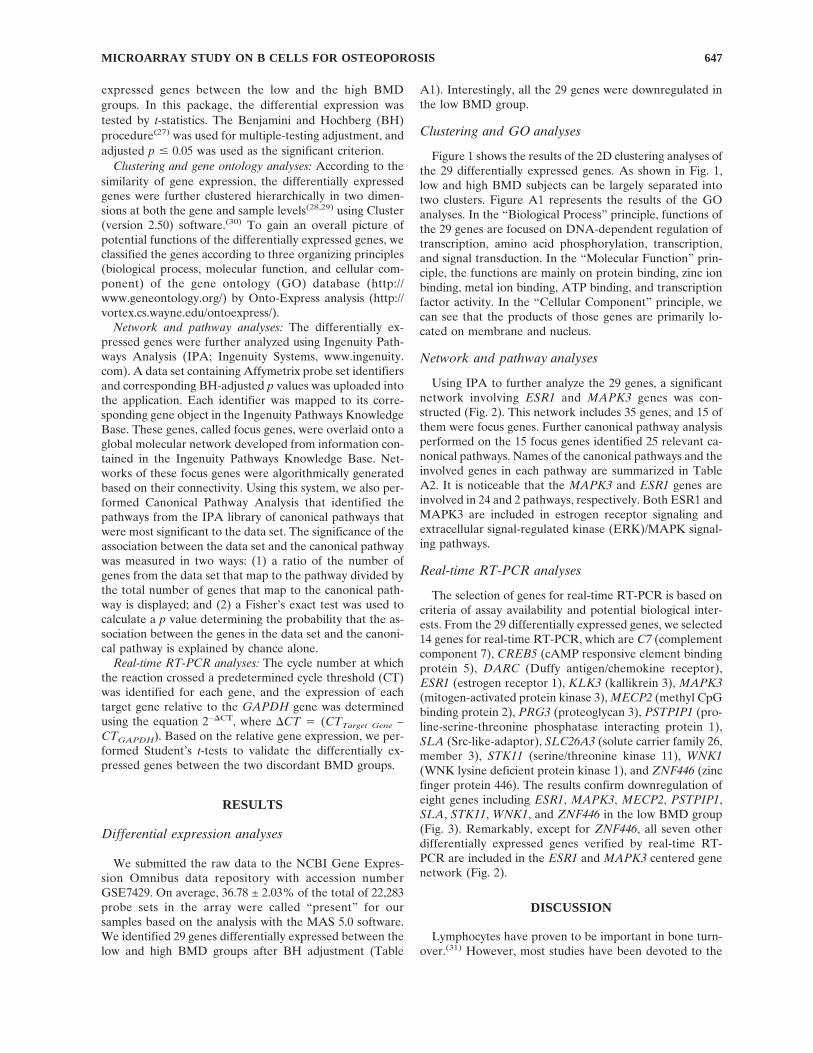
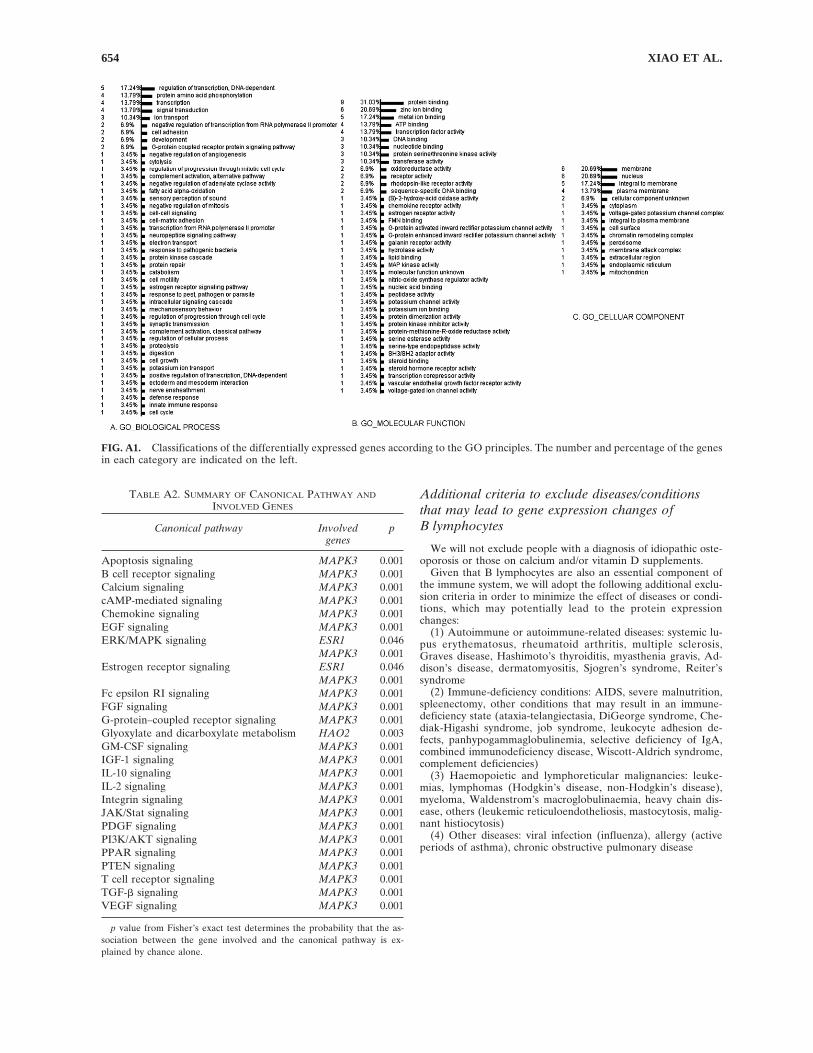
Figure 1 shows the results of the 2D clustering analyses ofthe 29 differentially expressed genes. As shown in Fig. 1,low and high BMD subjects can be largely separated intotwo clusters. Figure A1 represents the results of the GOanalyses. In the “Biological Process” principle, functions ofthe 29 genes are focused on DNA-dependent regulation oftranscription, amino acid phosphorylation, transcription,and signal transduction. In the “Molecular Function” prin-ciple, the functions are mainly on protein binding, zinc ionbinding, metal ion binding, ATP binding, and transcriptionfactor activity. In the “Cellular Component” principle, wecan see that the products of those genes are primarily lo-cated on membrane and nucleus.
Network and pathway analyses
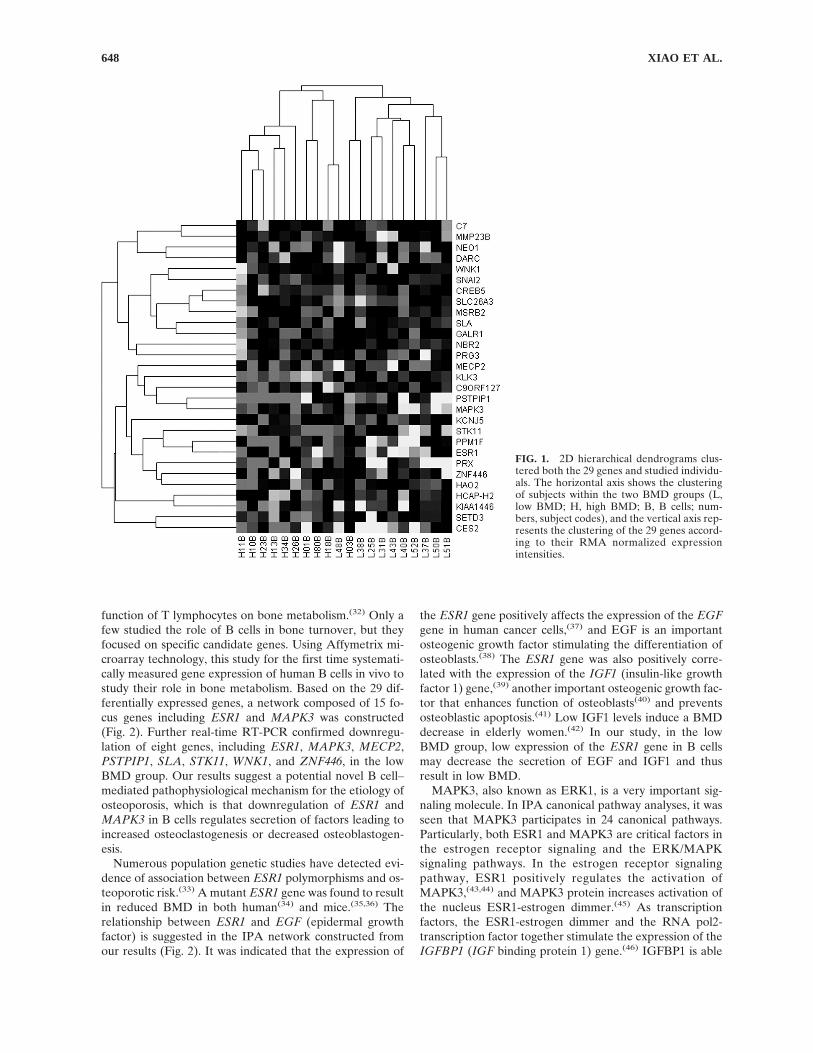
Using IPA to further analyze the 29 genes, a significantnetwork involving ESR1 and MAPK3 genes was con-structed (Fig. 2). This network includes 35 genes, and 15 ofthem were focus genes. Further canonical pathway analysisperformed on the 15 focus genes identified 25 relevant ca-nonical pathways. Names of the canonical pathways and theinvolved genes in each pathway are summarized in TableA2. It is noticeable that the MAPK3 and ESR1 genes areinvolved in 24 and 2 pathways, respectively. Both ESR1 andMAPK3 are included in estrogen receptor signaling andextracellular signal-regulated kinase (ERK)/MAPK signal-ing pathways.
Real-time RT-PCR analyses
The selection of genes for real-time RT-PCR is based oncriteria of assay availability and potential biological inter-ests. From the 29 differentially expressed genes, we selected14 genes for real-time RT-PCR, which are C7 (complementcomponent 7), CREB5 (cAMP responsive element bindingprotein 5), DARC (Duffy antigen/chemokine receptor),ESR1 (estrogen receptor 1), KLK3 (kallikrein 3), MAPK3(mitogen-activated protein kinase 3), MECP2 (methyl CpGbinding protein 2), PRG3 (proteoglycan 3), PSTPIP1 (pro-line-serine-threonine phosphatase interacting protein 1),SLA (Src-like-adaptor), SLC26A3 (solute carrier family 26,member 3), STK11 (serine/threonine kinase 11), WNK1(WNK lysine deficient protein kinase 1), and ZNF446 (zincfinger protein 446). The results confirm downregulation ofeight genes including ESR1, MAPK3, MECP2, PSTPIP1,SLA, STK11, WNK1, and ZNF446 in the low BMD group(Fig. 3). Remarkably, except for ZNF446, all seven otherdifferentially expressed genes verified by real-time RT-PCR are included in the ESR1 and MAPK3 centered genenetwork (Fig. 2).
DISCUSSION
Lymphocytes have proven to be important in bone turn-over.(31) However, most studies have been devoted to the
MICROARRAY STUDY ON B CELLS FOR OSTEOPOROSIS 647
function of T lymphocytes on bone metabolism.(32) Only afew studied the role of B cells in bone turnover, but theyfocused on specific candidate genes. Using Affymetrix mi-croarray technology, this study for the first time systemati-cally measured gene expression of human B cells in vivo tostudy their role in bone metabolism. Based on the 29 dif-ferentially expressed genes, a network composed of 15 fo-cus genes including ESR1 and MAPK3 was constructed(Fig. 2). Further real-time RT-PCR confirmed downregu-lation of eight genes, including ESR1, MAPK3, MECP2,PSTPIP1, SLA, STK11, WNK1, and ZNF446, in the lowBMD group. Our results suggest a potential novel B cell–mediated pathophysiological mechanism for the etiology ofosteoporosis, which is that downregulation of ESR1 andMAPK3 in B cells regulates secretion of factors leading toincreased osteoclastogenesis or decreased osteoblastogen-esis.
Numerous population genetic studies have detected evi-dence of association between ESR1 polymorphisms and os-teoporotic risk.(33) A mutant ESR1 gene was found to resultin reduced BMD in both human(34) and mice.(35,36) Therelationship between ESR1 and EGF (epidermal growthfactor) is suggested in the IPA network constructed fromour results (Fig. 2). It was indicated that the expression of
the ESR1 gene positively affects the expression of the EGFgene in human cancer cells,(37) and EGF is an importantosteogenic growth factor stimulating the differentiation ofosteoblasts.(38) The ESR1 gene was also positively corre-lated with the expression of the IGF1 (insulin-like growthfactor 1) gene,(39) another important osteogenic growth fac-tor that enhances function of osteoblasts(40) and preventsosteoblastic apoptosis.(41) Low IGF1 levels induce a BMDdecrease in elderly women.(42) In our study, in the lowBMD group, low expression of the ESR1 gene in B cellsmay decrease the secretion of EGF and IGF1 and thusresult in low BMD.
MAPK3, also known as ERK1, is a very important sig-naling molecule. In IPA canonical pathway analyses, it wasseen that MAPK3 participates in 24 canonical pathways.Particularly, both ESR1 and MAPK3 are critical factors inthe estrogen receptor signaling and the ERK/MAPKsignaling pathways. In the estrogen receptor signalingpathway, ESR1 positively regulates the activation ofMAPK3,(43,44) and MAPK3 protein increases activation ofthe nucleus ESR1-estrogen dimmer.(45) As transcriptionfactors, the ESR1-estrogen dimmer and the RNA pol2-transcription factor together stimulate the expression of theIGFBP1 (IGF binding protein 1) gene.(46) IGFBP1 is able
FIG. 1. 2D hierarchical dendrograms clus-tered both the 29 genes and studied individu-als. The horizontal axis shows the clusteringof subjects within the two BMD groups (L,low BMD; H, high BMD; B, B cells; num-bers, subject codes), and the vertical axis rep-resents the clustering of the 29 genes accord-ing to their RMA normalized expressionintensities.
XIAO ET AL.648
to extend the half-life and enhance the biological activity ofIGF1.(47) In the ERK/MAPK signaling pathway, con-versely, MAPK3 increases activation of ESR1.(48) Thus, thedownregulation of MAPK3 may decrease activation ofESR1 and accordingly reduce the expression of bone-
forming factors stimulated by MAPK3 per se and by ESR1in low BMD subjects. In addition, MAPK3 is a stimulatingfactor in a canonical apoptosis signaling pathway(49) in IPAanalyses. The downregulation of the MAPK3 gene mayrestrain pre-B cell or B cell apoptosis and provide a largerreservoir for osteoclastic differentiation in low BMDwomen versus high BMD women.
From the IPA network, we notice that ESR1 andMAPK3 (Fig. 2) also indirectly regulate five of the other sixreal-time RT-PCR–confirmed genes except for ZNF446.Among the six genes, MECP2 was recently found to sup-press expression of the RANKL gene in mouse osteoblastsby contributing methylation of the RANKL gene pro-moter.(50) Hence, the downregulation of MECP2 will in-crease the RANKL expression and consequently stimulateosteoclastogenesis. Moreover, studies have also found thathuman MECP2 gene mutations in Rett syndrome reducebone formation and cause osteoporosis.(51) The downregu-lation of MECP2 in the low BMD group is consistent withthe above evidence. MECP2 is located at Xq28. Interest-ingly, our previous two whole genome linkage studies onBMD in 4,126, and 1816 subjects, respectively, identifiedlinkage signals at Xq27,(52,53) and the linkage peak markeris only 3 Mb away from the physical location of MECP2gene.
FIG. 2. A network diagram constructedby IPA. Shaded genes are focus genes in-cluded in the input 29 differentially ex-pressed genes. Direct interactions are solidlines, whereas indirect interactions are rep-resented by dotted lines. The score is a nu-merical value used to rank how relevantthe network is to the total input genes. Thescore takes into account the number of fo-cus genes in the network and the size of thenetwork to approximate how relevant thisnetwork is to the original list of genes.
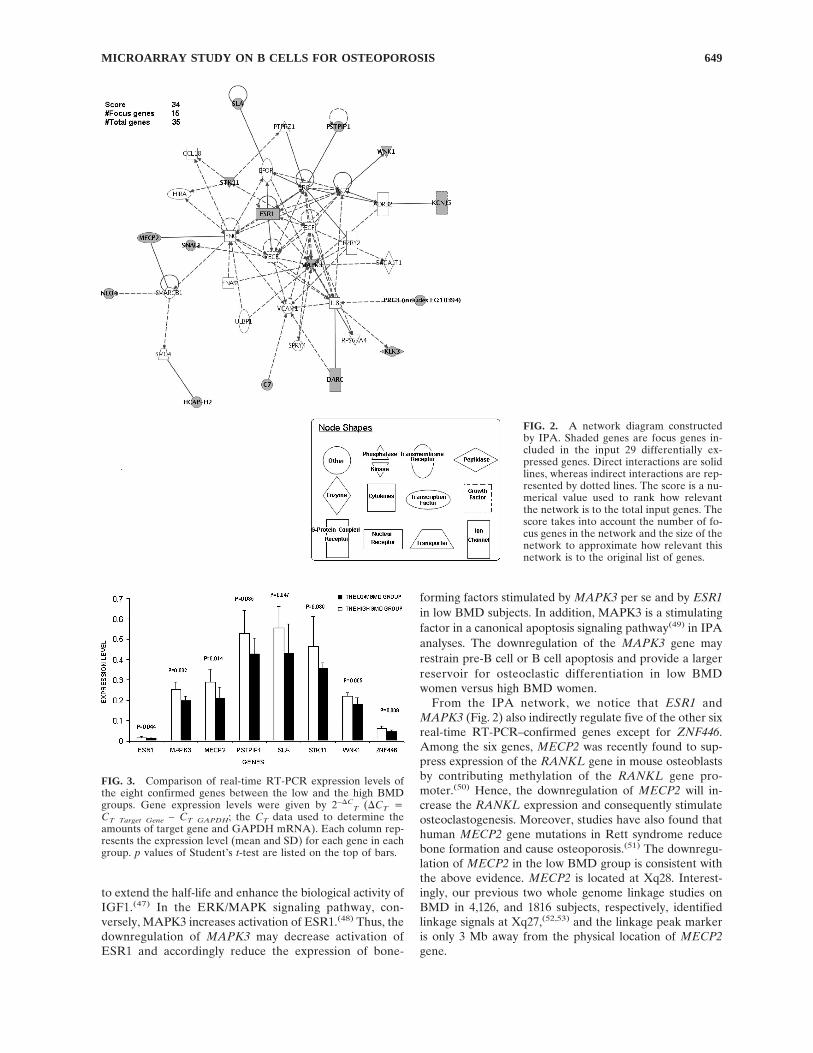
FIG. 3. Comparison of real-time RT-PCR expression levels ofthe eight confirmed genes between the low and the high BMDgroups. Gene expression levels were given by 2−�C
T (�CT �CT Target Gene − CT GAPDH; the CT data used to determine theamounts of target gene and GAPDH mRNA). Each column rep-resents the expression level (mean and SD) for each gene in eachgroup. p values of Student’s t-test are listed on the top of bars.
MICROARRAY STUDY ON B CELLS FOR OSTEOPOROSIS 649
STK11 mutant mice displayed increased death of mesen-chymal cells,(54) which are the stem cells of osteoblasts. Theactivation of STK11 is also increased by EGF.(55) PSTPIP1protein mutant human cell lines showed elevated secretionof interleukin 1 � (IL1B) protein,(56) a factor stimulatingosteoclatogenesis and bone resorption.(57) SLA mutantmice showed an increment in B-cell quantity,(58) and acti-vation of naïve B cells decreased the expression of SLAmRNA in mice.(59) This evidence suggests that downregu-lation of the SLA gene may increase B cells with potentialof osteoclastic differentiation and also activate the functionof B cells contributing to bone loss. In our study, STK11,PSTPIP1, and SLA genes were downregulated in the lowBMD group, which confirms results of the previous studies.
As to WNK1 and ZNF446 genes, no direct evidenceshows their relationship with B cells, osteoblasts, or osteo-clasts. Recently, however, downregulation of WNK1 pro-tein kinase was found to suppress proliferation of neuralprogenitor cells likely by involving activation of the ERK/MAPK3 signaling pathway.(60) Presumably, the samemechanism exists in B cells. The ZNF446 gene is a novelgene that was recently identified and may act as a transcrip-tional repressor in the ERK/MAPK3 signaling pathway.(61)
As we discussed, a suppressed ERK/MAPK3 signalingpathway decreases activation of ESR1.
Human circulating B cells were studied in this work fortheir role in bone metabolism. In the human peripheralskeleton, such as the femur, the sinusoid of basic multicel-lular unit (BMU) proved to be the sole access route forcirculating monocytes to enter the bone microenvironmentto differentiate into osteoclasts.(62) Similarly, circulating Bcells may also move into the human bone microenviron-ment through the sinusoid of BMU and carry on their rolein osteoblastogenesis or osteoclastogenesis.
To obtain a whole picture of the above-discussed con-
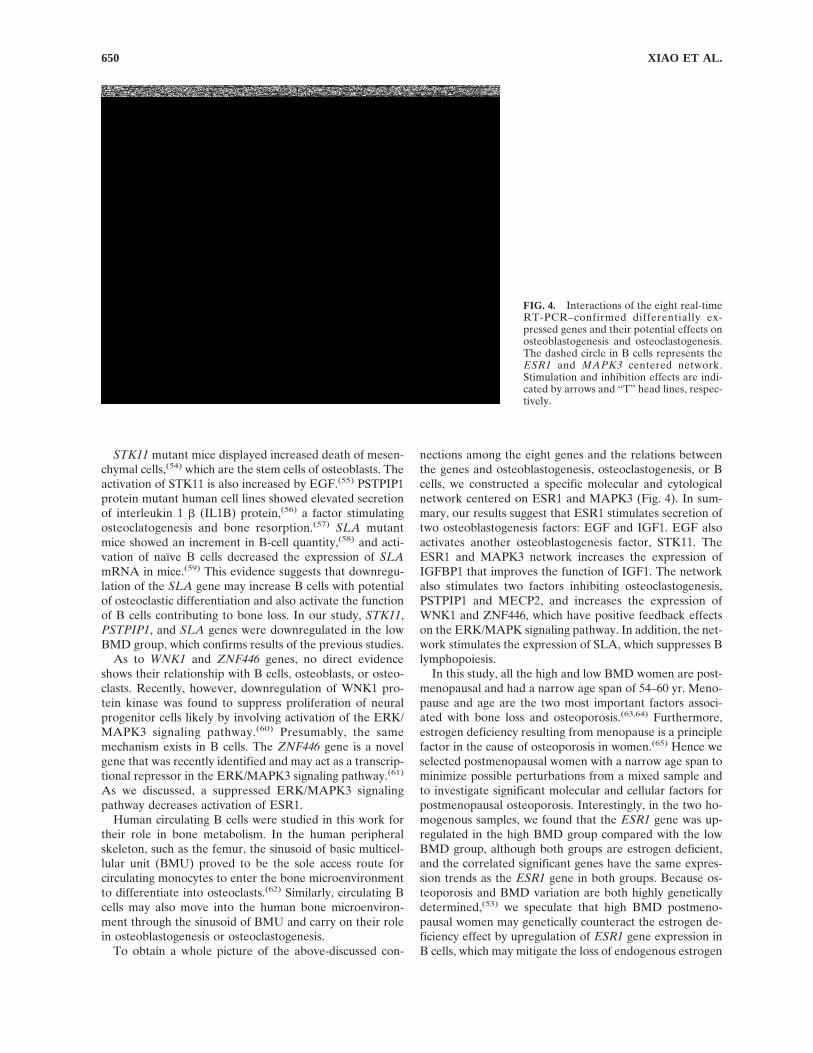
nections among the eight genes and the relations betweenthe genes and osteoblastogenesis, osteoclastogenesis, or Bcells, we constructed a specific molecular and cytologicalnetwork centered on ESR1 and MAPK3 (Fig. 4). In sum-mary, our results suggest that ESR1 stimulates secretion oftwo osteoblastogenesis factors: EGF and IGF1. EGF alsoactivates another osteoblastogenesis factor, STK11. TheESR1 and MAPK3 network increases the expression ofIGFBP1 that improves the function of IGF1. The networkalso stimulates two factors inhibiting osteoclastogenesis,PSTPIP1 and MECP2, and increases the expression ofWNK1 and ZNF446, which have positive feedback effectson the ERK/MAPK signaling pathway. In addition, the net-work stimulates the expression of SLA, which suppresses Blymphopoiesis.
In this study, all the high and low BMD women are post-menopausal and had a narrow age span of 54–60 yr. Meno-pause and age are the two most important factors associ-ated with bone loss and osteoporosis.(63,64) Furthermore,estrogen deficiency resulting from menopause is a principlefactor in the cause of osteoporosis in women.(65) Hence weselected postmenopausal women with a narrow age span tominimize possible perturbations from a mixed sample andto investigate significant molecular and cellular factors forpostmenopausal osteoporosis. Interestingly, in the two ho-mogenous samples, we found that the ESR1 gene was up-regulated in the high BMD group compared with the lowBMD group, although both groups are estrogen deficient,and the correlated significant genes have the same expres-sion trends as the ESR1 gene in both groups. Because os-teoporosis and BMD variation are both highly geneticallydetermined,(53) we speculate that high BMD postmeno-pausal women may genetically counteract the estrogen de-ficiency effect by upregulation of ESR1 gene expression inB cells, which may mitigate the loss of endogenous estrogen
FIG. 4. Interactions of the eight real-timeRT-PCR–confirmed differentially ex-pressed genes and their potential effects onosteoblastogenesis and osteoclastogenesis.The dashed circle in B cells represents theESR1 and MAPK3 centered network.Stimulation and inhibition effects are indi-cated by arrows and “T” head lines, respec-tively.
XIAO ET AL.650
by stimulating a cascade of gene expression and result inreduced bone turnover. For low BMD postmenopausalwomen, on the contrary, estrogen deficiency may lead todownregulation of the ESR1 gene and subsequent down-regulation of the relevant genes in B cells, resulting in boneloss.
Actually, we also performed the chip experiments andcomparison analyses for B-cell expression between 10 lowand 10 high BMD (with the same inclusion and exclusioncriteria except for menopause status and age range) pre-menopausal women but found no significant differentiallyexpressed genes after the multiple-testing adjustment (datanot shown). Lack of evident association of those genesidentified in postmenopausal women in premenopausalwomen dose not necessarily mean that those genes do notcontribute to premenopausal bone mass variation but maynot significant enough to be detected.
Our study initially compares gene expression profiles andprovides evidence for the functional difference of in vivoblood B cells between postmenopausal low and high BMDwomen. We found that a novel ESR1 and MAPK3 centeredgene network (Figs. 2 and 4) may contribute to the etiologyof postmenopausal osteoporosis. The results provide valu-able clues for further molecular and cellular studies on therelationship between B cells and osteoporosis.
ACKNOWLEDGMENTS
This research was partially supported by a grant fromSate of Nebraska (LB595), grants from Natural ScienceFoundation of China (30230210, 30470534, and 30600364)and the Scientific Research Fund of Hunan Provincial Edu-cation Department (04B039, 05B037), and NIH Grants R21AG027110-01A1, R01 GM60402, R01 AR050496, R01AG026564, P50 AR055081, and K01 AR02170-01A2.
REFERENCES
1. Boyce BF, Hughes DE, Wright KR, Xing L, Dai A 1999 Re-cent advances in bone biology provide insight into the patho-genesis of bone diseases. Lab Invest 79:83–94.
2. Pacifici R 1996 Estrogen, cytokines, and pathogenesis of post-menopausal osteoporosis. J Bone Miner Res 11:1043–1051.
3. Manolagas SC 2000 Birth and death of bone cells: Basic regu-latory mechanisms and implications for the pathogenesis andtreatment of osteoporosis. Endocr Rev 21:115–137.
4. Duong LT, Rodan GA 2001 Regulation of osteoclast forma-tion and function. Rev Endocr Metab Disord 2:95–104.
5. Riggs BL, Khosla S, Melton LJ III 2002 Sex steroids and theconstruction and conservation of the adult skeleton. EndocrRev 23:279–302.
6. Arron JR, Choi Y 2000 Bone versus immune system. Nature408:535–536.
7. Baron R 2004 Arming the osteoclast. Nat Med 10:458–460.8. Walsh MC, Kim N, Kadono Y, Rho J, Lee SY, Lorenzo J, Choi
Y 2006 Osteoimmunology: Interplay between the immune sys-tem and bone metabolism. Annu Rev Immunol 24:33–63.
9. Takayanagi H, Kim S, Koga T, Taniguchi T 2005 Stat1-mediated cytoplasmic attenuation in osteoimmunology. J CellBiochem 94:232–240.
10. Hsu H, Lacey DL, Dunstan CR, Solovyev I, Colombero A,Timms E, Tan HL, Elliott G, Kelley MJ, Sarosi I, Wang L, XiaXZ, Elliott R, Chiu L, Black T, Scully S, Capparelli C, Morony
S, Shimamoto G, Bass MB, Boyle WJ 1999 Tumor necrosisfactor receptor family member RANK mediates osteoclast dif-ferentiation and activation induced by osteoprotegerin ligand.Proc Natl Acad Sci USA 96:3540–3545.
11. Onoe Y, Miyaura C, Kaminakayashiki T, Nagai Y, Noguchi K,Chen QR, Seo H, Ohta H, Nozawa S, Kudo I, Suda T 1996IL-13 and IL-4 inhibit bone resorption by suppressing cyclo-oxygenase-2-dependent prostaglandin synthesis in osteoblasts.J Immunol 156:758–764.
12. Choi Y, Woo KM, Ko SH, Lee YJ, Park SJ, Kim HM, KwonBS 2001 Osteoclastogenesis is enhanced by activated B cellsbut suppressed by activated CD8(+) T cells. Eur J Immunol31:2179–2188.
13. Manabe N, Kawaguchi H, Chikuda H, Miyaura C, Inada M,Nagai R, Nabeshima Y, Nakamura K, Sinclair AM, Scheuer-mann RH, Kuro-o M 2001 Connection between B lymphocyteand osteoclast differentiation pathways. J Immunol 167:2625–2631.
14. Giuliani N, Colla S, Sala R, Moroni M, Lazzaretti M, LaMonica S, Bonomini S, Hojden M, Sammarelli G, Barille S,Bataille R, Rizzoli V 2002 Human myeloma cells stimulate thereceptor activator of nuclear factor-kappa B ligand (RANKL)in T lymphocytes: A potential role in multiple myeloma bonedisease. Blood 100:4615–4621.
15. Giuliani N, Colla S, Morandi F, Lazzaretti M, Sala R, Bono-mini S, Grano M, Colucci S, Svaldi M, Rizzoli V 2005 Myelomacells block RUNX2/CBFA1 activity in human bone marrowosteoblast progenitors and inhibit osteoblast formation and dif-ferentiation. Blood 106:2472–2483.
16. Centrella M, McCarthy TL, Canalis E 1991 Transforminggrowth factor-beta and remodeling of bone. J Bone Joint SurgAm 73:1418–1428.
17. Weitzmann MN, Cenci S, Haug J, Brown C, DiPersio J, PacificiR 2000 B lymphocytes inhibit human osteoclastogenesis bysecretion of TGFbeta. J Cell Biochem 78:318–324.
18. Simonet WS, Lacey DL, Dunstan CR, Kelley M, Chang MS,Luthy R, Nguyen HQ, Wooden S, Bennett L, Boone T, Shi-mamoto G, DeRose M, Elliott R, Colombero A, Tan HL, TrailG, Sullivan J, Davy E, Bucay N, Renshaw-Gegg L, HughesTM, Hill D, Pattison W, Campbell P, Sander S, Van G, TarpleyJ, Derby P, Lee R, Boyle WJ 1997 Osteoprotegerin: A novelsecreted protein involved in the regulation of bone density.Cell 89:309–319.
19. Li Y, Toraldo G, Li A, Yang X, Zhang H, Qian WP, Weitz-mann MN 2007 B cells and T cells are critical for the preser-vation of bone homeostasis and attainment of peak bone massin vivo. Blood 109:3839–3848.
20. Sato T, Shibata T, Ikeda K, Watanabe K 2001 Generation ofbone-resorbing osteoclasts from B220+ cells: Its role in accel-erated osteoclastogenesis due to estrogen deficiency. J BoneMiner Res 16:2215–2221.
21. Toraldo G, Roggia C, Qian WP, Pacifici R, Weitzmann MN2003 IL-7 induces bone loss in vivo by induction of receptoractivator of nuclear factor kappa B ligand and tumor necrosisfactor alpha from T cells. Proc Natl Acad Sci USA 100:125–130.
22. Masuzawa T, Miyaura C, Onoe Y, Kusano K, Ohta H, NozawaS, Suda T 1994 Estrogen deficiency stimulates B lymphopoiesisin mouse bone marrow. J Clin Invest 94:1090–1097.
23. Liu YZ, Dvornyk V, Lu Y, Shen H, Lappe JM, Recker RR,Deng HW 2005 A novel pathophysiological mechanism forosteoporosis suggested by an in vivo gene expression study ofcirculating monocytes. J Biol Chem 280:29011–29016.
24. Deng HW, Deng H, Liu YJ, Liu YZ, Xu FH, Shen H, ConwayT, Li JL, Huang QY, Davies KM, Recker RR 2002 A genome-wide linkage scan for quantitative-trait loci for obesity pheno-types. Am J Hum Genet 70:1138–1151.
25. Irizarry RA, Hobbs B, Collin F, Beazer-Barclay YD, Antonel-lis KJ, Scherf U, Speed TP 2003 Exploration, normalization,and summaries of high density oligonucleotide array probelevel data. Biostatistics 4:249–264.
26. Gautier L, Cope L, Bolstad BM, Irizarry RA 2004 affy–analysis
MICROARRAY STUDY ON B CELLS FOR OSTEOPOROSIS 651
of Affymetrix GeneChip data at the probe level. Bioinformat-ics 20:307–315.
27. Benjamini Y, Hochberg Y 1995 Controlling the false dicoveryrate: A practical and powerful approach to multiple testing. JRoy Stat Soc B 57:289–300.
28. Getz G, Levine E, Domany E 2000 Coupled two-way cluster-ing analysis of gene microarray data. Proc Natl Acad Sci USA97:12079–12084.
29. Wu X, Dewey TG 2006 From microarray to biological net-works: Analysis of gene expression profiles. Methods Mol Biol316:35–48.
30. Eisen MB, Spellman PT, Brown PO, Botstein D 1998 Clusteranalysis and display of genome-wide expression patterns. ProcNatl Acad Sci USA 95:14863–14868.
31. Bell NH 2003 RANK ligand and the regulation of skeletalremodeling. J Clin Invest 111:1120–1122.
32. Weitzmann MN, Pacifici R 2005 Role of the immune system inpostmenopausal bone loss. Curr Osteoporos Rep 3:92–97.
33. Liu YJ, Shen H, Xiao P, Xiong DH, Li LH, Recker RR, DengHW 2006 Molecular genetic studies of gene identification forosteoporosis: A 2004 update. J Bone Miner Res 21:1511–1535.
34. Smith EP, Boyd J, Frank GR, Takahashi H, Cohen RM,Specker B, Williams TC, Lubahn DB, Korach KS 1994 Estro-gen resistance caused by a mutation in the estrogen-receptorgene in a man. N Engl J Med 331:1056–1061.
35. Vidal O, Lindberg MK, Hollberg K, Baylink DJ, Andersson G,Lubahn DB, Mohan S, Gustafsson JA, Ohlsson C 2000 Estro-gen receptor specificity in the regulation of skeletal growth andmaturation in male mice. Proc Natl Acad Sci USA 97:5474–5479.
36. Lindberg MK, Alatalo SL, Halleen JM, Mohan S, GustafssonJA, Ohlsson C 2001 Estrogen receptor specificity in the regu-lation of the skeleton in female mice. J Endocrinol 171:229–236.
37. Dotzlaw H, Miller T, Karvelas J, Murphy LC 1990 Epidermalgrowth factor gene expression in human breast cancer biopsysamples: Relationship to estrogen and progesterone receptorgene expression. Cancer Res 50:4204–4208.
38. Kratchmarova I, Blagoev B, Haack-Sorensen M, Kassem M,Mann M 2005 Mechanism of divergent growth factor effects inmesenchymal stem cell differentiation. Science 308:1472–1477.
39. Mendez P, Wandosell F, Garcia-Segura LM 2006 Cross-talkbetween estrogen receptors and insulin-like growth factor-I re-ceptor in the brain: Cellular and molecular mechanisms. FrontNeuroendocrinol 27:391–403.
40. Hock JM, Centrella M, Canalis E 1988 Insulin-like growth fac-tor I has independent effects on bone matrix formation and cellreplication. Endocrinology 122:254–260.
41. Hill PA, Tumber A, Meikle MC 1997 Multiple extracellularsignals promote osteoblast survival and apoptosis. Endocrinol-ogy 138:3849–3858.
42. Barrett-Connor E, Goodman-Gruen D 1998 Gender differ-ences in insulin-like growth factor and bone mineral densityassociation in old age: The Rancho Bernardo Study. J BoneMiner Res 13:1343–1349.
43. Levin ER 2003 Bidirectional signaling between the estrogenreceptor and the epidermal growth factor receptor. Mol Endo-crinol 17:309–317.
44. Acconcia F, Ascenzi P, Bocedi A, Spisni E, Tomasi V, Tren-talance A, Visca P, Marino M 2005 Palmitoylation-dependentestrogen receptor alpha membrane localization: Regulation by17beta-estradiol. Mol Biol Cell 16:231–237.
45. Likhite VS, Stossi F, Kim K, Katzenellenbogen BS, Katzenel-lenbogen JA 2006 Kinase-specific phosphorylation of the es-trogen receptor changes receptor interactions with ligand, de-oxyribonucleic acid, and coregulators associated withalterations in estrogen and tamoxifen activity. Mol Endocrinol20:3120–3132.
46. Paassilta M, Karjalainen A, Kervinen K, Savolainen MJ, Heik-kinen J, Backstrom AC, Kesaniemi YA 2000 Insulin-likegrowth factor binding protein-1 (IGFBP-1) and IGF-I duringoral and transdermal estrogen replacement therapy: Relationto lipoprotein(a) levels. Atherosclerosis 149:157–162.
47. Hwa V, Oh Y, Rosenfeld RG 1999 The insulin-like growthfactor-binding protein (IGFBP) superfamily. Endocr Rev20:761–787.
48. Schaeffer HJ, Weber MJ 1999 Mitogen-activated protein ki-nases: Specific messages from ubiquitous messengers. Mol CellBiol 19:2435–2444.
49. Kyriakis JM, Avruch J 2001 Mammalian mitogen-activatedprotein kinase signal transduction pathways activated by stressand inflammation. Physiol Rev 81:807–869.
50. Kitazawa R, Kitazawa S 2007 Methylation status of a singleCpG locus 3 bases upstream of TATA-box of receptor activa-tor of nuclear factor-kappaB ligand (RANKL) gene promotermodulates cell- and tissue-specific RANKL expression and os-teoclastogenesis. Mol Endocrinol 21:148–158.
51. Budden SS, Gunness ME 2003 Possible mechanisms of osteo-penia in Rett syndrome: Bone histomorphometric studies. JChild Neurol 18:698–702.
52. Shen H, Zhang YY, Long JR, Xu FH, Liu YZ, Xiao P, ZhaoLJ, Xiong DH, Liu YJ, Dvornyk V, Rocha-Sanchez S, Liu PY,Li JL, Conway T, Davies KM, Recker RR, Deng HW 2004 Agenome-wide linkage scan for bone mineral density in an ex-tended sample: Evidence for linkage on 11q23 and Xq27. JMed Genet 41:743–751.
53. Xiao P, Shen H, Guo YF, Xiong DH, Liu YZ, Liu YJ, Zhao LJ,Long JR, Guo Y, Recker RR, Deng HW 2006 Genomic re-gions identified for BMD in a large sample including epistaticinteractions and gender-specific effects. J Bone Miner Res21:1536–1544.
54. Ylikorkala A, Rossi DJ, Korsisaari N, Luukko K, Alitalo K,Henkemeyer M, Makela TP 2001 Vascular abnormalities andderegulation of VEGF in Lkb1-deficient mice. Science293:1323–1326.
55. Sapkota GP, Kieloch A, Lizcano JM, Lain S, Arthur JS, Wil-liams MR, Morrice N, Deak M, Alessi DR 2001 Phosphoryla-tion of the protein kinase mutated in Peutz-Jeghers cancersyndrome, LKB1/STK11, at Ser431 by p90(RSK) and cAMP-dependent protein kinase, but not its farnesylation at Cys(433),is essential for LKB1 to suppress cell vrowth. J Biol Chem276:19469–19482.
56. Shoham NG, Centola M, Mansfield E, Hull KM, Wood G,Wise CA, Kastner DL 2003 Pyrin binds the PSTPIP1/CD2BP1protein, defining familial Mediterranean fever and PAPA syn-drome as disorders in the same pathway. Proc Natl Acad SciUSA 100:13501–13506.
57. Suda T, Takahashi N, Martin TJ 1992 Modulation of osteoclastdifferentiation. Endocr Rev 13:66–80.
58. Dragone LL, Myers MD, White C, Sosinowski T, Weiss A 2006SRC-like adaptor protein regulates B cell development andfunction. J Immunol 176:335–345.
59. Glynne R, Ghandour G, Rayner J, Mack DH, Goodnow CC2000 B-lymphocyte quiescence, tolerance and activation asviewed by global gene expression profiling on microarrays. Im-munol Rev 176:216–246.
60. Sun X, Gao L, Yu RK, Zeng G 2006 Down-regulation ofWNK1 protein kinase in neural progenitor cells suppresses cellproliferation and migration. J Neurochem 99:1114–1121.
61. Liu F, Zhu C, Xiao J, Wang Y, Tang W, Yuan W, Zhao Y, LiY, Xiang Z, Wu X, Liu M 2005 A novel human KRAB-containing zinc-finger gene ZNF446 inhibits transcriptional ac-tivities of SRE and AP-1. Biochem Biophys Res Commun333:5–13.
62. Parfitt AM 1998 Osteoclast precursors as leukocytes: Impor-tance of the area code. Bone 23:491–494.
63. Hui SL, Wiske PS, Norton JA, Johnston CC Jr 1982 A pro-spective study of change in bone mass with age in postmeno-pausal women. J Chronic Dis 35:715–725.
64. Steiger P, Cummings SR, Black DM, Spencer NE, Genant HK1992 Age-related decrements in bone mineral density inwomen over 65. J Bone Miner Res 7:625–632.
65. Weitzmann MN, Pacifici R 2006 Estrogen regulation of im-mune cell bone interactions. Ann NY Acad Sci 1068:256–274.
XIAO ET AL.652
Address reprint requests to:Hong-Wen Deng, PhD
Departments of Orthopedic Surgery and Basic MedicalScience School of Medicine
University of Missouri–Kansas City2411 Holmes Street, Room M3-C03
Kansas City, MO 64108, USAE-mail: [email protected]
Received in original form July 9, 2007; revised form December 31,2007; accepted January 28, 2008.
APPENDIX: EXCLUSION CRITERIA
Criteria to exclude nongenetic factors that maycause BMD variation
(1) Serious residuals from cerebral vascular disease(2) Diabetes mellitus, except for easily controlled, non–
insulin-dependent diabetes mellitus
(3) Chronic renal disease manifest by serum creatinine >1.9mg/dl
(4) Chronic liver diseases or alcoholism(5) Significant chronic lung disease(6) Corticosteroid therapy at pharmacologic levels currently or
for >6-mo duration at any time(7) Treatment with anticonvulsant therapy currently or for
>6-mo duration at any time(8) Evidence of other metabolic or inherited bone disease such
as hyper- or hypoparathyroidism, Paget’s disease, osteomalacia,osteognesis imperfecta, or others
(9) Rheumatoid arthritis or collagen disease(10) Recent major gastrointestinal disease (within the past
year) such as peptic ulcer, malabsorption, chronic ulcerative coli-tis, regional enteritis, or any significant chronic diarrhea state
(11) Significant disease of any endocrine organ that would af-fect bone mass
(12) Hyperthyroidism(13) Any neurological or musculoskeletal condition that would
be a nongenetic cause of low bone mass(14) Any other disease, treatment (including bisphosphonates),
or condition (such as hormone replacement therapy) that wouldbe an apparent nongenetic factor underlying the variation of BMD
TABLE A1. GENES DIFFERENTIALLY EXPRESSED BETWEEN THE HIGH AND LOW BMD GROUPS
Gene symbol Gene full name ffyIDGenomiclocation
FoldL/H*
Rawp value
Adjustedp value†
MAPK3 Mitogen-activated protein kinase 3 212046_x_at 16p11 0.86 5.19E-08 0.000578STK11 Serine/threonine kinase 11 204292_x_at 19p13 0.66 8.54E-08 0.000634MMP23B Matrix metalloproteinase 23B 207118_s_at 1p36 0.61 2.23E-07 0.001240HAO2 Hydroxyacid oxidase 2 (long chain) 220801_s_at 1p13 0.57 5.80E-07 0.002585PPM1F Protein phosphatase 1F (PP2C
domain containing)207758_at 22q11 0.91 1.32E-06 0.004400
SETD3 SET domain containing 3 212465_at 14q32 0.81 3.10E-06 0.008634C9ORF127 Chromosome 9 open reading frame
127207839_s_at 9p13 0.77 3.79E-06 0.009395
SLA Src-like-adaptor 214977_at 8q24 0.48 7.48E-06 0.016677C7 Complement component 7 202992_at 5p13 0.96 8.47E-06 0.016746SNAI2 Snail homolog 2 213139_at 8q11 0.97 9.02E-06 0.016746CREB5 Camp responsive element binding
protein 5205931_s_at 7p15 0.32 1.11E-05 0.019085
MECP2 Methyl cpg binding protein 2 202617_s_at Xq28 0.62 1.53E-05 0.020170NBR2 Neighbor of BRCA1 gene 2 207631_at 17q21 0.77 1.50E-05 0.020170PSTPIP1 Proline-serine-threonine
phosphatase interacting protein 1211178_s_at 15q24-q25 0.77 1.52E-05 0.020170
ZNF446 Zinc finger protein 446 219900_s_at 19q13 0.77 1.54E-05 0.020170WNK1 WNK lysine deficient protein
kinase 1202940_at 12p13 0.94 2.79E-05 0.031133
MSRB2 Methionine sulfoxide reductase B2 219451_at 10p12 0.64 2.72E-05 0.031133GALR1 Galanin receptor 1 220821_at 18q23 0.69 2.68E-05 0.031133HCAP-H2 Kleisin beta 205086_s_at 22q13 0.74 3.50E-05 0.033890DARC Duffy antigen/chemokine receptor 208335_s_at 1q21-q22 0.56 3.70E-05 0.033890CES2 Carboxylesterase 2 213509_x_at 16q22 0.81 3.21E-05 0.033890PRX Periaxin 220024_s_at 19q13 0.84 3.71E-05 0.033890PRG3 Proteoglycan 3 220811_at 11q12 0.61 3.95E-05 0.033890NEO1 Neogenin homolog 1 (chicken) 204321_at 15q22–15q23 0.58 4.87E-05 0.040215KLK3 Kallikrein 3 204583_x_at 19q13 0.60 5.82E-05 0.045586ESR1 Estrogen receptor 1 211233_x_at 6q25 0.87 5.93E-05 0.045586KCNJ5 Potassium inwardly-rectifying
channel, subfamily J, member 5208404_x_at 11q24 0.76 6.49E-05 0.048171
SLC26A3 Solute carrier family 26, member 3 215657_at 7q31 0.41 6.74E-05 0.048420KIAA1446 Likely ortholog of rat
brain-enriched guanylatekinase-associated protein
220795_s_at 14q32 0.67 7.08E-05 0.049286
* The ratio of the mean expression value given by MAS 5.0 in the low to that in the high BMD group.† The BH adjusted p value.
MICROARRAY STUDY ON B CELLS FOR OSTEOPOROSIS 653
Additional criteria to exclude diseases/conditionsthat may lead to gene expression changes ofB lymphocytes
We will not exclude people with a diagnosis of idiopathic oste-oporosis or those on calcium and/or vitamin D supplements.
Given that B lymphocytes are also an essential component ofthe immune system, we will adopt the following additional exclu-sion criteria in order to minimize the effect of diseases or condi-tions, which may potentially lead to the protein expressionchanges:
(1) Autoimmune or autoimmune-related diseases: systemic lu-pus erythematosus, rheumatoid arthritis, multiple sclerosis,Graves disease, Hashimoto’s thyroiditis, myasthenia gravis, Ad-dison’s disease, dermatomyositis, Sjogren’s syndrome, Reiter’ssyndrome
(2) Immune-deficiency conditions: AIDS, severe malnutrition,spleenectomy, other conditions that may result in an immune-deficiency state (ataxia-telangiectasia, DiGeorge syndrome, Che-diak-Higashi syndrome, job syndrome, leukocyte adhesion de-fects, panhypogammaglobulinemia, selective deficiency of IgA,combined immunodeficiency disease, Wiscott-Aldrich syndrome,complement deficiencies)
(3) Haemopoietic and lymphoreticular malignancies: leuke-mias, lymphomas (Hodgkin’s disease, non-Hodgkin’s disease),myeloma, Waldenstrom’s macroglobulinaemia, heavy chain dis-ease, others (leukemic reticuloendotheliosis, mastocytosis, malig-nant histiocytosis)
(4) Other diseases: viral infection (influenza), allergy (activeperiods of asthma), chronic obstructive pulmonary disease
TABLE A2. SUMMARY OF CANONICAL PATHWAY AND
INVOLVED GENES
Canonical pathway Involvedgenes
p
Apoptosis signaling MAPK3 0.001B cell receptor signaling MAPK3 0.001Calcium signaling MAPK3 0.001cAMP-mediated signaling MAPK3 0.001Chemokine signaling MAPK3 0.001EGF signaling MAPK3 0.001ERK/MAPK signaling ESR1 0.046
MAPK3 0.001Estrogen receptor signaling ESR1 0.046
MAPK3 0.001Fc epsilon RI signaling MAPK3 0.001FGF signaling MAPK3 0.001G-protein–coupled receptor signaling MAPK3 0.001Glyoxylate and dicarboxylate metabolism HAO2 0.003GM-CSF signaling MAPK3 0.001IGF-1 signaling MAPK3 0.001IL-10 signaling MAPK3 0.001IL-2 signaling MAPK3 0.001Integrin signaling MAPK3 0.001JAK/Stat signaling MAPK3 0.001PDGF signaling MAPK3 0.001PI3K/AKT signaling MAPK3 0.001PPAR signaling MAPK3 0.001PTEN signaling MAPK3 0.001T cell receptor signaling MAPK3 0.001TGF-� signaling MAPK3 0.001VEGF signaling MAPK3 0.001
p value from Fisher’s exact test determines the probability that the as-sociation between the gene involved and the canonical pathway is ex-plained by chance alone.
FIG. A1. Classifications of the differentially expressed genes according to the GO principles. The number and percentage of the genesin each category are indicated on the left.
XIAO ET AL.654