Embed Size (px)
Citation preview
In Vivo Calibration Methods of SPME and Application to
Pharmacokinetic Studies
by
Chung Yan Yeung
A thesis
presented to the University of Waterloo
in fulfillment of the
thesis requirement for the degree of
Master of Science
in
Chemistry
Waterloo, Ontario, Canada, 2009
© Chung Yan Yeung 2009

ii
AUTHOR’S DECLARATION
I hereby declare that I am the sole author of this thesis. This is a true copy of the thesis, including
any required final revisions, as accepted by my examiners.
I understand that my thesis may be made electronically available to the public.
Chung Yan Yeung
iii
ABSTRACT
Solid phase microextraction (SPME) has gained much popularity for in vivo applications
recently. Thus far, there are two types of pre-equilibrium kinetic calibration that have been
applied to in vivo SPME: on-fibre standardization and dominant pre-equilibrium desorption. Both
of these techniques have their own advantages and disadvantages. To address the limitations
presented by these two techniques, a third pre-equilibrium kinetic calibration method, the
diffusion-based interface model, was investigated. The diffusion-based interface model had been
successfully applied to air and water samples but was never utilized for in vivo SPME studies.
For the first part of the research, on-fibre standardization, dominant pre-equilibrium desorption,
and diffusion-based interface model were compared in terms of accuracy, precision, and
experimental procedures, by using a flow-through system. These three kinetic calibrations were
further validated by equilibrium SPME extraction and protein-plasma precipitation, a current
state-of-the-art sampling method.
The potential of diffusion-based interface model was yet again demonstrated in the
second part of the research project. This calibration method was applied to comparative
pharmacokinetic studies of two drugs, fenoterol and methoxyfenoterol, on 5 rats. To provide a
constant sampling rate as required for diffusion-based interface model, a SPME animal sampling
autosampler, AccuSampler®, was utilized. It custom-written program allowed the entire SPME
sampling procedure excluding insertion and removal of SPME probes to be automated.
Furthermore, to validate the results obtained by SPME, the AccuSampler® was programmed to
withdraw blood after each SPME sampling time point for conventional method analysis using
protein-plasma precipitation. The well correlated data obtained by SPME sampling and the

iv
conventional method illustrated the potential of diffusion-based interface model as an excellent
choice for future in vivo SPME applications.
v
ACKNOWLEDGEMENTS
I would like to take this opportunity to thank my supervisor Dr. Janusz Pawliszyn for
offering me this challenging yet fascinating project. His guidance, encouragement, and patience
throughout these two years had led to the completion of my thesis.
For my committee members, Dr. Palmer and Dr. De Lannoy, I would like to thank them
for their time and guidance in 794 research proposal. Special acknowledgement goes out to Dr.
De Lannoy for travelling between Waterloo and Mississauga for both my research proposal
seminar and thesis defence.
Throughout these two years, I have received much friendship, help, and guidance by my
colleagues. I would particularly like to sincerely thank Dajana Vuckovic for her guidance
throughout this program. She truly had spent a lot of time with me from teaching me the basics in
analytical chemistry, as I was new to this field, to helping and guiding me with my manuscripts. I
thank you Dr. Pawliszyn to have Dajana as my great mentor. I would also like to thank Dr. Shine
Zhang and Erasmus Cudjoe for their help. I am also very thankful to all my other co-workers for
their friendship and support during different phases of my work.

vi
DEDICATION
To my parents, John Yeung and Catherine Kwan, for their loving caring, understanding, and
encouragement
vii
TABLE OF CONTENTS
List of Figures .................................................................................................................... ix
List of Tables ...................................................................................................................... x
List of Abbreviations ........................................................................................................... xi
1 Introduction ............................................................................................................ 1
1.1 PRINCIPLES OF SOLID PHASE MICROEXTRACTION (SPME) ....................... 1
1.2 IN VIVO SPME .......................................................................................................... 3
1.2.1 Applications of In Vivo SPME ............................................................ 5
1.3 CALIBRATION PROCEDURES IN SPME ............................................................. 7
1.3.1 On-fibre Standardization ..................................................................... 8
1.3.2 Dominant Pre-equilibrium Desorption ............................................... 10
1.3.3 Diffusion-based Interface Model ....................................................... 12
1.4 RESEARCH PROPOSAL .......................................................................................... 15
2 In vivo SPME calibration methods comparison: On-fibre standardization,
Dominant pre-equilibrium desorption, and Diffusion-based interface model
on flow-through system ........................................................................................ 17
2.1 OVERVIEW ............................................................................................................... 17
2.2 MATERIALS AND METHODS ............................................................................... 18
2.2.1 Materials .............................................................................................. 18
2.2.2 LC-MS/MS Assay ............................................................................... 18
2.2.3 In Vitro SPME Method Development ................................................. 20
2.2.4 Flow-through system ........................................................................... 21
2.2.5 Preparation of Calibration Standards .................................................. 23
2.2.6 On-Fibre Standardization ................................................................... 23
2.2.7 Dominant Pre-equilibrium Desorption ............................................... 24
2.2.8 Diffusion-based interface model ........................................................ 25
2.2.9 Equilibrium Extraction ....................................................................... 25
2.2.10 Conventional blood analysis ............................................................. 25
2.3 RESULTS AND DISCUSSIONS .............................................................................. 26
2.3.1 SPME Method Development .............................................................. 26
2.3.2 On-Fibre Standardization ................................................................... 33
2.3.3 Dominant Pre-equilibrium Desorption ................................................ 37
2.3.4 Diffusion-based Interface model ......................................................... 39
2.3.5 SPME Equilibrium Extraction ............................................................ 45
2.3.6 Conventional Method-Plasma Protein Precipitation .......................... 46
2.3.7 Calibration Methods Comparison ....................................................... 48
2.4 CONCLUSIONS ........................................................................................................ 51
viii
3 Pharmacokinetic studies of fenoterol and methoxyfenoterol in rats using semi-
automated in vivo solid-phase microextraction sampling and diffusion-based
interface calibration model .................................................................................... 52
3.1 OVERVIEW ................................................................................................................ 52
3.2 BACKGROUND ........................................................................................................ 54
3.3 METHODS AND MATERIALS ............................................................................... 56
3.3.1 Materials ............................................................................................. 56
3.3.2 LC-MS/MS Assay .............................................................................. 56
3.3.3 In Vitro SPME Method Development ................................................. 56
3.3.4 Animal Experiments ........................................................................... 57
3.3.5 In Vivo SPME Procedures ................................................................... 57
3.3.6 Conventional Plasma Sampling and Analysis .................................... 58
3.3.7 Calibration Methods ............................................................................ 58
3.4 RESULTS AND DISCUSSIONS .............................................................................. 59
3.4.1 Calibration Method - Diffusion-based Interface Model ...................... 59
3.4.2 Pharmacokinetic Profiles .................................................................... 60
3.5 CONCLUSIONS ........................................................................................................ 67
References ........................................................................................................................... 68
CHAPTER 1 ..................................................................................................................... 68
CHAPTER 2 ..................................................................................................................... 69
CHAPTER 3 ..................................................................................................................... 70
ix
LIST OF FIGURES
Figure 1: Schematic representation of direct fiber extraction .............................................. 2
Figure 2: A special SPME device for in vivo extraction ..................................................... 4
Figure 3: Pharmacokinetic profiles of A) diazepam B) oxazepam and C) nordiazepam from
the average of three studies in three beagles after dosage with diazepam ............ 5
Figure 4: Schematic diagram of SPME sampling with rodents ........................................... 6
Figure 5: Absorption time profiles for diazepam, nordiazepam, and oxazepam,
and desorption time profiles for their deuterated analogues, diazepam-d5,
nordiazepam-d5, and oxazepam-d5 ......................................................................... 8
Figure 6: Application of pre-dominant desorption on jade plants ...................................... 11
Figure 7: Diagram illustrating the concentration gradient in the boundary layer and sample 13
Figure 8: A) Snapshot of the flow-through system and B) Close up of the interface,
SPME fibre and syringe ....................................................................................... 22
Figure 9: Extraction capacity and inter-fibre variability of three types of commercially
available coating: cyano, C18, and RPA (n=10) .................................................. 27
Figure 10: Effect of pre-conditioning method on amount extracted after the indicated time
and solvent type (n=3) ........................................................................................ 28
Figure 11: Desorption time determination by extraction with 100 ng/mL fenoterol in
PBS buffer for 60 minutes with vortex followed by desorption at various time in
desorption solvent (n=3) ..................................................................................... 29
Figure 12: Pump sampling rate versus percent extraction for fenoterol and
methoxyfenoterol (n=3) ...................................................................................... 30
Figure 13: Extraction time profile in rat whole blood for fenoterol and methoxyfenoterol 31
Figure 14: Stability of fenoterol and methoxyfenoterol on fibres ........................................ 32
Figure 15: Equilibrium extraction of fenoterol in PBS buffer and blood ............................ 36
Figure 16: Amount loaded versus loading concentration of fenoterol ................................. 38
Figure 17: A plot of peak area ratio of fenoterol and the internal standard
versus the concentration in the sample ................................................................ 47
Figure 18: Connection of Accusampler ® with a rat ........................................................... 61
Figure 19: Determination of blood to plasma ratio of methoxyfenoterol
using the slope of concentration versus amount extracted ................................ 62
Figure 20: Determination of blood to plasma ratio of fenoterol
using the slope of concentration versus amount extracted ................................ 63
Figure 21: Mean concentration versus time profiles of fenoterol in logarithmic
scale (n =5) following 5 mg/kg i.v. administration ............................................ 64
Figure 22: Mean concentration versus time profiles of methoxyfenoterol (n =5)
in logarithmic scale following 5 mg/kg i.v. administration .............................. 64
Figure 23: Detection of methoxyfenoterol glucuronide (n=2) simultaneously with
methoxyfenoterol ............................................................................................... 66
x
LIST OF TABLES
Table 1: MS parameters for methoxyfenoterol, fenoterol and pseudoephedrine .................. 19
Table 2: The LC gradient for fenoterol and methoxyfenoterol analysis .............................. 20
Table 3: A 7 point extraction of fenoterol and methoxyfenoterol (n=3) using
SPME extraction in rat whole blood and plasma protein precipitation ................... 33
Table 4: Ratio of n/ne for fenoterol and methoxyfenoterol .................................................. 34
Table 5: Concentration of loading solution and amount loaded on fibre overnight ............ 35
Table 6: On-fibre standardization- Results for n, Q, q0 which was obtained with fibres (n=3)
that were not used for extraction, and ne which was calculated with equation 5 .. 35 Table 7: Concentrations calculated using on-fibre standardization ..................................... 37
Table 8: Dominant pre-equilibrium desorption- results for n, Q, q0 which was
obtained with fibres (n=3) that were not used for extraction, and ne which
was calculated with equation 5 ............................................................................... 38 Table 9: Concentrations calculated using dominant pre-equilibrium desorption ............... 39
Table 10: Determination of experimental calibration constant for buffer and
blood using 100 ng/mL fenoterol (n=5) ................................................................. 40
Table 11: Calibrated concentration using the experimental calibration constant
for buffer and blood ............................................................................................. 40
Table 12: Parameters used to calculate calibration constant for fenoterol in blood ............ 42
Table 13: A comparison between experimental and theoretical calibration
constant for fenoterol in whole blood and PBS buffer ......................................... 42
Table 14: Comparison of calibrated concentrations obtained by experimental
calibration constant and theoretical calibration constant .................................... 44
Table 15: Weight equation using reciprocal y square for figure 15 ..................................... 45
Table 16: Amount extracted n and calculated concentration using equilibrium
extraction at 3 concentrations (n=3) ..................................................................... 46
Table 17: Measured concentration using plasma protein precipitation ................................ 47
Table 18: Relative recovery and standard deviation comparison in whole blood
between 3 in vivo calibration methods, equilibrium extraction,
and conventional method ..................................................................................... 48
Table 19: Relative recovery and standard deviation comparison in PBS buffer
between 3 in vivo calibration methods, equilibrium extraction,
and conventional method ...................................................................................... 48
Table 20: Parameters used to calculate calibration constant for fenoterol
and methoxyfenoterol ........................................................................................... 59
Table 21: A comparison between experimental and theoretical calibration constant
for fenoterol and methoxyfenoterol ...................................................................... 60
xi
LIST OF ABBREVIATIONS
ACN Acetonitrile
β2-AR β2-adrenoceptor
C18 Octadecyl-silica
CAD Collision activated dissociation
CCAC Canadian council on animal care
CN Cyano
HILIC Hydrophilic interaction liquid chromatography
HPLC High performance liquid chromatography
IV Intravenous
LC Liquid chromatography
LOQ Limits of quantification
m/z Mass to charge ratio
MeOH Methanol
MR Matrix reservoir
MS Mass spectrometry
PBS Phosphate buffered saline
PP Peristaltic pump
RBC Red blood cell
RPA Reversed phase amide
RSD Relative standard deviation
SP Syringe pump
SPE Solid phase extraction
SPME Solid phase microextraction
SRM Selected Reaction Monitoring
1
Chapter 1: Introduction
In vivo studies have always had importance in biological and chemical processes
for drug development. Since in vivo studies are conducted within a living organism,
results obtained for therapeutic and toxic effects of a drug are more relevant in
comparison with in vitro studies. There are many factors to consider when selecting an in
vivo sampling technique. These include sensitivity, accuracy, and precision of the overall
method.
Solid phase microextraction (SPME), which was invented by Dr. Janusz
Pawliszyn in the late 1980s, has recently gained much popularity for in vivo studies due
to its advantage of integrating the sampling and sample preparation procedures. Owing to
the minimal number of experimental steps required that prevent significant error such as
sample loss and operation error, high sensitivity, accuracy, and precision are achievable
using SPME.
1.1 Principles of Solid Phase Microextraction (SPME)
There are three main experimental steps for analysis with SPME: extraction,
desorption, and instrumental analysis [1]. During extraction, analyte in the sample
partitions into the extraction phase of the SPME fibre, and further partitions into the
desorption solvent during desorption. Subsequently, the desorption solvent is injected
into the analytical instrument for separation and quantitation [1].
At the initial stage of extraction, the amount extracted increases linearly with
time. However, later on, extraction reaches equilibrium. In other words, equilibrium is
reached between the amount extracted on the fibre and what is left in the sample matrix.
2
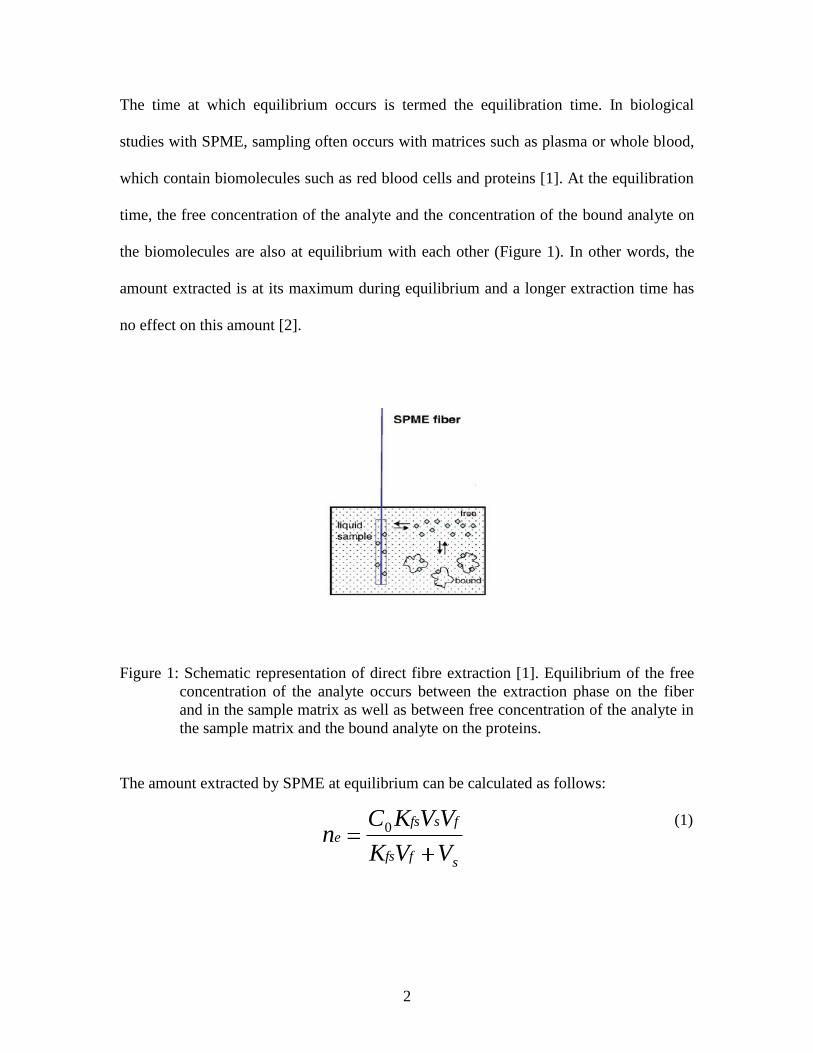
The time at which equilibrium occurs is termed the equilibration time. In biological
studies with SPME, sampling often occurs with matrices such as plasma or whole blood,
which contain biomolecules such as red blood cells and proteins [1]. At the equilibration
time, the free concentration of the analyte and the concentration of the bound analyte on
the biomolecules are also at equilibrium with each other (Figure 1). In other words, the
amount extracted is at its maximum during equilibrium and a longer extraction time has
no effect on this amount [2].
Figure 1: Schematic representation of direct fibre extraction [1]. Equilibrium of the free
concentration of the analyte occurs between the extraction phase on the fiber
and in the sample matrix as well as between free concentration of the analyte in
the sample matrix and the bound analyte on the proteins.
The amount extracted by SPME at equilibrium can be calculated as follows:
n = Kfs ·Vf · (1)
Kfs·Vf + Vs
sffs
fsfse
VVK
VVKCn 0
3
where ne is the amount extracted, Kfs is the distribution constant of the extraction phase
and sample, Vf is the volume of the extraction phase, Vs is the sample volume, and C0 is
the initial concentration of the target analyte [1]. However, when the volume of the
sample matrix is very large, so that Kfs ·Vf << Vs, the amount extracted n can be calculated
as follows:
(2)
The simplification from equation 1 to equation 2 illustrates the advantage of SPME for on
site or in vivo analysis; a defined volume is unnecessary for direct exposure of the probe
to the sample matrix [1].
1.2 In Vivo SPME
Traditional in vivo studies on small animals may require sacrificing animals due
to the removal of blood samples. For such in vivo analysis, SPME offers two main
advantages. First, since blood withdrawal is not necessary and the circulating blood
volume does not change, the number of animals used is minimized. Second, only a
minimal disturbance to the chemical balance of the system occurs since substance
depletion is negligible as only a small amount of the free analyte is extracted [3].
Therefore, since only a small amount of analyte is extracted and the circulating blood
volume is preserved, more data points can be obtained per animal and thus the inter-
animal variances are decreased and accurate results are achieved.
Early in vivo studies with SPME measuring venous blood concentrations of a
substance involved sampling in the vein directly where a catheter was placed in a
ffse VKCn 0
4
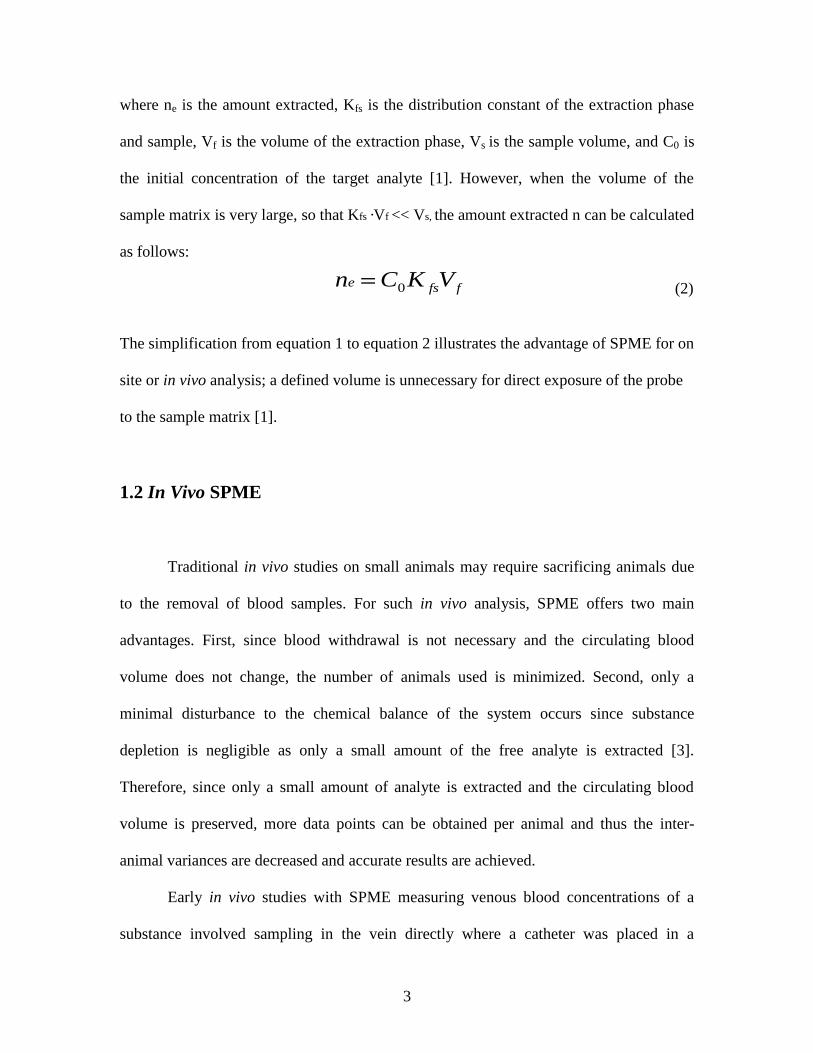
peripheral vein and sealed with a PRN adapter [4]. The SPME probe was loaded into a
needle that was used to pierce the PRN adapter. Subsequently, the probe slid into the
catheter, exposing the extraction phase, and the needle was withdrawn [4]. However, this
technique was rather cumbersome. Blood exposure and blood leaking from the catheter
during the insertion and removal of the probes were inevitable. To overcome these
obstacles, a new type of SPME device was invented that prevents any leaking of blood
and minimized exposure to blood (Figure 2) [5].
Figure 2: A special SPME device for in vivo extraction [5]
The SPME device consists of a thin flexible wire coated with an extraction phase housed
in a hypodermic needle [5]. The assembly including the wire and needle is sealed with
silicone glue. During extraction, the reinforcement tube is depressed to allow the
exposure of the extraction phase into the flowing blood of the vein [5].
This new SPME device simplifies extraction procedures and sampling can be
done much more efficiently. Its usefulness has been demonstrated in applications such as
monitoring intravenous concentrations of drugs and metabolites in beagles and rats [6, 7],
and field sampling of pharmaceuticals in fish [8].
5
1.2.1 Applications Of In Vivo SPME
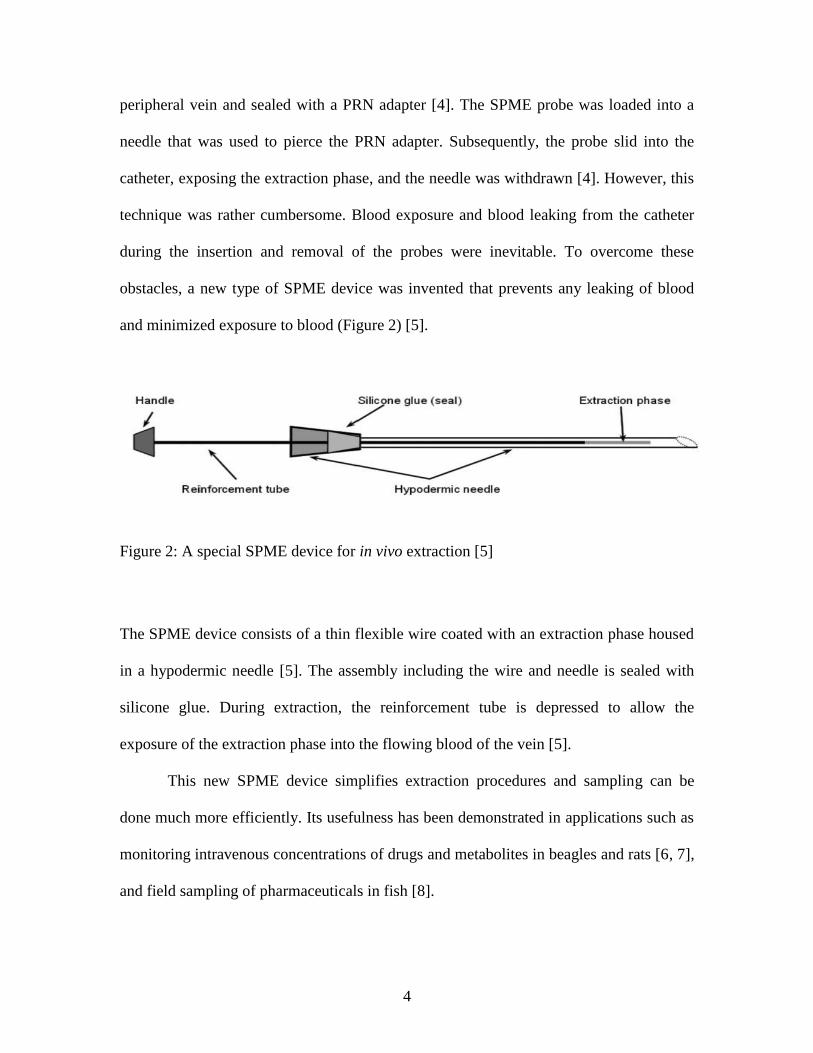
In the study of the pharmacokinetics of diazepam by Lord et al. [4], the venous
concentration of diazepam and its metabolites, oxazepam and nordiazepam, were
monitored in three beagles following intravenous administration of diazepam and were
compared with the profiles obtained with SPME by conventional analysis for validation.
The pharmacokinetic profiles of diazepam, oxazepam, and nordiazepam are shown in
figure 3.
Figure 3: Pharmacokinetic profiles of A) diazepam B) oxazepam and C) nordiazepam
from the average of three studies in three beagles after dosage with diazepam.
The venous concentration was monitored over the course of 8 hours for the 3
drugs. (n=6 for the last point and n=9 for all the other points). Diamonds
represent SPME probe and squares represent conventional method [4].
In the pharmacokinetic profile of diazepam, a rapid distribution phase followed by a less
rapid decay in concentration occurred over the period of study. The rate of metabolism
from diazepam to nordiazepam was fast since a high concentration of nordiazepam was
6
detected at early time points (Figure 3C) [4]. For oxazepam, the rate of formation and the
rate of elimination was the same up to 1.5 hours of post dosage of diazepam.
The advantage of SPME is seen more prominent when pharmacokinetic studies
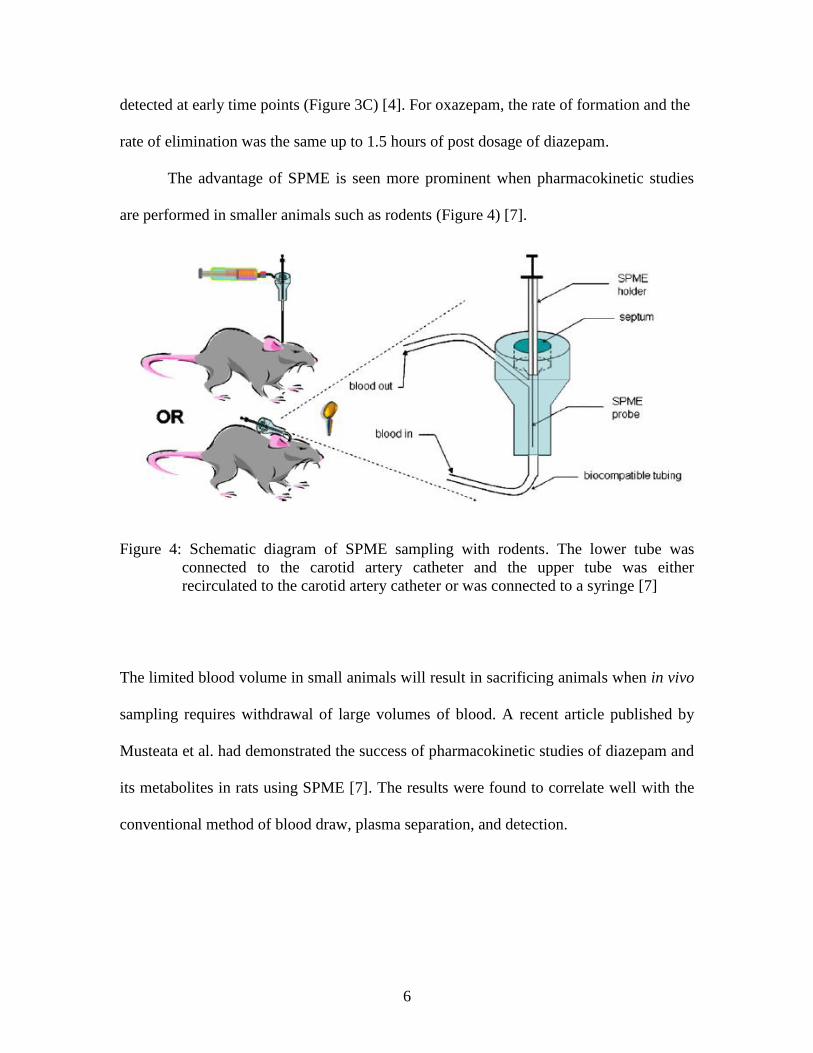
are performed in smaller animals such as rodents (Figure 4) [7].
Figure 4: Schematic diagram of SPME sampling with rodents. The lower tube was
connected to the carotid artery catheter and the upper tube was either
recirculated to the carotid artery catheter or was connected to a syringe [7]
The limited blood volume in small animals will result in sacrificing animals when in vivo
sampling requires withdrawal of large volumes of blood. A recent article published by
Musteata et al. had demonstrated the success of pharmacokinetic studies of diazepam and
its metabolites in rats using SPME [7]. The results were found to correlate well with the
conventional method of blood draw, plasma separation, and detection.
7
The feasibility of in vivo SPME was demonstrated by Zhou et al. [8] in the field
sampling of pharmaceuticals in fish muscles. In the study, wild fishes were collected
from different river locations with variability in municipal wastewater effluent. The
fishes were sampled by SPME and the amount extracted was compared linearly with the
waterborne concentrations of pharmaceuticals understudy [8].
1.3 Calibration Procedures in SPME
Successful usage of SPME depends on the selection of calibration method.
Equilibrium extraction remains an attractive option because during in vivo SPME testing
in a conscious animal, the blood flow rate within the catheterized blood vessel, which is
analogous to the speed of agitation, is uncontrollable. However, the amount of analyte
extracted at equilibrium is independent of flow rate, so accurate and reliable quantitation
can be achieved using equilibrium sampling [9].
Lord et al. performed the first in vivo SPME pharmacokinetic studies to measure
the circulating concentration of diazepam and its metabolites in Beagle dogs using an
extraction time of 30 minutes which was sufficient to establish equilibrium between the
fibre and blood [4]. However, such a long sampling time limits temporal resolution
because the determined concentration would be an average of the overall sampling time
period and is feasible only when very thin coatings such as polypyrrole [4] are used. For
some SPME fibres, however, equilibrium extraction is not practical, since equilibration
takes too long [10]. In this case, the use of pre-equilibrium sampling strategy in
combination with kinetic calibration is a better method of sampling [11-19].
8
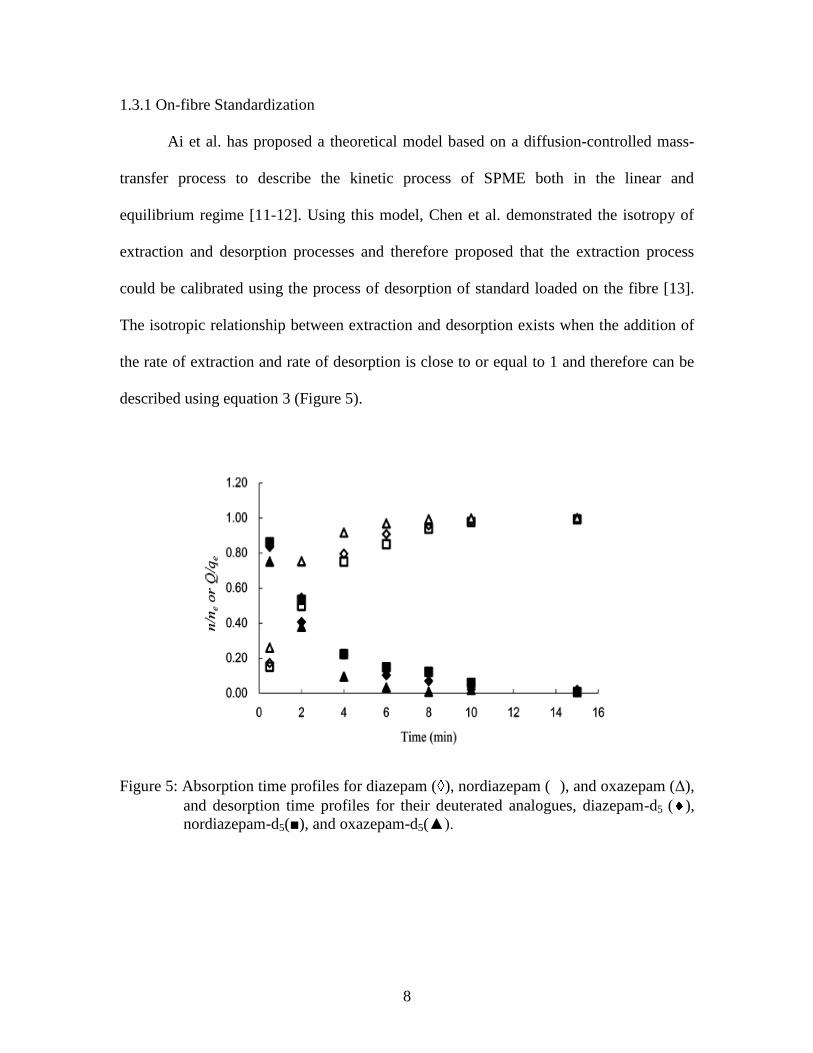
1.3.1 On-fibre Standardization
Ai et al. has proposed a theoretical model based on a diffusion-controlled mass-
transfer process to describe the kinetic process of SPME both in the linear and
equilibrium regime [11-12]. Using this model, Chen et al. demonstrated the isotropy of
extraction and desorption processes and therefore proposed that the extraction process
could be calibrated using the process of desorption of standard loaded on the fibre [13].
The isotropic relationship between extraction and desorption exists when the addition of
the rate of extraction and rate of desorption is close to or equal to 1 and therefore can be
described using equation 3 (Figure 5).
Figure 5: Absorption time profiles for diazepam ( ), nordiazepam ( ), and oxazepam (Δ),
and desorption time profiles for their deuterated analogues, diazepam-d5 ( ),
nordiazepam-d5(■), and oxazepam-d5(▲).
9
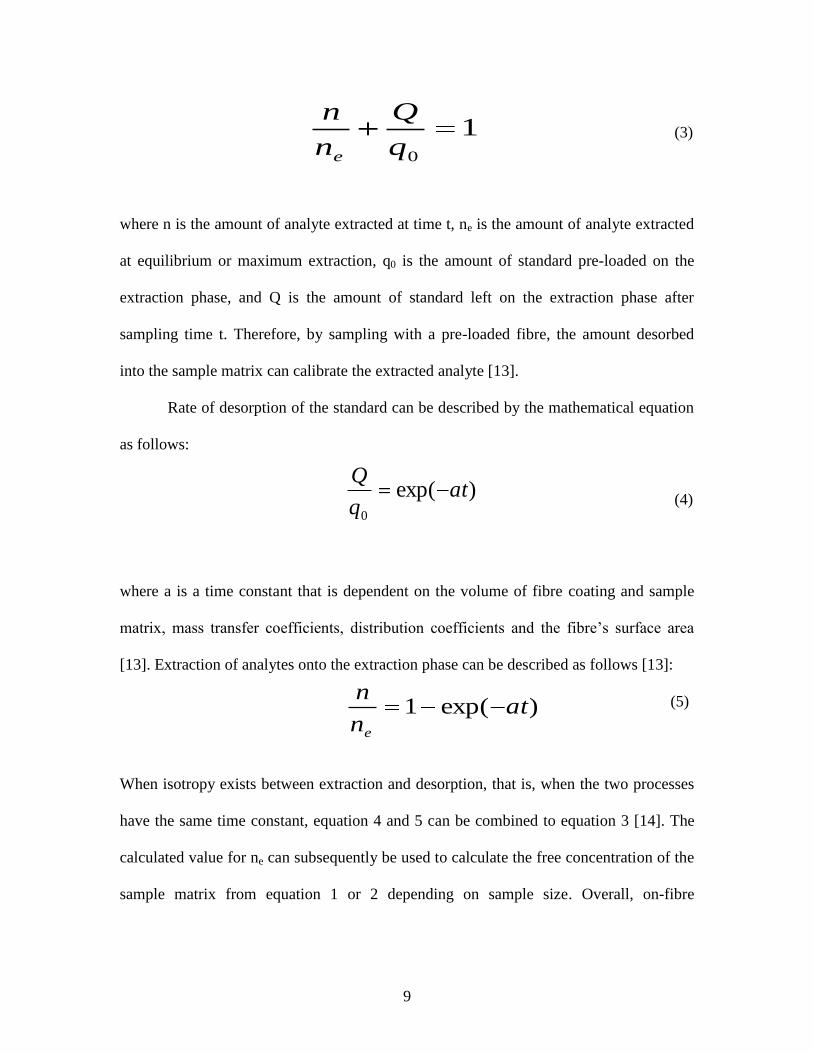
(3)
where n is the amount of analyte extracted at time t, ne is the amount of analyte extracted
at equilibrium or maximum extraction, q0 is the amount of standard pre-loaded on the
extraction phase, and Q is the amount of standard left on the extraction phase after
sampling time t. Therefore, by sampling with a pre-loaded fibre, the amount desorbed
into the sample matrix can calibrate the extracted analyte [13].
Rate of desorption of the standard can be described by the mathematical equation
as follows:
(4)
where a is a time constant that is dependent on the volume of fibre coating and sample
matrix, mass transfer coefficients, distribution coefficients and the fibre’s surface area
[13]. Extraction of analytes onto the extraction phase can be described as follows [13]:
(5)
When isotropy exists between extraction and desorption, that is, when the two processes
have the same time constant, equation 4 and 5 can be combined to equation 3 [14]. The
calculated value for ne can subsequently be used to calculate the free concentration of the
sample matrix from equation 1 or 2 depending on sample size. Overall, on-fibre
10q
Q
n
n
e
)exp(0
atq
Q
)exp(1 atn
n
e
10
standardization method for in vivo studies compensates for matrix effects and the effects
of agitation or blood flow rate when sampling from an animal [7, 15].
1.3.2 Dominant Pre-equilibrium Desorption
On-fibre standardization has been successfully applied to in vivo studies [7, 15]
and other areas such as environmental monitoring [16] and food [14]. However, for this
standardization technique, a standard is required for pre-loading onto the fibre. These
standards, usually radioactive compounds or deuterated analogues of the analyte, are
relatively expensive and the availability is limited. Moreover, addition of standard into
the sample matrix can possibly have a negative impact on the system under investigation.
Therefore, a standard-free calibration method was introduced by Zhou et al [18]. Similar
to on-fibre standardization, dominant pre-equilibrium desorption, uses the isotropic
relationship between the amount extracted and amount desorbed for calibration.
For dominant pre-equilibrium desorption, it was found that the rate of desorption
is constant when the pre-loaded amount is four-fold higher than the potential extracted
amount from the sample matrix. When this requirement is fulfilled, desorption becomes
dominant and extraction by the same fibre is negligible [18]. Another prominent factor to
consider in this calibration method is the distance between the desorption fibre and the
extraction fibre. Because the preloaded standard is the same as the extracted analyte,
these fibres must be kept apart from each other in order to prevent them from affecting
each other but not too far so that the matrices between desorption and extraction are
different [18].
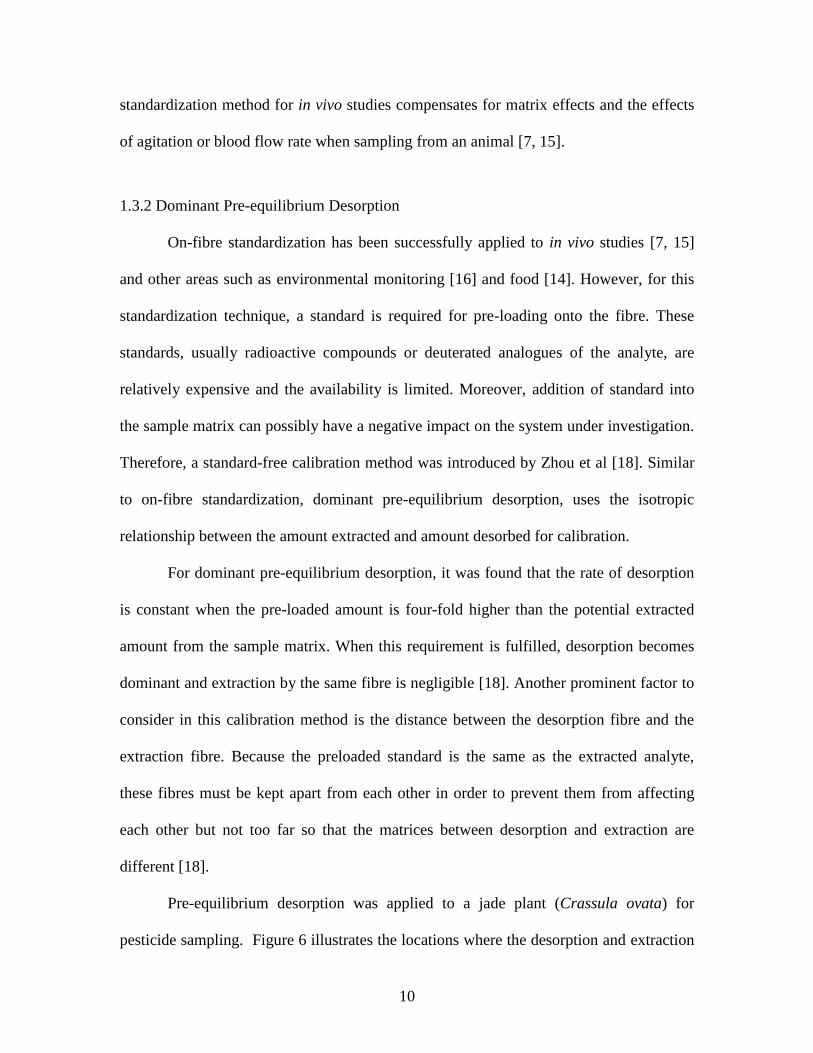
Pre-equilibrium desorption was applied to a jade plant (Crassula ovata) for
pesticide sampling. Figure 6 illustrates the locations where the desorption and extraction
11
fibres were inserted. The desorption fibres were previously pre-loaded with the pesticides
of interest [18].
Figure 6: Application of pre-dominant desorption on jade plants. The locations for SPME
absorption and desorption are illustrated [18]
In addition to jade plants, this technique has been applied to study pharmaceutical
accumulation in wild fish using separate animals for desorption and extraction [8].
1.3.3 Diffusion-based interface Model
Although dominant pre-equilibrium desorption does not require other standards,
this calibration method may be too costly because different fibres are needed for both
extraction and desorption. In addition, a different animal may be used for calibration if
the sampling area of the animal is too small to fit both an extraction and a desorption
fibre as was the case when sampling muscle of wild fish where one fish was used for
extraction and another for desorption [8].
12
To address the limitations of dominant pre-equilibrium desorption, another
standard-free pre-equilibrium calibration method, the diffusion-based-interface
calibration model was investigated for in vivo SPME studies [19-22]. Similar to dominant
pre-equilibrium desorption, the diffusion-based-interface model uses the analyte itself to
calibrate the amount extracted. However, unlike dominant pre-equilibrium desorption,
this method requires fewer SPME fibres and the size of sampling area is not of great
concern.
Diffusion-based interface model calibration is based primarily on the principle of
analyte diffusion from the sample matrix to the fibre [19]. First, the analyte travels from
the sample matrix to the surface of the fibre. Depending on the types of fibre used and
thus the mode of extraction, the analyte will partition into the bulk of the polymer, in the
case of absorption extraction, or adsorb onto the binding sites available on the surface of
the coating, in the case of adsorption extraction. In the mass transfer process, the analyte
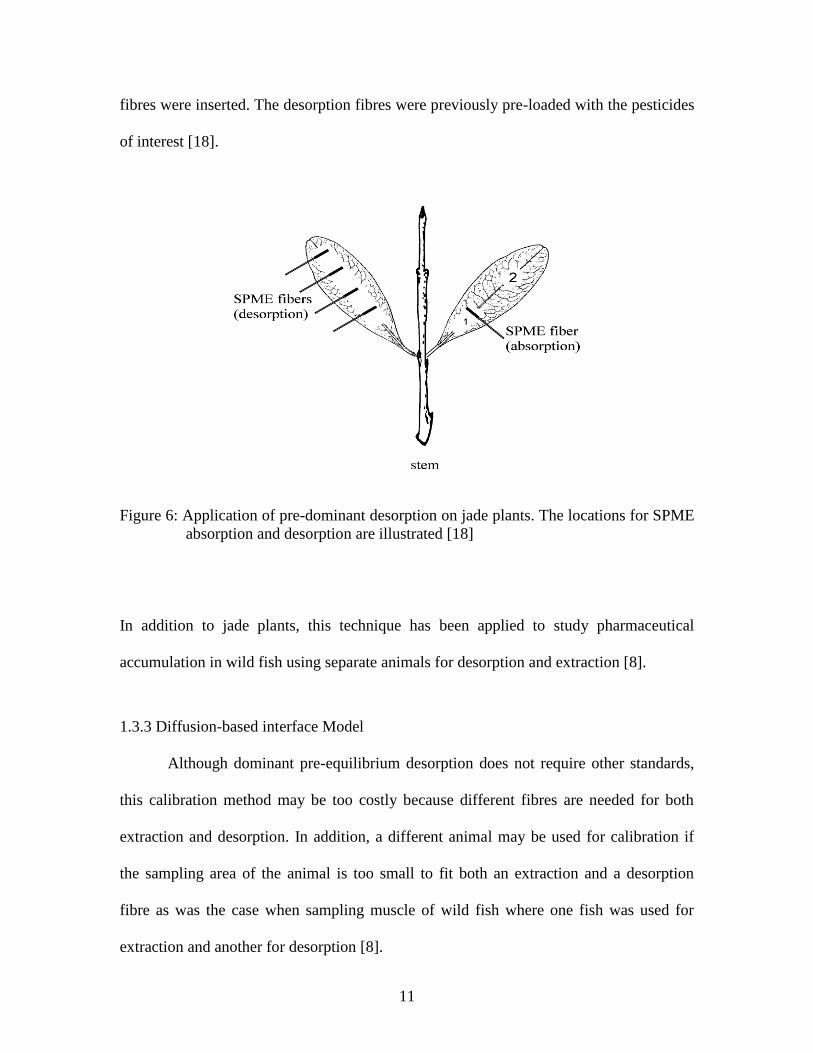
must travel through the boundary layer, the layer between the bulk of the sample and the
fibre surface (Figure 7), to the surface of the fibre [19]. When a fibre is submerged into
the sample matrix for extraction, the fluid that is touching the surface of the fibre is
stationary. As the distance from the fibre surface increases, the fluid movement increases
as well, corresponding to the bulk flow in the sample [1].
13
Figure 7: Diagram illustrating the concentration gradient in the boundary layer and
sample
During pre-equilibrium extraction, the concentration gradient of the analyte across
the boundary layer is high since the concentration of analyte in the sorbent (Csorbent) is
practically zero [19]. Therefore, diffusion of the analyte occurs from high concentration,
the bulk sample, to low concentration, the sorbent. This allows the rate of extraction to be
correlated linearly to the concentration of the analyte in the sample and calibration can be
performed according to the extraction rate [19]. The concentration of the bulk sample can
be determined as follows:
(6)
LLtD
bbnC
2
)/)ln((
14
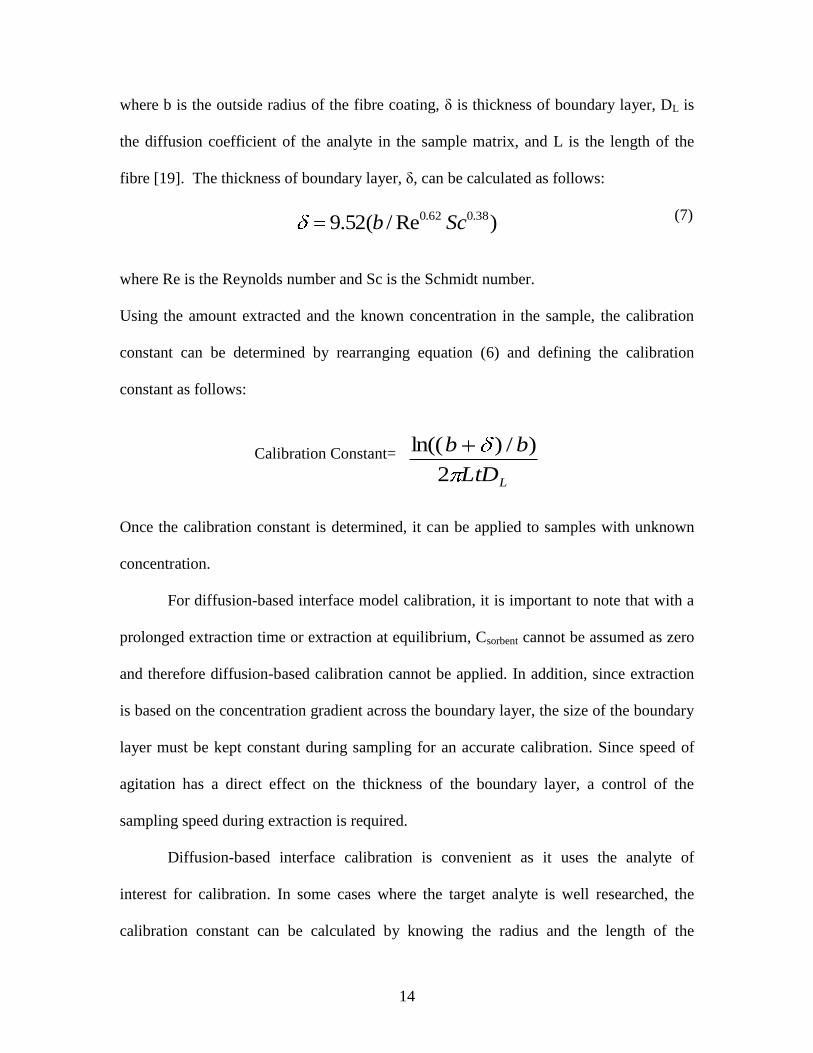
where b is the outside radius of the fibre coating, δ is thickness of boundary layer, DL is
the diffusion coefficient of the analyte in the sample matrix, and L is the length of the
fibre [19]. The thickness of boundary layer, δ, can be calculated as follows:
(7)
where Re is the Reynolds number and Sc is the Schmidt number.
Using the amount extracted and the known concentration in the sample, the calibration
constant can be determined by rearranging equation (6) and defining the calibration
constant as follows:
Calibration Constant=
Once the calibration constant is determined, it can be applied to samples with unknown
concentration.
For diffusion-based interface model calibration, it is important to note that with a
prolonged extraction time or extraction at equilibrium, Csorbent cannot be assumed as zero
and therefore diffusion-based calibration cannot be applied. In addition, since extraction
is based on the concentration gradient across the boundary layer, the size of the boundary
layer must be kept constant during sampling for an accurate calibration. Since speed of
agitation has a direct effect on the thickness of the boundary layer, a control of the
sampling speed during extraction is required.
Diffusion-based interface calibration is convenient as it uses the analyte of
interest for calibration. In some cases where the target analyte is well researched, the
calibration constant can be calculated by knowing the radius and the length of the
LLtD
bb
2
)/)ln((
)Re/(52.9 38.062.0 Scb
15
coating, the extraction time, and diffusion coefficient for the analyte [20]. This
calibration method, therefore, offers an attractive alternative to other pre-equilibrium
calibration methods.
1.4 Research Proposal
The utility of in vivo SPME sampling has been demonstrated using animals of
different sizes with different calibration methods. On-fibre standardization has been
applied successfully on beagles and rats in studying the pharmacokinetics of diazepam
and its metabolites. However, this method requires radioactive or deuterated standards
which may be difficult to find or harmful to the investigated system. To overcome this
problem, a novel standard-free calibration technique, dominant pre-equilibrium
desorption, was introduced. Nevertheless, this method has several shortcomings; first, it
requires more fibres than other calibration methods since different sets of fibre for
extraction and pre-loading for desorption are needed. This not only increases the cost of
the experiment, but also decreases the precision of the data due to fibre variability.
Second, when in vivo studies are performed on animals, two different animals may be
required if the sampling area is too small to fit both an extraction fibre and a pre-loaded
fibre.
Due to these reasons, the diffusion-based interface model, another standard-free
calibration method, was investigated. In this method, the bulk concentration is
determined by the calibration constant, which can be determined experimentally or
16
theoretically. In this research, three calibration methods were compared, using a flow-
through system, and validated by SPME equilibrium extraction and plasma-protein
precipitation. All methods were compared in terms of accuracy, precision, and ease of
operation. The best calibration method, the diffusion-based interface model, was selected
and applied in pharmacokinetic studies of fenoterol and methoxyfenoterol in rats.
AccuSampler®, an automated in vivo sampling system, was used to provide a constant
sampling rate as required for the diffusion-based interface method. All SPME sampling
procedures except for the insertion and removal of the SPME probe were automated with
the custom-written program installed in AccuSampler®. All SPME data obtained were
validated with plasma-protein precipitation.
17
Chapter 2: In vivo SPME calibration method comparison: on-fibre standardization,
dominant pre-equilibrium desorption, and diffusion-based interface model on flow-through
system
2.1 Overview
SPME has recently gained ground for in vivo studies relying on direct extraction of
analytes of interest from a living system. However, success of applying SPME is greatly
dependent on the selection of the calibration method. In this research, three in vivo SPME
calibration methods, on-fibre standardization, dominant pre-equilibrium desorption, and
diffusion-based interface model, were compared in terms of precision, accuracy, and ease of
experimental procedures using a flow-through system. In addition, these calibration methods
were further validated using SPME equilibrium extraction and a conventional method that
involved protein precipitation. The comparison was performed using fenoterol as the analyte of
interest and liquid chromatography (LC)-tandem mass spectrometry (MS) was used for the
analysis. All three methods compared well with both the equilibrium extraction and the
conventional method in terms of accuracy. In terms of precision, diffusion-based interface model
had the best precision of 9-14% RSD in whole blood, and RSD of 9-15% in phosphate buffered
saline (PBS). Dominant pre-equilibrium desorption had the poorest precision of 20-28% RSD in
whole blood, and a RSD of 26-30% in PBS. The poorer precision observed for the dominant pre-
equilibrium desorption method can be explained by the need to use more fibres in comparison to
the other two calibration methods. In terms of ease of experimental procedures, the diffusion-
based interface model was the simplest, as it did not require procedures such as fibre loading.
This research suggests the potential use of diffusion-based interface model as the best calibration
method for future in vivo SPME studies.
18
2.2 Materials and methods
2.2.1 Materials
(R,R)-Fenoterol and (R,R)-methoxyfenoterol were obtained from National Institute of
Health (Baltimore, MD, US). Pseudoephedrine, ammonium acetate and silicone oil were
purchased from Sigma-Aldrich (St. Louis, MO, US). High performance liquid chromatography
(HPLC) grade acetonitrile (ACN) and methanol (MeOH) were purchased from Fisher Scientific
(Fair Lawn, NJ, US). Fresh rat whole blood (sterile, with sodium heparin as anticoagulant) and
plasma were purchased from Lampire Biological Laboratories Inc. (Pipersville, PA, US). Rat
whole blood was maintained at 40C for a maximum of 1 week and plasma was kept frozen at -
200C until use. Deionized water was obtained from a Barnstead/Thermodyne Nano-pure ultrapure
water system (Dubuque, IA, US).
2.2.2 LC-MS/MS Assay
For analysis of fenoterol and methoxyfenoterol, a Shimadzu (Kyoto, Japan) 10AVP LC
consisting of a system controller and dual binary pumps, a CTC-PAL autosampler, and MDS
Sciex API 3000 tandem MS were used. The MS system was operated in the electrospray
ionization positive ion mode with selected reaction monitoring (SRM). Methoxyfenoterol was
monitored using SRM transition of m/z 318.2→121.1, fenoterol was monitored at m/z
304.3→107.1, and pseudoephedrine, the internal standard, was monitored at m/z 165.8→148.2.
The optimum settings for MS parameters were obtained using direct infusion of 1 μg/mL
standard solution. The source temperature was set to 5000C, ionspray voltage 4500 V, collision
19
activated dissociation (CAD) gas was 10, the nebulizer gas was 15, and the curtain gas was 10.
The remaining parameters can be found in Table 1:
Declustering
Potential (V)
Focusing
Potential (V)
Entrance
Potential (V)
Collision
Energy (V)
Cell Exit
Potential (V)
Methoxyfenoterol 50 70 7 35 15
Fenoterol 17 60 13 33 10
Pseudoephedrine 15 70 10 15 10
Table 1: MS parameters for methoxyfenoterol, fenoterol and pseudoephedrine
The LC-MS method was modified from Kim et al. [1]. Atlantis HILIC Silica 3μm (2.1
mm X 50 mm) (Waters, Milford, MA, US) column was used. Before the first injection, the
column was pre-conditioned for 1 hour with mobile phase B, which consisted of
acetonitrile:ammonium acetate (pH unadjusted, 10 mM) (95:5, v/v). Mobile phase A was
acetonitrile:ammonium acetate (pH unadjusted, 10 mM) (50:50, v/v). The flow rate was 0.5
mL/min throughout the entire run time of 7 minutes. To avoid any contamination in the MS
detector, the first minute of effluent was diverted to waste using Waters switching valve. The
gradient is shown in the following table:
20
Table 2: The LC gradient for fenoterol and methoxyfenoterol analysis
The data collected were processed using the Analyst 1.4.1 software from MDS Sciex.
2.2.3 In Vitro SPME Method Development
For SPME method development, both fenoterol and methoxyfenoterol were studied as
methoxyfenoterol, although used only as an isotropic standard for on-fibre standardization in
this chapter, pharmacokinetics study of methoxyfenoterol was performed in the following
chapter..
Selection of a commercially prototype fibre was based on highest extraction efficiency
for the compounds of interest and lowest inter-fibre variations. Commercial prototype reverse
phased amide (RPA) fibre, C18, and cyano (CN) type fibre were used for extraction under static
conditions for 2 minutes in 100 ng/mL standard PBS buffer solution of fenoterol and
methoxyfenoterol. RPA fibres were selected for subsequent experiments. A preconditioning
method was selected based on the highest extraction efficiency. Fibres were either not
preconditioned or preconditioned for various lengths of time in either desorption solvent of
Time (mins) Events Parameter
0.01 Event 2
1.00 %B 100
1.01 Event 0
2.50 %B 50
3.00 %B 50
3.01 %B 100
5.99 %B 100
7.00 STOP 100
21
ACN:MeOH (80:20, v/v) or in 100% MeOH followed by 2 minutes extraction in static conditions
in 100 ng/mL fenoterol in PBS buffer solution.
Desorption time was determined based on the lowest percentage of carryover. To
determine the extraction time for subsequent in vivo studies, extractions were performed in 100
ng/mL standard whole blood solution for either 2 or 4 minutes at 2 different pump flow rates of
0.6 mL/min and 1.4 mL/min using a syringe pump (Kloehn Co. LTD, Las Vegas, Nevada, US).
Extraction for 4 minutes at 1.4 mL/min was selected based on the highest sensitivity in
comparison with other combinations. An extraction time profile was constructed using the flow
rate of 1.4 mL/min and extraction in 100 ng/mL standard whole blood solution.
The stability of fenoterol and methoxyfenoterol was investigated. Fibres were desorbed
after extraction times of 24, 36 and 72 hours. The extracted fibres were kept in a freezer and
away from light until desorption. The linear ranges for SPME and plasma protein precipitation
were determined from 10, 250, 500, 1000, 2000, 10000, to 20000 ng/mL. Each fibre was of
single use. For extraction at higher concentrations, serial dilutions were made to the desorption
solvent for SPME and supernatant for plasma protein precipitation method until the peak area
was within the linear range of the instrument response. In addition, prior to desorption, the fibres
were rinsed with nano-pure water for approximately 1 second to dissolve any impurities. The
residual water on the fibre was blotted on Kimwipe tissue.
2.2.4 Flow-through System
For the comparisons of the three kinetic calibration methods, a flow- through system was
used (Figure 8).
22
Tubing Hot Plate
PP MR SP SPME Probe
Interface Syringe
Figure 8: A) Snapshot of the flow-through system with a peristaltic pump (PP) for providing a
controlled linear velocity of fluid from the matrix reservoir (MR) to the tubing. A hole
was drilled into the tubing where an interface was placed. On one side of the interface,
a syringe or syringe pump (SP) was pierced into the septum of the interface where it
provided the power for blood to flow through the interface. The SPME probe was
pierced on the other side of the interface. A hotplate (HR) was used to control the
temperature of the sample at 37-380C. B) Close up of the interface, SPME fibre and
syringe
The peristaltic pump (VWR, cat # 57951-016, 4-600 mL/min) functioned as an artificial heart.
The tubing functioned as an artificial vein and was selected based on three criteria: suitability for
peristaltic pump usage, biocompatibility, and low or minimal extraction. Two types of tubing,
Tygon S-50-HL and Tygon LFL were selected as they fulfilled the first two requirements.
Subsequently, Tygon S-50-HL of I.D. X O.D.: 1/8 X 1/4 inch and wall thickness of 1/16 inch
(VWR, cat # 63010-231) was selected as it extracted smaller amount of analytes compared to
Tygon LFL. The peristaltic pump was set at a flow rate of 75 mL/min according to a previous
experiment [2] but with an addition of a hot plate and a crystallizing dish on top with silicone oil
23
to maintain temperature at 380C. Extractions were performed when the tubing was equilibrated at
37-380C. The setup was optimized using Beagle dog parameters as the pressure range in the
circulation loop was within the same range as that expected in Beagle dog vein and incorporation
of any external flow resistance was not necessary [2-3].
2.2.5 Preparation of Calibration Standards
PBS buffer of pH 7.4 was prepared by dissolving 8g of NaCl, 0.2g of KCl, 1.44g of
Na2HPO4, and 0.24g of KH2PO4 in water. To evaluate the accuracy of the calibration methods,
extractions were performed in whole blood and PBS buffer with spiked fenoterol concentrations
at 10, 5000, and 20,000 ng/mL which fall in the dynamic linear range determined previously.
Prior to extraction, the blood was incubated with the spiked fenoterol for 24 hours. This allowed
the drug to distribute evenly in the sample. The calibrated amount was compared with the true
concentration in the sample. Three determinations were performed at each concentration level
and using each kinetic calibration method in order to evaluate method precision. Equilibrium
extraction and conventional method of plasma protein precipitation were performed for
comparison with the three kinetic calibrations.
2.2.6 On-fibre Standardization
For on-fibre standardization, methoxyfenoterol was used as the standard. To determine
whether isotropic exists between fenoterol and methoxyfenoterol, the ratios of n/ne for both drugs
were determined. For the determination of n, extraction was performed in 100 ng/mL whole
blood using a flow rate of 1.4 mL/min. For ne, extraction was performed for 1 hour, the time it
takes to reach equilibrium between whole blood and fibre according to the extraction time profile.
Methoxyfenoterol, either 10 ng/mL or 1000 ng/mL in PBS buffer, was loaded overnight as the
24
standard on fibre. To obtain the value for q0, the fibres that were not used in subsequent
extractions were desorbed in desorption solvent consisting of ACN and MeOH (80:20, v/v).
For extraction, the fibre loaded with methoxyfenoterol was pierced through one of the
septa of the interface that was drilled through the tubing of the flow-through system. Meanwhile,
a syringe was pierced through the other septa and used to manually push and pull the blood up to
the interface at 1.4 mL/min. Extraction was performed for 4 minutes followed by desorption for 1
hour in desorption solvent. For this calibration method, both Q and n were determined
simultaneously using a single fibre.
2.2.7 Dominant Pre-equilibrium Desorption
For dominant pre-equilibrium desorption, the preloaded amount must be at least 4-fold
higher than the potential extracted amount from the sample matrix [4], so an experiment to
determine the pre-loading concentration was first performed. Fibres were loaded with varying
amounts of fenoterol using a series of different concentrations (5000, 10,000, 20,000, 50,000
ng/mL) and were desorbed in desorption solvent to determine how much was loaded to obtain q0.
Subsequently, 4 minute extractions were performed on the flow-through system using a syringe
and non-loaded fibre to determine n. The concentrations of fenoterol were 10, 5000, and 20,000
ng/mL. The amount extracted was compared with the amount loaded to decide on the
concentration required for loading.
Due to the small area of the interface, extraction and desorption of the preloaded fibre
were not performed simultaneously. The pre-loaded fibre was exposed to the flowing blood
sample or PBS buffer of 10, 5000, and 20,000ng/mL of fenoterol for a 4 minutes desorption via a
syringe again using the flow-through system. Subsequently, the desorbed pre-loaded fibre were
desorbed in the desorption solvent for 1 hour to obtain Q.
25
2.2.8 Diffusion-based Interface Model
For diffusion-based calibration, the calibration constant was determined experimentally
by performing five extractions in the flow-through system using 100 ng/mL fenoterol for 4
minutes in both PBS buffer and whole blood. All extractions, both for the actual experiment and
calibration constant, were performed with a syringe pump. To calculate the concentration of the
sample, the experimentally determined calibration constant was applied according to equation 6.
The calibration constant was also determined theoretically by calculations using equation 6 for
comparison with the experimentally determined calibration constant.
2.2.9 Equilibrium Extraction
For equilibrium extraction, each extraction was performed for 1 hour to reach equilibrium
using the syringe pump and the flow-through system at 10, 5000, and 20,000 ng/mL in PBS
buffer and whole blood followed by 1 hour desorption. A calibration curve was constructed from
10 ng/mL – 20,000 ng/mL at the same extraction time to calculate the initial concentration in the
sample.
2.2.10 Conventional Blood Analysis
For validation purposes, 0.3mL blood was withdrawn using a syringe from the same
interface where SPME probe was inserted. The blood sample was subsequently centrifuged
(14,000 rpm, 5 min, 40C) and plasma was isolated. A 0.08 mL portion of plasma was mixed with
0.30 mL of HPLC grade ACN in conical centrifuge vials for protein precipitation. After vortex
mixing (2400 rpm, 5 min) and centrifugation (14,000 rpm, 10 min, 40C), 0.01 mL of the
supernatant was transferred to a 0.1 mL insert (Supelco, Bellefonte, PA, US). 0.09 mL of
desorption solvent for dilution and 0.01 mL of pseudoephedrine (50 ng/mL) as internal standard
26
to control for injection volume variation were added. The resulting solution was vortexed
manually to ensure thorough mixing. External calibration was performed to determine the amount
of fenoterol in the plasma sample. For this, blank plasma was spiked with different
concentrations of fenoterol. Following the same procedures as above, the spiked plasma was
mixed with ACN for protein precipitation followed by vortex mixing and centrifugation.
2.3 Results & Discussions
2.3.1 SPME Method Development
Three commercial prototype coatings, C18, RPA, and CN were selected for evaluation
[5]. Extractions were performed for 2 minutes using 100 ng/mL at static conditions to determine
the extraction efficiency. Ten fibres were used for each type of coating for extraction. RPA
displayed the highest extraction capacity and lowest inter-fibre variability (Figure 9). Therefore,
it was selected for subsequent in vivo studies.
27
Coatings selection
2 minutes static extraction
0
0.1
0.2
0.3
0.4
0.5
0.6
0.7
CN C18 RPA
Coating Types
% E
xtra
ctio
n
Methoxyfenoterol Fenoterol
Figure 9: Extraction capacity and inter-fibre variability of three types of commercially available
coating: cyano, C18, and RPA (n=10). Error bars represent one standard deviation
from the mean. The extraction time was 2 minutes in static condition in 100 ng/mL
standard PBS buffer solution
From previous experiments, it was known that pre-wetting or pre-conditioning the coating
by soaking the fibres into organic solvent greatly enhanced the extraction efficiency. Therefore,
two organic solvents, consisting of ACN and MeOH (80:20, v/v) and 100% methanol were
selected. Extractions were performed in 100 ng/mL after 0, 15, 30, and 60 minutes of pre-
conditioning in desorption solvent. This was compared with extraction performed after 60
minutes of pre-conditioning in MeOH (Figure 10). It was observed that amount extracted was
below the limits of quantification (LOQ) when no pre-conditioning was performed on the fibres.
No difference in extraction efficiency was found after 30 and 60 minutes of pre-conditioning with
desorption solvent or MeOH. Therefore, on the basis of these results, each RPA probe was pre-
conditioned for at least 30 minutes using desorption solvent before any extraction was performed.
28
Pre-conditioning Methods Selection
0.00
0.05
0.10
0.15
0.20
0.25
0.30
0.35
0.40
0.45
No
Preconditioning
15 mins (DS) 30 mins (DS) 60mins(DS) 60mins (MeoH)
% E
xtr
acti
on
Figure 10: Effect of pre-conditioning method on amount extracted after the indicated time and
solvent type (n=3). Error bars represent one standard deviation from the mean. Two
solvents were selected for pre-conditioning: desorption solvent (DS) and methanol
(MeOH). The extraction time was 2 minutes in static condition in 100 ng/mL PBS
buffer standard solution of fenoterol
For SPME method development, it is important to determine the desorption time. The
selected time should be long enough to allow almost all of the analyte to be desorbed from the
fibre. In this experiment, extractions were performed in 100 ng/mL fenoterol in PBS buffer for 60
minutes with vortex (2400 rpm) followed by desorption for 15, 30, 45, and 60 minutes. Carryover
was determined by subsequent desorption for another 60 minutes in fresh desorption solvent
(Figure 11).
29
Desorption time determination
0
0.5
1
1.5
2
2.5
3
3.5
4
4.5
15 30 45 60
Time (min)
% C
arr
yo
ver
Figure 11: Desorption time determination by extraction with 100 ng/mL fenoterol in PBS buffer
for 60 minutes with vortex followed by desorption at various time in desorption
solvent (n=3). Error bars represent one standard deviation from the mean.
A 60 minute desorption time was selected for subsequent experiments as it gave less than 0.5%
carryover.
For pre-equilibrium extraction using the three kinetic calibrations, on-fibre standardization,
dominant pre-equilibrium desorption, and diffusion-based interface model, the amount extracted
must be far less than the amount extracted at equilibrium. There are two factors that affect the
amount extracted: sampling speed and sampling time. Since a syringe or syringe pump would be
used to push and pull the flowing sample through the interface, this agitation would increase the
amount extracted by the fibre in comparison with extractions performed at static conditions.
Therefore, it is important to consider the pump flow rate or the manual push-pull rate by the
syringe. Because the kinetic calibration methods, specifically the diffusion-based interface model,
would be applied to sampling real animals such as rats, the sampling rate should be well below
the normal flow rate in the animal in order to give minimal disturbance. 0.6 mL/min was selected
based on previous pharmacokinetic studies [6].
30
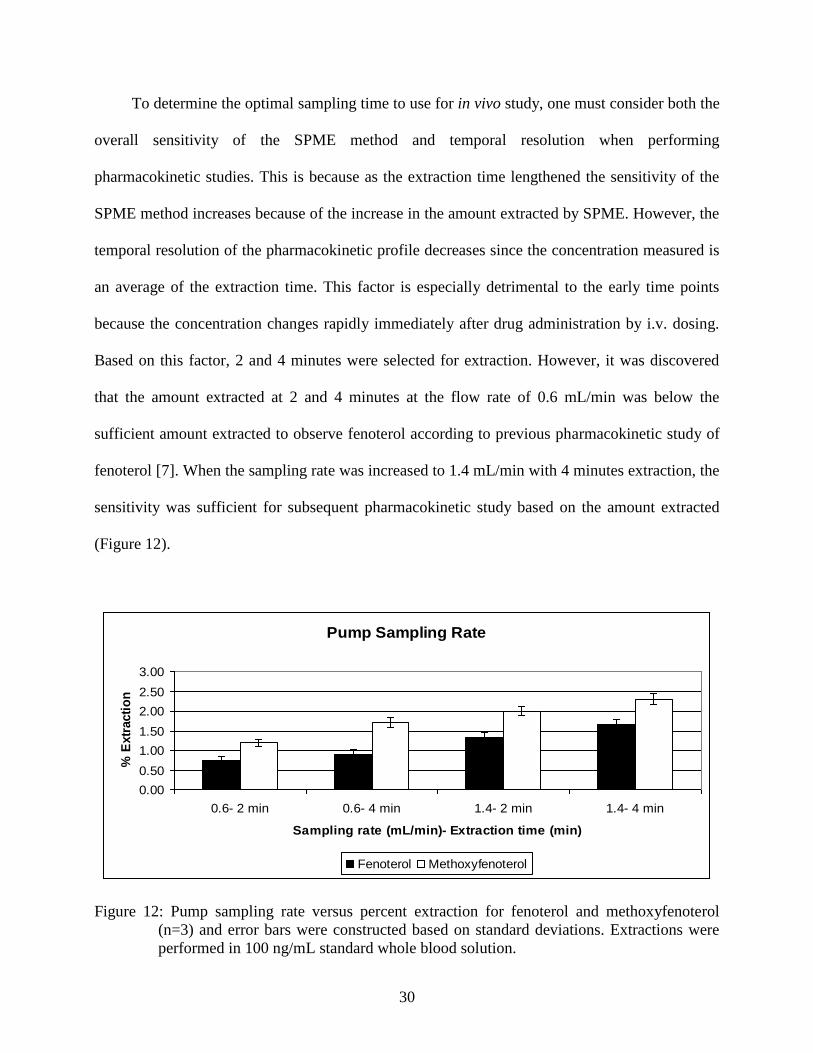
To determine the optimal sampling time to use for in vivo study, one must consider both the
overall sensitivity of the SPME method and temporal resolution when performing
pharmacokinetic studies. This is because as the extraction time lengthened the sensitivity of the
SPME method increases because of the increase in the amount extracted by SPME. However, the
temporal resolution of the pharmacokinetic profile decreases since the concentration measured is
an average of the extraction time. This factor is especially detrimental to the early time points
because the concentration changes rapidly immediately after drug administration by i.v. dosing.
Based on this factor, 2 and 4 minutes were selected for extraction. However, it was discovered
that the amount extracted at 2 and 4 minutes at the flow rate of 0.6 mL/min was below the
sufficient amount extracted to observe fenoterol according to previous pharmacokinetic study of
fenoterol [7]. When the sampling rate was increased to 1.4 mL/min with 4 minutes extraction, the
sensitivity was sufficient for subsequent pharmacokinetic study based on the amount extracted
(Figure 12).
Pump Sampling Rate
0.00
0.50
1.00
1.50
2.00
2.50
3.00
0.6- 2 min 0.6- 4 min 1.4- 2 min 1.4- 4 min
Sampling rate (mL/min)- Extraction time (min)
% E
xtr
acti
on
Fenoterol Methoxyfenoterol
Figure 12: Pump sampling rate versus percent extraction for fenoterol and methoxyfenoterol
(n=3) and error bars were constructed based on standard deviations. Extractions were
performed in 100 ng/mL standard whole blood solution.
31
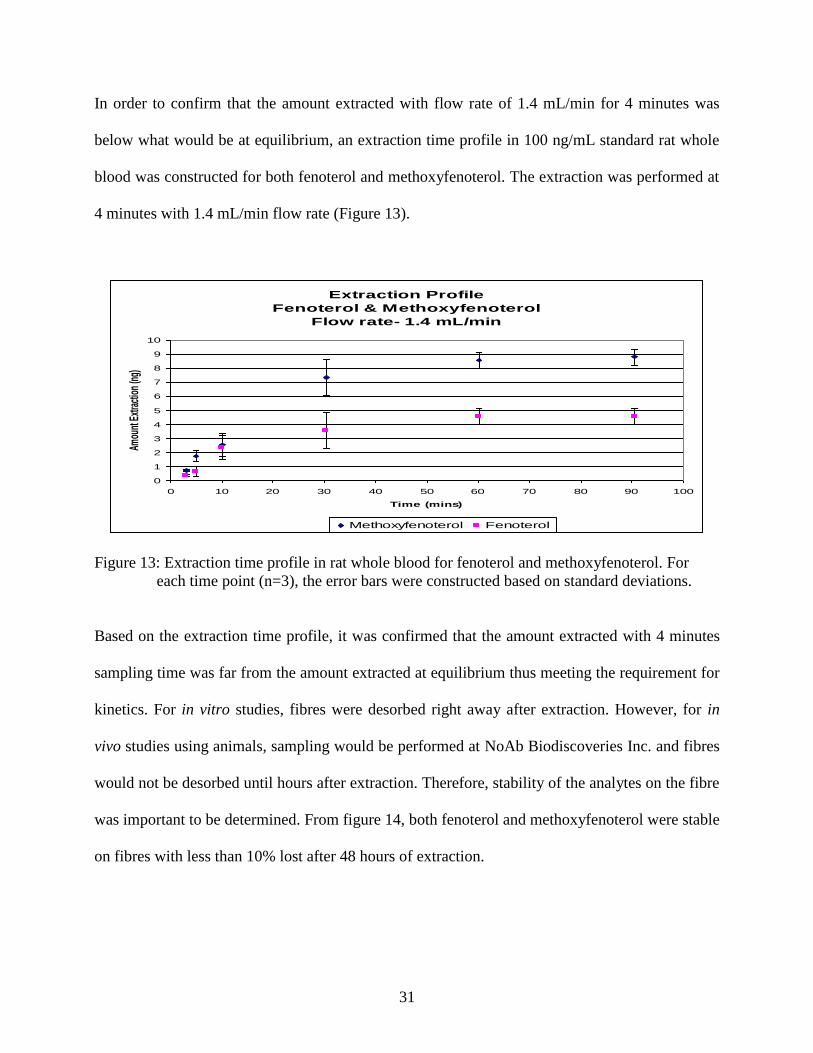
In order to confirm that the amount extracted with flow rate of 1.4 mL/min for 4 minutes was
below what would be at equilibrium, an extraction time profile in 100 ng/mL standard rat whole
blood was constructed for both fenoterol and methoxyfenoterol. The extraction was performed at
4 minutes with 1.4 mL/min flow rate (Figure 13).
Extraction Profile
Fenoterol & Methoxyfenoterol
Flow rate- 1.4 mL/min
0
1
2
3
4
5
6
7
8
9
10
0 10 20 30 40 50 60 70 80 90 100
Time (mins)
Amou
nt E
xtra
ctio
n (n
g)
Methoxyfenoterol Fenoterol
Figure 13: Extraction time profile in rat whole blood for fenoterol and methoxyfenoterol. For
each time point (n=3), the error bars were constructed based on standard deviations.
Based on the extraction time profile, it was confirmed that the amount extracted with 4 minutes
sampling time was far from the amount extracted at equilibrium thus meeting the requirement for
kinetics. For in vitro studies, fibres were desorbed right away after extraction. However, for in
vivo studies using animals, sampling would be performed at NoAb Biodiscoveries Inc. and fibres
would not be desorbed until hours after extraction. Therefore, stability of the analytes on the fibre
was important to be determined. From figure 14, both fenoterol and methoxyfenoterol were stable
on fibres with less than 10% lost after 48 hours of extraction.
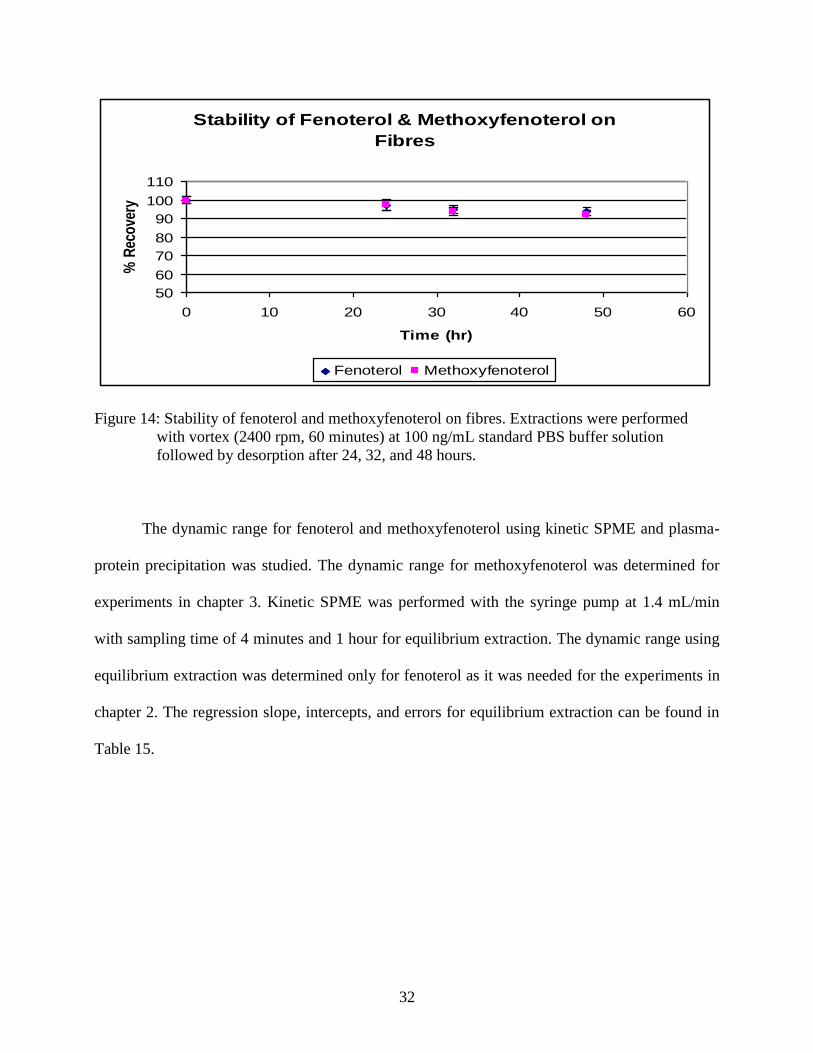
32
Stability of Fenoterol & Methoxyfenoterol on
Fibres
50
60
70
80
90
100
110
0 10 20 30 40 50 60
Time (hr)
% R
eco
very
Fenoterol Methoxyfenoterol
Figure 14: Stability of fenoterol and methoxyfenoterol on fibres. Extractions were performed
with vortex (2400 rpm, 60 minutes) at 100 ng/mL standard PBS buffer solution
followed by desorption after 24, 32, and 48 hours.
The dynamic range for fenoterol and methoxyfenoterol using kinetic SPME and plasma-
protein precipitation was studied. The dynamic range for methoxyfenoterol was determined for
experiments in chapter 3. Kinetic SPME was performed with the syringe pump at 1.4 mL/min
with sampling time of 4 minutes and 1 hour for equilibrium extraction. The dynamic range using
equilibrium extraction was determined only for fenoterol as it was needed for the experiments in
chapter 2. The regression slope, intercepts, and errors for equilibrium extraction can be found in
Table 15.
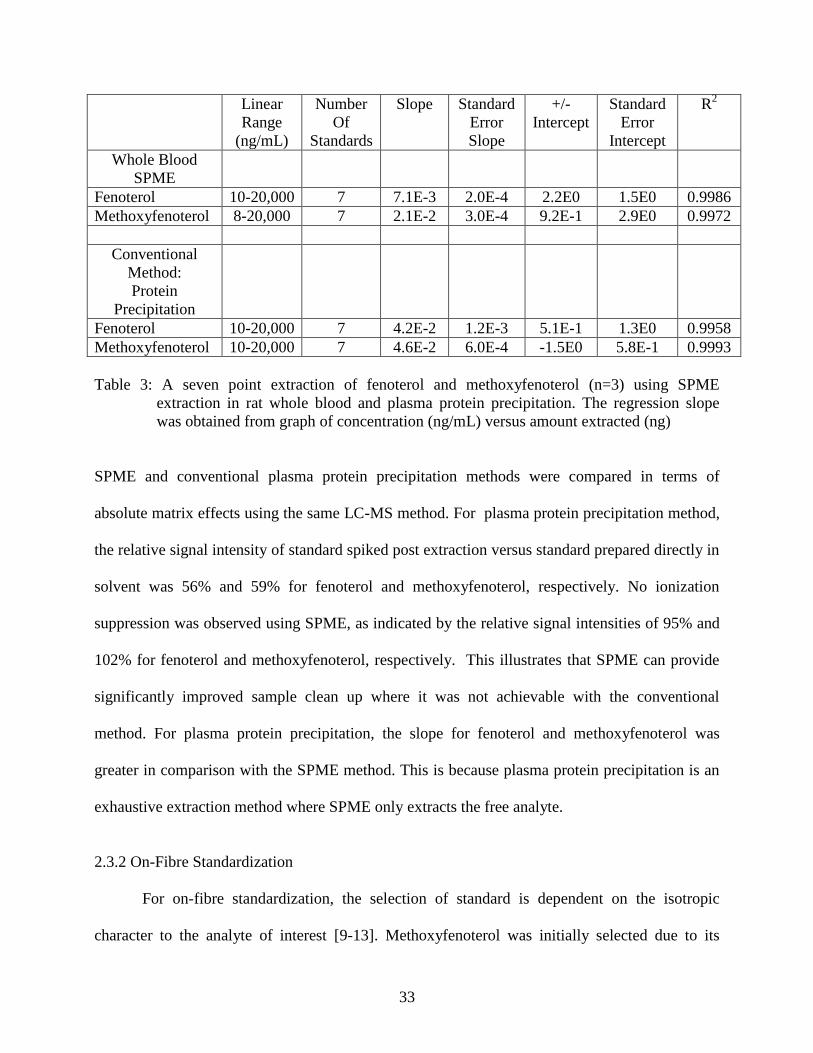
33
Linear
Range
(ng/mL)
Number
Of
Standards
Slope Standard
Error
Slope
+/-
Intercept
Standard
Error
Intercept
R2
Whole Blood
SPME
Fenoterol 10-20,000 7 7.1E-3 2.0E-4 2.2E0 1.5E0 0.9986
Methoxyfenoterol 8-20,000 7 2.1E-2 3.0E-4 9.2E-1 2.9E0 0.9972
Conventional
Method:
Protein
Precipitation
Fenoterol 10-20,000 7 4.2E-2 1.2E-3 5.1E-1 1.3E0 0.9958
Methoxyfenoterol 10-20,000 7 4.6E-2 6.0E-4 -1.5E0 5.8E-1 0.9993
Table 3: A seven point extraction of fenoterol and methoxyfenoterol (n=3) using SPME
extraction in rat whole blood and plasma protein precipitation. The regression slope
was obtained from graph of concentration (ng/mL) versus amount extracted (ng)
SPME and conventional plasma protein precipitation methods were compared in terms of
absolute matrix effects using the same LC-MS method. For plasma protein precipitation method,
the relative signal intensity of standard spiked post extraction versus standard prepared directly in
solvent was 56% and 59% for fenoterol and methoxyfenoterol, respectively. No ionization
suppression was observed using SPME, as indicated by the relative signal intensities of 95% and
102% for fenoterol and methoxyfenoterol, respectively. This illustrates that SPME can provide
significantly improved sample clean up where it was not achievable with the conventional
method. For plasma protein precipitation, the slope for fenoterol and methoxyfenoterol was
greater in comparison with the SPME method. This is because plasma protein precipitation is an
exhaustive extraction method where SPME only extracts the free analyte.
2.3.2 On-Fibre Standardization
For on-fibre standardization, the selection of standard is dependent on the isotropic
character to the analyte of interest [9-13]. Methoxyfenoterol was initially selected due to its
34
similarity in structure to fenoterol. Previously, Zhou et al. had demonstrated that if the analyte
and standard were isotropic, the time constant, a, for desorption of the standard, should be similar
to the time constant of the extraction process of the analyte [14, 15]. Based on this conclusion
and equations (3) and (4), isotropism can be confirmed either using the ratio of n/ne or Q/q0 for
both the analyte and standard. If the ratios for analyte and potential standard have similar values,
their isotropic relationship is positive. This can save much time from determining the extraction
and desorption time profile for the analyte of interest and standard respectively.
Fenoterol Methoxyfenoterol
n (ng) 8.2E-2 1.5E0
ne (ng) 4.9E0 9.1E0
n/ne 0.17 0.17
Table 4: Ratio of n/ne for fenoterol and methoxyfenoterol (n=3)
To obtain q0, the loaded amount of methoxyfenoterol, excess fibres were loaded
overnight. It is important to load fibres with enough time to achieve equilibrium between the
loading solution and fibre since the amount loaded would be more consistent. q0 can be
determined by preloading several extra probes and immediately desorbing them. Two
concentrations, 10 and 1000 ng/mL were selected for loading (Table 5). For lower concentration
sample such as 10 ng/mL, fibres were loaded with 10 ng/mL of methoxyfenoterol and for higher
concentration, 1000 ng/mL of methoxyfenoterol were loaded. This was due to the consideration
of serial dilution which would be required for higher concentrations before injecting the sample
into the instrument. If a low concentration was used for loading, the instrument might not be
sensitive enough to pick up methoxyfenoterol after dilution.
35
Concentration of
methoxyfenoterol loading
solution (ng/mL)
Loaded amount of
methoxyfenoterol on fibre
(ng)
RSD (%)
(n = 3)
10 0.23 5
1000 23 4
Table 5: The amount of methoxyfenoterol loaded on fibres after overnight extraction with
agitation (2400 rpm). The loading solution consisted of methoxyfenoterol in 1.5 mL
PBS buffer
Table 6 displays the results for n, Q, q0 (either 10 or 1000 ng/mL) and the calculated ne by using
equation 5. Both n and Q were obtained with the same fibre sampling in whole blood and PBS
buffer with concentration of 10, 5000, and 20,000 ng/mL fenoterol. That is, both extraction and
desorption were performed simultaneously with 1 fibre. A syringe was used to push and pull the
sample at a flow rate of 1.4 mL/min through the interface. A syringe pump was not used since a
control of sampling rate was not required for this calibration method. For actual in vivo
application of on-fibre standardization, a syringe was used instead of syringe pump.
Table 6: On-fibre standardization- Results for n, Q, q0 which was obtained with fibres (n=3) that
were not used for extraction, and ne which was calculated with equation 5
To calculate the bulk concentration of fenoterol in the sample using ne determined with the aid of
equation 3, the product of Kfs and Vf was obtained from the slope of calibration plot obtained by
finding the amount of fenoterol extracted under equilibrium conditions from standard solutions
containing different amounts of fenoterol (Figure 15).
n (ng) (RSD) Q(ng) (RSD) q0(ng) (RSD) ne(ng) (RSD)
Concentrations Buffer Blood Buffer Blood Buffer Blood Buffer Blood
10 (ng/mL) 1.0E-01
(13) 4.9E-03
(13) 1.3E-01
(5) 2.2E-01
(6.2) 2.3E-01
(5) 2.3E-01
(5) 2.6E-01
(19) 1.4E-01
(17)
5000 (ng/mL) 8.1E+01
(24) 2.3E+00
(22) 1.0E+01
(8) 2.2E-01
(6) 2.3E+01
(4) 2.3E-01
(4) 1.4E+02
(19) 7.6E+01
(15)
20000 (ng/mL) 2.8E+02
(19) 9.3E+01
(26) 1.1E+01
(3) 1.6E+01
(6) 2.3E+01
(4) 2.3E+01
(4) 5.2E+02
(20) 2.9E+02
(16)
36
Equilibrium Extraction-Fenoterol
y = 1.5E-2x + 2.0
R2 = 0.9989
y = 3.0E-2x + 2.3
R2 = 0.9997
-100
0
100
200
300
400
500
600
700
0 5000 10000 15000 20000 25000
Fenoterol Concentration (ng/mL)
Am
ou
nt
Ex
tra
cte
d
(ng
)
Blood
Buffer
Figure 15: Equilibrium extraction of fenoterol in PBS buffer and blood. The slope of the line
was used to determine the product of Kfs and Vf.
The differences observed in Figure 15 between extraction from whole blood and PBS
buffer are due to the differences in free concentration of fenoterol in the two matrices. In whole
blood, fenoterol can bind to biomolecules present, thus lowering the free concentration of analyte
in solution. The concentration calculated using the slope of the line in figure 15 and equation 2
can be found in Table 7:
37
C0 (ng/mL)
Concentrations Fibre Buffer Blood
10 (ng/mL) 1 7.7E00 9.0E00
2 1.1E00 8.1E00
3 9.4E00 1.1E00
Mean 9.4E00 9.4E00
RSD (%) 19 17
5000 (ng/mL) 1 4.1E03 6.1E03
2 5.6E03 4.9E03
3 5.9E03 4.6E03
Mean 5.2E03 5.2E03
RSD (%) 19 15
20000 (ng/mL) 1 1.5E04 2.2E04
2 2.1E04 2.1E04
3 2.2E04 1.6E04
Mean 1.9E04 2.0E04
RSD (%) 19 16
Table 7: Concentrations calculated using on-fibre standardization
2.3.3 Dominant Pre-equilibrium Desorption
For isotropic desorption, the amount pre-loaded on the fibre must be 4-fold higher than
the potential extracted amount [14,16]. Therefore, to determine the loading concentration, four
concentrations of fenoterol, 5000, 10,000, 20,000 and 50,000 ng/mL were selected for loading.
Similar to on-fibre standardization, fibres were loaded from PBS buffer using equilibrium
overnight extraction.
After deciding the appropriate loading concentration (Figure 16) by comparing amount
extracted and amount loaded, the loaded fibre was desorbed into the respective sample in order to
determine ne (5) using a syringe.
38
Concentration versus Amount Loaded
0
200
400
600
800
1000
1200
1400
1600
1800
0 10000 20000 30000 40000 50000 60000
Concentration (ng/mL)
Am
ou
nt
Lo
ad
ed
(n
g)
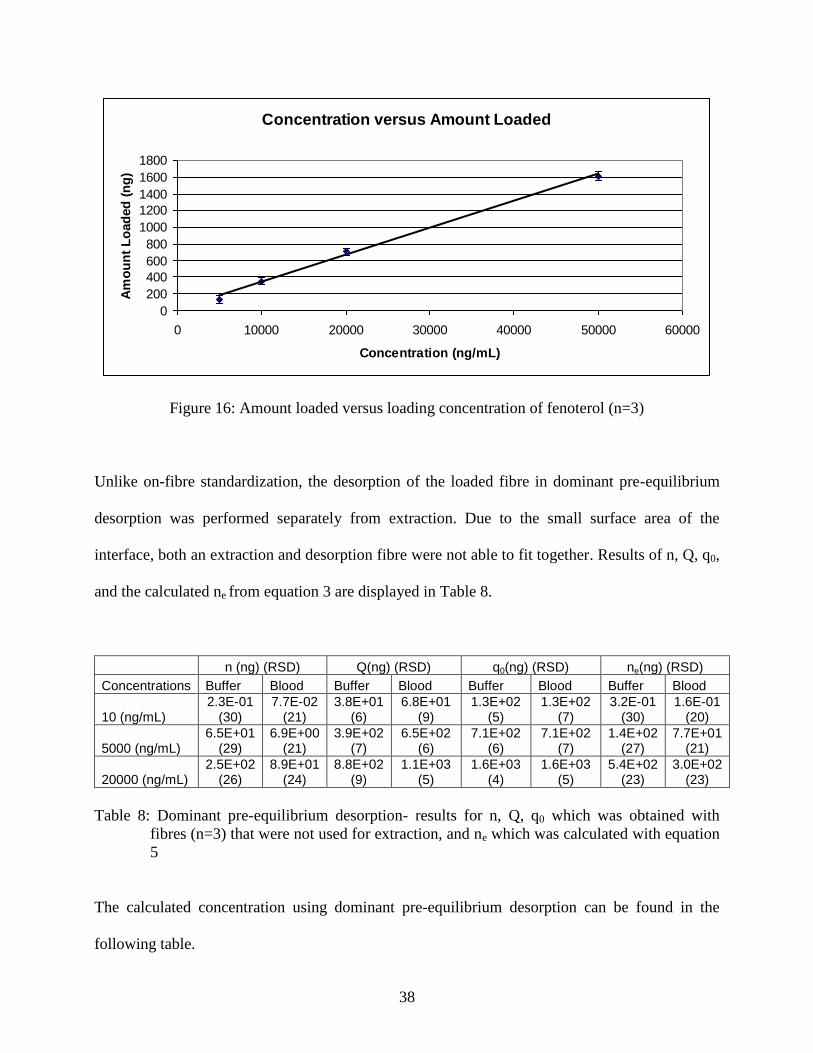
Figure 16: Amount loaded versus loading concentration of fenoterol (n=3)
Unlike on-fibre standardization, the desorption of the loaded fibre in dominant pre-equilibrium
desorption was performed separately from extraction. Due to the small surface area of the
interface, both an extraction and desorption fibre were not able to fit together. Results of n, Q, q0,
and the calculated ne from equation 3 are displayed in Table 8.
n (ng) (RSD) Q(ng) (RSD) q0(ng) (RSD) ne(ng) (RSD)
Concentrations Buffer Blood Buffer Blood Buffer Blood Buffer Blood
10 (ng/mL) 2.3E-01
(30) 7.7E-02
(21) 3.8E+01
(6) 6.8E+01
(9) 1.3E+02
(5) 1.3E+02
(7) 3.2E-01
(30) 1.6E-01
(20)
5000 (ng/mL) 6.5E+01
(29) 6.9E+00
(21) 3.9E+02
(7) 6.5E+02
(6) 7.1E+02
(6) 7.1E+02
(7) 1.4E+02
(27) 7.7E+01
(21)
20000 (ng/mL) 2.5E+02
(26) 8.9E+01
(24) 8.8E+02
(9) 1.1E+03
(5) 1.6E+03
(4) 1.6E+03
(5) 5.4E+02
(23) 3.0E+02
(23)
Table 8: Dominant pre-equilibrium desorption- results for n, Q, q0 which was obtained with
fibres (n=3) that were not used for extraction, and ne which was calculated with equation
5
The calculated concentration using dominant pre-equilibrium desorption can be found in the
following table.
39
Concentrations Fibre Buffer Blood
10 (ng/mL) 1 1.5E+01 1.0E+01
2 1.3E+01 1.3E+01
3 7.9E+00 9.4E+00
Mean 1.2E+01 1.1E+01
RSD (%) 30 20
5000 (ng/mL) 1 3.7E+03 4.5E+03
2 5.1E+03 4.9E+03
3 6.5E+03 6.5E+03
Mean 5.1E+03 5.3E+03
RSD (%) 27 28
20000 (ng/mL) 1 2.3E+04 2.4E+04
2 2.2E+04 1.6E+04
3 1.5E+04 2.2E+04
Mean 2.0E+04 2.1E+04
RSD (%) 26 23
Table 9: Concentrations calculated using dominant pre-equilibrium desorption
2.3.4 Diffusion-based Interface Model
For diffusion-based interface model calibration [17-21], the calibration constant was
obtained by extraction of 100 ng/mL of fenoterol standard solution prepared in whole blood and
PBS buffer, respectively. Using the amount extracted and the known concentration in the sample,
the calibration constant can be determined using equation (6). In this experiment, five extractions
were performed to improve the accuracy of the experimental calibration constant with an
acceptable RSD. However, the number of extractions can vary depending on the overall method
precision.
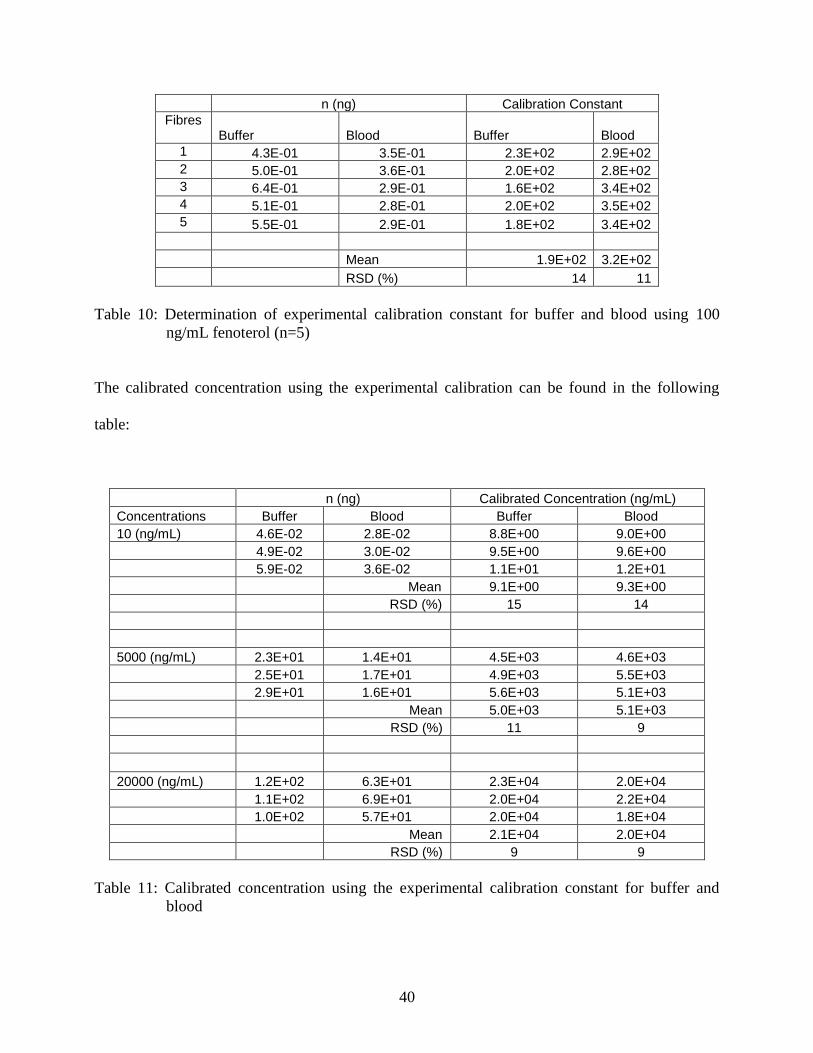
40
n (ng) Calibration Constant
Fibres Buffer Blood Buffer Blood
1 4.3E-01 3.5E-01 2.3E+02 2.9E+02
2 5.0E-01 3.6E-01 2.0E+02 2.8E+02
3 6.4E-01 2.9E-01 1.6E+02 3.4E+02
4 5.1E-01 2.8E-01 2.0E+02 3.5E+02
5 5.5E-01 2.9E-01 1.8E+02 3.4E+02
Mean 1.9E+02 3.2E+02
RSD (%) 14 11
Table 10: Determination of experimental calibration constant for buffer and blood using 100
ng/mL fenoterol (n=5)
The calibrated concentration using the experimental calibration can be found in the following
table:
n (ng) Calibrated Concentration (ng/mL)
Concentrations Buffer Blood Buffer Blood
10 (ng/mL) 4.6E-02 2.8E-02 8.8E+00 9.0E+00
4.9E-02 3.0E-02 9.5E+00 9.6E+00
5.9E-02 3.6E-02 1.1E+01 1.2E+01
Mean 9.1E+00 9.3E+00
RSD (%) 15 14
5000 (ng/mL) 2.3E+01 1.4E+01 4.5E+03 4.6E+03
2.5E+01 1.7E+01 4.9E+03 5.5E+03
2.9E+01 1.6E+01 5.6E+03 5.1E+03
Mean 5.0E+03 5.1E+03
RSD (%) 11 9
20000 (ng/mL) 1.2E+02 6.3E+01 2.3E+04 2.0E+04
1.1E+02 6.9E+01 2.0E+04 2.2E+04
1.0E+02 5.7E+01 2.0E+04 1.8E+04
Mean 2.1E+04 2.0E+04
RSD (%) 9 9
Table 11: Calibrated concentration using the experimental calibration constant for buffer and
blood
41
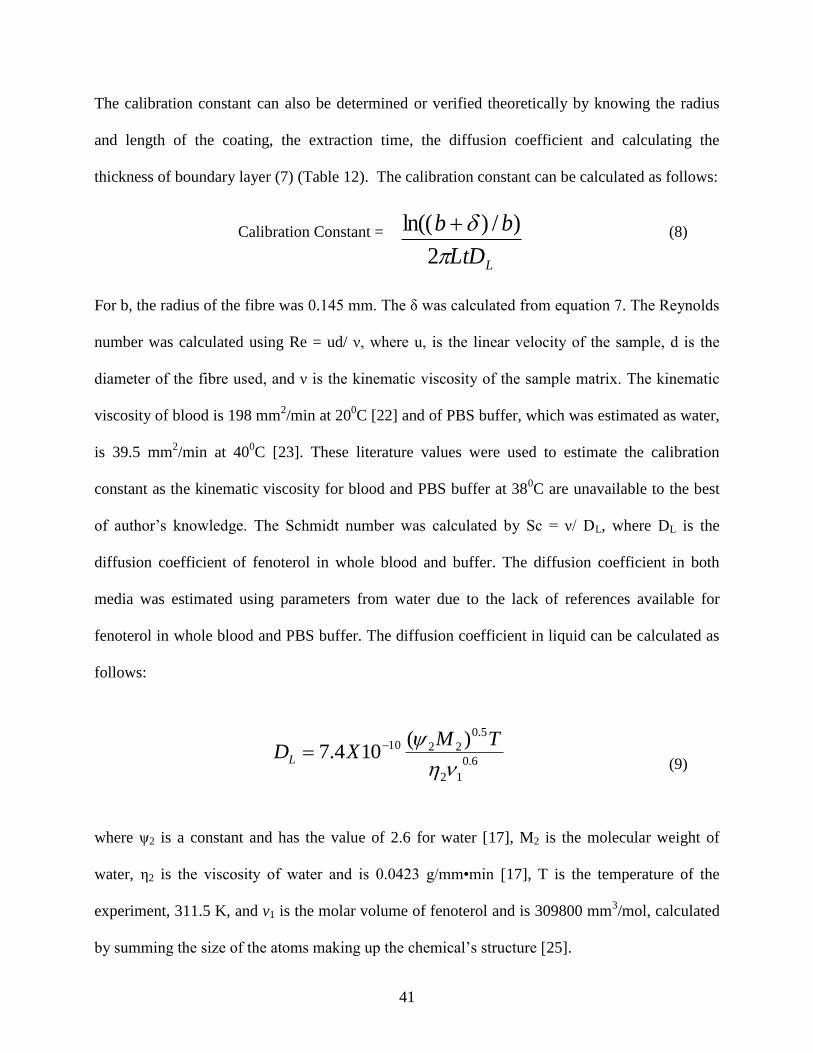
The calibration constant can also be determined or verified theoretically by knowing the radius
and length of the coating, the extraction time, the diffusion coefficient and calculating the
thickness of boundary layer (7) (Table 12). The calibration constant can be calculated as follows:
Calibration Constant = (8)
For b, the radius of the fibre was 0.145 mm. The δ was calculated from equation 7. The Reynolds
number was calculated using Re = ud/ ν, where u, is the linear velocity of the sample, d is the
diameter of the fibre used, and ν is the kinematic viscosity of the sample matrix. The kinematic
viscosity of blood is 198 mm2/min at 20
0C [22] and of PBS buffer, which was estimated as water,
is 39.5 mm2/min at 40
0C [23]. These literature values were used to estimate the calibration
constant as the kinematic viscosity for blood and PBS buffer at 380C are unavailable to the best
of author’s knowledge. The Schmidt number was calculated by Sc = ν/ DL, where DL is the
diffusion coefficient of fenoterol in whole blood and buffer. The diffusion coefficient in both
media was estimated using parameters from water due to the lack of references available for
fenoterol in whole blood and PBS buffer. The diffusion coefficient in liquid can be calculated as
follows:
(9)
where ψ2 is a constant and has the value of 2.6 for water [17], M2 is the molecular weight of
water, η2 is the viscosity of water and is 0.0423 g/mm•min [17], T is the temperature of the
experiment, 311.5 K, and v1 is the molar volume of fenoterol and is 309800 mm3/mol, calculated
by summing the size of the atoms making up the chemical’s structure [25].
LLtD
bb
2
)/)ln((
6.0
12
5.0
2210 )(104.7
TMXDL
42
Table 12: Parameters used to calculate calibration constant for fenoterol in blood and PBS buffer
Fenoterol Whole Blood PBS Buffer
Experimental (n=5) 320.4 ± 11 192.6 ± 14
Theoretical 304.2* 207.1*
Table 13: A comparison between experimental and theoretical calibration constant for fenoterol
in whole blood and PBS buffer *(The kinematic viscosity of water was taken to be at
400C and blood at 20
0C when the actual experimental temperature was 38
0C)
From Table 13, the theoretical calibration constant for fenoterol is very close to the range
of the determined experimental constant for whole blood and PBS. Sample calculation to obtain
the theoretical constant for fenoterol in blood is illustrated:
Calibration Constant =
b = Radius of fibre coating) = Diameter (mm)/ 2
= 290 μm / 2
= 0.145 mm
δ = boundary layer
Re = Reynolds number = ud
ν
u = linear velocity = r/A
r = sampling rate = 1.4 mL/min = 1400 mm3/min
A = area of interface = πr2 = π(1.1mm)
2
u = 1400 mm3/min
π (1.1mm)2
= 368.479 mm/min
d = diameter of fibre = 290 mm
ν = kinematic viscosity = 198 mm2/min
Fenoterol b
(mm)
δ
(K•min2/mm
3)
Re Sc
(mm4/min
2•K)
DL
(K•min/mm2)
L
(mm)
t
(min)
Blood 0.145 3.15E-4 0.540 1.05E10 1.89E-8 15 4
PBS buffer 0.145 2.14E-4 2.704 2.09E9 1.89E-8 15 4
LLtD
bb
2
)/)ln((
)Re/(52.9 38.062.0 Scb
43
Re = 368.29 mm/min (0.290mm)
198 mm2/min
= 0.540
Sc = Schmidt number = ν
DL
ν = kinematic viscosity = 198 mm2/min
DL = Diffusion coefficient
Ψ2 = constant =2.6 for water
M2 = Molecular weight = 18.0 g/mol for
water
T = 311.5 K
v 1 = molar volume of fenoterol
= 17(C) + 21(H) + 1(N) + 4(O) –2 rings
= 18(16.5) + 23(2) + 1(5.7) + 4(5.5) –
2(20.2)
= 309.8 cm3/mol = 309800 mm
3/mol
η2 = 0.0423 g/mm•min for water
DL
= 1.892 E -8 K min/mm2
Sc = 198 mm2/min
1.892 E -8 K min/mm2
= 1.047E10 mm4/ Kmin
2
= 3.15E-4 Kmin2/mm
3
Calibration Constant =
= 304.2 mm-3
6.0
12
5.0
2210 )(104.7
TMX
6.03
5.010
)/309800min)(/0423.0(
5.311)/0.186.2(104.7
molmmmmg
KmolgX
))min/10047.1()54.0(
145.0(52.9
38.02462.0 KmmE
mm
)min/8892.1(min4152
)145.0/)/min415.3145.0ln((2
32
mmKEmm
mmmmKEmm
44
Calibrated Concentration experimental calibration
constant(ng/mL)
Calibrated Concentration theoretical calibration
constant(ng/mL)
Concentrations Buffer Blood Buffer Blood
10 (ng/mL) 8.8E+00 9.0E+00 9.4E+00 8.6E+00
9.5E+00 9.6E+00 1.0E+01 9.2E+00
1.1E+01 1.2E+01 1.2E+01 1.1E+01
Mean 9.1E+00 9.3E+00 1.1E+01 9.6E+00
RSD (%) 15 14 14 13
5000 (ng/mL) 4.5E+03 4.6E+03 4.8E+03 4.4E+03
4.9E+03 5.5E+03 5.2E+03 5.2E+03
5.6E+03 5.1E+03 6.0E+03 4.9E+03
Mean 5.0E+03 5.1E+03 5.4E+03 4.9E+03
RSD (%) 11 9 11 9
20000 (ng/mL) 2.3E+04 2.0E+04 2.5E+04 1.9E+04
2.0E+04 2.2E+04 2.2E+04 2.1E+04
2.0E+04 1.8E+04 2.1E+04 1.8E+04
Mean 2.1E+04 2.0E+04 2.3E+04 1.9E+04
RSD (%) 9 9 9 9
Table 14: Comparison of calibrated concentrations obtained by experimental calibration constant
and theoretical calibration constant
From Table 14, results obtained by using the experimental calibration constant were more
accurate since the theoretical calibration constants were only estimated. However, the accuracy of
results predicted using theoretical calibration constant was also very good, indicating the
usefulness of this method.
In addition, for successful application of diffusion-based interface model calibration, two
requirements must be fulfilled: the concentration of the analyte in sorbent must be close to zero
in order for a concentration gradient to be constructed, and a constant agitation or sampling speed
is required to keep the boundary layer constant. For the first requirement, a prolonged extraction
time or extraction at equilibrium is detrimental since the sorbent concentration cannot be assumed
as zero. For the second requirement, because extraction is based on the concentration gradient
45
across the boundary layer, the size of the boundary layer must be kept constant during sampling
for an accurate calibration. In order to achieve a constant size of boundary layer, the speed of
agitation must be constant.
2.3.5 SPME Equilibrium Extraction
Equilibrium extraction was performed to compare with the three kinetic calibration
methods. Extractions were performed in whole blood and PBS buffer of 10, 5000, and 20000
ng/mL fenoterol using the flow-through system The extraction time was 1 hour using a syringe
pump with flow rate at 1.4 mL/min as this was the extraction time and flow rate to reach
equilibrium according to figure 13. To determine the initial concentration in the sample, external
calibration was used. The amount extracted at equilibrium versus concentration was plotted in
figure 15. The amount extracted ne was calculated using the graph in figure 15 and the following
weighted equation (reciprocal y square) (Table 15):
Linear
Range
(ng/mL)
Number
Of
Standards
Slope Standard
Error
Slope
+/-
Intercept
Standard
Error
Intercept
R2
Whole Blood 10-21,000 6 1.4E-2 1.8E-3 -2.7E-2 1.5E-2 0.9424
PBS buffer 10-21,000 6 3.2E-2 2.0E-4 9.7E-2 3.7E-2 0.9841
Table 15: Weighted equation using reciprocal y square for figure 15
The weighted equation was used since the y-intercept of the non-weighted equation was larger
than the amount extracted at 10 ng/mL. The calculated concentration using equilibrium SPME
are shown in the following table:
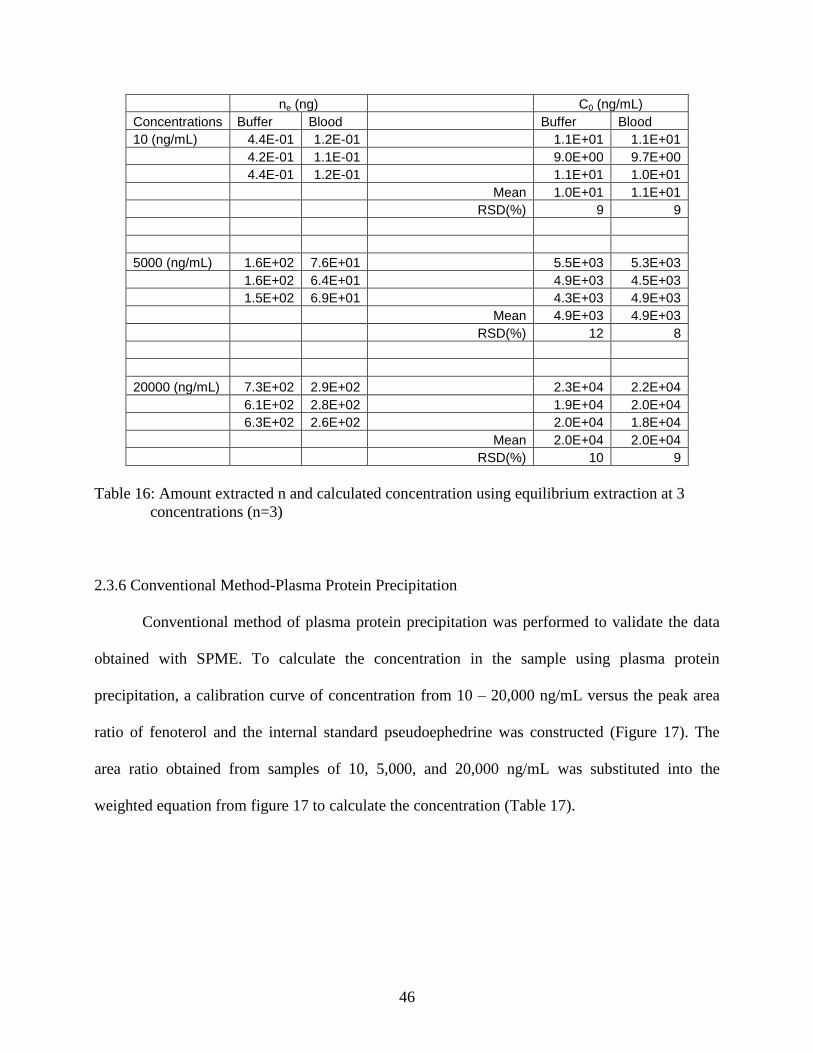
46
ne (ng) C0 (ng/mL)
Concentrations Buffer Blood Buffer Blood
10 (ng/mL) 4.4E-01 1.2E-01 1.1E+01 1.1E+01
4.2E-01 1.1E-01 9.0E+00 9.7E+00
4.4E-01 1.2E-01 1.1E+01 1.0E+01
Mean 1.0E+01 1.1E+01
RSD(%) 9 9
5000 (ng/mL) 1.6E+02 7.6E+01 5.5E+03 5.3E+03
1.6E+02 6.4E+01 4.9E+03 4.5E+03
1.5E+02 6.9E+01 4.3E+03 4.9E+03
Mean 4.9E+03 4.9E+03
RSD(%) 12 8
20000 (ng/mL) 7.3E+02 2.9E+02 2.3E+04 2.2E+04
6.1E+02 2.8E+02 1.9E+04 2.0E+04
6.3E+02 2.6E+02 2.0E+04 1.8E+04
Mean 2.0E+04 2.0E+04
RSD(%) 10 9
Table 16: Amount extracted n and calculated concentration using equilibrium extraction at 3
concentrations (n=3)
2.3.6 Conventional Method-Plasma Protein Precipitation
Conventional method of plasma protein precipitation was performed to validate the data
obtained with SPME. To calculate the concentration in the sample using plasma protein
precipitation, a calibration curve of concentration from 10 – 20,000 ng/mL versus the peak area
ratio of fenoterol and the internal standard pseudoephedrine was constructed (Figure 17). The
area ratio obtained from samples of 10, 5,000, and 20,000 ng/mL was substituted into the
weighted equation from figure 17 to calculate the concentration (Table 17).
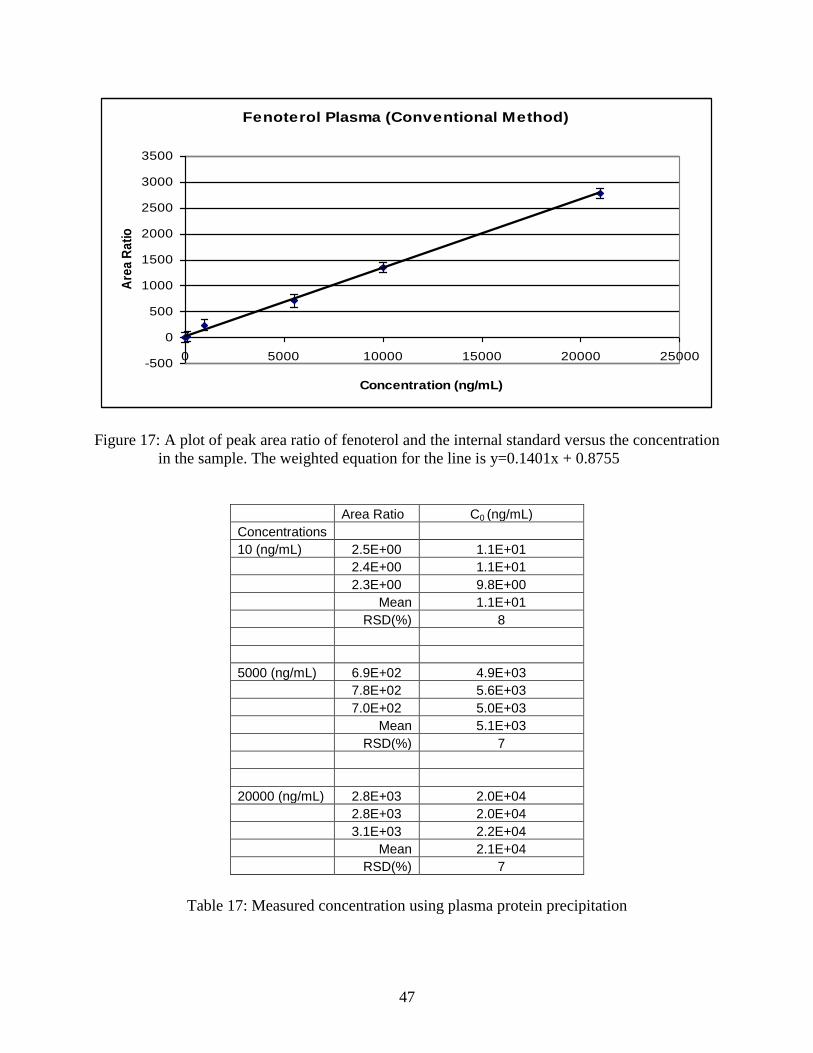
47
Fenoterol Plasma (Conventional Method)
-500
0
500
1000
1500
2000
2500
3000
3500
0 5000 10000 15000 20000 25000
Concentration (ng/mL)
Are
a R
ati
o
Figure 17: A plot of peak area ratio of fenoterol and the internal standard versus the concentration
in the sample. The weighted equation for the line is y=0.1401x + 0.8755
Area Ratio C0 (ng/mL)
Concentrations
10 (ng/mL) 2.5E+00 1.1E+01
2.4E+00 1.1E+01
2.3E+00 9.8E+00
Mean 1.1E+01
RSD(%) 8
5000 (ng/mL) 6.9E+02 4.9E+03
7.8E+02 5.6E+03
7.0E+02 5.0E+03
Mean 5.1E+03
RSD(%) 7
20000 (ng/mL) 2.8E+03 2.0E+04
2.8E+03 2.0E+04
3.1E+03 2.2E+04
Mean 2.1E+04
RSD(%) 7
Table 17: Measured concentration using plasma protein precipitation
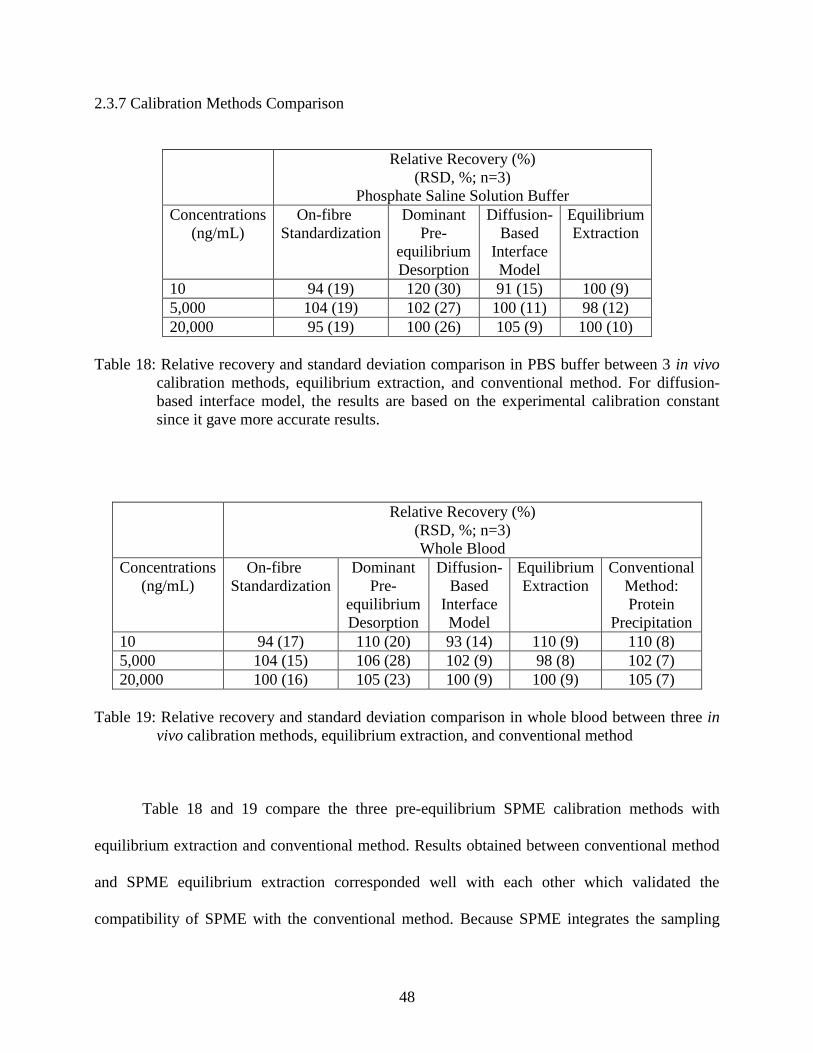
48
2.3.7 Calibration Methods Comparison
Relative Recovery (%)
(RSD, %; n=3)
Phosphate Saline Solution Buffer
Concentrations
(ng/mL)
On-fibre
Standardization
Dominant
Pre-
equilibrium
Desorption
Diffusion-
Based
Interface
Model
Equilibrium
Extraction
10 94 (19) 120 (30) 91 (15) 100 (9)
5,000 104 (19) 102 (27) 100 (11) 98 (12)
20,000 95 (19) 100 (26) 105 (9) 100 (10)
Table 18: Relative recovery and standard deviation comparison in PBS buffer between 3 in vivo
calibration methods, equilibrium extraction, and conventional method. For diffusion-
based interface model, the results are based on the experimental calibration constant
since it gave more accurate results.
Relative Recovery (%)
(RSD, %; n=3)
Whole Blood
Concentrations
(ng/mL)
On-fibre
Standardization
Dominant
Pre-
equilibrium
Desorption
Diffusion-
Based
Interface
Model
Equilibrium
Extraction
Conventional
Method:
Protein
Precipitation
10 94 (17) 110 (20) 93 (14) 110 (9) 110 (8)
5,000 104 (15) 106 (28) 102 (9) 98 (8) 102 (7)
20,000 100 (16) 105 (23) 100 (9) 100 (9) 105 (7)
Table 19: Relative recovery and standard deviation comparison in whole blood between three in
vivo calibration methods, equilibrium extraction, and conventional method
Table 18 and 19 compare the three pre-equilibrium SPME calibration methods with
equilibrium extraction and conventional method. Results obtained between conventional method
and SPME equilibrium extraction corresponded well with each other which validated the
compatibility of SPME with the conventional method. Because SPME integrates the sampling
49
procedure and sample preparation, it is a more time effective sampling method: after extraction,
each fibre was desorbed and the desorption solvent was injected directly into the instrument for
analysis. The conventional method required many sample preparation steps such as centrifugation
and vortexing before the sample could be injected into the instrument. PBS buffer is comparable
to protein-free plasma in terms of matrix effect due to the same ionic strength between the two
matrices. Musteata et al. had proven that when a drug was spiked into PBS and protein-free
plasma, the amount extracted was practically the same when using the same type of fibre and
sampling conditions. In addition, it was found that the pH of the protein-free plasma remained the
same when isotonic PBS was used to dilute protein-free plasma in a 10:1 ratio [26-27].
Therefore, the distribution constant of the fibre and the two matrices was the same due to similar
ionic strength.
When comparing on-fibre standardization and diffusion-based interface model, the
relative recoveries were very much comparable. However, standard deviation with using on-fibre
standardization was slightly higher than the diffusion-based interface model. This could be due to
the extra experimental steps required for loading of fibres prior to sampling for on-fibre
standardization. The diffusion-based interface model clearly offered an attractive alternative in
terms of fewer experimental steps and a cost-effective method since the analyte of interest can be
used as a standard for calibration and fewer fibres are required. In addition, the need for
additional experiments for calibration step can be eliminated altogether when the calibration
constant can be calculated. The main disadvantage for the diffusion-based interface model is the
need to control flow rate or the sampling speed to achieve a constant size of boundary layer. This
requirement is difficult in certain applications when connection to a pump for controlling of flow
rate is problematic. However, if sensitivity is not a problem, static extraction can also be
performed in order to eliminate the need for a pump.
50
Dominant pre-equilibrium desorption is a new developed technique that has been
successfully applied to fish muscle by Zhou et al. [16]. Comparing this calibration method with
the other two pre-equilibrium SPME calibration methods on the same system, this method had
the highest standard deviation for both whole blood and PBS buffer. Experimental errors were
incurred from the fibre loading procedures due to variability of fibres even within the same batch.
In addition to poorer precision, the time required was greater than the other two calibration
methods. This was because extraction had to be performed first to determine n, and a separate
experiment was required to determine q0 in order to decide on the loading concentration. In
addition, it was found by experiment that the sampling speed was also important for dominant
pre-equilibrium desorption. In order for isotropic relationship to exist between extraction and
desorption, all experimental parameters including sampling time, sample volume, temperature,
and sampling speed for the two processes must be the same unless sampling was performed
under static condition. This was different from on-fibre standardization since the two processes,
extraction and desorption, occurred simultaneously in the same sample with the use of a single
fibre.
51
2.4 Conclusions
In this research, three in vivo SPME calibration methods were compared on a flow-
through system. They were evaluated in terms of precision, accuracy and experimental
procedures, and were validated by equilibrium SPME extraction and a conventional method. All
three calibration methods had comparable accuracy and the diffusion-based interface model had
the highest precision. In addition, it did not require any other standard besides the analyte of
interest and the number of fibres used for calibration was smaller in comparison with the other
two calibration methods. However, a disadvantage of the diffusion-based interface model was the
requirement of constant sampling rate and therefore required a pump to perform any extraction.
In the case where the control of sampling rate is impossible, on-fibre standardization, which had a
comparable accuracy as diffusion-based interface model, may be the next best alternative. Since
desorption and extraction occurred simultaneously on one fibre, desorption was used to calibrate
extraction. Dominant pre-equilibrium desorption has the same calibration principle as on-fibre
standardization, however, it had the lowest precision. This could be due to the excessive number
of fibre required which increased both error and cost. Since the sampling area, or the interface,
was too small to fit both an extraction and a desorption fibre, two separate experiments were
performed for extraction and desorption. This required more time and further reduced the
precision of the results in comparison to on-fibre standardization. Therefore, based on this
research, diffusion-based interface model had the most favorable results with the least
experimental procedures. This clearly suggests potential use of diffusion-based interface model
for future in vivo SPME studies.
52
Chapter 3: Pharmacokinetic studies of fenoterol and methoxyfenoterol in rats using semi-
automated in vivo solid-phase microextraction sampling and diffusion-based interface
calibration model
3.1 Overview
SPME can be used to sample circulating blood of animals without the need to withdraw a
representative blood sample. In this study, in vivo SPME in combination with liquid-
chromatography tandem mass spectrometry was used for pharmacokinetic studies of two drug
analytes: fenoterol and methoxyfenoterol on five rats. This research illustrates, for the first time,
the feasibility of a diffusion-based interface model calibration for in vivo SPME studies. To
provide a constant sampling rate as required for the diffusion-based interface model, partial
automation of SPME animal sampling was accomplished using Accusampler®, an instrument
capable of automated repetitive blood sampling from rats. The use of the Accusampler® with a
custom-written program allowed the automation of all in vivo SPME steps except the insertion
and removal of the SPME probe. Each semi-automated in vivo SPME sampling was followed by
automatic blood draw in order to enable the comparison of SPME results to traditional analysis
based on blood withdrawal and plasma-protein precipitation. The results obtained show good
agreement between SPME and the conventional method, indicating the utility of the proposed
method. In addition, in vivo SPME allowed the monitoring of the metabolite methoxyfenoterol
glucuronide, which could not be detected using the traditional plasma protein precipitation
method. The proposed diffusion-based interface model has several advantages over other kinetic
calibration models for in vivo sampling including: (i) It does not require any addition of standard
into the sample matrix during in vivo studies, (ii) it is simple, rapid and eliminates the need to
pre-load appropriate standard into SPME extraction phase and (iii) the calibration constant can be

53
calculated based on the diffusion coefficient, extraction time, fibre length and radius, and size of
the boundary layer. In the current study, the experimental calibration constants of 338.9±30mm-3
and 298.5±25 mm-3
showed excellent agreement with the theoretical calibration constants of
304.2 mm-3
and 315.3 mm-3
for fenoterol and methoxyfenoterol, respectively.
54
3.2 Background
Asthma, a chronic inflammatory disease of the airways, is a growing public concern since
it is one of the most prevalent chronic diseases with more than 100 million sufferers worldwide
according to statistics from Asthma Society of Canada [1]. Consequently, much effort and
resources are put into research of asthma medications each year in the hope of discovering new
active compounds to target the disease.
Fenoterol, 5-[1-hydroxy-2-[[2-(4-hydroxyphenyl)-1-methylethyl]-amino]ethyl]-1,3-
benzenediol, is a β2-adrenoceptor (β2-AR) agonist that is used for the treatment of asthma and
congestive heart failure [2-3]. The prescriptive fenoterol is a racemic mixture of (R,R)-fenoterol
and (S,S)-fenoterol. However, previous preclinical studies, cellular membrane affinity
chromatography studies and cardiomyocyte binding and contraction assays, conducted by
Wainer’s group at National Institute of Health (NIH), have demonstrated that (S,S)-fenoterol is
essentially inactive at the receptor while (R,R)-fenoterol is responsible for the β2-AR agonist
activity [3]. Additionally, the data from these studies have shown that (R,R)-methoxyfenoterol, a
fenoterol derivative, has the same activity as (R,R)-fenoterol at the β2-AR. Thus, it was proposed
that (R,R)-methoxyfenoterol could also be used as asthma and heart failure medication. In this
research, a comparative pharmacokinetic study of (R,R)-fenoterol and (R,R)-methoxyfenoterol
was conducted.
In designing a preclinical study, the sensitivity of the bioanalytical assay is a primary
concern. This is especially true with low bioavailability drugs such as fenoterol, with an
incomplete absorption and extensive metabolism via phase II pathways [2, 4]. Therefore, the
success of the study is greatly dependent on method selection. The first pharmacokinetic study of
fenoterol on rats was performed by Koster et al. where fenoterol was extracted by ion-pair
55
extraction into ethyl acetate using BIS as a pairing agent after various routes of administration
[4]. Recently, Siluk et al. performed plasma-concentration time analysis on fenoterol using solid
phase extraction (SPE) [2], and Kim et al. developed an online immunoextraction method for
better sensitivity and specificity extraction of fenoterol [5]. However, all these methods measured
the drug concentration in plasma samples which require collection of blood samples of at least
0.150 mL [5] and further processed to plasma.
Since the invention of SPME, a novel sampling technique, in vivo studies such as drug
dosing and pharmacokinetics have been made simpler with the integration of sampling and
sample preparation [6]. SPME allows direct extraction of a drug circulating in animal blood
without the need to withdraw any blood sample. This eliminates the need to separate plasma from
whole blood, speeds up overall sample preparation time and minimizes inadvertent analyte losses
during sample preparation because the number of sample handling steps is greatly reduced. Most
importantly, SPME allows the monitoring of free or unbound concentrations of drug analyte
where most conventional methods offer the total concentrations [7-8]. Measurement of free
concentration is important as it is the unbound drug analyte that determines its efficacy.
The main objective of this research was to apply the diffusion-based interface calibration
model for the first time to in vivo SPME pharmacokinetic studies in rats. However, initial
pharmacokinetic studies performed on rats using in vivo SPME relied on a polyurethane interface
connected to the carotid artery catheter and manual assisted agitation using push-pull method
with a syringe [9]. This type of manual sampling would not provide sufficiently uniform agitation
to enable the use of diffusion-based interface calibration, so in current research the process of in
vivo SPME sampling was further automated using AccuSampler®, a commercial instrument
automated for repetitive blood sampling, The automated system allowed for a much easier
sampling procedure, minimal animal contact, and provided uniform and reproducible flow rates
56
within the tubing which permitted the use of diffusion-based interface calibration model for in
vivo SPME studies for the first time. The model was successfully applied to comparative
pharmacokinetic study of fenoterol and methoxyfenoterol on five rats. In addition, a conventional
method based on blood withdrawal was performed to validate the SPME data obtained.
3.3 Materials and methods
3.3.1 Materials
(R,R)-Fenoterol and (R,R)-methoxyfenoterol were obtained from National Institute of
Health (Baltimore, MD, US). Pseudoephedrine and ammonium acetate were purchased from
Sigma-Aldrich (St. Louis, MO, US). The standards were diluted to different concentrations either
in methanol for instrument calibration or PBS pH 7.4, for in vitro experiments. HPLC grade
acetonitrile and methanol were purchased from Fisher Scientific (Fair Lawn, NJ, US). Fresh rat
whole blood (sodium heparin as anticoagulant) and plasma were obtained from NoAb
BioDiscoveries Inc. (Mississauga, ON, Canada). Rat whole blood was maintained at 40C for
maximum 1 week and plasma was kept frozen at -200C until use. Deionized water was obtained
from a Barnstead/Thermodyne Nano-pure ultrapure water system (Dubuque, IA, US).
3.3.2 LC-MS/MS Assay- Please see section 2.2.2
3.3.3 In Vitro SPME Method Development- Please see section 2.2.3
57
3.3.4 Animal Experiments
Ten conscious Sprague-Dawley rats (Charles River Labs, St. Constant, PQ, Canada)
weighing approximately 300 g were used to conduct in vivo experiments: five rats for fenoterol
and five for methoxyfenoterol. Animals were conscious and freely moving throughout the study.
The catheter from the animal was linked to the AccuSampler® tubing system (Dilab,
Lund, Sweden). Rats were administered 5 mg/kg of either fenoterol or methoxyfenoterol. At each
time point, a pre-conditioned, sterile SPME device was inserted by piercing the septum of the
interface and only the coated portion of the wire housed inside the hypodermic needle was
exposed to the flowing blood. The flow rate of the pump was 1.4 mL/min which was well below
normal blood flow rate in the rat carotid artery for minimal disturbance. The push-pull volume
was 0.35 mL. After sampling, the blood was returned to the animal and the catheter was flushed
with saline to compensate for the lost blood to maintain fluid balance within the animal. For each
time point, two samplings were performed: SPME sampling was performed first followed by
blood withdrawal of 0.2 mL for conventional plasma analysis
3.3.5 In Vivo SPME Procedure
Before drug administration, a zero time probe analysis was performed followed by blood
draw (0.2 mL). Drug concentration was monitored for 6 hours at time points 3, 15, 30, 60, 120,
180, 240, 300, and 360 minutes. After 4 minutes of extraction, the probe was removed from the
interface and quickly rinsed with water to prevent blood clotting at the tip of the hypodermic
needle. Residual water on the fibre was blotted lightly with a Kimwipe tissue. The SPME probes
were stored at -200C until analysis was performed. A new fibre was used for each time point.
The probes collected were desorbed in 0.1 mL inserts with desorption solvent for 1 hour
with vortex (2400 rpm). A 0.01 mL portion of pseudoephedrine (50 ng/mL) was added and the
58
resulting solution was vortexed manually. A 0.02 mL portion was injected for analysis using the
chromatographic conditions as stated in section 2.2.2.
3.3.6 Conventional Plasma Sampling and Analysis
For validation purposes, 0.2 mL blood was withdrawn after SPME sampling. The time
points when blood draws were performed were 7, 19, 34, 64, 124, 184, 244, 304, 364 min. The
blood sample was subsequently centrifuged (6700 rpm, 5 min, 40C) and plasma was isolated and
frozen at -200C in 2 mL cryovials (Wheaton Science Products, Millville, NJ, US) until analysis.
For analysis, protein precipitation was first performed. 0.08 mL of plasma was mixed with 0.30
mL of HPLC grade acetonitrile in conical centrifuge vials. After vortex mixing (2400 rpm, 5
min) and centrifugation (14,000 rpm, 10 min, 40C), 0.01 mL of the supernatant was transferred to
a 0.1 mL insert (Supelco, Bellefonte, PA, US) followed by an addition of 0.09 mL of desorption
solvent for dilution and 0.01 mL of pseudoephedrine (50 ng/mL) as internal standard to control
for injection volume variation. The resulting solution was vortexed manually and 0.02 mL was
injected for analysis using the chromatographic conditions as stated in section 2.2.2.
3.3.7 Calibration Methods
For diffusion-based interface model calibration, the diffusion constant was determined
using 100 ng/mL of 10 mL whole blood sample (n=5 determinations). The blood sample was
incubated at 370C and sampling was performed with the AccuSampler® pump using the same
sampling parameters as the in vivo studies on the animals. The determined diffusion-based
constant was applied to calculate the circulated concentration at each time point.
59
3.4 Results and Discussions
3.4.1 Calibration Method - Diffusion-based Interface Model
For the diffusion-based interface model, the calibration constant was obtained by
performing SPME procedure in rat whole blood spiked with known amount of fenoterol or
methoxyfenoterol. To mimic the actual in vivo experiment, 10 mL whole blood of 100 ng/mL
fenoterol or methoxyfenoterol was incubated at 370C and all other sampling parameters i.e.
sampling rate and extraction time remained the same. Using the amount extracted and the known
concentration in the sample, the calibration constant can be determined. Extractions were
performed five times to obtain a better precision.
The theoretical calibration constant was determined similar to section 2.3.4.
Table 20: Parameters used to calculate calibration constant for fenoterol and methoxyfenoterol.
Sc= ν/DL, where ν is the kinematic viscosity of water, and Re = ud/ν, where u is the
linear velocity of the sample and d is diameter of the fibre used.
The radius of the fibre was 0.145 mm. All parameters, including the kinematic viscosity
of blood, sampling time, and temperatures, were the same as section 2.3.4. The molar volume to
calculate the diffusion coefficient was calculated by summing the size of the atoms making up the
chemical’s structure [10]. For fenoterol, the molar volume is 309800 mm3/mol and 330300
mm3/mol for methoxyfenoterol.
b
(mm)
δ
(K•min2/mm
3)
Re Sc
(mm4/min
2•K)
DL
(K•min/mm2)
L
(mm)
t
(min)
Fenoterol 0.145 3.15E-4 0.540 1.05E10 1.89E-8 15 4
Methoxyfenoterol 0.145 3.14E-4 0.540 1.09E10 1.82E-8 15 4
60
Experimental
(n = 5)
(mm-3
)
Theoretical
(mm-3
)
Fenoterol 338.9 ± 30 304.2
Methoxyfenoterol 298.5 ± 25 315.3
Table 21: A comparison between experimental and theoretical calibration constant for fenoterol
and methoxyfenoterol
Similar to the diffusion-based interface model calibration performed in chapter 2, the theoretical
calibration constant for both fenoterol and methoxyfenoterol is either within or very close to the
range of the determined experimental constant.
In terms of the calibration method, the diffusion-based interface model is convenient as it
does not require any addition of standard. If literature values can be accessed easily, the
calibration constant can be calculated and the calibration step can be omitted altogether. In the
case where the values for the parameters can only be estimated, as in the case for fenoterol and
methoxyfenoterol since these analytes are not well researched, a calibration constant obtained
experimentally may be more accurate. Nevertheless, the calibration method for the diffusion-
based interface model is simple and therefore offers an attractive alternative to other previously
used pre-equilibrium calibration methods
3.3.2 Pharmacokinetic Profiles
The sampling procedures employed for in vivo SPME were much simpler compared to
previous pharmacokinetic studies on rats [9]. Since the interface was connected to the
Accusampler® instead of on the nape of the animal’s neck, direct handling of the animal during
sampling was avoided. In addition, during the sampling time of 4 minutes, the animal was
allowed to move freely in the cage where as in the previous pharmacokinetic studies, the animal
61
was held by the analyst during the time of extraction (Figure 18). This causes extra stress on the
animal during the experiment and might have possible effect on the accuracy of the results.
Figure 18: Connection of Accusampler ® with a rat [11]
The fenoterol (Figure 21) and methoxyfenoterol (Figure 22) concentration versus time profiles
obtained by SPME sampling which measured the concentrations in whole blood were validated
by conventional method, protein precipitation, which measured the analyte concentrations in
plasma. The distribution of fenoterol and methoxyfenoterol are different in plasma and whole
blood. Therefore, the results from plasma and whole blood cannot be compared directly for drugs
whose red blood cell (RBC) to plasma partition ratio is different from 1. In current study, the
RBC to plasma partition ratio was determined for fenoterol and methoxyfenoterol using SPME.
62
Extractions were performed in SPME and plasma sample spanning the circulated concentration
for fenoterol and methoxyfenoterol. The RBC-plasma partition ratio was determined by the ratio
of the slope plotted with concentration against the amount extracted (Figure 19, 20).
Methoxyfenoterol- Blood to plasma ratio
y = 2.1E-2x + 5.0E-1
R2 = 0.9986
y = 9.9E-3x + 1.8E0
R2 = 0.9976
-100
0
100
200
300
400
500
0 5000 10000 15000 20000 25000
Concentrations (ng/mL)
Am
ou
nt
Ex
tra
cte
d (
ng
)
Whole Blood Plasma
Figure 19: Determination of blood to plasma ratio of methoxyfenoterol using the slope of
concentration versus amount extracted
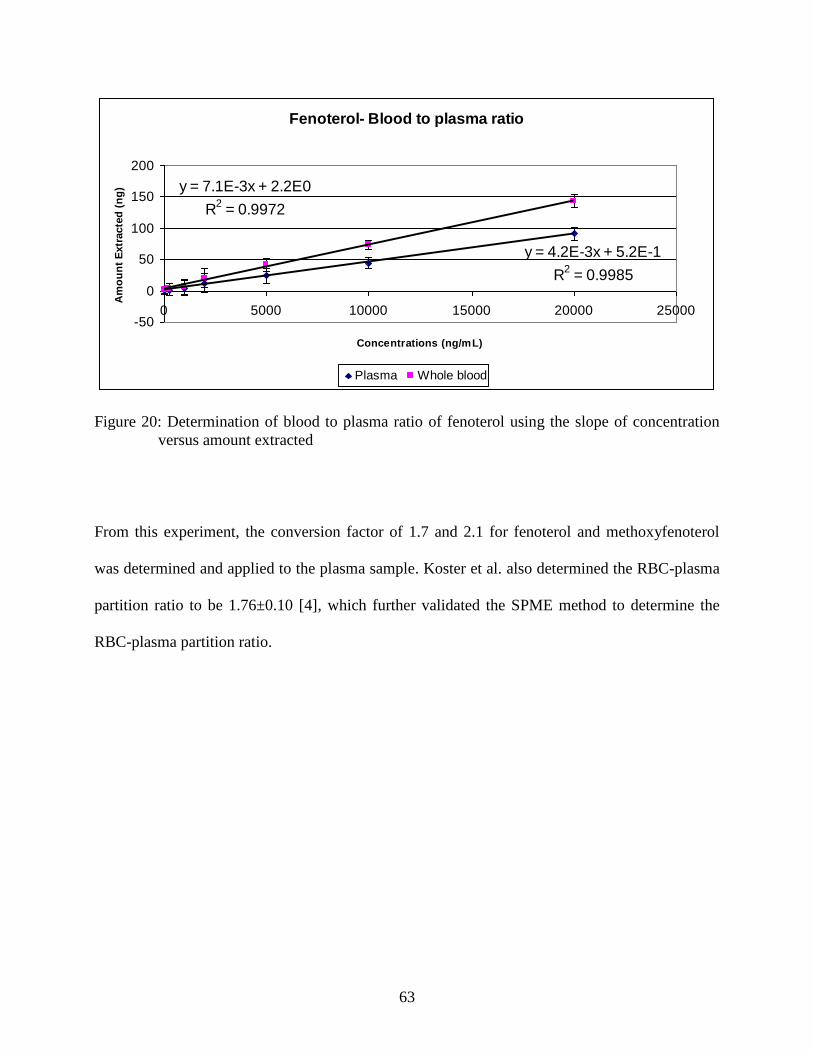
63
Fenoterol- Blood to plasma ratio
y = 7.1E-3x + 2.2E0
R2 = 0.9972
y = 4.2E-3x + 5.2E-1
R2 = 0.9985
-50
0
50
100
150
200
0 5000 10000 15000 20000 25000
Concentrations (ng/mL)
Am
ou
nt
Extr
acte
d (
ng
)
Plasma Whole blood
Figure 20: Determination of blood to plasma ratio of fenoterol using the slope of concentration
versus amount extracted
From this experiment, the conversion factor of 1.7 and 2.1 for fenoterol and methoxyfenoterol
was determined and applied to the plasma sample. Koster et al. also determined the RBC-plasma
partition ratio to be 1.76±0.10 [4], which further validated the SPME method to determine the
RBC-plasma partition ratio.
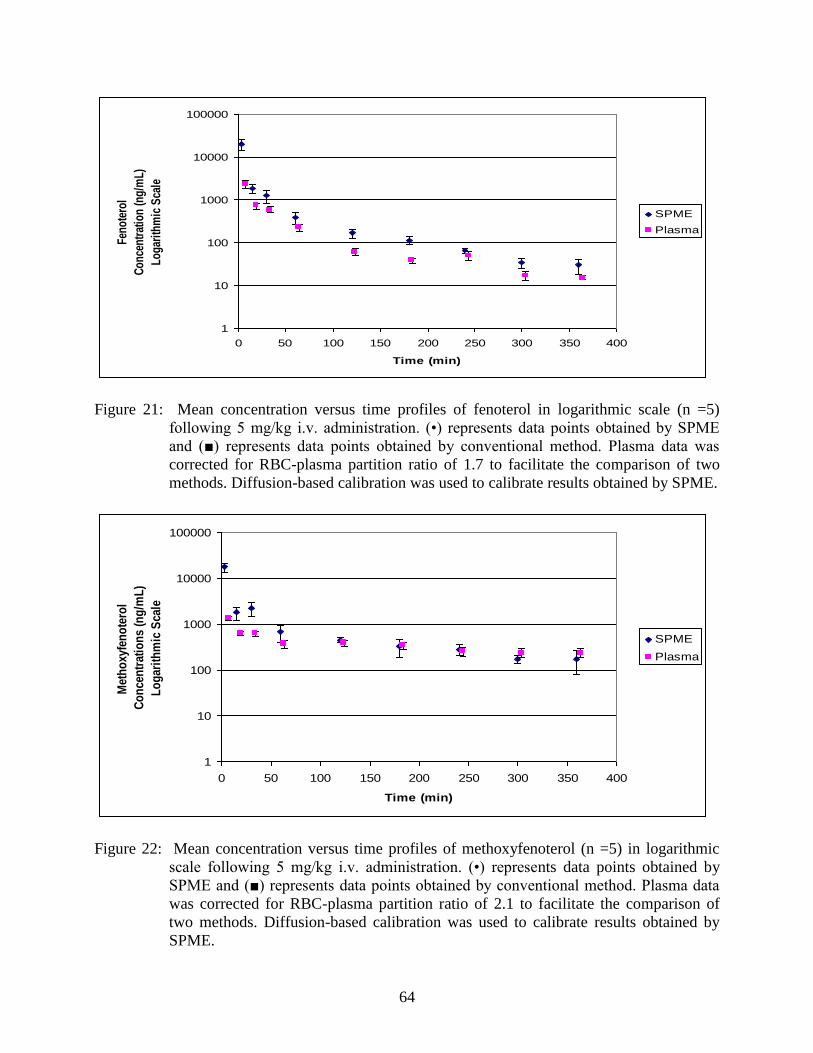
64
1
10
100
1000
10000
100000
0 50 100 150 200 250 300 350 400
Time (min)
Feno
tero
l
Con
cent
rati
on (
ng/m
L)
Loga
rith
mic
Sca
le
SPME
Plasma
Figure 21: Mean concentration versus time profiles of fenoterol in logarithmic scale (n =5)
following 5 mg/kg i.v. administration. (•) represents data points obtained by SPME
and (■) represents data points obtained by conventional method. Plasma data was
corrected for RBC-plasma partition ratio of 1.7 to facilitate the comparison of two
methods. Diffusion-based calibration was used to calibrate results obtained by SPME.
1
10
100
1000
10000
100000
0 50 100 150 200 250 300 350 400
Time (min)
Met
ho
xyfe
no
tero
l
Co
nce
ntr
atio
ns
(ng
/mL
)
Lo
gar
ith
mic
Sca
le
SPME
Plasma
Figure 22: Mean concentration versus time profiles of methoxyfenoterol (n =5) in logarithmic
scale following 5 mg/kg i.v. administration. (•) represents data points obtained by
SPME and (■) represents data points obtained by conventional method. Plasma data
was corrected for RBC-plasma partition ratio of 2.1 to facilitate the comparison of
two methods. Diffusion-based calibration was used to calibrate results obtained by
SPME.
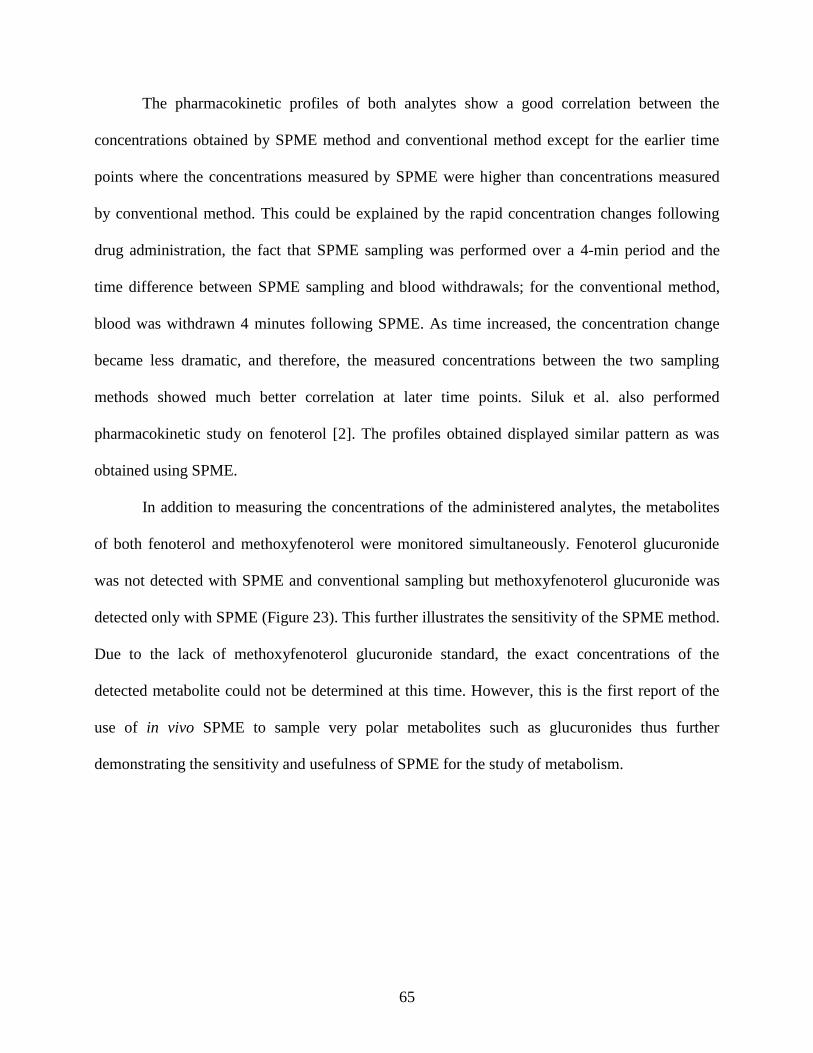
65
The pharmacokinetic profiles of both analytes show a good correlation between the
concentrations obtained by SPME method and conventional method except for the earlier time
points where the concentrations measured by SPME were higher than concentrations measured
by conventional method. This could be explained by the rapid concentration changes following
drug administration, the fact that SPME sampling was performed over a 4-min period and the
time difference between SPME sampling and blood withdrawals; for the conventional method,
blood was withdrawn 4 minutes following SPME. As time increased, the concentration change
became less dramatic, and therefore, the measured concentrations between the two sampling
methods showed much better correlation at later time points. Siluk et al. also performed
pharmacokinetic study on fenoterol [2]. The profiles obtained displayed similar pattern as was
obtained using SPME.
In addition to measuring the concentrations of the administered analytes, the metabolites
of both fenoterol and methoxyfenoterol were monitored simultaneously. Fenoterol glucuronide
was not detected with SPME and conventional sampling but methoxyfenoterol glucuronide was
detected only with SPME (Figure 23). This further illustrates the sensitivity of the SPME method.
Due to the lack of methoxyfenoterol glucuronide standard, the exact concentrations of the
detected metabolite could not be determined at this time. However, this is the first report of the
use of in vivo SPME to sample very polar metabolites such as glucuronides thus further
demonstrating the sensitivity and usefulness of SPME for the study of metabolism.
66
0.00
0.05
0.10
0.15
0.20
0.25
0.30
0.35
0.40
0.45
0 10 20 30 40 50 60 70
Time (min)
Are
a R
ati
o
Meth
oxyfe
no
tero
l G
luco
rin
de
Rat 1
Rat 2
Figure 23: Detection of methoxyfenoterol glucuronide (n=2) simultaneously with
methoxyfenoterol. The presence of methoxyfenoterol glucuronide was only detected
at the first 4 time points i.e. 3, 15, 30, and 60 minutes for both rats.
67
3.4 Conclusions
Diffusion-based interface model calibration and the use of an automated SPME blood
sampler, AccuSampler®, were successfully applied for the first time to in vivo SPME. Use of the
AccuSampler® simplified the extraction procedures and minimized direct contact with the
animal during the experiment. In addition, it provided a constant blood flow into the interface for
extraction, a requirement for diffusion-based interface model calibration. Diffusion-based
interface model calibration, unlike previously used kinetic calibration, does not require any other
deuterated or radioactive compounds as standards and does not require any pre-loading steps
prior to in vivo experiments. The calibration constant can be estimated using theoretical
calculations and parameters obtained from literature or can simply be determined by extraction
with a known concentration sample and using the same sampling parameters as the actual in vivo
experiments. Therefore, this calibration approach not only extends the applicability of pre-
equilibrium in vivo SPME to situations where no appropriate standard is available, but also
greatly simplifies or even eliminates the need for experimental calibration.
68
References
CHAPTER 1
[1]Pawliszyn, J., Solid Phase Microextraction: Theory and Practice; Wiley: New York, 1997
[2]Lord, H.; Pawliszyn, J. J. Chromatogr., A. 2000, 902, 17-63
[3] Musteata, F.M.; Pawliszyn, J. J. Biochem. Biophys. Methods 2007, 70(2), 181-193.
[4] Lord, L.H.; Grant, P.R.; Walles, M.; Incledon, B.; Fahie, B.; Pawliszyn, J. Anal. Chem. 2003,
75 (19), 5103- 5115.
[5] Musteata, F.M.; Musteata, M.L.; Pawliszyn, J. Clin. Chem. 2005, 52(4), 708-715.
[6] Es-haghi, A.; Zhang, X.; Musteata, F.M.; Bagheri, H.; Pawliszyn, J. Analyst 2007, 132, 672-
678
[7] Musteata, F.M.; De Lannoy, I.; Gien, B.; Pawliszyn, J. J. Pharm. Biomed. Anal. 2008, 907-
912
[8] Zhou, S.N.; Oakes, K.D.; Servos, M.R.; Pawliszyn, J. Environ. Sci. Technol. 2008, 42, 6073-
6079.
[9] Schubert J.K., Miekisch W., Fuchs P., Scherzer N., Lord H., Pawliszyn J., Mundkowski R.G.,
Clin. Chim. Acta, 2007, 386, 57-62
[10] Vuckovic, D.; Shirey, R.; Chen, Y.; Sidisky, L.; Aurand, C.; Stenerson, K.; Pawliszyn, J.
Anal. Chim. Acta 2009, 638(2), 175-185
[11] Ai, J. Anal. Chem. 1997, 69 (6), 1230-1236
[12] Ouyang, G.; Pawliszyn, J. Anal. Chim. Acta 2008, 627(2), 184-197
[13] Chen, Y.; O’Reilly, J.; Wang, Y.; Pawliszyn, J. Analyst 2004, 129, 702-703
[14] Bragg, L.; Qin, Z.; Alaee, M.l Pawliszyn, J. J. Chromatogr. A 2006, 1124, 112-120
[15] Zhang, X.; Es-haghi, A.; Musteata, F.M.; Ouyang, G.; Pawliszyn, J. Anal. Chem. 2007,
79(12), 4507-4513
[16] Ouyang, G.; Pawliszyn, J. Anal. Chem. 2006, 78, 5783-5788
[17] Ouyang, G.; Zhao, W.; Pawliszyn, J. Anal. Chem. 2005, 77, 8122-8128
69
[18] Zhou, S. N.; Zhao, W.; Pawliszyn, J. Anal. Chem. 2008, 80(2), 481-490
[19] Pawliszyn, J., Handbook of Solid Phase Microextraction; Department of Chemistry,
University of Waterloo: Waterloo, 2008
[20] Sukola K.; Koziel J.; Augusto F.; Pawliszyn J. Anal Chem. 2001, 73, 13-18
[21] Paschke, A.; Popp, P. J Chromatogr. A 2004, 1025, 11-16
[22] Koziel, J.; Jia, M.; Pawliszyn, J. Anal. Chem. 2000, 72(21), 5178-5186
CHAPTER 2
[1] Kim, H.S.; Siluk, D.; Wainer, I.W. J. Chromatogr. A. 2008 Article in Press
[2] Rahman, T.F., Thesis: Preparation and Assessment of SPME probes Based on Pyrrole
Derivatives; Department of Chemistry, University of Waterloo: Waterloo, 2007
[3] Zhang, X.; Es-haghi, A.; Musteata, F.M.; Ouyang, G.; Pawliszyn, J. Anal. Chem. 2007,
79(12), 4507-4513
[4] Zhou, S. N.; Zhao, W.; Pawliszyn, J. Anal. Chem. 2008, 80(2), 481-490
[5] Vuckovic, D.; Shirey, R.; Chen, Y.; Sidisky, L.; Aurand, C.; Stenerson, K.; Pawliszyn, J. Anal.
Chim. Acta 2009, 638(2), 175-185
[6] Musteata, M.; De Lannoy, I.; Gien, B.; Pawliszyn, J. Pharm. Biomed. Anal. 2008, 47, 907-
912
[7] Kim, H.S.; Siluk, D.; Wainer, I.W. J. Chromatogr. A. 2008 Article in Press
[8] Ouyang, G.; Pawliszyn, J. Anal. Chim. Acta 2008, 627(2), 184-197
[9] Chen, Y.; Pawliszyn, J. Anal. Chem. 2004, 76(19), 5807-5815
[10] Chen, Y.; O’Reilly, J.; Wang, Y.; Pawliszyn, J. Analyst 2004, 129, 702-703
[11] Wang, Y.; O’Reilly, J.; Chen, Y.; Pawliszyn, J. Chromatogr. A 2005, 1072, 13-17
[12] Ouyang, G.; Zhao, W.; Pawliszyn, J. Anal. Chem. 2005, 77, 8122-8128
[13] Zhao, W.; Ouyang, G.; Alaee, M.; Pawliszyn, J. Chromatogr. A 2006, 1124, 112-120
70
[14] Zhou, S. N.; Zhao, W.; Pawliszyn, J. Anal. Chem. 2008, 80(2), 481-490
[15] Zhang, X.; Cudjoe, E.; Vuckovic, D.; Pawliszyn, J. J. Chromatogr. A. 2009 Article in Press
[16] Zhou S.N.; Oakes, K.D.; Servos, M.R.; Pawliszyn, J. Environ. Sci. Technol. 2008, 42, 6073-
6079
[17] Pawliszyn, J., Solid Phase Microextraction: Theory and Practice; Wiley: New York, 1997
[18] Pawliszyn, J., Handbook of Solid Phase Microextraction; Department of Chemistry,
University of Waterloo: Waterloo, 2008
[19] Sukola K.; Koziel J.; Augusto F.; Pawliszyn J. Anal Chem. 2001, 73, 13-18
[20] Paschke, A.; Popp, P. J Chromatogr. A 2004, 1025, 11-16
[21] Koziel, J.; Jia, M.; Pawliszyn, J. Anal. Chem. 2000, 72(21), 5178-5186
[22] Mongrain, R.; Brunette, J.; Tardif, J.C.; Bertrand, O.F. J. Biomech. Eng. 2004, 126(4), 529-
535
[23] The Engineering Toolbox: Dynamic and Kinetmatic Viscosity of Water in SI Units,
http://www.engineeringtoolbox.com/water-dynamic-kinematic-viscosity-d_596.html
(Accessed, April 2009)
[25] Schwarenbach, R., Gschwend P., Imboden, D., Eds Environmental Organic Chemistry; John
Wiley & Sons Inc: New York, 1993
[26] Musteata, M., Pawliszyn, J., Qian, M., Wu, J., Miwa, G. J. Pharm. Sci. 2006, 95(8), 1712-
1722
[27] Musteata, M, Pawliszyn, J. J. Proteome Res. 2005, 4(3), 789-900
CHAPTER 3
[1] Asthma facts and statistics, Asthma Society of Canada
http://www.asthma.ca/corp/newsroom/pdf/asthmastats.pdf (Accessed Feb, 2009)
[2] Siluk D.; Kim H.S.; Cole, T.; Wainer, I.W. J Pharm. Biomed. Anal. 2008, 48, 960-964
[3] Jozwiak, K.; Khalid, C.; Tanga, M.J.; Berzetei-Gurske I.; Jimenez, L.; Kozocas, J.A.; Woo,
A.; Zhu, W.; Xiao, R.; Abernethy, D.R.; Wainer, I.W. J. Med. Chem. 2007, 50 (12), 2903-
2915
71
[4] Koster, A, Sj.; Hofman, G.A.; Frankhuizen-Sierevogel A.C.; Noordhoek, J. Drug metabolism
and disposition. 1985, 14 (4), 464-469
[5] Kim, H.S.; Siluk, D.; Wainer, I.W. J. Chromatogr. A. 2008 Article in Press
[6] Lord, H.L.; Grant, R.P.; Walles, M.; Incledon, B.; Fahie, B.; Pawliszyn J, Anal. Chem. 2003,
75(19), 5103-5115
[7] Musteata, F.M.; Musteata, M.L.; Pawliszyn, J. Clin. Chem. 2005, 52(4), 708-715
[8] Musteata, F.M.; Pawliszyn, J. Trends Anal. Chem. 2007, 26(1), 36-45
[9] Musteata, M.; De Lannoy, I.; Gien, B.; Pawliszyn, J. Pharm. Biomed. Anal. 2008, 47, 907-
912
[9] Pawliszyn, J., Solid Phase Microextraction: Theory and Practice; Wiley: New York, 1997
[10] Schwarenbach, R., Gschwend P., Imboden, D., Eds Environmental Organic Chemistry; John
Wiley & Sons Inc: New York, 1993
[11] Dilab®: AccuSampler, http://www.dilab.com/index.php?id=219 (Accessed April, 2009)