Embed Size (px)
Citation preview
In-vitro Synthesis and Reconstitution of
Cytochrome bo3 Ubiquinol Oxidase in
Artificial Membranes
Dissertation
Zur Erlangung des Grades Doktor der Naturwissenschaften
Am Fachbereich Biologie Der Johannes Gutenberg-Universität Mainz
Ahu ARSLAN YILDIZ geboren am 20.12.1980 in Turkey
Mainz, 2010
Dekan: Prof. Dr. Erwin Schmidt 1. Berichterstatter: Prof. Dr. Eva K. Sinner 2. Berichterstatter: Prof. Dr. Harald Paulsen 3. Prüfer: Prof. Dr. Wolfgang Knoll 4. Prüfer: Prof. Dr. Elmar Jaenicke Tag der mündlichen Prüfung: 29.01.2010
ii
Abbreviations
ATP Adenosine triphosphate
PD Parkinson’s Disease
Cyt-bo3 Cytochrome bo3 ubiquinol oxidase
NADH Nicotinamide adenine dinucleotide
UQ Ubiquinone
UQH2 Ubiquinol
Cyt-c Cytochrome c
E.coli Escherichia coli
Heme Heme or Haem molecule
Cyt-bd Cytochrome bd ubiquinol oxidase
cyo Cytochrome encoding operon
CuA Copper site in subunit II
CuB Copper of binuclear site
CFPS Cell-free protein synthesis
tRNA Transfer RNA
GTP Guanidine triphosphate
BLMs Black lipid membranes
sBLM Supported bilayer lipid membrane
tBLM Tethered lipid bilayer membrane
SPR Surface Plasmon Resonance Spectroscopy
SPFS Surface Plasmon Enhanced Fluorescence Spectroscopy
θc Critical angle
θm Minimum angle
TIR Total internal reflection
εd Dielectric constant
n Refractive index
CA Contact angle
pJRHisA Subunit II histidine tagged enzyme with natural promoter
pRCO3 Fused subunit II-I-III enzyme with natural promoter
pETcyo Subunit II histidine tagged enzyme with T7 promoter
LB Luria Bertani media
iii
KOH Potassium hydroxide
PES Polyethylene sulfonate
X-Gal Bromo-chloro-indolyl-galactopyranoside
IPTG Isopropyl β-D-1-thiogalactopyranoside
RT Room temperature
rpm Round per minute
NaAc Sodium acetate
EtOH Ethanol
TAE Tris-Acetate-EDTA buffer
kb kilo base pairs
Ni-NTA Nickel-Nitrilotriacetic acid
BCA Bicinchoninic acid
mRNA Messenger RNA
SDS Sodium dodecyl sulfate
PVDF Polyvinylidene fluoride
Ab Antibody
DMSO Dimethyl sulfoxide
HCl Hydrochloric acid
KM Michaelis-Menten affinity constant
Vmax Michaelis-Menten velocity
PDMS Polydimethyl sulfoxide
LaSFN9 High refractive index glass
HeNe Helium/Neon
λ Wavelength
TM Transversal magnetic (p) polarization
P19 Laminin Peptide P19
EDC N-(3-Dimethylaminopropyl)-N'-ethylcarbodiimide Hydrochloride
NHS N-Hydroxysuccinimide
DMPE 1,2-Dimyristoyl-sn-glycero-3-phosphoethanolamine
PBS Phoshate Buffered Saline (Buffer)
PC L-α-Phosphatidylcholine from soybean
1°Ab Primary antibody
2°Ab Secondary antibody
iv
PentaHis 1°Ab Primary antibody responds to five histidine residues
Cy5 Fluorescence Cyanine dye
Alexa Fluor 647 Fluorescence Alexa Fluor dye
DPePE 1,2-Dipentadecanoyl-sn-glycero-3-phosphoethanolamine
DPPE 1,2-Dipalmitoyl-sn-glycero-3-phosphoethanolamine
DPhyPE 1,2-Diphytanoyl-sn-glycero-3-phosphoethanolamine
DPalPE 1,2-Dipalmitoleoyl-sn-glycero-3-phosphoethanolamine
DLPE 1,2-Dilinolenoyl-sn-glycero-3-phosphoethanolamine
DAPE 1,2-Diarachidonoyl-sn-glycero-3-phosphoethanolamine
DDPE 1,2-Didocosahexaenoyl-sn-glycero-3-phosphoethanolamine
TE E.coli Total Extract
AFM Atomic force microscopy
FR Farnesyl Transferase
cyoA Subunit II encoding operon
cyoB Subunit I encoding operon
cyoC Subunit III encoding operon
cyoD Subunit IV encoding operon
cyoE FR encoding operon
T7 T7 promoter
aa Amino acid
bp Base pair
kDa kilo Dalton
PEG Polyethylene glycol
BSA Bovine Serum Albumine
DTT Sodium hydrosulfite or dithionite
e- Electron
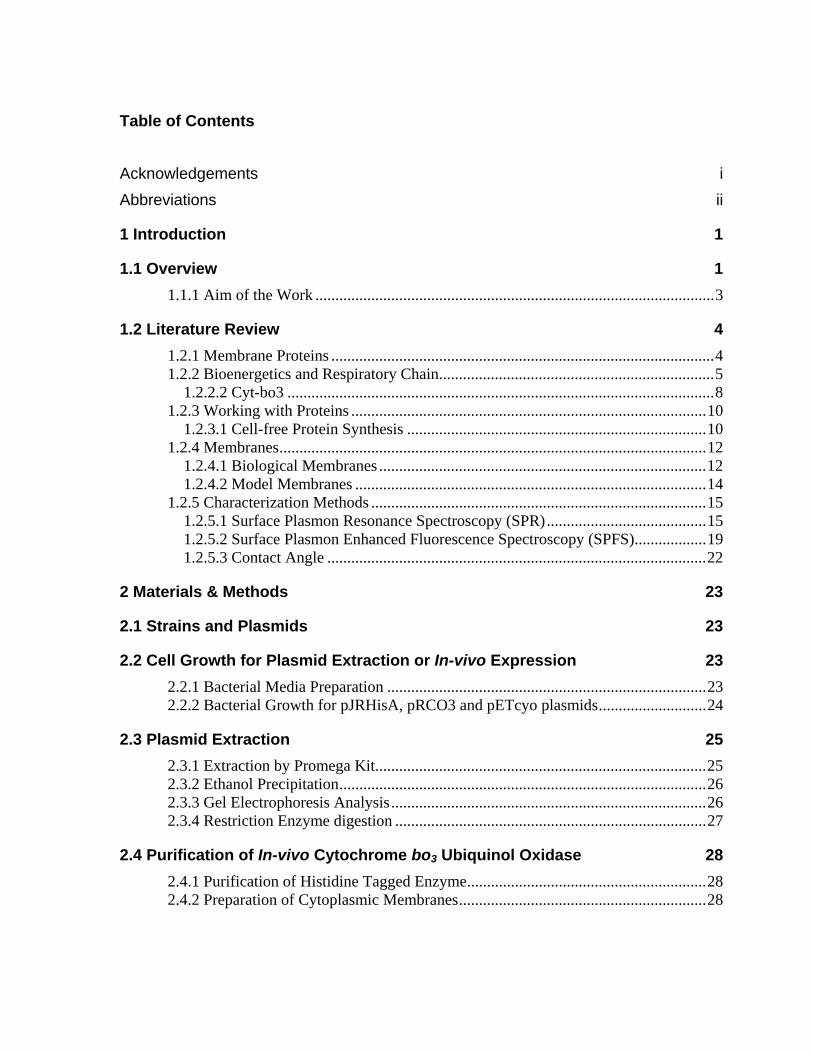
Table of Contents
Acknowledgements i Abbreviations ii
1 Introduction 1
1.1 Overview 1 1.1.1 Aim of the Work ....................................................................................................3
1.2 Literature Review 4 1.2.1 Membrane Proteins ................................................................................................4 1.2.2 Bioenergetics and Respiratory Chain.....................................................................5
1.2.2.2 Cyt-bo3 ...........................................................................................................8 1.2.3 Working with Proteins .........................................................................................10
1.2.3.1 Cell-free Protein Synthesis ...........................................................................10 1.2.4 Membranes...........................................................................................................12
1.2.4.1 Biological Membranes ..................................................................................12 1.2.4.2 Model Membranes ........................................................................................14
1.2.5 Characterization Methods ....................................................................................15 1.2.5.1 Surface Plasmon Resonance Spectroscopy (SPR)........................................15 1.2.5.2 Surface Plasmon Enhanced Fluorescence Spectroscopy (SPFS)..................19 1.2.5.3 Contact Angle ...............................................................................................22
2 Materials & Methods 23
2.1 Strains and Plasmids 23
2.2 Cell Growth for Plasmid Extraction or In-vivo Expression 23 2.2.1 Bacterial Media Preparation ................................................................................23 2.2.2 Bacterial Growth for pJRHisA, pRCO3 and pETcyo plasmids...........................24
2.3 Plasmid Extraction 25 2.3.1 Extraction by Promega Kit...................................................................................25 2.3.2 Ethanol Precipitation............................................................................................26 2.3.3 Gel Electrophoresis Analysis...............................................................................26 2.3.4 Restriction Enzyme digestion ..............................................................................27
2.4 Purification of In-vivo Cytochrome bo3 Ubiquinol Oxidase 28 2.4.1 Purification of Histidine Tagged Enzyme............................................................28 2.4.2 Preparation of Cytoplasmic Membranes..............................................................28
2.5 In-vitro Expression of Cytochrome bo3 Ubiquinol Oxidase 29 2.5.1 Promega E.coli Kit...............................................................................................29 2.5.2 Qiagen Insect Kit .................................................................................................30 2.5.3 Acetone Precipitation...........................................................................................31 2.5.4 BODIPY-FL Labelling ........................................................................................31
2.6 Immuno Blotting 32 2.6.1 Coomassie Staining..............................................................................................34
2.7 Spectroscopic Quantification of Enzyme 34 2.7.1 Reduction of UQ Substrate ..................................................................................34 2.7.2 Spectrophotometric Analysis of Cyt-bo3 .............................................................35
2.7.2.1 Reduced Minus Oxidized Spectra .......................................................................................... 35 2.7.2.2 Enzyme Activity Assay via Spectroscopic detection.............................................................. 35
2.7.3 Enzyme Activity Assay via Oxygen Electrode....................................................35 2.7.4 Sample Preparation of in-vitro Expressed Cyt-bo3 for Spectrophotometric Analysis and Enzyme Activity Assay...........................................................................36
2.8 SPR/SPFS Measurements 36 2.8.1 Preparation of PDMS Spacer ...............................................................................36 2.8.2 Preparation of Gold Substrates ............................................................................36 2.8.3 SPR/SPFS Setup ..................................................................................................37 2.8.4 Assembly of Flow Cell ........................................................................................39 2.8.5 Scan and Kinetic Mode of SPR/SPFS .................................................................40 2.8.6 Experimental SPR/SPFS Protocol .......................................................................41
2.9 Contact Angle Measurements 45
3 Results & Discussion 47
3.1 Membrane Construction Strategies 47 3.1.1 General Remarks of tethered Bilayer Lipid Membranes (tBLM)........................47 3.1.2 Peptide Spacer......................................................................................................47 3.1.3 Monolayer Formation ..........................................................................................50
3.1.3.1 DMPE Optimization............................................................................................................... 51 3.1.3.2 Phospholipid Optimization ..................................................................................................... 53
3.1.4 Bilayer Formation ................................................................................................55 3.1.5 Conclusion of Membrane Construction...............................................................60
3.2 Plasmid DNA Overview 61
3.3 Plasmid Extraction for in-vitro Expression and General Analysis 69 3.3.1 Cell growth for Plasmid DNA Isolation ..............................................................69 3.3.2 Isolation of Plasmid DNA....................................................................................70 3.3.3 Gel Electrophoresis Analysis...............................................................................71
3.4 Purification of Histidine Tagged Cytochrome bo3 Ubiquinol Oxidase 74 3.4.1 Isolation of Histidine Tagged Cytochrome bo3 ...................................................74 3.4.2 Preparation of Cytoplasmic Membranes..............................................................82 3.4.3 Conclusion of Cyt-bo3 Purification......................................................................84
3.5 In-vitro Expression of Histidine Tagged Cytochrome bo3 Ubiquinol Oxidase and Western Blot Analysis 84
3.5.1 Expression of Cytochrome bo3 via Promega E.coli Kit.......................................84 3.5.2 Expression of Cytochrome bo3 via Qiagen Insect Kit .........................................87 3.5.3 Expression and Characterization of Non-Histidine Tagged Cytochrome bo3 via BODIPY-FL Labelling ...........................................................................................88 3.5.4 Conclusion of In-vitro Expression of Cyt-bo3 .....................................................90
3.6 Observation of Histidine Tagged Cytochrome bo3 Expression in Artificial Membranes by Surface Plasmon Enhanced Fluorescent Spectroscopy 91
3.6.1 Kinetic Mode Measurements ...............................................................................92 3.6.2 Membrane-Antibody Interaction .........................................................................93 3.6.3 Incorporation of Isolated Enzyme........................................................................95 3.6.4 Detection of in-vitro Expression of the Cytochrome bo3 in Real Time...............98
3.6.4.1 In-vitro Expression of Cyt-bo3 for pJRHisA plasmid............................................................. 98 3.6.4.2 In-vitro Expression of Cyt-bo3 for pETcyo plasmid............................................................... 99
3.6.5 Western Blot Analysis of SPFS .........................................................................101 3.6.6 Conclusion of SPFS detection of Cyt-bo3 in Artificial Membranes ..................103
3.7 Spectroscopic Features of Cytochrome bo3 104 3.7.1 Spectrophotometric Analysis of Isolated Cytoplasmic Membranes..................104 3.7.2 Spectrophotometric Analysis of in-vitro Expressed Cytochrome bo3 ..............106
3.8 Enzymatic Properties of Cytochrome bo3 107 3.8.1 Ubiquinol/Ubiquinone Quantification ...............................................................108 3.8.2 Enzyme Activity Assay of Isolated Cytoplasmic Membranes ..........................109 3.8.3 Enzyme Activity Assay of in-vitro Expressed Cytochrome bo3 .......................115 3.8.4 Conclusion Enzymatic Activity of in-vitro Expressed Cyt-bo3.........................117
4 General Conclusion & Outlook 119
List of Tables 121
List of Figures 122
References 127
CHAPTER I : INTRODUCTION
1
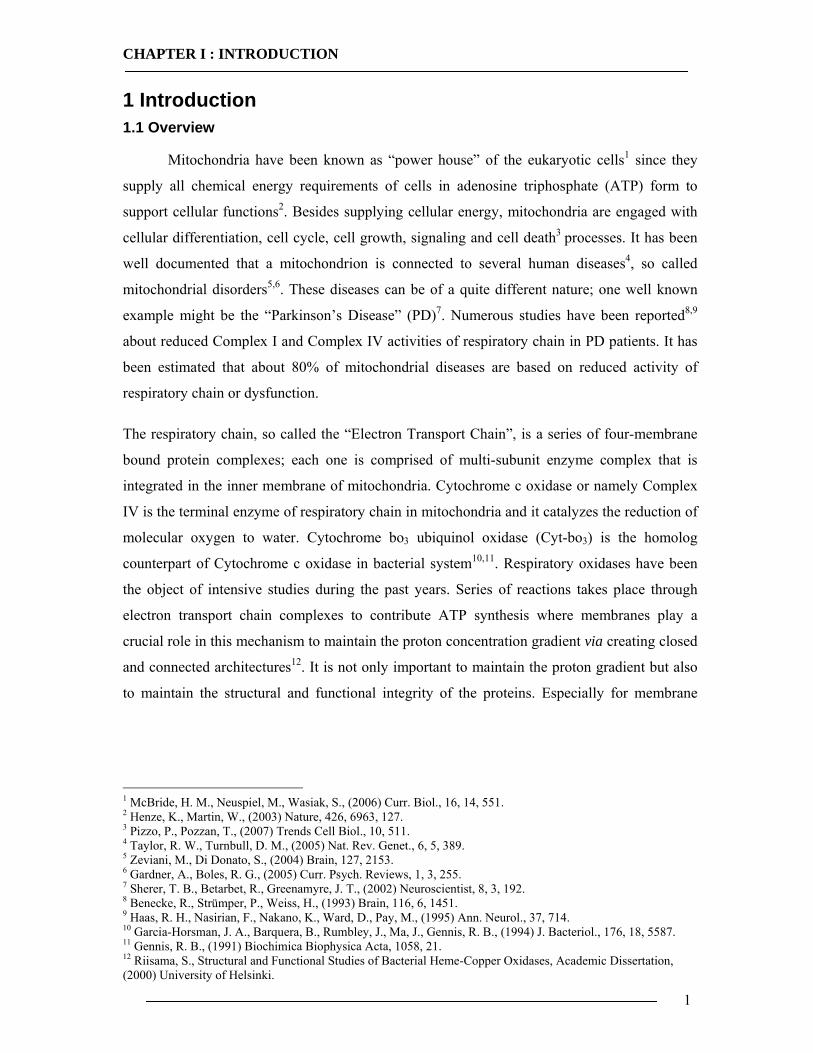
1 Introduction 1.1 Overview
Mitochondria have been known as “power house” of the eukaryotic cells1 since they
supply all chemical energy requirements of cells in adenosine triphosphate (ATP) form to
support cellular functions2. Besides supplying cellular energy, mitochondria are engaged with
cellular differentiation, cell cycle, cell growth, signaling and cell death3 processes. It has been
well documented that a mitochondrion is connected to several human diseases4, so called
mitochondrial disorders5,6. These diseases can be of a quite different nature; one well known
example might be the “Parkinson’s Disease” (PD)7. Numerous studies have been reported8,9
about reduced Complex I and Complex IV activities of respiratory chain in PD patients. It has
been estimated that about 80% of mitochondrial diseases are based on reduced activity of
respiratory chain or dysfunction.
The respiratory chain, so called the “Electron Transport Chain”, is a series of four-membrane
bound protein complexes; each one is comprised of multi-subunit enzyme complex that is
integrated in the inner membrane of mitochondria. Cytochrome c oxidase or namely Complex
IV is the terminal enzyme of respiratory chain in mitochondria and it catalyzes the reduction of
molecular oxygen to water. Cytochrome bo3 ubiquinol oxidase (Cyt-bo3) is the homolog
counterpart of Cytochrome c oxidase in bacterial system10,11. Respiratory oxidases have been
the object of intensive studies during the past years. Series of reactions takes place through
electron transport chain complexes to contribute ATP synthesis where membranes play a
crucial role in this mechanism to maintain the proton concentration gradient via creating closed
and connected architectures12. It is not only important to maintain the proton gradient but also
to maintain the structural and functional integrity of the proteins. Especially for membrane
1 McBride, H. M., Neuspiel, M., Wasiak, S., (2006) Curr. Biol., 16, 14, 551. 2 Henze, K., Martin, W., (2003) Nature, 426, 6963, 127. 3 Pizzo, P., Pozzan, T., (2007) Trends Cell Biol., 10, 511. 4 Taylor, R. W., Turnbull, D. M., (2005) Nat. Rev. Genet., 6, 5, 389. 5 Zeviani, M., Di Donato, S., (2004) Brain, 127, 2153. 6 Gardner, A., Boles, R. G., (2005) Curr. Psych. Reviews, 1, 3, 255. 7 Sherer, T. B., Betarbet, R., Greenamyre, J. T., (2002) Neuroscientist, 8, 3, 192. 8 Benecke, R., Strümper, P., Weiss, H., (1993) Brain, 116, 6, 1451. 9 Haas, R. H., Nasirian, F., Nakano, K., Ward, D., Pay, M., (1995) Ann. Neurol., 37, 714. 10 Garcia-Horsman, J. A., Barquera, B., Rumbley, J., Ma, J., Gennis, R. B., (1994) J. Bacteriol., 176, 18, 5587. 11 Gennis, R. B., (1991) Biochimica Biophysica Acta, 1058, 21. 12 Riisama, S., Structural and Functional Studies of Bacterial Heme-Copper Oxidases, Academic Dissertation, (2000) University of Helsinki.
CHAPTER I : INTRODUCTION
2
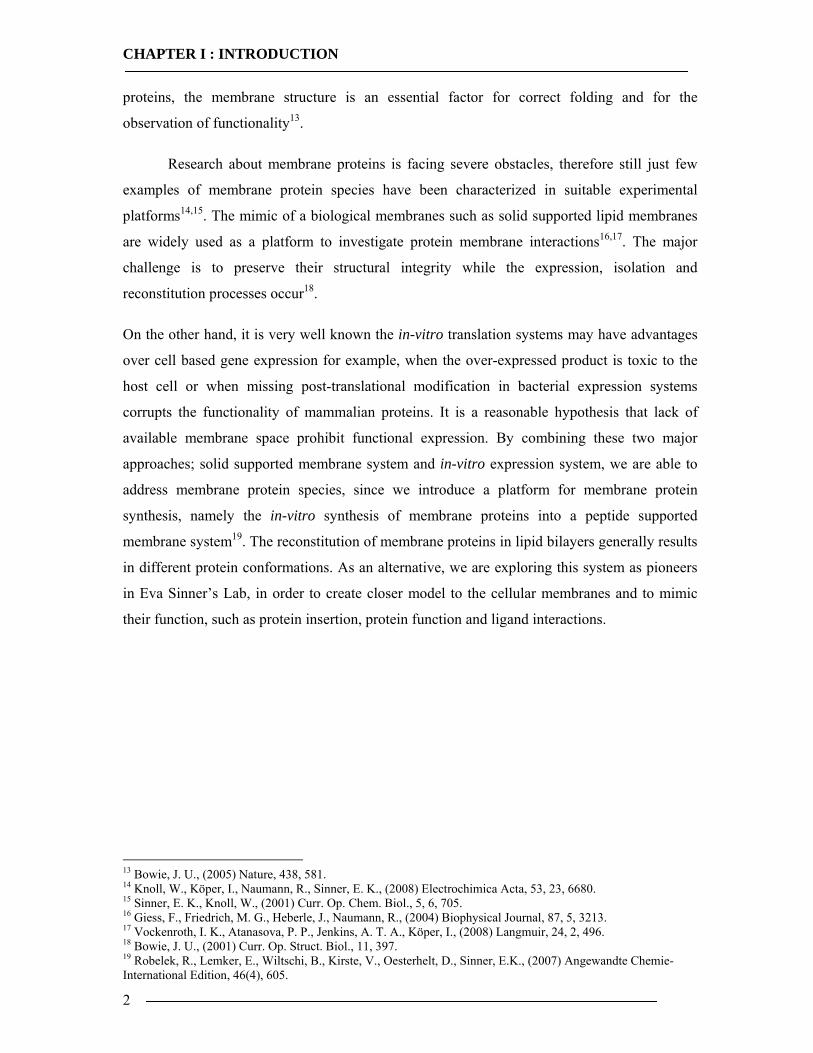
proteins, the membrane structure is an essential factor for correct folding and for the
observation of functionality13.
Research about membrane proteins is facing severe obstacles, therefore still just few
examples of membrane protein species have been characterized in suitable experimental
platforms14,15. The mimic of a biological membranes such as solid supported lipid membranes
are widely used as a platform to investigate protein membrane interactions16,17. The major
challenge is to preserve their structural integrity while the expression, isolation and
reconstitution processes occur18.
On the other hand, it is very well known the in-vitro translation systems may have advantages
over cell based gene expression for example, when the over-expressed product is toxic to the
host cell or when missing post-translational modification in bacterial expression systems
corrupts the functionality of mammalian proteins. It is a reasonable hypothesis that lack of
available membrane space prohibit functional expression. By combining these two major
approaches; solid supported membrane system and in-vitro expression system, we are able to
address membrane protein species, since we introduce a platform for membrane protein
synthesis, namely the in-vitro synthesis of membrane proteins into a peptide supported
membrane system19. The reconstitution of membrane proteins in lipid bilayers generally results
in different protein conformations. As an alternative, we are exploring this system as pioneers
in Eva Sinner’s Lab, in order to create closer model to the cellular membranes and to mimic
their function, such as protein insertion, protein function and ligand interactions.
13 Bowie, J. U., (2005) Nature, 438, 581. 14 Knoll, W., Köper, I., Naumann, R., Sinner, E. K., (2008) Electrochimica Acta, 53, 23, 6680. 15 Sinner, E. K., Knoll, W., (2001) Curr. Op. Chem. Biol., 5, 6, 705. 16 Giess, F., Friedrich, M. G., Heberle, J., Naumann, R., (2004) Biophysical Journal, 87, 5, 3213. 17 Vockenroth, I. K., Atanasova, P. P., Jenkins, A. T. A., Köper, I., (2008) Langmuir, 24, 2, 496. 18 Bowie, J. U., (2001) Curr. Op. Struct. Biol., 11, 397. 19 Robelek, R., Lemker, E., Wiltschi, B., Kirste, V., Oesterhelt, D., Sinner, E.K., (2007) Angewandte Chemie-International Edition, 46(4), 605.
CHAPTER I : INTRODUCTION
3
1.1.1 Aim of the Work
The aim of this project is to synthesize fully functional Cyt-bo3 in artificial membrane
surface by maintaining its structural integrity as its natural form. This study is divided into
three parts.
I. In the first part optimization of the suitable membrane structure is aimed, although the very
same system19 was used previously, it is quite difficult to insert large membrane proteins such
as Cyt-bo3 with large internal and external membrane domains. Thus, it is necessary to provide
good equilibrium in between high packing density and native-like fluidity.
II. The second and the prominent part of this study consists in application of the in-vitro
expression of active Cyt-bo3 in artificial membrane surface by using this optimized membrane
system. Both in-vitro expression and insertion of a membrane protein is a quite complicated
process and they are major topics of the related field. Here these two major approaches are
combined to increase the efficiency and to decrease the disadvantages.
III. The final part consists in the characterization and analysis of enzyme functionality to see
the potential of such a strategy for protein research and commercial applications in several
fields.
CHAPTER I : INTRODUCTION
4
1.2 Literature Review
1.2.1 Membrane Proteins
Membrane proteins can be divided into two main groups; integral and peripheral
membrane proteins20. Integral proteins are very firmly associated with the membrane and
removable only by agents that interfere with hydrophobic interactions such as detergents,
organic solvents or denaturing agents. Most integral proteins contain residues with
hydrophobic side chain that interact with membrane phospholipids for anchoring the protein to
the membrane and most of the integral proteins span the entire phospholipid bilayer. Two
different types of membrane spanning domains are found in transmembrane proteins; one or
more α-helices or less commonly multiple β-strands. When the polypeptide chain of integral
membrane protein spans the membrane multiple times, the core of the protein is generally
hydrophilic which permits the passage of water soluble molecules and the surface is
hydrophobic that permits interaction with the interior of lipid bilayer21. Peripheral membrane
proteins associate with the membrane through electrostatic interactions and hydrogen bonding
with the hydrophilic domains of integral membrane proteins or with the polar head groups of
membrane lipids. They do not interact directly with the hydrophobic core of the phospholipid
bilayer. They can be released by relatively mild agents that interfere with the electrostatic
interactions or break hydrogen bonds.
Several families of integral proteins in the plasma membrane provide specific points of
attachment between cells, or between a cell and respective extracellular matrix protein species.
The ability of cells to receive and act on signals from beyond the plasma membrane is
fundamental to life. Cells receive constant input from membrane proteins that act as
information receptors, sampling the surrounding for pH, osmotic strength, and the availability
of food, oxygen, light and the presence of hazardous chemicals. In all these cases, signal
represents “information” that is detected by specific receptors and converted to a “cellular
response” which always involves a chemical process. This conversion of information into a
chemical change, signal transduction, is a universal property of all living cells. These processes
are remarkably specific and sensitive such as enzyme-substrate interaction. This specificity is
generally achieved by membrane proteins.
20 Nelson, D. L., Cox, M. M., (2005) Lehninger Principles of Biochemistry, 4th Edt., W. H. Freeman Co, NewYork. 21 Lodish, H., Berk, A., Zipursky, S. L., Matsudaira, P., Baltimore, D., Darnell, J., (2000) Molecular Cell Biology, 4th Edt., W. H. Freeman Co., NewYork.
CHAPTER I : INTRODUCTION
5
1.2.2 Bioenergetics and Respiratory Chain
Living cells and organisms must perform work to stay alive, to grow and to reproduce.
The ability to harness energy and to channel it into biological work is a fundamental property
of all living organisms which can confine under the term Bioenergetics. Bioenergetics is a huge
subject of the field of biochemistry, which concerns energy flow through living systems which
includes different cellular and metabolic processes that leads to production and utilization of
energy such as ATP20. Electron transfer in oxidation-reduction reactions involve the loss of
electrons by one chemical species which is thereby oxidized, and the gain of electrons by
another species which is reduced in return. The flow of electrons in oxidation-reduction
reactions is responsible directly or indirectly for all “work” done by living organisms which
means responsible for the production of energy as well. The path of electron flow in
metabolism is complex. Electrons move from various metabolic intermediates to specialized
electron carrier in enzyme catalyzed reactions. These electron carriers are called as “electron
transport chain” or “respiratory chain”.
Electron transport chain connects a chemical reaction in between an electron donor and an
electron acceptor to transfer H+ ions across the membrane through a set of mediating
biochemical reactions. Respiratory chain is situated in the mitochondrial inner membrane in
eukaryotes and in the outer membrane (more exactly cell-wall) in prokaryotes.
Electron transfer from NADH to molecular oxygen is highly favorable and large
amount of energy is released when electrons are transported along the respiratory chain from
NADH to molecular oxygen. Enzymes of respiratory chain conserve this energy via
translocating protons across the membrane which generates an electrochemical proton gradient
across the respective membrane. Here membrane has an important role by forming a closed or
protected system which proton gradient can be maintained12. The controlled flow of protons
drive ATP synthesis and this is called the “chemiosmotic theory”22.
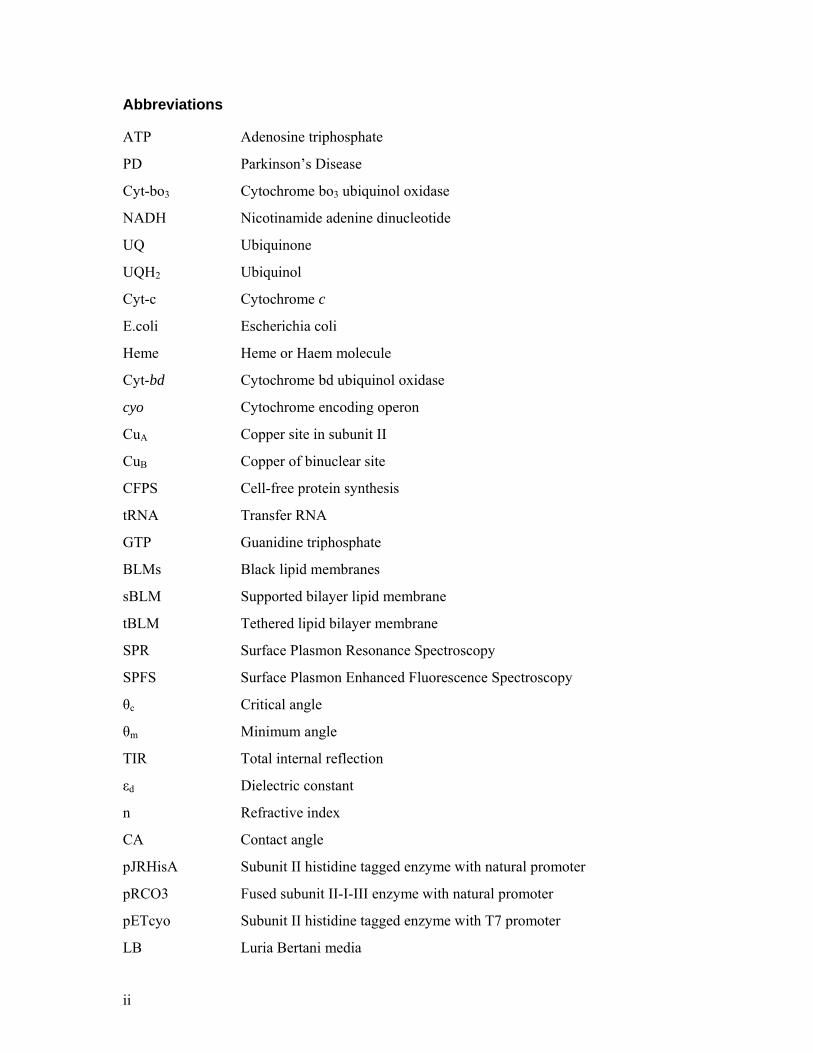
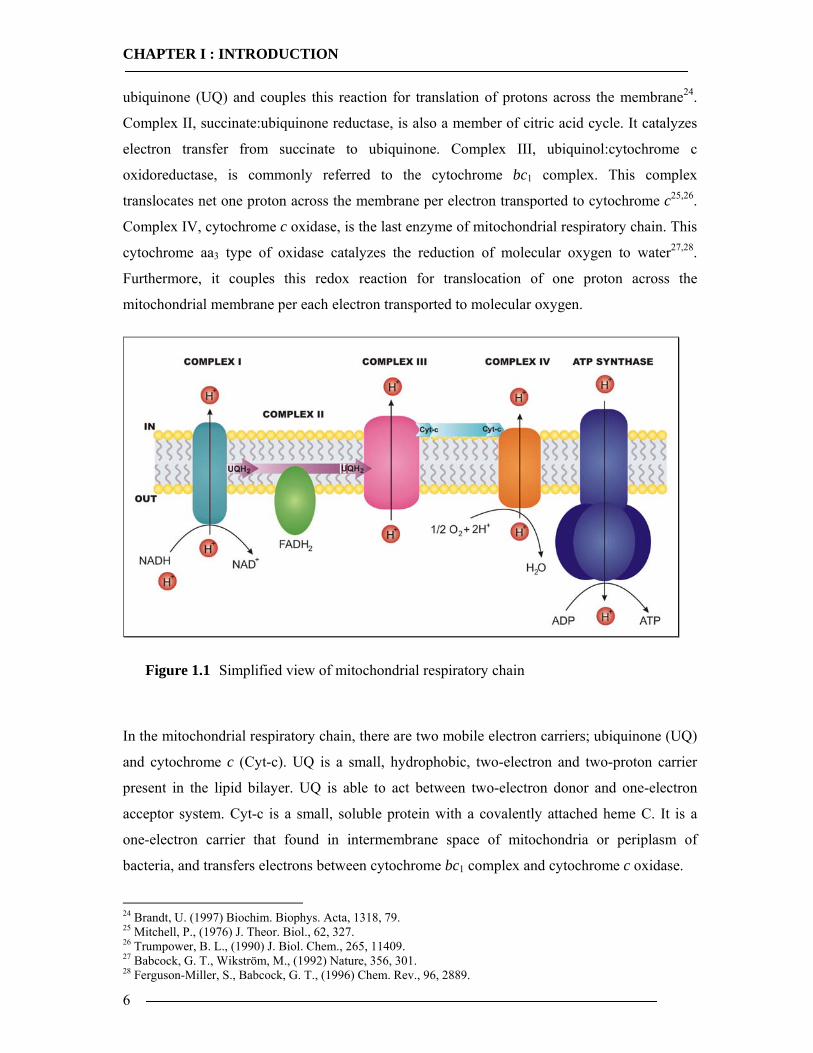
Mitochondrial respiratory chain is composed of energy-transducing, multi-subunit
enzyme complexes, shown in Figure 1.1; Complex I-IV, each designated to couple the redox
potential energy from the oxidation of substrates to the reduction of product and mobile
electron carriers which shuttle electrons in between the complexes during this process23. The
first enzyme of the respiratory chain is Complex I, known as NADH:ubiquinone
oxidoreductase, which transfers electrons from nicotinamide adenine dinucleotide (NADH) to 22 Mitchell, P., (1961) Nature, 191, 144. 23 Saraste, M., (1999) Science, 283, 1488.
CHAPTER I : INTRODUCTION
6
ubiquinone (UQ) and couples this reaction for translation of protons across the membrane24.
Complex II, succinate:ubiquinone reductase, is also a member of citric acid cycle. It catalyzes
electron transfer from succinate to ubiquinone. Complex III, ubiquinol:cytochrome c
oxidoreductase, is commonly referred to the cytochrome bc1 complex. This complex
translocates net one proton across the membrane per electron transported to cytochrome c25,26.
Complex IV, cytochrome c oxidase, is the last enzyme of mitochondrial respiratory chain. This
cytochrome aa3 type of oxidase catalyzes the reduction of molecular oxygen to water27,28.
Furthermore, it couples this redox reaction for translocation of one proton across the
mitochondrial membrane per each electron transported to molecular oxygen.
Figure 1.1 Simplified view of mitochondrial respiratory chain
In the mitochondrial respiratory chain, there are two mobile electron carriers; ubiquinone (UQ)
and cytochrome c (Cyt-c). UQ is a small, hydrophobic, two-electron and two-proton carrier
present in the lipid bilayer. UQ is able to act between two-electron donor and one-electron
acceptor system. Cyt-c is a small, soluble protein with a covalently attached heme C. It is a
one-electron carrier that found in intermembrane space of mitochondria or periplasm of
bacteria, and transfers electrons between cytochrome bc1 complex and cytochrome c oxidase.
24 Brandt, U. (1997) Biochim. Biophys. Acta, 1318, 79. 25 Mitchell, P., (1976) J. Theor. Biol., 62, 327. 26 Trumpower, B. L., (1990) J. Biol. Chem., 265, 11409. 27 Babcock, G. T., Wikström, M., (1992) Nature, 356, 301. 28 Ferguson-Miller, S., Babcock, G. T., (1996) Chem. Rev., 96, 2889.
CHAPTER I : INTRODUCTION
7
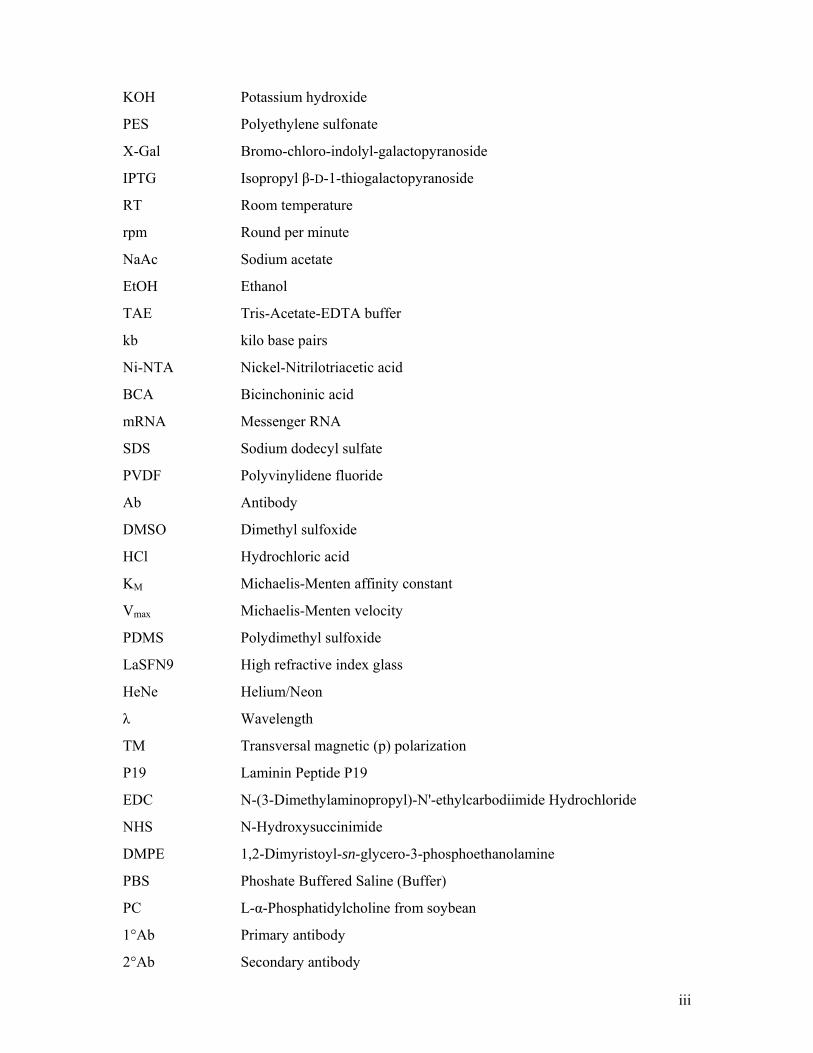
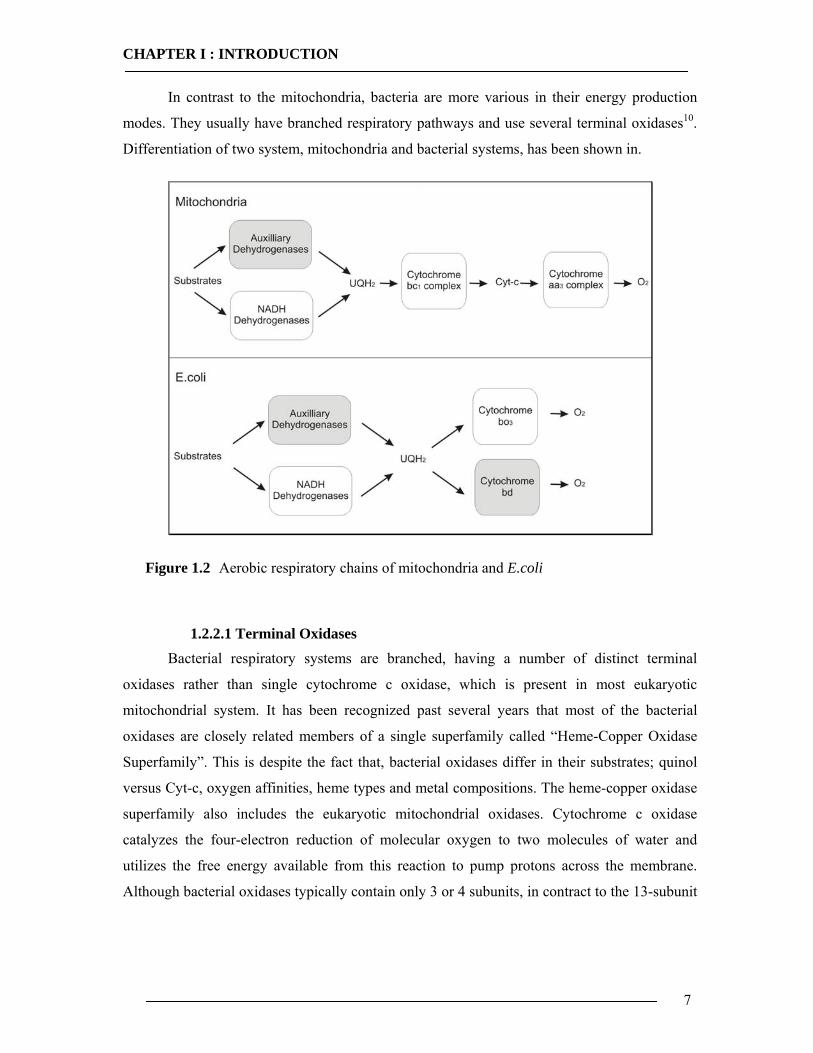
In contrast to the mitochondria, bacteria are more various in their energy production
modes. They usually have branched respiratory pathways and use several terminal oxidases10.
Differentiation of two system, mitochondria and bacterial systems, has been shown in.
Figure 1.2 Aerobic respiratory chains of mitochondria and E.coli
1.2.2.1 Terminal Oxidases
Bacterial respiratory systems are branched, having a number of distinct terminal
oxidases rather than single cytochrome c oxidase, which is present in most eukaryotic
mitochondrial system. It has been recognized past several years that most of the bacterial
oxidases are closely related members of a single superfamily called “Heme-Copper Oxidase
Superfamily”. This is despite the fact that, bacterial oxidases differ in their substrates; quinol
versus Cyt-c, oxygen affinities, heme types and metal compositions. The heme-copper oxidase
superfamily also includes the eukaryotic mitochondrial oxidases. Cytochrome c oxidase
catalyzes the four-electron reduction of molecular oxygen to two molecules of water and
utilizes the free energy available from this reaction to pump protons across the membrane.
Although bacterial oxidases typically contain only 3 or 4 subunits, in contract to the 13-subunit
CHAPTER I : INTRODUCTION
8
mammalian enzyme, the bacterial oxidases catalyze the reduction of molecular oxygen and
pump protons as efficiently as the mitochondrial oxidases do29.
All aerobic bacterial species examined so far, have multiple respiratory oxidases. The
different respiratory oxidases allow the cells to customize their respiratory systems to meet the
demands of a variety of environmental growth conditions. For example, E.coli has two
different respiratory oxidases, cytochrome bd and cytochrome bo3. Cyt-bd has a substantially
higher affinity for O2 than Cyt-bo3 has and it induced to high levels when the oxygen tension of
growth medium is low.
1.2.2.2 Cyt-bo3
The E.coli cytochrome o complex is a four-subunit enzyme that catalyzes the two-
electron oxidation of UQ within the bacterial cytoplasmic membrane and the four-electron
reduction of molecular oxygen to water. The oxidase contains two heme prosthetic groups and
one copper. The tree mitochondrially encoded subunits of the eukaryotic cytochrome c
oxidases, subunit I, II, III, each have a homologue in the quinol oxidase. For example, the
sequence of subunit I of bo3 type quinol oxidase from E.coli is 40% identical to the sequence
of bovine aa3 type cytochrome c oxidase and followed by subunit II on the order of 23-30%.
The sequence of the cyo operon which has been given completely in materials section, has
clearly shown a phylogenetic relationship between the heme b containing ubiquinol oxidase
from E.coli and the aa3 type family of cytochrome c oxidase11.
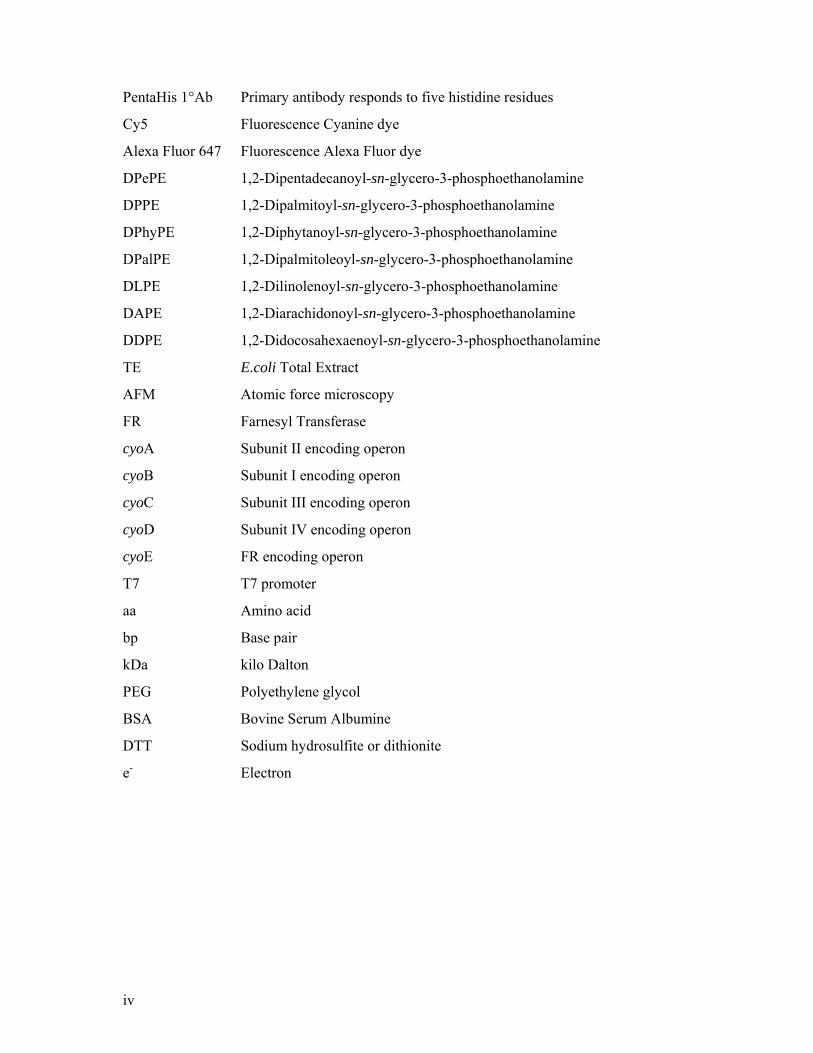
Cyt-bo3 is a four subunit enzyme, compared to as many as thirteen subunits found in
the mammalian enzyme. Subunit I has been shown to be the location of the three redox active
metal centers, heme b, heme o and CuB. Subunit I from E.coli contains 15 transmembrane
spanning domains. Subunit II has 2 transmembrane spanning domains and a large C-terminal
hydrophilic domain in the periplasm. Subunit III and subunit IV have five and three
transmembrane spans respectively. Subunit IV has little or no sequence homology with other
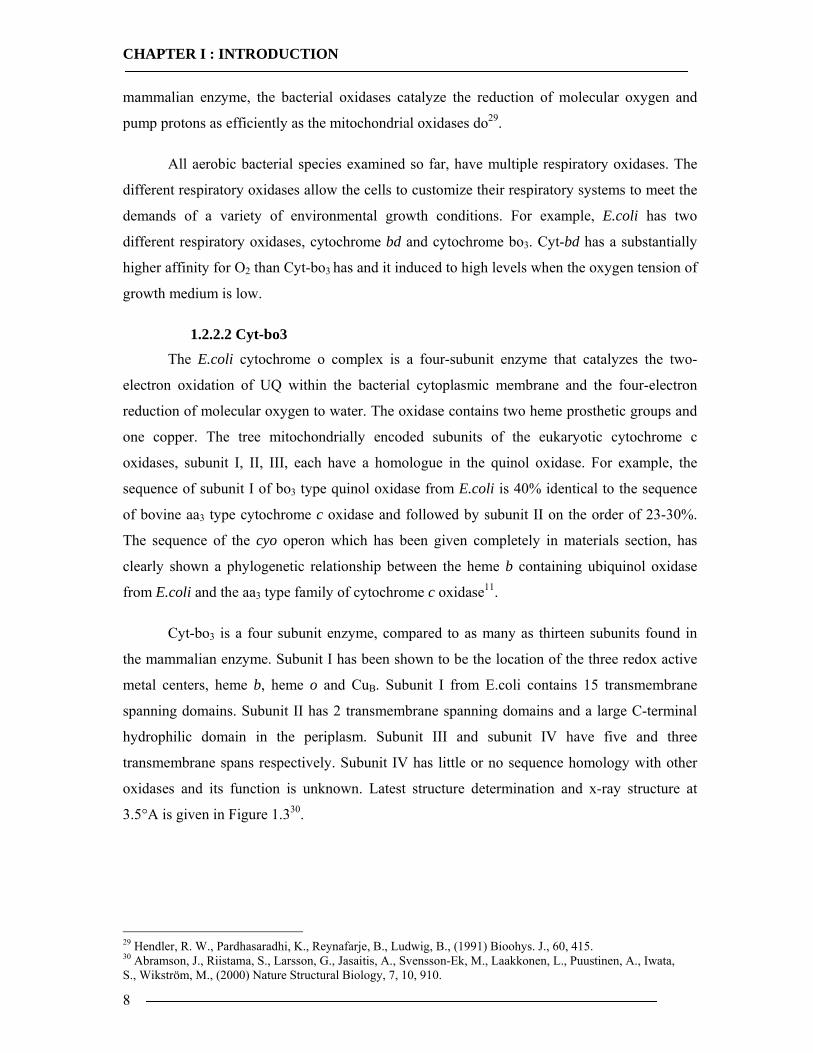
oxidases and its function is unknown. Latest structure determination and x-ray structure at
3.5°A is given in Figure 1.330.
29 Hendler, R. W., Pardhasaradhi, K., Reynafarje, B., Ludwig, B., (1991) Bioohys. J., 60, 415. 30 Abramson, J., Riistama, S., Larsson, G., Jasaitis, A., Svensson-Ek, M., Laakkonen, L., Puustinen, A., Iwata, S., Wikström, M., (2000) Nature Structural Biology, 7, 10, 910.
CHAPTER I : INTRODUCTION
9
Figure 1.3 Overall structure of ubiquinol oxidase from E.coli
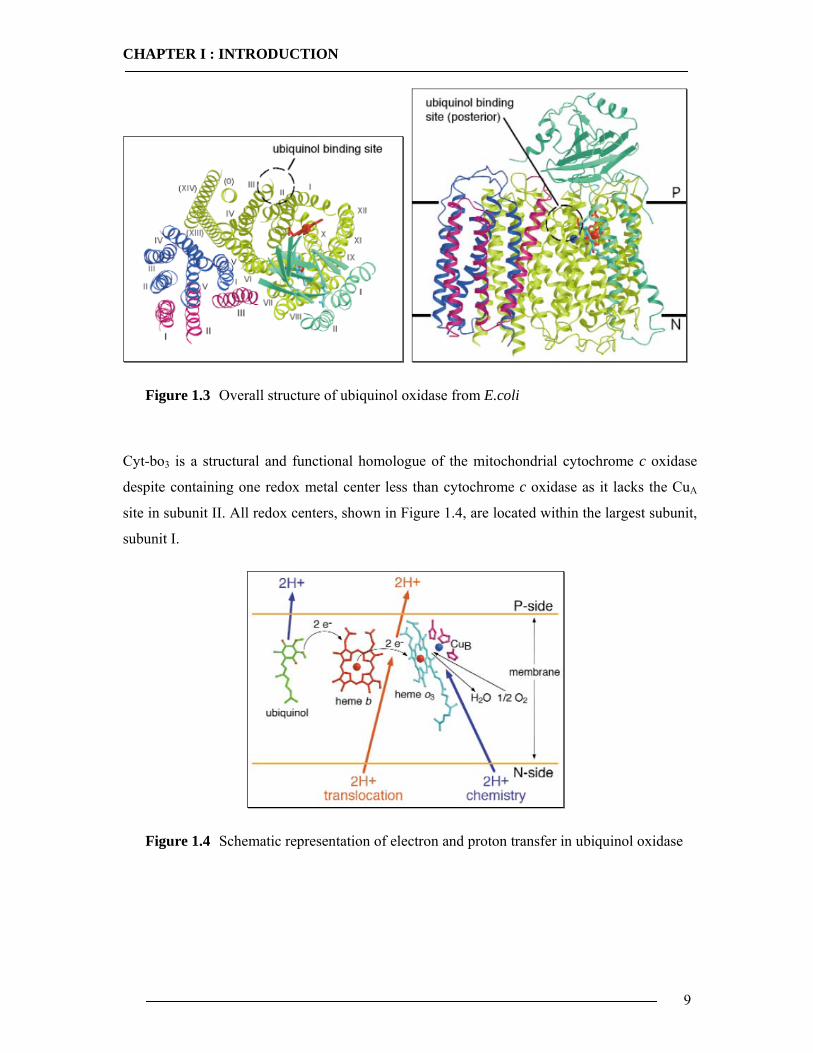
Cyt-bo3 is a structural and functional homologue of the mitochondrial cytochrome c oxidase
despite containing one redox metal center less than cytochrome c oxidase as it lacks the CuA
site in subunit II. All redox centers, shown in Figure 1.4, are located within the largest subunit,
subunit I.
Figure 1.4 Schematic representation of electron and proton transfer in ubiquinol oxidase
CHAPTER I : INTRODUCTION
10
1.2.3 Working with Proteins
Understanding of protein structure and function has been derived from the study of
many individual proteins. Because of the vast variations of knowledge about its genetics, E.coli
is the system of choice for expression of many heterologous proteins31. Genetic manipulations
are straight forward, cultures of E.coli are easily and inexpensively grown and many foreign
proteins are well-tolerated and may be expressed at high levels. During the past 20 years,
several hundred recombinant proteins have been expressed in E.coli using several vector
systems. Factors that influence the choice of a system for expression of particular protein in
E.coli can be listed mainly as; size of the protein, amount of protein needed, whether active
protein is required.
To study a protein in detail, the researcher must be able to separate it from other
proteins from the cellular context and must have the techniques to determine its properties. A
pure preparation is essential before a protein’s properties and activities can be determined. The
source of a protein is generally tissue or microbial cells. Given the fact that cells contain
thousands of different kinds of proteins. Methods for separating proteins take advantage of
properties that vary from one protein to the next, including size, color, charge and binding
properties. All purification procedures require a method for quantifying or assaying the protein
of interest in the presence of other proteins. To purify a protein, it is essential to have a way of
detecting and quantifying that protein at each step of the procedure. Whether the expressed
protein is to be used in structural and functional studies, it is best to have target as a soluble
protein. Overexpression of foreign proteins from cloned genes in heterologous hosts, such as
E.coli, often leads to the formation of insoluble intracellular aggregates of expressed protein.
A common strategy to avoid some of the problems associated with expression
difficulties, purification process and functioning is to express the protein of interest by using a
cell-free system.
1.2.3.1 Cell-free Protein Synthesis
Cell-free protein synthesis32 (CFPS) is a rapid and high throughput technology for
obtaining proteins from their genes. In-vitro protein translation using cell extracts has become
an important tool for molecular biology by playing a central role in a wide variety of
applications. CFPS or namely in-vitro synthesis refers to protein production by using lysates
31 Sambrook, J., Russell, D. W., (2001) Molecular Cloning A Laboratory Manual, 3rd Edt., Cold Spring Harbor Laboratory Press, NewYork. 32 Nirenberg, M. W., Matthaei, J. H., (1961) Proc. Natl. Acad. Sci., 47, 1588.
CHAPTER I : INTRODUCTION
11
that provides the cellular machinery necessary for synthesis. Ribosomes, tRNAs, GTP, ATP,
Mg+2, K+, initiation, elongation and termination factors are among the requirements for a
translation system. These are provided by lysates, commercially available or home-made,
which can be obtained from prokaryotic or eukaryotic sources.
CFPS is a useful alternative to in-vivo synthesis for the analysis and production of
proteins33. Some of them include better protein yield, an optimal environment in terms of co-
and post-translational modifications, cell viability concerns, ease of use, cost and time saving.
The biggest advantage comparing to the protein production in living cells, is that CFPS is the
fastest way to obtain an expressed protein (phenotype) from a gene (genotype) of a protein. In
in-vivo protein expression, a large part of the metabolic resources are dedicated towards basic
cellular processes. However in an in-vitro production system, all those resources are
optimized towards to the production of protein of interest. There are no cell walls in in-vitro
expression system, it is an open system which allows the addition of components to create
most optimal environment for the protein production. There is no cell growth in in-vitro
expression system and hence even proteins considered toxic or inhibitory to the host cell can be
expressed. In most cases enough protein can be produced in few hours. No elaborate setup is
required for the synthesis and there is no need for further purification steps.
One of the potential and most far-reaching impacts of in-vitro expression could be in
the area of membrane protein production34. Membrane proteins account for nearly a third of the
genes encoded by most fully sequenced genomes. However only a handful of integral
membrane protein structures (<80) have been observed and characterized. Over expression of
membrane proteins in-vivo frequently results in cell toxicity largely owing to their
hydrophobicity, protein aggregation, misfolding and low yield. In some cases, the over
expression of integral membrane proteins such as ion channel proteins, transporters and
receptors can disrupt the integrity of the cell membrane and lead to cell lysis. What is exciting
is that nearly all of these obstacles can be overcome by cell-free expression. In-vitro expression
offers a unique opportunity to use the highly efficient bacterial transcription and translation
machinery while introducing natural mammalian or other synthetic lipids. In addition to all
these facts, in-vitro expression can circumvent the problem of post-translational modification.
The presence of mild detergents or lipid mixtures during the reaction notably eased aggregation
and insolubility issues and does not interfere with the translation activity.
33 Spirin, A. S., Swartz, J. R., (2008) Cell-free Protein Synthesis, WILEY-VCH Verlag GmbH & Co. 34 Katzen, F., Chang, G., Kudlicki, W., (2005) Trends in Biotechnology, 23, 3, 150.
CHAPTER I : INTRODUCTION
12
1.2.4 Membranes
1.2.4.1 Biological Membranes
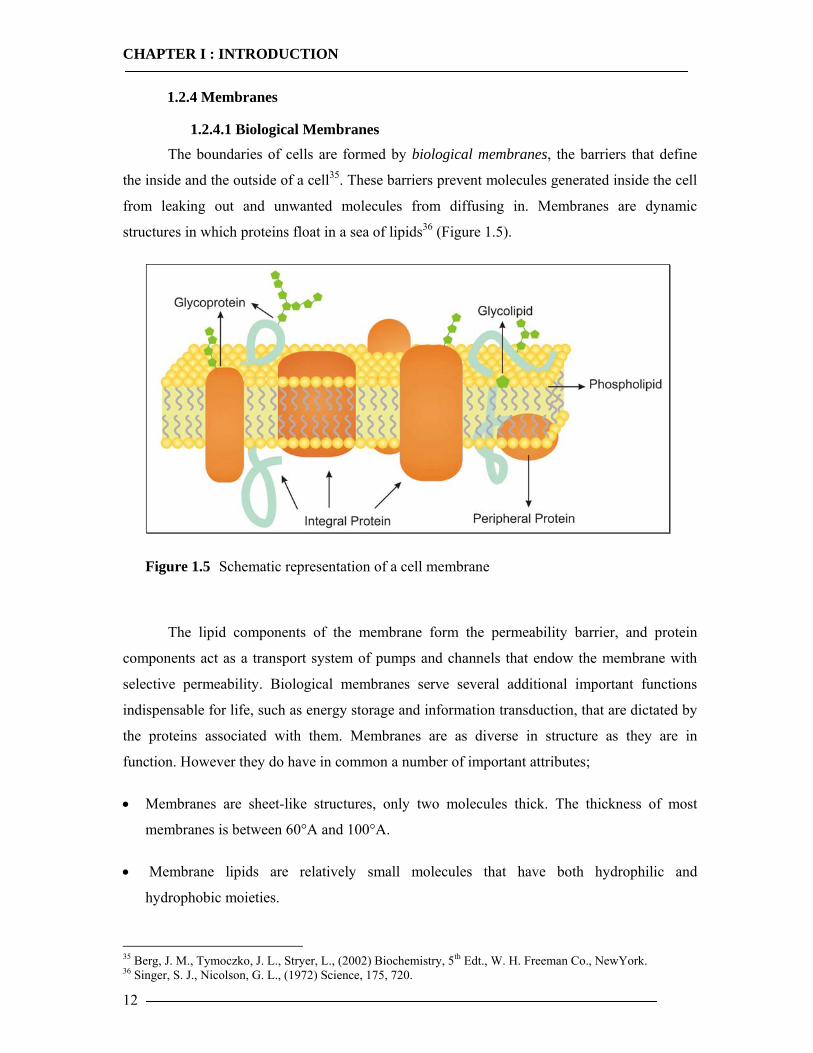
The boundaries of cells are formed by biological membranes, the barriers that define
the inside and the outside of a cell35. These barriers prevent molecules generated inside the cell
from leaking out and unwanted molecules from diffusing in. Membranes are dynamic
structures in which proteins float in a sea of lipids36 (Figure 1.5).
Figure 1.5 Schematic representation of a cell membrane
The lipid components of the membrane form the permeability barrier, and protein
components act as a transport system of pumps and channels that endow the membrane with
selective permeability. Biological membranes serve several additional important functions
indispensable for life, such as energy storage and information transduction, that are dictated by
the proteins associated with them. Membranes are as diverse in structure as they are in
function. However they do have in common a number of important attributes;
• Membranes are sheet-like structures, only two molecules thick. The thickness of most
membranes is between 60°A and 100°A.
• Membrane lipids are relatively small molecules that have both hydrophilic and
hydrophobic moieties.
35 Berg, J. M., Tymoczko, J. L., Stryer, L., (2002) Biochemistry, 5th Edt., W. H. Freeman Co., NewYork. 36 Singer, S. J., Nicolson, G. L., (1972) Science, 175, 720.
CHAPTER I : INTRODUCTION
13
• Membranes consist mainly of lipids and proteins. They also contain carbohydrates that are
linked to lipids and proteins.
• Membranes are fluid structures. Lipid molecules diffuse rapidly in the plane of the
membrane, as do proteins, unless they are anchored by specific interactions. Membranes
can be regarded as two-dimensional solutions of oriented proteins and lipids.
• Specific proteins mediate distinctive functions if membranes. Proteins serve as pumps,
channels, receptors, energy transducers and enzymes. Membrane proteins are embedded in
lipid bilayers, which create suitable environment for their activity.
Lipids differ remarkably from the other groups of biomolecules. They have a variety of
biological roles; they serve as highly concentrated energy stores, signal molecules and
components of the membrane. The three major kinds of membrane lipids are phospholipids,
glycolipids and cholesterol. Phospholipids are the major class of membrane lipids and they are
abundant in all biological membranes. A phospholipid37 molecule is constructed from four
components; a fatty acid, a backbone which fatty acids are attached, a phosphate and an
alcohol group attached to the phosphate. The fatty acid components provide hydrophobic
barrier, whereas the remainder of the molecule has hydrophilic properties to enable interaction
with the environment.
Membrane formation is a consequence of the amphipathic nature of the molecules.
Their polar head groups favor contact with water, whereas their hydrocarbon tails interact with
one another. One way is to form a micelle38, a globular structure in which polar head groups
are surrounded by water and hydrocarbon tails are inside. Alternatively, the strongly opposed
preferences of the hydrophilic and hydrophobic moieties of membrane lipids can be satisfied
by forming a lipid bilayer39. The hydrophobic tails of each individual sheet interact with one
another, forming a hydrophobic interior that acts as a permeability barrier. The hydrophilic
head groups interact with the aqueous medium on each side of the bilayer. The favored
structure for most phospholipids in aqueous media is biomolecular sheet rather than a micelle.
The reason is that, two fatty acyl chains of phospholipids are two bulky to fit into the interior
of a micelle. The formation of lipid bilayer is a self assembly process. In other words, the
structure of a lipid bilayer is inherent in the structure of the constituent lipid molecule. The
37 Helm, C. A., Israelachvili, J. N., (1993) Methods in Enzymology, 220, 130. 38 Tanford, C., (1980) The hydrophobic effect: Formation of Micelles and Biological Membranes, 2nd Edt., John Wiley & Sons Inc. 39 Israelachvili, J. N., Marcelja, S., Horn, R. G., (1980) Quarterly Reviews of Biophysics, 13, 121.
CHAPTER I : INTRODUCTION
14
growth of lipid bilayer architectures from phospholipids is a rapid and spontaneous process in
water. Hydrophobic interactions are the major driving force for the formation of lipid bilayer.
Recall that, hydrophobic interactions also play a dominant role in the folding, insertion and
functioning of proteins.
1.2.4.2 Model Membranes
For the systematic study of membranes and membrane related processes, various model
systems have been proposed that allow an facile characterization of the membrane architecture
by minimizing the number of parameters involved40,41. The first model systems developed, can
be described as non-supported membranes such as liposomes, giant vesicles and black lipid
membranes. Liposomes are spherically assembled bilayers where the hydrophobic part is
buried inside42. Their limitation for electrochemical characterizations, since their inner
compartment is very small and inaccessible and their limited lifetime is an important drawback
for practical applications. Planar lipid membranes or black lipid membranes (BLMs) have been
established to overcome these limitations43,44. BLMs are assemblies of two opposing
monolayers spanning on aperture which separates two aqueous compartments.
The BLM technique has been successfully used to study the membrane active
substances45,46. Unlike liposomes, it provides a direct access to both sides of the membrane and
this allows modifying each side. Nevertheless, the main drawback of BLMs is their inherent
instability. Long time measurements and robust sensing devices using BLMs are still not
feasible47. Stability problems of model membranes have been overcome by using solid
supports48 underneath the membrane. Another advantage of this system is to use various
surface analytical tools for the characterization.
Supported bilayer lipid membranes49 (sBLM) can be divided into two subgroups; the
so-called “solid supported bilayers” which are separated from the solid support by only a thin
40 Chan, Y. H. M., Boxer, S. G., (2007) Current Opinion in Chemical Biology, 11, 6, 581. 41 Förch. R., Schönherr, H., Jenkins, A. T. A., (2009) Surface Design: Applications in Bioscience and Nanotechnology, WILEY-VCH Verlag GmbH & Co. . 42 Edwards, D. A., Schneck, F., Zhang, I., Davis, A. M. J., Chen, H., Langer, R., (1996) Boiphys. J., 71, 1208. 43 Ottava, A., Tvarozek, V., Racek, J., Sabo, J., Ziegler, V., Hianik, T., Tien, H., (1997) Supramolecular Science, 4, 101. 44 Winterhalter, M., (2000) Current Opinion in Colloid & Interface Science, 5, 250. 45 Kasianowicz, J. J., Brandin, E., Branton, D., Deamer, D. W., (1996) Proc. Natl. Acad. Sci., 102, 12377. 46 Subrahmaniam, Y., Alves, I. D., Salgado, G. F. J., Lau, P. W., Wysocki, R. J., Salamon, Z., Tollin, G., Hruby, V. J., Brown, M. F., Saavedra, S. S., (2005) JACS Comm., 127, 5320. 47 Heyse, S., Stora, T., Schmid, E., Lakey, J. H., Vogel, H., (1998) Biochimica Biophysica Acta, 88507, 319. 48 Sackmann, E., (1996) Science, 271, 43. 49 Knoll, W., Frank, C. W., Heibel, C., Naumann, R., Offenhauser, A., Rühe, J., Schmidt, E. K., Shen, W. W., Sinner, A., (2000) Reviews in Molecular Biotechnology, 74, 137.
CHAPTER I : INTRODUCTION
15
water layer and the alternative type of bilayer which is separated from solid support by a spacer
such as small polymer layer or a thin tethering layer that composed of heterogeneous
molecules. Since separation of a bilayer from solid support by a thin water layer does not
provide any ion reservoir under the membrane, it does not suit for functional analysis of
electrogenic membrane proteins and in addition, this model system does not provide enough
space for the functional incorporation of complex membrane proteins.
Tethered lipid bilayer membranes50,51 (tBLM) provide a reservoir place for insertion of the
protein. The inner leaflet of tBLM is covalently coupled to the solid support via spacer group.
Such systems have been shown to provide excellent stability and electrical properties52, as well
as high efficiency to incorporate membrane proteins16 which is satisfactory for biosensing
applications.
1.2.5 Characterization Methods
1.2.5.1 Surface Plasmon Resonance Spectroscopy (SPR)
Over the last two decades, surface plasmon resonance (SPR) has attracted a great deal
of attention53,54. It has been widely used as a detection technique in biosensor applications55,56
as well as for characterizing molecular interactions at the interface between analytes and a
sensor surface. It has been shown this system is an effective optical tool for the
characterization of the thin films, as well as for the sensitive detection of kinetic binding
processes.
Surface plasmons are surface waves which can be excited at the interface between a
metal and a dielectric and the exact excitation conditions strongly depend on the optical
properties of the system. This measurable response of the system permits the sensitive
monitoring of processes near interface. Under certain conditions, the energy carried by photons
is transferred to packets of electrons, called plasmon, on a metal surface like Au, Ag, Al, Cu,
etc. This energy transfer occurs only at a specific resonance wavelength, namely at the
wavelength where the quantum energy carried by the photons exactly equals the quantum
50 Raguse, B., Braach-Maksvytis, V., Cornell, B. A., King, L. G., Osman, P. D. J., Pace, R. J., Wieczorek, L., (1998) Langmuir, 14, 648. 51 Köper, I., (2007) Molecular BioSystems, 3, 10, 651. 52 Atanasov, V., Atanasov, P., Vockenroth, I., Knorr, N., Köper, I., (2006) Bioconjugated Chem., 17, 631. 53 Raether, H., (1988) Surface Plasmon on Smooth and Rough Surfaces and on Gratings, Springer, Berlin. 54 Ulman, A., (1991) An Introduction to Ultrathin Organic Films, Academic Press, London. 55 Neumann, T., (2001) Strategies for Detecting DNA Hybridisation Using Surface Plasmon Fluorescence Spectroscopy, Dissertation Thesis, Johannes Gutenberg University. 56 Vockenroth, I. K., (2007) Investigation of Tethered Bilayer Lipid Membranes for Their Potential Use in Biosensing Devices, Dissertation Thesis, University of Bath.
CHAPTER I : INTRODUCTION
16
energy level of plasmon. In order to understand the excitation of surface plasmons by light,
total internal reflection and the dispersion relation of surface plasmons has to be discussed.
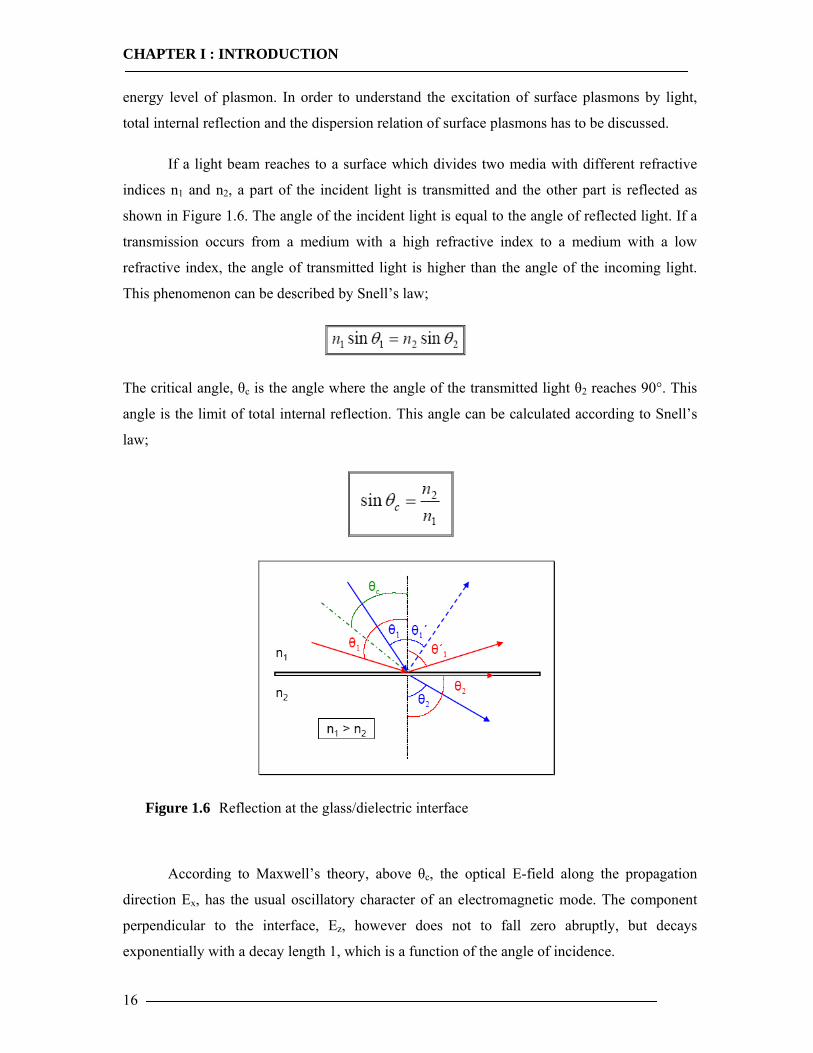
If a light beam reaches to a surface which divides two media with different refractive
indices n1 and n2, a part of the incident light is transmitted and the other part is reflected as
shown in Figure 1.6. The angle of the incident light is equal to the angle of reflected light. If a
transmission occurs from a medium with a high refractive index to a medium with a low
refractive index, the angle of transmitted light is higher than the angle of the incoming light.
This phenomenon can be described by Snell’s law;
The critical angle, θc is the angle where the angle of the transmitted light θ2 reaches 90°. This
angle is the limit of total internal reflection. This angle can be calculated according to Snell’s
law;
Figure 1.6 Reflection at the glass/dielectric interface
According to Maxwell’s theory, above θc, the optical E-field along the propagation
direction Ex, has the usual oscillatory character of an electromagnetic mode. The component
perpendicular to the interface, Ez, however does not to fall zero abruptly, but decays
exponentially with a decay length 1, which is a function of the angle of incidence.
CHAPTER I : INTRODUCTION
17
Such an electromagnetic field distribution is called as an evanescent field. The decay length is
in the order of wavelength of incoming light.
If the beam reaches to metal surface in contact with dielectric, as described in previous
paragraph, a part will be reflected and the other part will be transmitted. Additionally, it can
lead to an interaction in between the light and the electrons of the metal. This produces a
collective movement of the nearly free electron gas of metal. Because of their charge, these
electrons keep a certain distance from each other and a pseudo lattice is created. Electrons can
only move in a collective manner in this lattice. These collective excitation states of the quasi
free electrons of metal are described as “Surface Plasmon Polaritons”.
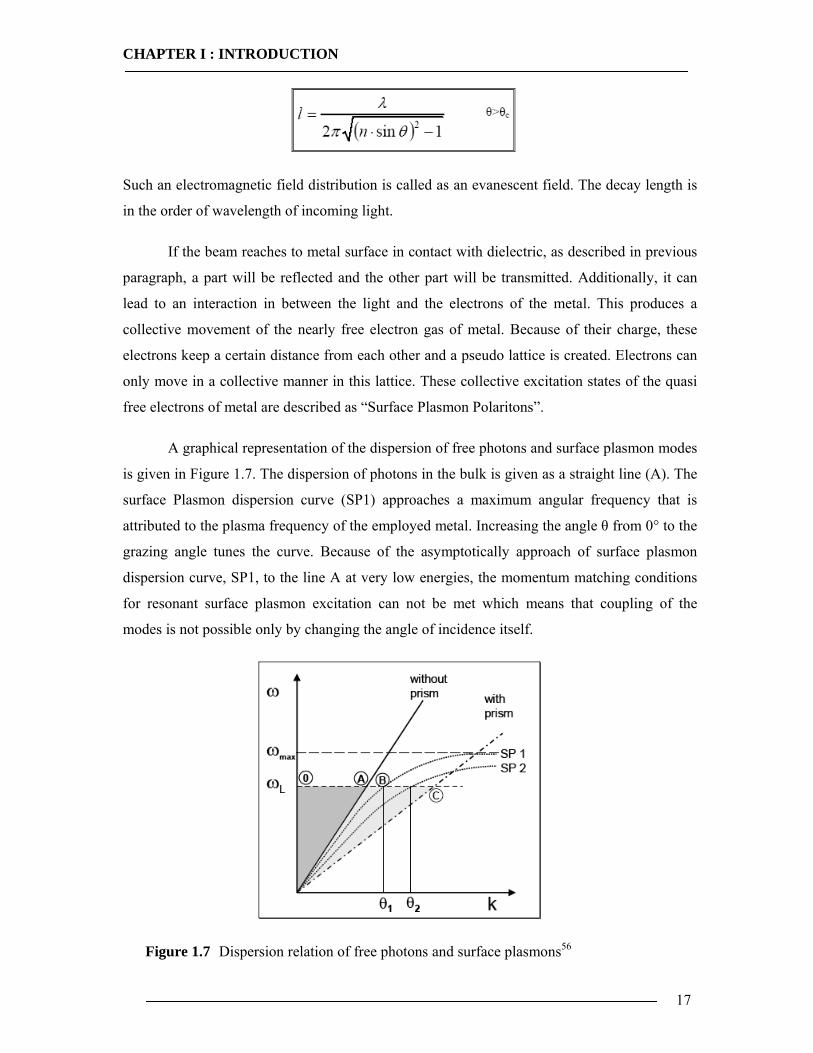
A graphical representation of the dispersion of free photons and surface plasmon modes
is given in Figure 1.7. The dispersion of photons in the bulk is given as a straight line (A). The
surface Plasmon dispersion curve (SP1) approaches a maximum angular frequency that is
attributed to the plasma frequency of the employed metal. Increasing the angle θ from 0° to the
grazing angle tunes the curve. Because of the asymptotically approach of surface plasmon
dispersion curve, SP1, to the line A at very low energies, the momentum matching conditions
for resonant surface plasmon excitation can not be met which means that coupling of the
modes is not possible only by changing the angle of incidence itself.
Figure 1.7 Dispersion relation of free photons and surface plasmons56
CHAPTER I : INTRODUCTION
18
There are two coupling techniques to overcome this problem; prism coupling and
grating coupling57. A common way to increase the momentum of light is a method based on
prism coupling58. Using this method, photons are not coupled directly to the metal/dielectric
interface but via the evanescent tail of light upon total internal reflection at base of a high
refractive index prism. The geometry experimentally used in this work is the Kretschmann
configuration59, shown in section 2.8.3 (Figure 2.2). By using this configuration, the
evanescent field close to the surface causes a very intensive and sensitive interaction with the
surface. Therefore, SPR is a suitable tool for the investigation of optical properties of thin films
and layers.
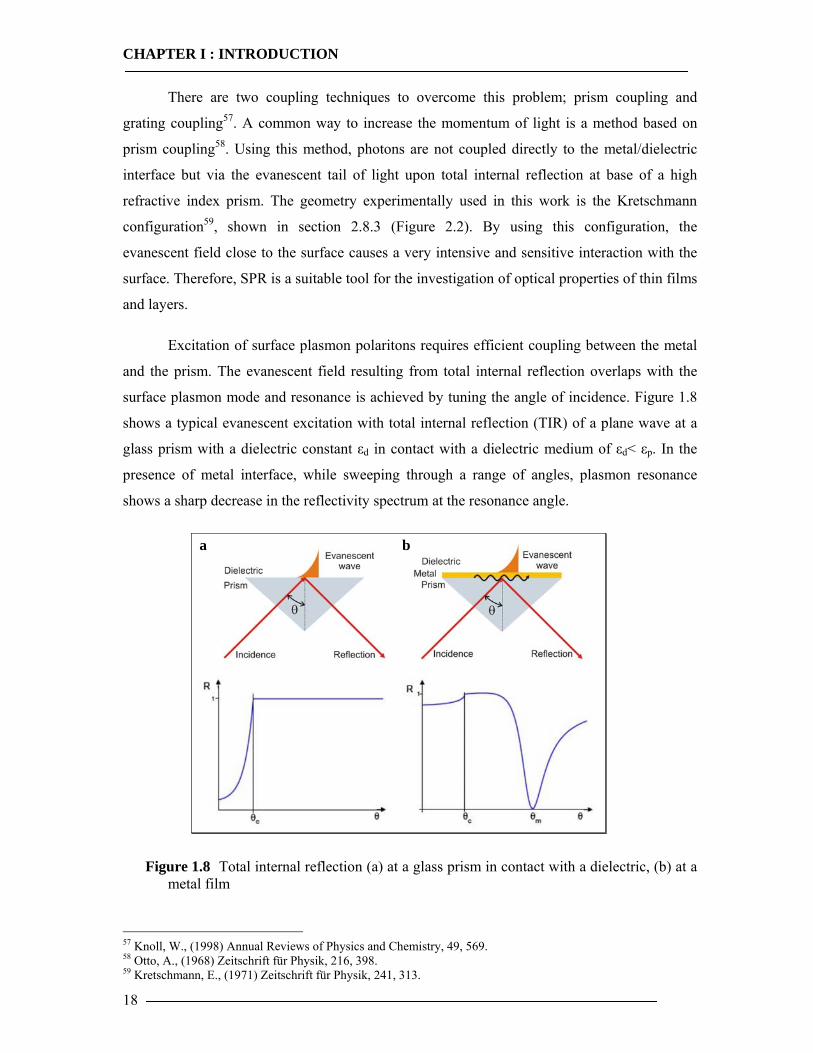
Excitation of surface plasmon polaritons requires efficient coupling between the metal
and the prism. The evanescent field resulting from total internal reflection overlaps with the
surface plasmon mode and resonance is achieved by tuning the angle of incidence. Figure 1.8
shows a typical evanescent excitation with total internal reflection (TIR) of a plane wave at a
glass prism with a dielectric constant εd in contact with a dielectric medium of εd< εp. In the
presence of metal interface, while sweeping through a range of angles, plasmon resonance
shows a sharp decrease in the reflectivity spectrum at the resonance angle.
Figure 1.8 Total internal reflection (a) at a glass prism in contact with a dielectric, (b) at a metal film
57 Knoll, W., (1998) Annual Reviews of Physics and Chemistry, 49, 569. 58 Otto, A., (1968) Zeitschrift für Physik, 216, 398. 59 Kretschmann, E., (1971) Zeitschrift für Physik, 241, 313.
a b
CHAPTER I : INTRODUCTION
19
In the scan mode, reflectivity changes are measured as a function of the incident angle.
Changes in the refractive index occurring at the metal film due to the adsorption or binding on
this film are detected as a shift in the minimum angle θm . The deposition of an ultra thin layer
of a material with a higher refractive index than the ambient dielectric is equivalent to an
increase of the overall refractive index integrated over the evanescent field. The net effect is a
slight shift of the resonance angle in order to in order to again couple resonantly to surface
plasmon modes. In a kinetic measurement, the change in intensity of reflected light is
measured at a constant angle. The formation of a new layer results in an increase in intensity of
reflected light. This increase in intensity corresponds to a shift of a resonance angle. In a
typical kinetic curve, there is only very slight change in reflectivity when the curve reaches to
plateau. Kinetic measurements allow the investigation of adsorption processes. Moreover,
qualitative aspects of the adsorption can be observed. For example, a fast adsorption results in
a very sharp slope.
1.2.5.2 Surface Plasmon Enhanced Fluorescence Spectroscopy (SPFS)
Analytical methods incorporating fluorescence based detection are widely used in
chemical as well as biochemical research due to the extraordinary sensitivity, signal
amplification and the favorable time scale on which fluorescence occur. A number of processes
can be observed by monitoring their influence on a fluorescent probe during the fluorescent
lifetime which is typically in range of 10ns. The SPR method offers a label-free, non-invasive
and real time detection of various biomolecular events. Detection limit and sensitivity
problems occur with SPR, when an analyte does not form a closed layer or a thick layer
enough to be monitored as a change in reflectivity minimum60. Recently surface plasmon
enhanced fluorescence spectroscopy (SPFS) was introduced61 which overcomes this sensitivity
limitations of SPR by combining it with the indirect detection methods of fluorescence62. SPFS
uses the enhanced electromagnetic field obtained by SPR to excite fluorescent dyes in close
proximity to the metal/dielectric interface. The evanescent surface plasmon field excites
fluorophores within the vicinity of this field. The optical excitation follows the strength of the
evanescent field and reaches its maximum near the maximum resonant angle of surface
plasmons. The fluorescence peak is observed at a slightly lower angle than the actual resonance
angle, the reflectivity minimum is only shifted due to an absorptive loss or damping in the
metal film.
60 Spinke, J., Liley, M., Guder, H. J., Angermaier, L., Knoll, W., (1993) Langmuir, 9, 1821. 61 Attridge, J. W., Daniels, P. B., Deakon, J. K., Robins, G. A., Davidson, G. P., (1991) Biosensors & Bioelectronics, 6, 201. 62 Liebermann, T., Knoll, W., (2000) Colloids and Surfaces, 171, 115.
CHAPTER I : INTRODUCTION
20
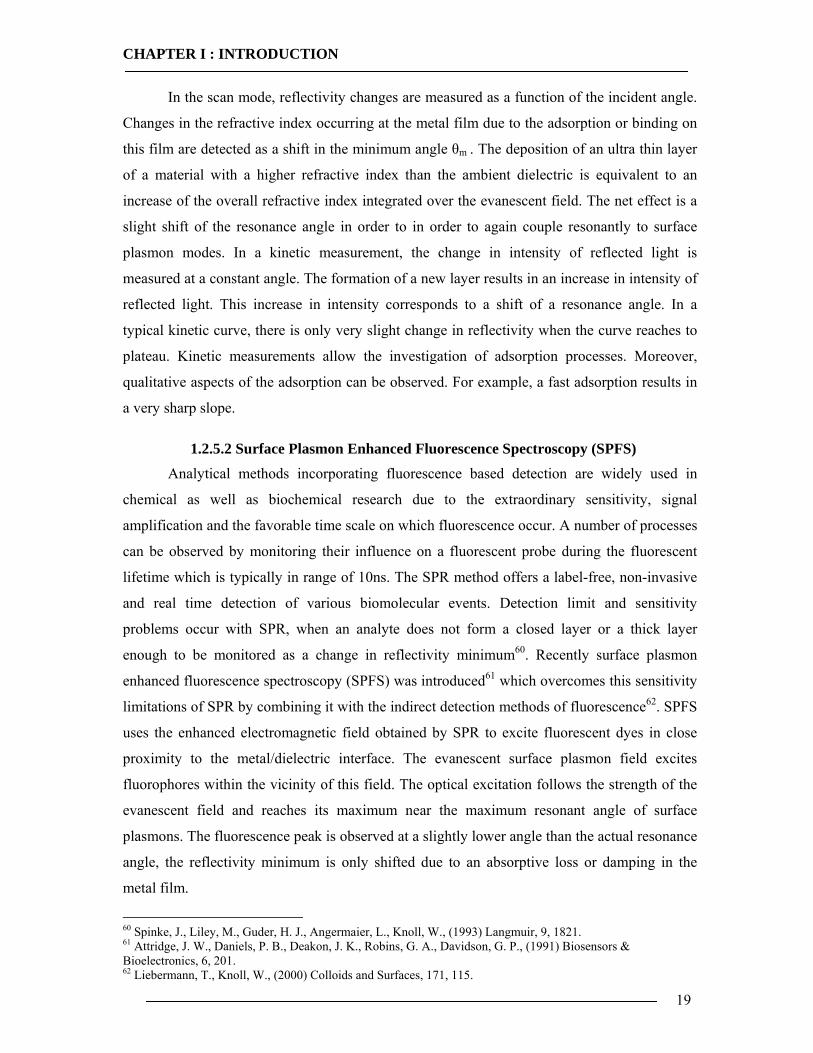
The fluorescence emission from the fluorophore molecules is strongly dependent upon
the distance from the metal surface. The ones that are close to the metal surface are quenched
and most of the excited state energy is dissipated as heat63,64. For the fluorophores lying at
intermediate distances from the metal surface, some of their energy can be used in back
coupling of a surface plasmon mode. And as a last case, at sufficient separation distances
(>20nm) free emission of the dye nominates. Some of the distance dependent energy transfer
mechanisms are summarized in Figure 1.9. The layer architecture which is used for SPFS
needs to be designed and optimized according to these distance related effects to guarantee the
binding of the fluorophores within a distance in between 30 and 100 nm from the metal surface
which is inside the evanescent field but out of the quenching distance65.
Figure 1.9 Major decay channels for fluorophores in close proximity to metal film
1.2.5.2.1 Fluorescence
Fluorescence is well characterized phenomenon which describes the emission of
photons from the molecules that undergo a transition from electronically excited state to the
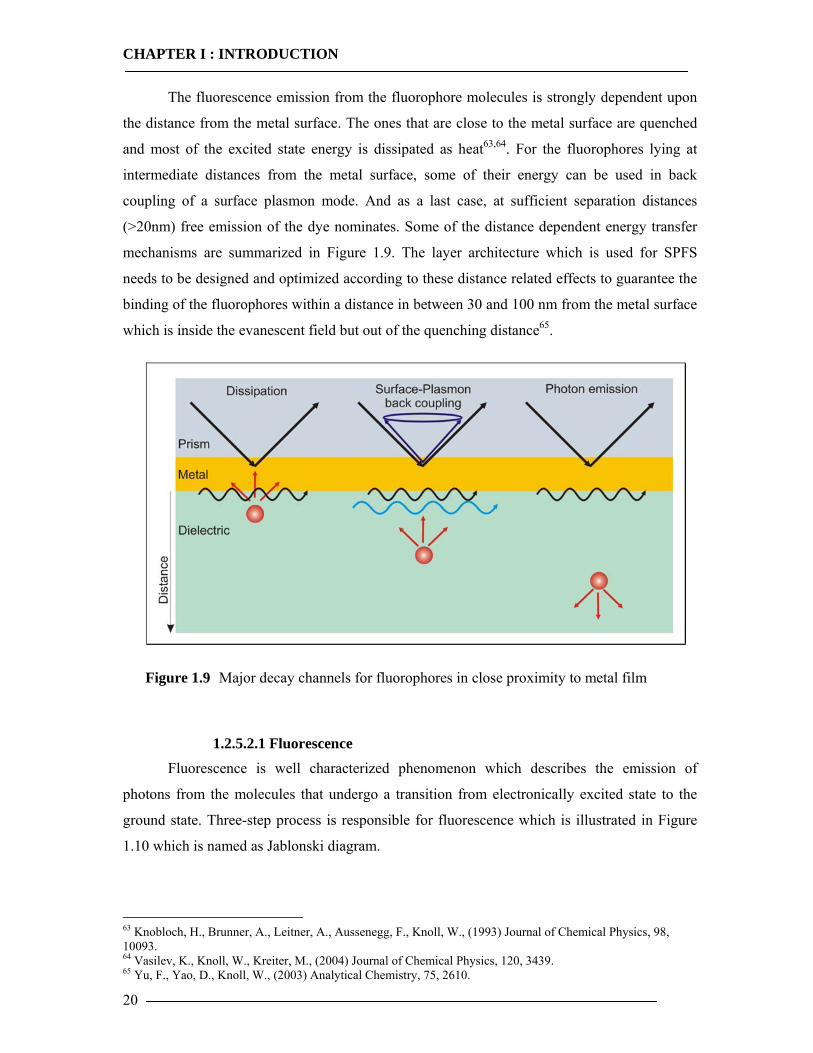
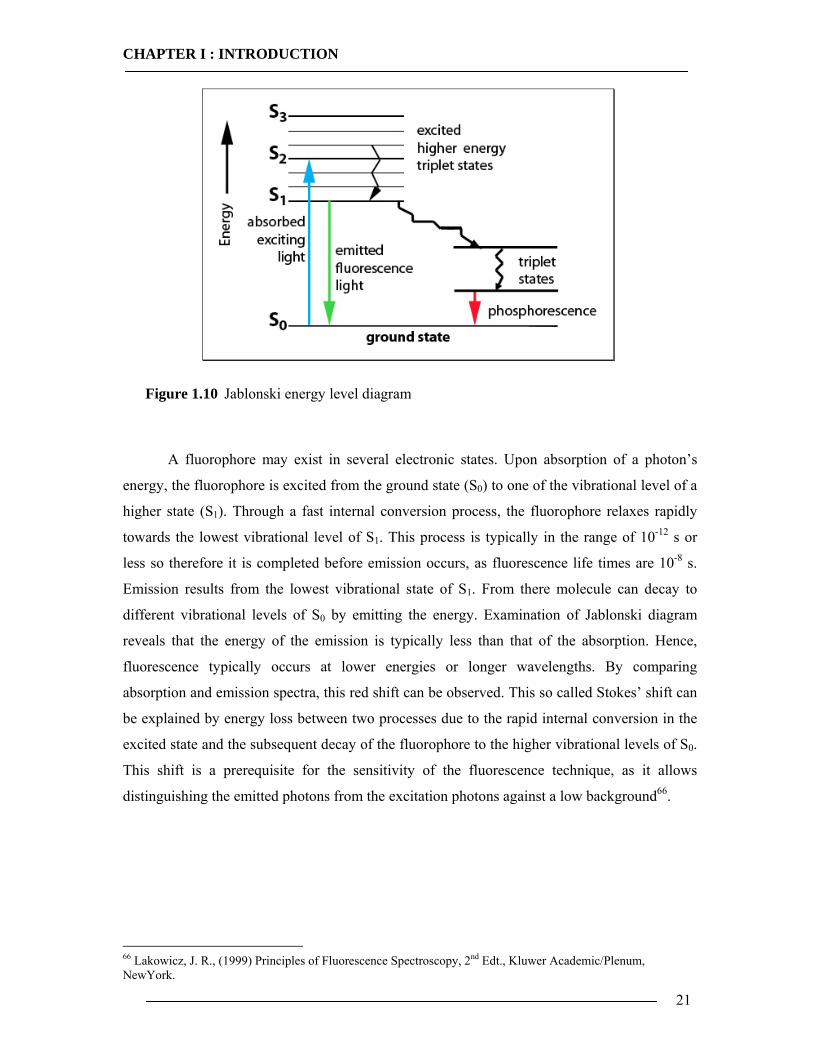
ground state. Three-step process is responsible for fluorescence which is illustrated in Figure
1.10 which is named as Jablonski diagram.
63 Knobloch, H., Brunner, A., Leitner, A., Aussenegg, F., Knoll, W., (1993) Journal of Chemical Physics, 98, 10093. 64 Vasilev, K., Knoll, W., Kreiter, M., (2004) Journal of Chemical Physics, 120, 3439. 65 Yu, F., Yao, D., Knoll, W., (2003) Analytical Chemistry, 75, 2610.
CHAPTER I : INTRODUCTION
21
Figure 1.10 Jablonski energy level diagram
A fluorophore may exist in several electronic states. Upon absorption of a photon’s
energy, the fluorophore is excited from the ground state (S0) to one of the vibrational level of a
higher state (S1). Through a fast internal conversion process, the fluorophore relaxes rapidly
towards the lowest vibrational level of S1. This process is typically in the range of 10-12 s or
less so therefore it is completed before emission occurs, as fluorescence life times are 10-8 s.
Emission results from the lowest vibrational state of S1. From there molecule can decay to
different vibrational levels of S0 by emitting the energy. Examination of Jablonski diagram
reveals that the energy of the emission is typically less than that of the absorption. Hence,
fluorescence typically occurs at lower energies or longer wavelengths. By comparing
absorption and emission spectra, this red shift can be observed. This so called Stokes’ shift can
be explained by energy loss between two processes due to the rapid internal conversion in the
excited state and the subsequent decay of the fluorophore to the higher vibrational levels of S0.
This shift is a prerequisite for the sensitivity of the fluorescence technique, as it allows
distinguishing the emitted photons from the excitation photons against a low background66.
66 Lakowicz, J. R., (1999) Principles of Fluorescence Spectroscopy, 2nd Edt., Kluwer Academic/Plenum, NewYork.
CHAPTER I : INTRODUCTION
22
1.2.5.3 Contact Angle
Contact angle (CA) measurements consist of the analysis of the shape of a droplet on a
surface67. This method reveals information about hydrophilicity of surfaces. Wetting of a
surface is a sensitive process and it depends strongly on the chemical composition of a surface.
CA measurements can quantify the wettability as these measurements react sensible on small
chances of the surface. The CA is a measure for the energetic interaction between solid and
liquid and thus gives information about the hydrophobicity and hydrophilicity of a surface68. If
a solvent shows complete wetting, this is called spreading and a film is generated. For
incomplete wetting, a droplet is created so CA can be determined. The outer form of droplet
results from the minimization of free energy of the surface and the gas phase. This relation is
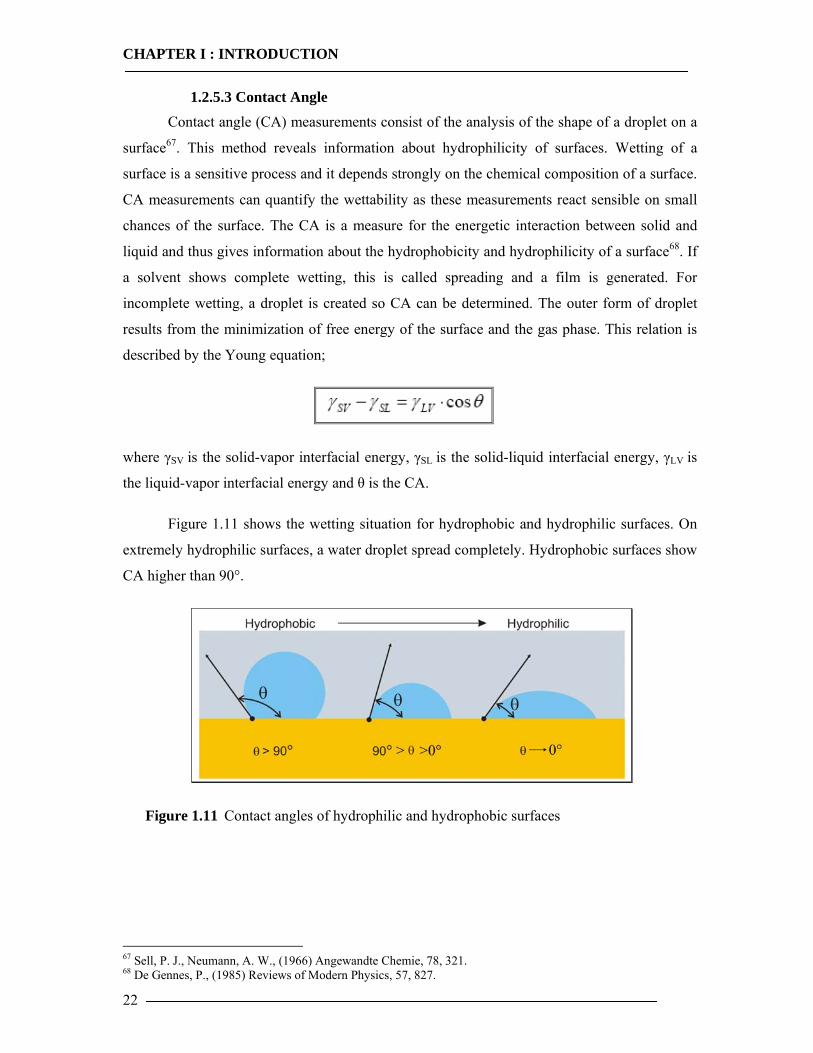
described by the Young equation;
where γSV is the solid-vapor interfacial energy, γSL is the solid-liquid interfacial energy, γLV is
the liquid-vapor interfacial energy and θ is the CA.
Figure 1.11 shows the wetting situation for hydrophobic and hydrophilic surfaces. On
extremely hydrophilic surfaces, a water droplet spread completely. Hydrophobic surfaces show
CA higher than 90°.
Figure 1.11 Contact angles of hydrophilic and hydrophobic surfaces
67 Sell, P. J., Neumann, A. W., (1966) Angewandte Chemie, 78, 321. 68 De Gennes, P., (1985) Reviews of Modern Physics, 57, 827.
CHAPTER II : MATERIALS & METHODS
23
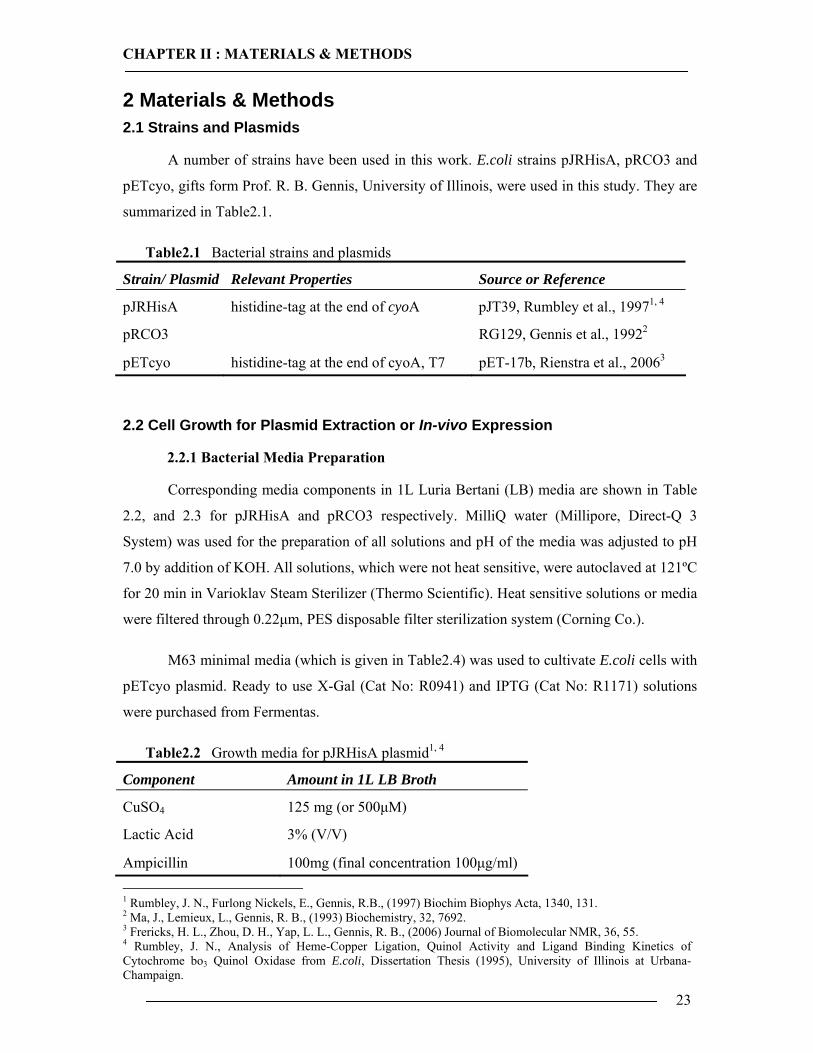
2 Materials & Methods 2.1 Strains and Plasmids
A number of strains have been used in this work. E.coli strains pJRHisA, pRCO3 and
pETcyo, gifts form Prof. R. B. Gennis, University of Illinois, were used in this study. They are
summarized in Table2.1.
Table2.1 Bacterial strains and plasmids
Strain/ Plasmid Relevant Properties Source or Reference
pJRHisA histidine-tag at the end of cyoA pJT39, Rumbley et al., 19971, 4
pRCO3 RG129, Gennis et al., 19922
pETcyo histidine-tag at the end of cyoA, T7 pET-17b, Rienstra et al., 20063
2.2 Cell Growth for Plasmid Extraction or In-vivo Expression
2.2.1 Bacterial Media Preparation
Corresponding media components in 1L Luria Bertani (LB) media are shown in Table
2.2, and 2.3 for pJRHisA and pRCO3 respectively. MilliQ water (Millipore, Direct-Q 3
System) was used for the preparation of all solutions and pH of the media was adjusted to pH
7.0 by addition of KOH. All solutions, which were not heat sensitive, were autoclaved at 121ºC
for 20 min in Varioklav Steam Sterilizer (Thermo Scientific). Heat sensitive solutions or media
were filtered through 0.22µm, PES disposable filter sterilization system (Corning Co.).
M63 minimal media (which is given in Table2.4) was used to cultivate E.coli cells with
pETcyo plasmid. Ready to use X-Gal (Cat No: R0941) and IPTG (Cat No: R1171) solutions
were purchased from Fermentas.
Table2.2 Growth media for pJRHisA plasmid1, 4
Component Amount in 1L LB Broth
CuSO4 125 mg (or 500µM)
Lactic Acid 3% (V/V)
Ampicillin 100mg (final concentration 100µg/ml)
1 Rumbley, J. N., Furlong Nickels, E., Gennis, R.B., (1997) Biochim Biophys Acta, 1340, 131. 2 Ma, J., Lemieux, L., Gennis, R. B., (1993) Biochemistry, 32, 7692. 3 Frericks, H. L., Zhou, D. H., Yap, L. L., Gennis, R. B., (2006) Journal of Biomolecular NMR, 36, 55. 4 Rumbley, J. N., Analysis of Heme-Copper Ligation, Quinol Activity and Ligand Binding Kinetics of Cytochrome bo3 Quinol Oxidase from E.coli, Dissertation Thesis (1995), University of Illinois at Urbana-Champaign.
CHAPTER II : MATERIALS & METHODS
24
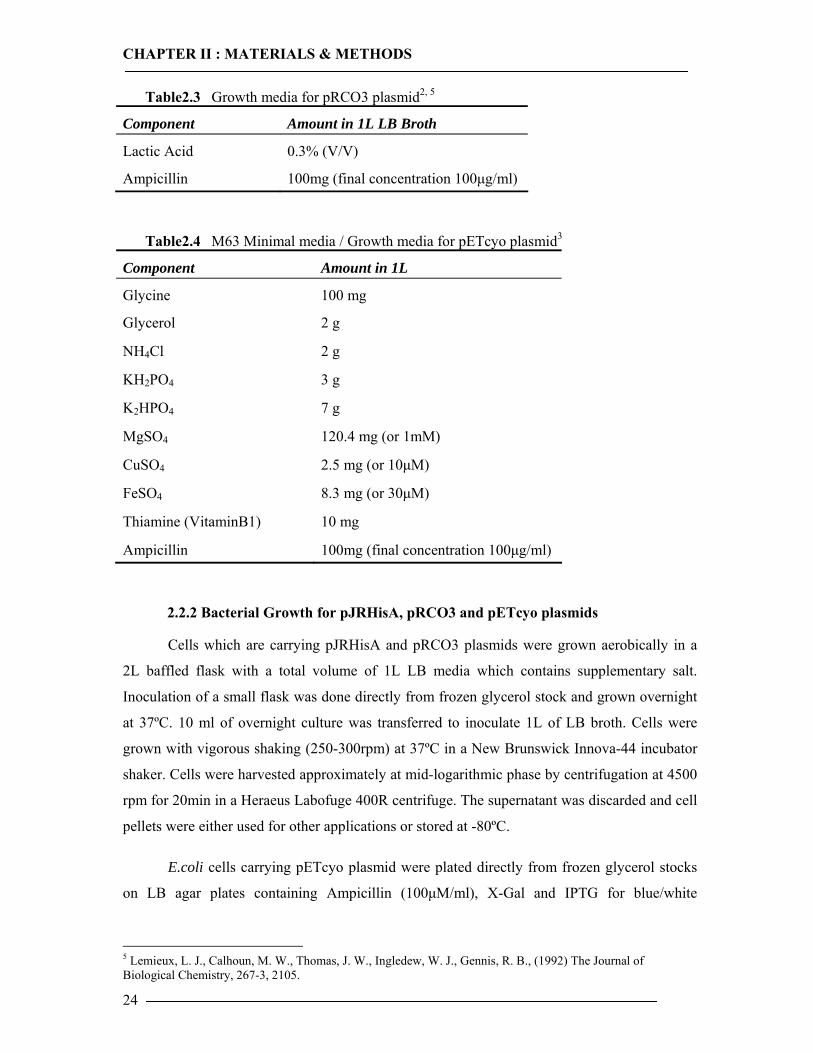
Table2.3 Growth media for pRCO3 plasmid2, 5
Component Amount in 1L LB Broth
Lactic Acid 0.3% (V/V)
Ampicillin 100mg (final concentration 100µg/ml)
Table2.4 M63 Minimal media / Growth media for pETcyo plasmid3
Component Amount in 1L
Glycine 100 mg
Glycerol 2 g
NH4Cl 2 g
KH2PO4 3 g
K2HPO4 7 g
MgSO4 120.4 mg (or 1mM)
CuSO4 2.5 mg (or 10µM)
FeSO4 8.3 mg (or 30µM)
Thiamine (VitaminB1) 10 mg
Ampicillin 100mg (final concentration 100µg/ml)
2.2.2 Bacterial Growth for pJRHisA, pRCO3 and pETcyo plasmids
Cells which are carrying pJRHisA and pRCO3 plasmids were grown aerobically in a
2L baffled flask with a total volume of 1L LB media which contains supplementary salt.
Inoculation of a small flask was done directly from frozen glycerol stock and grown overnight
at 37ºC. 10 ml of overnight culture was transferred to inoculate 1L of LB broth. Cells were
grown with vigorous shaking (250-300rpm) at 37ºC in a New Brunswick Innova-44 incubator
shaker. Cells were harvested approximately at mid-logarithmic phase by centrifugation at 4500
rpm for 20min in a Heraeus Labofuge 400R centrifuge. The supernatant was discarded and cell
pellets were either used for other applications or stored at -80ºC.
E.coli cells carrying pETcyo plasmid were plated directly from frozen glycerol stocks
on LB agar plates containing Ampicillin (100µM/ml), X-Gal and IPTG for blue/white
5 Lemieux, L. J., Calhoun, M. W., Thomas, J. W., Ingledew, W. J., Gennis, R. B., (1992) The Journal of Biological Chemistry, 267-3, 2105.
CHAPTER II : MATERIALS & METHODS
25
screening6 of colonies. Individual blue colonies were picked for inoculation of small flask and
transferred in 1L media as described above. Cells were grown aerobically in 1L M63 minimal
media which is given in Table2.4. Supplementation of trace metals and vitamins was optimized
and determined to be critical for heme production and increased production of active enzyme.
IPTG induction was done at early-logarithmic phase. Over expression of Cyt-bo3 was complete
4 h after induction and cells were pelleted at 4500 rpm for 20min. Pellets were stored at -80ºC
for further applications.
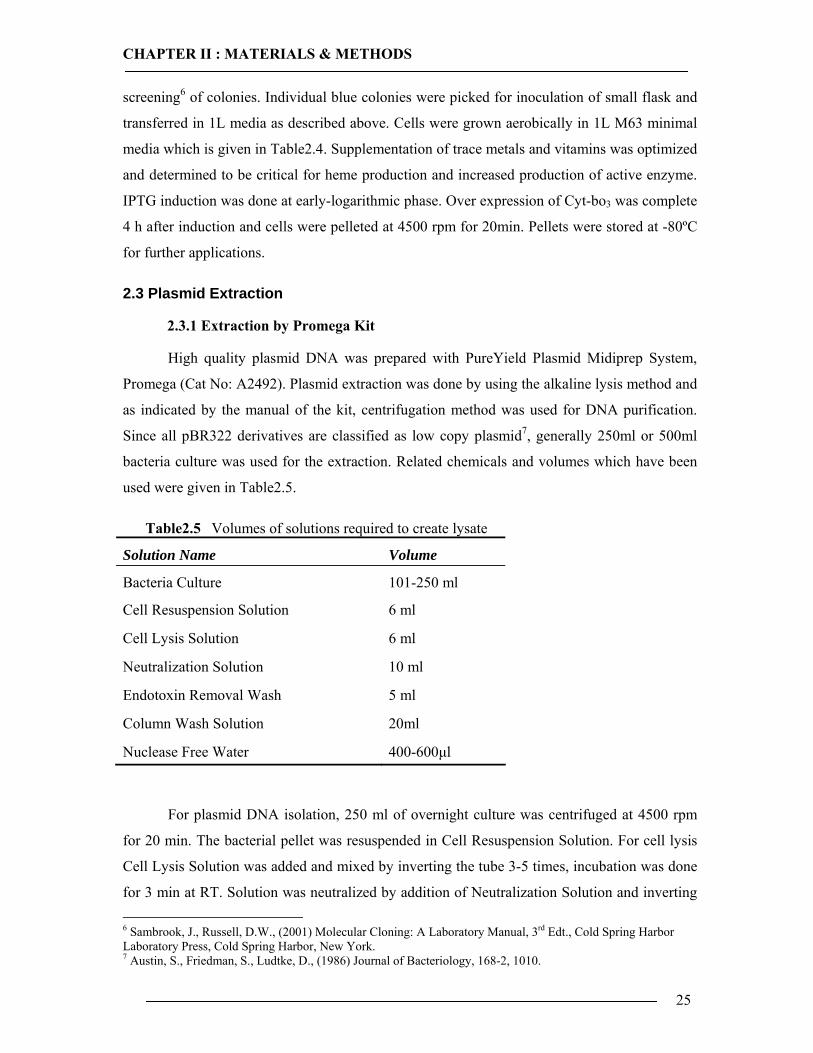
2.3 Plasmid Extraction
2.3.1 Extraction by Promega Kit
High quality plasmid DNA was prepared with PureYield Plasmid Midiprep System,
Promega (Cat No: A2492). Plasmid extraction was done by using the alkaline lysis method and
as indicated by the manual of the kit, centrifugation method was used for DNA purification.
Since all pBR322 derivatives are classified as low copy plasmid7, generally 250ml or 500ml
bacteria culture was used for the extraction. Related chemicals and volumes which have been
used were given in Table2.5.
Table2.5 Volumes of solutions required to create lysate
Solution Name Volume
Bacteria Culture 101-250 ml
Cell Resuspension Solution 6 ml
Cell Lysis Solution 6 ml
Neutralization Solution 10 ml
Endotoxin Removal Wash 5 ml
Column Wash Solution 20ml
Nuclease Free Water 400-600µl
For plasmid DNA isolation, 250 ml of overnight culture was centrifuged at 4500 rpm
for 20 min. The bacterial pellet was resuspended in Cell Resuspension Solution. For cell lysis
Cell Lysis Solution was added and mixed by inverting the tube 3-5 times, incubation was done
for 3 min at RT. Solution was neutralized by addition of Neutralization Solution and inverting 6 Sambrook, J., Russell, D.W., (2001) Molecular Cloning: A Laboratory Manual, 3rd Edt., Cold Spring Harbor Laboratory Press, Cold Spring Harbor, New York. 7 Austin, S., Friedman, S., Ludtke, D., (1986) Journal of Bacteriology, 168-2, 1010.
CHAPTER II : MATERIALS & METHODS
26
3-5 times. Neutralization was complete after 2-3 minutes incubation at RT. Cell debris was
removed by centrifugation at 3500 rpm for 5 min with PureYield Clearing Column. Filtered
lysate containing DNA was poured into PureYield Binding Column and centrifuged for 3 min
at 3500 rpm. Endotoxin Removal Wash was added to remove substantial amount of protein,
RNA and other endotoxin contaminants, and centrifuged at 3500 rpm for 3 min. Column Wash
Solution was added to the column and followed by centrifugation at 3500 rpm for 5 min and
additional 10 min run was performed to ensure the removal of ethanol. Nuclease-free water
was added to the column and DNA was collected after centrifugation at 4000 rpm, 5min.
2.3.2 Ethanol Precipitation
For subsequent applications, such as in-vitro expression, higher concentration of
plasmid DNA and purity was needed. Therefore, ethanol precipitation was performed after
plasmid extraction. This treatment of the plasmid DNA was carried out as following;
• Add 1/10 volume of NaAc (3M, pH 4.8) to the low concentration plasmid DNA
and mix gently.
• Add 2 volume of 95-100 % EtOH and mix gently.
• Place sample at -80ºC for 30 min.
• Centrifugate the sample at 12,000 rpm (4ºC) for 30min.
• Decant supernatant and drain samples on a paper towel on the bench.
• Resuspend DNA in nuclease free water for desired concentration.
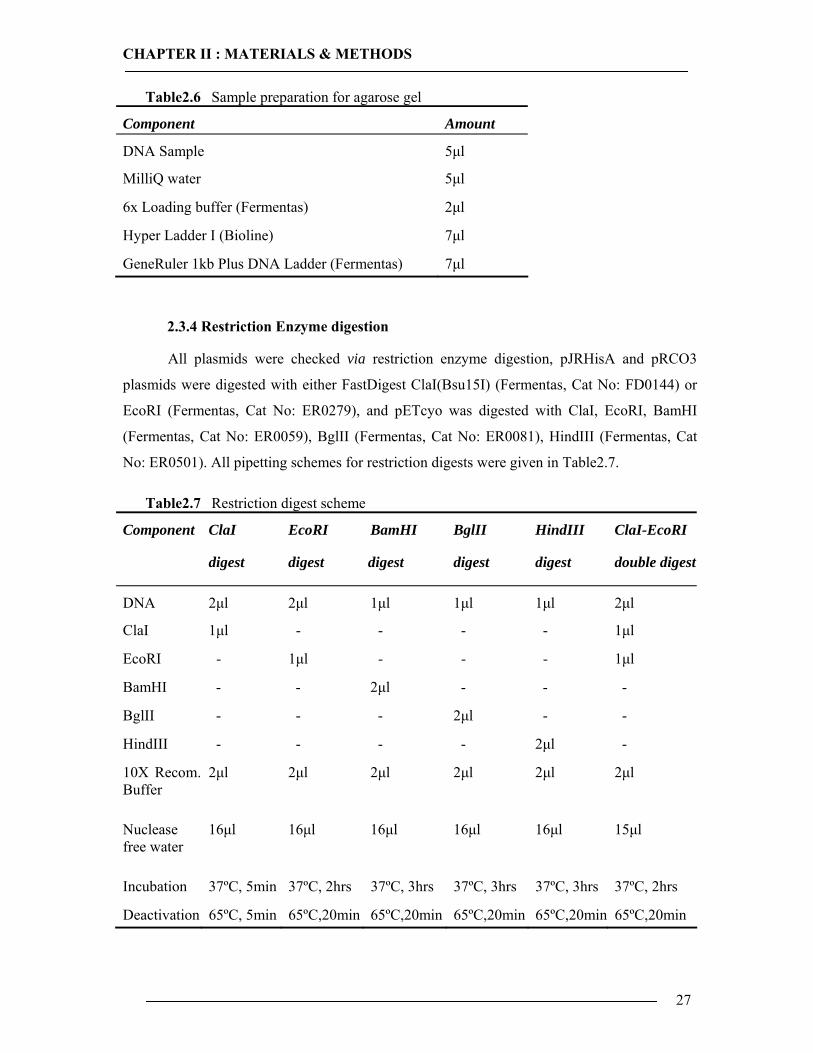
2.3.3 Gel Electrophoresis Analysis
Extracted plasmid DNA and restricted linear DNA samples were separated in
horizontal gel electrophoresis chamber (Agagel Mini, Biometra) according to their molecular
size. 1% agarose was boiled in 1xTAE buffer (30ml) for 2-3 min and after cooling down at
~60ºC and 3µl of SYBRSafe DNA stain (Invitrogen, Cat No: S33102) was applied. 1xTAE
buffer was used as electrophoresis buffer as well. DNA samples were diluted with loading
buffer, amounts and markers which have been used were given in Table2.6. Gel
electrophoresis was carried out at 120V during 55 min.
CHAPTER II : MATERIALS & METHODS
27
Table2.6 Sample preparation for agarose gel
Component Amount
DNA Sample 5µl
MilliQ water 5µl
6x Loading buffer (Fermentas) 2µl
Hyper Ladder I (Bioline) 7µl
GeneRuler 1kb Plus DNA Ladder (Fermentas) 7µl
2.3.4 Restriction Enzyme digestion
All plasmids were checked via restriction enzyme digestion, pJRHisA and pRCO3
plasmids were digested with either FastDigest ClaI(Bsu15I) (Fermentas, Cat No: FD0144) or
EcoRI (Fermentas, Cat No: ER0279), and pETcyo was digested with ClaI, EcoRI, BamHI
(Fermentas, Cat No: ER0059), BglII (Fermentas, Cat No: ER0081), HindIII (Fermentas, Cat
No: ER0501). All pipetting schemes for restriction digests were given in Table2.7.
Table2.7 Restriction digest scheme
Component ClaI
digest
EcoRI
digest
BamHI
digest
BglII
digest
HindIII
digest
ClaI-EcoRI
double digest
DNA 2µl 2µl 1µl 1µl 1µl 2µl
ClaI 1µl - - - - 1µl
EcoRI - 1µl - - - 1µl
BamHI - - 2µl - - -
BglII - - - 2µl - -
HindIII - - - - 2µl -
10X Recom. Buffer
2µl 2µl 2µl 2µl 2µl 2µl
Nuclease free water
16µl 16µl 16µl 16µl 16µl 15µl
Incubation 37ºC, 5min 37ºC, 2hrs 37ºC, 3hrs 37ºC, 3hrs 37ºC, 3hrs 37ºC, 2hrs
Deactivation 65ºC, 5min 65ºC,20min 65ºC,20min 65ºC,20min 65ºC,20min 65ºC,20min
CHAPTER II : MATERIALS & METHODS
28
2.4 Purification of In-vivo Cytochrome bo3 Ubiquinol Oxidase
2.4.1 Purification of Histidine Tagged Enzyme
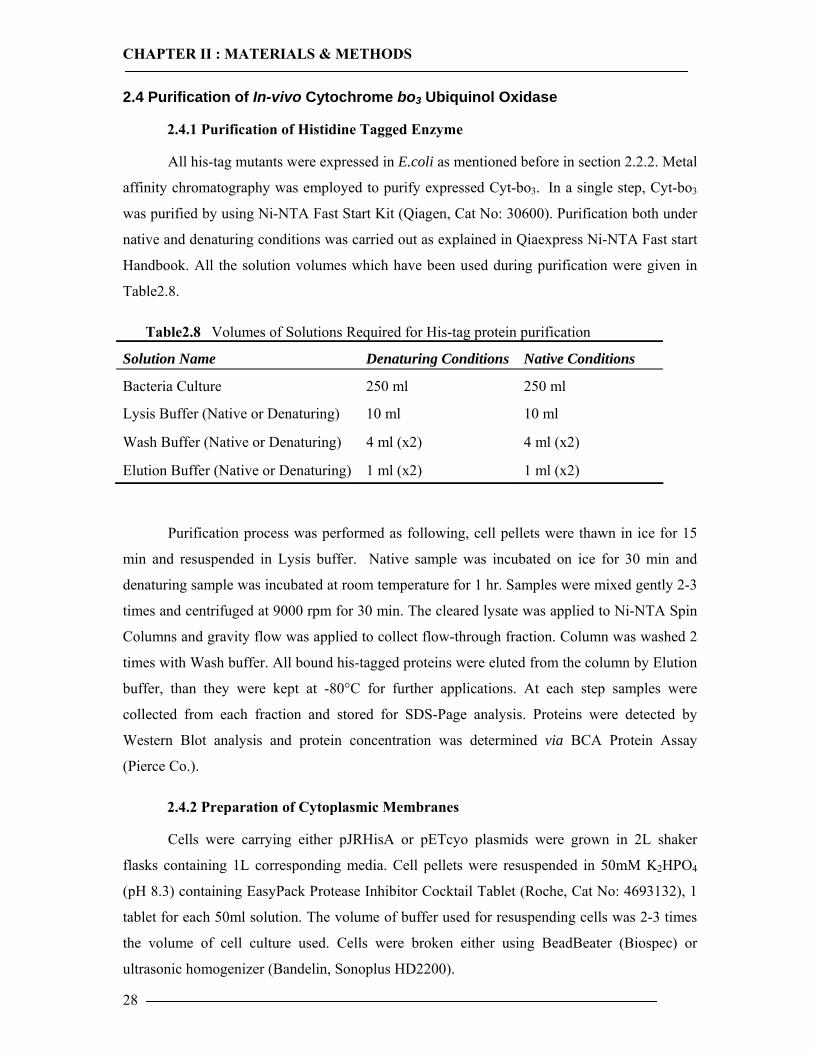
All his-tag mutants were expressed in E.coli as mentioned before in section 2.2.2. Metal
affinity chromatography was employed to purify expressed Cyt-bo3. In a single step, Cyt-bo3
was purified by using Ni-NTA Fast Start Kit (Qiagen, Cat No: 30600). Purification both under
native and denaturing conditions was carried out as explained in Qiaexpress Ni-NTA Fast start
Handbook. All the solution volumes which have been used during purification were given in
Table2.8.
Table2.8 Volumes of Solutions Required for His-tag protein purification
Solution Name Denaturing Conditions Native Conditions
Bacteria Culture 250 ml 250 ml
Lysis Buffer (Native or Denaturing) 10 ml 10 ml
Wash Buffer (Native or Denaturing) 4 ml (x2) 4 ml (x2)
Elution Buffer (Native or Denaturing) 1 ml (x2) 1 ml (x2)
Purification process was performed as following, cell pellets were thawn in ice for 15
min and resuspended in Lysis buffer. Native sample was incubated on ice for 30 min and
denaturing sample was incubated at room temperature for 1 hr. Samples were mixed gently 2-3
times and centrifuged at 9000 rpm for 30 min. The cleared lysate was applied to Ni-NTA Spin
Columns and gravity flow was applied to collect flow-through fraction. Column was washed 2
times with Wash buffer. All bound his-tagged proteins were eluted from the column by Elution
buffer, than they were kept at -80°C for further applications. At each step samples were
collected from each fraction and stored for SDS-Page analysis. Proteins were detected by
Western Blot analysis and protein concentration was determined via BCA Protein Assay
(Pierce Co.).
2.4.2 Preparation of Cytoplasmic Membranes
Cells were carrying either pJRHisA or pETcyo plasmids were grown in 2L shaker
flasks containing 1L corresponding media. Cell pellets were resuspended in 50mM K2HPO4
(pH 8.3) containing EasyPack Protease Inhibitor Cocktail Tablet (Roche, Cat No: 4693132), 1
tablet for each 50ml solution. The volume of buffer used for resuspending cells was 2-3 times
the volume of cell culture used. Cells were broken either using BeadBeater (Biospec) or
ultrasonic homogenizer (Bandelin, Sonoplus HD2200).
CHAPTER II : MATERIALS & METHODS
29
Cell debris was removed by centrifugation at 9000 rpm for 15 min (Eppendorf 5810R
centrifuge) at 4ºC. Membranes were pelletted by centrifugation of supernatant at 47,000 rpm in
Beckman UltraMax ultracentrifuge at 4ºC for 3 hrs. Pellet was resuspended in 50mM K2HPO4
(pH 8.3) and solubilized by addition of TritonX-100 (1%) and octyl glucoside (1.25%). The
solution was mixed 1-2 hrs, prior to solubilization of membrane pellet, and kept in ice.
Solution was centrifuged again at 30,000 rpm, 4ºC for 20 min to remove all insoluble material.
Amicon Ultra-15 Centrifugal Filter (Millipore, Cat No: UF905024) was used to concentrate the
final solution at 4500 rpm for 15 min. Concentrated supernatant was stored at -80ºC and used
as a positive control for further applications such as, spectroscopic analysis and enzyme
activity assay.
2.5 In-vitro Expression of Cytochrome bo3 Ubiquinol Oxidase
2.5.1 Promega E.coli Kit
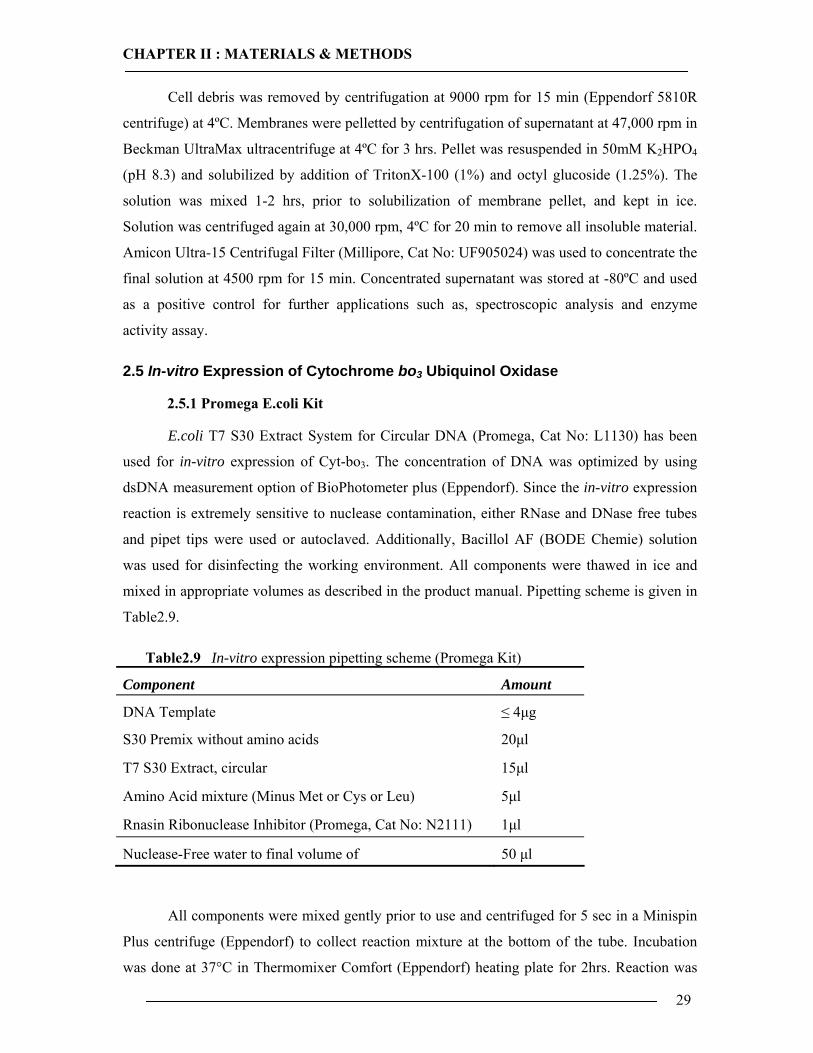
E.coli T7 S30 Extract System for Circular DNA (Promega, Cat No: L1130) has been
used for in-vitro expression of Cyt-bo3. The concentration of DNA was optimized by using
dsDNA measurement option of BioPhotometer plus (Eppendorf). Since the in-vitro expression
reaction is extremely sensitive to nuclease contamination, either RNase and DNase free tubes
and pipet tips were used or autoclaved. Additionally, Bacillol AF (BODE Chemie) solution
was used for disinfecting the working environment. All components were thawed in ice and
mixed in appropriate volumes as described in the product manual. Pipetting scheme is given in
Table2.9.
Table2.9 In-vitro expression pipetting scheme (Promega Kit)
Component Amount
DNA Template ≤ 4µg
S30 Premix without amino acids 20µl
T7 S30 Extract, circular 15µl
Amino Acid mixture (Minus Met or Cys or Leu) 5µl
Rnasin Ribonuclease Inhibitor (Promega, Cat No: N2111) 1µl
Nuclease-Free water to final volume of 50 µl
All components were mixed gently prior to use and centrifuged for 5 sec in a Minispin
Plus centrifuge (Eppendorf) to collect reaction mixture at the bottom of the tube. Incubation
was done at 37°C in Thermomixer Comfort (Eppendorf) heating plate for 2hrs. Reaction was
CHAPTER II : MATERIALS & METHODS
30
stopped by placing the tube in ice and kept at -80°C either for further applications or directly
analyzed via Western Blot analysis.
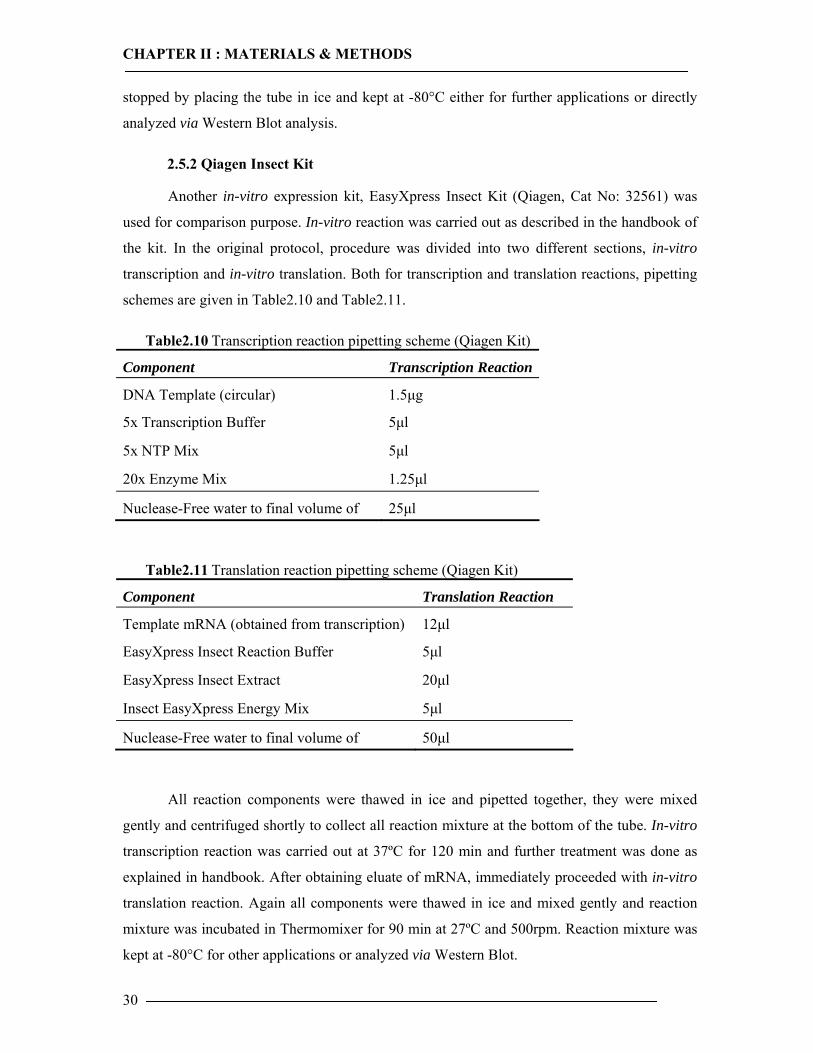
2.5.2 Qiagen Insect Kit
Another in-vitro expression kit, EasyXpress Insect Kit (Qiagen, Cat No: 32561) was
used for comparison purpose. In-vitro reaction was carried out as described in the handbook of
the kit. In the original protocol, procedure was divided into two different sections, in-vitro
transcription and in-vitro translation. Both for transcription and translation reactions, pipetting
schemes are given in Table2.10 and Table2.11.
Table2.10 Transcription reaction pipetting scheme (Qiagen Kit)
Component Transcription Reaction
DNA Template (circular) 1.5µg
5x Transcription Buffer 5µl
5x NTP Mix 5µl
20x Enzyme Mix 1.25µl
Nuclease-Free water to final volume of 25µl
Table2.11 Translation reaction pipetting scheme (Qiagen Kit)
Component Translation Reaction
Template mRNA (obtained from transcription) 12µl
EasyXpress Insect Reaction Buffer 5µl
EasyXpress Insect Extract 20µl
Insect EasyXpress Energy Mix 5µl
Nuclease-Free water to final volume of 50µl
All reaction components were thawed in ice and pipetted together, they were mixed
gently and centrifuged shortly to collect all reaction mixture at the bottom of the tube. In-vitro
transcription reaction was carried out at 37ºC for 120 min and further treatment was done as
explained in handbook. After obtaining eluate of mRNA, immediately proceeded with in-vitro
translation reaction. Again all components were thawed in ice and mixed gently and reaction
mixture was incubated in Thermomixer for 90 min at 27ºC and 500rpm. Reaction mixture was
kept at -80°C for other applications or analyzed via Western Blot.
CHAPTER II : MATERIALS & METHODS
31
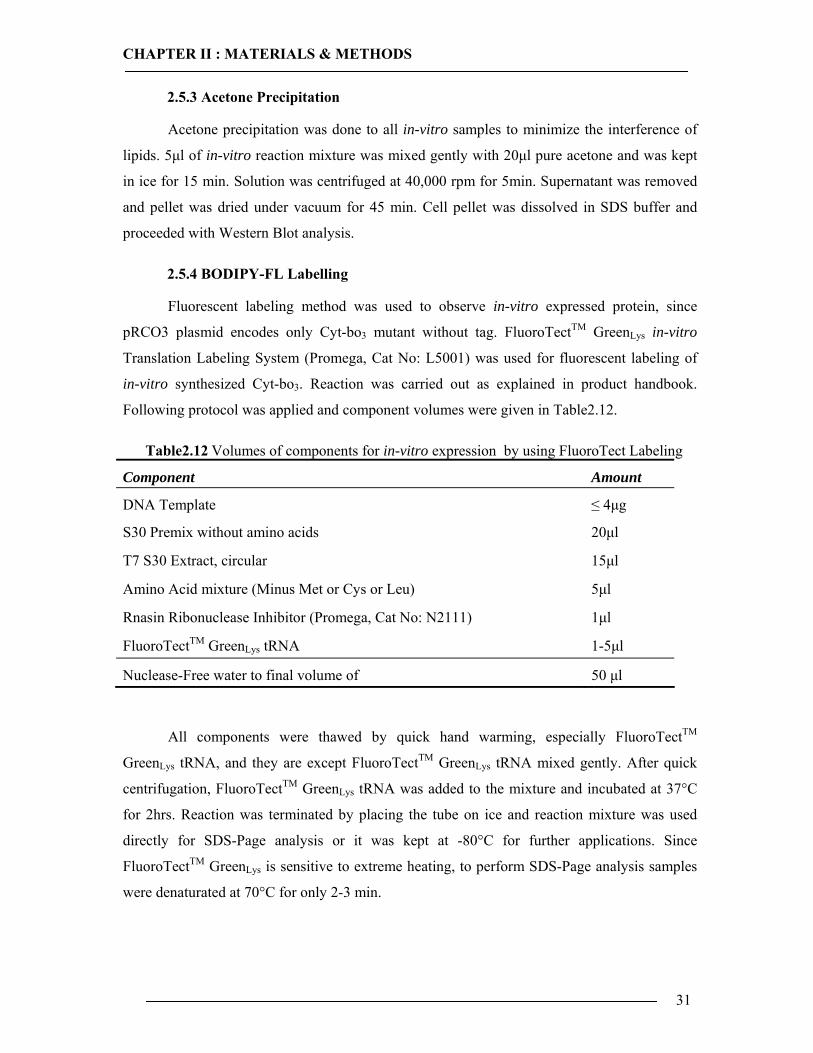
2.5.3 Acetone Precipitation
Acetone precipitation was done to all in-vitro samples to minimize the interference of
lipids. 5µl of in-vitro reaction mixture was mixed gently with 20µl pure acetone and was kept
in ice for 15 min. Solution was centrifuged at 40,000 rpm for 5min. Supernatant was removed
and pellet was dried under vacuum for 45 min. Cell pellet was dissolved in SDS buffer and
proceeded with Western Blot analysis.
2.5.4 BODIPY-FL Labelling
Fluorescent labeling method was used to observe in-vitro expressed protein, since
pRCO3 plasmid encodes only Cyt-bo3 mutant without tag. FluoroTectTM GreenLys in-vitro
Translation Labeling System (Promega, Cat No: L5001) was used for fluorescent labeling of
in-vitro synthesized Cyt-bo3. Reaction was carried out as explained in product handbook.
Following protocol was applied and component volumes were given in Table2.12.
Table2.12 Volumes of components for in-vitro expression by using FluoroTect Labeling
Component Amount
DNA Template ≤ 4µg
S30 Premix without amino acids 20µl
T7 S30 Extract, circular 15µl
Amino Acid mixture (Minus Met or Cys or Leu) 5µl
Rnasin Ribonuclease Inhibitor (Promega, Cat No: N2111) 1µl
FluoroTectTM GreenLys tRNA 1-5µl
Nuclease-Free water to final volume of 50 µl
All components were thawed by quick hand warming, especially FluoroTectTM
GreenLys tRNA, and they are except FluoroTectTM GreenLys tRNA mixed gently. After quick
centrifugation, FluoroTectTM GreenLys tRNA was added to the mixture and incubated at 37°C
for 2hrs. Reaction was terminated by placing the tube on ice and reaction mixture was used
directly for SDS-Page analysis or it was kept at -80°C for further applications. Since
FluoroTectTM GreenLys is sensitive to extreme heating, to perform SDS-Page analysis samples
were denaturated at 70°C for only 2-3 min.
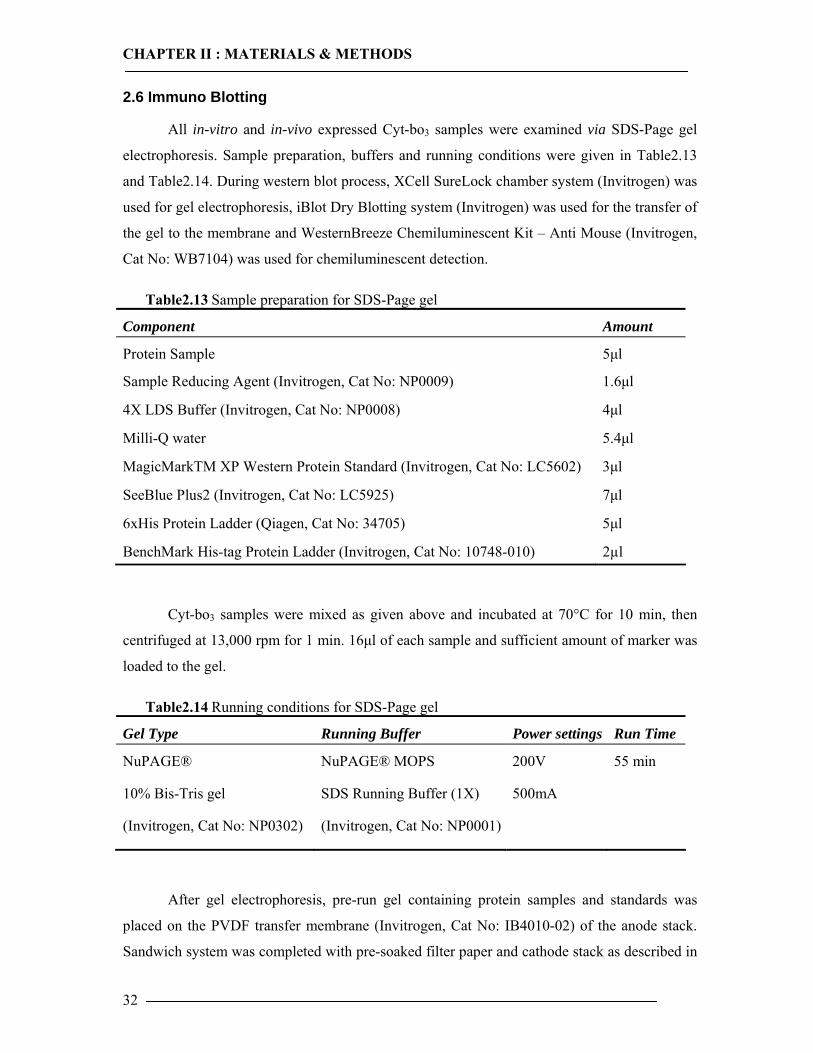
CHAPTER II : MATERIALS & METHODS
32
2.6 Immuno Blotting
All in-vitro and in-vivo expressed Cyt-bo3 samples were examined via SDS-Page gel
electrophoresis. Sample preparation, buffers and running conditions were given in Table2.13
and Table2.14. During western blot process, XCell SureLock chamber system (Invitrogen) was
used for gel electrophoresis, iBlot Dry Blotting system (Invitrogen) was used for the transfer of
the gel to the membrane and WesternBreeze Chemiluminescent Kit – Anti Mouse (Invitrogen,
Cat No: WB7104) was used for chemiluminescent detection.
Table2.13 Sample preparation for SDS-Page gel
Component Amount
Protein Sample 5µl
Sample Reducing Agent (Invitrogen, Cat No: NP0009) 1.6µl
4X LDS Buffer (Invitrogen, Cat No: NP0008) 4µl
Milli-Q water 5.4µl
MagicMarkTM XP Western Protein Standard (Invitrogen, Cat No: LC5602) 3µl
SeeBlue Plus2 (Invitrogen, Cat No: LC5925) 7µl
6xHis Protein Ladder (Qiagen, Cat No: 34705) 5µl
BenchMark His-tag Protein Ladder (Invitrogen, Cat No: 10748-010) 2µl
Cyt-bo3 samples were mixed as given above and incubated at 70°C for 10 min, then
centrifuged at 13,000 rpm for 1 min. 16µl of each sample and sufficient amount of marker was
loaded to the gel.
Table2.14 Running conditions for SDS-Page gel
Gel Type Running Buffer Power settings Run Time
NuPAGE®
10% Bis-Tris gel
(Invitrogen, Cat No: NP0302)
NuPAGE® MOPS
SDS Running Buffer (1X)
(Invitrogen, Cat No: NP0001)
200V
500mA
55 min
After gel electrophoresis, pre-run gel containing protein samples and standards was
placed on the PVDF transfer membrane (Invitrogen, Cat No: IB4010-02) of the anode stack.
Sandwich system was completed with pre-soaked filter paper and cathode stack as described in
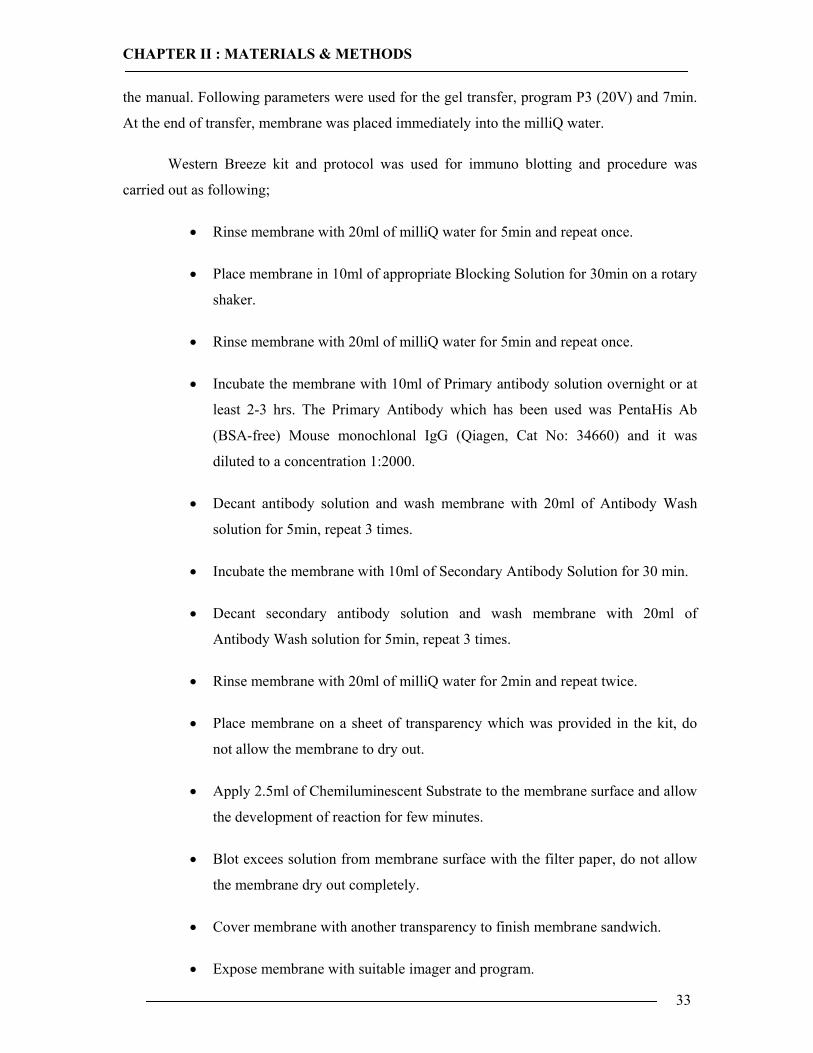
CHAPTER II : MATERIALS & METHODS
33
the manual. Following parameters were used for the gel transfer, program P3 (20V) and 7min.
At the end of transfer, membrane was placed immediately into the milliQ water.
Western Breeze kit and protocol was used for immuno blotting and procedure was
carried out as following;
• Rinse membrane with 20ml of milliQ water for 5min and repeat once.
• Place membrane in 10ml of appropriate Blocking Solution for 30min on a rotary
shaker.
• Rinse membrane with 20ml of milliQ water for 5min and repeat once.
• Incubate the membrane with 10ml of Primary antibody solution overnight or at
least 2-3 hrs. The Primary Antibody which has been used was PentaHis Ab
(BSA-free) Mouse monochlonal IgG (Qiagen, Cat No: 34660) and it was
diluted to a concentration 1:2000.
• Decant antibody solution and wash membrane with 20ml of Antibody Wash
solution for 5min, repeat 3 times.
• Incubate the membrane with 10ml of Secondary Antibody Solution for 30 min.
• Decant secondary antibody solution and wash membrane with 20ml of
Antibody Wash solution for 5min, repeat 3 times.
• Rinse membrane with 20ml of milliQ water for 2min and repeat twice.
• Place membrane on a sheet of transparency which was provided in the kit, do
not allow the membrane to dry out.
• Apply 2.5ml of Chemiluminescent Substrate to the membrane surface and allow
the development of reaction for few minutes.
• Blot excees solution from membrane surface with the filter paper, do not allow
the membrane dry out completely.
• Cover membrane with another transparency to finish membrane sandwich.
• Expose membrane with suitable imager and program.

CHAPTER II : MATERIALS & METHODS
34
To complete western blotting procedure, LAS 3000 Imaging System (Fuji) was used
and exposure details are given in Table2.15.
Table2.15 Exposure conditions for Western Blotting
Exposure Type Interval Time Sensitivity/Resolution Dark box settings
Increment
3-5 min
Standard Chemiluminescent Method
Light: none
Filter: through
Iris: F2.8
2.6.1 Coomassie Staining
After gel electrophoresis, instructions were followed as explained in the manual of
SimplyBlueTM SafeStain product (Invitrogen, Cat No: LC6060). Gel was removed completely
from gel cassette and was rinsed 3 times with 100ml milliQ water for 5min. Than, it was
stained in 20-25 ml of SimplyBlue staining solution up to 3 hrs. For over night incubation,
20% NaCl (w/v) solution was added to the staining solution. After staining the gel, it was
washed with 100ml milliQ water for 1hr. Image was displayed immediately.
2.7 Spectroscopic Quantification of Enzyme
2.7.1 Reduction of UQ Substrate
Enzyme activity of Cyt-bo3 was monitored via UV-Vis spectroscopy. Ubiquinone-1 or
in other words Coenzyme-Q (Sigma, Cat No: C7956) was used as an analog of substrate.
Ubiquinone (UQ) was reduced as explained elsewhere 4,8.
20mg UQ was dissolved in 3ml absolute ethanol and 3ml, 0.1M K2HPO4 (pH 6.5).
15µl, 1.2M HCl was added in this mixture and the solution was bubbled for 10 min with N2. A
few grains of sodium hydrosulfite/dithionite (Acros, Cat No:169590256) and sodium
borohydride (Sigma-Aldrich, Cat No: 452882) were added till solution become colorless, than
the solution was bubbled again with N2 for 10min. Solution was extracted with 3ml
cyclohexane three times and top phase was collected. Extracted material was dried under N2
stream. Colorless oily residue was resuspended in 2.5ml DMSO containing 6mM HCl. Final
8 Rieske, J. S., (1967) Methods in Enzymology, 239.
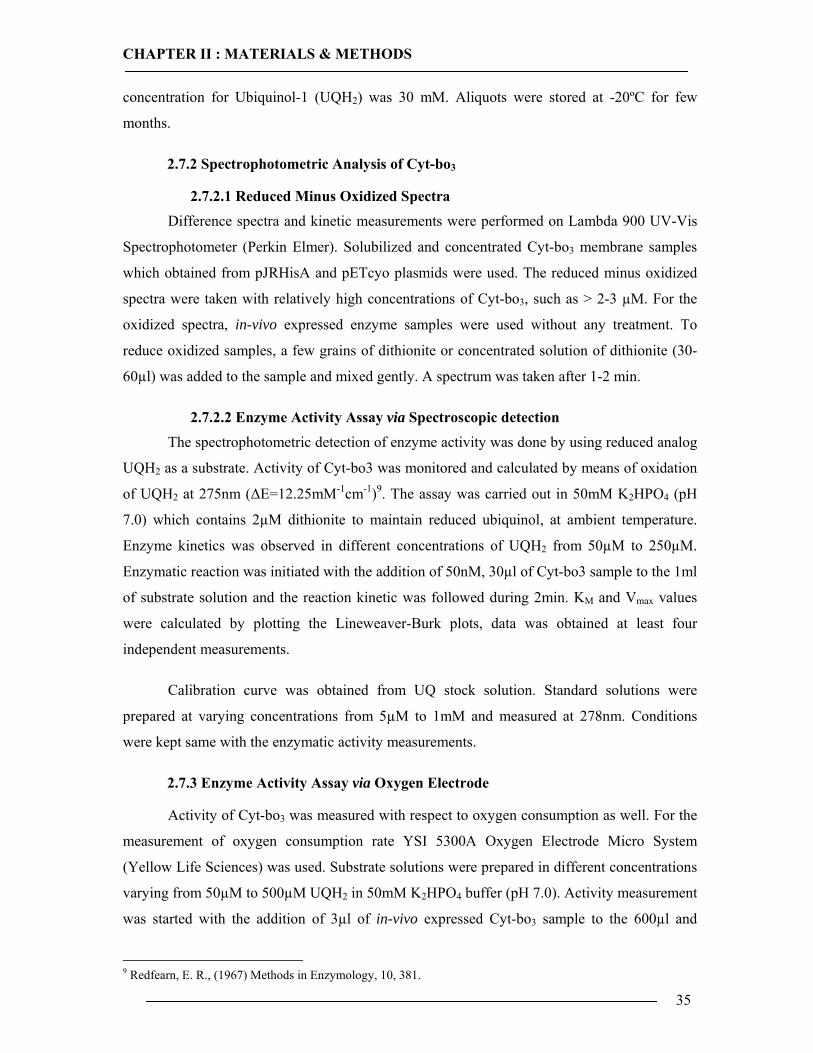
CHAPTER II : MATERIALS & METHODS
35
concentration for Ubiquinol-1 (UQH2) was 30 mM. Aliquots were stored at -20ºC for few
months.
2.7.2 Spectrophotometric Analysis of Cyt-bo3
2.7.2.1 Reduced Minus Oxidized Spectra
Difference spectra and kinetic measurements were performed on Lambda 900 UV-Vis
Spectrophotometer (Perkin Elmer). Solubilized and concentrated Cyt-bo3 membrane samples
which obtained from pJRHisA and pETcyo plasmids were used. The reduced minus oxidized
spectra were taken with relatively high concentrations of Cyt-bo3, such as > 2-3 µM. For the
oxidized spectra, in-vivo expressed enzyme samples were used without any treatment. To
reduce oxidized samples, a few grains of dithionite or concentrated solution of dithionite (30-
60µl) was added to the sample and mixed gently. A spectrum was taken after 1-2 min.
2.7.2.2 Enzyme Activity Assay via Spectroscopic detection
The spectrophotometric detection of enzyme activity was done by using reduced analog
UQH2 as a substrate. Activity of Cyt-bo3 was monitored and calculated by means of oxidation
of UQH2 at 275nm (∆E=12.25mM-1cm-1)9. The assay was carried out in 50mM K2HPO4 (pH
7.0) which contains 2µM dithionite to maintain reduced ubiquinol, at ambient temperature.
Enzyme kinetics was observed in different concentrations of UQH2 from 50µM to 250µM.
Enzymatic reaction was initiated with the addition of 50nM, 30µl of Cyt-bo3 sample to the 1ml
of substrate solution and the reaction kinetic was followed during 2min. KM and Vmax values
were calculated by plotting the Lineweaver-Burk plots, data was obtained at least four
independent measurements.
Calibration curve was obtained from UQ stock solution. Standard solutions were
prepared at varying concentrations from 5µM to 1mM and measured at 278nm. Conditions
were kept same with the enzymatic activity measurements.
2.7.3 Enzyme Activity Assay via Oxygen Electrode
Activity of Cyt-bo3 was measured with respect to oxygen consumption as well. For the
measurement of oxygen consumption rate YSI 5300A Oxygen Electrode Micro System
(Yellow Life Sciences) was used. Substrate solutions were prepared in different concentrations
varying from 50µM to 500µM UQH2 in 50mM K2HPO4 buffer (pH 7.0). Activity measurement
was started with the addition of 3µl of in-vivo expressed Cyt-bo3 sample to the 600µl and
9 Redfearn, E. R., (1967) Methods in Enzymology, 10, 381.
CHAPTER II : MATERIALS & METHODS
36
recorded during 2-3 min. At least two independent measurements were obtained for the
enzymatic activity calculations. For the calculation of in-vitro expressed enzyme activity,
500µM UQH2 was used and oxygen consumption was recorded with the addition of 10-25µl of
Cyt-bo3.
2.7.4 Sample Preparation of in-vitro Expressed Cyt-bo3 for Spectrophotometric Analysis and Enzyme Activity Assay
In-vitro expression of Cyt-bo3 was done as explained in section 2.5.1 and samples were
used with and without purification process for the activity measurement. Purification was done
as mentioned before in section 2.4.2 with small modifications. 350-400 µL in-vitro expression
mix was resuspended in 50mM K2HPO4 (pH 8.3). The volume of buffer used for resuspension
was 2-3 times the volume of the mix. Debris was removed by centrifugation at 10,000 rpm for
15 min at 4ºC. Cyt-bo3 or membranes were pelletted by centrifugation of supernatant at 47,000
rpm at 4ºC for 3 hrs. Pellet was resuspended in 50mM K2HPO4 (pH 8.3) and solubilized by
addition of TritonX-100 (1%) and octyl glucoside (1.25%). The solution was mixed in ice for
1-2 hrs to solubilize the protein.
2.8 SPR/SPFS Measurements
2.8.1 Preparation of PDMS Spacer
Sylgard 184 Silicon Elastomer (Dow Corning GmbH) was used for the preparation of
PDMS spacer ring. Base silicon elastomer and curing agent were mixed in 10:1 ratio and
homogenized by vortexing. All bubbles were removed by using a desiccator system which is
connected to a vacuum pump. After removal of bubbles, small amount of PDMS mixture was
filled in ellipse shaped molds and evenly spreaded in the mold. Filled molds were placed in an
80°C oven for 5 min so PDMS becomes more viscous and goes into crevasses. Cured PDMS
was peeled off from the mold after 48 hrs incubation at room temperature.
2.8.2 Preparation of Gold Substrates
LaSFN9 glass substrates which has a refractive index value n=1.845 (Schott AG) were
used as a substrate for gold evaporation. Before the evaporation of gold following procedure
was applied to clean glass slides;
• Place glass slides in a container and rinse with 2% Hellmanex (Hellma GmbH)
solution for 15min in ultrasonic bath.
• Rinse 15 times with milliQ.
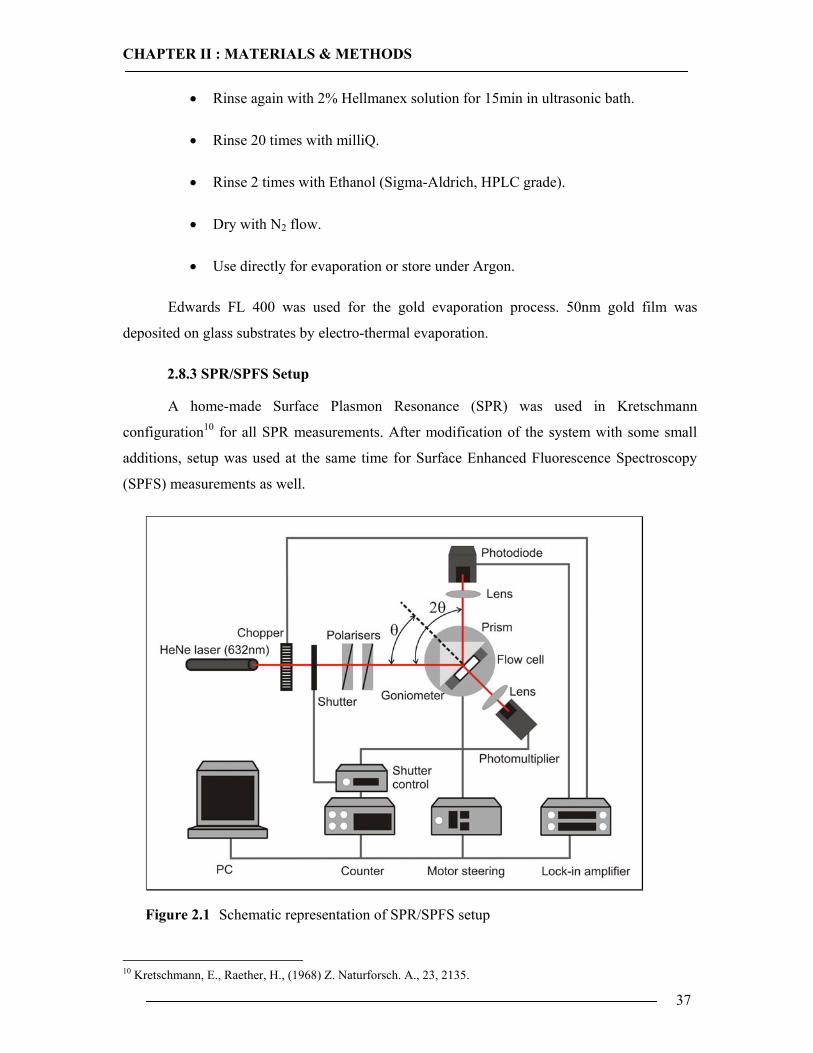
CHAPTER II : MATERIALS & METHODS
37
• Rinse again with 2% Hellmanex solution for 15min in ultrasonic bath.
• Rinse 20 times with milliQ.
• Rinse 2 times with Ethanol (Sigma-Aldrich, HPLC grade).
• Dry with N2 flow.
• Use directly for evaporation or store under Argon.
Edwards FL 400 was used for the gold evaporation process. 50nm gold film was
deposited on glass substrates by electro-thermal evaporation.
2.8.3 SPR/SPFS Setup
A home-made Surface Plasmon Resonance (SPR) was used in Kretschmann
configuration10 for all SPR measurements. After modification of the system with some small
additions, setup was used at the same time for Surface Enhanced Fluorescence Spectroscopy
(SPFS) measurements as well.
Figure 2.1 Schematic representation of SPR/SPFS setup
10 Kretschmann, E., Raether, H., (1968) Z. Naturforsch. A., 23, 2135.
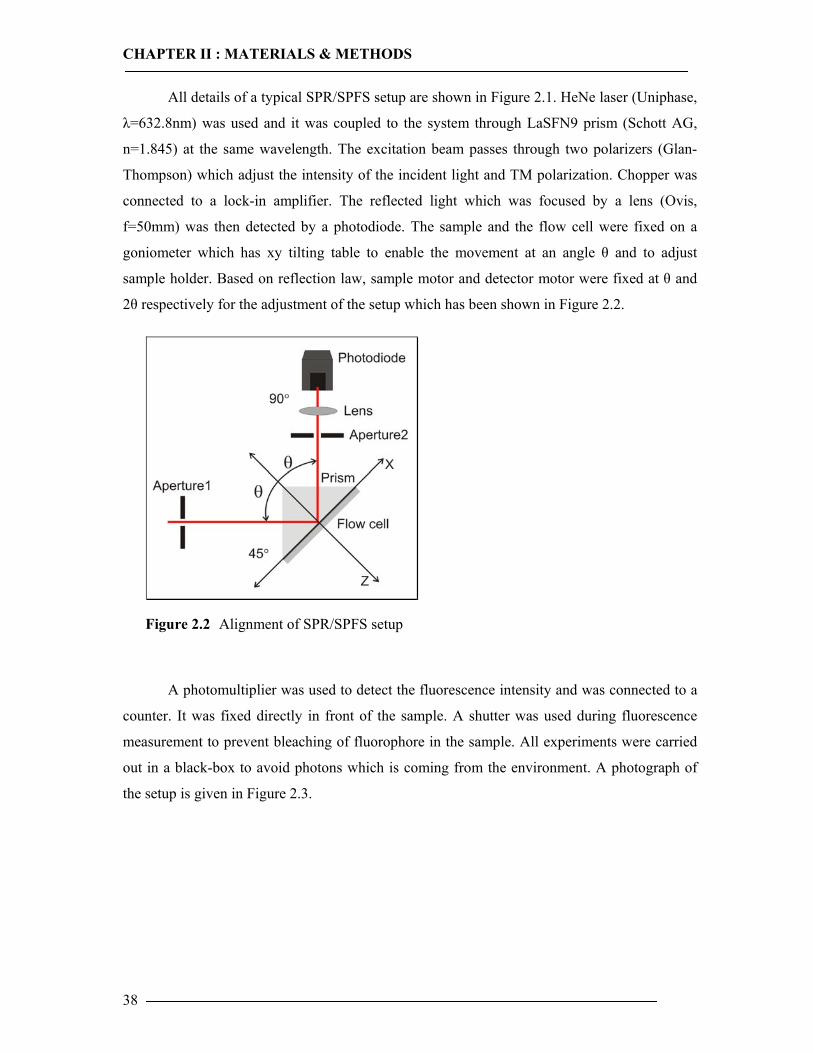
CHAPTER II : MATERIALS & METHODS
38
All details of a typical SPR/SPFS setup are shown in Figure 2.1. HeNe laser (Uniphase,
λ=632.8nm) was used and it was coupled to the system through LaSFN9 prism (Schott AG,
n=1.845) at the same wavelength. The excitation beam passes through two polarizers (Glan-
Thompson) which adjust the intensity of the incident light and TM polarization. Chopper was
connected to a lock-in amplifier. The reflected light which was focused by a lens (Ovis,
f=50mm) was then detected by a photodiode. The sample and the flow cell were fixed on a
goniometer which has xy tilting table to enable the movement at an angle θ and to adjust
sample holder. Based on reflection law, sample motor and detector motor were fixed at θ and
2θ respectively for the adjustment of the setup which has been shown in Figure 2.2.
Figure 2.2 Alignment of SPR/SPFS setup
A photomultiplier was used to detect the fluorescence intensity and was connected to a
counter. It was fixed directly in front of the sample. A shutter was used during fluorescence
measurement to prevent bleaching of fluorophore in the sample. All experiments were carried
out in a black-box to avoid photons which is coming from the environment. A photograph of
the setup is given in Figure 2.3.
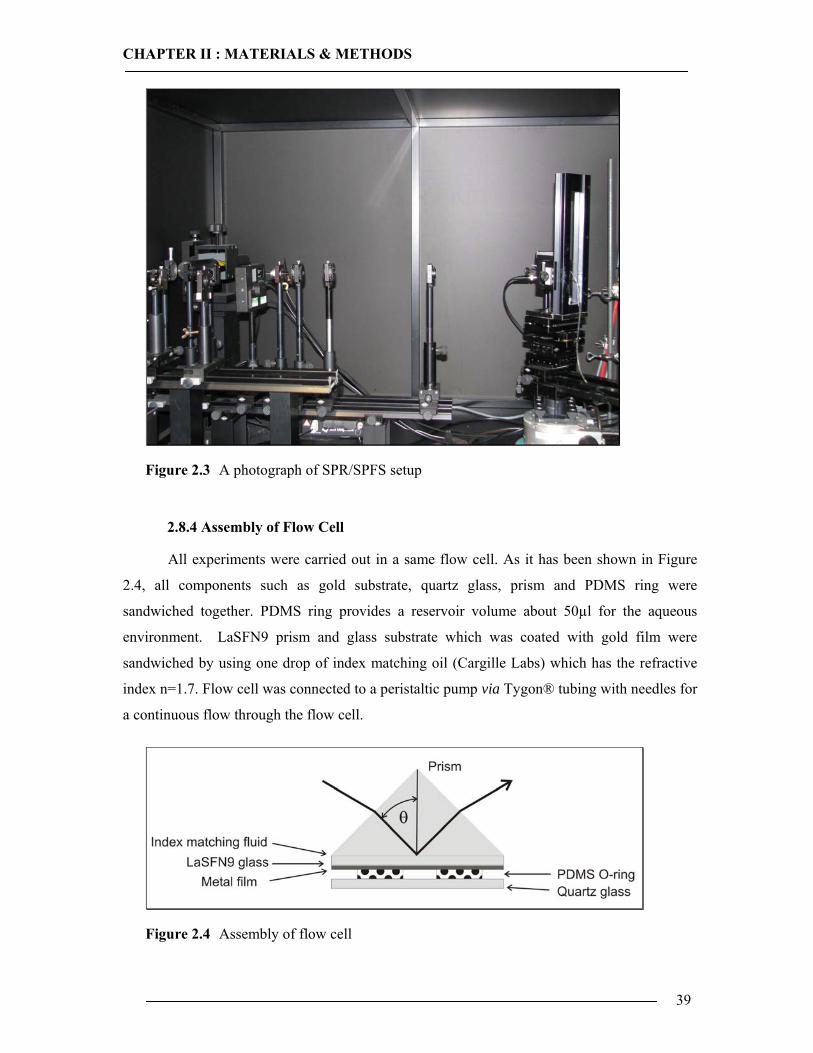
CHAPTER II : MATERIALS & METHODS
39
Figure 2.3 A photograph of SPR/SPFS setup
2.8.4 Assembly of Flow Cell
All experiments were carried out in a same flow cell. As it has been shown in Figure
2.4, all components such as gold substrate, quartz glass, prism and PDMS ring were
sandwiched together. PDMS ring provides a reservoir volume about 50µl for the aqueous
environment. LaSFN9 prism and glass substrate which was coated with gold film were
sandwiched by using one drop of index matching oil (Cargille Labs) which has the refractive
index n=1.7. Flow cell was connected to a peristaltic pump via Tygon® tubing with needles for
a continuous flow through the flow cell.
Figure 2.4 Assembly of flow cell
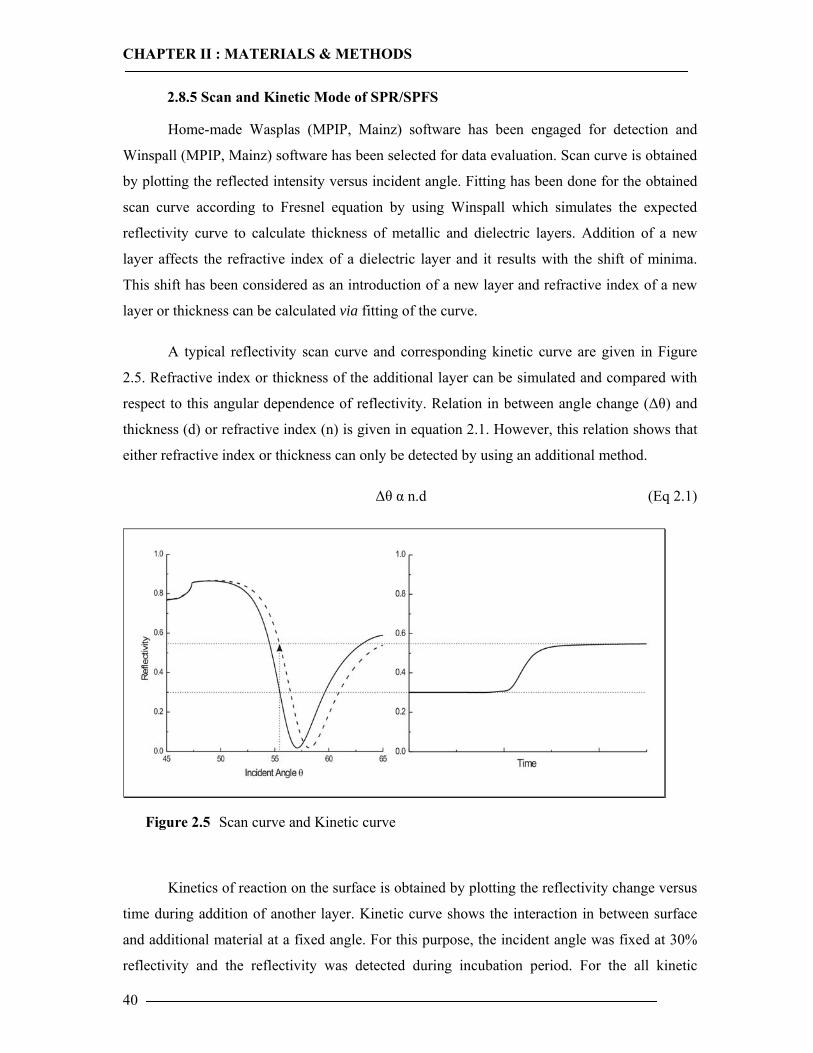
CHAPTER II : MATERIALS & METHODS
40
2.8.5 Scan and Kinetic Mode of SPR/SPFS
Home-made Wasplas (MPIP, Mainz) software has been engaged for detection and
Winspall (MPIP, Mainz) software has been selected for data evaluation. Scan curve is obtained
by plotting the reflected intensity versus incident angle. Fitting has been done for the obtained
scan curve according to Fresnel equation by using Winspall which simulates the expected
reflectivity curve to calculate thickness of metallic and dielectric layers. Addition of a new
layer affects the refractive index of a dielectric layer and it results with the shift of minima.
This shift has been considered as an introduction of a new layer and refractive index of a new
layer or thickness can be calculated via fitting of the curve.
A typical reflectivity scan curve and corresponding kinetic curve are given in Figure
2.5. Refractive index or thickness of the additional layer can be simulated and compared with
respect to this angular dependence of reflectivity. Relation in between angle change (∆θ) and
thickness (d) or refractive index (n) is given in equation 2.1. However, this relation shows that
either refractive index or thickness can only be detected by using an additional method.
∆θ α n.d (Eq 2.1)
Figure 2.5 Scan curve and Kinetic curve
Kinetics of reaction on the surface is obtained by plotting the reflectivity change versus
time during addition of another layer. Kinetic curve shows the interaction in between surface
and additional material at a fixed angle. For this purpose, the incident angle was fixed at 30%
reflectivity and the reflectivity was detected during incubation period. For the all kinetic
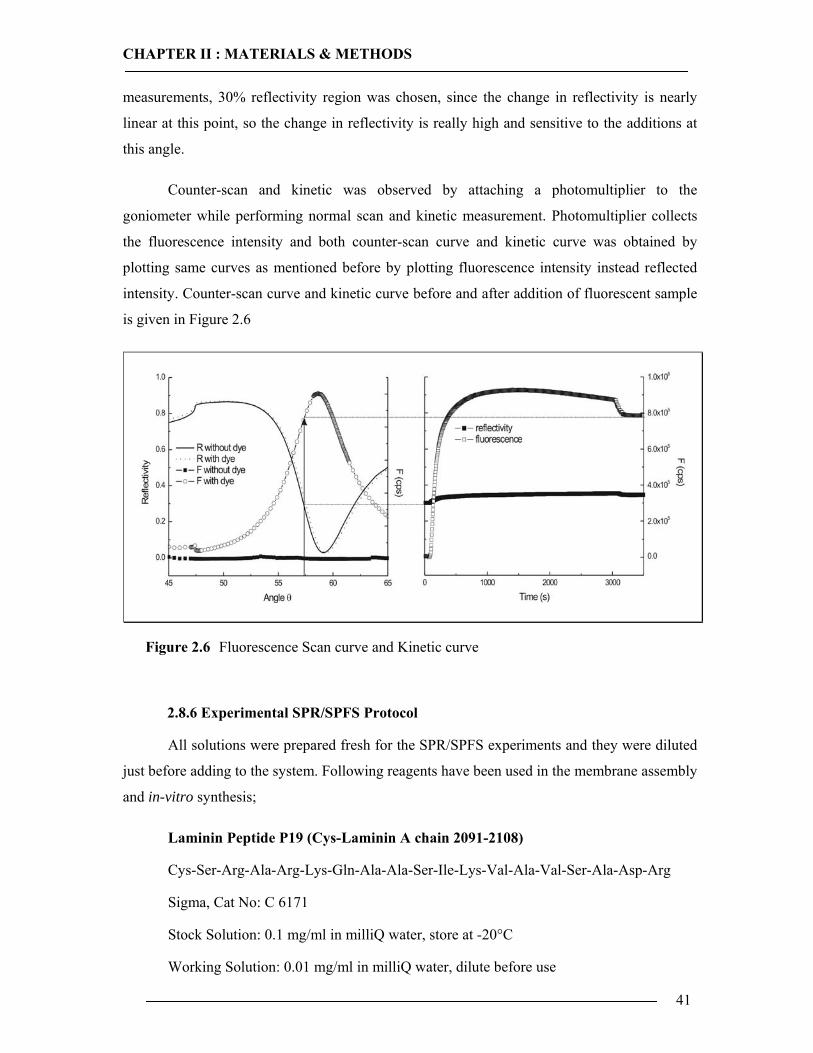
CHAPTER II : MATERIALS & METHODS
41
measurements, 30% reflectivity region was chosen, since the change in reflectivity is nearly
linear at this point, so the change in reflectivity is really high and sensitive to the additions at
this angle.
Counter-scan and kinetic was observed by attaching a photomultiplier to the
goniometer while performing normal scan and kinetic measurement. Photomultiplier collects
the fluorescence intensity and both counter-scan curve and kinetic curve was obtained by
plotting same curves as mentioned before by plotting fluorescence intensity instead reflected
intensity. Counter-scan curve and kinetic curve before and after addition of fluorescent sample
is given in Figure 2.6
Figure 2.6 Fluorescence Scan curve and Kinetic curve
2.8.6 Experimental SPR/SPFS Protocol
All solutions were prepared fresh for the SPR/SPFS experiments and they were diluted
just before adding to the system. Following reagents have been used in the membrane assembly
and in-vitro synthesis;
Laminin Peptide P19 (Cys-Laminin A chain 2091-2108)
Cys-Ser-Arg-Ala-Arg-Lys-Gln-Ala-Ala-Ser-Ile-Lys-Val-Ala-Val-Ser-Ala-Asp-Arg
Sigma, Cat No: C 6171
Stock Solution: 0.1 mg/ml in milliQ water, store at -20°C
Working Solution: 0.01 mg/ml in milliQ water, dilute before use
CHAPTER II : MATERIALS & METHODS
42
N-(3-Dimethylaminopropyl)-N'-ethylcarbodiimide Hydrochloride (EDC)
Fluka, Cat No: 03449
Stock Solution & Working Solution: 0.4M in milliQ water, store at -20°C
N-Hydroxysuccinimide (NHS)
Fluka, Cat No: 56480
Stock Solution & Working Solution: 0.1M in milliQ water, store at -20°C
1,2-Dimyristoyl-sn-glycero-3-phosphoethanolamine (DMPE)
Sigma, Cat No: P 5693 or Avanti Polar Lipids, Cat No: 850745X
Stock Solution: 2 mg/ml in PBS (Dullbecco’s Phoshate Buffered Saline 1X, GIBCO/Invitrogen, Cat No: 14040-083) with 0.1% TritonX-100 (Sigma, Cat No: T9284), store at -20°C
Working Solution: 0.2 mg/ml in PBS, dilute before use
When it is in powder form, lipid was directly dissolved in PBS buffer which contains
TritonX-100 and solution was mixed via vortex or ultrasonic bath was used till complete
solubilization. At the end solution was milky suspension since the solubility was low. When it
is dissolved form in chloroform, solvent was evaporated completely by N2 stream and PBS was
added together with TritonX-100. Solution was frozen in liquid nitrogen, than it was thawed in
water bath (35°C). It was mixed well by vortexing and this treatment was done at least three
times to get high solubility of DMPE.
L-α-Phosphatidylcholine from soybean (PC)
Fluka, Cat No: 61757
Stock Solution: 100 mg/ml, 10% in chloroform, store at -20°C
Working Solution: 1.0 mg/ml in PBS, dilute before use
Same procedure was performed since lipid is dissolved in chloroform, chloroform was
evaporated by N2 stream and PBS was added. Solution was mixed well by vortexing. Freeze &
thaw cycle was done at least three times.
Western Blocking Reagent
Roche, Cat No: 11921673001
Stock Solution: 10X concentrated blocking solution
CHAPTER II : MATERIALS & METHODS
43
Working Solution: 0.5% (V/V) in PBS, dilute before use
PentaHis Ab (BSA free) Mouse monoclonal IgG (1°Ab)
Qiagen, Cat No: 34660
Stock Solution: 0.2 µg/µl in milliQ water, store at -20°C
Working Solution: 2.0% (V/V) in 200µl PBS, dilute before use
Cy5-Conjugated Secondary Antibody Goat-Antimouse IgG H+L (2°Ab)
Chemicon Int., Cat No: AP181S
Stock Solution: 1.5 mg/ml in milliQ water, store at 4°C
Working Solution: 3.0% (V/V) in 200µl PBS, dilute before use
PentaHis Alexa Fluor 647 Conjugate (1°Ab)
Qiagen, Cat No: 35370
Stock Solution: 200 µg/ml, store at 4°C
Working Solution: 3.0% (V/V) in 200µl PBS, dilute before use
During measurements, SPR Scan was performed always just before and after addition
of new layer or component. SPR Kinetic was performed during addition and incubation of a
new component. Self assembly of the Tethered Bilayer Lipid Membrane (tBLM) was carried
out step by step as follows;
• Assemble the sample holder and the flow cell as explained in section 2.8.4
• Rinse surface of the gold substrate and flow cell with 1ml milliQ water
• Perform scan each time after rinsing and before addition of a new layer
• Pump 500µl of P19 solution to the flow cell with the flow rate 0.105 ml/min and
incubate for 45min
• Rinse surface with 1ml milliQ water
• Add 500µl of a 1:1 EDC/NHS mixture to the flow cell and incubate for 10min

CHAPTER II : MATERIALS & METHODS
44
• Do not rinse after EDC/NHS addition step
• Add 1ml of DMPE solution to the flow cell without rinsing to exchange all
EDC/NHS mixture with DMPE solution, incubate for 60min
• Rinse surface with 1ml PBS buffer
• Extrude 500µl of PC solution by using extruder
• Add PC vesicles to the system and incubate for 90min
• Rinse surface with 1ml PBS buffer
• Prepare in-vitro mix as explained in section 2.5.1 and add into flow cell
immediately. Incubate for 120 min at 37°C.
• Rinse with 1ml PBS buffer and collect in-vitro mix for western blot analysis
• Add 1ml, 0.5% Western Blocking Reagent and incubate for 60min
• Rinse with 1ml PBS buffer
• Add 200µl of 1°Ab solution (PentaHis) or for the direct detection PentaHis
Alexa Fluor 647 Conjugate, incubate for 60 min.
• Install photomultiplier to the system before addition of any fluorescent labeled
component
• Rinse with 1ml PBS buffer
• Add 200µl of 2°Ab solution, Cy5 Conjugate and incubate for 45 min. Skip this
step if you are using PentaHis Alexa Fluor 647 Conjugate instead PentaHis
1°Ab
• Rinse with 1ml PBS buffer and perform fluorescent scan for the detection of
protein-antibody complex
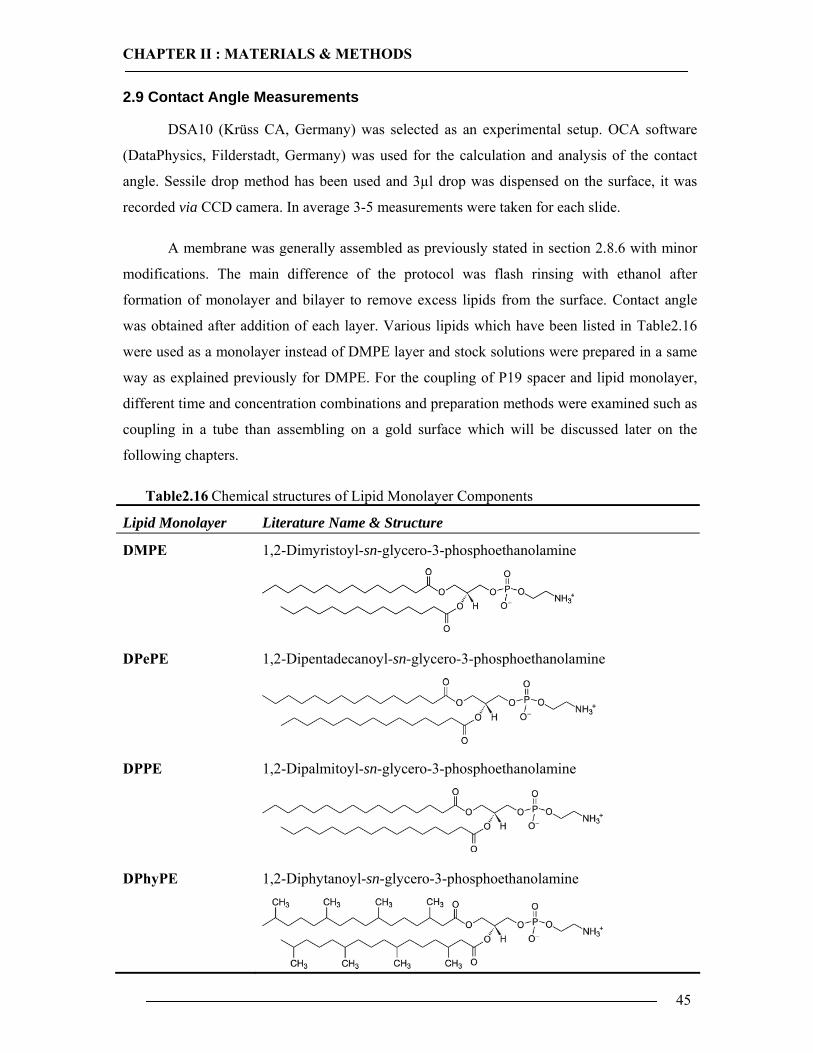
CHAPTER II : MATERIALS & METHODS
45
2.9 Contact Angle Measurements
DSA10 (Krüss CA, Germany) was selected as an experimental setup. OCA software
(DataPhysics, Filderstadt, Germany) was used for the calculation and analysis of the contact
angle. Sessile drop method has been used and 3µl drop was dispensed on the surface, it was
recorded via CCD camera. In average 3-5 measurements were taken for each slide.
A membrane was generally assembled as previously stated in section 2.8.6 with minor
modifications. The main difference of the protocol was flash rinsing with ethanol after
formation of monolayer and bilayer to remove excess lipids from the surface. Contact angle
was obtained after addition of each layer. Various lipids which have been listed in Table2.16
were used as a monolayer instead of DMPE layer and stock solutions were prepared in a same
way as explained previously for DMPE. For the coupling of P19 spacer and lipid monolayer,
different time and concentration combinations and preparation methods were examined such as
coupling in a tube than assembling on a gold surface which will be discussed later on the
following chapters.
Table2.16 Chemical structures of Lipid Monolayer Components
Lipid Monolayer Literature Name & Structure
DMPE 1,2-Dimyristoyl-sn-glycero-3-phosphoethanolamine
DPePE 1,2-Dipentadecanoyl-sn-glycero-3-phosphoethanolamine
DPPE 1,2-Dipalmitoyl-sn-glycero-3-phosphoethanolamine
DPhyPE 1,2-Diphytanoyl-sn-glycero-3-phosphoethanolamine

CHAPTER II : MATERIALS & METHODS
46
DPalPE 1,2-Dipalmitoleoyl-sn-glycero-3-phosphoethanolamine
DLPE 1,2-Dilinolenoyl-sn-glycero-3-phosphoethanolamine
DAPE 1,2-Diarachidonoyl-sn-glycero-3-phosphoethanolamine
DDPE 1,2-Didocosahexaenoyl-sn-glycero-3-phosphoethanolamine
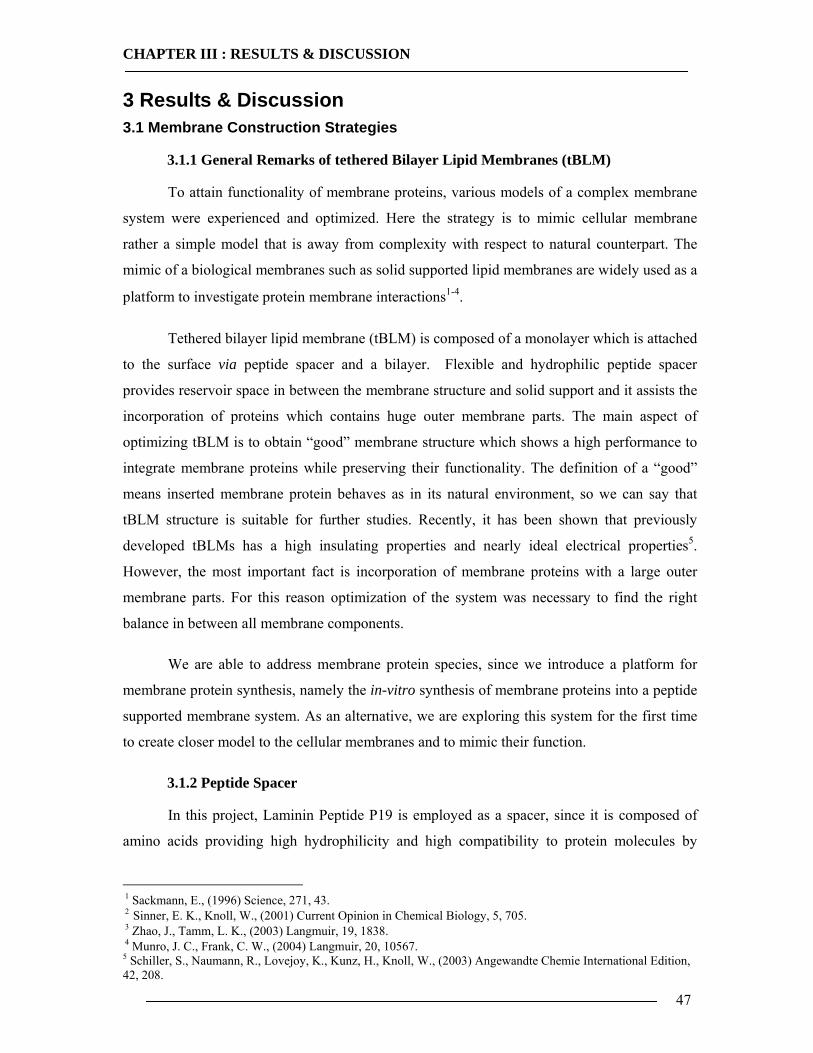
CHAPTER III : RESULTS & DISCUSSION
47
3 Results & Discussion 3.1 Membrane Construction Strategies
3.1.1 General Remarks of tethered Bilayer Lipid Membranes (tBLM)
To attain functionality of membrane proteins, various models of a complex membrane
system were experienced and optimized. Here the strategy is to mimic cellular membrane
rather a simple model that is away from complexity with respect to natural counterpart. The
mimic of a biological membranes such as solid supported lipid membranes are widely used as a
platform to investigate protein membrane interactions1-4.
Tethered bilayer lipid membrane (tBLM) is composed of a monolayer which is attached
to the surface via peptide spacer and a bilayer. Flexible and hydrophilic peptide spacer
provides reservoir space in between the membrane structure and solid support and it assists the
incorporation of proteins which contains huge outer membrane parts. The main aspect of
optimizing tBLM is to obtain “good” membrane structure which shows a high performance to
integrate membrane proteins while preserving their functionality. The definition of a “good”
means inserted membrane protein behaves as in its natural environment, so we can say that
tBLM structure is suitable for further studies. Recently, it has been shown that previously
developed tBLMs has a high insulating properties and nearly ideal electrical properties5.
However, the most important fact is incorporation of membrane proteins with a large outer
membrane parts. For this reason optimization of the system was necessary to find the right
balance in between all membrane components.
We are able to address membrane protein species, since we introduce a platform for
membrane protein synthesis, namely the in-vitro synthesis of membrane proteins into a peptide
supported membrane system. As an alternative, we are exploring this system for the first time
to create closer model to the cellular membranes and to mimic their function.
3.1.2 Peptide Spacer
In this project, Laminin Peptide P19 is employed as a spacer, since it is composed of
amino acids providing high hydrophilicity and high compatibility to protein molecules by
1 Sackmann, E., (1996) Science, 271, 43. 2 Sinner, E. K., Knoll, W., (2001) Current Opinion in Chemical Biology, 5, 705. 3 Zhao, J., Tamm, L. K., (2003) Langmuir, 19, 1838. 4 Munro, J. C., Frank, C. W., (2004) Langmuir, 20, 10567. 5 Schiller, S., Naumann, R., Lovejoy, K., Kunz, H., Knoll, W., (2003) Angewandte Chemie International Edition, 42, 208.
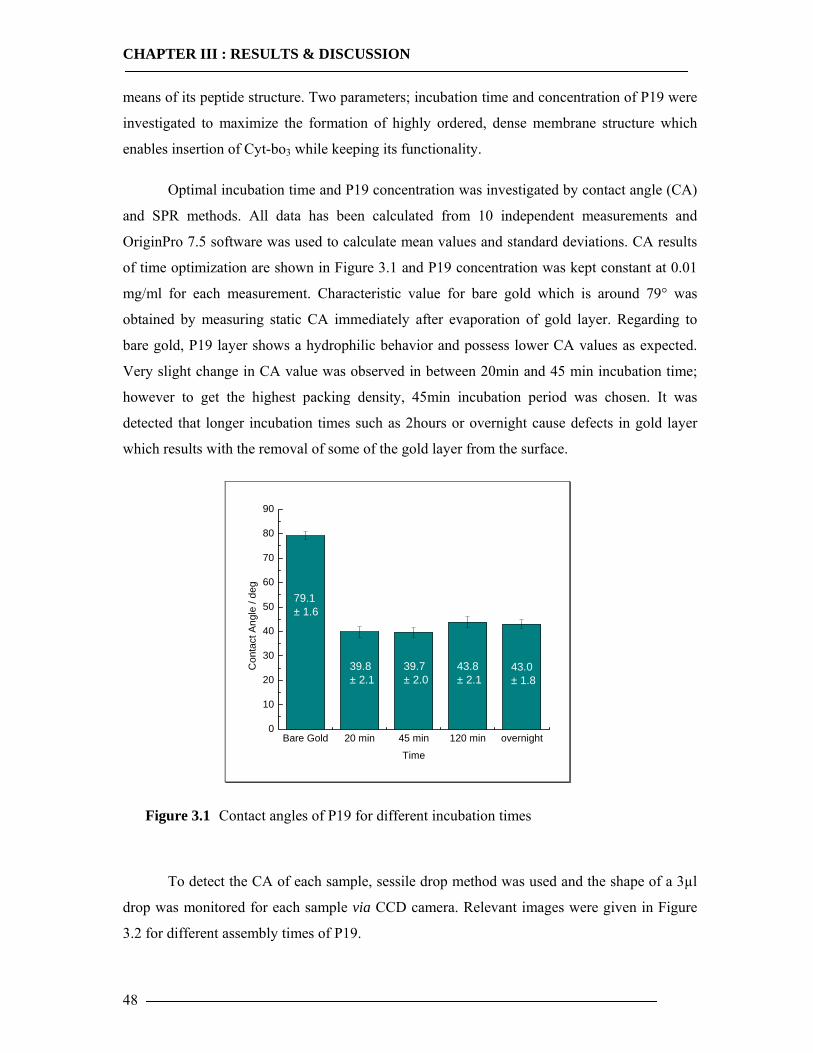
CHAPTER III : RESULTS & DISCUSSION
48
means of its peptide structure. Two parameters; incubation time and concentration of P19 were
investigated to maximize the formation of highly ordered, dense membrane structure which
enables insertion of Cyt-bo3 while keeping its functionality.
Optimal incubation time and P19 concentration was investigated by contact angle (CA)
and SPR methods. All data has been calculated from 10 independent measurements and
OriginPro 7.5 software was used to calculate mean values and standard deviations. CA results
of time optimization are shown in Figure 3.1 and P19 concentration was kept constant at 0.01
mg/ml for each measurement. Characteristic value for bare gold which is around 79° was
obtained by measuring static CA immediately after evaporation of gold layer. Regarding to
bare gold, P19 layer shows a hydrophilic behavior and possess lower CA values as expected.
Very slight change in CA value was observed in between 20min and 45 min incubation time;
however to get the highest packing density, 45min incubation period was chosen. It was
detected that longer incubation times such as 2hours or overnight cause defects in gold layer
which results with the removal of some of the gold layer from the surface.
Bare Gold 20 min 45 min 120 min overnight0
10
20
30
40
50
60
70
80
90
43.0± 1.8
43.8± 2.1
39.7± 2.0
79.1± 1.6
Con
tact
Ang
le /
deg
Time
39.8± 2.1
Figure 3.1 Contact angles of P19 for different incubation times
To detect the CA of each sample, sessile drop method was used and the shape of a 3µl
drop was monitored for each sample via CCD camera. Relevant images were given in Figure
3.2 for different assembly times of P19.
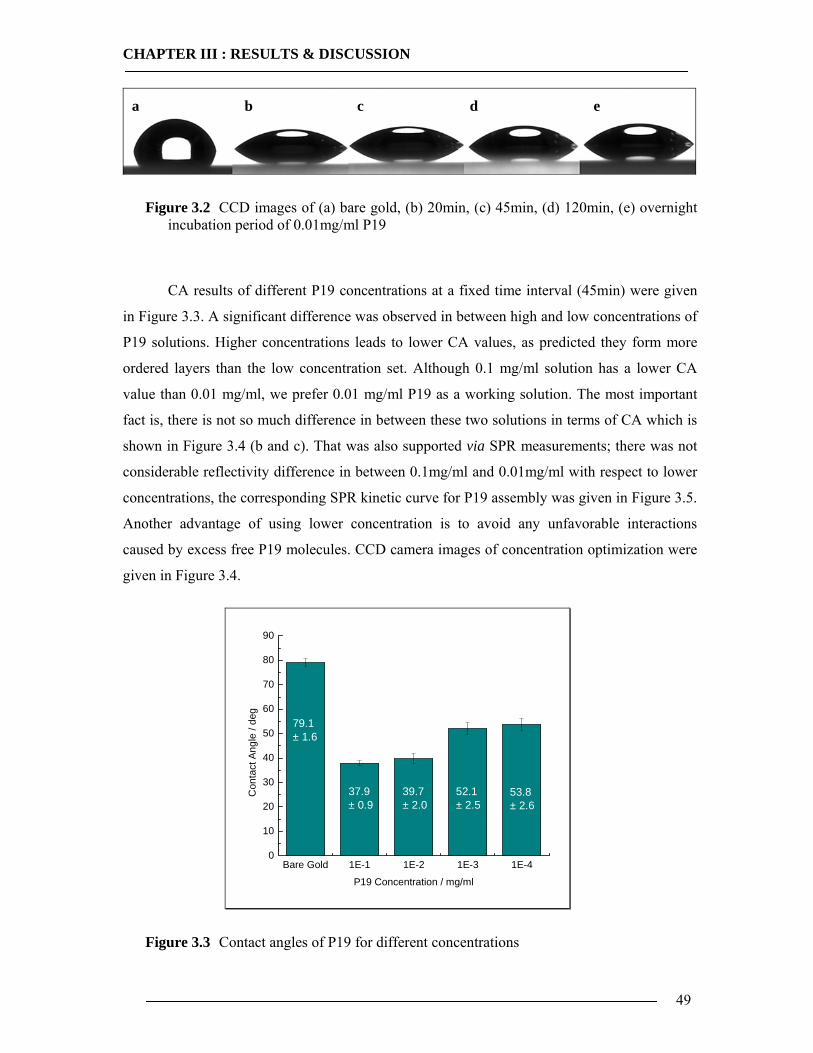
CHAPTER III : RESULTS & DISCUSSION
49
Figure 3.2 CCD images of (a) bare gold, (b) 20min, (c) 45min, (d) 120min, (e) overnight incubation period of 0.01mg/ml P19
CA results of different P19 concentrations at a fixed time interval (45min) were given
in Figure 3.3. A significant difference was observed in between high and low concentrations of
P19 solutions. Higher concentrations leads to lower CA values, as predicted they form more
ordered layers than the low concentration set. Although 0.1 mg/ml solution has a lower CA
value than 0.01 mg/ml, we prefer 0.01 mg/ml P19 as a working solution. The most important
fact is, there is not so much difference in between these two solutions in terms of CA which is
shown in Figure 3.4 (b and c). That was also supported via SPR measurements; there was not
considerable reflectivity difference in between 0.1mg/ml and 0.01mg/ml with respect to lower
concentrations, the corresponding SPR kinetic curve for P19 assembly was given in Figure 3.5.
Another advantage of using lower concentration is to avoid any unfavorable interactions
caused by excess free P19 molecules. CCD camera images of concentration optimization were
given in Figure 3.4.
Bare Gold 1E-1 1E-2 1E-3 1E-40
10
20
30
40
50
60
70
80
90
Con
tact
Ang
le /
deg
P19 Concentration / mg/ml
79.1± 1.6
37.9± 0.9
39.7± 2.0
52.1± 2.5
53.8± 2.6
Figure 3.3 Contact angles of P19 for different concentrations
a b c d e
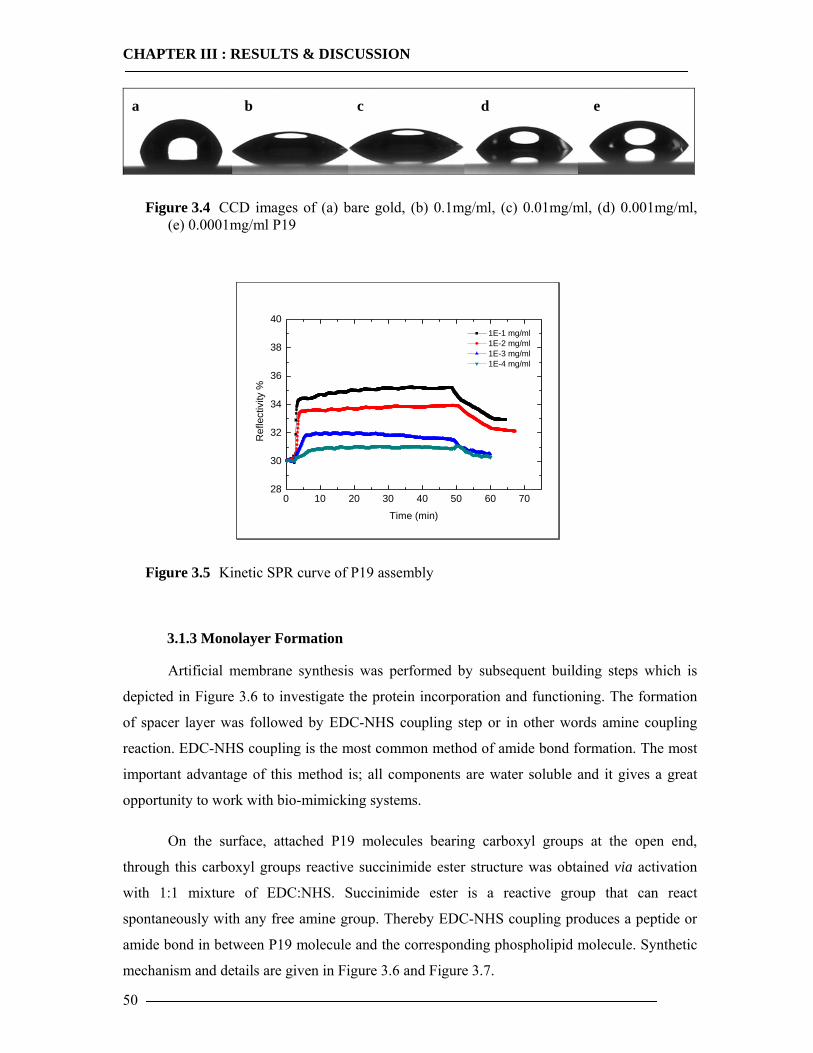
CHAPTER III : RESULTS & DISCUSSION
50
Figure 3.4 CCD images of (a) bare gold, (b) 0.1mg/ml, (c) 0.01mg/ml, (d) 0.001mg/ml, (e) 0.0001mg/ml P19
0 10 20 30 40 50 60 7028
30
32
34
36
38
40
Ref
lect
ivity
%
Time (min)
1E-1 mg/ml 1E-2 mg/ml 1E-3 mg/ml 1E-4 mg/ml
Figure 3.5 Kinetic SPR curve of P19 assembly
3.1.3 Monolayer Formation
Artificial membrane synthesis was performed by subsequent building steps which is
depicted in Figure 3.6 to investigate the protein incorporation and functioning. The formation
of spacer layer was followed by EDC-NHS coupling step or in other words amine coupling
reaction. EDC-NHS coupling is the most common method of amide bond formation. The most
important advantage of this method is; all components are water soluble and it gives a great
opportunity to work with bio-mimicking systems.
On the surface, attached P19 molecules bearing carboxyl groups at the open end,
through this carboxyl groups reactive succinimide ester structure was obtained via activation
with 1:1 mixture of EDC:NHS. Succinimide ester is a reactive group that can react
spontaneously with any free amine group. Thereby EDC-NHS coupling produces a peptide or
amide bond in between P19 molecule and the corresponding phospholipid molecule. Synthetic
mechanism and details are given in Figure 3.6 and Figure 3.7.
a b c d e
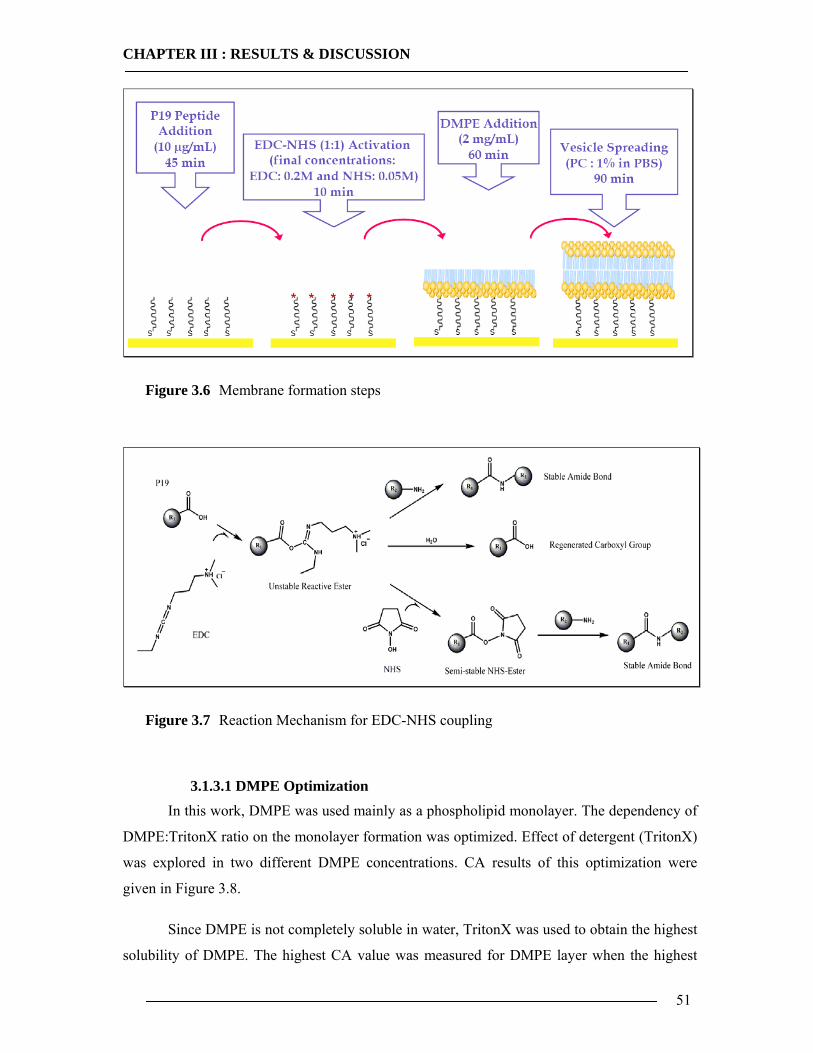
CHAPTER III : RESULTS & DISCUSSION
51
Figure 3.6 Membrane formation steps
Figure 3.7 Reaction Mechanism for EDC-NHS coupling
3.1.3.1 DMPE Optimization
In this work, DMPE was used mainly as a phospholipid monolayer. The dependency of
DMPE:TritonX ratio on the monolayer formation was optimized. Effect of detergent (TritonX)
was explored in two different DMPE concentrations. CA results of this optimization were
given in Figure 3.8.
Since DMPE is not completely soluble in water, TritonX was used to obtain the highest
solubility of DMPE. The highest CA value was measured for DMPE layer when the highest
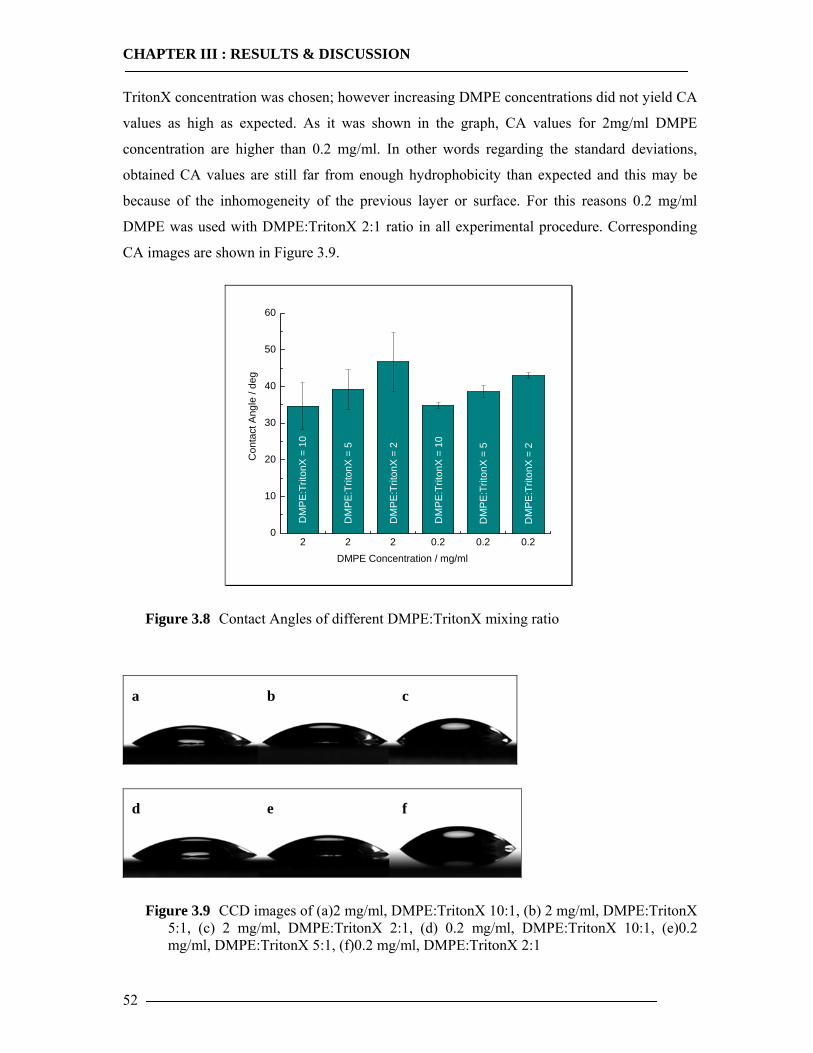
CHAPTER III : RESULTS & DISCUSSION
52
TritonX concentration was chosen; however increasing DMPE concentrations did not yield CA
values as high as expected. As it was shown in the graph, CA values for 2mg/ml DMPE
concentration are higher than 0.2 mg/ml. In other words regarding the standard deviations,
obtained CA values are still far from enough hydrophobicity than expected and this may be
because of the inhomogeneity of the previous layer or surface. For this reasons 0.2 mg/ml
DMPE was used with DMPE:TritonX 2:1 ratio in all experimental procedure. Corresponding
CA images are shown in Figure 3.9.
2 2 2 0.2 0.2 0.20
10
20
30
40
50
60
DM
PE:T
riton
X =
2
DM
PE:T
riton
X =
5
DM
PE:
Trito
nX =
10
Con
tact
Ang
le /
deg
DMPE Concentration / mg/ml
DM
PE:
Trito
nX =
10
DM
PE:
Trito
nX =
5
DM
PE:T
riton
X =
2
Figure 3.8 Contact Angles of different DMPE:TritonX mixing ratio
Figure 3.9 CCD images of (a)2 mg/ml, DMPE:TritonX 10:1, (b) 2 mg/ml, DMPE:TritonX 5:1, (c) 2 mg/ml, DMPE:TritonX 2:1, (d) 0.2 mg/ml, DMPE:TritonX 10:1, (e)0.2 mg/ml, DMPE:TritonX 5:1, (f)0.2 mg/ml, DMPE:TritonX 2:1
a b c
d e f
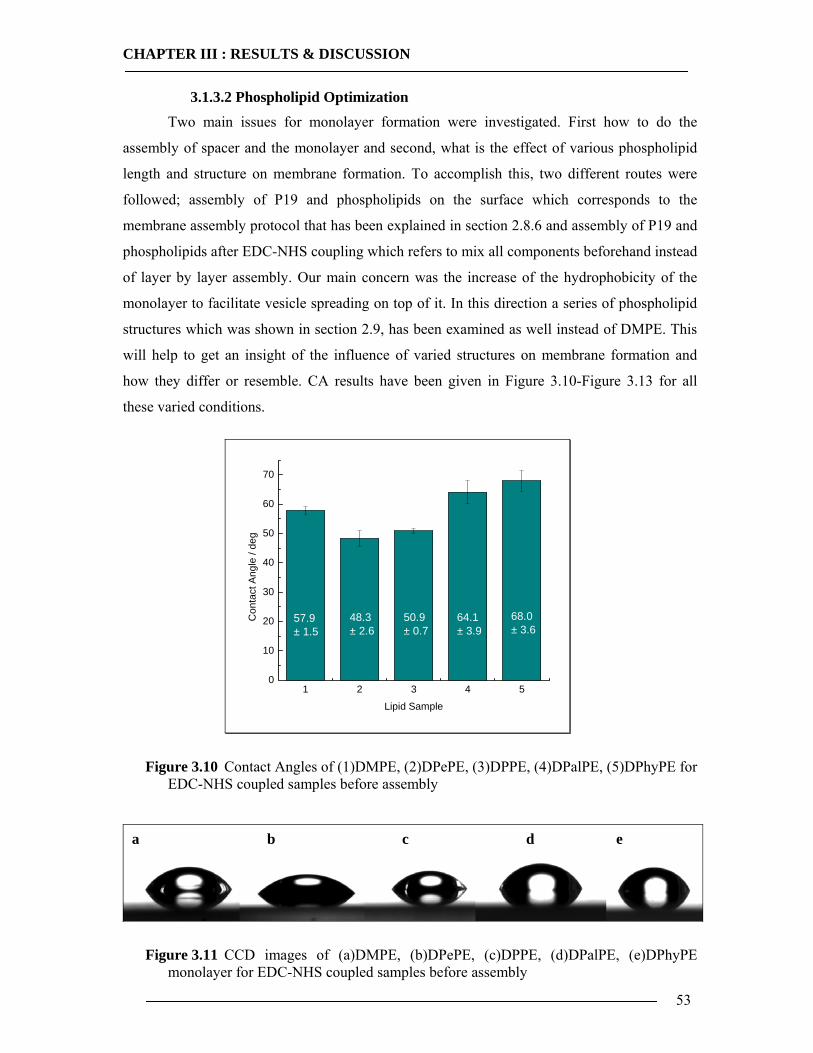
CHAPTER III : RESULTS & DISCUSSION
53
3.1.3.2 Phospholipid Optimization
Two main issues for monolayer formation were investigated. First how to do the
assembly of spacer and the monolayer and second, what is the effect of various phospholipid
length and structure on membrane formation. To accomplish this, two different routes were
followed; assembly of P19 and phospholipids on the surface which corresponds to the
membrane assembly protocol that has been explained in section 2.8.6 and assembly of P19 and
phospholipids after EDC-NHS coupling which refers to mix all components beforehand instead
of layer by layer assembly. Our main concern was the increase of the hydrophobicity of the
monolayer to facilitate vesicle spreading on top of it. In this direction a series of phospholipid
structures which was shown in section 2.9, has been examined as well instead of DMPE. This
will help to get an insight of the influence of varied structures on membrane formation and
how they differ or resemble. CA results have been given in Figure 3.10-Figure 3.13 for all
these varied conditions.
1 2 3 4 50
10
20
30
40
50
60
70
68.0± 3.6
64.1± 3.9
50.9± 0.7
57.9± 1.5
Con
tact
Ang
le /
deg
Lipid Sample
48.3± 2.6
Figure 3.10 Contact Angles of (1)DMPE, (2)DPePE, (3)DPPE, (4)DPalPE, (5)DPhyPE for EDC-NHS coupled samples before assembly
Figure 3.11 CCD images of (a)DMPE, (b)DPePE, (c)DPPE, (d)DPalPE, (e)DPhyPE monolayer for EDC-NHS coupled samples before assembly
a b c d e
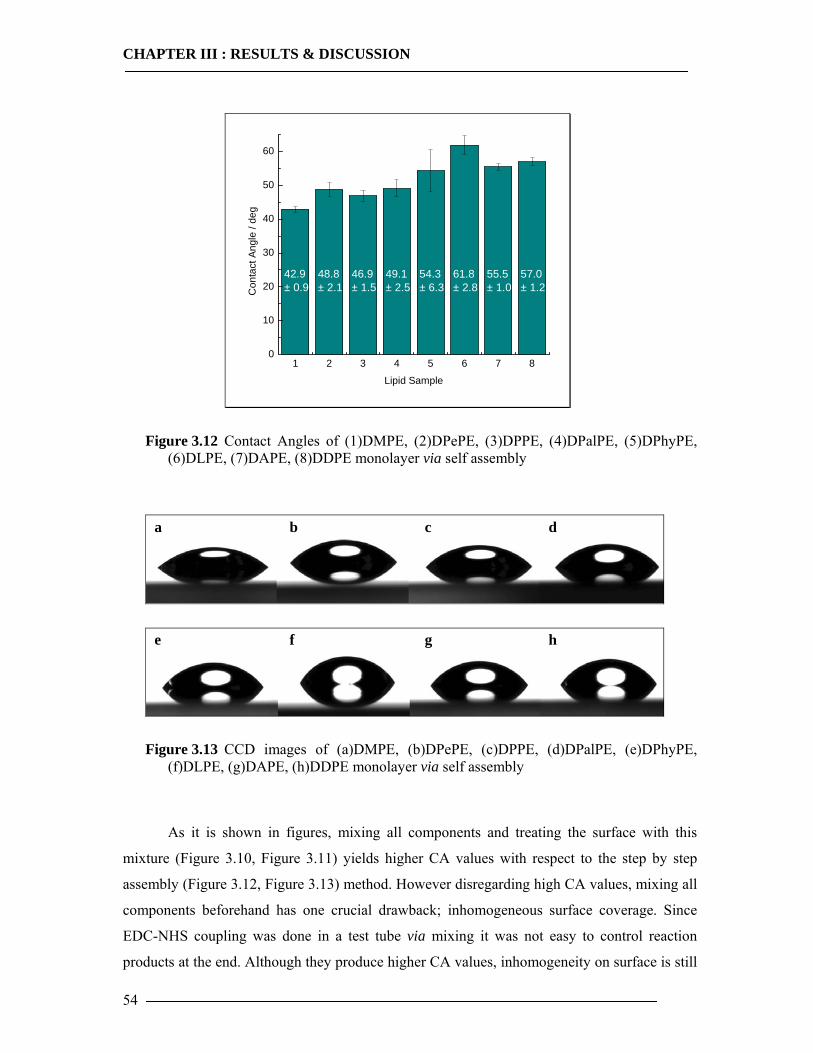
CHAPTER III : RESULTS & DISCUSSION
54
1 2 3 4 5 6 7 80
10
20
30
40
50
60
46.9± 1.5
48.8± 2.1
42.9± 0.9C
onta
ct A
ngle
/ de
g
Lipid Sample
61.8± 2.8
54.3± 6.3
49.1± 2.5
55.5± 1.0
57.0± 1.2
Figure 3.12 Contact Angles of (1)DMPE, (2)DPePE, (3)DPPE, (4)DPalPE, (5)DPhyPE, (6)DLPE, (7)DAPE, (8)DDPE monolayer via self assembly
Figure 3.13 CCD images of (a)DMPE, (b)DPePE, (c)DPPE, (d)DPalPE, (e)DPhyPE, (f)DLPE, (g)DAPE, (h)DDPE monolayer via self assembly
As it is shown in figures, mixing all components and treating the surface with this
mixture (Figure 3.10, Figure 3.11) yields higher CA values with respect to the step by step
assembly (Figure 3.12, Figure 3.13) method. However disregarding high CA values, mixing all
components beforehand has one crucial drawback; inhomogeneous surface coverage. Since
EDC-NHS coupling was done in a test tube via mixing it was not easy to control reaction
products at the end. Although they produce higher CA values, inhomogeneity on surface is still
a b c d
e f g h
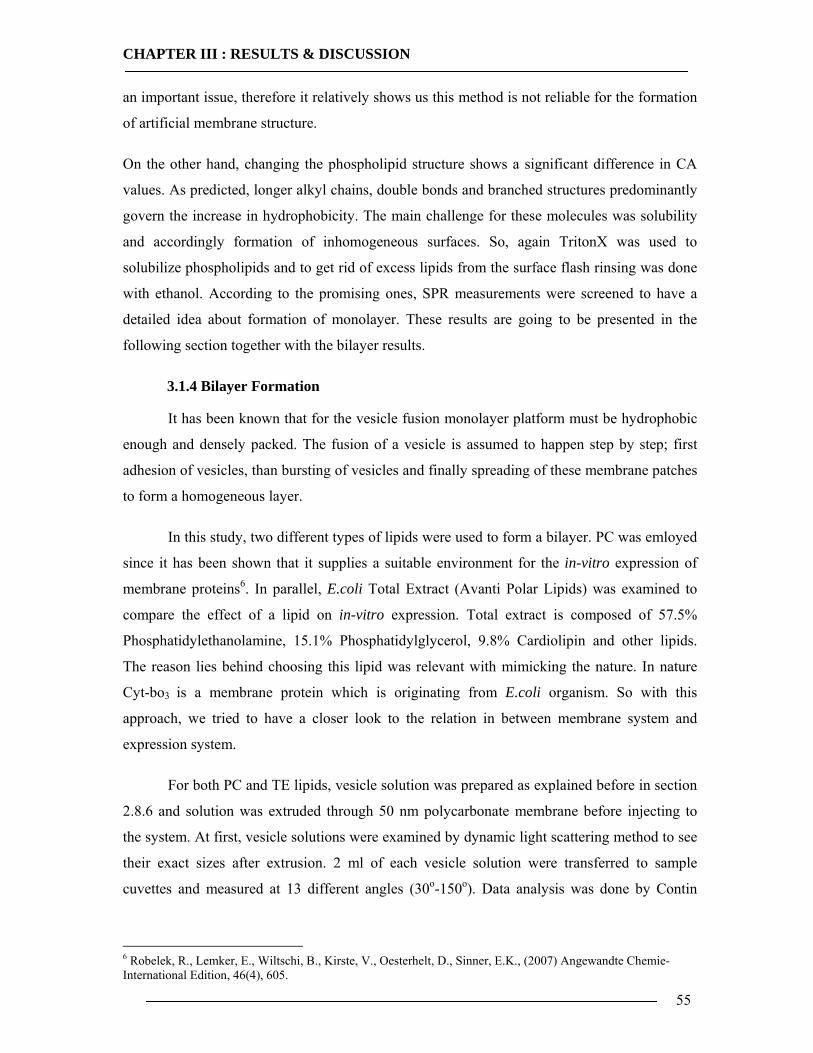
CHAPTER III : RESULTS & DISCUSSION
55
an important issue, therefore it relatively shows us this method is not reliable for the formation
of artificial membrane structure.
On the other hand, changing the phospholipid structure shows a significant difference in CA
values. As predicted, longer alkyl chains, double bonds and branched structures predominantly
govern the increase in hydrophobicity. The main challenge for these molecules was solubility
and accordingly formation of inhomogeneous surfaces. So, again TritonX was used to
solubilize phospholipids and to get rid of excess lipids from the surface flash rinsing was done
with ethanol. According to the promising ones, SPR measurements were screened to have a
detailed idea about formation of monolayer. These results are going to be presented in the
following section together with the bilayer results.
3.1.4 Bilayer Formation
It has been known that for the vesicle fusion monolayer platform must be hydrophobic
enough and densely packed. The fusion of a vesicle is assumed to happen step by step; first
adhesion of vesicles, than bursting of vesicles and finally spreading of these membrane patches
to form a homogeneous layer.
In this study, two different types of lipids were used to form a bilayer. PC was emloyed
since it has been shown that it supplies a suitable environment for the in-vitro expression of
membrane proteins6. In parallel, E.coli Total Extract (Avanti Polar Lipids) was examined to
compare the effect of a lipid on in-vitro expression. Total extract is composed of 57.5%
Phosphatidylethanolamine, 15.1% Phosphatidylglycerol, 9.8% Cardiolipin and other lipids.
The reason lies behind choosing this lipid was relevant with mimicking the nature. In nature
Cyt-bo3 is a membrane protein which is originating from E.coli organism. So with this
approach, we tried to have a closer look to the relation in between membrane system and
expression system.
For both PC and TE lipids, vesicle solution was prepared as explained before in section
2.8.6 and solution was extruded through 50 nm polycarbonate membrane before injecting to
the system. At first, vesicle solutions were examined by dynamic light scattering method to see
their exact sizes after extrusion. 2 ml of each vesicle solution were transferred to sample
cuvettes and measured at 13 different angles (30o-150o). Data analysis was done by Contin
6 Robelek, R., Lemker, E., Wiltschi, B., Kirste, V., Oesterhelt, D., Sinner, E.K., (2007) Angewandte Chemie-International Edition, 46(4), 605.
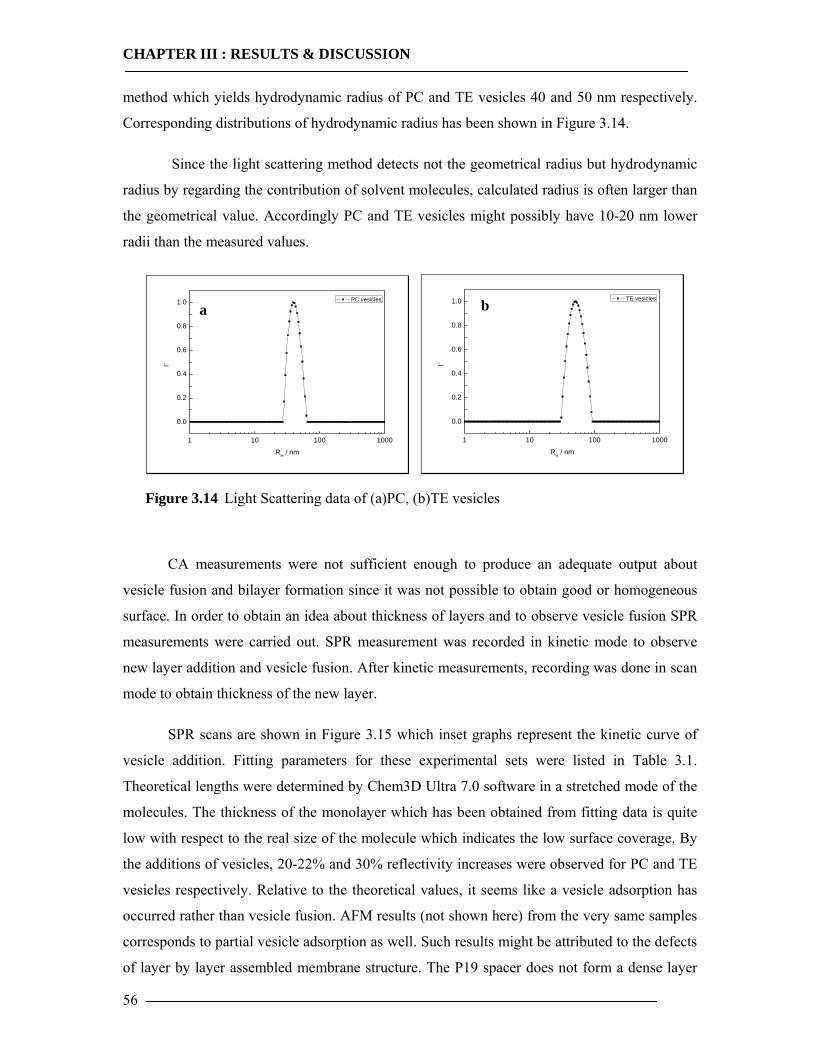
CHAPTER III : RESULTS & DISCUSSION
56
method which yields hydrodynamic radius of PC and TE vesicles 40 and 50 nm respectively.
Corresponding distributions of hydrodynamic radius has been shown in Figure 3.14.
Since the light scattering method detects not the geometrical radius but hydrodynamic
radius by regarding the contribution of solvent molecules, calculated radius is often larger than
the geometrical value. Accordingly PC and TE vesicles might possibly have 10-20 nm lower
radii than the measured values.
1 10 100 1000
0.0
0.2
0.4
0.6
0.8
1.0
PC vesicles
Γ
RH / nm
1 10 100 1000
0.0
0.2
0.4
0.6
0.8
1.0
TE vesicles
RH / nmΓ
Figure 3.14 Light Scattering data of (a)PC, (b)TE vesicles
CA measurements were not sufficient enough to produce an adequate output about
vesicle fusion and bilayer formation since it was not possible to obtain good or homogeneous
surface. In order to obtain an idea about thickness of layers and to observe vesicle fusion SPR
measurements were carried out. SPR measurement was recorded in kinetic mode to observe
new layer addition and vesicle fusion. After kinetic measurements, recording was done in scan
mode to obtain thickness of the new layer.
SPR scans are shown in Figure 3.15 which inset graphs represent the kinetic curve of
vesicle addition. Fitting parameters for these experimental sets were listed in Table 3.1.
Theoretical lengths were determined by Chem3D Ultra 7.0 software in a stretched mode of the
molecules. The thickness of the monolayer which has been obtained from fitting data is quite
low with respect to the real size of the molecule which indicates the low surface coverage. By
the additions of vesicles, 20-22% and 30% reflectivity increases were observed for PC and TE
vesicles respectively. Relative to the theoretical values, it seems like a vesicle adsorption has
occurred rather than vesicle fusion. AFM results (not shown here) from the very same samples
corresponds to partial vesicle adsorption as well. Such results might be attributed to the defects
of layer by layer assembled membrane structure. The P19 spacer does not form a dense layer
a b
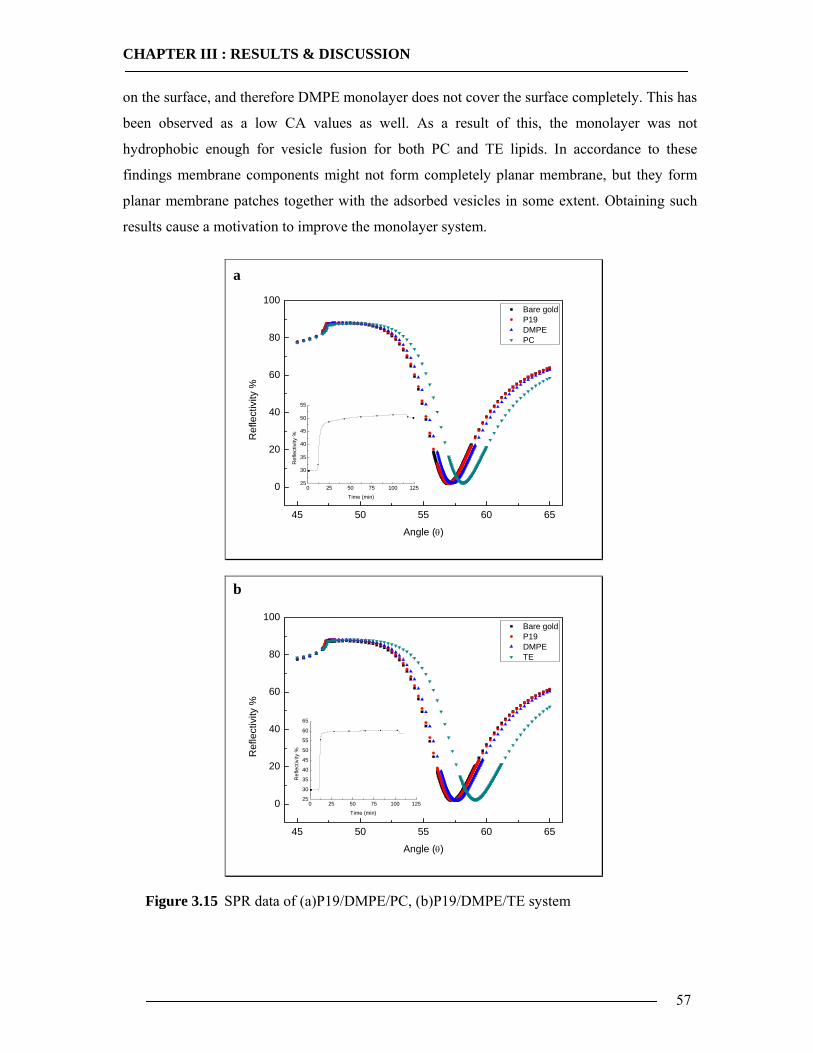
CHAPTER III : RESULTS & DISCUSSION
57
on the surface, and therefore DMPE monolayer does not cover the surface completely. This has
been observed as a low CA values as well. As a result of this, the monolayer was not
hydrophobic enough for vesicle fusion for both PC and TE lipids. In accordance to these
findings membrane components might not form completely planar membrane, but they form
planar membrane patches together with the adsorbed vesicles in some extent. Obtaining such
results cause a motivation to improve the monolayer system.
45 50 55 60 65
0
20
40
60
80
100
0 25 50 75 100 12525
30
35
40
45
50
55
Ref
lect
ivity
%
Angle (θ)
Bare gold P19 DMPE PC
Ref
lect
ivity
%
Time (min)
45 50 55 60 65
0
20
40
60
80
100
0 25 50 75 100 12525
30
35
40
45
50
55
60
65
Ref
lect
ivity
%
Angle (θ)
Bare gold P19 DMPE TE
Ref
lect
ivity
%
Time (min)
Figure 3.15 SPR data of (a)P19/DMPE/PC, (b)P19/DMPE/TE system
a
b
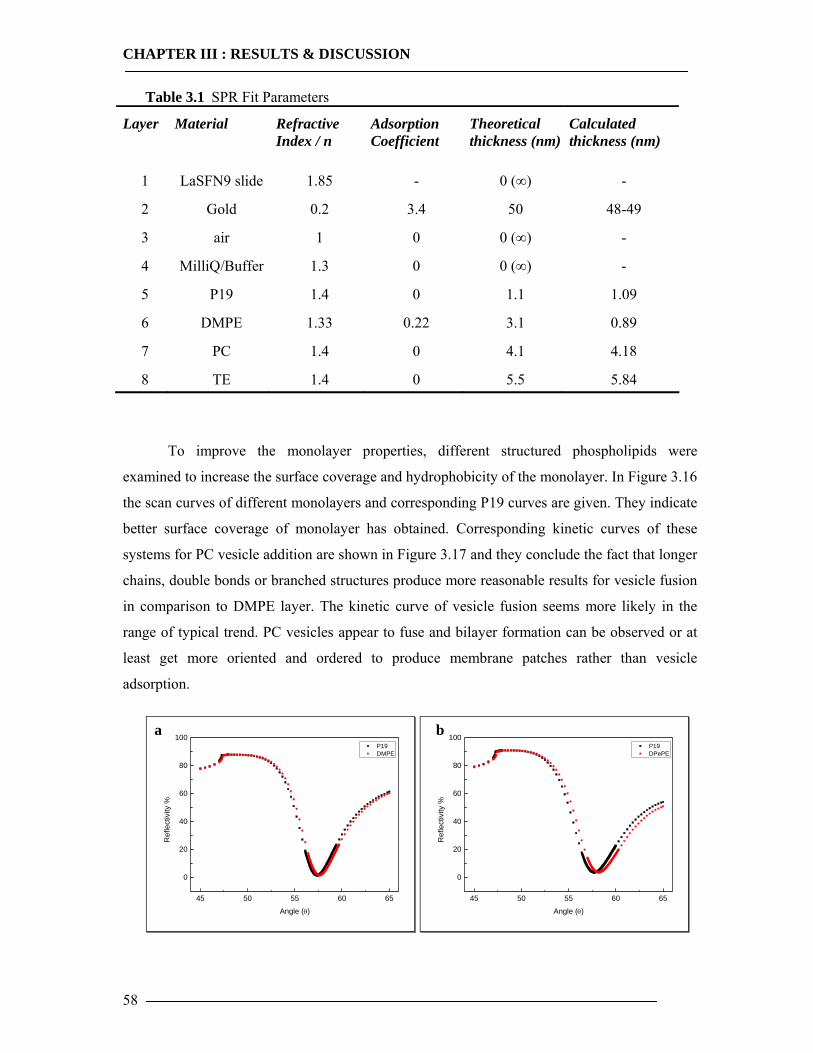
CHAPTER III : RESULTS & DISCUSSION
58
Table 3.1 SPR Fit Parameters
Layer Material Refractive Index / n
Adsorption Coefficient
Theoretical thickness (nm)
Calculated thickness (nm)
1 LaSFN9 slide 1.85 - 0 (∞) -
2 Gold 0.2 3.4 50 48-49
3 air 1 0 0 (∞) -
4 MilliQ/Buffer 1.3 0 0 (∞) -
5 P19 1.4 0 1.1 1.09
6 DMPE 1.33 0.22 3.1 0.89
7 PC 1.4 0 4.1 4.18
8 TE 1.4 0 5.5 5.84
To improve the monolayer properties, different structured phospholipids were
examined to increase the surface coverage and hydrophobicity of the monolayer. In Figure 3.16
the scan curves of different monolayers and corresponding P19 curves are given. They indicate
better surface coverage of monolayer has obtained. Corresponding kinetic curves of these
systems for PC vesicle addition are shown in Figure 3.17 and they conclude the fact that longer
chains, double bonds or branched structures produce more reasonable results for vesicle fusion
in comparison to DMPE layer. The kinetic curve of vesicle fusion seems more likely in the
range of typical trend. PC vesicles appear to fuse and bilayer formation can be observed or at
least get more oriented and ordered to produce membrane patches rather than vesicle
adsorption.
45 50 55 60 65
0
20
40
60
80
100
Ref
lect
ivity
%
Angle (θ)
P19 DMPE
45 50 55 60 65
0
20
40
60
80
100 P19 DPePE
Ref
lect
ivity
%
Angle (θ)
a b
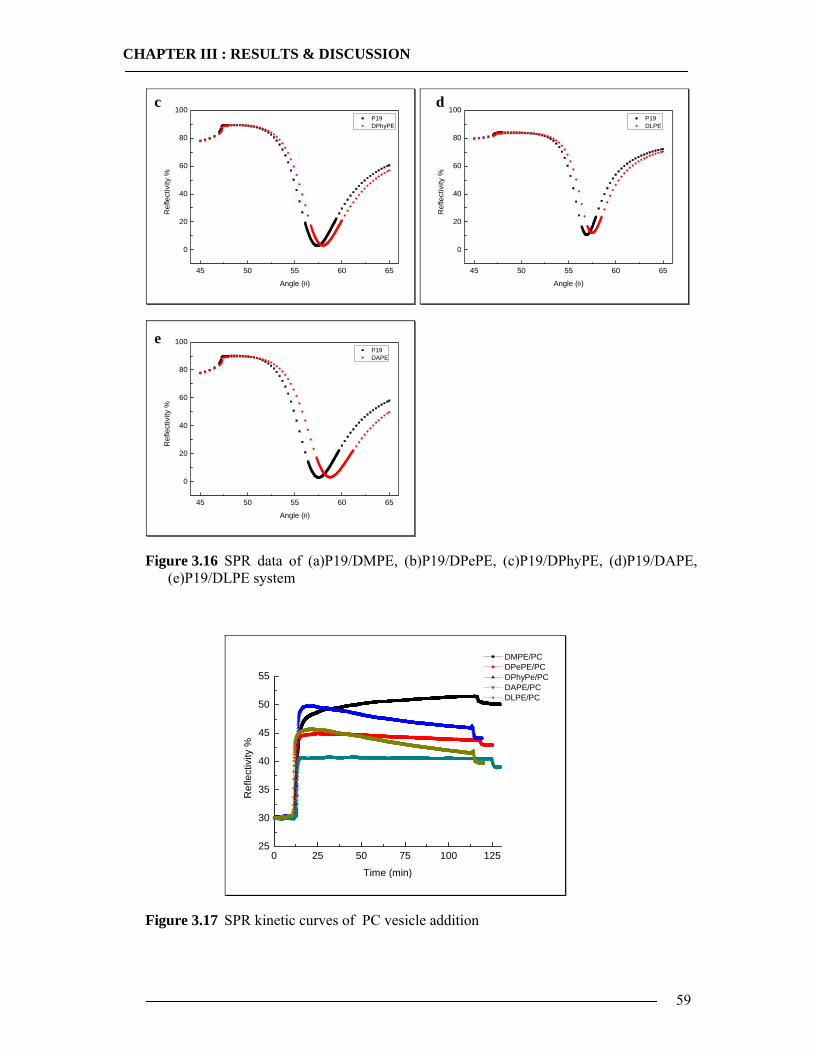
CHAPTER III : RESULTS & DISCUSSION
59
45 50 55 60 65
0
20
40
60
80
100 P19 DPhyPE
Ref
lect
ivity
%
Angle (θ)
45 50 55 60 65
0
20
40
60
80
100 P19 DLPE
Ref
lect
ivity
%
Angle (θ)
45 50 55 60 65
0
20
40
60
80
100 P19 DAPE
Ref
lect
ivity
%
Angle (θ)
Figure 3.16 SPR data of (a)P19/DMPE, (b)P19/DPePE, (c)P19/DPhyPE, (d)P19/DAPE, (e)P19/DLPE system
0 25 50 75 100 12525
30
35
40
45
50
55
Ref
lect
ivity
%
Time (min)
DMPE/PC DPePE/PC DPhyPe/PC DAPE/PC DLPE/PC
Figure 3.17 SPR kinetic curves of PC vesicle addition
c d
e
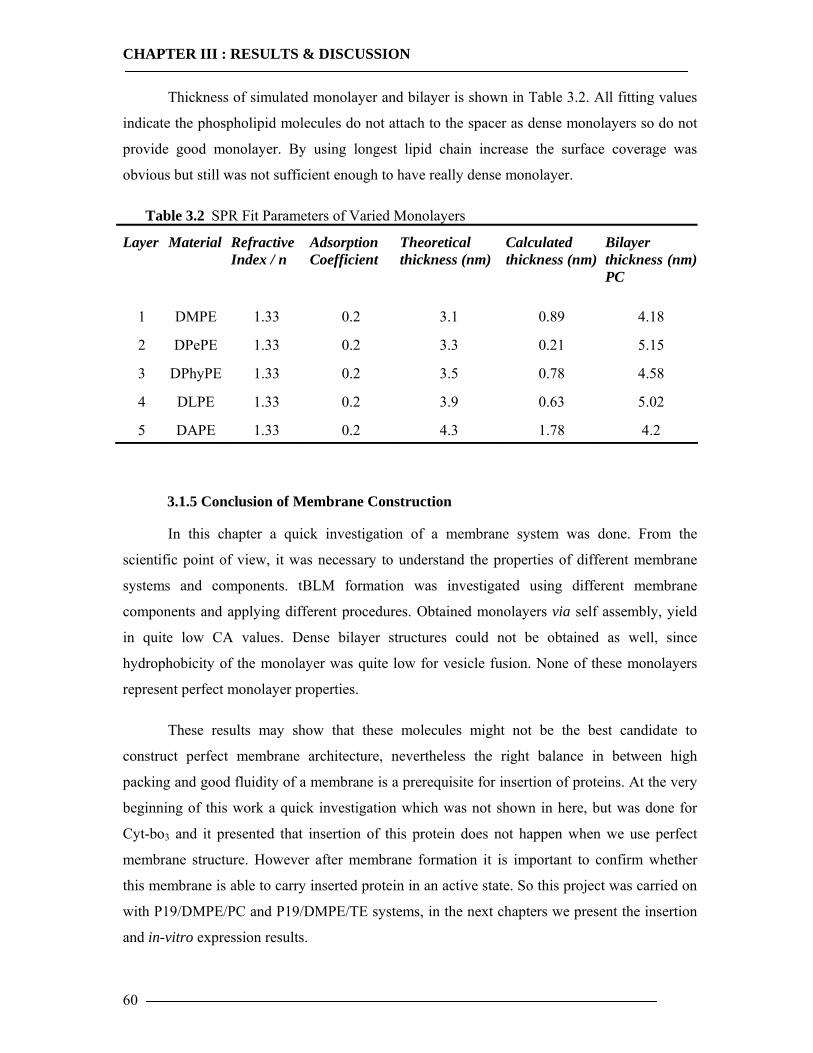
CHAPTER III : RESULTS & DISCUSSION
60
Thickness of simulated monolayer and bilayer is shown in Table 3.2. All fitting values
indicate the phospholipid molecules do not attach to the spacer as dense monolayers so do not
provide good monolayer. By using longest lipid chain increase the surface coverage was
obvious but still was not sufficient enough to have really dense monolayer.
Table 3.2 SPR Fit Parameters of Varied Monolayers
Layer Material Refractive Index / n
Adsorption Coefficient
Theoretical thickness (nm)
Calculated thickness (nm)
Bilayer thickness (nm) PC
1 DMPE 1.33 0.2 3.1 0.89 4.18
2 DPePE 1.33 0.2 3.3 0.21 5.15
3 DPhyPE 1.33 0.2 3.5 0.78 4.58
4 DLPE 1.33 0.2 3.9 0.63 5.02
5 DAPE 1.33 0.2 4.3 1.78 4.2
3.1.5 Conclusion of Membrane Construction
In this chapter a quick investigation of a membrane system was done. From the
scientific point of view, it was necessary to understand the properties of different membrane
systems and components. tBLM formation was investigated using different membrane
components and applying different procedures. Obtained monolayers via self assembly, yield
in quite low CA values. Dense bilayer structures could not be obtained as well, since
hydrophobicity of the monolayer was quite low for vesicle fusion. None of these monolayers
represent perfect monolayer properties.
These results may show that these molecules might not be the best candidate to
construct perfect membrane architecture, nevertheless the right balance in between high
packing and good fluidity of a membrane is a prerequisite for insertion of proteins. At the very
beginning of this work a quick investigation which was not shown in here, but was done for
Cyt-bo3 and it presented that insertion of this protein does not happen when we use perfect
membrane structure. However after membrane formation it is important to confirm whether
this membrane is able to carry inserted protein in an active state. So this project was carried on
with P19/DMPE/PC and P19/DMPE/TE systems, in the next chapters we present the insertion
and in-vitro expression results.
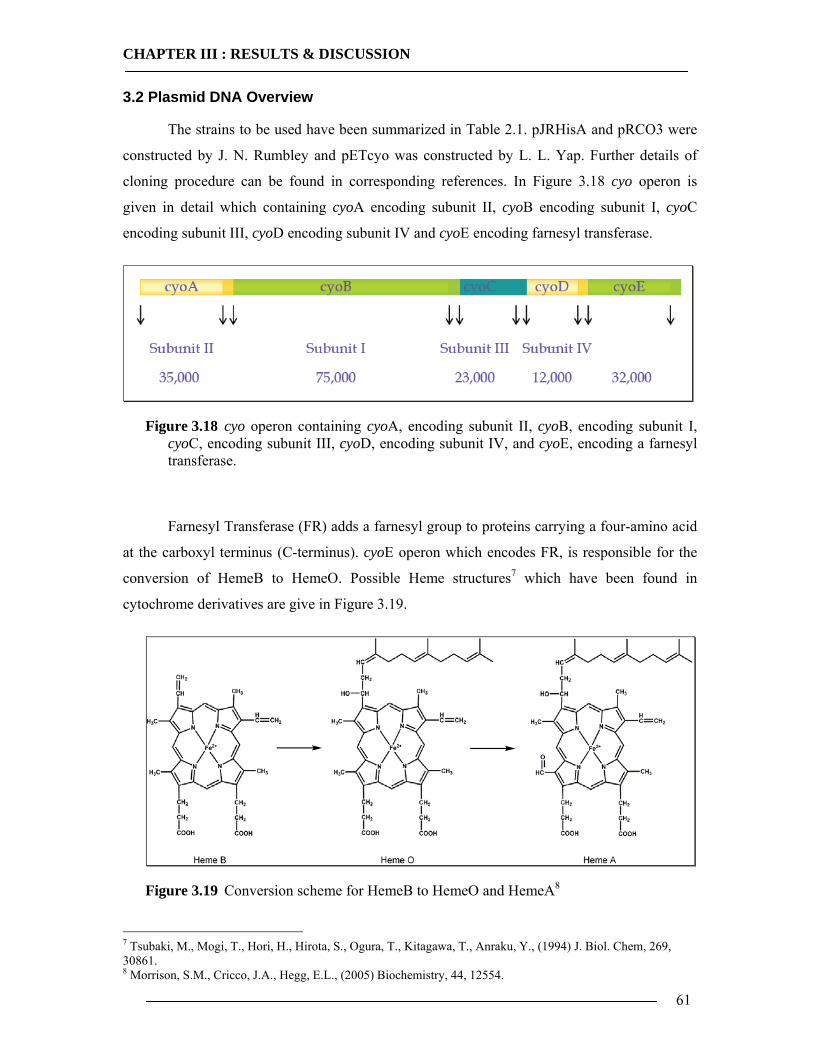
CHAPTER III : RESULTS & DISCUSSION
61
3.2 Plasmid DNA Overview
The strains to be used have been summarized in Table 2.1. pJRHisA and pRCO3 were
constructed by J. N. Rumbley and pETcyo was constructed by L. L. Yap. Further details of
cloning procedure can be found in corresponding references. In Figure 3.18 cyo operon is
given in detail which containing cyoA encoding subunit II, cyoB encoding subunit I, cyoC
encoding subunit III, cyoD encoding subunit IV and cyoE encoding farnesyl transferase.
Figure 3.18 cyo operon containing cyoA, encoding subunit II, cyoB, encoding subunit I, cyoC, encoding subunit III, cyoD, encoding subunit IV, and cyoE, encoding a farnesyl transferase.
Farnesyl Transferase (FR) adds a farnesyl group to proteins carrying a four-amino acid
at the carboxyl terminus (C-terminus). cyoE operon which encodes FR, is responsible for the
conversion of HemeB to HemeO. Possible Heme structures7 which have been found in
cytochrome derivatives are give in Figure 3.19.
Figure 3.19 Conversion scheme for HemeB to HemeO and HemeA8
7 Tsubaki, M., Mogi, T., Hori, H., Hirota, S., Ogura, T., Kitagawa, T., Anraku, Y., (1994) J. Biol. Chem, 269, 30861. 8 Morrison, S.M., Cricco, J.A., Hegg, E.L., (2005) Biochemistry, 44, 12554.

CHAPTER III : RESULTS & DISCUSSION
62
pJRHisA plasmid which encodes the cyoABCDE operon express the wild type Cyt-bo3
with 6xHis tag on the C-terminus of subunitII. Proposed topological models for each subunit
were shown in Figure 3.20.
a
b
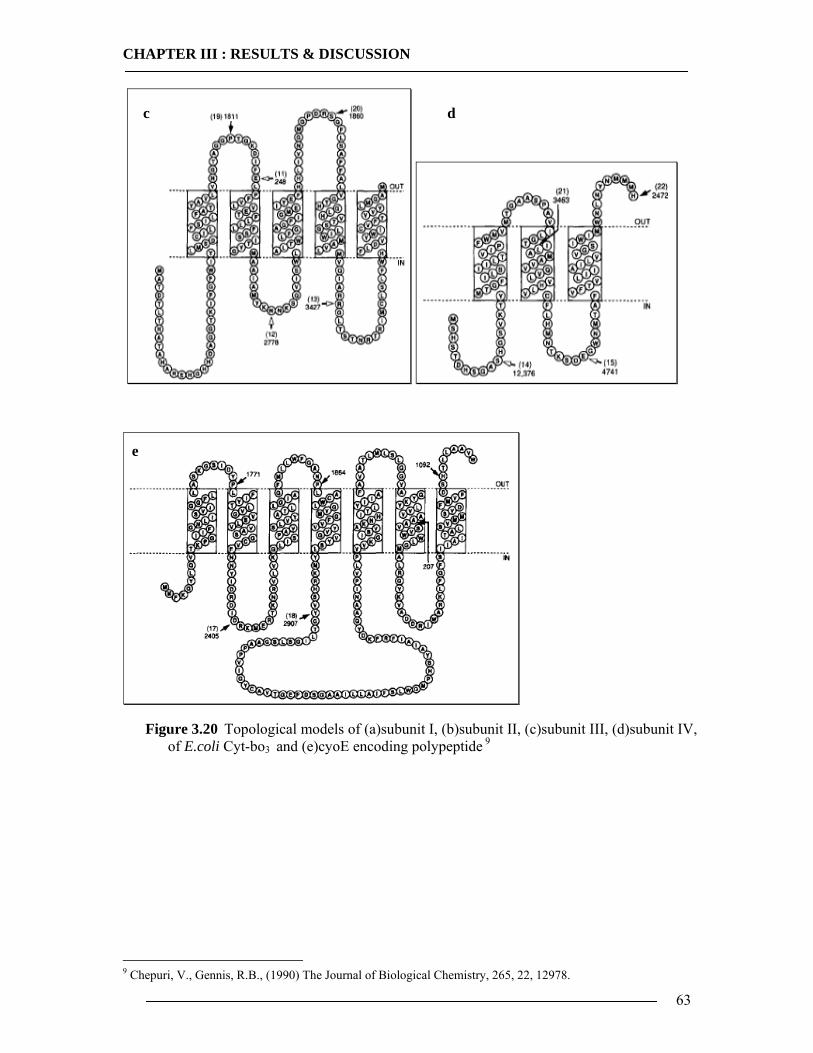
CHAPTER III : RESULTS & DISCUSSION
63
Figure 3.20 Topological models of (a)subunit I, (b)subunit II, (c)subunit III, (d)subunit IV, of E.coli Cyt-bo3 and (e)cyoE encoding polypeptide
9
9 Chepuri, V., Gennis, R.B., (1990) The Journal of Biological Chemistry, 265, 22, 12978.
c d
e
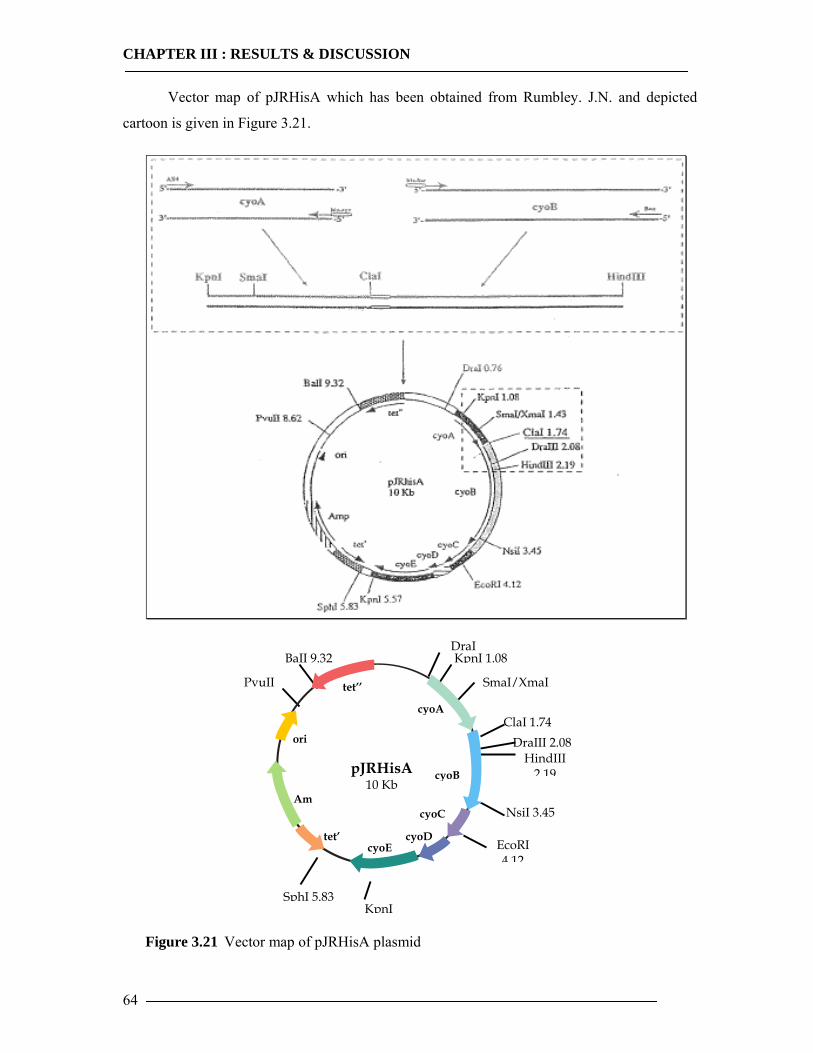
CHAPTER III : RESULTS & DISCUSSION
64
Vector map of pJRHisA which has been obtained from Rumbley. J.N. and depicted
cartoon is given in Figure 3.21.
Figure 3.21 Vector map of pJRHisA plasmid
PvuII
pJRHisA 10 Kb
DraI KpnI 1.08
SmaI/XmaI
ClaI 1.74 DraIII 2.08
BaII 9.32
HindIII 2 19
NsiI 3.45
EcoRI 4 12
KpnI SphI 5.83
tet’’
cyoA
cyoB
cyoC
cyoD cyoE
tet’
Am
ori
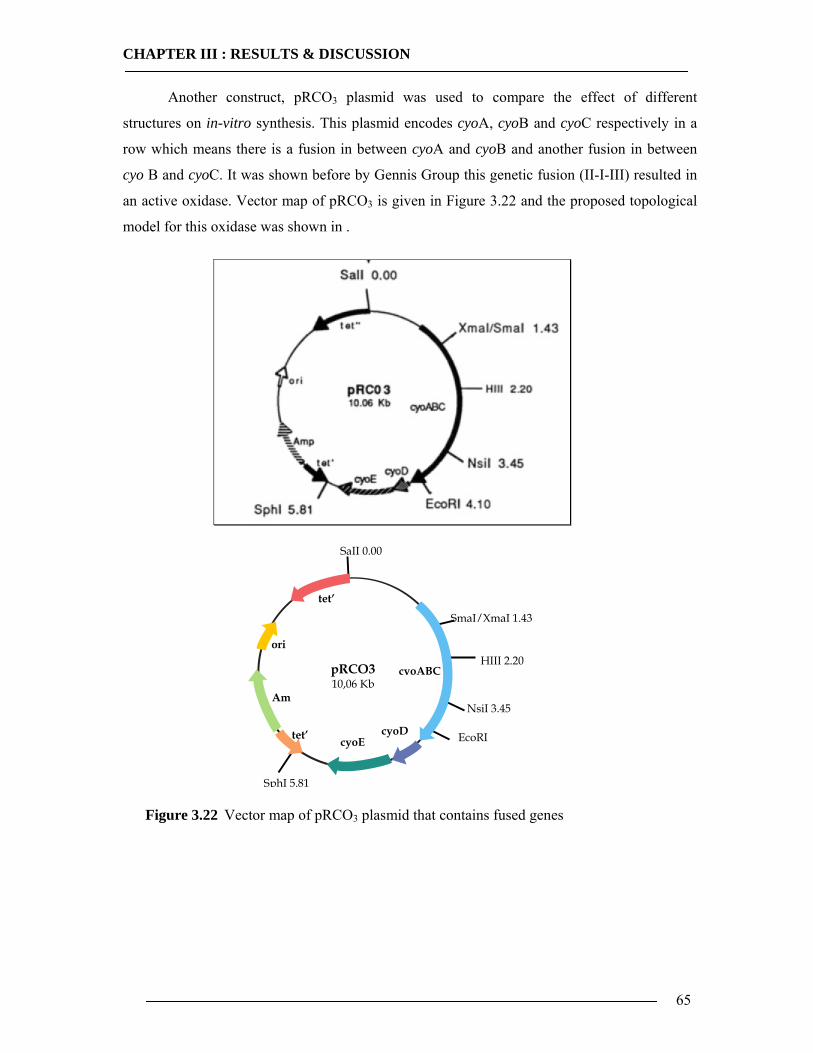
CHAPTER III : RESULTS & DISCUSSION
65
Another construct, pRCO3 plasmid was used to compare the effect of different
structures on in-vitro synthesis. This plasmid encodes cyoA, cyoB and cyoC respectively in a
row which means there is a fusion in between cyoA and cyoB and another fusion in between
cyo B and cyoC. It was shown before by Gennis Group this genetic fusion (II-I-III) resulted in
an active oxidase. Vector map of pRCO3 is given in Figure 3.22 and the proposed topological
model for this oxidase was shown in .
Figure 3.22 Vector map of pRCO3 plasmid that contains fused genes
pRCO3 10,06 Kb
SmaI/XmaI 1.43
SaII 0.00
HIII 2.20
NsiI 3.45
EcoRI
SphI 5.81
tet’
cyoABC
cyoD cyoE tet’
Am
ori
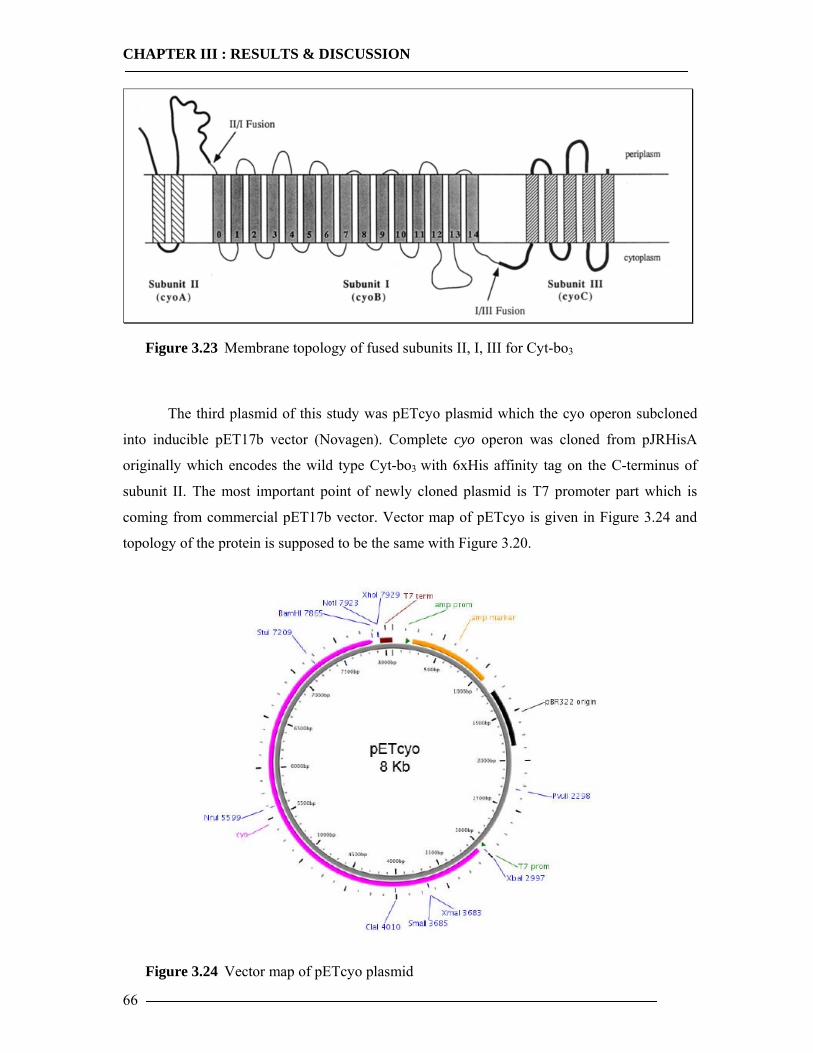
CHAPTER III : RESULTS & DISCUSSION
66
Figure 3.23 Membrane topology of fused subunits II, I, III for Cyt-bo3
The third plasmid of this study was pETcyo plasmid which the cyo operon subcloned
into inducible pET17b vector (Novagen). Complete cyo operon was cloned from pJRHisA
originally which encodes the wild type Cyt-bo3 with 6xHis affinity tag on the C-terminus of
subunit II. The most important point of newly cloned plasmid is T7 promoter part which is
coming from commercial pET17b vector. Vector map of pETcyo is given in Figure 3.24 and
topology of the protein is supposed to be the same with Figure 3.20.
Figure 3.24 Vector map of pETcyo plasmid
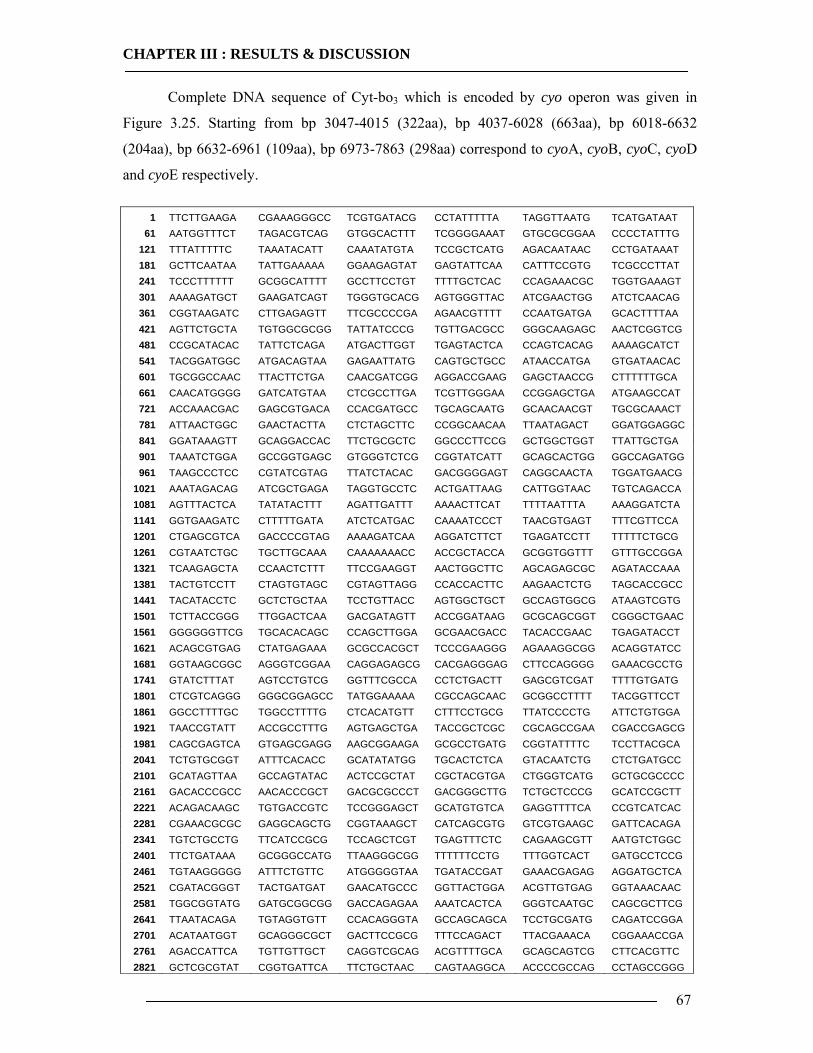
CHAPTER III : RESULTS & DISCUSSION
67
Complete DNA sequence of Cyt-bo3 which is encoded by cyo operon was given in
Figure 3.25. Starting from bp 3047-4015 (322aa), bp 4037-6028 (663aa), bp 6018-6632
(204aa), bp 6632-6961 (109aa), bp 6973-7863 (298aa) correspond to cyoA, cyoB, cyoC, cyoD
and cyoE respectively.
1 TTCTTGAAGA CGAAAGGGCC TCGTGATACG CCTATTTTTA TAGGTTAATG TCATGATAAT 61 AATGGTTTCT TAGACGTCAG GTGGCACTTT TCGGGGAAAT GTGCGCGGAA CCCCTATTTG
121 TTTATTTTTC TAAATACATT CAAATATGTA TCCGCTCATG AGACAATAAC CCTGATAAAT 181 GCTTCAATAA TATTGAAAAA GGAAGAGTAT GAGTATTCAA CATTTCCGTG TCGCCCTTAT 241 TCCCTTTTTT GCGGCATTTT GCCTTCCTGT TTTTGCTCAC CCAGAAACGC TGGTGAAAGT 301 AAAAGATGCT GAAGATCAGT TGGGTGCACG AGTGGGTTAC ATCGAACTGG ATCTCAACAG 361 CGGTAAGATC CTTGAGAGTT TTCGCCCCGA AGAACGTTTT CCAATGATGA GCACTTTTAA 421 AGTTCTGCTA TGTGGCGCGG TATTATCCCG TGTTGACGCC GGGCAAGAGC AACTCGGTCG 481 CCGCATACAC TATTCTCAGA ATGACTTGGT TGAGTACTCA CCAGTCACAG AAAAGCATCT 541 TACGGATGGC ATGACAGTAA GAGAATTATG CAGTGCTGCC ATAACCATGA GTGATAACAC 601 TGCGGCCAAC TTACTTCTGA CAACGATCGG AGGACCGAAG GAGCTAACCG CTTTTTTGCA 661 CAACATGGGG GATCATGTAA CTCGCCTTGA TCGTTGGGAA CCGGAGCTGA ATGAAGCCAT 721 ACCAAACGAC GAGCGTGACA CCACGATGCC TGCAGCAATG GCAACAACGT TGCGCAAACT 781 ATTAACTGGC GAACTACTTA CTCTAGCTTC CCGGCAACAA TTAATAGACT GGATGGAGGC 841 GGATAAAGTT GCAGGACCAC TTCTGCGCTC GGCCCTTCCG GCTGGCTGGT TTATTGCTGA 901 TAAATCTGGA GCCGGTGAGC GTGGGTCTCG CGGTATCATT GCAGCACTGG GGCCAGATGG 961 TAAGCCCTCC CGTATCGTAG TTATCTACAC GACGGGGAGT CAGGCAACTA TGGATGAACG
1021 AAATAGACAG ATCGCTGAGA TAGGTGCCTC ACTGATTAAG CATTGGTAAC TGTCAGACCA 1081 AGTTTACTCA TATATACTTT AGATTGATTT AAAACTTCAT TTTTAATTTA AAAGGATCTA 1141 GGTGAAGATC CTTTTTGATA ATCTCATGAC CAAAATCCCT TAACGTGAGT TTTCGTTCCA 1201 CTGAGCGTCA GACCCCGTAG AAAAGATCAA AGGATCTTCT TGAGATCCTT TTTTTCTGCG 1261 CGTAATCTGC TGCTTGCAAA CAAAAAAACC ACCGCTACCA GCGGTGGTTT GTTTGCCGGA 1321 TCAAGAGCTA CCAACTCTTT TTCCGAAGGT AACTGGCTTC AGCAGAGCGC AGATACCAAA 1381 TACTGTCCTT CTAGTGTAGC CGTAGTTAGG CCACCACTTC AAGAACTCTG TAGCACCGCC 1441 TACATACCTC GCTCTGCTAA TCCTGTTACC AGTGGCTGCT GCCAGTGGCG ATAAGTCGTG 1501 TCTTACCGGG TTGGACTCAA GACGATAGTT ACCGGATAAG GCGCAGCGGT CGGGCTGAAC 1561 GGGGGGTTCG TGCACACAGC CCAGCTTGGA GCGAACGACC TACACCGAAC TGAGATACCT 1621 ACAGCGTGAG CTATGAGAAA GCGCCACGCT TCCCGAAGGG AGAAAGGCGG ACAGGTATCC 1681 GGTAAGCGGC AGGGTCGGAA CAGGAGAGCG CACGAGGGAG CTTCCAGGGG GAAACGCCTG 1741 GTATCTTTAT AGTCCTGTCG GGTTTCGCCA CCTCTGACTT GAGCGTCGAT TTTTGTGATG 1801 CTCGTCAGGG GGGCGGAGCC TATGGAAAAA CGCCAGCAAC GCGGCCTTTT TACGGTTCCT 1861 GGCCTTTTGC TGGCCTTTTG CTCACATGTT CTTTCCTGCG TTATCCCCTG ATTCTGTGGA 1921 TAACCGTATT ACCGCCTTTG AGTGAGCTGA TACCGCTCGC CGCAGCCGAA CGACCGAGCG 1981 CAGCGAGTCA GTGAGCGAGG AAGCGGAAGA GCGCCTGATG CGGTATTTTC TCCTTACGCA 2041 TCTGTGCGGT ATTTCACACC GCATATATGG TGCACTCTCA GTACAATCTG CTCTGATGCC 2101 GCATAGTTAA GCCAGTATAC ACTCCGCTAT CGCTACGTGA CTGGGTCATG GCTGCGCCCC 2161 GACACCCGCC AACACCCGCT GACGCGCCCT GACGGGCTTG TCTGCTCCCG GCATCCGCTT 2221 ACAGACAAGC TGTGACCGTC TCCGGGAGCT GCATGTGTCA GAGGTTTTCA CCGTCATCAC 2281 CGAAACGCGC GAGGCAGCTG CGGTAAAGCT CATCAGCGTG GTCGTGAAGC GATTCACAGA 2341 TGTCTGCCTG TTCATCCGCG TCCAGCTCGT TGAGTTTCTC CAGAAGCGTT AATGTCTGGC 2401 TTCTGATAAA GCGGGCCATG TTAAGGGCGG TTTTTTCCTG TTTGGTCACT GATGCCTCCG 2461 TGTAAGGGGG ATTTCTGTTC ATGGGGGTAA TGATACCGAT GAAACGAGAG AGGATGCTCA 2521 CGATACGGGT TACTGATGAT GAACATGCCC GGTTACTGGA ACGTTGTGAG GGTAAACAAC 2581 TGGCGGTATG GATGCGGCGG GACCAGAGAA AAATCACTCA GGGTCAATGC CAGCGCTTCG 2641 TTAATACAGA TGTAGGTGTT CCACAGGGTA GCCAGCAGCA TCCTGCGATG CAGATCCGGA 2701 ACATAATGGT GCAGGGCGCT GACTTCCGCG TTTCCAGACT TTACGAAACA CGGAAACCGA 2761 AGACCATTCA TGTTGTTGCT CAGGTCGCAG ACGTTTTGCA GCAGCAGTCG CTTCACGTTC 2821 GCTCGCGTAT CGGTGATTCA TTCTGCTAAC CAGTAAGGCA ACCCCGCCAG CCTAGCCGGG
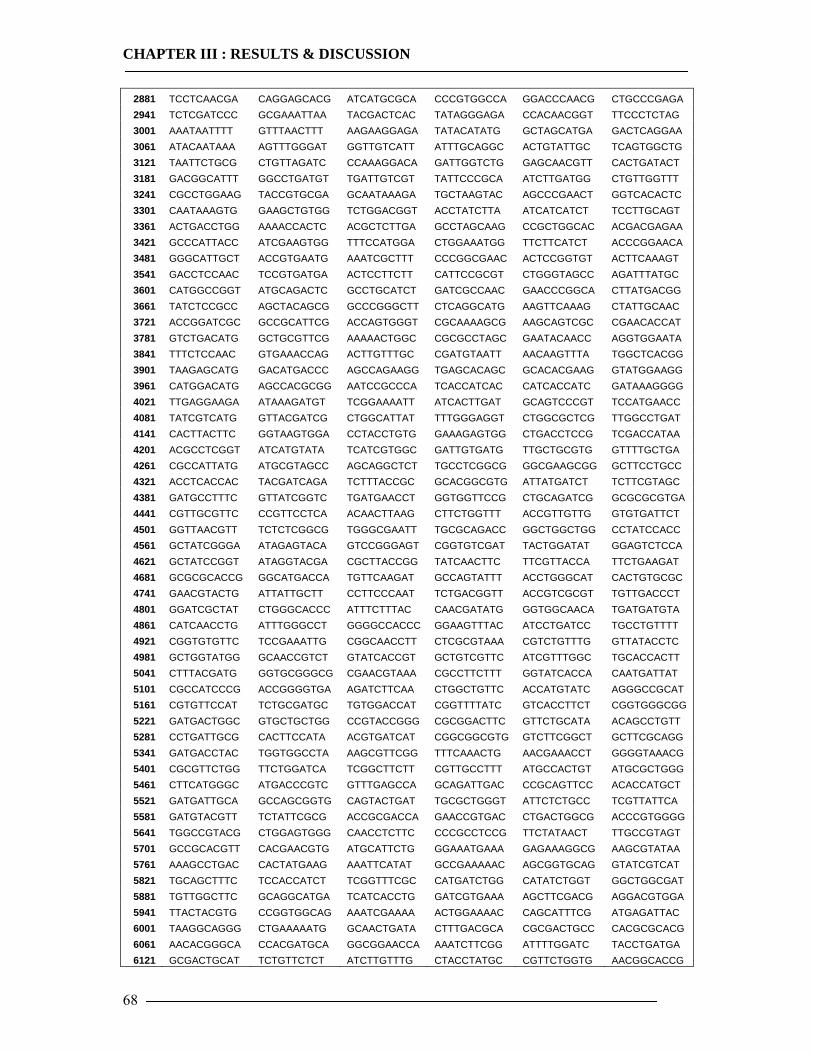
CHAPTER III : RESULTS & DISCUSSION
68
2881 TCCTCAACGA CAGGAGCACG ATCATGCGCA CCCGTGGCCA GGACCCAACG CTGCCCGAGA 2941 TCTCGATCCC GCGAAATTAA TACGACTCAC TATAGGGAGA CCACAACGGT TTCCCTCTAG 3001 AAATAATTTT GTTTAACTTT AAGAAGGAGA TATACATATG GCTAGCATGA GACTCAGGAA 3061 ATACAATAAA AGTTTGGGAT GGTTGTCATT ATTTGCAGGC ACTGTATTGC TCAGTGGCTG 3121 TAATTCTGCG CTGTTAGATC CCAAAGGACA GATTGGTCTG GAGCAACGTT CACTGATACT 3181 GACGGCATTT GGCCTGATGT TGATTGTCGT TATTCCCGCA ATCTTGATGG CTGTTGGTTT 3241 CGCCTGGAAG TACCGTGCGA GCAATAAAGA TGCTAAGTAC AGCCCGAACT GGTCACACTC 3301 CAATAAAGTG GAAGCTGTGG TCTGGACGGT ACCTATCTTA ATCATCATCT TCCTTGCAGT 3361 ACTGACCTGG AAAACCACTC ACGCTCTTGA GCCTAGCAAG CCGCTGGCAC ACGACGAGAA 3421 GCCCATTACC ATCGAAGTGG TTTCCATGGA CTGGAAATGG TTCTTCATCT ACCCGGAACA 3481 GGGCATTGCT ACCGTGAATG AAATCGCTTT CCCGGCGAAC ACTCCGGTGT ACTTCAAAGT 3541 GACCTCCAAC TCCGTGATGA ACTCCTTCTT CATTCCGCGT CTGGGTAGCC AGATTTATGC 3601 CATGGCCGGT ATGCAGACTC GCCTGCATCT GATCGCCAAC GAACCCGGCA CTTATGACGG 3661 TATCTCCGCC AGCTACAGCG GCCCGGGCTT CTCAGGCATG AAGTTCAAAG CTATTGCAAC 3721 ACCGGATCGC GCCGCATTCG ACCAGTGGGT CGCAAAAGCG AAGCAGTCGC CGAACACCAT 3781 GTCTGACATG GCTGCGTTCG AAAAACTGGC CGCGCCTAGC GAATACAACC AGGTGGAATA 3841 TTTCTCCAAC GTGAAACCAG ACTTGTTTGC CGATGTAATT AACAAGTTTA TGGCTCACGG 3901 TAAGAGCATG GACATGACCC AGCCAGAAGG TGAGCACAGC GCACACGAAG GTATGGAAGG 3961 CATGGACATG AGCCACGCGG AATCCGCCCA TCACCATCAC CATCACCATC GATAAAGGGG 4021 TTGAGGAAGA ATAAAGATGT TCGGAAAATT ATCACTTGAT GCAGTCCCGT TCCATGAACC 4081 TATCGTCATG GTTACGATCG CTGGCATTAT TTTGGGAGGT CTGGCGCTCG TTGGCCTGAT 4141 CACTTACTTC GGTAAGTGGA CCTACCTGTG GAAAGAGTGG CTGACCTCCG TCGACCATAA 4201 ACGCCTCGGT ATCATGTATA TCATCGTGGC GATTGTGATG TTGCTGCGTG GTTTTGCTGA 4261 CGCCATTATG ATGCGTAGCC AGCAGGCTCT TGCCTCGGCG GGCGAAGCGG GCTTCCTGCC 4321 ACCTCACCAC TACGATCAGA TCTTTACCGC GCACGGCGTG ATTATGATCT TCTTCGTAGC 4381 GATGCCTTTC GTTATCGGTC TGATGAACCT GGTGGTTCCG CTGCAGATCG GCGCGCGTGA 4441 CGTTGCGTTC CCGTTCCTCA ACAACTTAAG CTTCTGGTTT ACCGTTGTTG GTGTGATTCT 4501 GGTTAACGTT TCTCTCGGCG TGGGCGAATT TGCGCAGACC GGCTGGCTGG CCTATCCACC 4561 GCTATCGGGA ATAGAGTACA GTCCGGGAGT CGGTGTCGAT TACTGGATAT GGAGTCTCCA 4621 GCTATCCGGT ATAGGTACGA CGCTTACCGG TATCAACTTC TTCGTTACCA TTCTGAAGAT 4681 GCGCGCACCG GGCATGACCA TGTTCAAGAT GCCAGTATTT ACCTGGGCAT CACTGTGCGC 4741 GAACGTACTG ATTATTGCTT CCTTCCCAAT TCTGACGGTT ACCGTCGCGT TGTTGACCCT 4801 GGATCGCTAT CTGGGCACCC ATTTCTTTAC CAACGATATG GGTGGCAACA TGATGATGTA 4861 CATCAACCTG ATTTGGGCCT GGGGCCACCC GGAAGTTTAC ATCCTGATCC TGCCTGTTTT 4921 CGGTGTGTTC TCCGAAATTG CGGCAACCTT CTCGCGTAAA CGTCTGTTTG GTTATACCTC 4981 GCTGGTATGG GCAACCGTCT GTATCACCGT GCTGTCGTTC ATCGTTTGGC TGCACCACTT 5041 CTTTACGATG GGTGCGGGCG CGAACGTAAA CGCCTTCTTT GGTATCACCA CAATGATTAT 5101 CGCCATCCCG ACCGGGGTGA AGATCTTCAA CTGGCTGTTC ACCATGTATC AGGGCCGCAT 5161 CGTGTTCCAT TCTGCGATGC TGTGGACCAT CGGTTTTATC GTCACCTTCT CGGTGGGCGG 5221 GATGACTGGC GTGCTGCTGG CCGTACCGGG CGCGGACTTC GTTCTGCATA ACAGCCTGTT 5281 CCTGATTGCG CACTTCCATA ACGTGATCAT CGGCGGCGTG GTCTTCGGCT GCTTCGCAGG 5341 GATGACCTAC TGGTGGCCTA AAGCGTTCGG TTTCAAACTG AACGAAACCT GGGGTAAACG 5401 CGCGTTCTGG TTCTGGATCA TCGGCTTCTT CGTTGCCTTT ATGCCACTGT ATGCGCTGGG 5461 CTTCATGGGC ATGACCCGTC GTTTGAGCCA GCAGATTGAC CCGCAGTTCC ACACCATGCT 5521 GATGATTGCA GCCAGCGGTG CAGTACTGAT TGCGCTGGGT ATTCTCTGCC TCGTTATTCA 5581 GATGTACGTT TCTATTCGCG ACCGCGACCA GAACCGTGAC CTGACTGGCG ACCCGTGGGG 5641 TGGCCGTACG CTGGAGTGGG CAACCTCTTC CCCGCCTCCG TTCTATAACT TTGCCGTAGT 5701 GCCGCACGTT CACGAACGTG ATGCATTCTG GGAAATGAAA GAGAAAGGCG AAGCGTATAA 5761 AAAGCCTGAC CACTATGAAG AAATTCATAT GCCGAAAAAC AGCGGTGCAG GTATCGTCAT 5821 TGCAGCTTTC TCCACCATCT TCGGTTTCGC CATGATCTGG CATATCTGGT GGCTGGCGAT 5881 TGTTGGCTTC GCAGGCATGA TCATCACCTG GATCGTGAAA AGCTTCGACG AGGACGTGGA 5941 TTACTACGTG CCGGTGGCAG AAATCGAAAA ACTGGAAAAC CAGCATTTCG ATGAGATTAC 6001 TAAGGCAGGG CTGAAAAATG GCAACTGATA CTTTGACGCA CGCGACTGCC CACGCGCACG 6061 AACACGGGCA CCACGATGCA GGCGGAACCA AAATCTTCGG ATTTTGGATC TACCTGATGA 6121 GCGACTGCAT TCTGTTCTCT ATCTTGTTTG CTACCTATGC CGTTCTGGTG AACGGCACCG
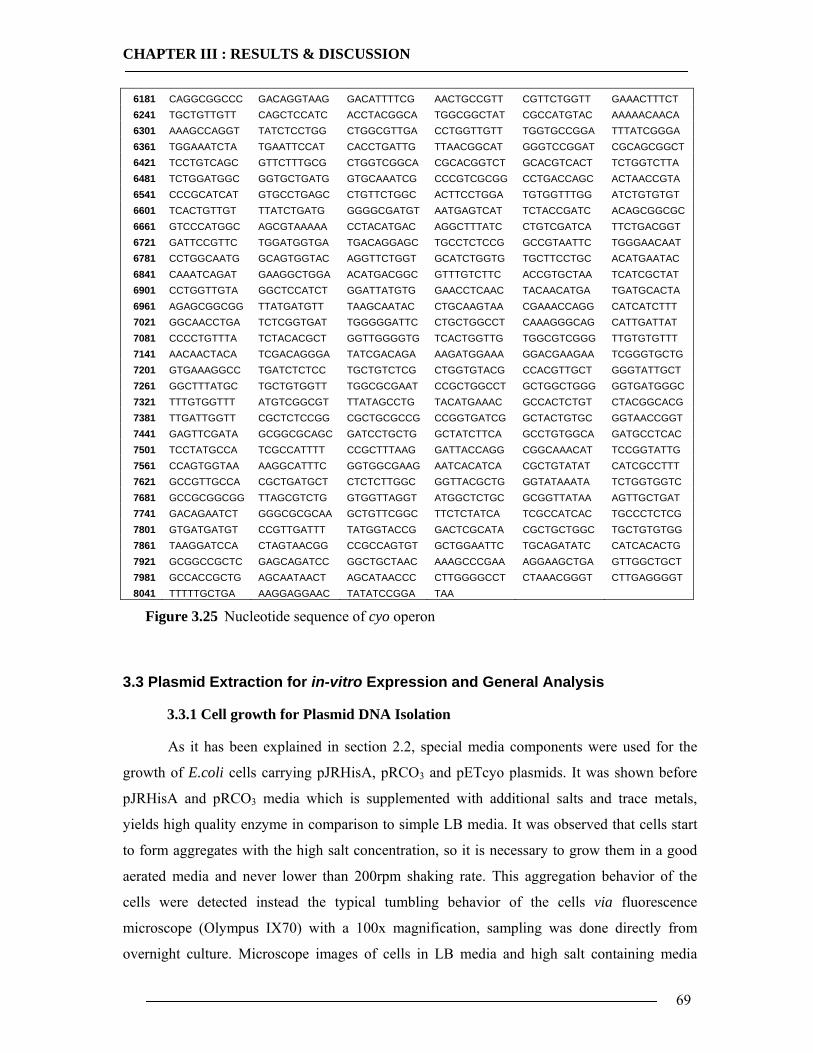
CHAPTER III : RESULTS & DISCUSSION
69
6181 CAGGCGGCCC GACAGGTAAG GACATTTTCG AACTGCCGTT CGTTCTGGTT GAAACTTTCT 6241 TGCTGTTGTT CAGCTCCATC ACCTACGGCA TGGCGGCTAT CGCCATGTAC AAAAACAACA 6301 AAAGCCAGGT TATCTCCTGG CTGGCGTTGA CCTGGTTGTT TGGTGCCGGA TTTATCGGGA 6361 TGGAAATCTA TGAATTCCAT CACCTGATTG TTAACGGCAT GGGTCCGGAT CGCAGCGGCT 6421 TCCTGTCAGC GTTCTTTGCG CTGGTCGGCA CGCACGGTCT GCACGTCACT TCTGGTCTTA 6481 TCTGGATGGC GGTGCTGATG GTGCAAATCG CCCGTCGCGG CCTGACCAGC ACTAACCGTA 6541 CCCGCATCAT GTGCCTGAGC CTGTTCTGGC ACTTCCTGGA TGTGGTTTGG ATCTGTGTGT 6601 TCACTGTTGT TTATCTGATG GGGGCGATGT AATGAGTCAT TCTACCGATC ACAGCGGCGC 6661 GTCCCATGGC AGCGTAAAAA CCTACATGAC AGGCTTTATC CTGTCGATCA TTCTGACGGT 6721 GATTCCGTTC TGGATGGTGA TGACAGGAGC TGCCTCTCCG GCCGTAATTC TGGGAACAAT 6781 CCTGGCAATG GCAGTGGTAC AGGTTCTGGT GCATCTGGTG TGCTTCCTGC ACATGAATAC 6841 CAAATCAGAT GAAGGCTGGA ACATGACGGC GTTTGTCTTC ACCGTGCTAA TCATCGCTAT 6901 CCTGGTTGTA GGCTCCATCT GGATTATGTG GAACCTCAAC TACAACATGA TGATGCACTA 6961 AGAGCGGCGG TTATGATGTT TAAGCAATAC CTGCAAGTAA CGAAACCAGG CATCATCTTT 7021 GGCAACCTGA TCTCGGTGAT TGGGGGATTC CTGCTGGCCT CAAAGGGCAG CATTGATTAT 7081 CCCCTGTTTA TCTACACGCT GGTTGGGGTG TCACTGGTTG TGGCGTCGGG TTGTGTGTTT 7141 AACAACTACA TCGACAGGGA TATCGACAGA AAGATGGAAA GGACGAAGAA TCGGGTGCTG 7201 GTGAAAGGCC TGATCTCTCC TGCTGTCTCG CTGGTGTACG CCACGTTGCT GGGTATTGCT 7261 GGCTTTATGC TGCTGTGGTT TGGCGCGAAT CCGCTGGCCT GCTGGCTGGG GGTGATGGGC 7321 TTTGTGGTTT ATGTCGGCGT TTATAGCCTG TACATGAAAC GCCACTCTGT CTACGGCACG 7381 TTGATTGGTT CGCTCTCCGG CGCTGCGCCG CCGGTGATCG GCTACTGTGC GGTAACCGGT 7441 GAGTTCGATA GCGGCGCAGC GATCCTGCTG GCTATCTTCA GCCTGTGGCA GATGCCTCAC 7501 TCCTATGCCA TCGCCATTTT CCGCTTTAAG GATTACCAGG CGGCAAACAT TCCGGTATTG 7561 CCAGTGGTAA AAGGCATTTC GGTGGCGAAG AATCACATCA CGCTGTATAT CATCGCCTTT 7621 GCCGTTGCCA CGCTGATGCT CTCTCTTGGC GGTTACGCTG GGTATAAATA TCTGGTGGTC 7681 GCCGCGGCGG TTAGCGTCTG GTGGTTAGGT ATGGCTCTGC GCGGTTATAA AGTTGCTGAT 7741 GACAGAATCT GGGCGCGCAA GCTGTTCGGC TTCTCTATCA TCGCCATCAC TGCCCTCTCG 7801 GTGATGATGT CCGTTGATTT TATGGTACCG GACTCGCATA CGCTGCTGGC TGCTGTGTGG 7861 TAAGGATCCA CTAGTAACGG CCGCCAGTGT GCTGGAATTC TGCAGATATC CATCACACTG 7921 GCGGCCGCTC GAGCAGATCC GGCTGCTAAC AAAGCCCGAA AGGAAGCTGA GTTGGCTGCT 7981 GCCACCGCTG AGCAATAACT AGCATAACCC CTTGGGGCCT CTAAACGGGT CTTGAGGGGT 8041 TTTTTGCTGA AAGGAGGAAC TATATCCGGA TAA
Figure 3.25 Nucleotide sequence of cyo operon
3.3 Plasmid Extraction for in-vitro Expression and General Analysis
3.3.1 Cell growth for Plasmid DNA Isolation
As it has been explained in section 2.2, special media components were used for the
growth of E.coli cells carrying pJRHisA, pRCO3 and pETcyo plasmids. It was shown before
pJRHisA and pRCO3 media which is supplemented with additional salts and trace metals,
yields high quality enzyme in comparison to simple LB media. It was observed that cells start
to form aggregates with the high salt concentration, so it is necessary to grow them in a good
aerated media and never lower than 200rpm shaking rate. This aggregation behavior of the
cells were detected instead the typical tumbling behavior of the cells via fluorescence
microscope (Olympus IX70) with a 100x magnification, sampling was done directly from
overnight culture. Microscope images of cells in LB media and high salt containing media
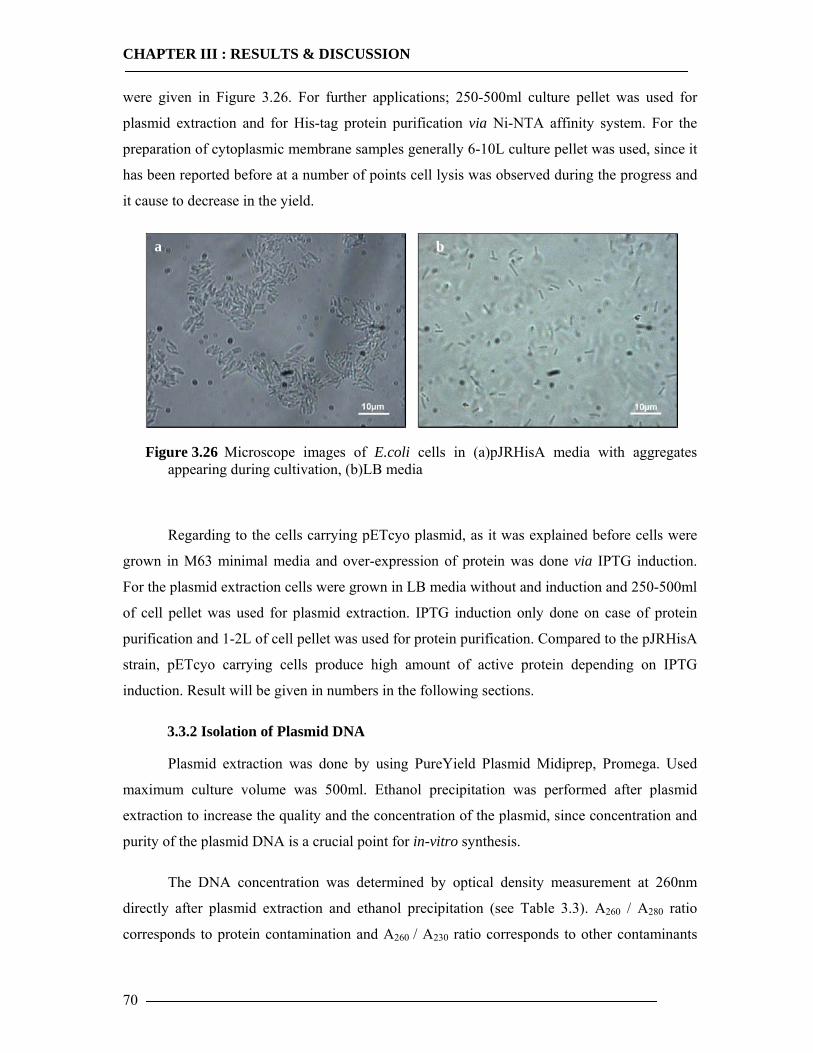
CHAPTER III : RESULTS & DISCUSSION
70
were given in Figure 3.26. For further applications; 250-500ml culture pellet was used for
plasmid extraction and for His-tag protein purification via Ni-NTA affinity system. For the
preparation of cytoplasmic membrane samples generally 6-10L culture pellet was used, since it
has been reported before at a number of points cell lysis was observed during the progress and
it cause to decrease in the yield.
Figure 3.26 Microscope images of E.coli cells in (a)pJRHisA media with aggregates appearing during cultivation, (b)LB media
Regarding to the cells carrying pETcyo plasmid, as it was explained before cells were
grown in M63 minimal media and over-expression of protein was done via IPTG induction.
For the plasmid extraction cells were grown in LB media without and induction and 250-500ml
of cell pellet was used for plasmid extraction. IPTG induction only done on case of protein
purification and 1-2L of cell pellet was used for protein purification. Compared to the pJRHisA
strain, pETcyo carrying cells produce high amount of active protein depending on IPTG
induction. Result will be given in numbers in the following sections.
3.3.2 Isolation of Plasmid DNA
Plasmid extraction was done by using PureYield Plasmid Midiprep, Promega. Used
maximum culture volume was 500ml. Ethanol precipitation was performed after plasmid
extraction to increase the quality and the concentration of the plasmid, since concentration and
purity of the plasmid DNA is a crucial point for in-vitro synthesis.
The DNA concentration was determined by optical density measurement at 260nm
directly after plasmid extraction and ethanol precipitation (see Table 3.3). A260 / A280 ratio
corresponds to protein contamination and A260 / A230 ratio corresponds to other contaminants
a b
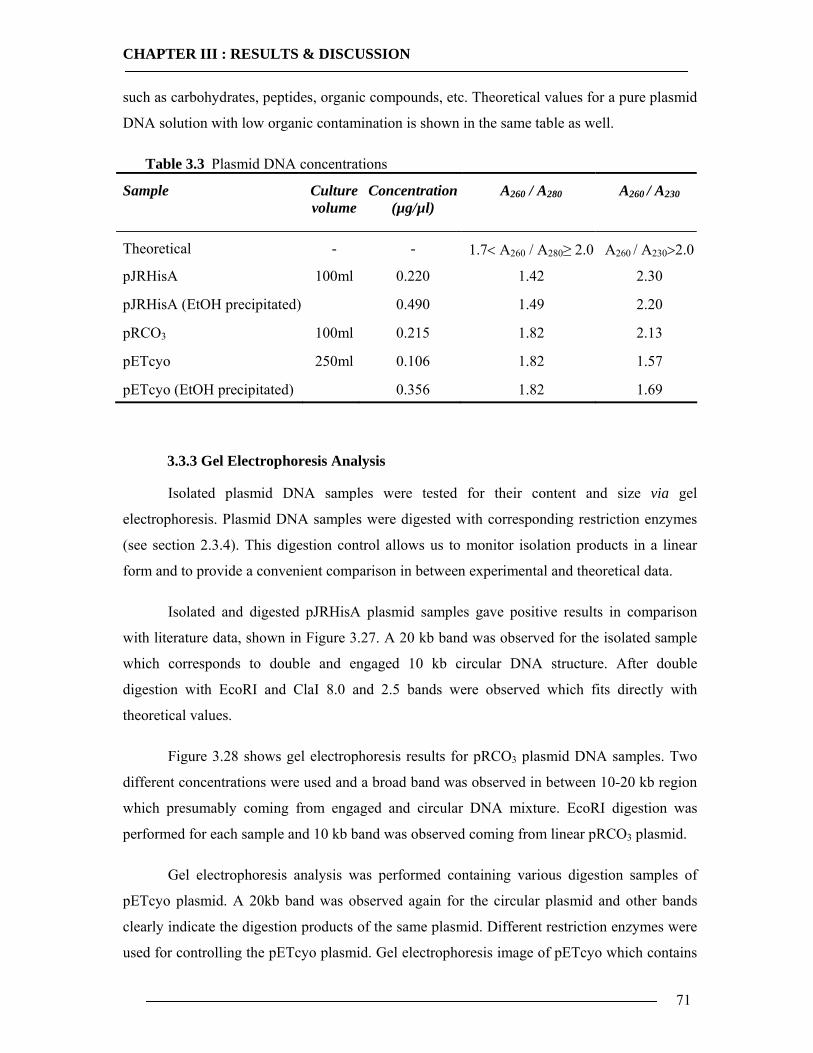
CHAPTER III : RESULTS & DISCUSSION
71
such as carbohydrates, peptides, organic compounds, etc. Theoretical values for a pure plasmid
DNA solution with low organic contamination is shown in the same table as well.
Table 3.3 Plasmid DNA concentrations
Sample Culture volume
Concentration (µg/µl)
A260 / A280 A260 / A230
Theoretical - - 1.7< A260 / A280≥ 2.0 A260 / A230>2.0
pJRHisA 100ml 0.220 1.42 2.30
pJRHisA (EtOH precipitated) 0.490 1.49 2.20
pRCO3 100ml 0.215 1.82 2.13
pETcyo 250ml 0.106 1.82 1.57
pETcyo (EtOH precipitated) 0.356 1.82 1.69
3.3.3 Gel Electrophoresis Analysis
Isolated plasmid DNA samples were tested for their content and size via gel
electrophoresis. Plasmid DNA samples were digested with corresponding restriction enzymes
(see section 2.3.4). This digestion control allows us to monitor isolation products in a linear
form and to provide a convenient comparison in between experimental and theoretical data.
Isolated and digested pJRHisA plasmid samples gave positive results in comparison
with literature data, shown in Figure 3.27. A 20 kb band was observed for the isolated sample
which corresponds to double and engaged 10 kb circular DNA structure. After double
digestion with EcoRI and ClaI 8.0 and 2.5 bands were observed which fits directly with
theoretical values.
Figure 3.28 shows gel electrophoresis results for pRCO3 plasmid DNA samples. Two
different concentrations were used and a broad band was observed in between 10-20 kb region
which presumably coming from engaged and circular DNA mixture. EcoRI digestion was
performed for each sample and 10 kb band was observed coming from linear pRCO3 plasmid.
Gel electrophoresis analysis was performed containing various digestion samples of
pETcyo plasmid. A 20kb band was observed again for the circular plasmid and other bands
clearly indicate the digestion products of the same plasmid. Different restriction enzymes were
used for controlling the pETcyo plasmid. Gel electrophoresis image of pETcyo which contains
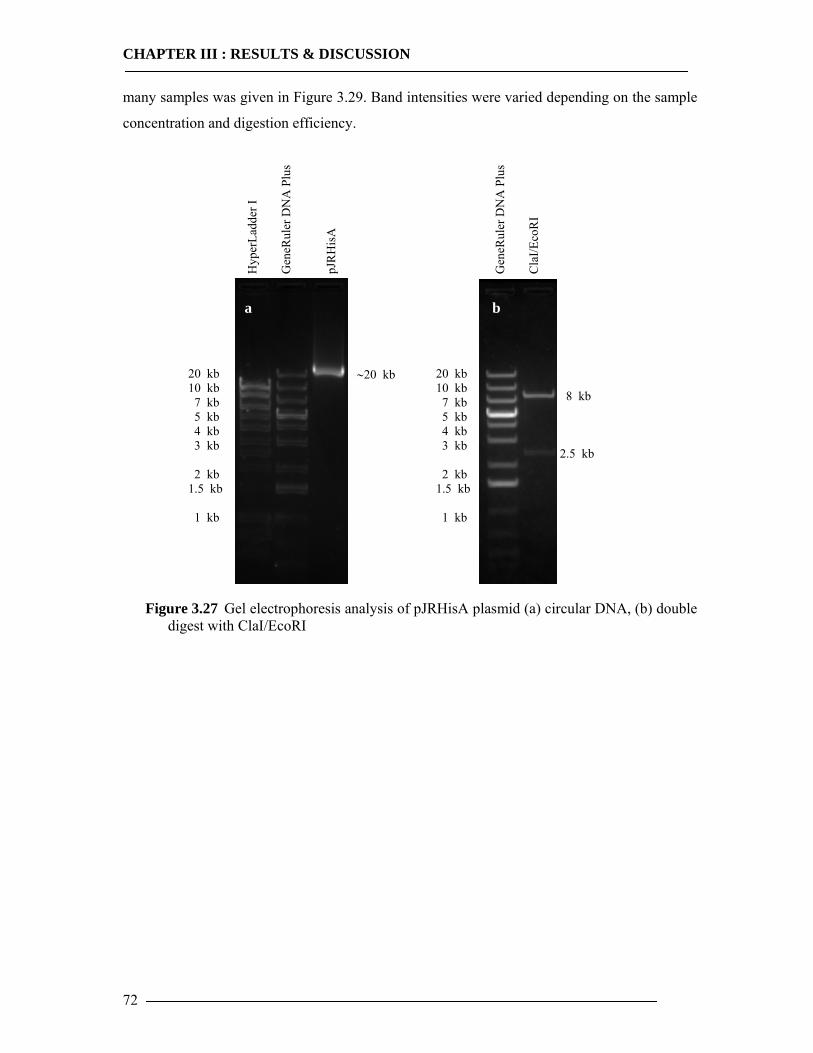
CHAPTER III : RESULTS & DISCUSSION
72
many samples was given in Figure 3.29. Band intensities were varied depending on the sample
concentration and digestion efficiency.
Figure 3.27 Gel electrophoresis analysis of pJRHisA plasmid (a) circular DNA, (b) double digest with ClaI/EcoRI
b
20 kb 10 kb 7 kb 5 kb 4 kb 3 kb 2 kb 1.5 kb 1 kb
8 kb 2.5 kb
Gen
eRul
er D
NA
Plu
s
Cla
I/Eco
RI
a
20 kb 10 kb 7 kb 5 kb 4 kb 3 kb 2 kb 1.5 kb 1 kb
∼20 kb
Gen
eRul
er D
NA
Plu
s
pJR
His
A
Hyp
erLa
dder
I
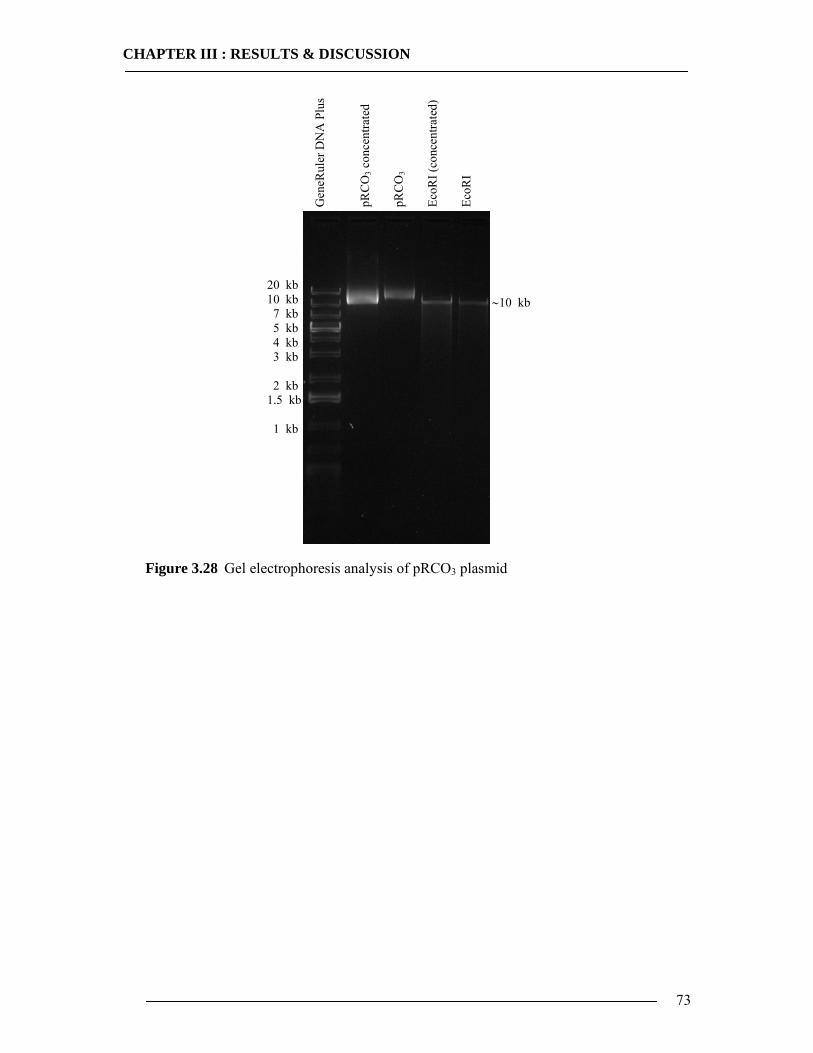
CHAPTER III : RESULTS & DISCUSSION
73
Figure 3.28 Gel electrophoresis analysis of pRCO3 plasmid
20 kb 10 kb 7 kb 5 kb 4 kb 3 kb 2 kb 1.5 kb 1 kb
∼10 kbG
eneR
uler
DN
A P
lus
pRC
O3 c
once
ntra
ted
EcoR
I (co
ncen
trate
d)
pRC
O3
EcoR
I
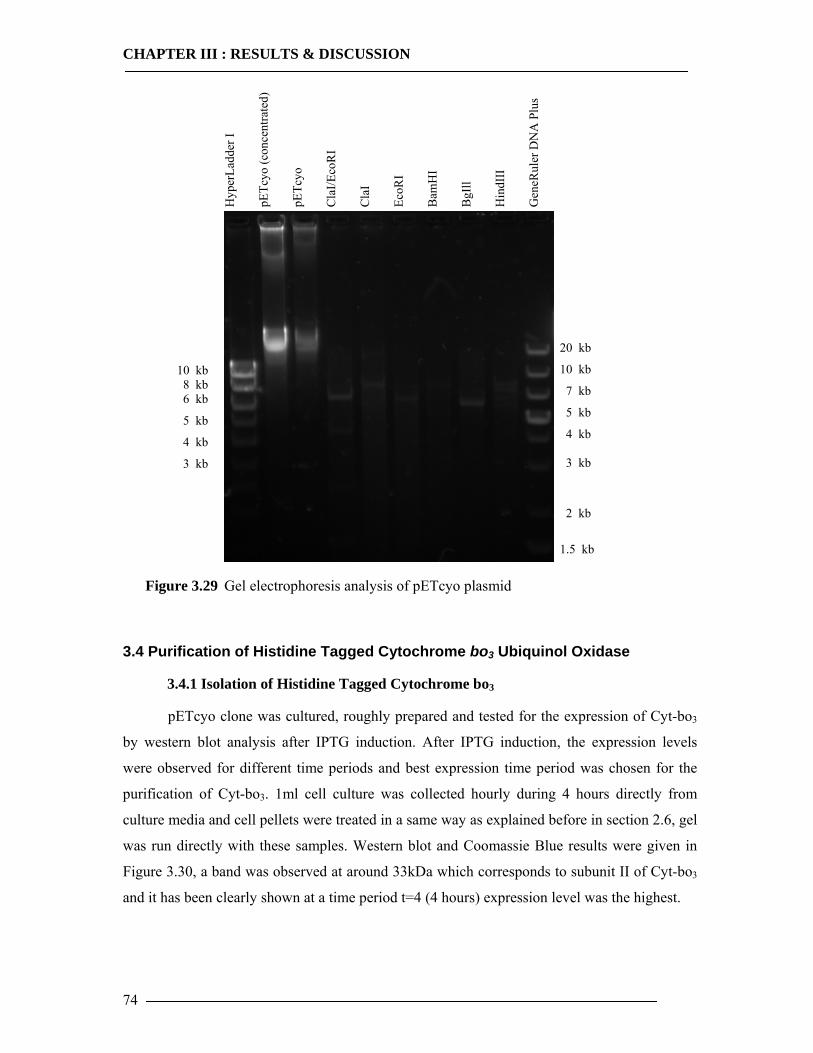
CHAPTER III : RESULTS & DISCUSSION
74
Figure 3.29 Gel electrophoresis analysis of pETcyo plasmid
3.4 Purification of Histidine Tagged Cytochrome bo3 Ubiquinol Oxidase
3.4.1 Isolation of Histidine Tagged Cytochrome bo3
pETcyo clone was cultured, roughly prepared and tested for the expression of Cyt-bo3
by western blot analysis after IPTG induction. After IPTG induction, the expression levels
were observed for different time periods and best expression time period was chosen for the
purification of Cyt-bo3. 1ml cell culture was collected hourly during 4 hours directly from
culture media and cell pellets were treated in a same way as explained before in section 2.6, gel
was run directly with these samples. Western blot and Coomassie Blue results were given in
Figure 3.30, a band was observed at around 33kDa which corresponds to subunit II of Cyt-bo3
and it has been clearly shown at a time period t=4 (4 hours) expression level was the highest.
10 kb 8 kb 6 kb
5 kb
4 kb
3 kb
Gen
eRul
er D
NA
Plu
s
Hyp
erLa
dder
I
Cla
I
pETc
yo
Cla
I/Eco
RI
pETc
yo (c
once
ntra
ted)
EcoR
I
Bam
HI
BgI
ll
Hin
dIII
20 kb
10 kb
7 kb
5 kb
4 kb 3 kb
2 kb
1.5 kb
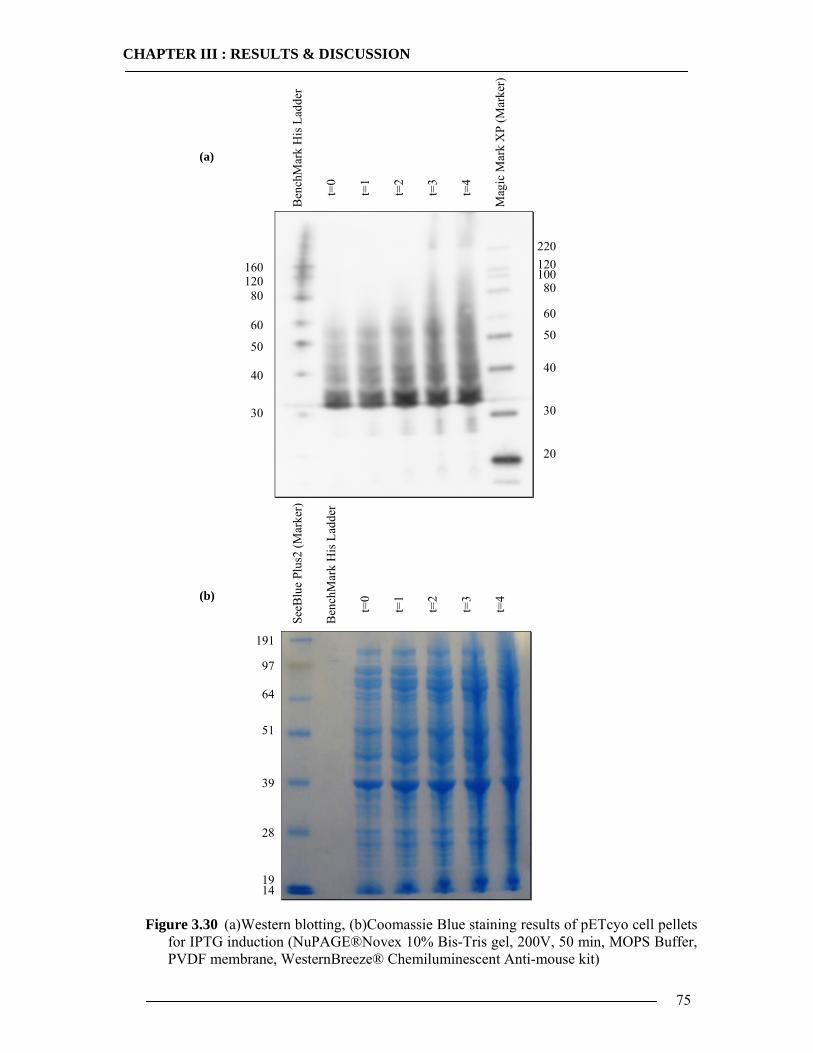
CHAPTER III : RESULTS & DISCUSSION
75
Figure 3.30 (a)Western blotting, (b)Coomassie Blue staining results of pETcyo cell pellets for IPTG induction (NuPAGE®Novex 10% Bis-Tris gel, 200V, 50 min, MOPS Buffer, PVDF membrane, WesternBreeze® Chemiluminescent Anti-mouse kit)
160 120 80 60
50
40
30
Mag
ic M
ark
XP
(Mar
ker)
t=0
Ben
chM
ark
His
Lad
der
220 120 100 80 60
50 40 30
20
t=1
t=2
t=3
t=4
(a)
SeeB
lue
Plus
2 (M
arke
r)
t=0
Ben
chM
ark
His
Lad
der
t=1
t=2
t=3
t=4
191 97 64
51 39
28
19 14
(b)
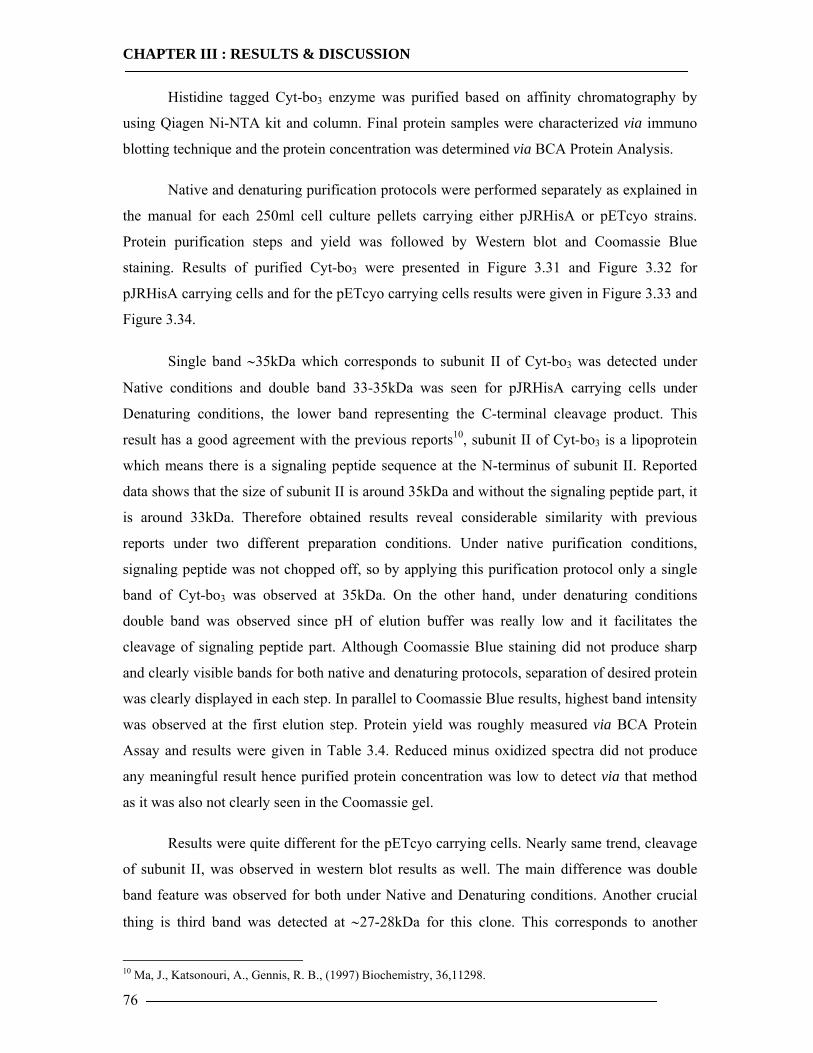
CHAPTER III : RESULTS & DISCUSSION
76
Histidine tagged Cyt-bo3 enzyme was purified based on affinity chromatography by
using Qiagen Ni-NTA kit and column. Final protein samples were characterized via immuno
blotting technique and the protein concentration was determined via BCA Protein Analysis.
Native and denaturing purification protocols were performed separately as explained in
the manual for each 250ml cell culture pellets carrying either pJRHisA or pETcyo strains.
Protein purification steps and yield was followed by Western blot and Coomassie Blue
staining. Results of purified Cyt-bo3 were presented in Figure 3.31 and Figure 3.32 for
pJRHisA carrying cells and for the pETcyo carrying cells results were given in Figure 3.33 and
Figure 3.34.
Single band ∼35kDa which corresponds to subunit II of Cyt-bo3 was detected under
Native conditions and double band 33-35kDa was seen for pJRHisA carrying cells under
Denaturing conditions, the lower band representing the C-terminal cleavage product. This
result has a good agreement with the previous reports10, subunit II of Cyt-bo3 is a lipoprotein
which means there is a signaling peptide sequence at the N-terminus of subunit II. Reported
data shows that the size of subunit II is around 35kDa and without the signaling peptide part, it
is around 33kDa. Therefore obtained results reveal considerable similarity with previous
reports under two different preparation conditions. Under native purification conditions,
signaling peptide was not chopped off, so by applying this purification protocol only a single
band of Cyt-bo3 was observed at 35kDa. On the other hand, under denaturing conditions
double band was observed since pH of elution buffer was really low and it facilitates the
cleavage of signaling peptide part. Although Coomassie Blue staining did not produce sharp
and clearly visible bands for both native and denaturing protocols, separation of desired protein
was clearly displayed in each step. In parallel to Coomassie Blue results, highest band intensity
was observed at the first elution step. Protein yield was roughly measured via BCA Protein
Assay and results were given in Table 3.4. Reduced minus oxidized spectra did not produce
any meaningful result hence purified protein concentration was low to detect via that method
as it was also not clearly seen in the Coomassie gel.
Results were quite different for the pETcyo carrying cells. Nearly same trend, cleavage
of subunit II, was observed in western blot results as well. The main difference was double
band feature was observed for both under Native and Denaturing conditions. Another crucial
thing is third band was detected at ∼27-28kDa for this clone. This corresponds to another
10 Ma, J., Katsonouri, A., Gennis, R. B., (1997) Biochemistry, 36,11298.
CHAPTER III : RESULTS & DISCUSSION
77
cleavage of N-terminus after cleavage of signaling peptide and chopped sequence assumed to
be the outer part of the membrane protein depending on heavy proteolysis during purification
treatments. Removal of signaling peptide part was speculated as a post-translational
modification rather than proteolytic digestion so it was also known that this process does not
affect the functionality of enzyme. But in this case this fraction of the purified enzyme might
not show proper enzyme activity.
Again separation of the enzyme from the cell mixture was clearly displayed and highest
intensity was observed for the first elution step. Although IPTG induction enhances the
expression of protein thus resulting protein concentration of pETcyo clone was higher than
pJRHisA clone, still yield was quite low for the Coomassie Blue detection and reduced minus
oxidized spectra. Hence BCA protein assay was used to determine the yield of purified protein
samples as well. Results were presented in Table 3.4.
Table 3.4 Cyt-bo3 concentrations, determined via BCA Assay
Sample Culture volume (ml)
Concentration (µg/µl)
pJRHisA/Native 250 1103 (±30)
pJRHisA/Denaturing 250 147 (±10)
pETcyo/Native 250 1600 (±30)
pETcyo/Denaturing 250 1840 (±40)
Ni-NTA affinity chromatography was inadequate method for the purification of pRCO3
carrying cells because of the fact that this clone of Cyt-bo3 does not have an affinity tag. So in
this case purification11 and detection12 of the protein is quite difficult and even impossible.
Meaningful results could not be obtained from pRCO3 clone for the in-vivo expression and
purification of Cyt-bo3.
11 Lemieux, L. J., Calhoun, M. W., Thomas, J. W., Ingledew, W. J., Gennis, R. B., (1992) The Journal of Biological Chemistry, 267, 3, 2105. 12 Ma, J., Lemieux, L., Gennis, R. B., (1993) Biochemistry, 32, 7692.
CHAPTER III : RESULTS & DISCUSSION
78
Figure 3.31 (a)Western blotting, (b)Coomassie Blue staining results of pJRHisA under Native purification conditions (NuPAGE®Novex 10% Bis-Tris gel, 200V, 35min, MES Buffer, PVDF membrane, WesternBreeze® Chemiluminescent Anti-mouse kit)
198
98
62
49 38 28 17 6
50
40
30
20
100 75 50
30
15
Mag
ic M
ark
XP
(Mar
ker)
SeeB
lue
Plus
2 (M
arke
r)
Was
h Fr
actio
n 1
Posi
tive
Con
trol
Cel
l Lys
ate
6xH
is P
rote
in L
adde
r
Was
h Fr
actio
n 2
Elut
ion
Frac
tion
1
Elut
ion
Frac
tion
2
Elut
ion
Frac
tion
3
220 120 100 80 60 50 40
30 20
(b)
(a)
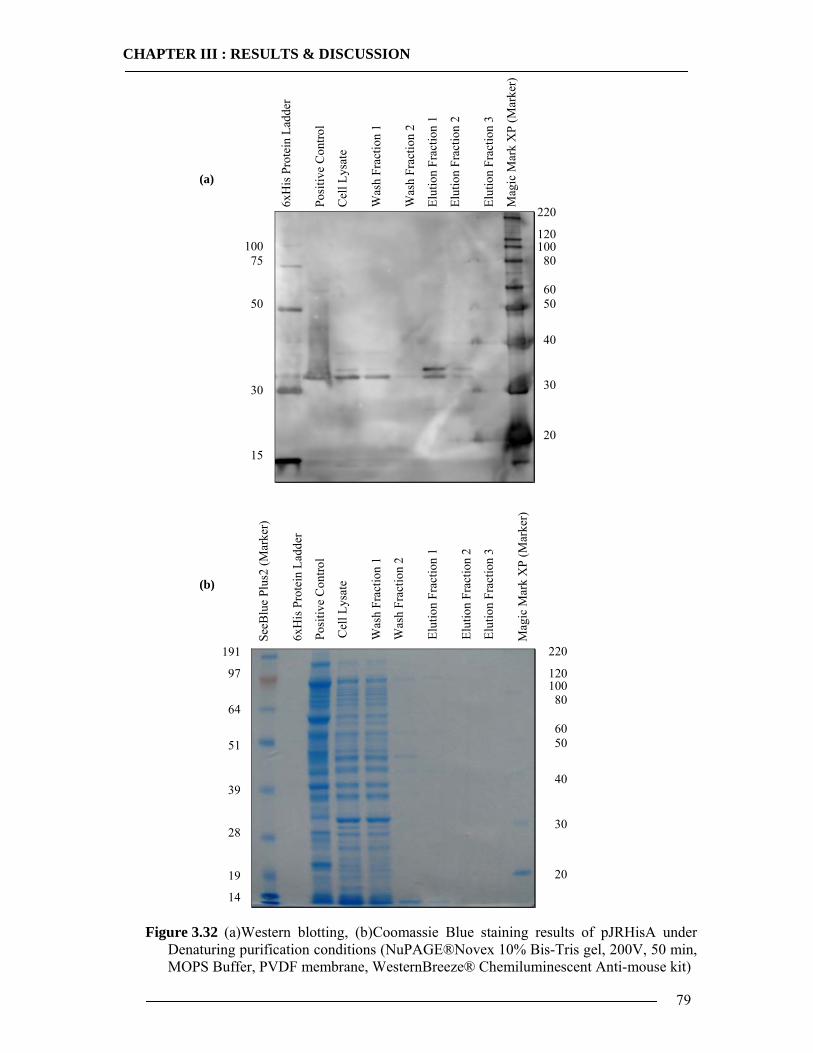
CHAPTER III : RESULTS & DISCUSSION
79
Figure 3.32 (a)Western blotting, (b)Coomassie Blue staining results of pJRHisA under Denaturing purification conditions (NuPAGE®Novex 10% Bis-Tris gel, 200V, 50 min, MOPS Buffer, PVDF membrane, WesternBreeze® Chemiluminescent Anti-mouse kit)
100 75 50
30
15
Mag
ic M
ark
XP
(Mar
ker)
Was
h Fr
actio
n 1
Posi
tive
Con
trol
Cel
l Lys
ate
6xH
is P
rote
in L
adde
r
Was
h Fr
actio
n 2
Elut
ion
Frac
tion
1
Elut
ion
Frac
tion
2
Elut
ion
Frac
tion
3
220 120 100 80 60 50
40 30
20
SeeB
lue
Plus
2 (M
arke
r)
191
97
64
51
39 28 19
14
Mag
ic M
ark
XP
(Mar
ker)
Was
h Fr
actio
n 1
Posi
tive
Con
trol
Cel
l Lys
ate
6xH
is P
rote
in L
adde
r
Was
h Fr
actio
n 2
Elut
ion
Frac
tion
1
Elut
ion
Frac
tion
2
Elut
ion
Frac
tion
3
220 120 100 80 60 50
40 30
20
(b)
(a)
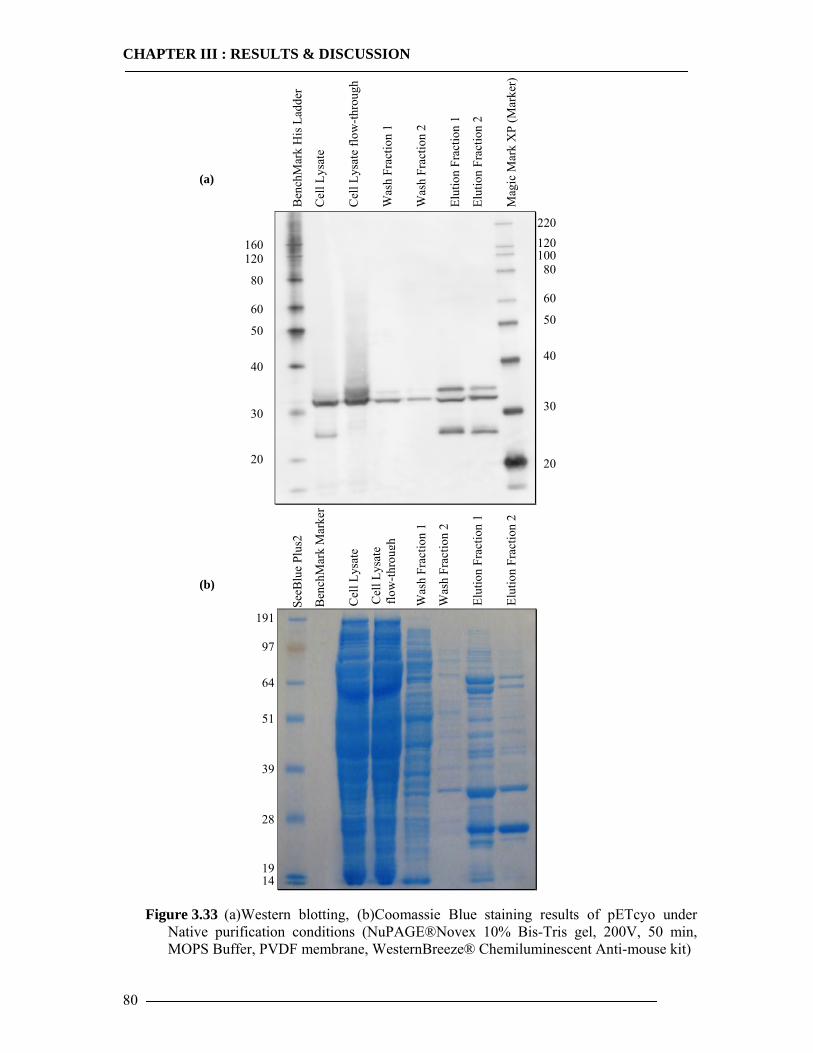
CHAPTER III : RESULTS & DISCUSSION
80
Figure 3.33 (a)Western blotting, (b)Coomassie Blue staining results of pETcyo under Native purification conditions (NuPAGE®Novex 10% Bis-Tris gel, 200V, 50 min, MOPS Buffer, PVDF membrane, WesternBreeze® Chemiluminescent Anti-mouse kit)
160 120
80
60
50
40 30 20
Mag
ic M
ark
XP
(Mar
ker)
Was
h Fr
actio
n 1
Cel
l Lys
ate
flow
-thro
ugh
Cel
l Lys
ate
Ben
chM
ark
His
Lad
der
Was
h Fr
actio
n 2
Elut
ion
Frac
tion
1
Elut
ion
Frac
tion
2
220 120 100 80 60
50
40
30
20
SeeB
lue
Plus
2
191
97
64
51
39
28
19 14
Was
h Fr
actio
n 1
Cel
l Lys
ate
Cel
l Lys
ate
flow
-thro
u gh
Ben
chM
ark
Mar
ker
Was
h Fr
actio
n 2
Elut
ion
Frac
tion
1
Elut
ion
Frac
tion
2
(b)
(a)
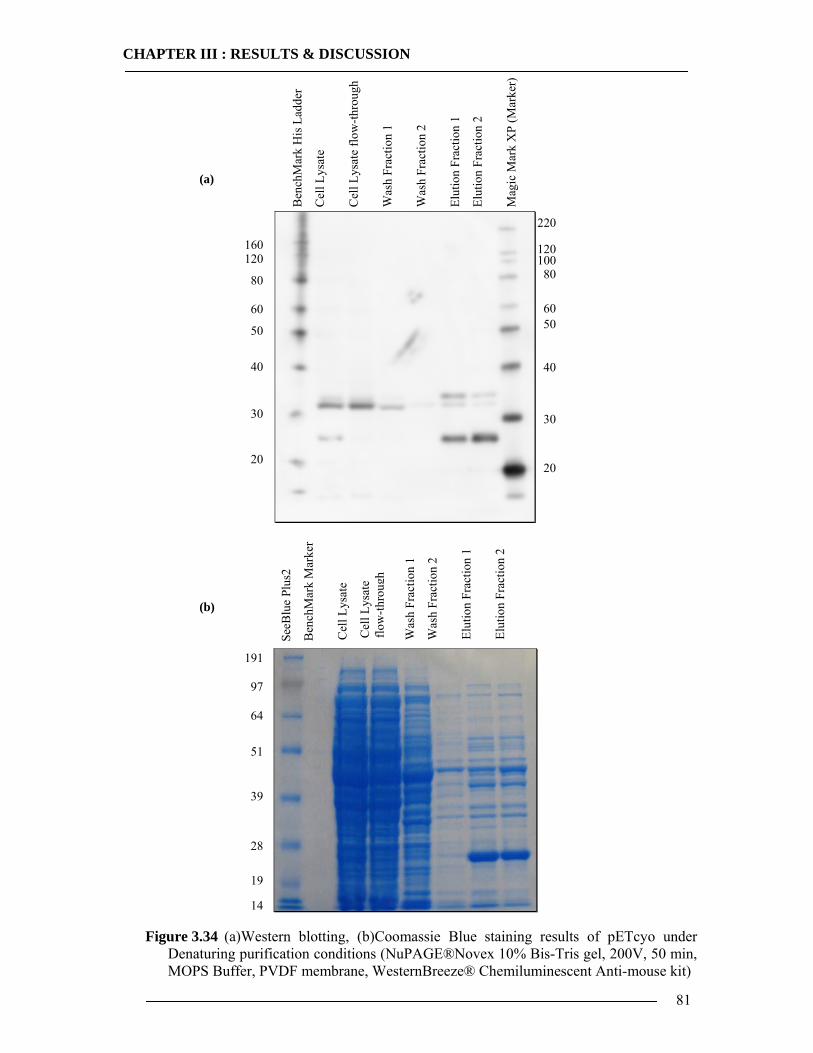
CHAPTER III : RESULTS & DISCUSSION
81
Figure 3.34 (a)Western blotting, (b)Coomassie Blue staining results of pETcyo under Denaturing purification conditions (NuPAGE®Novex 10% Bis-Tris gel, 200V, 50 min, MOPS Buffer, PVDF membrane, WesternBreeze® Chemiluminescent Anti-mouse kit)
160 120
80
60
50
40 30 20
Mag
ic M
ark
XP
(Mar
ker)
Was
h Fr
actio
n 1
Cel
l Lys
ate
flow
-thro
ugh
Cel
l Lys
ate
Ben
chM
ark
His
Lad
der
Was
h Fr
actio
n 2
Elut
ion
Frac
tion
1
Elut
ion
Frac
tion
2
220
120 100 80 60 50
40
30 20
SeeB
lue
Plus
2
191
97
64
51
39
28
19 14
Was
h Fr
actio
n 1
Cel
l Lys
ate
Cel
l Lys
ate
flow
-thro
u gh
Ben
chM
ark
Mar
ker
Was
h Fr
actio
n 2
Elut
ion
Frac
tion
1
Elut
ion
Frac
tion
2
(b)
(a)
CHAPTER III : RESULTS & DISCUSSION
82
3.4.2 Preparation of Cytoplasmic Membranes
In-vivo expressed Cyt-bo3 samples were used just as a positive control to be compared
with in-vitro samples, by this comparison, quality and the function of Cyt-bo3 was determined.
All of the results presented in this part were obtained on a cytoplasmic membrane state without
affinity purification.
The protocol for cytoplasmic membrane preparation was described previously in
section 2.4.2. Cytoplasmic membranes of Cyt-bo3 enzyme were purified roughly and purified
enzyme was characterized by western blot and the yield was determined via reduced minus
oxidized spectroscopy instead of BCA protein assay. The spectra was taken with high
concentrations of Cyt-bo3, for this reason either 6L cell culture of pJRHisA clone or 2L cell
culture of pETcyo clone was used separately for the protein purification. Reduced minus
oxidized spectra results will be presented separately in the following sections.
Immuno blotting results of membrane samples for each pJRHisA and pETcyo clones
are given in Figure 3.35 and Figure 3.36 respectively. Results clearly demonstrate and confirm
the expression of Cyt-bo3 for each clone. This time, ∼35kDa single band was observed for
pJRHisA clone which shows there is no degradation or cleavage product after purification.
Among the four purification steps, it is clearly demonstrated that enzyme was not lost during
purification process.
Western blot analysis of pETcyo clone shows a little cleavage product (Figure 3.36,
lane 2), nevertheless the biggest proportion still represent the uncleaved product. Concerning to
purification steps, significant loss of enzyme was not observed at each step. The most obvious
difference than the other results is complete separation of degradation product from the
uncleaved and “good” enzyme was observed after wash step. Only single band was obtained
from final solubilized enzyme solution and the band coming from the degradation product
∼28kDa was disappeared. So after concentration of this sample via concentration tube, enzyme
activity and spetrophotometric measurements were done by using this enzyme.
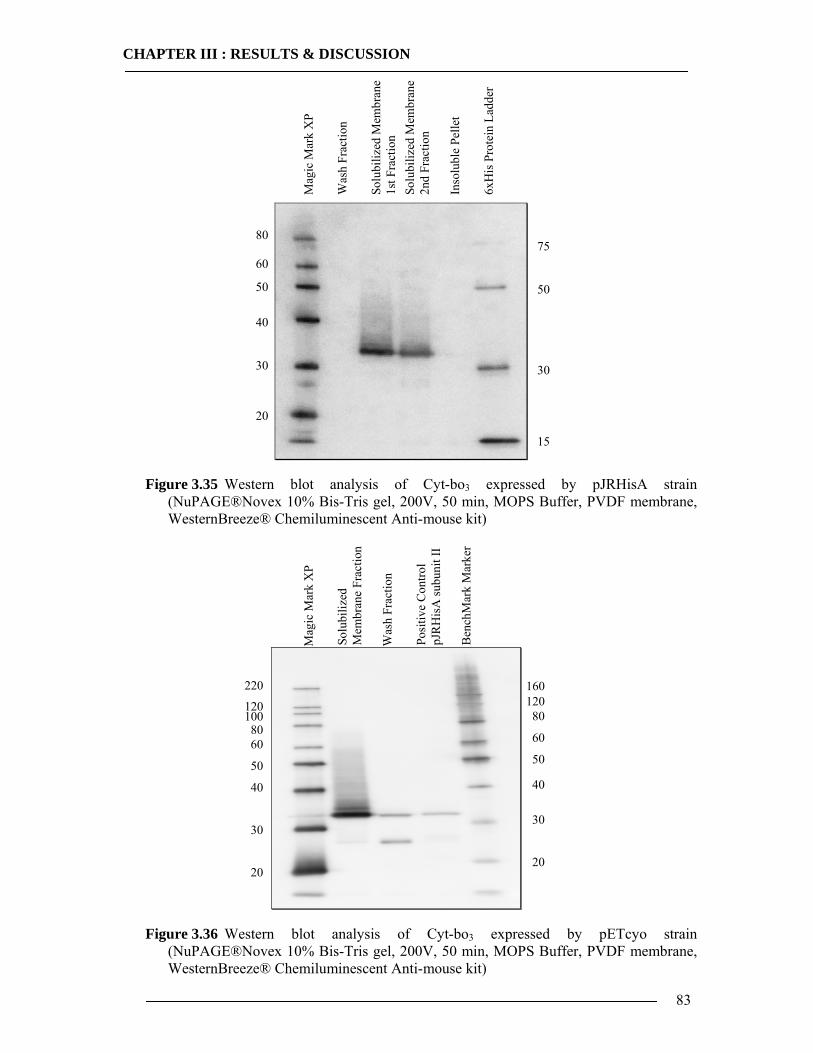
CHAPTER III : RESULTS & DISCUSSION
83
Figure 3.35 Western blot analysis of Cyt-bo3 expressed by pJRHisA strain (NuPAGE®Novex 10% Bis-Tris gel, 200V, 50 min, MOPS Buffer, PVDF membrane, WesternBreeze® Chemiluminescent Anti-mouse kit)
Figure 3.36 Western blot analysis of Cyt-bo3 expressed by pETcyo strain (NuPAGE®Novex 10% Bis-Tris gel, 200V, 50 min, MOPS Buffer, PVDF membrane, WesternBreeze® Chemiluminescent Anti-mouse kit)
75 50 30 15
Mag
ic M
ark
XP
Was
h Fr
actio
n
6xH
is P
rote
in L
adde
r
Solu
biliz
ed M
embr
ane
1st F
ract
ion
80 60 50
40
30
20
Inso
lubl
e Pe
llet
Solu
biliz
ed M
embr
ane
2nd
Frac
tion
Mag
ic M
ark
XP
Was
h Fr
actio
n
Ben
chM
ark
Mar
ker
Solu
biliz
ed
Mem
bran
e Fr
actio
n
220 120 100 80 60
50
40
30 20
Posi
tive
Con
trol
pJR
His
A su
buni
t II
160 120 80
60
50 40 30 20
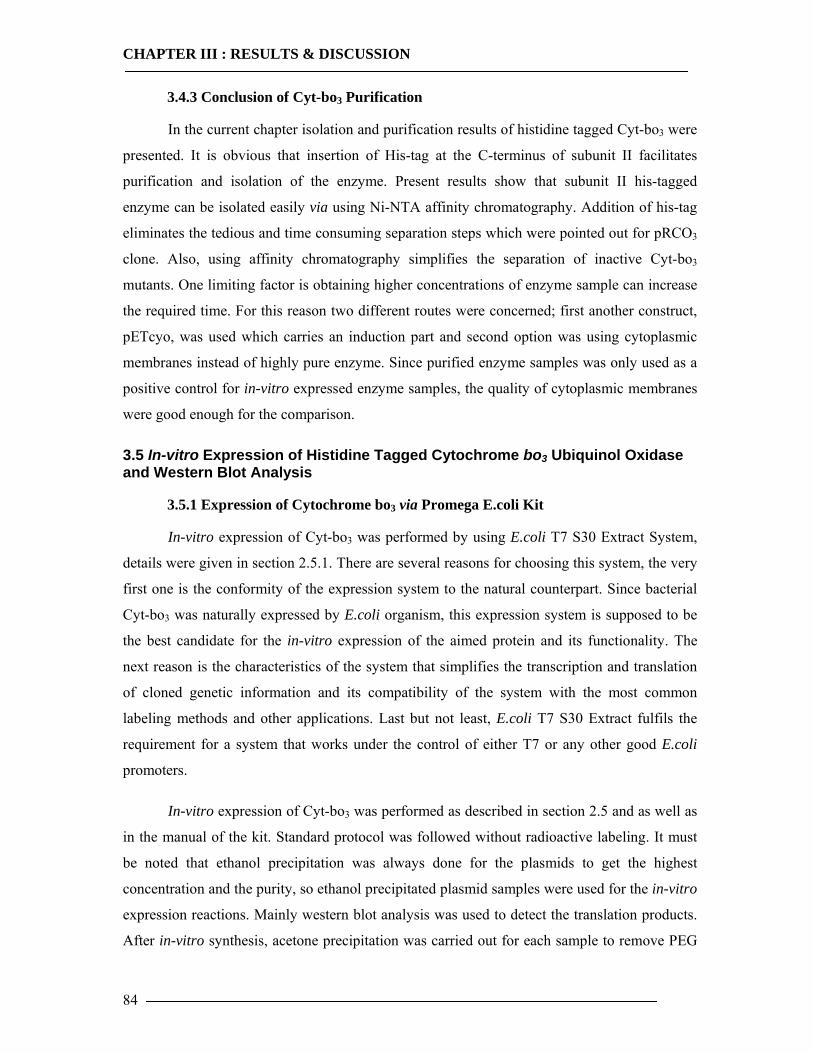
CHAPTER III : RESULTS & DISCUSSION
84
3.4.3 Conclusion of Cyt-bo3 Purification
In the current chapter isolation and purification results of histidine tagged Cyt-bo3 were
presented. It is obvious that insertion of His-tag at the C-terminus of subunit II facilitates
purification and isolation of the enzyme. Present results show that subunit II his-tagged
enzyme can be isolated easily via using Ni-NTA affinity chromatography. Addition of his-tag
eliminates the tedious and time consuming separation steps which were pointed out for pRCO3
clone. Also, using affinity chromatography simplifies the separation of inactive Cyt-bo3
mutants. One limiting factor is obtaining higher concentrations of enzyme sample can increase
the required time. For this reason two different routes were concerned; first another construct,
pETcyo, was used which carries an induction part and second option was using cytoplasmic
membranes instead of highly pure enzyme. Since purified enzyme samples was only used as a
positive control for in-vitro expressed enzyme samples, the quality of cytoplasmic membranes
were good enough for the comparison.
3.5 In-vitro Expression of Histidine Tagged Cytochrome bo3 Ubiquinol Oxidase and Western Blot Analysis
3.5.1 Expression of Cytochrome bo3 via Promega E.coli Kit
In-vitro expression of Cyt-bo3 was performed by using E.coli T7 S30 Extract System,
details were given in section 2.5.1. There are several reasons for choosing this system, the very
first one is the conformity of the expression system to the natural counterpart. Since bacterial
Cyt-bo3 was naturally expressed by E.coli organism, this expression system is supposed to be
the best candidate for the in-vitro expression of the aimed protein and its functionality. The
next reason is the characteristics of the system that simplifies the transcription and translation
of cloned genetic information and its compatibility of the system with the most common
labeling methods and other applications. Last but not least, E.coli T7 S30 Extract fulfils the
requirement for a system that works under the control of either T7 or any other good E.coli
promoters.
In-vitro expression of Cyt-bo3 was performed as described in section 2.5 and as well as
in the manual of the kit. Standard protocol was followed without radioactive labeling. It must
be noted that ethanol precipitation was always done for the plasmids to get the highest
concentration and the purity, so ethanol precipitated plasmid samples were used for the in-vitro
expression reactions. Mainly western blot analysis was used to detect the translation products.
After in-vitro synthesis, acetone precipitation was carried out for each sample to remove PEG
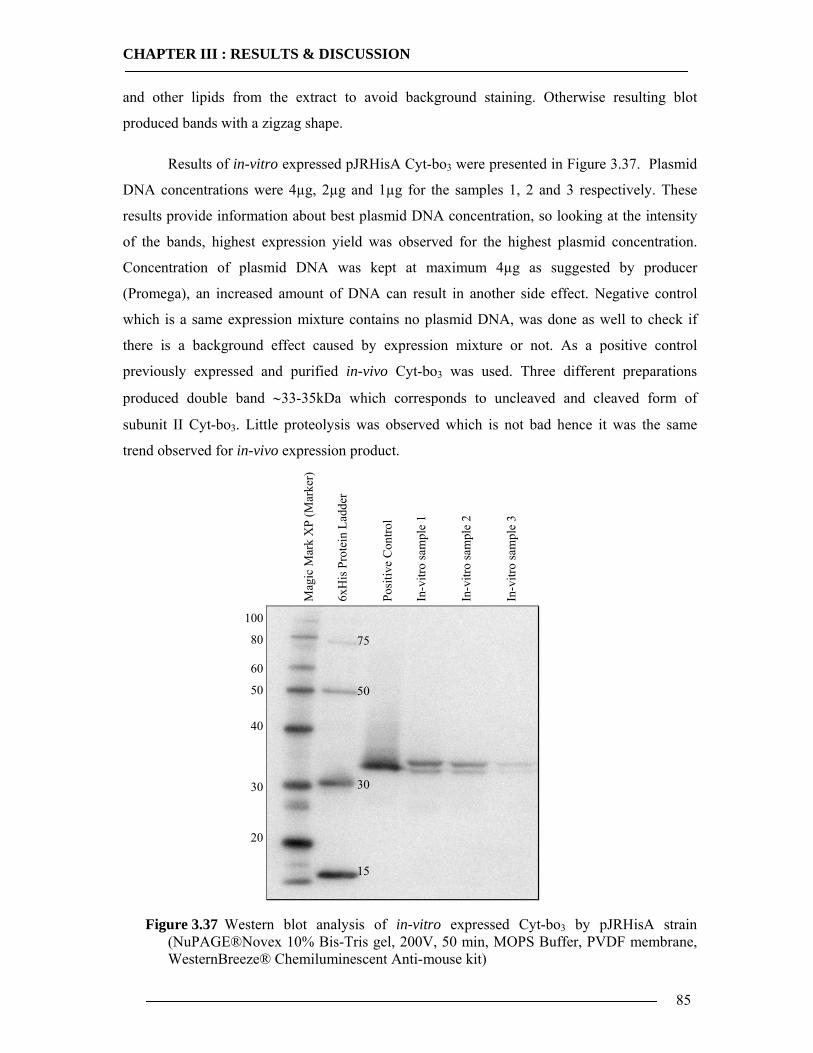
CHAPTER III : RESULTS & DISCUSSION
85
and other lipids from the extract to avoid background staining. Otherwise resulting blot
produced bands with a zigzag shape.
Results of in-vitro expressed pJRHisA Cyt-bo3 were presented in Figure 3.37. Plasmid
DNA concentrations were 4µg, 2µg and 1µg for the samples 1, 2 and 3 respectively. These
results provide information about best plasmid DNA concentration, so looking at the intensity
of the bands, highest expression yield was observed for the highest plasmid concentration.
Concentration of plasmid DNA was kept at maximum 4µg as suggested by producer
(Promega), an increased amount of DNA can result in another side effect. Negative control
which is a same expression mixture contains no plasmid DNA, was done as well to check if
there is a background effect caused by expression mixture or not. As a positive control
previously expressed and purified in-vivo Cyt-bo3 was used. Three different preparations
produced double band ∼33-35kDa which corresponds to uncleaved and cleaved form of
subunit II Cyt-bo3. Little proteolysis was observed which is not bad hence it was the same
trend observed for in-vivo expression product.
Figure 3.37 Western blot analysis of in-vitro expressed Cyt-bo3 by pJRHisA strain (NuPAGE®Novex 10% Bis-Tris gel, 200V, 50 min, MOPS Buffer, PVDF membrane, WesternBreeze® Chemiluminescent Anti-mouse kit)
75
50
30
15
Mag
ic M
ark
XP
(Mar
ker)
Posi
tive
Con
trol
6xH
is P
rote
in L
adde
r
In-v
itro
sam
ple
1
100
80
60
50
40
30
20
In-v
itro
sam
ple
2
In-v
itro
sam
ple
3
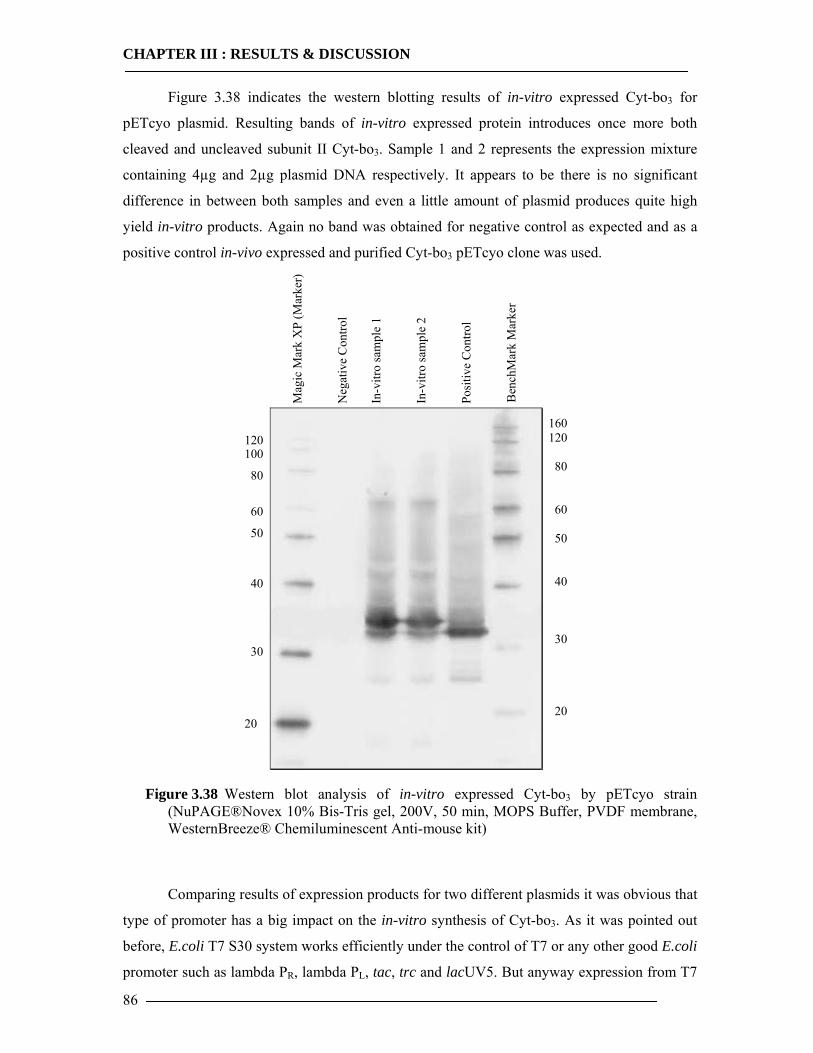
CHAPTER III : RESULTS & DISCUSSION
86
Figure 3.38 indicates the western blotting results of in-vitro expressed Cyt-bo3 for
pETcyo plasmid. Resulting bands of in-vitro expressed protein introduces once more both
cleaved and uncleaved subunit II Cyt-bo3. Sample 1 and 2 represents the expression mixture
containing 4µg and 2µg plasmid DNA respectively. It appears to be there is no significant
difference in between both samples and even a little amount of plasmid produces quite high
yield in-vitro products. Again no band was obtained for negative control as expected and as a
positive control in-vivo expressed and purified Cyt-bo3 pETcyo clone was used.
Figure 3.38 Western blot analysis of in-vitro expressed Cyt-bo3 by pETcyo strain (NuPAGE®Novex 10% Bis-Tris gel, 200V, 50 min, MOPS Buffer, PVDF membrane, WesternBreeze® Chemiluminescent Anti-mouse kit)
Comparing results of expression products for two different plasmids it was obvious that
type of promoter has a big impact on the in-vitro synthesis of Cyt-bo3. As it was pointed out
before, E.coli T7 S30 system works efficiently under the control of T7 or any other good E.coli
promoter such as lambda PR, lambda PL, tac, trc and lacUV5. But anyway expression from T7
Mag
ic M
ark
XP
(Mar
ker)
Posi
tive
Con
trol
In-v
itro
sam
ple
1
120 100
80
60
50
40
30 20
In-v
itro
sam
ple
2
Neg
ativ
e C
ontro
l
Ben
chM
ark
Mar
ker
160 120 80
60
50 40 30 20
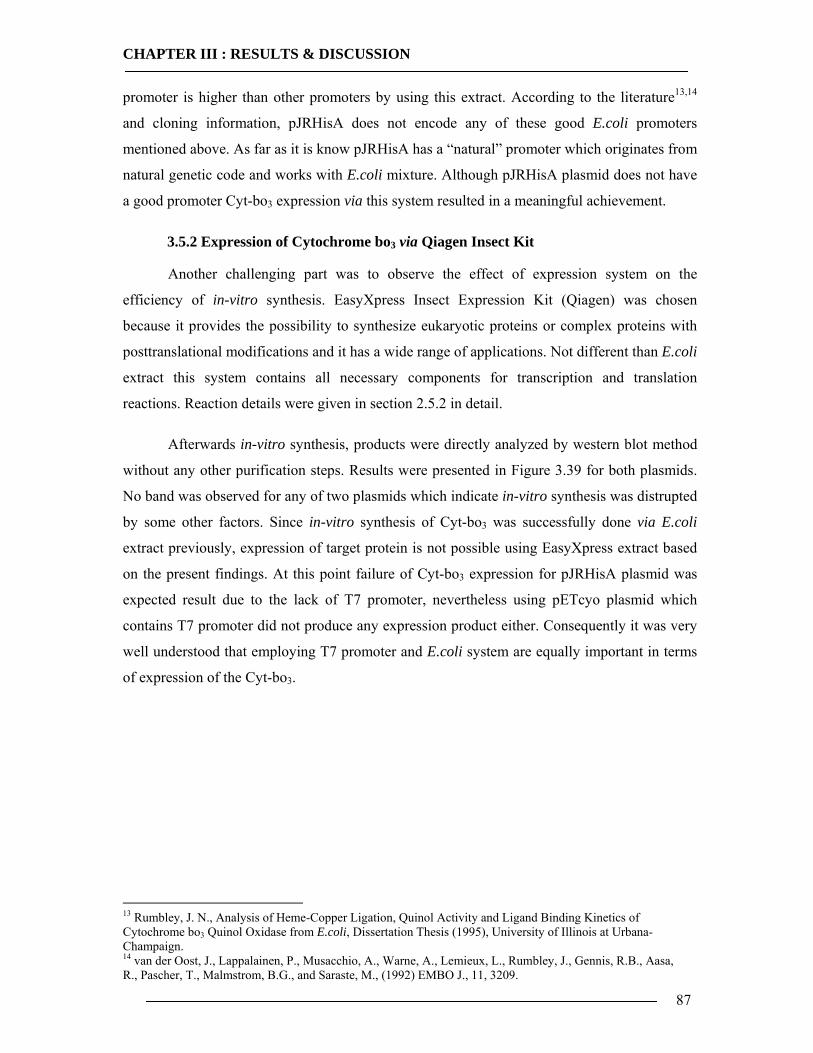
CHAPTER III : RESULTS & DISCUSSION
87
promoter is higher than other promoters by using this extract. According to the literature13,14
and cloning information, pJRHisA does not encode any of these good E.coli promoters
mentioned above. As far as it is know pJRHisA has a “natural” promoter which originates from
natural genetic code and works with E.coli mixture. Although pJRHisA plasmid does not have
a good promoter Cyt-bo3 expression via this system resulted in a meaningful achievement.
3.5.2 Expression of Cytochrome bo3 via Qiagen Insect Kit
Another challenging part was to observe the effect of expression system on the
efficiency of in-vitro synthesis. EasyXpress Insect Expression Kit (Qiagen) was chosen
because it provides the possibility to synthesize eukaryotic proteins or complex proteins with
posttranslational modifications and it has a wide range of applications. Not different than E.coli
extract this system contains all necessary components for transcription and translation
reactions. Reaction details were given in section 2.5.2 in detail.
Afterwards in-vitro synthesis, products were directly analyzed by western blot method
without any other purification steps. Results were presented in Figure 3.39 for both plasmids.
No band was observed for any of two plasmids which indicate in-vitro synthesis was distrupted
by some other factors. Since in-vitro synthesis of Cyt-bo3 was successfully done via E.coli
extract previously, expression of target protein is not possible using EasyXpress extract based
on the present findings. At this point failure of Cyt-bo3 expression for pJRHisA plasmid was
expected result due to the lack of T7 promoter, nevertheless using pETcyo plasmid which
contains T7 promoter did not produce any expression product either. Consequently it was very
well understood that employing T7 promoter and E.coli system are equally important in terms
of expression of the Cyt-bo3.
13 Rumbley, J. N., Analysis of Heme-Copper Ligation, Quinol Activity and Ligand Binding Kinetics of Cytochrome bo3 Quinol Oxidase from E.coli, Dissertation Thesis (1995), University of Illinois at Urbana-Champaign. 14 van der Oost, J., Lappalainen, P., Musacchio, A., Warne, A., Lemieux, L., Rumbley, J., Gennis, R.B., Aasa, R., Pascher, T., Malmstrom, B.G., and Saraste, M., (1992) EMBO J., 11, 3209.

CHAPTER III : RESULTS & DISCUSSION
88
Figure 3.39 Western blot analysis of in-vitro expressed Cyt-bo3 by using Insect Kit for pJRHisA(lane3) and pETcyo(lane4) strain (NuPAGE®Novex 10% Bis-Tris gel, 200V, 50 min, MOPS Buffer, PVDF membrane, WesternBreeze® Chemiluminescent Anti-mouse kit)
3.5.3 Expression and Characterization of Non-Histidine Tagged Cytochrome bo3 via BODIPY-FL Labelling
Based on the previous discussions, absence of affinity tag is the most important feature
of pRCO3 plasmid. FluoroTectTM GreenLys in-vitro Translation Labeling System enables the
fluorescent labeling of in-vitro products by using modified lysine transfer RNA which is
labeled with the fluorophore BODIPY-FL (Figure 3.40). Labelled lysine residues are integrated
into the final in-vitro product during translation step. This system offers several advantages
such as; fast detection, convenient results based on SDS-gel, non-radioactive labeling, high
sensitivity and compatibility with either eukaryotic or prokaryotic in-vitro expression systems.
Mag
ic M
ark
XP
(Mar
ker)
Posi
tive
Con
trol
pJR
His
A p
lasm
id
120100 80 60
50
40 30 20
pETc
yo p
lasm
id
Neg
ativ
e C
ontro
l
Ben
chM
ark
Mar
ker
160 120 80 60
50
40 30 20
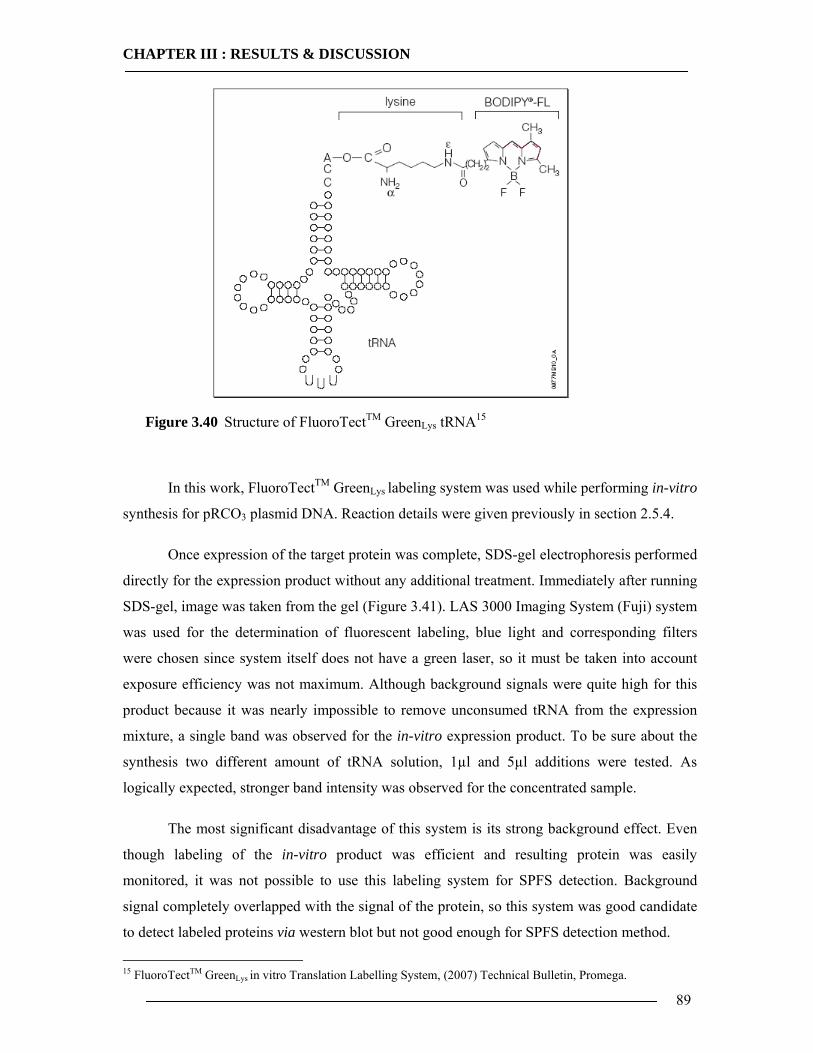
CHAPTER III : RESULTS & DISCUSSION
89
Figure 3.40 Structure of FluoroTectTM GreenLys tRNA15
In this work, FluoroTectTM GreenLys labeling system was used while performing in-vitro
synthesis for pRCO3 plasmid DNA. Reaction details were given previously in section 2.5.4.
Once expression of the target protein was complete, SDS-gel electrophoresis performed
directly for the expression product without any additional treatment. Immediately after running
SDS-gel, image was taken from the gel (Figure 3.41). LAS 3000 Imaging System (Fuji) system
was used for the determination of fluorescent labeling, blue light and corresponding filters
were chosen since system itself does not have a green laser, so it must be taken into account
exposure efficiency was not maximum. Although background signals were quite high for this
product because it was nearly impossible to remove unconsumed tRNA from the expression
mixture, a single band was observed for the in-vitro expression product. To be sure about the
synthesis two different amount of tRNA solution, 1µl and 5µl additions were tested. As
logically expected, stronger band intensity was observed for the concentrated sample.
The most significant disadvantage of this system is its strong background effect. Even
though labeling of the in-vitro product was efficient and resulting protein was easily
monitored, it was not possible to use this labeling system for SPFS detection. Background
signal completely overlapped with the signal of the protein, so this system was good candidate
to detect labeled proteins via western blot but not good enough for SPFS detection method.
15 FluoroTectTM GreenLys in vitro Translation Labelling System, (2007) Technical Bulletin, Promega.
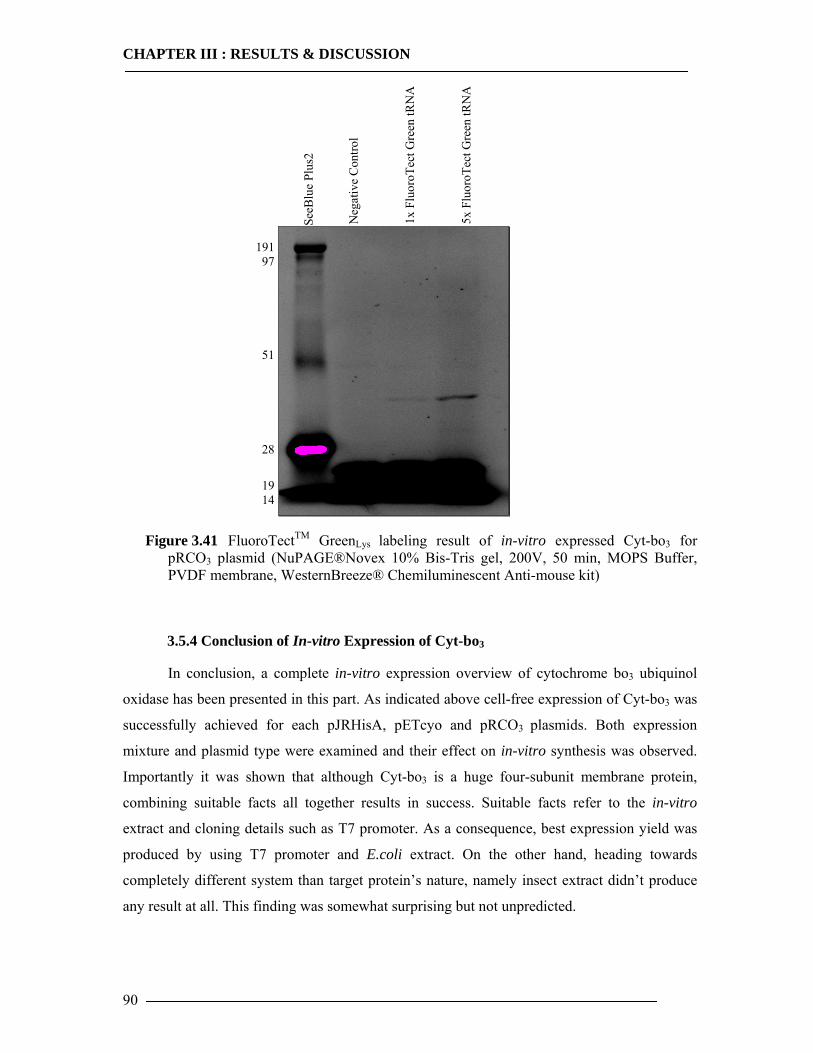
CHAPTER III : RESULTS & DISCUSSION
90
Figure 3.41 FluoroTectTM GreenLys labeling result of in-vitro expressed Cyt-bo3 for pRCO3 plasmid (NuPAGE®Novex 10% Bis-Tris gel, 200V, 50 min, MOPS Buffer, PVDF membrane, WesternBreeze® Chemiluminescent Anti-mouse kit)
3.5.4 Conclusion of In-vitro Expression of Cyt-bo3
In conclusion, a complete in-vitro expression overview of cytochrome bo3 ubiquinol
oxidase has been presented in this part. As indicated above cell-free expression of Cyt-bo3 was
successfully achieved for each pJRHisA, pETcyo and pRCO3 plasmids. Both expression
mixture and plasmid type were examined and their effect on in-vitro synthesis was observed.
Importantly it was shown that although Cyt-bo3 is a huge four-subunit membrane protein,
combining suitable facts all together results in success. Suitable facts refer to the in-vitro
extract and cloning details such as T7 promoter. As a consequence, best expression yield was
produced by using T7 promoter and E.coli extract. On the other hand, heading towards
completely different system than target protein’s nature, namely insect extract didn’t produce
any result at all. This finding was somewhat surprising but not unpredicted.
SeeB
lue
Plus
2
191 97
51
28
19 14
1x F
luor
oTec
t Gre
en tR
NA
Neg
ativ
e C
ontro
l
5x F
luor
oTec
t Gre
en tR
NA
CHAPTER III : RESULTS & DISCUSSION
91
3.6 Observation of Histidine Tagged Cytochrome bo3 Expression in Artificial Membranes by Surface Plasmon Enhanced Fluorescent Spectroscopy
For the detection of in-vitro expression products, SPFS method was chosen to enhance
the detection limit of optical sensors which is based on evanescent wave techniques such as
SPR. Fluorescence detection was done based on the presence of bound fluorophores in the
evanescent field.
Here two different approaches were followed to detect in-vitro expression of Cyt-bo3
via antibody-protein interaction. First of all “Sandwich assay” which utilizes the primary
(1°Ab) and secondary (2°Ab) antibodies were used to detect the target protein. The 1°Ab
(PentaHis Ab, Mouse monochlonal IgG, Qiagen) was directed against target protein Cyt-bo3
and labeled 2°Ab(Cy5-Conjugated Secondary Antibody, Goat-Antimouse IgG, Chemicon) was
directed against 1°Ab. As a second route, only labeled 1°Ab (PentaHis Alexa Fluor 647
Conjugate, Qiagen) was used directly against Cyt-bo3. In the following sections results will be
presented according to these approaches.
All experiments carried out in this work varies in chemicals but the following
experimental steps were used for each sample to measure absorption, desorption or binding
process on the surface.
• Background scan was measured to determine the thickness of film or other layer
and to determine the fluorescence background before sample addition.
• Kinetic run was performed until having a stable baseline to monitor the absorption
or binding process. Subsequently the system was rinsed with pure buffer to
remove unbound, excess material from the sample surface.
• Sample scan was done to determine thickness and refractive index change which
has been stated before and to measure fluorescence signal from the target
molecule. For all scan curves, background correction was performed by
subtracting corresponding background signal from each scan curve.
• All results have been obtained from at least 3-5 independent experiments and
average result was presented here.
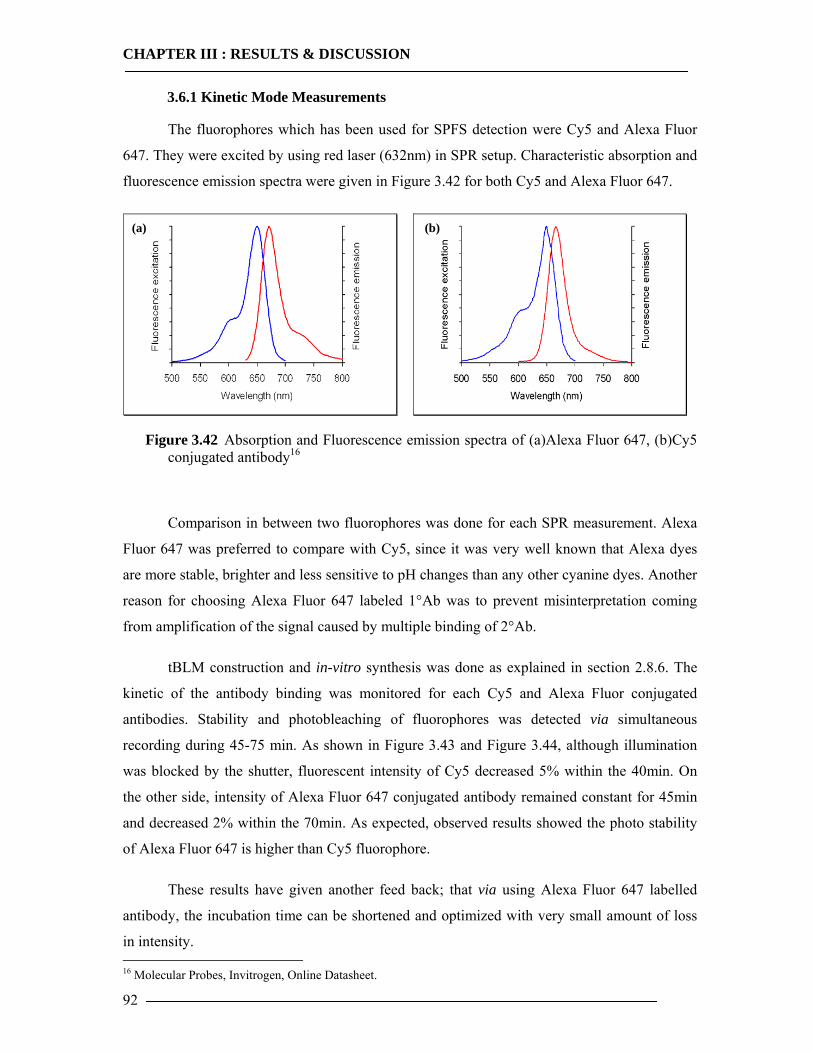
CHAPTER III : RESULTS & DISCUSSION
92
3.6.1 Kinetic Mode Measurements
The fluorophores which has been used for SPFS detection were Cy5 and Alexa Fluor
647. They were excited by using red laser (632nm) in SPR setup. Characteristic absorption and
fluorescence emission spectra were given in Figure 3.42 for both Cy5 and Alexa Fluor 647.
Figure 3.42 Absorption and Fluorescence emission spectra of (a)Alexa Fluor 647, (b)Cy5 conjugated antibody16
Comparison in between two fluorophores was done for each SPR measurement. Alexa
Fluor 647 was preferred to compare with Cy5, since it was very well known that Alexa dyes
are more stable, brighter and less sensitive to pH changes than any other cyanine dyes. Another
reason for choosing Alexa Fluor 647 labeled 1°Ab was to prevent misinterpretation coming
from amplification of the signal caused by multiple binding of 2°Ab.
tBLM construction and in-vitro synthesis was done as explained in section 2.8.6. The
kinetic of the antibody binding was monitored for each Cy5 and Alexa Fluor conjugated
antibodies. Stability and photobleaching of fluorophores was detected via simultaneous
recording during 45-75 min. As shown in Figure 3.43 and Figure 3.44, although illumination
was blocked by the shutter, fluorescent intensity of Cy5 decreased 5% within the 40min. On
the other side, intensity of Alexa Fluor 647 conjugated antibody remained constant for 45min
and decreased 2% within the 70min. As expected, observed results showed the photo stability
of Alexa Fluor 647 is higher than Cy5 fluorophore.
These results have given another feed back; that via using Alexa Fluor 647 labelled
antibody, the incubation time can be shortened and optimized with very small amount of loss
in intensity. 16 Molecular Probes, Invitrogen, Online Datasheet.
(b) (a)
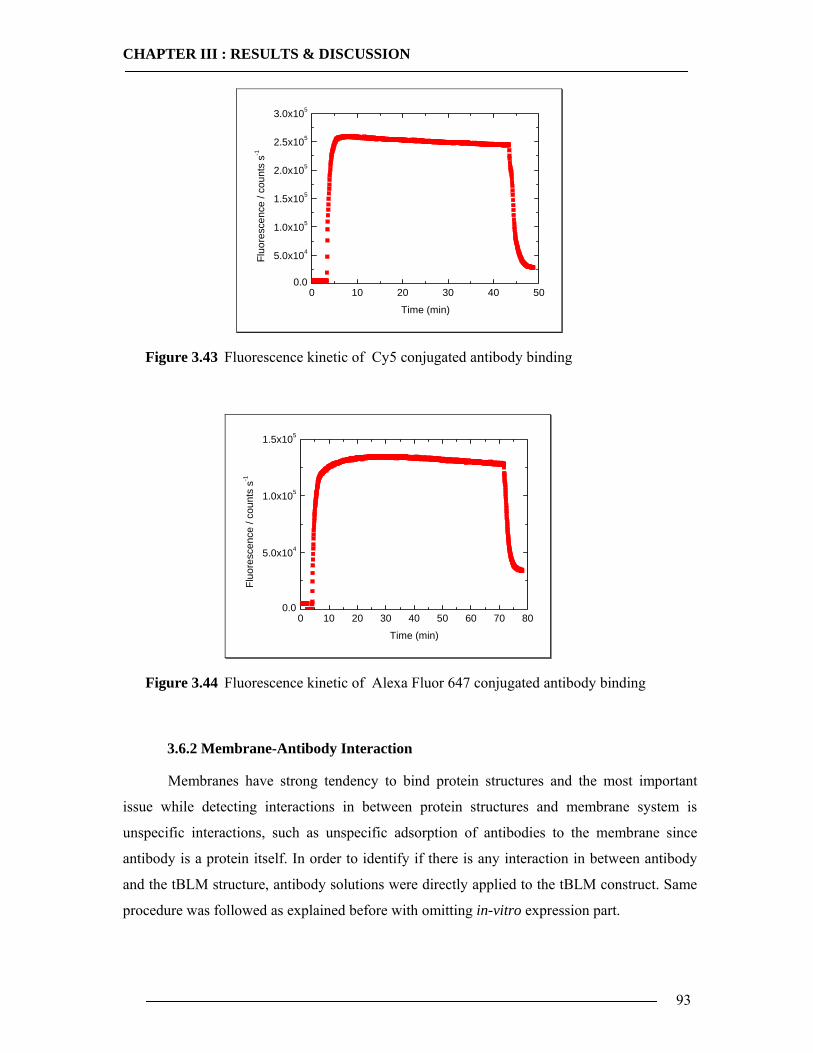
CHAPTER III : RESULTS & DISCUSSION
93
0 10 20 30 40 500.0
5.0x10⁴
1.0x10⁵
1.5x10⁵
2.0x10⁵
2.5x10⁵
3.0x10⁵
Fluo
resc
ence
/ co
unts
s-1
Time (min)
Figure 3.43 Fluorescence kinetic of Cy5 conjugated antibody binding
0 10 20 30 40 50 60 70 800.0
5.0x10⁴
1.0x10⁵
1.5x10⁵
Fluo
resc
ence
/ co
unts
s-1
Time (min)
Figure 3.44 Fluorescence kinetic of Alexa Fluor 647 conjugated antibody binding
3.6.2 Membrane-Antibody Interaction
Membranes have strong tendency to bind protein structures and the most important
issue while detecting interactions in between protein structures and membrane system is
unspecific interactions, such as unspecific adsorption of antibodies to the membrane since
antibody is a protein itself. In order to identify if there is any interaction in between antibody
and the tBLM structure, antibody solutions were directly applied to the tBLM construct. Same
procedure was followed as explained before with omitting in-vitro expression part.
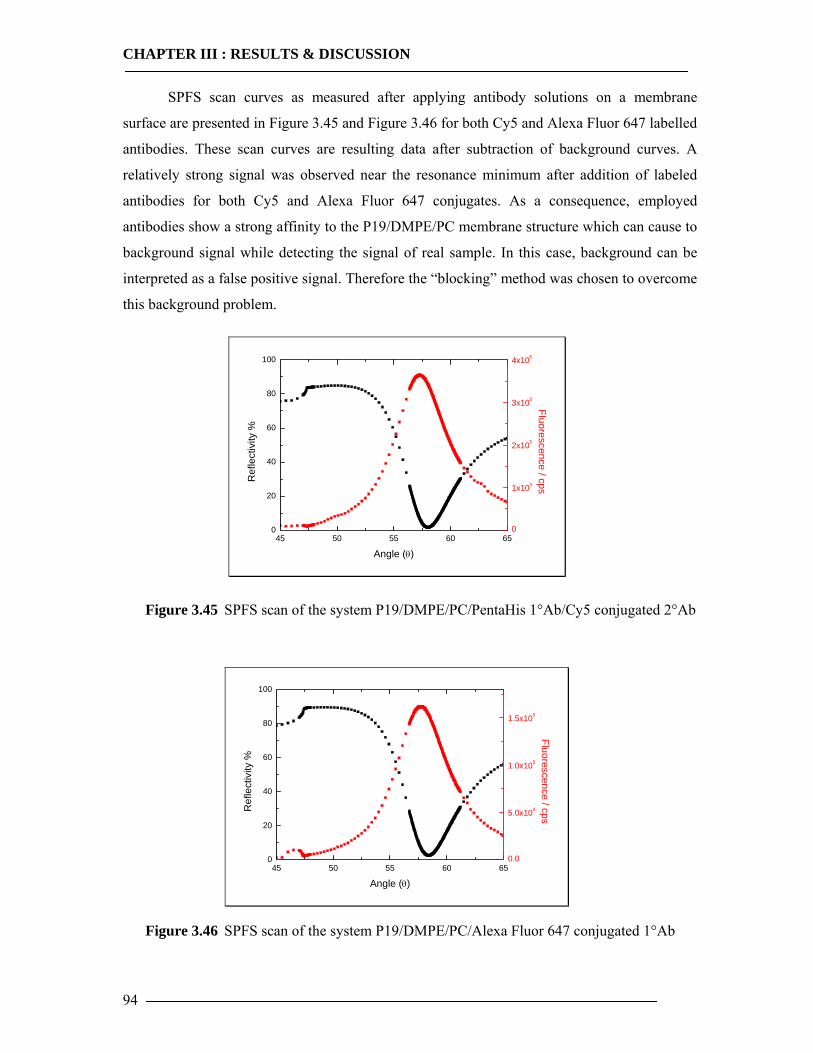
CHAPTER III : RESULTS & DISCUSSION
94
SPFS scan curves as measured after applying antibody solutions on a membrane
surface are presented in Figure 3.45 and Figure 3.46 for both Cy5 and Alexa Fluor 647 labelled
antibodies. These scan curves are resulting data after subtraction of background curves. A
relatively strong signal was observed near the resonance minimum after addition of labeled
antibodies for both Cy5 and Alexa Fluor 647 conjugates. As a consequence, employed
antibodies show a strong affinity to the P19/DMPE/PC membrane structure which can cause to
background signal while detecting the signal of real sample. In this case, background can be
interpreted as a false positive signal. Therefore the “blocking” method was chosen to overcome
this background problem.
45 50 55 60 650
20
40
60
80
100
Angle (θ)
Ref
lect
ivity
%
0
1x10⁵
2x10⁵
3x10⁵
4x10⁵
Fluorescence / cps
Figure 3.45 SPFS scan of the system P19/DMPE/PC/PentaHis 1°Ab/Cy5 conjugated 2°Ab
45 50 55 60 650
20
40
60
80
100
Angle (θ)
Ref
lect
ivity
%
0.0
5.0x10⁴
1.0x10⁵
1.5x10⁵
Fluorescence / cps
Figure 3.46 SPFS scan of the system P19/DMPE/PC/Alexa Fluor 647 conjugated 1°Ab
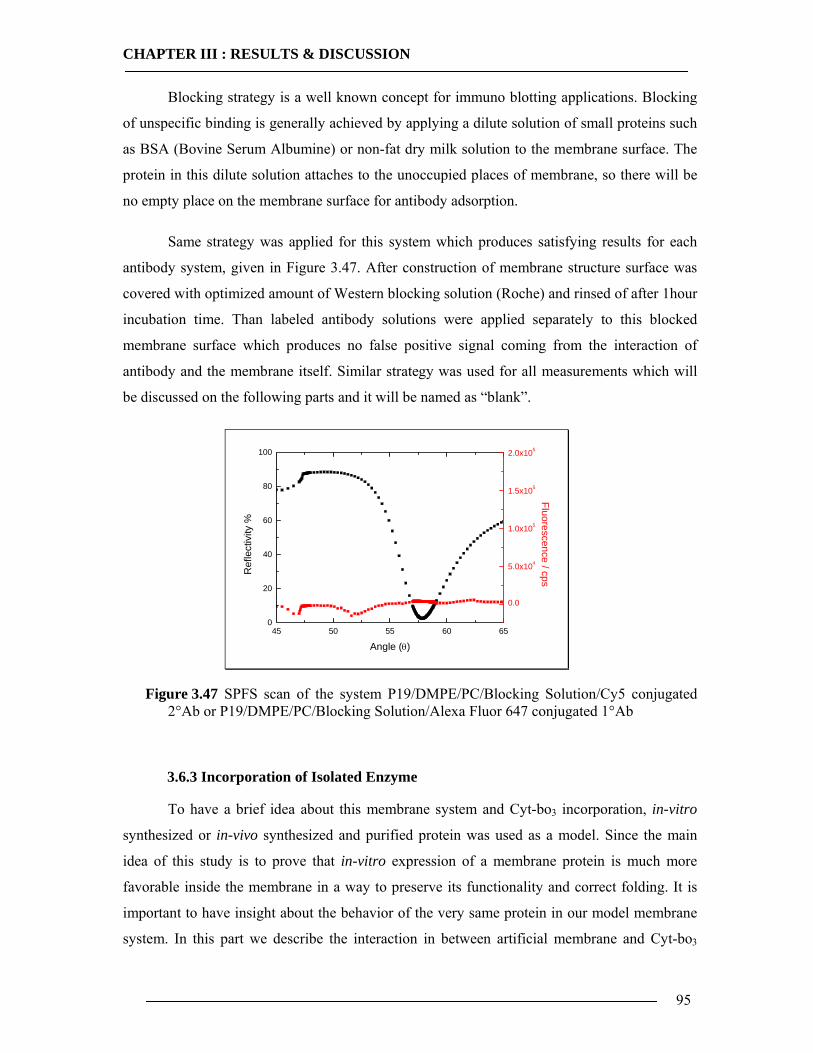
CHAPTER III : RESULTS & DISCUSSION
95
Blocking strategy is a well known concept for immuno blotting applications. Blocking
of unspecific binding is generally achieved by applying a dilute solution of small proteins such
as BSA (Bovine Serum Albumine) or non-fat dry milk solution to the membrane surface. The
protein in this dilute solution attaches to the unoccupied places of membrane, so there will be
no empty place on the membrane surface for antibody adsorption.
Same strategy was applied for this system which produces satisfying results for each
antibody system, given in Figure 3.47. After construction of membrane structure surface was
covered with optimized amount of Western blocking solution (Roche) and rinsed of after 1hour
incubation time. Than labeled antibody solutions were applied separately to this blocked
membrane surface which produces no false positive signal coming from the interaction of
antibody and the membrane itself. Similar strategy was used for all measurements which will
be discussed on the following parts and it will be named as “blank”.
45 50 55 60 650
20
40
60
80
100
Angle (θ)
Ref
lect
ivity
%
0.0
5.0x10⁴
1.0x10⁵
1.5x10⁵
2.0x10⁵
Fluorescence / cps
Figure 3.47 SPFS scan of the system P19/DMPE/PC/Blocking Solution/Cy5 conjugated 2°Ab or P19/DMPE/PC/Blocking Solution/Alexa Fluor 647 conjugated 1°Ab
3.6.3 Incorporation of Isolated Enzyme
To have a brief idea about this membrane system and Cyt-bo3 incorporation, in-vitro
synthesized or in-vivo synthesized and purified protein was used as a model. Since the main
idea of this study is to prove that in-vitro expression of a membrane protein is much more
favorable inside the membrane in a way to preserve its functionality and correct folding. It is
important to have insight about the behavior of the very same protein in our model membrane
system. In this part we describe the interaction in between artificial membrane and Cyt-bo3
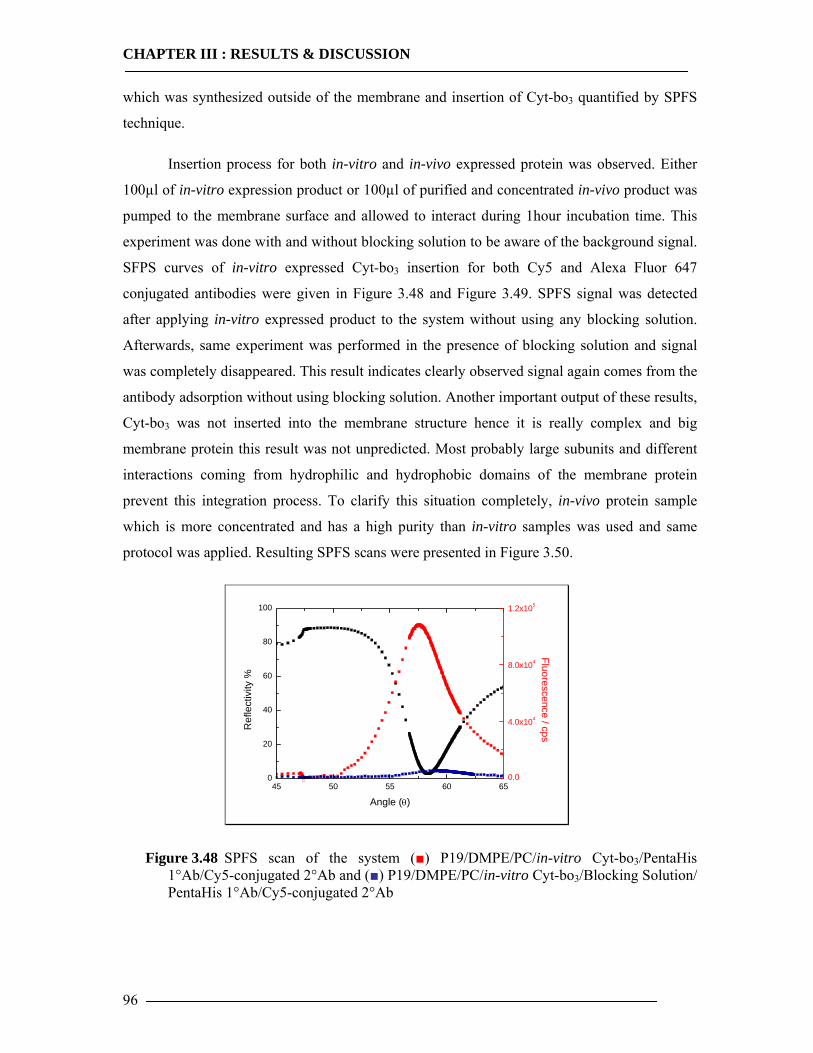
CHAPTER III : RESULTS & DISCUSSION
96
which was synthesized outside of the membrane and insertion of Cyt-bo3 quantified by SPFS
technique.
Insertion process for both in-vitro and in-vivo expressed protein was observed. Either
100µl of in-vitro expression product or 100µl of purified and concentrated in-vivo product was
pumped to the membrane surface and allowed to interact during 1hour incubation time. This
experiment was done with and without blocking solution to be aware of the background signal.
SFPS curves of in-vitro expressed Cyt-bo3 insertion for both Cy5 and Alexa Fluor 647
conjugated antibodies were given in Figure 3.48 and Figure 3.49. SPFS signal was detected
after applying in-vitro expressed product to the system without using any blocking solution.
Afterwards, same experiment was performed in the presence of blocking solution and signal
was completely disappeared. This result indicates clearly observed signal again comes from the
antibody adsorption without using blocking solution. Another important output of these results,
Cyt-bo3 was not inserted into the membrane structure hence it is really complex and big
membrane protein this result was not unpredicted. Most probably large subunits and different
interactions coming from hydrophilic and hydrophobic domains of the membrane protein
prevent this integration process. To clarify this situation completely, in-vivo protein sample
which is more concentrated and has a high purity than in-vitro samples was used and same
protocol was applied. Resulting SPFS scans were presented in Figure 3.50.
45 50 55 60 650
20
40
60
80
100
Angle (θ)
Ref
lect
ivity
%
0.0
4.0x10⁴
8.0x10⁴
1.2x10⁵
Fluorescence / cps
Figure 3.48 SPFS scan of the system (■) P19/DMPE/PC/in-vitro Cyt-bo3/PentaHis 1°Ab/Cy5-conjugated 2°Ab and (■) P19/DMPE/PC/in-vitro Cyt-bo3/Blocking Solution/ PentaHis 1°Ab/Cy5-conjugated 2°Ab
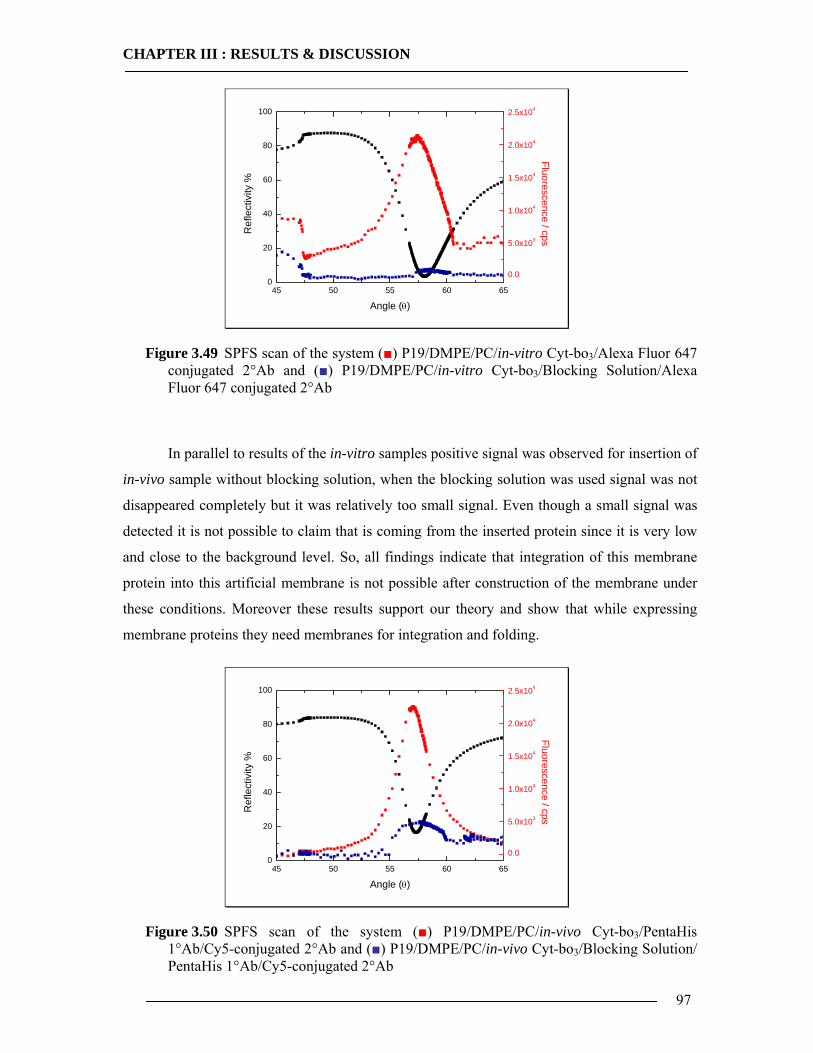
CHAPTER III : RESULTS & DISCUSSION
97
45 50 55 60 650
20
40
60
80
100
Angle (θ)
Ref
lect
ivity
%
0.0
5.0x10³
1.0x10⁴
1.5x10⁴
2.0x10⁴
2.5x10⁴
Fluorescence / cps
Figure 3.49 SPFS scan of the system (■) P19/DMPE/PC/in-vitro Cyt-bo3/Alexa Fluor 647 conjugated 2°Ab and (■) P19/DMPE/PC/in-vitro Cyt-bo3/Blocking Solution/Alexa Fluor 647 conjugated 2°Ab
In parallel to results of the in-vitro samples positive signal was observed for insertion of
in-vivo sample without blocking solution, when the blocking solution was used signal was not
disappeared completely but it was relatively too small signal. Even though a small signal was
detected it is not possible to claim that is coming from the inserted protein since it is very low
and close to the background level. So, all findings indicate that integration of this membrane
protein into this artificial membrane is not possible after construction of the membrane under
these conditions. Moreover these results support our theory and show that while expressing
membrane proteins they need membranes for integration and folding.
45 50 55 60 650
20
40
60
80
100
Angle (θ)
Ref
lect
ivity
%
0.0
5.0x10³
1.0x10⁴
1.5x10⁴
2.0x10⁴
2.5x10⁴
Fluorescence / cps
Figure 3.50 SPFS scan of the system (■) P19/DMPE/PC/in-vivo Cyt-bo3/PentaHis 1°Ab/Cy5-conjugated 2°Ab and (■) P19/DMPE/PC/in-vivo Cyt-bo3/Blocking Solution/ PentaHis 1°Ab/Cy5-conjugated 2°Ab
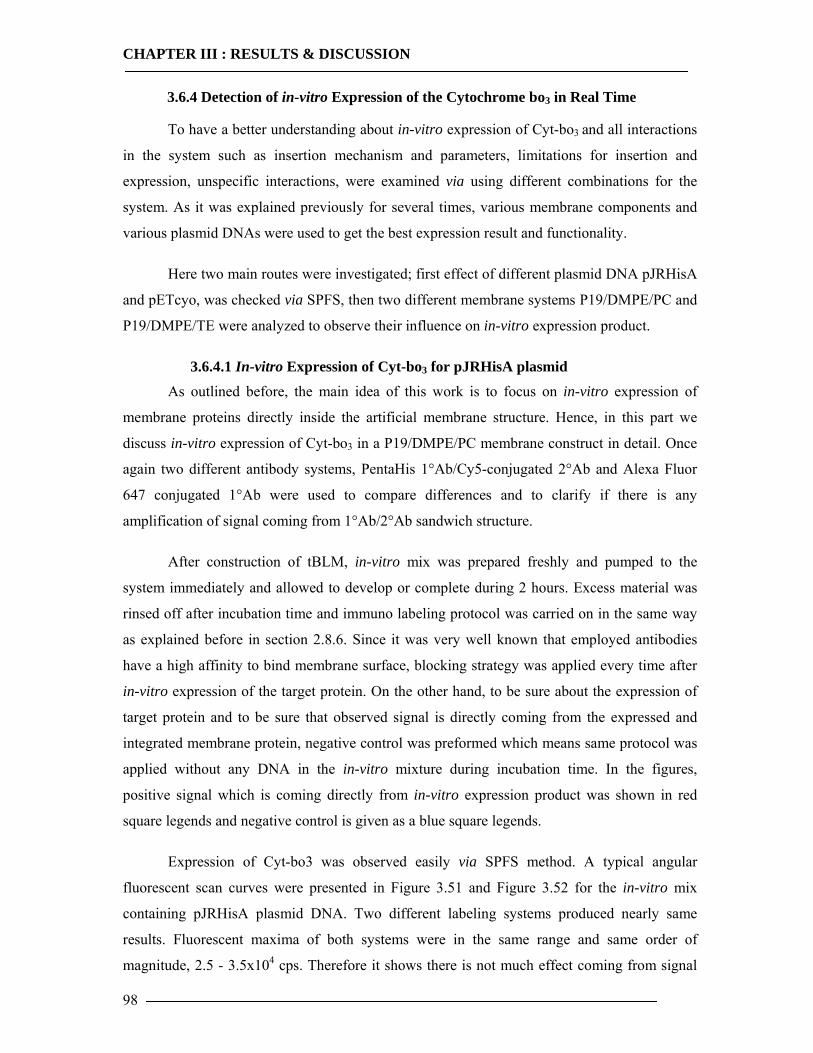
CHAPTER III : RESULTS & DISCUSSION
98
3.6.4 Detection of in-vitro Expression of the Cytochrome bo3 in Real Time
To have a better understanding about in-vitro expression of Cyt-bo3 and all interactions
in the system such as insertion mechanism and parameters, limitations for insertion and
expression, unspecific interactions, were examined via using different combinations for the
system. As it was explained previously for several times, various membrane components and
various plasmid DNAs were used to get the best expression result and functionality.
Here two main routes were investigated; first effect of different plasmid DNA pJRHisA
and pETcyo, was checked via SPFS, then two different membrane systems P19/DMPE/PC and
P19/DMPE/TE were analyzed to observe their influence on in-vitro expression product.
3.6.4.1 In-vitro Expression of Cyt-bo3 for pJRHisA plasmid
As outlined before, the main idea of this work is to focus on in-vitro expression of
membrane proteins directly inside the artificial membrane structure. Hence, in this part we
discuss in-vitro expression of Cyt-bo3 in a P19/DMPE/PC membrane construct in detail. Once
again two different antibody systems, PentaHis 1°Ab/Cy5-conjugated 2°Ab and Alexa Fluor
647 conjugated 1°Ab were used to compare differences and to clarify if there is any
amplification of signal coming from 1°Ab/2°Ab sandwich structure.
After construction of tBLM, in-vitro mix was prepared freshly and pumped to the
system immediately and allowed to develop or complete during 2 hours. Excess material was
rinsed off after incubation time and immuno labeling protocol was carried on in the same way
as explained before in section 2.8.6. Since it was very well known that employed antibodies
have a high affinity to bind membrane surface, blocking strategy was applied every time after
in-vitro expression of the target protein. On the other hand, to be sure about the expression of
target protein and to be sure that observed signal is directly coming from the expressed and
integrated membrane protein, negative control was preformed which means same protocol was
applied without any DNA in the in-vitro mixture during incubation time. In the figures,
positive signal which is coming directly from in-vitro expression product was shown in red
square legends and negative control is given as a blue square legends.
Expression of Cyt-bo3 was observed easily via SPFS method. A typical angular
fluorescent scan curves were presented in Figure 3.51 and Figure 3.52 for the in-vitro mix
containing pJRHisA plasmid DNA. Two different labeling systems produced nearly same
results. Fluorescent maxima of both systems were in the same range and same order of
magnitude, 2.5 - 3.5x10⁴ cps. Therefore it shows there is not much effect coming from signal
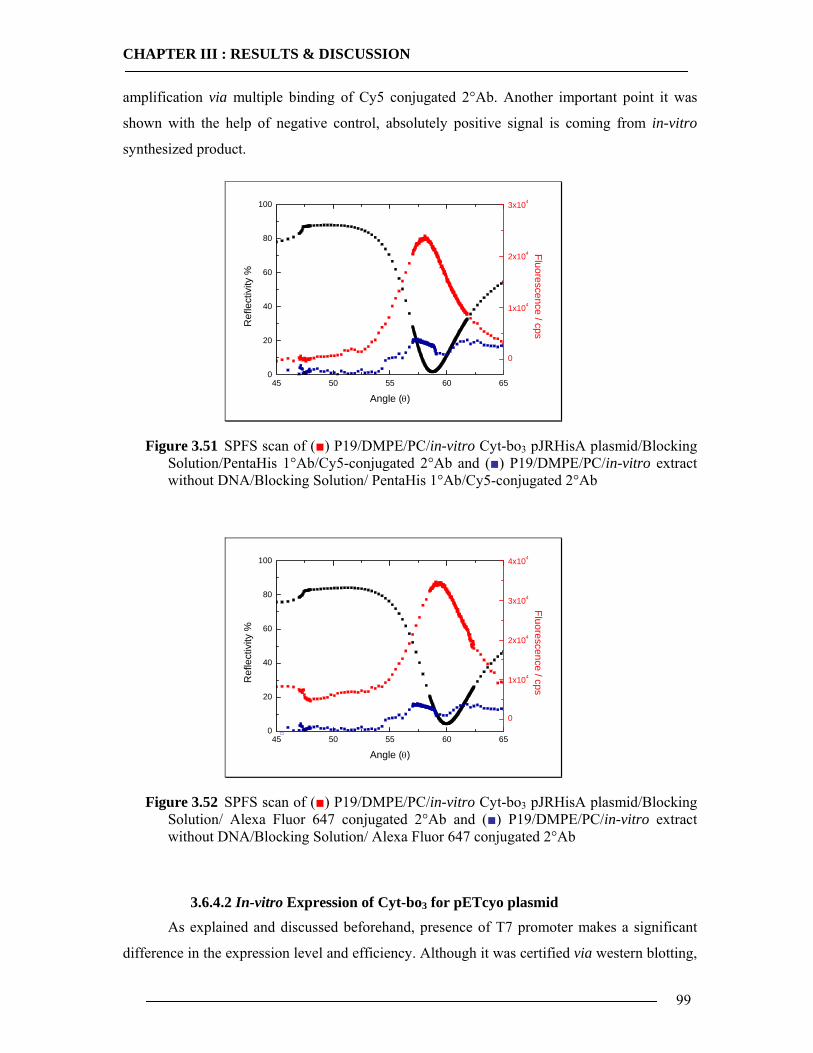
CHAPTER III : RESULTS & DISCUSSION
99
amplification via multiple binding of Cy5 conjugated 2°Ab. Another important point it was
shown with the help of negative control, absolutely positive signal is coming from in-vitro
synthesized product.
45 50 55 60 650
20
40
60
80
100
Angle (θ)
Ref
lect
ivity
%
0
1x10⁴
2x10⁴
3x10⁴
Fluorescence / cps
Figure 3.51 SPFS scan of (■) P19/DMPE/PC/in-vitro Cyt-bo3 pJRHisA plasmid/Blocking Solution/PentaHis 1°Ab/Cy5-conjugated 2°Ab and (■) P19/DMPE/PC/in-vitro extract without DNA/Blocking Solution/ PentaHis 1°Ab/Cy5-conjugated 2°Ab
45 50 55 60 650
20
40
60
80
100
Angle (θ)
Ref
lect
ivity
%
0
1x10⁴
2x10⁴
3x10⁴
4x10⁴
Fluorescence / cps
Figure 3.52 SPFS scan of (■) P19/DMPE/PC/in-vitro Cyt-bo3 pJRHisA plasmid/Blocking Solution/ Alexa Fluor 647 conjugated 2°Ab and (■) P19/DMPE/PC/in-vitro extract without DNA/Blocking Solution/ Alexa Fluor 647 conjugated 2°Ab
3.6.4.2 In-vitro Expression of Cyt-bo3 for pETcyo plasmid
As explained and discussed beforehand, presence of T7 promoter makes a significant
difference in the expression level and efficiency. Although it was certified via western blotting,
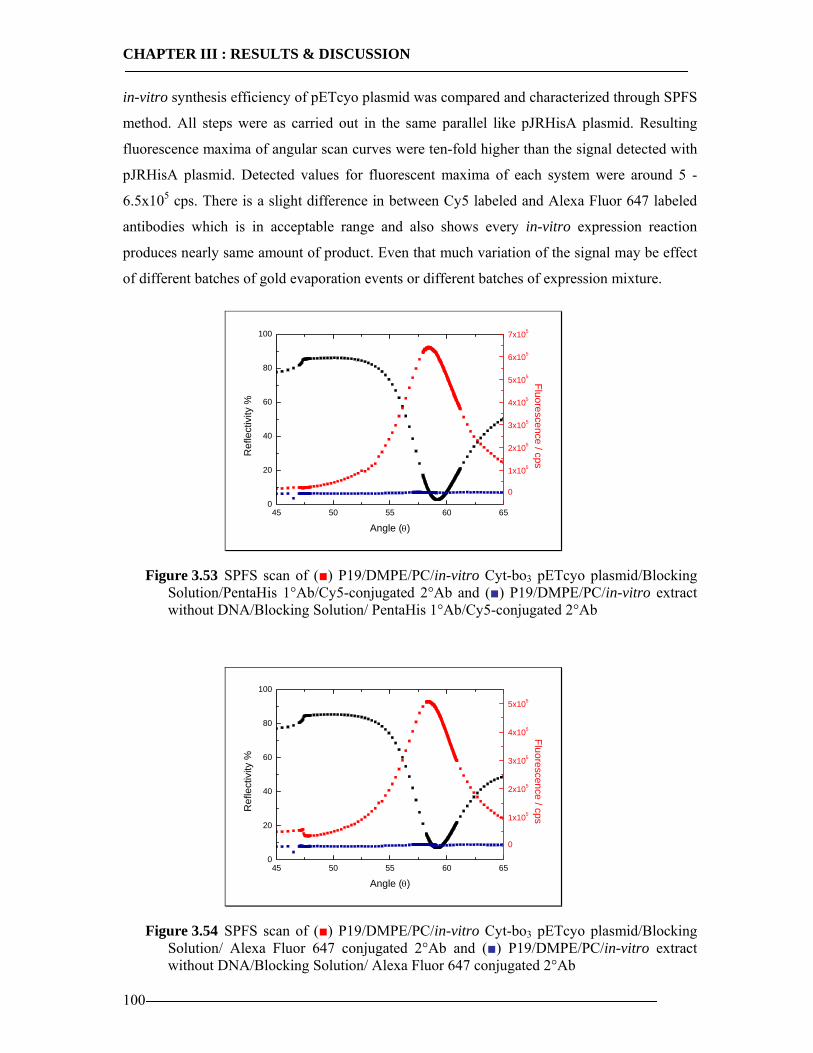
CHAPTER III : RESULTS & DISCUSSION
100
in-vitro synthesis efficiency of pETcyo plasmid was compared and characterized through SPFS
method. All steps were as carried out in the same parallel like pJRHisA plasmid. Resulting
fluorescence maxima of angular scan curves were ten-fold higher than the signal detected with
pJRHisA plasmid. Detected values for fluorescent maxima of each system were around 5 -
6.5x10⁵ cps. There is a slight difference in between Cy5 labeled and Alexa Fluor 647 labeled
antibodies which is in acceptable range and also shows every in-vitro expression reaction
produces nearly same amount of product. Even that much variation of the signal may be effect
of different batches of gold evaporation events or different batches of expression mixture.
45 50 55 60 650
20
40
60
80
100
Angle (θ)
Ref
lect
ivity
%
0
1x10⁵
2x10⁵
3x10⁵
4x10⁵
5x10⁵
6x10⁵
7x10⁵
Fluorescence / cps
Figure 3.53 SPFS scan of (■) P19/DMPE/PC/in-vitro Cyt-bo3 pETcyo plasmid/Blocking Solution/PentaHis 1°Ab/Cy5-conjugated 2°Ab and (■) P19/DMPE/PC/in-vitro extract without DNA/Blocking Solution/ PentaHis 1°Ab/Cy5-conjugated 2°Ab
45 50 55 60 650
20
40
60
80
100
Angle (θ)
Ref
lect
ivity
%
0
1x10⁵
2x10⁵
3x10⁵
4x10⁵
5x10⁵
Fluorescence / cps
Figure 3.54 SPFS scan of (■) P19/DMPE/PC/in-vitro Cyt-bo3 pETcyo plasmid/Blocking Solution/ Alexa Fluor 647 conjugated 2°Ab and (■) P19/DMPE/PC/in-vitro extract without DNA/Blocking Solution/ Alexa Fluor 647 conjugated 2°Ab
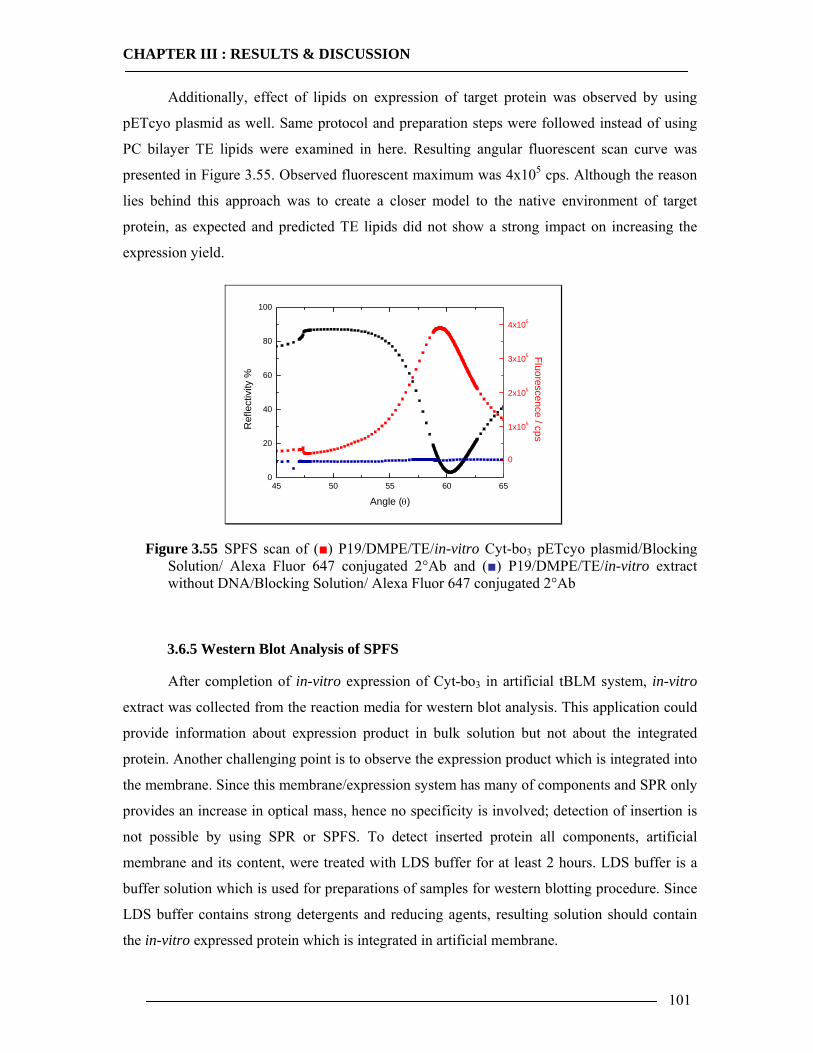
CHAPTER III : RESULTS & DISCUSSION
101
Additionally, effect of lipids on expression of target protein was observed by using
pETcyo plasmid as well. Same protocol and preparation steps were followed instead of using
PC bilayer TE lipids were examined in here. Resulting angular fluorescent scan curve was
presented in Figure 3.55. Observed fluorescent maximum was 4x10⁵ cps. Although the reason
lies behind this approach was to create a closer model to the native environment of target
protein, as expected and predicted TE lipids did not show a strong impact on increasing the
expression yield.
45 50 55 60 650
20
40
60
80
100
Angle (θ)
Ref
lect
ivity
%
0
1x10⁵
2x10⁵
3x10⁵
4x10⁵
Fluorescence / cps
Figure 3.55 SPFS scan of (■) P19/DMPE/TE/in-vitro Cyt-bo3 pETcyo plasmid/Blocking Solution/ Alexa Fluor 647 conjugated 2°Ab and (■) P19/DMPE/TE/in-vitro extract without DNA/Blocking Solution/ Alexa Fluor 647 conjugated 2°Ab
3.6.5 Western Blot Analysis of SPFS
After completion of in-vitro expression of Cyt-bo3 in artificial tBLM system, in-vitro
extract was collected from the reaction media for western blot analysis. This application could
provide information about expression product in bulk solution but not about the integrated
protein. Another challenging point is to observe the expression product which is integrated into
the membrane. Since this membrane/expression system has many of components and SPR only
provides an increase in optical mass, hence no specificity is involved; detection of insertion is
not possible by using SPR or SPFS. To detect inserted protein all components, artificial
membrane and its content, were treated with LDS buffer for at least 2 hours. LDS buffer is a
buffer solution which is used for preparations of samples for western blotting procedure. Since
LDS buffer contains strong detergents and reducing agents, resulting solution should contain
the in-vitro expressed protein which is integrated in artificial membrane.
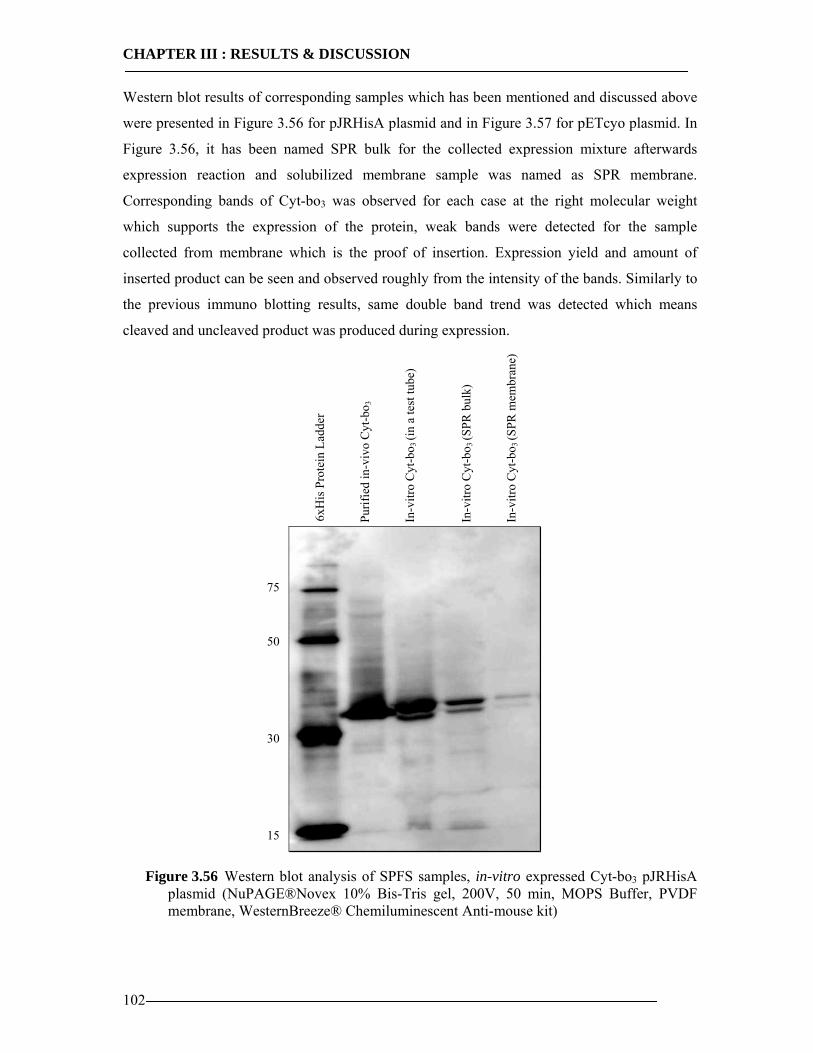
CHAPTER III : RESULTS & DISCUSSION
102
Western blot results of corresponding samples which has been mentioned and discussed above
were presented in Figure 3.56 for pJRHisA plasmid and in Figure 3.57 for pETcyo plasmid. In
Figure 3.56, it has been named SPR bulk for the collected expression mixture afterwards
expression reaction and solubilized membrane sample was named as SPR membrane.
Corresponding bands of Cyt-bo3 was observed for each case at the right molecular weight
which supports the expression of the protein, weak bands were detected for the sample
collected from membrane which is the proof of insertion. Expression yield and amount of
inserted product can be seen and observed roughly from the intensity of the bands. Similarly to
the previous immuno blotting results, same double band trend was detected which means
cleaved and uncleaved product was produced during expression.
Figure 3.56 Western blot analysis of SPFS samples, in-vitro expressed Cyt-bo3 pJRHisA plasmid (NuPAGE®Novex 10% Bis-Tris gel, 200V, 50 min, MOPS Buffer, PVDF membrane, WesternBreeze® Chemiluminescent Anti-mouse kit)
Purif
ied
in-v
ivo
Cyt
-bo 3
6xH
is P
rote
in L
adde
r
75 50 30 15
In-v
itro
Cyt
-bo 3
(in
a te
st tu
be)
In-v
itro
Cyt
-bo 3
(SPR
bul
k)
In-v
itro
Cyt
-bo 3
(SPR
mem
bran
e)
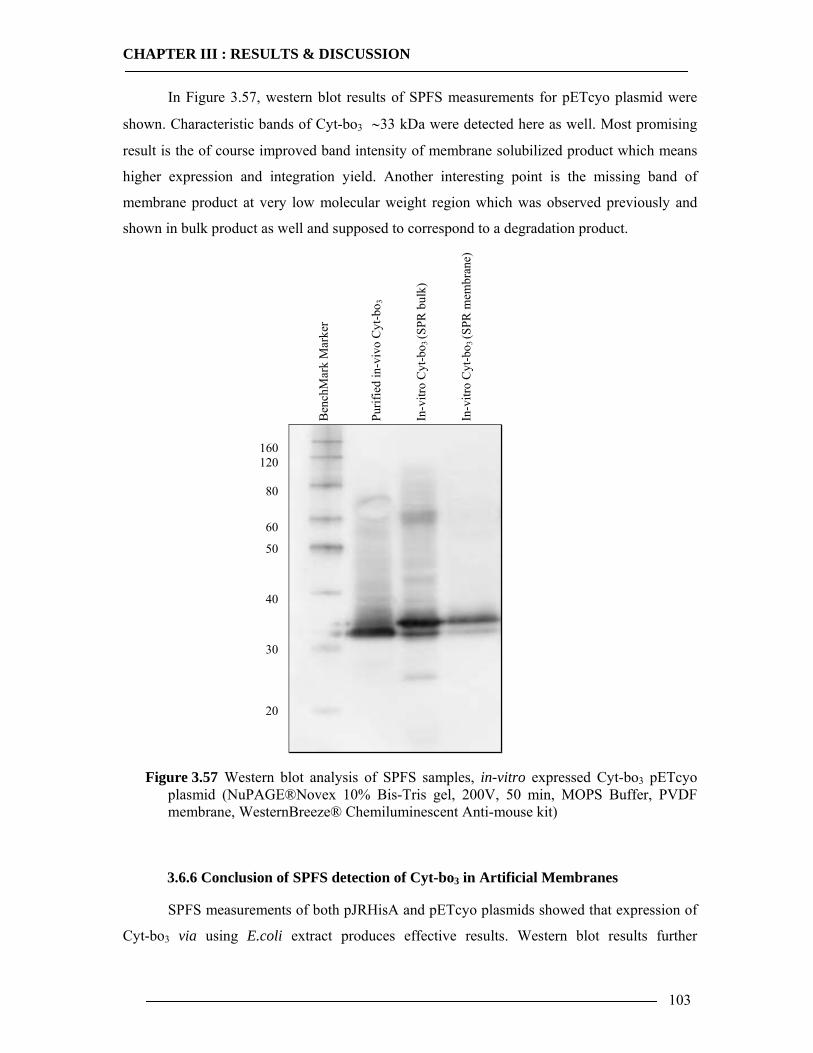
CHAPTER III : RESULTS & DISCUSSION
103
In Figure 3.57, western blot results of SPFS measurements for pETcyo plasmid were
shown. Characteristic bands of Cyt-bo3 ∼33 kDa were detected here as well. Most promising
result is the of course improved band intensity of membrane solubilized product which means
higher expression and integration yield. Another interesting point is the missing band of
membrane product at very low molecular weight region which was observed previously and
shown in bulk product as well and supposed to correspond to a degradation product.
Figure 3.57 Western blot analysis of SPFS samples, in-vitro expressed Cyt-bo3 pETcyo plasmid (NuPAGE®Novex 10% Bis-Tris gel, 200V, 50 min, MOPS Buffer, PVDF membrane, WesternBreeze® Chemiluminescent Anti-mouse kit)
3.6.6 Conclusion of SPFS detection of Cyt-bo3 in Artificial Membranes
SPFS measurements of both pJRHisA and pETcyo plasmids showed that expression of
Cyt-bo3 via using E.coli extract produces effective results. Western blot results further
Ben
chM
ark
Mar
ker
160 120 80
60
50
40
30
20
Purif
ied
in-v
ivo
Cyt
-bo 3
In-v
itro
Cyt
-bo 3
(SPR
bul
k)
In-v
itro
Cyt
-bo 3
(SPR
mem
bran
e)
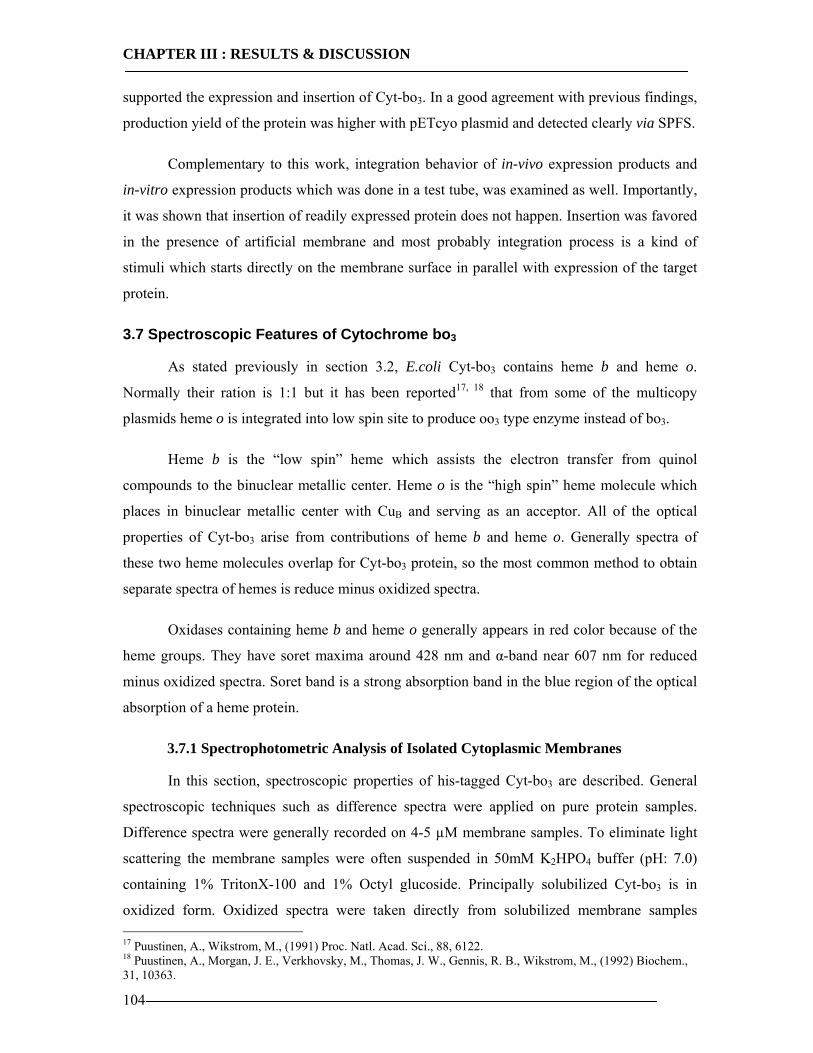
CHAPTER III : RESULTS & DISCUSSION
104
supported the expression and insertion of Cyt-bo3. In a good agreement with previous findings,
production yield of the protein was higher with pETcyo plasmid and detected clearly via SPFS.
Complementary to this work, integration behavior of in-vivo expression products and
in-vitro expression products which was done in a test tube, was examined as well. Importantly,
it was shown that insertion of readily expressed protein does not happen. Insertion was favored
in the presence of artificial membrane and most probably integration process is a kind of
stimuli which starts directly on the membrane surface in parallel with expression of the target
protein.
3.7 Spectroscopic Features of Cytochrome bo3
As stated previously in section 3.2, E.coli Cyt-bo3 contains heme b and heme o.
Normally their ration is 1:1 but it has been reported17, 18 that from some of the multicopy
plasmids heme o is integrated into low spin site to produce oo3 type enzyme instead of bo3.
Heme b is the “low spin” heme which assists the electron transfer from quinol
compounds to the binuclear metallic center. Heme o is the “high spin” heme molecule which
places in binuclear metallic center with CuB and serving as an acceptor. All of the optical
properties of Cyt-bo3 arise from contributions of heme b and heme o. Generally spectra of
these two heme molecules overlap for Cyt-bo3 protein, so the most common method to obtain
separate spectra of hemes is reduce minus oxidized spectra.
Oxidases containing heme b and heme o generally appears in red color because of the
heme groups. They have soret maxima around 428 nm and α-band near 607 nm for reduced
minus oxidized spectra. Soret band is a strong absorption band in the blue region of the optical
absorption of a heme protein.
3.7.1 Spectrophotometric Analysis of Isolated Cytoplasmic Membranes
In this section, spectroscopic properties of his-tagged Cyt-bo3 are described. General
spectroscopic techniques such as difference spectra were applied on pure protein samples.
Difference spectra were generally recorded on 4-5 µM membrane samples. To eliminate light
scattering the membrane samples were often suspended in 50mM K2HPO4 buffer (pH: 7.0)
containing 1% TritonX-100 and 1% Octyl glucoside. Principally solubilized Cyt-bo3 is in
oxidized form. Oxidized spectra were taken directly from solubilized membrane samples 17 Puustinen, A., Wikstrom, M., (1991) Proc. Natl. Acad. Sci., 88, 6122. 18 Puustinen, A., Morgan, J. E., Verkhovsky, M., Thomas, J. W., Gennis, R. B., Wikstrom, M., (1992) Biochem., 31, 10363.
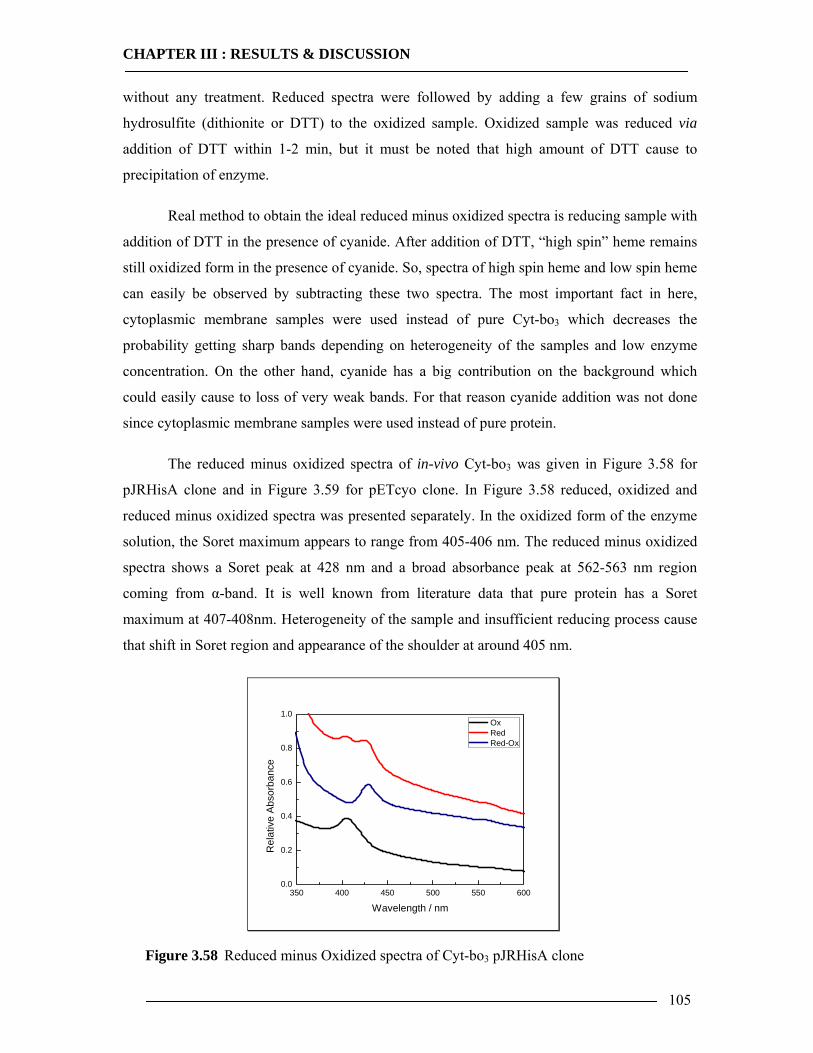
CHAPTER III : RESULTS & DISCUSSION
105
without any treatment. Reduced spectra were followed by adding a few grains of sodium
hydrosulfite (dithionite or DTT) to the oxidized sample. Oxidized sample was reduced via
addition of DTT within 1-2 min, but it must be noted that high amount of DTT cause to
precipitation of enzyme.
Real method to obtain the ideal reduced minus oxidized spectra is reducing sample with
addition of DTT in the presence of cyanide. After addition of DTT, “high spin” heme remains
still oxidized form in the presence of cyanide. So, spectra of high spin heme and low spin heme
can easily be observed by subtracting these two spectra. The most important fact in here,
cytoplasmic membrane samples were used instead of pure Cyt-bo3 which decreases the
probability getting sharp bands depending on heterogeneity of the samples and low enzyme
concentration. On the other hand, cyanide has a big contribution on the background which
could easily cause to loss of very weak bands. For that reason cyanide addition was not done
since cytoplasmic membrane samples were used instead of pure protein.
The reduced minus oxidized spectra of in-vivo Cyt-bo3 was given in Figure 3.58 for
pJRHisA clone and in Figure 3.59 for pETcyo clone. In Figure 3.58 reduced, oxidized and
reduced minus oxidized spectra was presented separately. In the oxidized form of the enzyme
solution, the Soret maximum appears to range from 405-406 nm. The reduced minus oxidized
spectra shows a Soret peak at 428 nm and a broad absorbance peak at 562-563 nm region
coming from α-band. It is well known from literature data that pure protein has a Soret
maximum at 407-408nm. Heterogeneity of the sample and insufficient reducing process cause
that shift in Soret region and appearance of the shoulder at around 405 nm.
350 400 450 500 550 6000.0
0.2
0.4
0.6
0.8
1.0
Rel
ativ
e Ab
sorb
ance
Wavelength / nm
Ox Red Red-Ox
Figure 3.58 Reduced minus Oxidized spectra of Cyt-bo3 pJRHisA clone
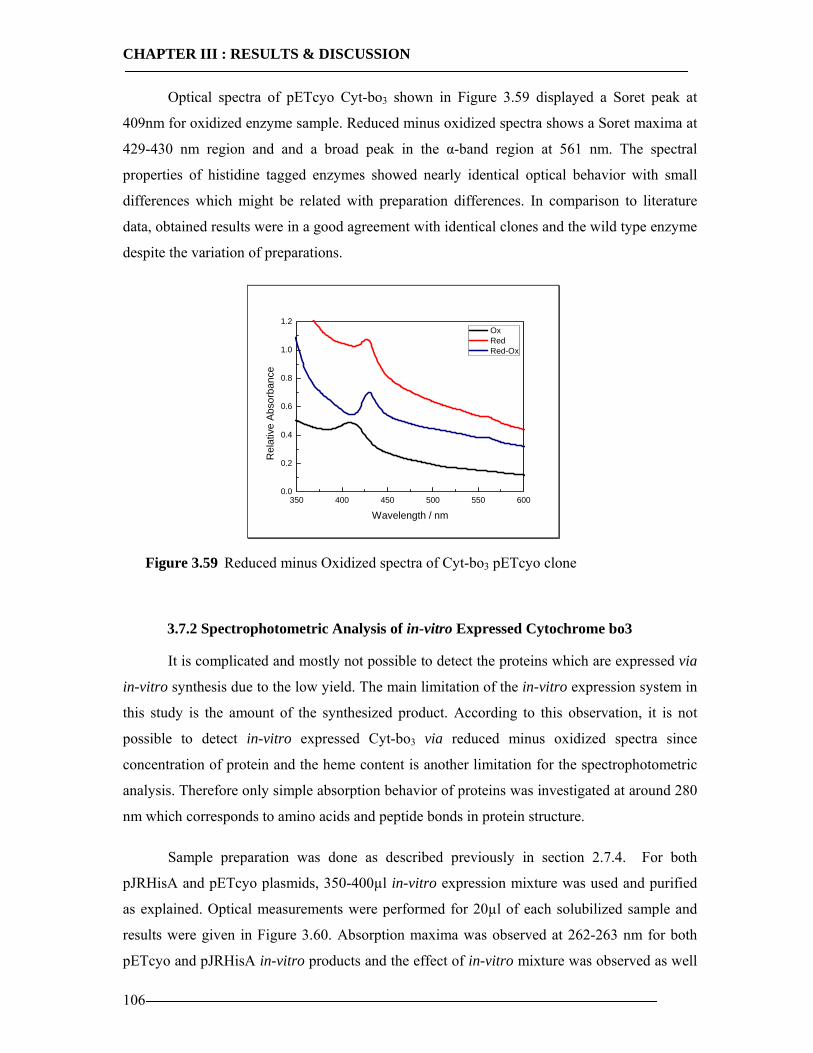
CHAPTER III : RESULTS & DISCUSSION
106
Optical spectra of pETcyo Cyt-bo3 shown in Figure 3.59 displayed a Soret peak at
409nm for oxidized enzyme sample. Reduced minus oxidized spectra shows a Soret maxima at
429-430 nm region and and a broad peak in the α-band region at 561 nm. The spectral
properties of histidine tagged enzymes showed nearly identical optical behavior with small
differences which might be related with preparation differences. In comparison to literature
data, obtained results were in a good agreement with identical clones and the wild type enzyme
despite the variation of preparations.
350 400 450 500 550 6000.0
0.2
0.4
0.6
0.8
1.0
1.2
Rel
ativ
e Ab
sorb
ance
Wavelength / nm
Ox Red Red-Ox
Figure 3.59 Reduced minus Oxidized spectra of Cyt-bo3 pETcyo clone
3.7.2 Spectrophotometric Analysis of in-vitro Expressed Cytochrome bo3
It is complicated and mostly not possible to detect the proteins which are expressed via
in-vitro synthesis due to the low yield. The main limitation of the in-vitro expression system in
this study is the amount of the synthesized product. According to this observation, it is not
possible to detect in-vitro expressed Cyt-bo3 via reduced minus oxidized spectra since
concentration of protein and the heme content is another limitation for the spectrophotometric
analysis. Therefore only simple absorption behavior of proteins was investigated at around 280
nm which corresponds to amino acids and peptide bonds in protein structure.
Sample preparation was done as described previously in section 2.7.4. For both
pJRHisA and pETcyo plasmids, 350-400µl in-vitro expression mixture was used and purified
as explained. Optical measurements were performed for 20µl of each solubilized sample and
results were given in Figure 3.60. Absorption maxima was observed at 262-263 nm for both
pETcyo and pJRHisA in-vitro products and the effect of in-vitro mixture was observed as well
CHAPTER III : RESULTS & DISCUSSION
107
since in-vitro extract is a protein mixture itself. It is clearly observed that there is a significant
difference in between negative (blank) and positive samples coming from expressed target
protein. Another substantial output regarding the absorbance values is as expected pETcyo
plasmid yields more concentrated sample than pJRHisA plasmid. Although specific absorbance
wavelength was ∼280 nm for protein structures, this shift might be caused by the purification
process of the protein or caused by heterogeneity of the sample. Sample concentrations were
analyzed roughly by using western blot technique and found out that each sample is in “ng”
amount. Detailed results will be represented in the following section together with enzyme
activity results.
240 250 260 270 280 290 3000.0
0.1
0.2
0.3
0.4
0.5
Rel
ativ
e Ab
sorb
ance
Wavelength / nm
Blank pETcyo pJRHisA
Figure 3.60 Spectrophotometric properties of in-vitro expressed Cyt-bo3
3.8 Enzymatic Properties of Cytochrome bo3
As stated previously, Cytochrome bo3 Ubiquinol Oxidase accepts electron from quinol
on the plasmic side of the membrane and as it can be understood easily from its name it
oxidizes quinol compound to quinine during enzymatic activity cycle. Enzymatic activity assay
was carried out either by monitoring the oxidation of UQH2 at 278nm or by measuring oxygen
consumption which is the evidence of UQH2 consumption as well.
Quinol is the main substrate of the enzymatic reaction carried by Cyt-bo3. Quinol is a
two electron carrier which cycles between other complexes of respiratory chain such as
dehydrogenases, and Cyt-bo3 and becomes reduced and oxidized respectively. Additionally,
quinol carries two protons and releases them into the periplasm during oxidation process.
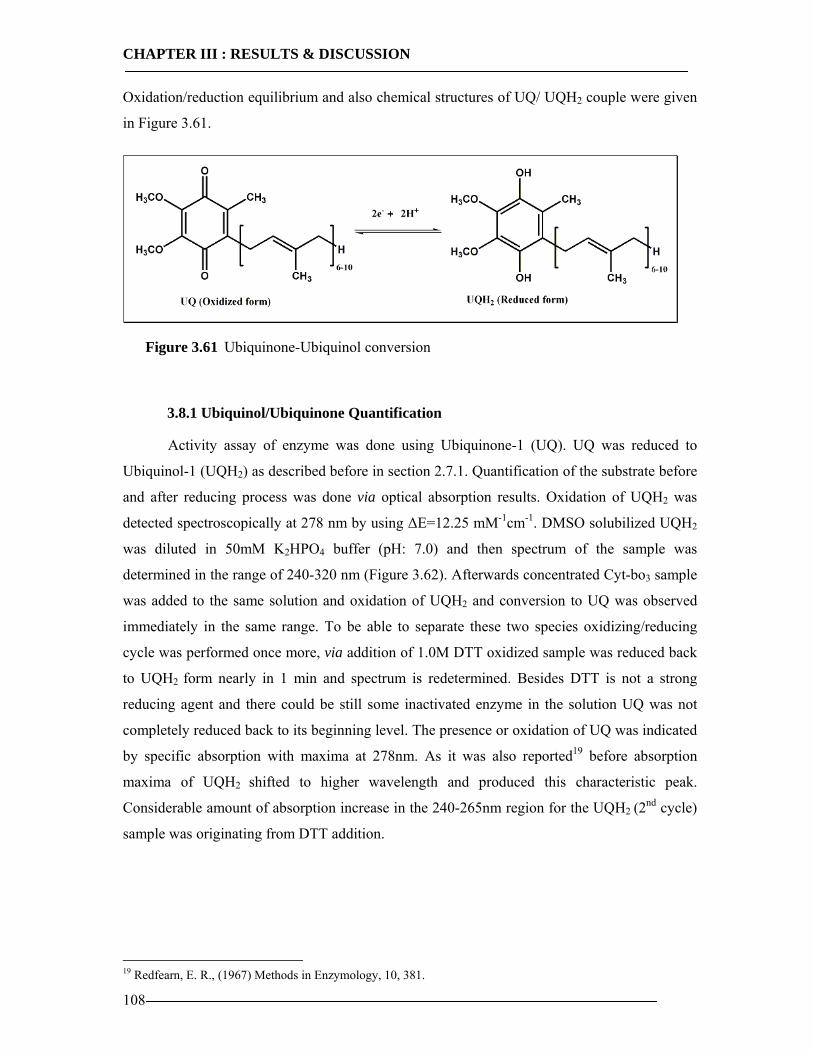
CHAPTER III : RESULTS & DISCUSSION
108
Oxidation/reduction equilibrium and also chemical structures of UQ/ UQH2 couple were given
in Figure 3.61.
Figure 3.61 Ubiquinone-Ubiquinol conversion
3.8.1 Ubiquinol/Ubiquinone Quantification
Activity assay of enzyme was done using Ubiquinone-1 (UQ). UQ was reduced to
Ubiquinol-1 (UQH2) as described before in section 2.7.1. Quantification of the substrate before
and after reducing process was done via optical absorption results. Oxidation of UQH2 was
detected spectroscopically at 278 nm by using ∆E=12.25 mM-1cm-1. DMSO solubilized UQH2
was diluted in 50mM K2HPO4 buffer (pH: 7.0) and then spectrum of the sample was
determined in the range of 240-320 nm (Figure 3.62). Afterwards concentrated Cyt-bo3 sample
was added to the same solution and oxidation of UQH2 and conversion to UQ was observed
immediately in the same range. To be able to separate these two species oxidizing/reducing
cycle was performed once more, via addition of 1.0M DTT oxidized sample was reduced back
to UQH2 form nearly in 1 min and spectrum is redetermined. Besides DTT is not a strong
reducing agent and there could be still some inactivated enzyme in the solution UQ was not
completely reduced back to its beginning level. The presence or oxidation of UQ was indicated
by specific absorption with maxima at 278nm. As it was also reported19 before absorption
maxima of UQH2 shifted to higher wavelength and produced this characteristic peak.
Considerable amount of absorption increase in the 240-265nm region for the UQH2 (2nd cycle)
sample was originating from DTT addition.
19 Redfearn, E. R., (1967) Methods in Enzymology, 10, 381.
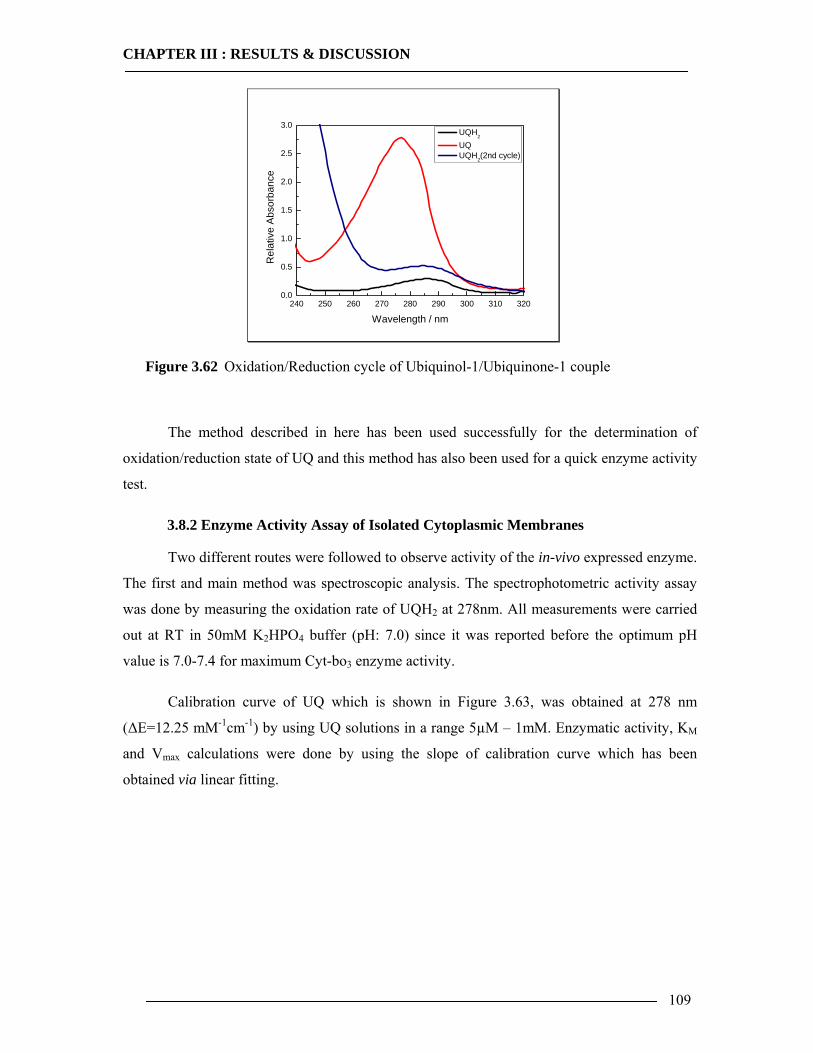
CHAPTER III : RESULTS & DISCUSSION
109
240 250 260 270 280 290 300 310 3200.0
0.5
1.0
1.5
2.0
2.5
3.0
Rel
ativ
e Ab
sorb
ance
Wavelength / nm
UQH2
UQ UQH2(2nd cycle)
Figure 3.62 Oxidation/Reduction cycle of Ubiquinol-1/Ubiquinone-1 couple
The method described in here has been used successfully for the determination of
oxidation/reduction state of UQ and this method has also been used for a quick enzyme activity
test.
3.8.2 Enzyme Activity Assay of Isolated Cytoplasmic Membranes
Two different routes were followed to observe activity of the in-vivo expressed enzyme.
The first and main method was spectroscopic analysis. The spectrophotometric activity assay
was done by measuring the oxidation rate of UQH2 at 278nm. All measurements were carried
out at RT in 50mM K2HPO4 buffer (pH: 7.0) since it was reported before the optimum pH
value is 7.0-7.4 for maximum Cyt-bo3 enzyme activity.
Calibration curve of UQ which is shown in Figure 3.63, was obtained at 278 nm
(∆E=12.25 mM-1cm-1) by using UQ solutions in a range 5µM – 1mM. Enzymatic activity, KM
and Vmax calculations were done by using the slope of calibration curve which has been
obtained via linear fitting.
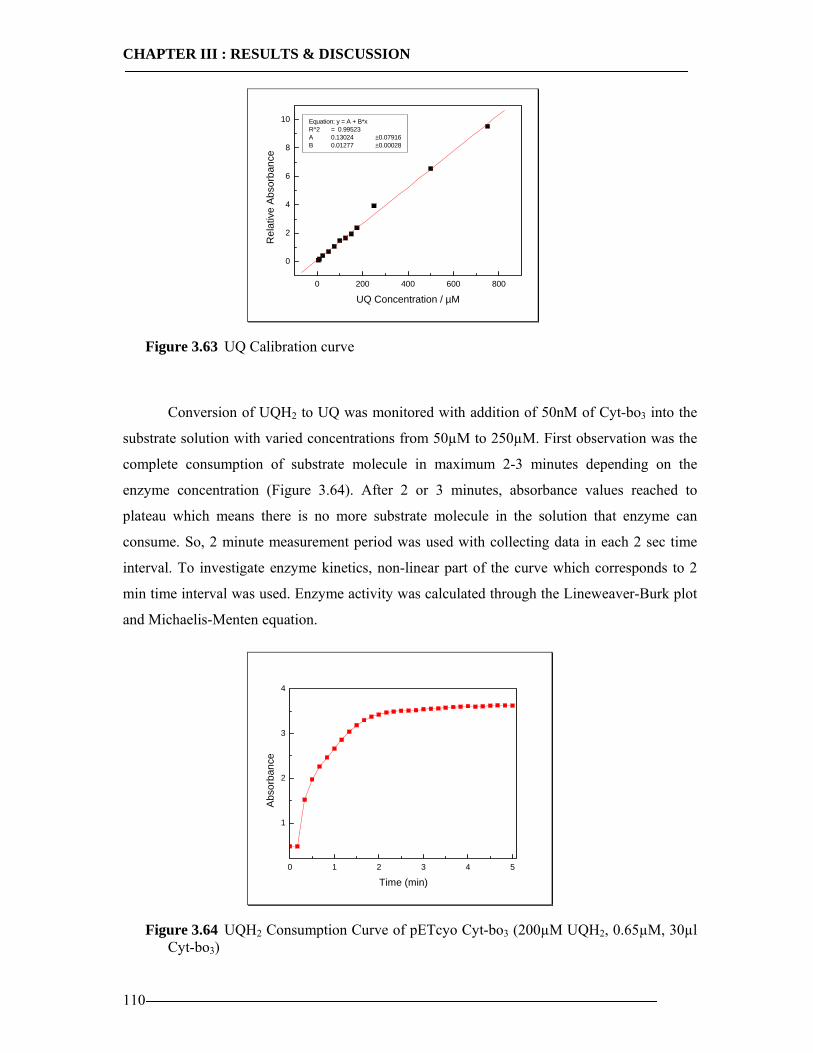
CHAPTER III : RESULTS & DISCUSSION
110
0 200 400 600 800
0
2
4
6
8
10 Equation: y = A + B*xR^2 = 0.99523A 0.13024 ±0.07916B 0.01277 ±0.00028
Rel
ativ
e Ab
sorb
ance
UQ Concentration / µM
Figure 3.63 UQ Calibration curve
Conversion of UQH2 to UQ was monitored with addition of 50nM of Cyt-bo3 into the
substrate solution with varied concentrations from 50µM to 250µM. First observation was the
complete consumption of substrate molecule in maximum 2-3 minutes depending on the
enzyme concentration (Figure 3.64). After 2 or 3 minutes, absorbance values reached to
plateau which means there is no more substrate molecule in the solution that enzyme can
consume. So, 2 minute measurement period was used with collecting data in each 2 sec time
interval. To investigate enzyme kinetics, non-linear part of the curve which corresponds to 2
min time interval was used. Enzyme activity was calculated through the Lineweaver-Burk plot
and Michaelis-Menten equation.
0 1 2 3 4 5
1
2
3
4
Abso
rban
ce
Time (min)
Figure 3.64 UQH2 Consumption Curve of pETcyo Cyt-bo3 (200µM UQH2, 0.65µM, 30µl Cyt-bo3)
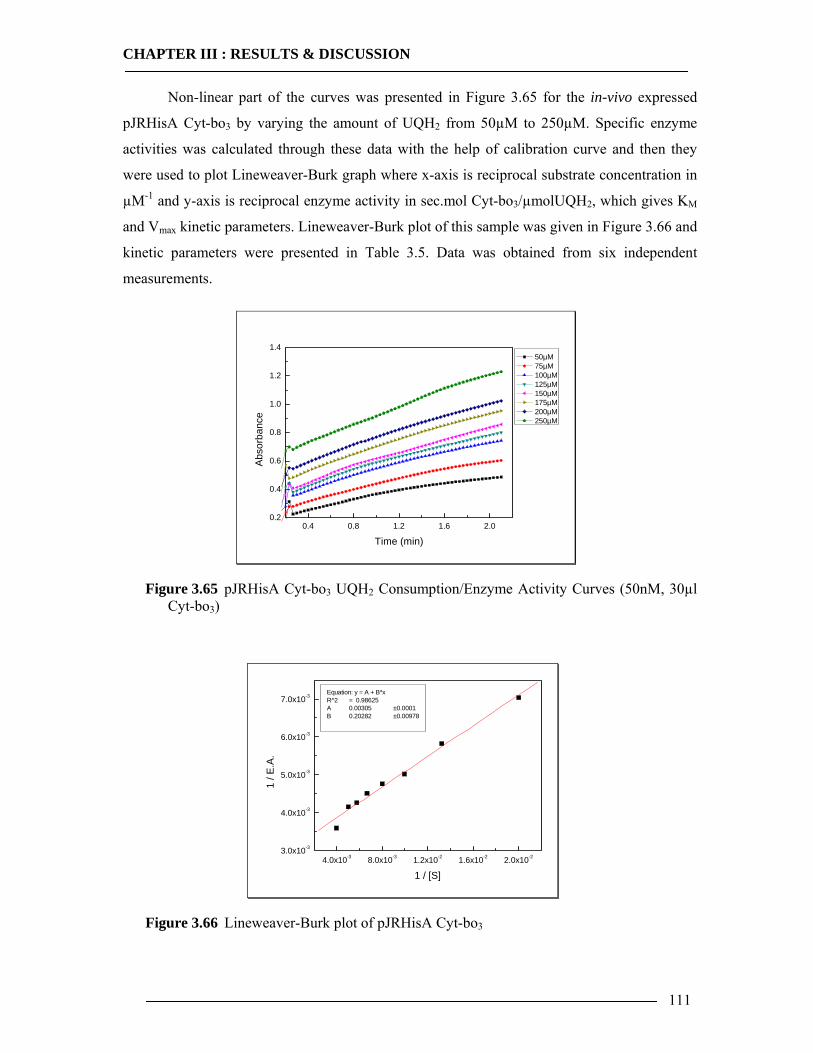
CHAPTER III : RESULTS & DISCUSSION
111
Non-linear part of the curves was presented in Figure 3.65 for the in-vivo expressed
pJRHisA Cyt-bo3 by varying the amount of UQH2 from 50µM to 250µM. Specific enzyme
activities was calculated through these data with the help of calibration curve and then they
were used to plot Lineweaver-Burk graph where x-axis is reciprocal substrate concentration in
µM-1 and y-axis is reciprocal enzyme activity in sec.mol Cyt-bo3/µmolUQH2, which gives KM
and Vmax kinetic parameters. Lineweaver-Burk plot of this sample was given in Figure 3.66 and
kinetic parameters were presented in Table 3.5. Data was obtained from six independent
measurements.
0.4 0.8 1.2 1.6 2.00.2
0.4
0.6
0.8
1.0
1.2
1.4
Abso
rban
ce
Time (min)
50µM 75µM 100µM 125µM 150µM 175µM 200µM 250µM
Figure 3.65 pJRHisA Cyt-bo3 UQH2 Consumption/Enzyme Activity Curves (50nM, 30µl Cyt-bo3)
4.0x10⁻³ 8.0x10⁻³ 1.2x10⁻² 1.6x10⁻² 2.0x10-23.0x10-3
4.0x10⁻³
5.0x10⁻³
6.0x10⁻³
7.0x10⁻³ Equation: y = A + B*xR^2 = 0.98625A 0.00305 ±0.0001B 0.20282 ±0.00978
1 / E
.A.
1 / [S]
Figure 3.66 Lineweaver-Burk plot of pJRHisA Cyt-bo3
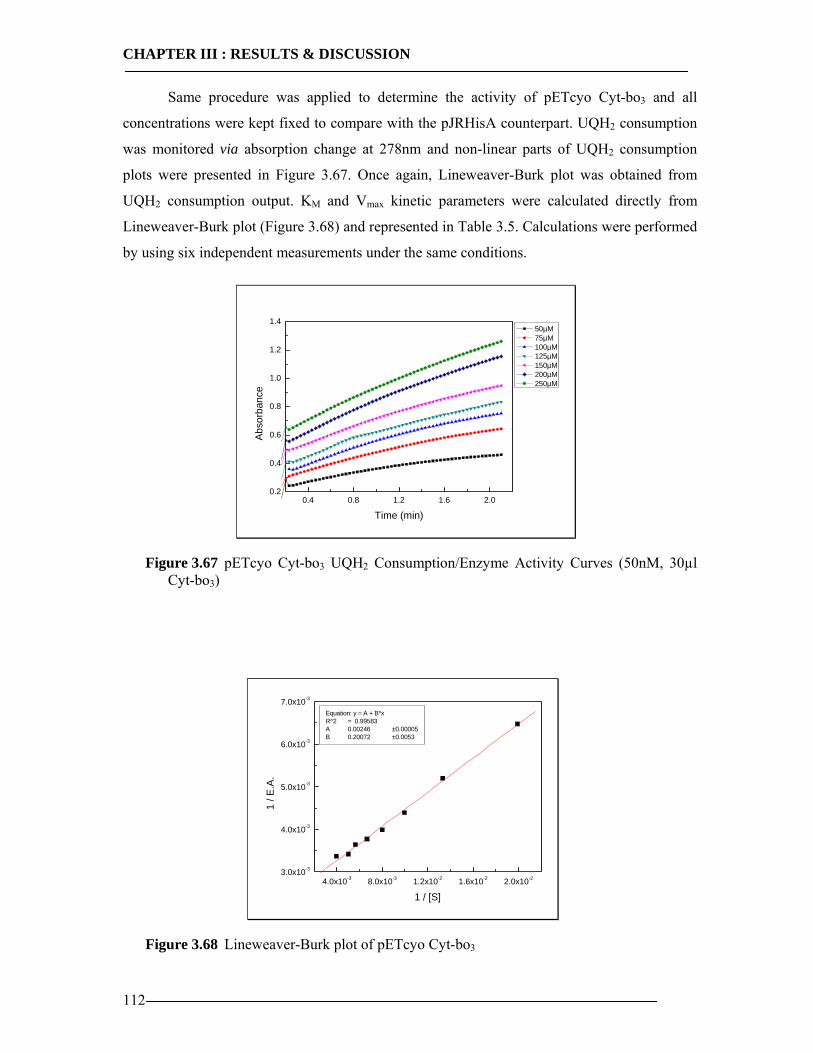
CHAPTER III : RESULTS & DISCUSSION
112
Same procedure was applied to determine the activity of pETcyo Cyt-bo3 and all
concentrations were kept fixed to compare with the pJRHisA counterpart. UQH2 consumption
was monitored via absorption change at 278nm and non-linear parts of UQH2 consumption
plots were presented in Figure 3.67. Once again, Lineweaver-Burk plot was obtained from
UQH2 consumption output. KM and Vmax kinetic parameters were calculated directly from
Lineweaver-Burk plot (Figure 3.68) and represented in Table 3.5. Calculations were performed
by using six independent measurements under the same conditions.
0.4 0.8 1.2 1.6 2.00.2
0.4
0.6
0.8
1.0
1.2
1.4
Abso
rban
ce
Time (min)
50µM 75µM 100µM 125µM 150µM 200µM 250µM
Figure 3.67 pETcyo Cyt-bo3 UQH2 Consumption/Enzyme Activity Curves (50nM, 30µl Cyt-bo3)
4.0x10⁻³ 8.0x10⁻³ 1.2x10⁻² 1.6x10⁻² 2.0x10-23.0x10-3
4.0x10⁻³
5.0x10⁻³
6.0x10⁻³
7.0x10⁻³
Equation: y = A + B*xR^2 = 0.99583A 0.00246 ±0.00005B 0.20072 ±0.0053
1 / E
.A.
1 / [S]
Figure 3.68 Lineweaver-Burk plot of pETcyo Cyt-bo3
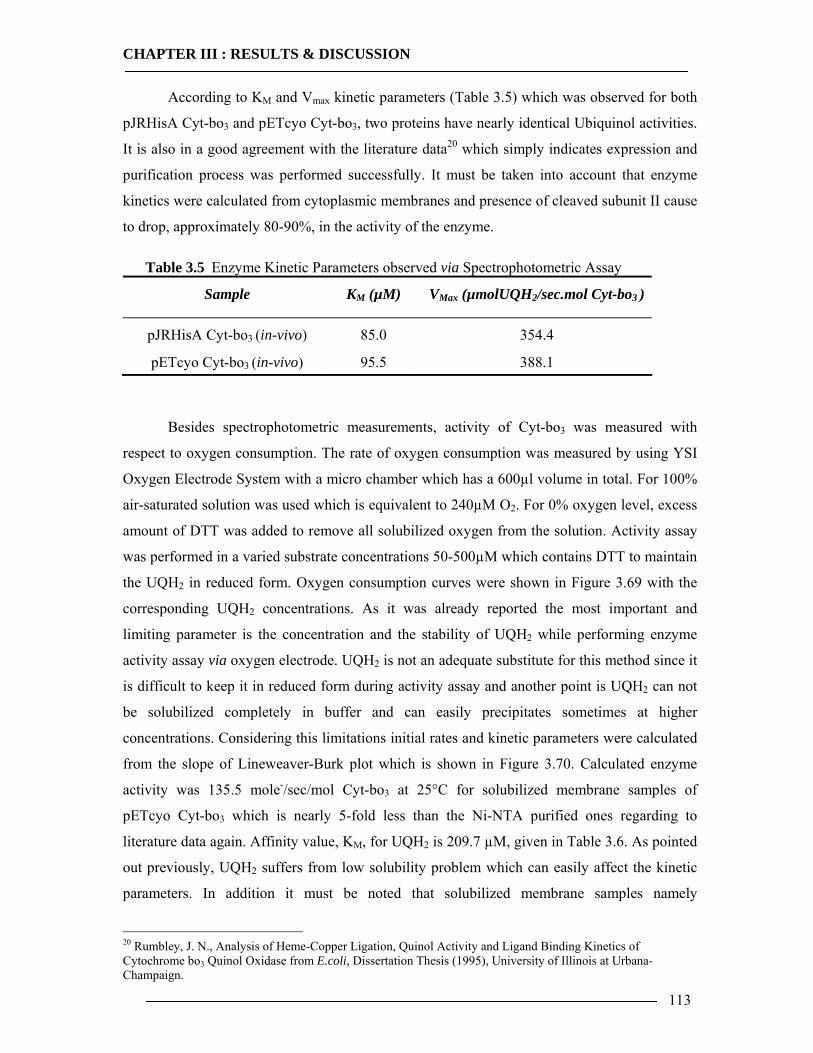
CHAPTER III : RESULTS & DISCUSSION
113
According to KM and Vmax kinetic parameters (Table 3.5) which was observed for both
pJRHisA Cyt-bo3 and pETcyo Cyt-bo3, two proteins have nearly identical Ubiquinol activities.
It is also in a good agreement with the literature data20 which simply indicates expression and
purification process was performed successfully. It must be taken into account that enzyme
kinetics were calculated from cytoplasmic membranes and presence of cleaved subunit II cause
to drop, approximately 80-90%, in the activity of the enzyme.
Table 3.5 Enzyme Kinetic Parameters observed via Spectrophotometric Assay
Sample KM (µM) VMax (µmolUQH2/sec.mol Cyt-bo3 )
pJRHisA Cyt-bo3 (in-vivo) 85.0 354.4
pETcyo Cyt-bo3 (in-vivo) 95.5 388.1
Besides spectrophotometric measurements, activity of Cyt-bo3 was measured with
respect to oxygen consumption. The rate of oxygen consumption was measured by using YSI
Oxygen Electrode System with a micro chamber which has a 600µl volume in total. For 100%
air-saturated solution was used which is equivalent to 240µM O2. For 0% oxygen level, excess
amount of DTT was added to remove all solubilized oxygen from the solution. Activity assay
was performed in a varied substrate concentrations 50-500µM which contains DTT to maintain
the UQH2 in reduced form. Oxygen consumption curves were shown in Figure 3.69 with the
corresponding UQH2 concentrations. As it was already reported the most important and
limiting parameter is the concentration and the stability of UQH2 while performing enzyme
activity assay via oxygen electrode. UQH2 is not an adequate substitute for this method since it
is difficult to keep it in reduced form during activity assay and another point is UQH2 can not
be solubilized completely in buffer and can easily precipitates sometimes at higher
concentrations. Considering this limitations initial rates and kinetic parameters were calculated
from the slope of Lineweaver-Burk plot which is shown in Figure 3.70. Calculated enzyme
activity was 135.5 mole-/sec/mol Cyt-bo3 at 25°C for solubilized membrane samples of
pETcyo Cyt-bo3 which is nearly 5-fold less than the Ni-NTA purified ones regarding to
literature data again. Affinity value, KM, for UQH2 is 209.7 µM, given in Table 3.6. As pointed
out previously, UQH2 suffers from low solubility problem which can easily affect the kinetic
parameters. In addition it must be noted that solubilized membrane samples namely
20 Rumbley, J. N., Analysis of Heme-Copper Ligation, Quinol Activity and Ligand Binding Kinetics of Cytochrome bo3 Quinol Oxidase from E.coli, Dissertation Thesis (1995), University of Illinois at Urbana-Champaign.
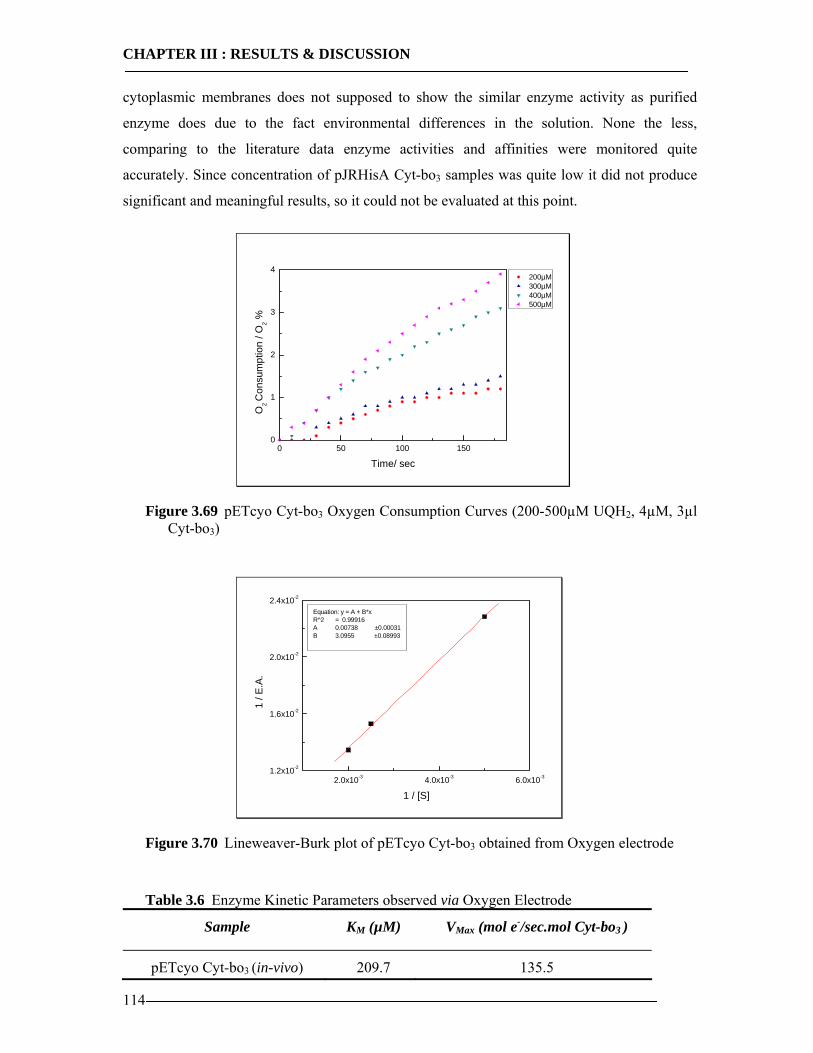
CHAPTER III : RESULTS & DISCUSSION
114
cytoplasmic membranes does not supposed to show the similar enzyme activity as purified
enzyme does due to the fact environmental differences in the solution. None the less,
comparing to the literature data enzyme activities and affinities were monitored quite
accurately. Since concentration of pJRHisA Cyt-bo3 samples was quite low it did not produce
significant and meaningful results, so it could not be evaluated at this point.
0 50 100 1500
1
2
3
4
O
2 C
onsu
mpt
ion
/ O2 %
Time/ sec
200µM 300µM 400µM 500µM
Figure 3.69 pETcyo Cyt-bo3 Oxygen Consumption Curves (200-500µM UQH2, 4µM, 3µl Cyt-bo3)
2.0x10⁻³ 4.0x10⁻³ 6.0x10-31.2x10-2
1.6x10⁻²
2.0x10⁻²
2.4x10⁻²
Equation: y = A + B*xR^2 = 0.99916A 0.00738 ±0.00031B 3.0955 ±0.08993
1 / E
.A.
1 / [S]
Figure 3.70 Lineweaver-Burk plot of pETcyo Cyt-bo3 obtained from Oxygen electrode
Table 3.6 Enzyme Kinetic Parameters observed via Oxygen Electrode
Sample KM (µM) VMax (mol e-/sec.mol Cyt-bo3 )
pETcyo Cyt-bo3 (in-vivo) 209.7 135.5
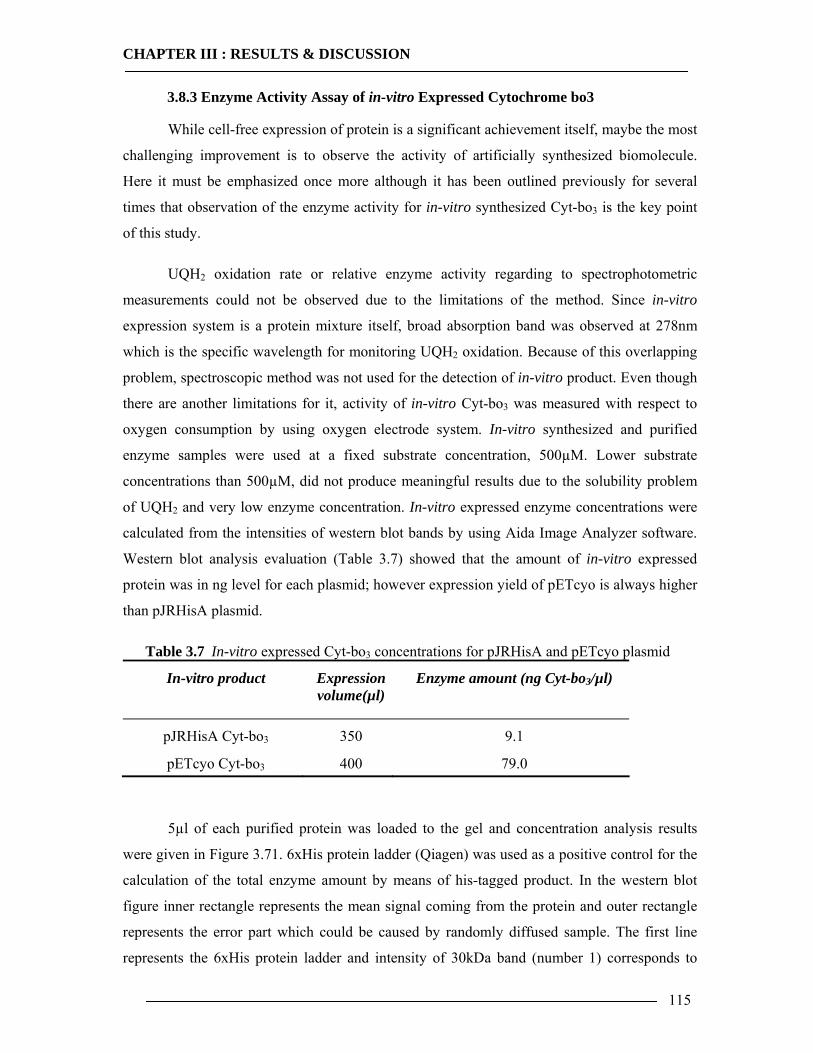
CHAPTER III : RESULTS & DISCUSSION
115
3.8.3 Enzyme Activity Assay of in-vitro Expressed Cytochrome bo3
While cell-free expression of protein is a significant achievement itself, maybe the most
challenging improvement is to observe the activity of artificially synthesized biomolecule.
Here it must be emphasized once more although it has been outlined previously for several
times that observation of the enzyme activity for in-vitro synthesized Cyt-bo3 is the key point
of this study.
UQH2 oxidation rate or relative enzyme activity regarding to spectrophotometric
measurements could not be observed due to the limitations of the method. Since in-vitro
expression system is a protein mixture itself, broad absorption band was observed at 278nm
which is the specific wavelength for monitoring UQH2 oxidation. Because of this overlapping
problem, spectroscopic method was not used for the detection of in-vitro product. Even though
there are another limitations for it, activity of in-vitro Cyt-bo3 was measured with respect to
oxygen consumption by using oxygen electrode system. In-vitro synthesized and purified
enzyme samples were used at a fixed substrate concentration, 500µM. Lower substrate
concentrations than 500µM, did not produce meaningful results due to the solubility problem
of UQH2 and very low enzyme concentration. In-vitro expressed enzyme concentrations were
calculated from the intensities of western blot bands by using Aida Image Analyzer software.
Western blot analysis evaluation (Table 3.7) showed that the amount of in-vitro expressed
protein was in ng level for each plasmid; however expression yield of pETcyo is always higher
than pJRHisA plasmid.
Table 3.7 In-vitro expressed Cyt-bo3 concentrations for pJRHisA and pETcyo plasmid
In-vitro product Expression volume(µl)
Enzyme amount (ng Cyt-bo3/µl)
pJRHisA Cyt-bo3 350 9.1
pETcyo Cyt-bo3 400 79.0
5µl of each purified protein was loaded to the gel and concentration analysis results
were given in Figure 3.71. 6xHis protein ladder (Qiagen) was used as a positive control for the
calculation of the total enzyme amount by means of his-tagged product. In the western blot
figure inner rectangle represents the mean signal coming from the protein and outer rectangle
represents the error part which could be caused by randomly diffused sample. The first line
represents the 6xHis protein ladder and intensity of 30kDa band (number 1) corresponds to
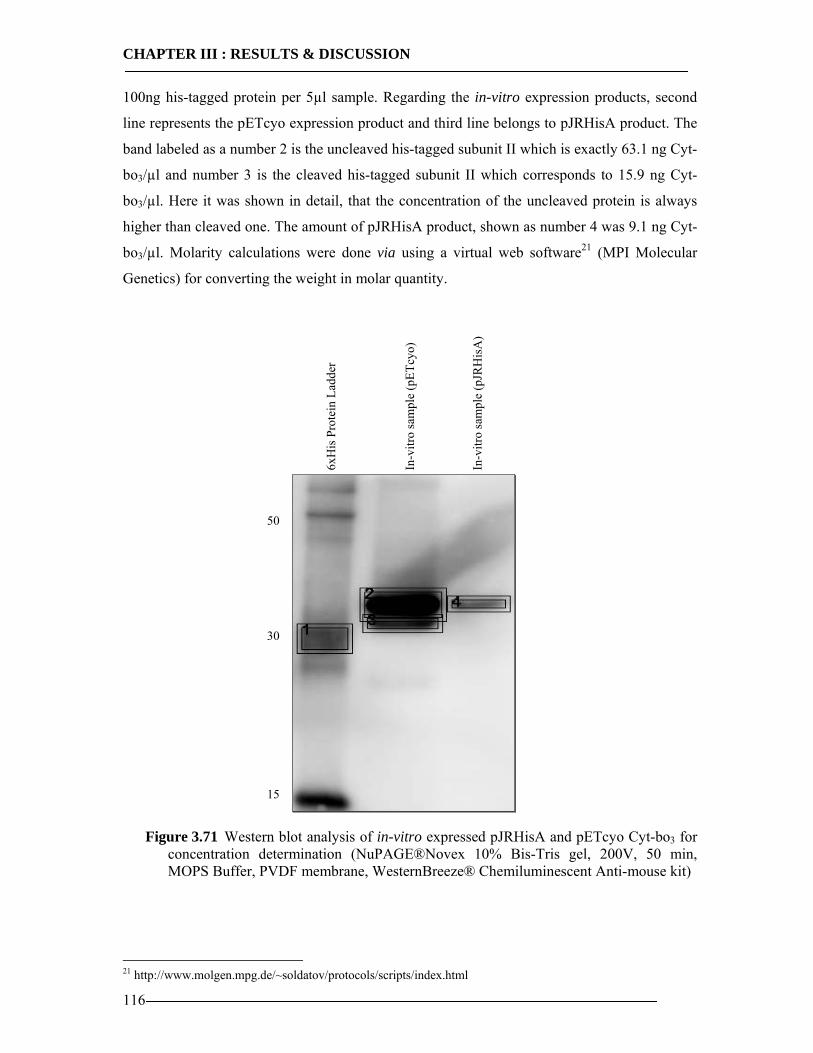
CHAPTER III : RESULTS & DISCUSSION
116
100ng his-tagged protein per 5µl sample. Regarding the in-vitro expression products, second
line represents the pETcyo expression product and third line belongs to pJRHisA product. The
band labeled as a number 2 is the uncleaved his-tagged subunit II which is exactly 63.1 ng Cyt-
bo3/µl and number 3 is the cleaved his-tagged subunit II which corresponds to 15.9 ng Cyt-
bo3/µl. Here it was shown in detail, that the concentration of the uncleaved protein is always
higher than cleaved one. The amount of pJRHisA product, shown as number 4 was 9.1 ng Cyt-
bo3/µl. Molarity calculations were done via using a virtual web software21 (MPI Molecular
Genetics) for converting the weight in molar quantity.
Figure 3.71 Western blot analysis of in-vitro expressed pJRHisA and pETcyo Cyt-bo3 for concentration determination (NuPAGE®Novex 10% Bis-Tris gel, 200V, 50 min, MOPS Buffer, PVDF membrane, WesternBreeze® Chemiluminescent Anti-mouse kit)
21 http://www.molgen.mpg.de/~soldatov/protocols/scripts/index.html
50
30
15
6xH
is P
rote
in L
adde
r
In-v
itro
sam
ple
(pET
cyo)
In-v
itro
sam
ple
(pJR
His
A)
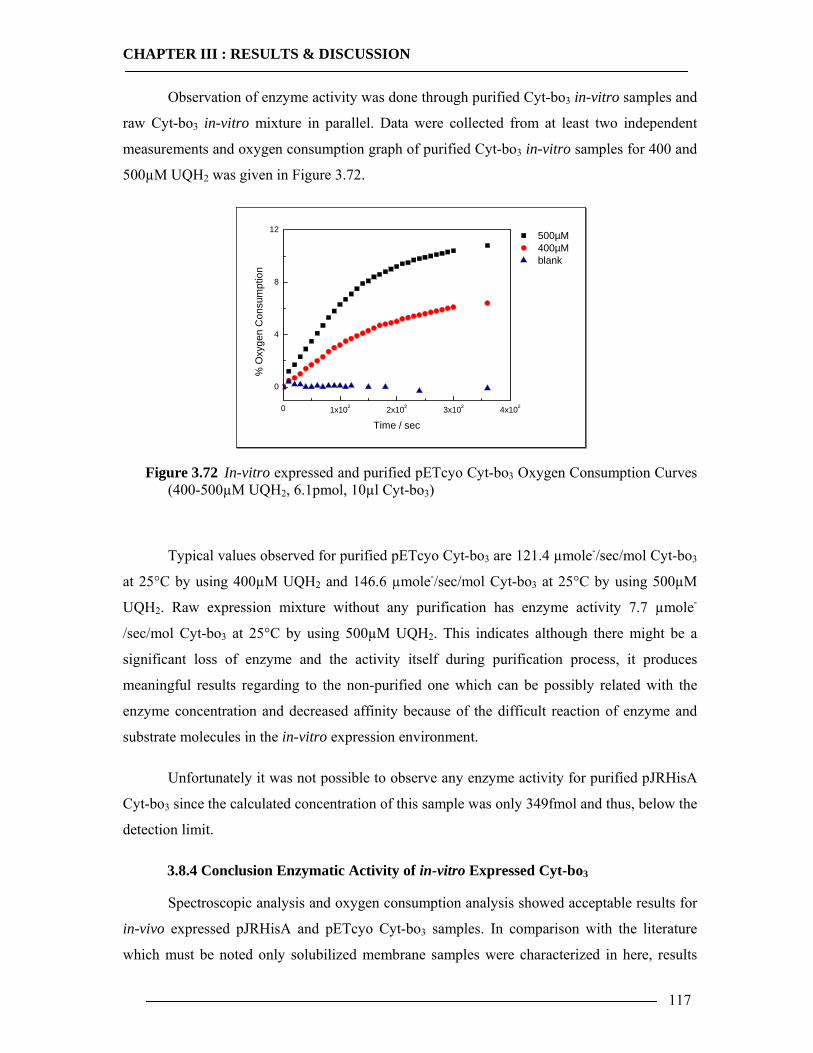
CHAPTER III : RESULTS & DISCUSSION
117
Observation of enzyme activity was done through purified Cyt-bo3 in-vitro samples and
raw Cyt-bo3 in-vitro mixture in parallel. Data were collected from at least two independent
measurements and oxygen consumption graph of purified Cyt-bo3 in-vitro samples for 400 and
500µM UQH2 was given in Figure 3.72.
0 1x10² 2x10² 3x10² 4x10²
0
4
8
12 500µM 400µM blank
% O
xyge
n C
onsu
mpt
ion
Time / sec
Figure 3.72 In-vitro expressed and purified pETcyo Cyt-bo3 Oxygen Consumption Curves (400-500µM UQH2, 6.1pmol, 10µl Cyt-bo3)
Typical values observed for purified pETcyo Cyt-bo3 are 121.4 µmole-/sec/mol Cyt-bo3
at 25°C by using 400µM UQH2 and 146.6 µmole-/sec/mol Cyt-bo3 at 25°C by using 500µM
UQH2. Raw expression mixture without any purification has enzyme activity 7.7 µmole-
/sec/mol Cyt-bo3 at 25°C by using 500µM UQH2. This indicates although there might be a
significant loss of enzyme and the activity itself during purification process, it produces
meaningful results regarding to the non-purified one which can be possibly related with the
enzyme concentration and decreased affinity because of the difficult reaction of enzyme and
substrate molecules in the in-vitro expression environment.
Unfortunately it was not possible to observe any enzyme activity for purified pJRHisA
Cyt-bo3 since the calculated concentration of this sample was only 349fmol and thus, below the
detection limit.
3.8.4 Conclusion Enzymatic Activity of in-vitro Expressed Cyt-bo3
Spectroscopic analysis and oxygen consumption analysis showed acceptable results for
in-vivo expressed pJRHisA and pETcyo Cyt-bo3 samples. In comparison with the literature
which must be noted only solubilized membrane samples were characterized in here, results
CHAPTER III : RESULTS & DISCUSSION
118
were in a good agreement regarding to UQH2 oxidation rate. Despite the fact the efficiency
difference in between pJRHisA plasmid and pETcyo plasmid, it did not affect the enzyme
activity.
The activity of in-vitro synthesized pETcyo Cyt-bo3 was apparently quite less than the
in-vivo expressed counterpart. This was not an unexpected result since the amount of enzyme
which is obtained from in-vitro system, is quite low comparing to in-vivo product.
Disregarding all limitations of the expression system and activity assay methods, promising
results were produced to verify the activity of in-vitro expressed Cyt-bo3 which correlates well
with western blot and SPFS characterization results.
CHAPTER IV : GENERAL CONCLUSION & OUTLOOK
119
4 General Conclusion & Outlook Components of the membrane system and the procedure were optimized for the
assembly of tethered bilayer lipid membranes (tBLM). The in-vitro synthesis and incorporation
of membrane proteins were investigated and furthermore their biosensing capabilities were
investigated in this artificial membrane system.
P19 spacer was self-assembled on gold surface and then EDC-NHS coupling was
performed to assemble phospholipid monolayer. Eight different phospholipids were
investigated to observe their influence on tBLM architecture and it was investigated by means
of CA and SPR. Membrane structures showed slight differences concerning their packing
density and fluidity, none of these model membranes represented the perfect planar membrane
structure. Nevertheless with this work it has been shown that proposed model membrane
architecture creates a quasi-natural environment for the incorporation of the aimed membrane
protein and for the activity observation. With the optimization of the platform, we had valuable
information not only about the insertion mechanism of the protein, but also minimum
requirements of the system to observe its functionality. With this approach, in-vitro synthesis
of the Cyt-bo3 and observation of its functionality was successfully achieved. Further
improvements and optimizations of the artificial membrane platform might be necessary to
increase incorporation efficiency and functionality.
Culture conditions were optimized to obtain high efficiency of purification. Isolation
and purification was done for the histidine tagged Cyt-bo3. Purified enzyme samples were used
for controlling protein insertion and functionality. For this reason, the quality of the
cytoplasmic membranes was sufficient enough to compare with the in-vitro counterparts. So,
further purification steps were not performed via using Ni-NTA affinity chromatography.
In-vitro expression of cytochrome bo3 ubiquinol oxidase was successfully achieved for
each pJRHisA, pETcyo and pRCO3 plasmids. Influence of expression mixture and promoter
type were examined and shown that E.coli extract is the best candidate for increased expression
efficiency. Besides, presence of T7 promoter increased the probability of the expression and
the best expression yield was produced by using T7 promoter which was cloned in pETcyo
plasmid. In parallel to these findings, SPFS results also confirmed the in-vitro expression of
Cyt-bo3 efficiently for both pJRHisA and pETcyo plasmids. Furthermore expression and
insertion was supported by western blot results of Cyt-bo3.
CHAPTER IV : GENERAL CONCLUSION & OUTLOOK
120
Additionally, insertion behavior for both in-vivo and in-vitro expressed Cyt-bo3 and
antibody adsorption effect was observed. As proposed, it was shown that insertion of a
membrane protein was favored in the presence of biomimetic membrane and insertion of
readily expressed protein does not happen. Another important finding was non-specific
interaction in between antibodies and the artificial membrane structure which cause to the
background effect or false positive signal in SPFS measurements. To prevent this non-specific
interaction, blocking solution was used and unoccupied places on the membrane surface were
covered with that.
Functionality of the in-vitro expression product was analysed by means of UQH2
oxidation rate and oxygen consumption. Enzyme activity was monitored for both in-vivo and
in-vitro expressed pJRHisA and pETcyo Cyt-bo3 samples. In a good agreement with SPFS
results, pETcyo expression product showed higher enzyme activity than pJRHisA product
depending on the presence of T7 promoter.
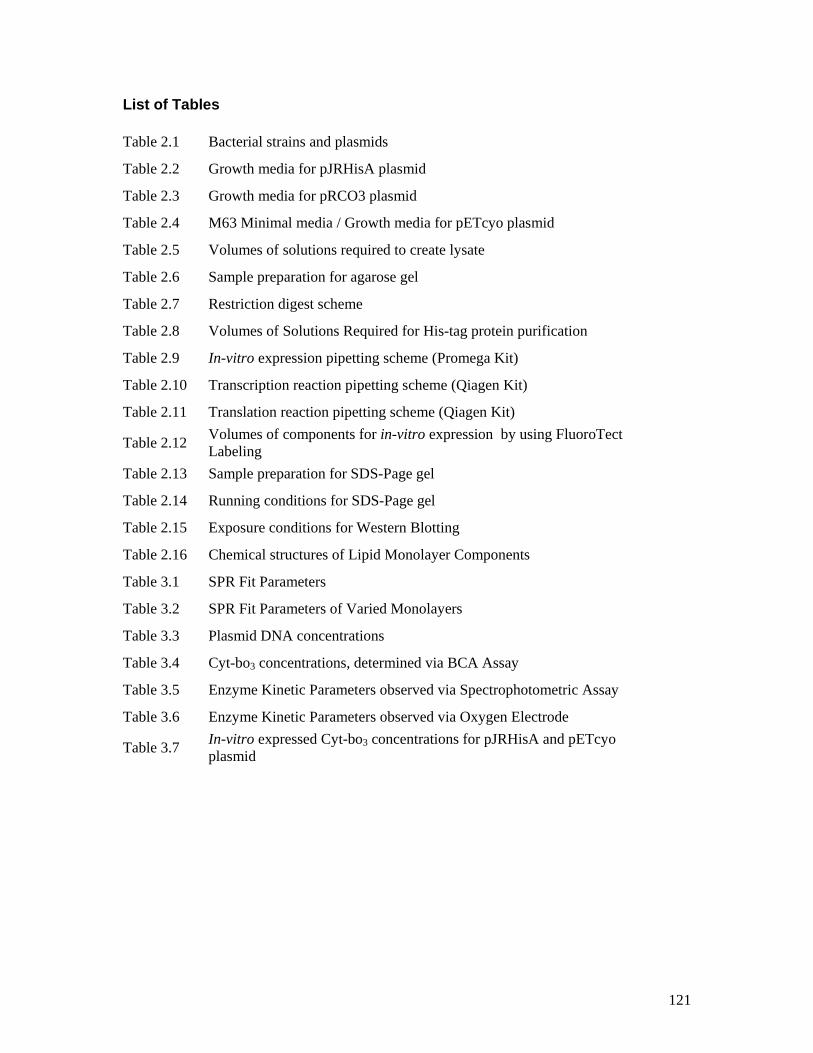
121
List of Tables
Table 2.1 Bacterial strains and plasmids
Table 2.2 Growth media for pJRHisA plasmid
Table 2.3 Growth media for pRCO3 plasmid
Table 2.4 M63 Minimal media / Growth media for pETcyo plasmid
Table 2.5 Volumes of solutions required to create lysate
Table 2.6 Sample preparation for agarose gel
Table 2.7 Restriction digest scheme
Table 2.8 Volumes of Solutions Required for His-tag protein purification
Table 2.9 In-vitro expression pipetting scheme (Promega Kit)
Table 2.10 Transcription reaction pipetting scheme (Qiagen Kit)
Table 2.11 Translation reaction pipetting scheme (Qiagen Kit)
Table 2.12 Volumes of components for in-vitro expression by using FluoroTect Labeling
Table 2.13 Sample preparation for SDS-Page gel
Table 2.14 Running conditions for SDS-Page gel
Table 2.15 Exposure conditions for Western Blotting
Table 2.16 Chemical structures of Lipid Monolayer Components
Table 3.1 SPR Fit Parameters
Table 3.2 SPR Fit Parameters of Varied Monolayers
Table 3.3 Plasmid DNA concentrations
Table 3.4 Cyt-bo3 concentrations, determined via BCA Assay
Table 3.5 Enzyme Kinetic Parameters observed via Spectrophotometric Assay
Table 3.6 Enzyme Kinetic Parameters observed via Oxygen Electrode
Table 3.7 In-vitro expressed Cyt-bo3 concentrations for pJRHisA and pETcyo plasmid
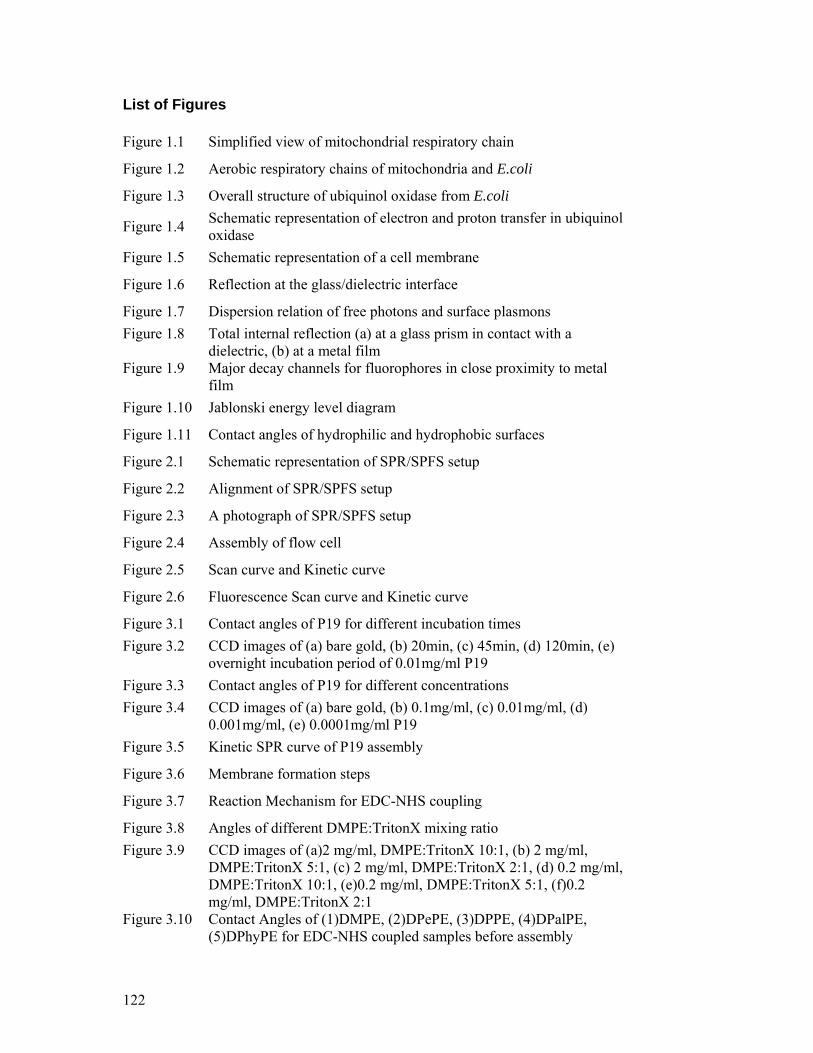
122
List of Figures
Figure 1.1 Simplified view of mitochondrial respiratory chain
Figure 1.2 Aerobic respiratory chains of mitochondria and E.coli
Figure 1.3 Overall structure of ubiquinol oxidase from E.coli
Figure 1.4 Schematic representation of electron and proton transfer in ubiquinol oxidase
Figure 1.5 Schematic representation of a cell membrane
Figure 1.6 Reflection at the glass/dielectric interface
Figure 1.7 Dispersion relation of free photons and surface plasmons Figure 1.8 Total internal reflection (a) at a glass prism in contact with a
dielectric, (b) at a metal film
Figure 1.9 Major decay channels for fluorophores in close proximity to metal film
Figure 1.10 Jablonski energy level diagram
Figure 1.11 Contact angles of hydrophilic and hydrophobic surfaces
Figure 2.1 Schematic representation of SPR/SPFS setup
Figure 2.2 Alignment of SPR/SPFS setup
Figure 2.3 A photograph of SPR/SPFS setup
Figure 2.4 Assembly of flow cell
Figure 2.5 Scan curve and Kinetic curve
Figure 2.6 Fluorescence Scan curve and Kinetic curve
Figure 3.1 Contact angles of P19 for different incubation times Figure 3.2 CCD images of (a) bare gold, (b) 20min, (c) 45min, (d) 120min, (e)
overnight incubation period of 0.01mg/ml P19
Figure 3.3 Contact angles of P19 for different concentrations Figure 3.4 CCD images of (a) bare gold, (b) 0.1mg/ml, (c) 0.01mg/ml, (d)
0.001mg/ml, (e) 0.0001mg/ml P19
Figure 3.5 Kinetic SPR curve of P19 assembly
Figure 3.6 Membrane formation steps
Figure 3.7 Reaction Mechanism for EDC-NHS coupling
Figure 3.8 Angles of different DMPE:TritonX mixing ratio Figure 3.9 CCD images of (a)2 mg/ml, DMPE:TritonX 10:1, (b) 2 mg/ml,
DMPE:TritonX 5:1, (c) 2 mg/ml, DMPE:TritonX 2:1, (d) 0.2 mg/ml, DMPE:TritonX 10:1, (e)0.2 mg/ml, DMPE:TritonX 5:1, (f)0.2 mg/ml, DMPE:TritonX 2:1
Figure 3.10 Contact Angles of (1)DMPE, (2)DPePE, (3)DPPE, (4)DPalPE, (5)DPhyPE for EDC-NHS coupled samples before assembly
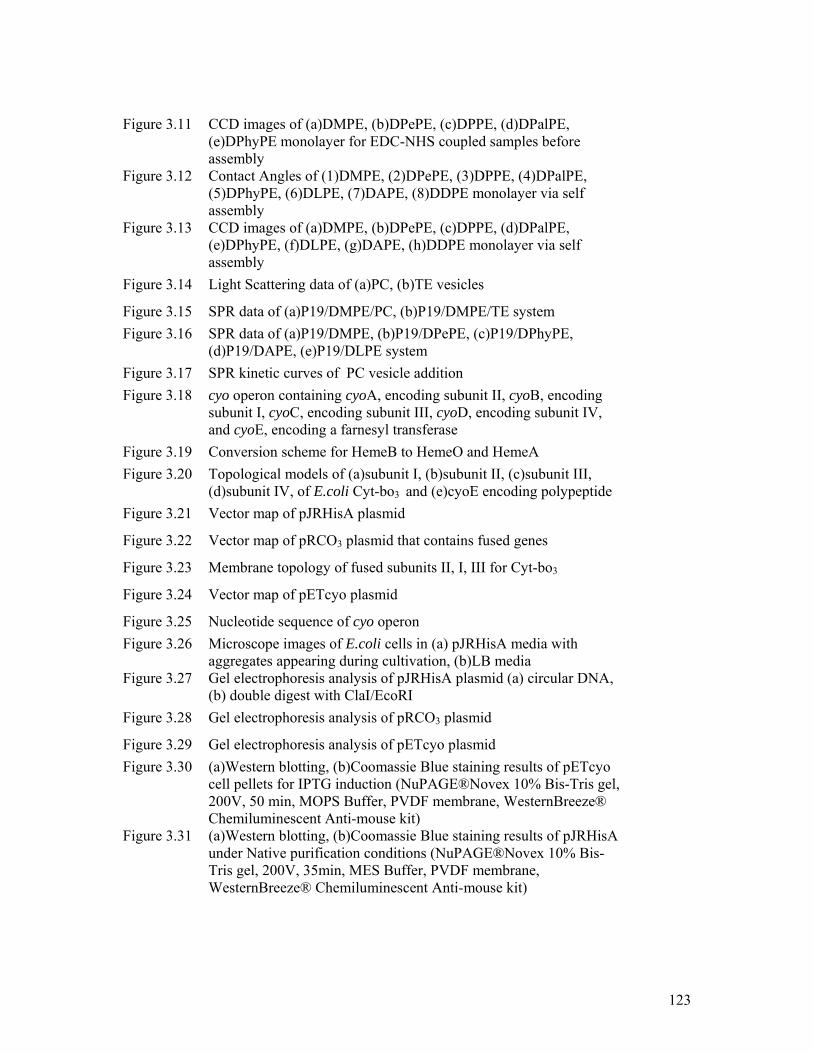
123
Figure 3.11 CCD images of (a)DMPE, (b)DPePE, (c)DPPE, (d)DPalPE,
(e)DPhyPE monolayer for EDC-NHS coupled samples before assembly
Figure 3.12 Contact Angles of (1)DMPE, (2)DPePE, (3)DPPE, (4)DPalPE, (5)DPhyPE, (6)DLPE, (7)DAPE, (8)DDPE monolayer via self assembly
Figure 3.13 CCD images of (a)DMPE, (b)DPePE, (c)DPPE, (d)DPalPE, (e)DPhyPE, (f)DLPE, (g)DAPE, (h)DDPE monolayer via self assembly
Figure 3.14 Light Scattering data of (a)PC, (b)TE vesicles
Figure 3.15 SPR data of (a)P19/DMPE/PC, (b)P19/DMPE/TE system Figure 3.16 SPR data of (a)P19/DMPE, (b)P19/DPePE, (c)P19/DPhyPE,
(d)P19/DAPE, (e)P19/DLPE system
Figure 3.17 SPR kinetic curves of PC vesicle addition Figure 3.18 cyo operon containing cyoA, encoding subunit II, cyoB, encoding
subunit I, cyoC, encoding subunit III, cyoD, encoding subunit IV, and cyoE, encoding a farnesyl transferase
Figure 3.19 Conversion scheme for HemeB to HemeO and HemeA Figure 3.20 Topological models of (a)subunit I, (b)subunit II, (c)subunit III,
(d)subunit IV, of E.coli Cyt-bo3 and (e)cyoE encoding polypeptide
Figure 3.21 Vector map of pJRHisA plasmid
Figure 3.22 Vector map of pRCO3 plasmid that contains fused genes
Figure 3.23 Membrane topology of fused subunits II, I, III for Cyt-bo3
Figure 3.24 Vector map of pETcyo plasmid
Figure 3.25 Nucleotide sequence of cyo operon Figure 3.26 Microscope images of E.coli cells in (a) pJRHisA media with
aggregates appearing during cultivation, (b)LB media
Figure 3.27 Gel electrophoresis analysis of pJRHisA plasmid (a) circular DNA, (b) double digest with ClaI/EcoRI
Figure 3.28 Gel electrophoresis analysis of pRCO3 plasmid
Figure 3.29 Gel electrophoresis analysis of pETcyo plasmid Figure 3.30 (a)Western blotting, (b)Coomassie Blue staining results of pETcyo
cell pellets for IPTG induction (NuPAGE®Novex 10% Bis-Tris gel, 200V, 50 min, MOPS Buffer, PVDF membrane, WesternBreeze® Chemiluminescent Anti-mouse kit)
Figure 3.31 (a)Western blotting, (b)Coomassie Blue staining results of pJRHisA under Native purification conditions (NuPAGE®Novex 10% Bis-Tris gel, 200V, 35min, MES Buffer, PVDF membrane, WesternBreeze® Chemiluminescent Anti-mouse kit)
124
Figure 3.32 (a)Western blotting, (b)Coomassie Blue staining results of pJRHisA under Denaturing purification conditions (NuPAGE®Novex 10% Bis-Tris gel, 200V, 50 min, MOPS Buffer, PVDF membrane, WesternBreeze® Chemiluminescent Anti-mouse kit)
Figure 3.33 (a)Western blotting, (b)Coomassie Blue staining results of pETcyo under Native purification conditions (NuPAGE®Novex 10% Bis-Tris gel, 200V, 50 min, MOPS Buffer, PVDF membrane, WesternBreeze® Chemiluminescent Anti-mouse kit)
Figure 3.34 (a)Western blotting, (b)Coomassie Blue staining results of pETcyo under Denaturing purification conditions (NuPAGE®Novex 10% Bis-Tris gel, 200V, 50 min, MOPS Buffer, PVDF membrane, WesternBreeze® Chemiluminescent Anti-mouse kit)
Figure 3.35 Western blot analysis of Cyt-bo3 expressed by pJRHisA strain (NuPAGE®Novex 10% Bis-Tris gel, 200V, 50 min, MOPS Buffer, PVDF membrane, WesternBreeze® Chemiluminescent Anti-mouse kit)
Figure 3.36 Western blot analysis of Cyt-bo3 expressed by pETcyo strain (NuPAGE®Novex 10% Bis-Tris gel, 200V, 50 min, MOPS Buffer, PVDF membrane, WesternBreeze® Chemiluminescent Anti-mouse kit)
Figure 3.37 Western blot analysis of in-vitro expressed Cyt-bo3 by pJRHisA strain (NuPAGE®Novex 10% Bis-Tris gel, 200V, 50 min, MOPS Buffer, PVDF membrane, WesternBreeze® Chemiluminescent Anti-mouse kit)
Figure 3.38 Western blot analysis of in-vitro expressed Cyt-bo3 by pETcyo strain (NuPAGE®Novex 10% Bis-Tris gel, 200V, 50 min, MOPS Buffer, PVDF membrane, WesternBreeze® Chemiluminescent Anti-mouse kit)
Figure 3.39 Western blot analysis of in-vitro expressed Cyt-bo3 by using Insect Kit for pJRHisA(lane3) and pETcyo(lane4) strain (NuPAGE®Novex 10% Bis-Tris gel, 200V, 50 min, MOPS Buffer, PVDF membrane, WesternBreeze® Chemiluminescent Anti-mouse kit)
Figure 3.40 Structure of FluoroTectTM GreenLys tRNA Figure 3.41 FluoroTectTM GreenLys labeling result of in-vitro expressed Cyt-bo3
for pRCO3 plasmid (NuPAGE®Novex 10% Bis-Tris gel, 200V, 50 min, MOPS Buffer, PVDF membrane, WesternBreeze® Chemiluminescent Anti-mouse kit)
Figure 3.42 Absorption and Fluorescence emission spectra of (a)Alexa Fluor647, (b)Cy5 conjugated antibody
Figure 3.43 Fluorescence kinetic of Cy5 conjugated antibody binding Figure 3.44 Fluorescence kinetic of Alexa Fluor 647 conjugated antibody
binding
Figure 3.45 SPFS scan of the system P19/DMPE/PC/PentaHis 1°Ab/Cy5 conjugated 2°Ab
Figure 3.46 SPFS scan of the system P19/DMPE/PC/Alexa Fluor 647 conjugated 1°Ab
125
Figure 3.47 SPFS scan of the system P19/DMPE/PC/Blocking Solution/Cy5 conjugated 2°Ab or P19/DMPE/PC/Blocking Solution/Alexa Fluor 647 conjugated 1°Ab
Figure 3.48 SPFS scan of the system (■) P19/DMPE/PC/in-vitro Cyt-bo3/PentaHis 1°Ab/Cy5-conjugated 2°Ab and (■) P19/DMPE/PC/in-vitro Cyt-bo3/Blocking Solution/ PentaHis 1°Ab/Cy5-conjugated 2°Ab
Figure 3.49 SPFS scan of the system (■) P19/DMPE/PC/in-vitro Cyt-bo3/Alexa Fluor 647 conjugated 2°Ab and (■) P19/DMPE/PC/in-vitro Cyt-bo3/Blocking Solution/Alexa Fluor 647 conjugated 2°Ab
Figure 3.50 SPFS scan of the system (■) P19/DMPE/PC/in-vivo Cyt-bo3/PentaHis 1°Ab/Cy5-conjugated 2°Ab and (■) P19/DMPE/PC/in-vivo Cyt-bo3/Blocking Solution/ PentaHis 1°Ab/Cy5-conjugated 2°Ab
Figure 3.51 SPFS scan of (■) P19/DMPE/PC/in-vitro Cyt-bo3 pJRHisA plasmid/Blocking Solution/PentaHis 1°Ab/Cy5-conjugated 2°Ab and (■) P19/DMPE/PC/in-vitro extract without DNA/Blocking Solution/ PentaHis 1°Ab/Cy5-conjugated 2°Ab
Figure 3.52 SPFS scan of (■) P19/DMPE/PC/in-vitro Cyt-bo3 pJRHisA plasmid/Blocking Solution/ Alexa Fluor 647 conjugated 2°Ab and (■) P19/DMPE/PC/in-vitro extract without DNA/Blocking Solution/ Alexa Fluor 647 conjugated 2°Ab
Figure 3.53 SPFS scan of (■) P19/DMPE/PC/in-vitro Cyt-bo3 pETcyo plasmid/Blocking Solution/PentaHis 1°Ab/Cy5-conjugated 2°Ab and (■) P19/DMPE/PC/in-vitro extract without DNA/Blocking Solution/ PentaHis 1°Ab/Cy5-conjugated 2°Ab
Figure 3.54 SPFS scan of (■) P19/DMPE/PC/in-vitro Cyt-bo3 pETcyo plasmid/Blocking Solution/ Alexa Fluor 647 conjugated 2°Ab and (■) P19/DMPE/PC/in-vitro extract without DNA/Blocking Solution/ Alexa Fluor 647 conjugated 2°Ab
Figure 3.55 SPFS scan of (■) P19/DMPE/TE/in-vitro Cyt-bo3 pETcyo plasmid/Blocking Solution/ Alexa Fluor 647 conjugated 2°Ab and (■) P19/DMPE/TE/in-vitro extract without DNA/Blocking Solution/ Alexa Fluor 647 conjugated 2°Ab
Figure 3.56 Western blot analysis of SPFS samples, in-vitro expressed Cyt-bo3 pJRHisA plasmid (NuPAGE®Novex 10% Bis-Tris gel, 200V, 50 min, MOPS Buffer, PVDF membrane, WesternBreeze® Chemiluminescent Anti-mouse kit)
Figure 3.57 Western blot analysis of SPFS samples, in-vitro expressed Cyt-bo3 pETcyo plasmid (NuPAGE®Novex 10% Bis-Tris gel, 200V, 50 min, MOPS Buffer, PVDF membrane, WesternBreeze® Chemiluminescent Anti-mouse kit)
Figure 3.58 Reduced minus Oxidized spectra of Cyt-bo3 pJRHisA clone
Figure 3.59 Reduced minus Oxidized spectra of Cyt-bo3 pETcyo clone
Figure 3.60 Spectrophotometric properties of in-vitro expressed Cyt-bo3
Figure 3.61 Ubiquinone-Ubiquinol conversion
Figure 3.62 Oxidation/Reduction cycle of Ubiquinol-1/Ubiquinone-1 couple
126
Figure 3.63 UQ Calibration curve Figure 3.64 UQH2 Consumption Curve of pETcyo Cyt-bo3 (200µM UQH2,
0.65µM, 30µl Cyt-bo3)
Figure 3.65 pJRHisA Cyt-bo3 UQH2 Consumption/Enzyme Activity Curves (50nM, 30µl Cyt-bo3)
Figure 3.66 Lineweaver-Burk plot of pJRHisA Cyt-bo3 Figure 3.67 pETcyo Cyt-bo3 UQH2 Consumption/Enzyme Activity Curves
(50nM, 30µl Cyt-bo3)
Figure 3.68 Lineweaver-Burk plot of pETcyo Cyt-bo3 Figure 3.69 pETcyo Cyt-bo3 Oxygen Consumption Curves (200-500µM UQH2,
4µM, 3µl Cyt-bo3)
Figure 3.70 Lineweaver-Burk plot of pETcyo Cyt-bo3 obtained from Oxygen electrode
Figure 3.71 Western blot analysis of in-vitro expressed pJRHisA and pETcyo Cyt-bo3 for concentration determination (NuPAGE®Novex 10% Bis-Tris gel, 200V, 50 min, MOPS Buffer, PVDF membrane, WesternBreeze® Chemiluminescent Anti-mouse kit)
Figure 3.72 In-vitro expressed and purified pETcyo Cyt-bo3 Oxygen Consumption Curves (400-500µM UQH2, 6.1pmol, 10µl Cyt-bo3)
127
References
Abramson, J., Riistama, S., Larsson, G., Jasaitis, A., Svensson-Ek, M., Laakkonen, L., Puustinen, A., Iwata, S., Wikström, M., (2000) Nature Structural Biology, 7, 10, 910
Atanasov, V., Atanasov, P., Vockenroth, I., Knorr, N., Köper, I., (2006) Bioconjugated Chem., 17, 631
Attridge, J. W., Daniels, P. B., Deakon, J. K., Robins, G. A., Davidson, G. P., (1991) Biosensors & Bioelectronics, 6, 201
Austin, S., Friedman, S., Ludtke, D., (1986) Journal of Bacteriology, 168-2, 1010
Babcock, G. T., Wikström, M., (1992) Nature, 356, 301
Benecke, R., Strümper, P., Weiss, H., (1993) Brain, 116, 6, 1451
Berg, J. M., Tymoczko, J. L., Stryer, L., (2002) Biochemistry, 5th Edt., W. H. Freeman Co., NewYork.
Bowie, J. U., (2001) Curr. Op. Struct. Biol., 11, 397
Bowie, J. U., (2005) Nature, 438, 581
Brandt, U. (1997) Biochim. Biophys. Acta, 1318, 79
Chan, Y. H. M., Boxer, S. G., (2007) Current Opinion in Chemical Biology, 11, 6, 581
Chepuri, V., Gennis, R.B., (1990) The Journal of Biological Chemistry, 265, 22, 12978
De Gennes, P., (1985) Reviews of Modern Physics, 57, 827
Edwards, D. A., Schneck, F., Zhang, I., Davis, A. M. J., Chen, H., Langer, R., (1996) Boiphys. J., 71, 1208
Ferguson-Miller, S., Babcock, G. T., (1996) Chem. Rev., 96, 2889
FluoroTectTM GreenLys in vitro Translation Labelling System, (2007) Technical Bulletin, Promega
Förch. R., Schönherr, H., Jenkins, A. T. A., (2009) Surface Design: Applications in Bioscience and Nanotechnology, WILEY-VCH Verlag GmbH & Co.
Frericks, H. L., Zhou, D. H., Yap, L. L., Gennis, R. B., (2006) Journal of Biomolecular NMR, 36, 55
Garcia-Horsman, J. A., Barquera, B., Rumbley, J., Ma, J., Gennis, R. B., (1994) J. Bacteriol., 176, 18, 5587
Gardner, A., Boles, R. G., (2005) Curr. Psych. Reviews, 1, 3, 255
Gennis, R. B., (1991) Biochimica Biophysica Acta, 1058, 21
Giess, F., Friedrich, M. G., Heberle, J., Naumann, R., (2004) Biophysical Journal, 87, 5, 3213
Haas, R. H., Nasirian, F., Nakano, K., Ward, D., Pay, M., (1995) Ann. Neurol., 37, 714
Helm, C. A., Israelachvili, J. N., (1993) Methods in Enzymology, 220, 130
128
Hendler, R. W., Pardhasaradhi, K., Reynafarje, B., Ludwig, B., (1991) Bioohys. J., 60, 415
Henze, K., Martin, W., (2003) Nature, 426, 6963, 127
Heyse, S., Stora, T., Schmid, E., Lakey, J. H., Vogel, H., (1998) Biochimica Biophysica Acta, 88507, 319
Israelachvili, J. N., Marcelja, S., Horn, R. G., (1980) Quarterly Reviews of Biophysics, 13, 121
Kasianowicz, J. J., Brandin, E., Branton, D., Deamer, D. W., (1996) Proc. Natl. Acad. Sci., 102, 12377
Katzen, F., Chang, G., Kudlicki, W., (2005) Trends in Biotechnology, 23, 3, 150
Knobloch, H., Brunner, A., Leitner, A., Aussenegg, F., Knoll, W., (1993) Journal of Chemical Physics, 98, 10093
Knoll, W., (1998) Annual Reviews of Physics and Chemistry, 49, 569
Knoll, W., Frank, C. W., Heibel, C., Naumann, R., Offenhauser, A., Rühe, J., Schmidt, E. K., Shen, W. W., Sinner, A., (2000) Reviews in Molecular Biotechnology, 74, 137
Knoll, W., Köper, I., Naumann, R., Sinner, E. K., (2008) Electrochimica Acta, 53, 23, 6680
Köper, I., (2007) Molecular BioSystems, 3, 10, 651
Kretschmann, E., Raether, H., (1968) Z. Naturforsch. A., 23, 2135
Kretschmann, E., (1971) Zeitschrift für Physik, 241, 313
Lakowicz, J. R., (1999) Principles of Fluorescence Spectroscopy, 2nd Edt., Kluwer Academic/Plenum, NewYork.
Lemieux, L. J., Calhoun, M. W., Thomas, J. W., Ingledew, W. J., Gennis, R. B., (1992) The Journal of Biological Chemistry, 267-3, 2105
Liebermann, T., Knoll, W., (2000) Colloids and Surfaces, 171, 115
Lodish, H., Berk, A., Zipursky, S. L., Matsudaira, P., Baltimore, D., Darnell, J., (2000) Molecular Cell Biology, 4th Edt., W. H. Freeman Co., NewYork.
Ma, J., Lemieux, L., Gennis, R. B., (1993) Biochemistry, 32, 7692
Ma, J., Katsonouri, A., Gennis, R. B., (1997) Biochemistry, 36,11298
McBride, H. M., Neuspiel, M., Wasiak, S., (2006) Curr. Biol., 16, 14, 551
Mitchell, P., (1961) Nature, 191, 144
Mitchell, P., (1976) J. Theor. Biol., 62, 327
Molecular Probes, Invitrogen, Online Datasheet
Morrison, S.M., Cricco, J.A., Hegg, E.L., (2005) Biochemistry, 44, 12554
Munro, J. C., Frank, C. W., (2004) Langmuir, 20, 10567
129
Nelson, D. L., Cox, M. M., (2005) Lehninger Principles of Biochemistry, 4th Edt., W. H. Freeman Co, NewYork.
Neumann, T., (2001) Strategies for Detecting DNA Hybridisation Using Surface Plasmon Fluorescence Spectroscopy, Dissertation Thesis, Johannes Gutenberg University
Nirenberg, M. W., Matthaei, J. H., (1961) Proc. Natl. Acad. Sci., 47, 1588
Ottava, A., Tvarozek, V., Racek, J., Sabo, J., Ziegler, V., Hianik, T., Tien, H., (1997) Supramolecular Science, 4, 101
Otto, A., (1968) Zeitschrift für Physik, 216, 398
Pizzo, P., Pozzan, T., (2007) Trends Cell Biol., 10, 511
Puustinen, A., Wikstrom, M., (1991) Proc. Natl. Acad. Sci., 88, 6122
Puustinen, A., Morgan, J. E., Verkhovsky, M., Thomas, J. W., Gennis, R. B., Wikstrom, M., (1992) Biochem., 31, 10363
Raether, H., (1988) Surface Plasmon on Smooth and Rough Surfaces and on Gratings, Springer, Berlin.
Raguse, B., Braach-Maksvytis, V., Cornell, B. A., King, L. G., Osman, P. D. J., Pace, R. J., Wieczorek, L., (1998) Langmuir, 14, 648
Redfearn, E. R., (1967) Methods in Enzymology, 10, 381
Rieske, J. S., (1967) Methods in Enzymology, 239
Riistama, S., (2000) Structural and Functional Studies of Bacterial Heme-Copper Oxidases, Academic Dissertation, University of Helsinki
Robelek, R., Lemker, E., Wiltschi, B., Kirste, V., Oesterhelt, D., Sinner, E.K., (2007) Angewandte Chemie-International Edition, 46(4), 605
Rumbley, J. N., Analysis of Heme-Copper Ligation, Quinol Activity and Ligand Binding Kinetics of Cytochrome bo3 Quinol Oxidase from E.coli, Dissertation Thesis (1995), University of Illinois at Urbana-Champaign
Rumbley, J. N., Furlong Nickels, E., Gennis, R.B., (1997) Biochim Biophys Acta, 1340, 131-142
Sackmann, E., (1996) Science, 271, 43
Sambrook, J., Russell, D. W., (2001) Molecular Cloning A Laboratory Manual, 3rd Edt., Cold Spring Harbor Laboratory Press, NewYork.
Saraste, M., (1999) Science, 283, 1488
Schiller, S., Naumann, R., Lovejoy, K., Kunz, H., Knoll, W., (2003) Angewandte Chemie International Edition, 42, 208
Sell, P. J., Neumann, A. W., (1966) Angewandte Chemie, 78, 321
Sherer, T. B., Betarbet, R., Greenamyre, J. T., (2002) Neuroscientist, 8, 3, 192
Singer, S. J., Nicolson, G. L., (1972) Science, 175, 720
130
Sinner, E. K., Knoll, W., (2001) Curr. Op. Chem. Biol., 5, 6, 705
Spinke, J., Liley, M., Guder, H. J., Angermaier, L., Knoll, W., (1993) Langmuir, 9, 1821
Spirin, A. S., Swartz, J. R., (2008) Cell-free Protein Synthesis, WILEY-VCH Verlag GmbH & Co.
Subrahmaniam, Y., Alves, I. D., Salgado, G. F. J., Lau, P. W., Wysocki, R. J., Salamon, Z., Tollin, G., Hruby, V. J., Brown, M. F., Saavedra, S. S., (2005) JACS Comm., 127, 5320
Tanford, C., (1980) The hydrophobic effect: Formation of Micelles and Biological Membranes, 2nd Edt., John Wiley & Sons Inc.
Taylor, R. W., Turnbull, D. M., (2005) Nat. Rev. Genet., 6, 5, 389
Trumpower, B. L., (1990) J. Biol. Chem., 265, 11409
Tsubaki, M., Mogi, T., Hori, H., Hirota, S., Ogura, T., Kitagawa, T., Anraku, Y., (1994) J. Biol. Chem, 269, 30861
Ulman, A., (1991) An Introduction to Ultrathin Organic Films, Academic Press, London.
van der Oost, J., Lappalainen, P., Musacchio, A., Warne, A., Lemieux, L., Rumbley, J., Gennis, R.B., Aasa, R., Pascher, T., Malmstrom, B.G., and Saraste, M., (1992) EMBO J., 11, 3209
Vasilev, K., Knoll, W., Kreiter, M., (2004) Journal of Chemical Physics, 120, 3439
Vockenroth, I. K., (2007) Investigation of Tethered Bilayer Lipid Membranes for Their Potential Use in Biosensing Devices, Dissertation Thesis, University of Bath
Vockenroth, I. K., Atanasova, P. P., Jenkins, A. T. A., Köper, I., (2008) Langmuir, 24, 2, 496
Winterhalter, M., (2000) Current Opinion in Colloid & Interface Science, 5, 250
Yu, F., Yao, D., Knoll, W., (2003) Analytical Chemistry, 75, 2610
Zeviani, M., Di Donato, S., (2004) Brain, 127, 2153
Zhao, J., Tamm, L. K., (2003) Langmuir, 19, 1838
www.molgen.mpg.de/~soldatov/protocols/scripts/index.html