Embed Size (px)
Citation preview
____________________________________________________________________________________________
*Corresponding author: Email: [email protected];
European Journal of Nutrition & Food Safety3(4): 134-145, 2013
SCIENCEDOMAIN internationalwww.sciencedomain.org
In vitro Starch Digestibility and NutritionalComposition of Improved Rice Varieties from
Cameroun
Amaka M. Odenigbo1,2, Sali Atanga Ndindeng 3, Chijioke A. Nwankpa1,Noe Woin3 and Michael Ngadi1*
1Department of Bioresource Engineering, McGill University, 21111 Lakeshore Road, Ste-Anne-de-Bellevue, Quebec, H9X 3V9, Canada.
2Department of Human Nutrition and Dietetics, Michael Okpara University of Agriculture,Umudike, Nigeria.
3IRAD, Yaounde, Cameroon.
Author’s contribution
This work was carried out in collaboration between all authors. Authors AMO and MNdesigned the study, performed the statistical analysis, wrote the protocol, and wrote the firstand final draft of the manuscript. Authors CAN, SAN and NW contributed to the analyses of
the study. All authors read and approved the final manuscript.
Received 1st June 2013Accepted 2nd October 2013
Published 6th November 2013
ABSTRACT
Aims: Resistant starch (RS), kinetics of starch digestion, predicted glycemic index (pGI)and nutritional composition were determined in two improved rice varieties fromCameroun.Place and Duration of Study: Department of Bioresource Engineering, McGill University,Canada between December 2012 and March 2013.Methodology: Non-parboiled and parboiled samples of TOX 3145 and NERICA-3varieties were involved in this study. An in vitro enzymatic starch digestion method wasapplied to measure starch digestibility parameters. Standardized methods were adoptedfor proximate and mineral contents evaluation.Results: The parboiled samples had significantly higher (P<0.05) resistant starch (8.35 -11.07%) than the non-parboiled samples (3.81 - 4.84%). The values for pGI among
Original Research Article
European Journal of Nutrition & Food Safety, 3(4): 134-145,, 2013
135
samples ranged from 57.57 to 67.78%. Significantly higher values for protein,phosphorus and potassium were found among the parboiled samples (P<0.05). Nutritionalcomposition was positively related to RS while pGI had inverse relationship with protein,ash, fat, phosphorus, potassium and RS.Conclusion: Starch digestibility of these rice varieties was associated to their nutritionalcomposition.
Keywords: Starch digestibility; milled rice; parboiling; resistant starch, improved rice variety;nutritional composition.
1. INTRODUCTION
Rice has become a staple food and a major source of energy in Cameroun [1]. Theincreased consumption rate of rice has made the screening of its glycemic index a relevantarea of research interest. Glycemic index (GI) is a property of starchy food, which describesthe rate of blood glucose absorption after consumption [2].
Milled rice is predominantly, starchy endosperm with a higher glycemic index compared tobrown rice that contains the outer bran and germ portions [3]. In the process of milling,removal of only husk from paddy results to production of brown rice while removal of branand most of the germ layer leads to production of milled rice (white rice).
Nutrients are more concentrated in the bran than the endosperm. It is a known fact thatmilling reduces the nutritional composition of rice grain, but on the other hand, the millingprocesses remove a large proportion of the anti-nutrient such as phytate, which mightadversely affect the utilization of some of the nutrients [4]. The milled rice could be parboiled(parboiled milled grain) or non-parboiled (raw milled grain). Parboiling process involves threeoperations namely; soaking, steaming and drying of paddy.
The techniques in parboiling vary from traditional method to more sophisticated procedures[5]. These various parboiling operation differ in degree and intensity of temperature as wellas soaking and steaming duration. The grain of parboiled rice is modified by the processesof soaking in hot water, steaming and drying it undergoes and this parboiled grain is notclassed as cooked rice.
Thus, parboiled milled rice are grains of paddy which are milled after the process ofparboiling whereas, non-parboiled milled rice are grains from milled raw paddy not subjectedto parboiling process.
Doesthale et al. [6] studied the effect of milling on nutrient loss in parboiled and non-parboiled rice grain. Their study reported significantly lower milling losses for nutrients inparboiled than non-parboiled rice. Higher concentration of nutrient found in parboiled ricewas attributed to nutrient solubilization and migration to the centre of the grain during starchgelatinization which occurs during the parboiling process [7,8].
However, Heinemann et al. [7] pointed the lack of uniformity in commercial parboilingprocesses in different countries as a hindrance to the conclusion of superior nutritionalbenefits of parboiled rice.
European Journal of Nutrition & Food Safety, 3(4): 134-145,, 2013
136
The benefits of parboiled rice grain over non-parboiled apart from firmer, stronger, less stickygrains, increase of milling recovery and decrease of cooking losses include increase inresistance starch fraction and lower glycemic index [9-12].
Resistant starch (RS) escapes enzymatic hydrolysis in the upper gastrointestinal tract whichrenders this fraction of starch unavailable to digestion with consequent reduction of post-prandial response. The relationship between RS and glycemic index of food had beendescribed [13,12].
Modern research efforts of both national and international organizations have contributed tothe improvement and development of newly improved rice varieties. The New Rice for Africa(NERICA) developed by AfricaRice (formerly West Africa Rice Development Association) areproducts of hybridization between the cultivated rice species of Oryza glaberrima and Oryzasativa [14]. In addition to the desirable agronomic characteristics (high yield, early maturityand resistant to drought, pests, diseases) of the improved varieties, the protein content ishigh [15,16].
The influence of protein content [17,18], moisture content [19], phosphorus contents[20,21,22] and resistant starch [23,24] on starch digestibility have been demonstrated. Withthe progressive release of newly improved rice varieties, it is relevant to evaluate thenutritional potential and glycemic index of each variety in order to provide optimal nutritionbenefits to consumers.
There is paucity of literature data on nutritional composition and starch digestibility of newlyimproved rice varieties in different processed forms. This study aimed to screen the resistantstarch fractions, predicted glycemic index, starch hydrolysis kinetics, proximate and mineralcomposition of two improved rice varieties grown in Cameroun.
2. MATERIALS AND METHODS
2.1 Samples
TOX 3145 and NERICA-3 rice varieties are improved lines of Oryza sativa L originated fromAfricaRice. Samples of freshly harvested paddy of these two varieties were collected from arice farmer in Ndop, Northwest Region of Cameroun. The varieties were harvested bypanicle picking and separated into three portions. A portion from each rice variety was notparboiled (NP), dried to 12% moisture content before milling (NERICA-NP and TOX-NPsamples). The other two portions from each variety were parboiled by two different methods,and then dried to moisture content of 14%.
Parboiled TOX 3145 variety was treated by Traditional (TOX-Trad samples) and IRAD-direct(TOX-IRAD) parboiling techniques.
Traditional parboiling was carried out by a farmer's group well known for parboiling rice at asemi-industrial scale in Cameroun. This traditional procedure involved no pre-cleaning ofpaddy, longer soaking and steaming time (18-20 hrs), soaking temperature of 80 ºC, non-uniform distribution of steam during steaming with traditional cooking equipment (barreldrums) and a three stone fire place.
European Journal of Nutrition & Food Safety, 3(4): 134-145,, 2013
137
The IRAD-direct parboiling was also carried out by the same farmer's group but theprocedure involved an improved direct parboiling technology which has been code named aUniform-Steam Parboiling system in IRAD (Unpublished report). The duration for soakingwas 12 hrs at 80 ºC. This technique involved use of an improved steaming equipment(Vessel, stand, steam basket) and improved parboiling stove to ensure uniform distributionof steam.
On the other hand, NERICA-3 variety was parboiled by both subsets of IRAD parboilingprocess IRAD-direct and IRAD-indirect parboiling techniques.
Direct parboiling technique involves putting the rough rice (paddy) in water, placed on thefire before heated to 80 ºC. At 80 ºC temperature, the paddy was removed from the fire andleft to stand in the water for 12 hr.
For indirect parboiling, water was heated to boiling point (98 ºC) and poured on paddy whilestirring. The paddy was then left to stand in the water for 12 hr.
Both parboiled and non-parboiled samples were dehusked with Satake rice husker (THU35A, Satake, Engineering Co. Ltd., Tokyo) and milled by a commercial roll milling facility.The milled rice grains were then brought to McGill University, Canada for analysis.
2.1.1 Sample preparation for analysis
2.1.1.1 Raw samples
Grains of the rice samples were individually ground using a coffee grinder (SUMEET MultiGrind, India) and passed through a 60 mesh (0.25 mm) sieve (CE Tyler, Ontario, Canada).
2.1.1.2 Cooked samples
Weight of 50±0.05 mg sample was weighed into capped tube and boiled in tap water (5 mL)for 30 min. Cooked samples were homogenized in cooking water for 1 min using Tissue-Tearor homogenizer (Biospec Products. Inc.) with controlled speed (level 2). The in vitrostarch digestibility analysis commenced immediately after homogenization [25].
2.2 Nutritional Composition
Nutrient composition was determined by standard methods of the Association of the OfficialAnalytical Chemists [26]. Moisture was estimated by drying in an oven at 105 °C untilconstant weight; ash contents by combustion of sample at temperature of 550 °C in mufflefurnace; protein by nitrogen determination using Leco Nitrogen Analyzer (N x 6.25) while fatdetermination was by Soxhlet extraction using petroleum ether as solvent. The totalcarbohydrate content was determined by difference using the following formula: 100 -(weight in grams [protein + fat + water + ash] in 100 g sample).
Concentrations of phosphorus, potassium, iron and magnesium were determined bydigestion of ground sample at 340 ºC using a digestion mixture of sulfuric acid, peroxide(30%), lithium and selenium. After digestion, phosphorus was estimated colorimetrically atthe wavelength of 880 nm on a flow injector analyzer instrument (QuickChem series 8000,Lachat Instruments, CO, USA). Potassium, magnesium and iron were measured with a
European Journal of Nutrition & Food Safety, 3(4): 134-145,, 2013
138
flame atomic absorption spectrophotometer (Perkin-Elmer 2380, Norwalk, Connecticut,USA).
2.3 Starch Fractions and Predicted Glycemic Index (pGI)
An in vitro method based on the procedure of Goni et al. [25] was adopted for determinationof predicted glycemic index (pGI). The resistant starch (RS), digestible starch (DS) and totalstarch (TS) were measured according to AOAC 2002.02 using the Megazyme RS kit(Megazyme, Bray, Ireland).
2.4 Statistical Analysis
The experimental design consisted of two rice varieties (TOX 3145 and NERICA-3)subjected to three treatments (non-parboiled, two differently parboiled techniques) totalling 6samples.
Data were expressed as mean±standard deviation of four replicate measurements. Variationin levels of starch fractions among samples were tested by a one way analysis of variance(ANOVA). The difference between means was determined by Scheffe's multiple comparisonprocedure test (P<0.05). Statistical software used was SAS version 9.3 (SAS Institute Inc.,Cary, NC, USA). The kinetic parameters were calculated by a nonlinear regression inMATLAB (Version 7.6.0.324 R2008a, The Mathworks, Inc., Natick, MA, USA).
3. RESULTS
Proximate composition showed that protein and ash contents among samples rangedbetween 8.97 -14.98% and 0.52-1.19% dry matter, respectively (Table 1). The fat contentamong samples was statistically similar (P>0.05).
TOX-NP sample had the lowest values for fat (0.39%), protein (8.97%) and highestcarbohydrate content (90.08%). The lowest ash content was observed in NERICA-NP(0.52%). However, NERICA-Direct had a significant highest protein content (14.98%) andlowest carbohydrate content (83.66%).
Generally, the parboiled samples had higher content of ash, protein and lower carbohydratecompared to their non-parboiled counterparts.
Table 1. Proximate composition of TOX 3145 and NERICA-3 varieties (% dry matter)
Samples Fat%
Ash%
Protein%
Carbohydrate%
TOX- NP 0.39±0.06a 0.57±0.04b 8.97±0.08d 90.08±0.01a
TOX- IRAD 0.44±0.03a 0.88±0.01ab 10.83±0.11c 87.85±0.06b
TOX-Trad 0.58±0.01a 1 .19±0.26a 12.52±0.14b 85.71±0.11c
NERICA-NP 0.51±0.15a 0.52±0.00b 10.35±0.71cd 88.63±0.86ab
NERICA-Indirect 0.51±0.01a 0.83±0.01ab 11.31±0.18bc 87.36±0.19bc
NERICA-Direct 0.60±0.10a 0.76±0.01ab 14.98±0.12a 83.66±0.00d
Mean±SD values with the same superscript letters in a column are not significantly different (P>0.05)
European Journal of Nutrition & Food Safety, 3(4): 134-145,, 2013
139
Table 2 presented varied concentration of phosphorus, potassium, magnesium and ironcontents ranging from 0.176 to 0.289 g/100 g; 0.266 to 0.369 g/100 g; 0.173 to 0.281 g/100g and 0.0 to 0.017 g/100 g, respectively.
Phosphorus and potassium composition in parboiled samples were significantly higher(P<0.05) compared to their non-parboiled counterparts.
Table 2. Mineral composition of TOX 3145 and NERICA-3 varieties (g/100 g dry matter)
Samples Phosphorus Potassium Magnesium IronTOX- NP 0.186±0.002d 0.273±0.006b 0.185±0.003ab 0.007±0.000ab
TOX- IRAD 0.237±0.0.001c 0.369±0.002a 0.173±0.005b 0.004±0.600b
TOX-Trad 0.274±0.007b 0.341±0.020a 0.281±0.050a 0.017±0.006a
NERICA-NP 0.246±0.005c 0.266±0.006b 0.246±0.001ab 0.001±0.000b
NERICA-Indirect 0.289±0.001a 0.359±0.020a 0.248±0.001ab 0.000±0.000b
NERICA-Direct 0.236±0.003c 0.280±0.007b 0.214 ±0.013ab 0.000±0.000b
Mean±SD values with the same superscript in a column are not significantly different (P>0.05)
The starch fractions of TOX 3145 and NERICA-3 rice samples are presented in Table 3. Thevariation in TS among samples (82.19 - 89.44%) was not statistically different(P>0.05). The most predominant fraction of the TS was the DS fraction which variedbetween 72.22 to 85.63%.
The fraction of RS ranged from 3.81 to 11.07 %. Highest value for RS was observedin TOX-IRAD (11.07%) while the two non-parboiled samples (TOX-NP and NERICA-NP)showed significantly lowest RS values (P<0.05). TOX-NP had the highest DS (85.63%) whileNERICA-Direct had lowest DS (72.22%).
The comparison of samples between different parboiling techniques showed that TOX-IRADhad a higher RS (11.07%) with lower DS (76.08%) than its counterpart, TOX-TP (8.82 and78.67%, respectively). Similar pattern was observed in samples of NERICA-3 variety.NERICA-Direct had higher RS (10.36%) with lower DS (72.22%) compared to NERICA-Indirect (8.35 and 75.95%, respectively).
Table 3. Starch fractions of TOX 3145 and NERICA-3 varieties (% dry matter)
Samples RS DS TSTOX- NP 3.81±0.97b 85.63±6.88a 89.44±6.45a
TOX- IRAD 11.07±3.09a 76.08±5.40ab 87.15±2.39a
TOX-Trad 8.82±2.66a 78.67±8.13ab 87.48±5.57a
NERICA-NP 4.84±0.13b 77.35±2.10ab 82.19±2.24a
NERICA-Indirect 8.35±0.86a 75.95±2.83ab 84.30±3.63a
NERICA-Direct 10.36±0.24a 72.22±3.36b 82.57±3.58a
Mean±SD values with the same superscript in a column are not significantly different (P>0.05)TS= total starch; DS= digestible starch; RS= resistant starch.
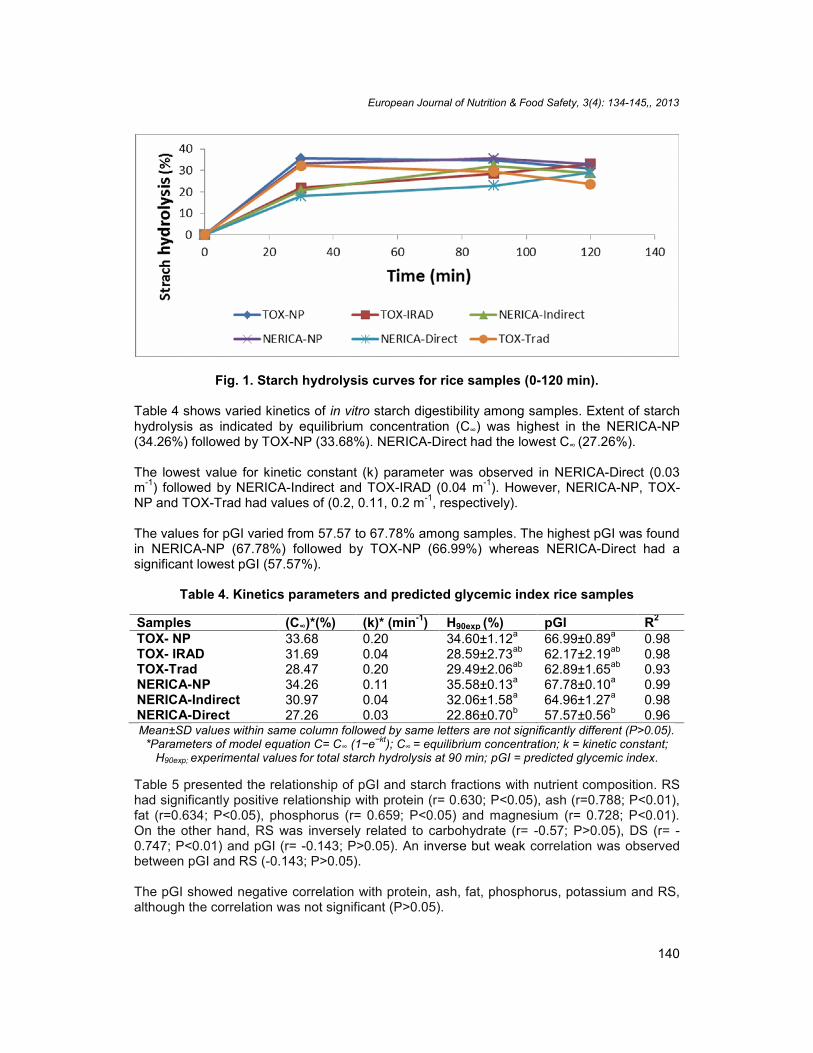
The starch hydrolysis curves from 0 to 120 min for samples are presented in Fig. 1. All thesamples portrayed rapid starch hydrolysis at the first 30 min of digestion. The curves forparboiled samples were lower than the non-parboiled samples. TOX-IRAD and NERICA-Direct did not achieve plateau before 90 min hydrolysis.
European Journal of Nutrition & Food Safety, 3(4): 134-145,, 2013
140
Fig. 1. Starch hydrolysis curves for rice samples (0-120 min).
Table 4 shows varied kinetics of in vitro starch digestibility among samples. Extent of starchhydrolysis as indicated by equilibrium concentration (C∞) was highest in the NERICA-NP(34.26%) followed by TOX-NP (33.68%). NERICA-Direct had the lowest C∞ (27.26%).
The lowest value for kinetic constant (k) parameter was observed in NERICA-Direct (0.03m-1) followed by NERICA-Indirect and TOX-IRAD (0.04 m-1). However, NERICA-NP, TOX-NP and TOX-Trad had values of (0.2, 0.11, 0.2 m-1, respectively).
The values for pGI varied from 57.57 to 67.78% among samples. The highest pGI was foundin NERICA-NP (67.78%) followed by TOX-NP (66.99%) whereas NERICA-Direct had asignificant lowest pGI (57.57%).
Table 4. Kinetics parameters and predicted glycemic index rice samples
Samples (C∞)*(%) (k)* (min-1) H90exp (%) pGI R2
TOX- NP 33.68 0.20 34.60±1.12a 66.99±0.89a 0.98TOX- IRAD 31.69 0.04 28.59±2.73ab 62.17±2.19ab 0.98TOX-Trad 28.47 0.20 29.49±2.06ab 62.89±1.65ab 0.93NERICA-NP 34.26 0.11 35.58±0.13a 67.78±0.10a 0.99NERICA-Indirect 30.97 0.04 32.06±1.58a 64.96±1.27a 0.98NERICA-Direct 27.26 0.03 22.86±0.70b 57.57±0.56b 0.96Mean±SD values within same column followed by same letters are not significantly different (P>0.05).
*Parameters of model equation C= C∞ (1−e−kt); C∞ = equilibrium concentration; k = kinetic constant;H90exp; experimental values for total starch hydrolysis at 90 min; pGI = predicted glycemic index.
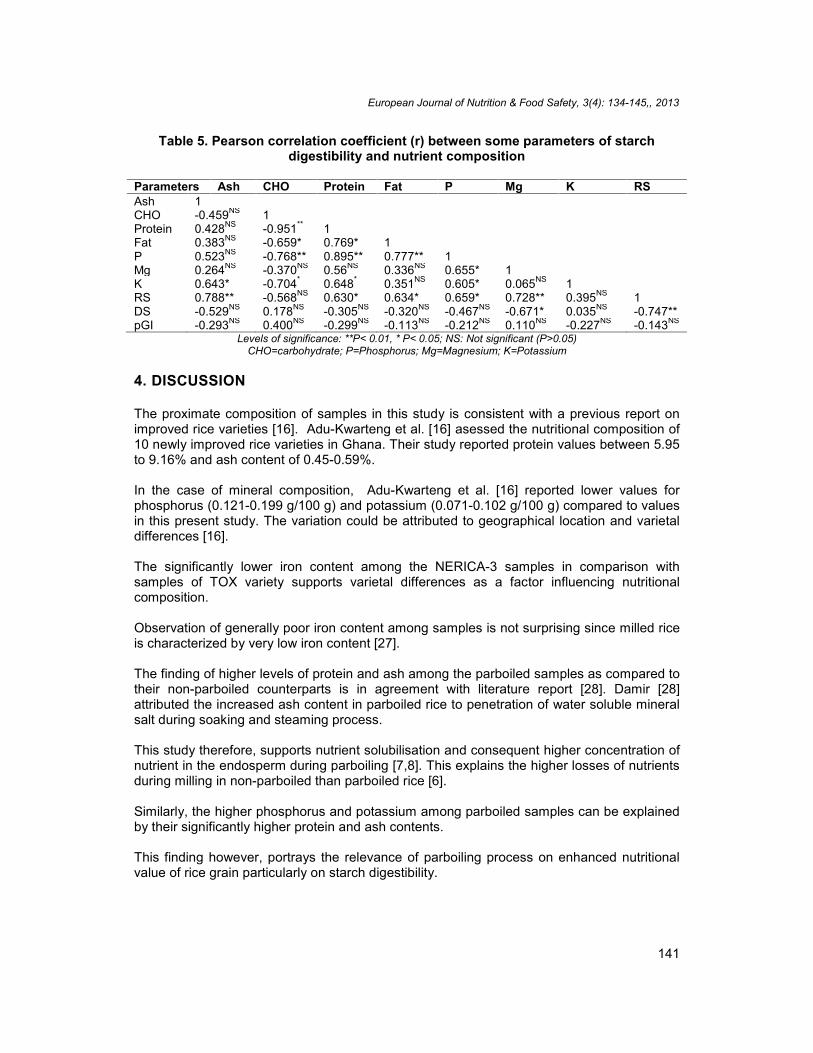
Table 5 presented the relationship of pGI and starch fractions with nutrient composition. RShad significantly positive relationship with protein (r= 0.630; P<0.05), ash (r=0.788; P<0.01),fat (r=0.634; P<0.05), phosphorus (r= 0.659; P<0.05) and magnesium (r= 0.728; P<0.01).On the other hand, RS was inversely related to carbohydrate (r= -0.57; P>0.05), DS (r= -0.747; P<0.01) and pGI (r= -0.143; P>0.05). An inverse but weak correlation was observedbetween pGI and RS (-0.143; P>0.05).
The pGI showed negative correlation with protein, ash, fat, phosphorus, potassium and RS,although the correlation was not significant (P>0.05).
European Journal of Nutrition & Food Safety, 3(4): 134-145,, 2013
141
Table 5. Pearson correlation coefficient (r) between some parameters of starchdigestibility and nutrient composition
Parameters Ash CHO Protein Fat P Mg K RSAsh 1CHO -0.459NS 1Protein 0.428NS -0.951** 1Fat 0.383NS -0.659* 0.769* 1P 0.523NS -0.768** 0.895** 0.777** 1Mg 0.264NS -0.370NS 0.56NS 0.336NS 0.655* 1K 0.643* -0.704* 0.648* 0.351NS 0.605* 0.065NS 1RS 0.788** -0.568NS 0.630* 0.634* 0.659* 0.728** 0.395NS 1DS -0.529NS 0.178NS -0.305NS -0.320NS -0.467NS -0.671* 0.035NS -0.747**pGI -0.293NS 0.400NS -0.299NS -0.113NS -0.212NS 0.110NS -0.227NS -0.143NS
Levels of significance: **P< 0.01, * P< 0.05; NS: Not significant (P>0.05)CHO=carbohydrate; P=Phosphorus; Mg=Magnesium; K=Potassium
4. DISCUSSION
The proximate composition of samples in this study is consistent with a previous report onimproved rice varieties [16]. Adu-Kwarteng et al. [16] asessed the nutritional composition of10 newly improved rice varieties in Ghana. Their study reported protein values between 5.95to 9.16% and ash content of 0.45-0.59%.
In the case of mineral composition, Adu-Kwarteng et al. [16] reported lower values forphosphorus (0.121-0.199 g/100 g) and potassium (0.071-0.102 g/100 g) compared to valuesin this present study. The variation could be attributed to geographical location and varietaldifferences [16].
The significantly lower iron content among the NERICA-3 samples in comparison withsamples of TOX variety supports varietal differences as a factor influencing nutritionalcomposition.
Observation of generally poor iron content among samples is not surprising since milled riceis characterized by very low iron content [27].
The finding of higher levels of protein and ash among the parboiled samples as compared totheir non-parboiled counterparts is in agreement with literature report [28]. Damir [28]attributed the increased ash content in parboiled rice to penetration of water soluble mineralsalt during soaking and steaming process.
This study therefore, supports nutrient solubilisation and consequent higher concentration ofnutrient in the endosperm during parboiling [7,8]. This explains the higher losses of nutrientsduring milling in non-parboiled than parboiled rice [6].
Similarly, the higher phosphorus and potassium among parboiled samples can be explainedby their significantly higher protein and ash contents.
This finding however, portrays the relevance of parboiling process on enhanced nutritionalvalue of rice grain particularly on starch digestibility.
European Journal of Nutrition & Food Safety, 3(4): 134-145,, 2013
142
Various nutrients including protein, moisture, and phosphorus in food have been associatedto starch digestibility [17,19-22]. High protein content in food as well as protein-starchcomplex were related to low glycemic response [17,18]. Previous studies have demonstratedthe influence of high phosphorus content in lowering starch digestibility rate [20,21].
The RS content among studied samples are comparable with literature data on milled rice[29, 30, 25]. The finding of higher RS with a lower DS fraction in parboiled rice than non-parboiled rice is consistent with literature documentation [31-34].
Walter et al. [29] reported a lower range (0.6-5.0%) of RS in non-parboiled samplescompared to 2.3-5.8% found in parboiled rice samples. The DS fractions in their study hadmean values of 82.4 for non-parboiled rice and 73.9% for parboiled samples.
The tendency of gelatinized starch during parboiling to undergo retrogradation upon coolingleads to resistant starch formation in parboiled rice grain [35].
The variation found in RS fraction between the different parboiled samples could beattributed to application of different degree of heat treatment during the different parboilingprocess. The protocol of traditional parboiling involved non-uniform distribution of steamduring parboiling which could have influenced the sampled grain.
RS fraction has demonstrated a significant influence on glycemic index of rice [30,24,36,25].
The pGI values among samples are within the moderate glycemic index of food classification[37]. This result is consistent with previous reports on milled non-parboiled rice. Hu et al. [30]reported 60.1-106.3% glycemic index in milled rice varieties. Miller et al. [38] showedglycemic index values between 64 and 93%.
This finding of higher pGI among the non-parboiled samples (NERICA-NP and TOX-NP) isin agreement with literature reports that parboiling elicits lower glycemic response comparedto the non-parboiled rice [9-12].
Moreover, the lower pGI among parboiled samples supports earlier reports that higherprotein and phosphorus content in food reduced rate of starch digestibility [17,20- 22]. Thehighly significant and positive correlation (r=0.895; P<0.01) between phosphorus and proteincontent in our study confirms the influence of protein and phosphorus on starch digestibility.
Deepa et al. [23] reported similar correlation of DS and RS with proximate nutrients in brownrice varieties.
Our study therefore, supports the literature fact that nutritional composition influences starchdigestibility. The formation of complex with starch by protein, fat and phosphorus hindersstarch susceptibility to amylolytic enzymes action [17,19-23].
The starch kinetic was described by a non-linear model [25] which indicates higherresistance to enzymatic hydrolysis with a lower rate of starch digestion in NERICA-Directand TOX-IRAD compared to other samples in this study.
European Journal of Nutrition & Food Safety, 3(4): 134-145,, 2013
143
5. CONCLUSION
The nutritional and starch digestibility profiles of parboiled and non-parboiled rice sampleswere highlighted. The parboiled samples had higher RS, lower pGI, and kinetic constantcompared to non-parboiled samples. RS had a significant positive relationship withnutritional composition, while pGI was inversely correlated to protein, ash, fat, phosphorus,potassium and RS.
This study portrayed the relationship of nutritional composition with starch digestibility in rice.There is need to extend this study on more rice varieties that are processed with similarparboiling techniques.
ACKNOWLEDGEMENTS
This study was supported by the Canadian International development Agency (CIDA) projecton enhancing food security in Africa through the improvement of rice post-harvest handling,marketing and the development of new rice-based products.
COMPETING INTERESTS
Authors have declared that no competing interests exist.
REFERENCES
1. Goufo P. Evaluating the constraints and opportunities for sustainable rice production inCameroon. Res J Agri Biol Sci. 2008;4(6):734-744.
2. Wolever TMS, Jenkins DJA, Jenkins AL, Josse RG. The glycemic index: methodologyand clinical implications. Am J Clin Nutr. 1991;54:846–854.
3. Foster-Powell K, Holt SHA, Brand-Miller JC. International table of glycemic index andglycemic load values: 2002. Am J Clin Nutr. 2002;76(1):5-56.
4. Pedersen B, Eggum B. The influence of milling on the nutritive value of flour fromcereal grains. 4. Rice. Plant Foods Hum Nutr. 1983;33(4):267-278.
5. Bello M, Baeza R, Tolaba M. Quality characteristics of milled and cooked rice affectedby hydrothermal treatment. J Food Eng. 2006;72(2):124-133.
6. Doesthale YG, Devara S, Rao S, Belavady B. Effect of milling on mineral and traceelement composition of raw and parboiled rice. J Sci Food Agri. 1979;30(1):40-46.
7. Heinemann R, Fagundes P, Pinto E, Penteado M, Lanfer-Marquez U. Comparativestudy of nutrient composition of commercial brown, parboiled and milled rice fromBrazil. J Food Comp Analy. 2005;18(4):287-296.
8. Amato GW, Carvalho JLV, Silveira FS. In: Ricardo Lenz (Ed.), Arroz parboiled:tecnologia limpa, produto nobre. Porto Alegre, RS, Brazil, 240pp. World HealthOrganization, Diet, nutrition and the prevention of chronic diseases. Report of a JoinWHO/FAO Expert Consultation. WHO Technical Report Series 916; 2003.
9. Larsen HN, Rasmussen OW, Rasmussen PH, Alstrup KK, Biswas SK, Tetens I, et al.Glycemic index of parboiled rice depends on the severity of processing: study in type 2diabetic subjects. Eur J Clin Nutr. 2000;54:380–385.
10. Jarvi AE, Karlstrom BE, Granfeldt YE, Bjorck I, Vessby B, Asp N. The influence of foodstructure on postprandial metabolism in patients with non-insulin-dependent diabetesmellitus. Am J Clin Nutr. 1995;61(4):837-842.
European Journal of Nutrition & Food Safety, 3(4): 134-145,, 2013
144
11. Casiraghi MC, Brighenti F, Pellegrini N, Leopardi E, Testolin G. Effect of processingon rice starch digestibility evaluated by in vivo and in vitro methods. J Cereal Sci.1993;17:147–156.
12. Jenkins DJA, Wolever TMS, Jenkins AL. Starchy foods and glycemic index. DiabetesCare. 1988;11(2):149-159.
13. Agama-Acevedo E, Islas-Hernández JJ, Pacheco-Vargas G, Osorio-Díaz P, Bello-Pérez LA. Starch digestibility and glycemic index of cookies partially substituted withunripe banana flour. Food Sci Technol. 2012;46(1):177-182.
14. Olembo N, M’mboyi F, Oyugi K. Success Stories in Crop Improvement in Africa; 2010.15. West Africa Rice Development Association, (WARDA). Annual report. 2002-2003. The
Africa Rice Center, Bouake’, Cote D’ivoire, http://www.Warda.Org. (retrieved, 13th
August 2007).16. Adu-Kwarteng E, Ellis W, Oduro I, Manful J. Rice grain quality: a comparison of local
varieties with new varieties under study in Ghana. Food Control. 2003;14(7):507-514.17. Chung HJ, Liu Q, Hoover R, Warkentin TD, and Vandenberg B. In vitro starch
digestibility, expected glycemic index, and thermal and pasting properties of floursfrom pea, lentil and chickpea cultivars. Food Chem. 2008;111:316-21.
18. Anderson IH, Levine AS, and Levitt MD. Incomplete absorption of the carbohydrate inall-purpose wheat flour. New England J Med. 1981;304:891-2.
19. Lynch D, Liu Q, Tarn T, Bizimungu B, Chen Q, Harris P, Chik C, and Skjodt N.Glycemie index — a review and implications for the potato industry. Am J Potato Res.2007;84:179-90.
20. Absar N, Zaidul ISM, Takigawa S, Hashimoto N, Matsuura-Endo C, Yamauchi H, andNoda T. Enzymatic hydrolysis of potato starches containing different amounts ofphosphorus. Food Chem. 2009;112:57-62.
21. Noda T, Takigawa S, Matsuura-Endo C, Suzuki T, Hashimoto N, Kottearachchi NS,Yamauchi H, Zaidul ISM. Factors affecting the digestibility of raw and gelatinizedpotato starches. Food Chem. 2008;110:465-70.
22. Sitohy MZ, Ramadan MF. Degradability of different phosphorylated starches andthermoplastic films prepared from corn starch phosphomonoesters. Starch – Starke.2001;53:317-322.
23. Deepa G, Singh V, Naidu KA. A comparative study on starch digestibility, glycemicindex and resistant starch of pigmented (‘Njavara’ and ‘Jyothi’) and non-pigmented (‘IR64’) rice varieties. J Food Sci Technol. 2010;47(6):644–649.
24. Frei M, Siddhuraju P, Becker K. Studies on the in vitro starch digestibility and theglycemic index of six different indigenous rice cultivars from the Philippines. FoodChem. 2003;83(3):395-402.
25. Goñi I, Garcia-Alonso A, Saura-Calixto F. A starch hydrolysis procedure to estimateglycemic index. Nutr Res. 1997;17(3):427-37.
26. Official Methods of Analysis (AOAC). Association of Official Analytical Chemist,International. 17th ed. Gaithersburg, Maryland, USA; 2000.
27. Lucca P, Hurrell R, Potrykus I. Fighting iron deficiency anemia with iron-rich rice. J AmColl Nutr. 2002;21(suppl 3):184S-190S.
28. Damir A. Comparative studies on the physicochemical properties and microstructureof raw and parboiled rice. Food Chem. 1985;16(1):1-14.
29. Walter M, Da Silva LP, Denardin CC. Rice and resistant starch: different contentdepending on chosen methodology. J Food Comp Anal. 2005;18(4):279-285.
30. Hu P, Zhao H, Duan Z, Linlin Z, Wu D. Starch digestibility and the estimated glycemicscore of different types of rice differing in amylose contents. J Cereal Sci.2004;40(3):231-237.
European Journal of Nutrition & Food Safety, 3(4): 134-145,, 2013
145
31. Newton J, Wang YJ, Mauromoustakos A. Effects of Cultivar and Processing Conditionon Physicochemical Properties and Starch Fractions in Parboiled Rice. Cereal Chem.2011;88(4):414-420.
32. Tetens I, Biswas SK, Glito LV, Kabir KA, Thilsted SH, Choudhury NH.Physicochemical characteristics as indicators of starch availability from milled rice. JCereal Sci. 1997;26:355-361.
33. Eggum B, Juliano B, Perez C, Acedo E. The resistant starch, undigestible energy andundigestible protein contents of raw and cooked milled rice. J Cereal Sci.1993;18(2):159-170.
34. Marsono Y, Topping DL. Complex carbohydrates in Australian rice products—Influence of microwave cooking and food processing. Lebensm. Wiss. Technol.1993;26:364-370.
35. Mitra A, Bhattacharya D, Roy S. Role of resistant starches particularly rice containingresistant starches in type 2 diabetes. J Hum Ecol. 2007;21(1):47-51.
36. Rashmi S, Urooj A. Effect of processing on nutritionally important starch fractions inrice varieties. Inter J Food Sci Nutr. 2003;54(1):27-36.
37. Jenkins DJ, Kendall CW, Augustin LS, Franceschi S, Hamidi M, Marchie A, JenkinsAL, Axelsen M. Glycemic index: overview of implications in health and disease. AmerJ Clin Nutr. 2002;76(1):266S-273S.
38. Miller JB, Pang E, Bramall L. Rice: a high or low glycemic index food? Am J Clin Nutr.1992;56:1034–1036.
_________________________________________________________________________© 2013 Odenigbo et al.; This is an Open Access article distributed under the terms of the Creative CommonsAttribution License (http://creativecommons.org/licenses/by/3.0), which permits unrestricted use, distribution, andreproduction in any medium, provided the original work is properly cited.
Peer-review history:The peer review history for this paper can be accessed here:
http://www.sciencedomain.org/review-history.php?iid=266&id=30&aid=2429