Embed Size (px)
Citation preview
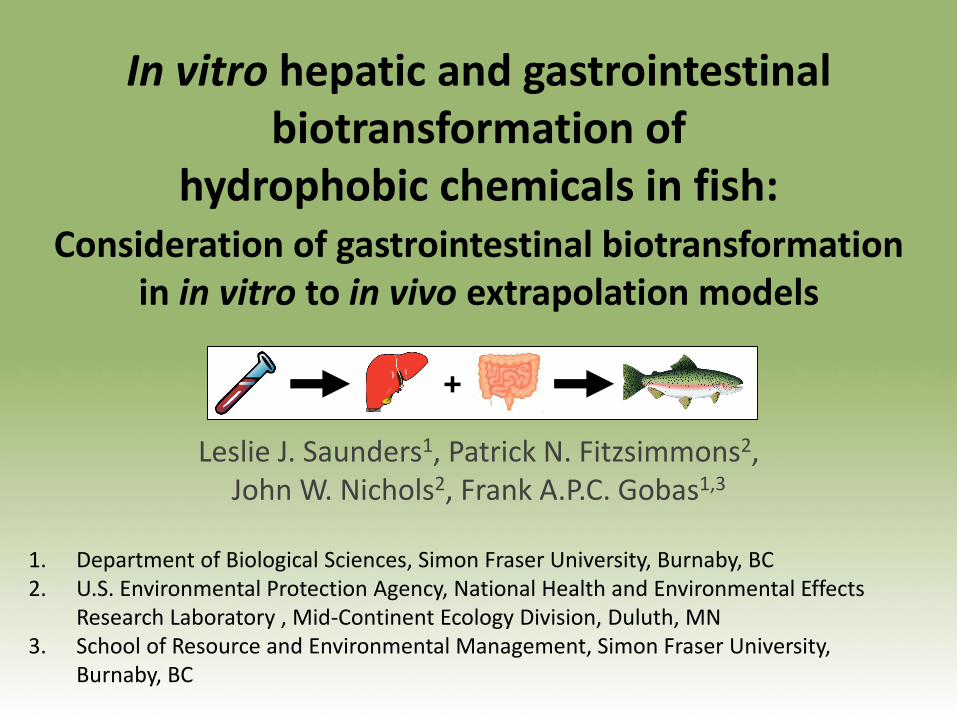
In vitro hepatic and gastrointestinal biotransformation of
hydrophobic chemicals in fish: Consideration of gastrointestinal biotransformation
in in vitro to in vivo extrapolation models
Leslie J. Saunders1, Patrick N. Fitzsimmons2, John W. Nichols2, Frank A.P.C. Gobas1,3
1. Department of Biological Sciences, Simon Fraser University, Burnaby, BC2. U.S. Environmental Protection Agency, National Health and Environmental Effects
Research Laboratory , Mid-Continent Ecology Division, Duluth, MN3. School of Resource and Environmental Management, Simon Fraser University,
Burnaby, BC
+
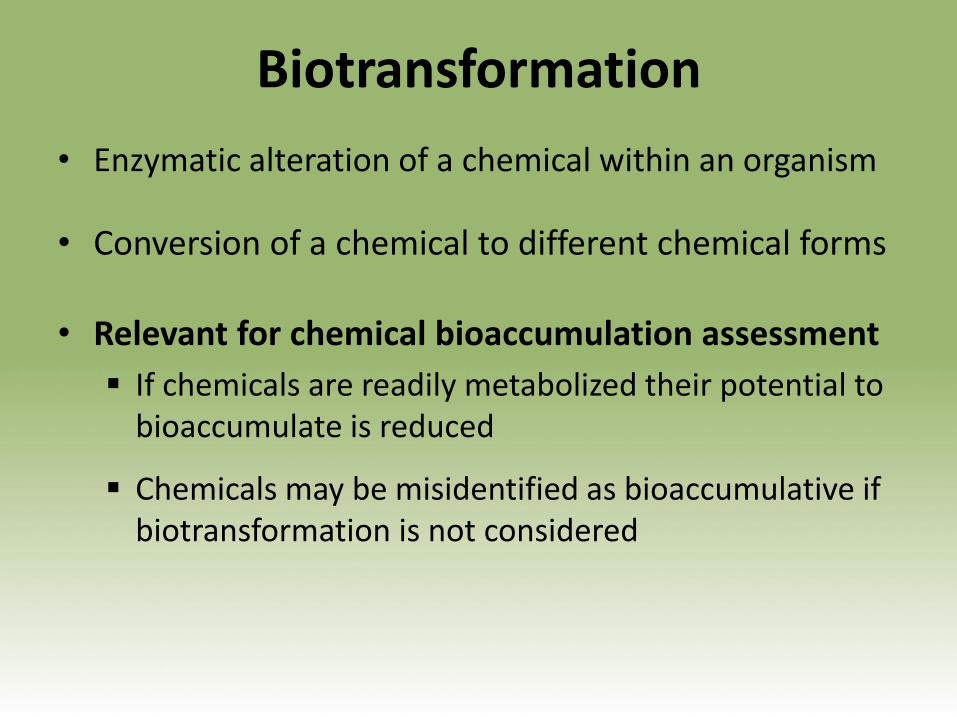
Biotransformation
• Enzymatic alteration of a chemical within an organism
• Conversion of a chemical to different chemical forms
• Relevant for chemical bioaccumulation assessment
If chemicals are readily metabolized their potential to bioaccumulate is reduced
Chemicals may be misidentified as bioaccumulative if biotransformation is not considered
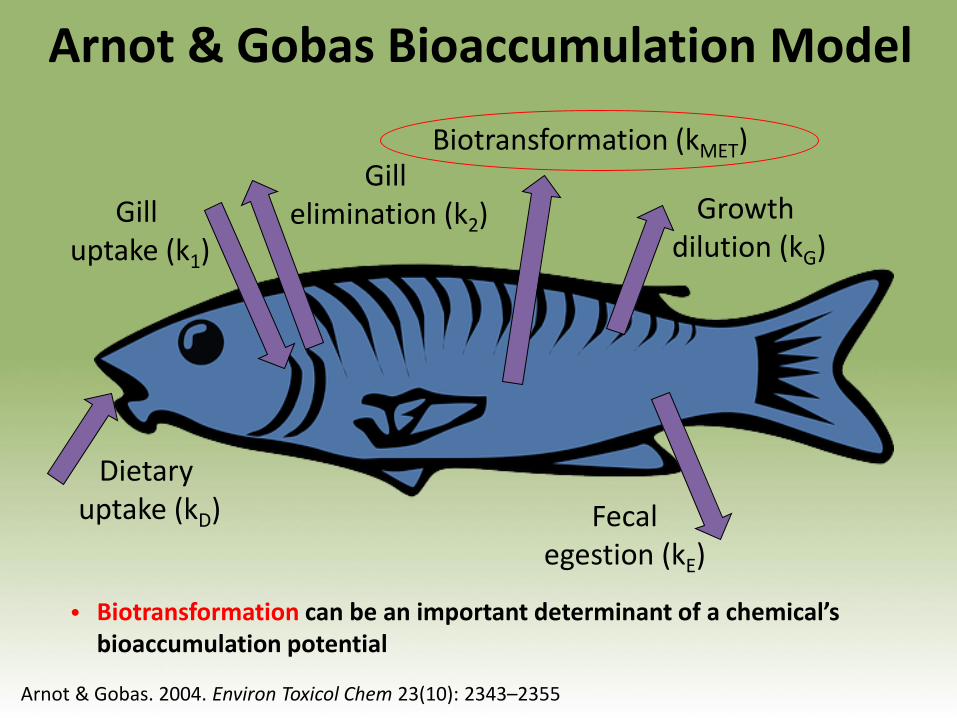
Dietary uptake (kD)
Gill uptake (k1)
Gill elimination (k2)
Biotransformation (kMET)
Growth dilution (kG)
Fecal egestion (kE)
• Biotransformation can be an important determinant of a chemical’s bioaccumulation potential
Arnot & Gobas. 2004. Environ Toxicol Chem 23(10): 2343–2355
Arnot & Gobas Bioaccumulation Model
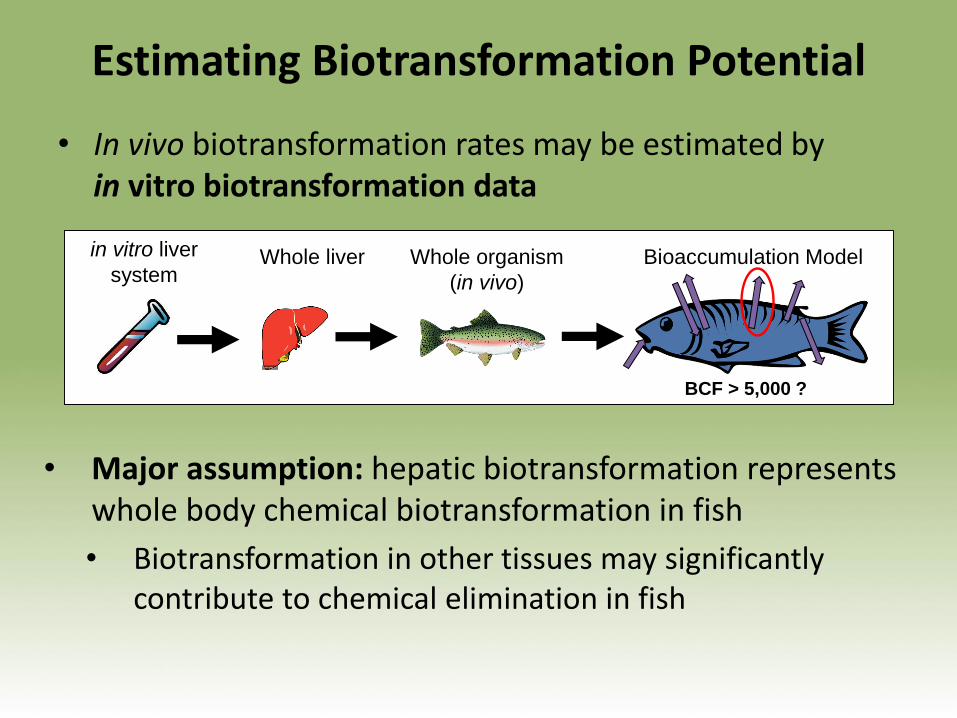
Estimating Biotransformation Potential
• In vivo biotransformation rates may be estimated by in vitro biotransformation data
BCF > 5,000 ?
in vitro liver
systemWhole liver Whole organism
(in vivo)
Bioaccumulation Model
• Major assumption: hepatic biotransformation represents whole body chemical biotransformation in fish
• Biotransformation in other tissues may significantly contribute to chemical elimination in fish
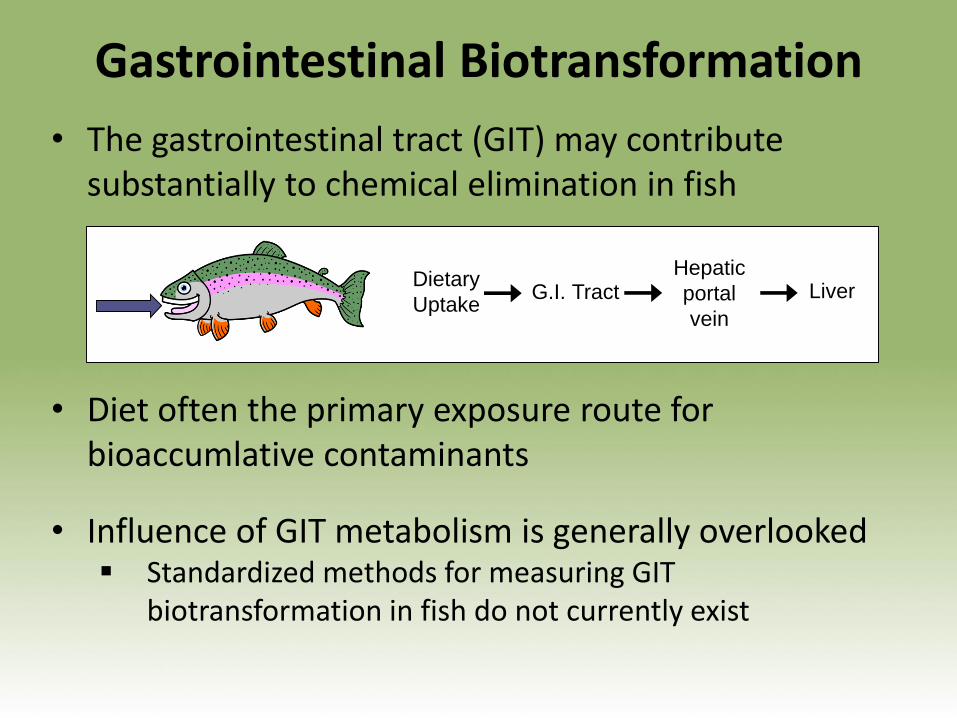
• The gastrointestinal tract (GIT) may contribute substantially to chemical elimination in fish
Gastrointestinal Biotransformation
• Diet often the primary exposure route for bioaccumlative contaminants
• Influence of GIT metabolism is generally overlooked Standardized methods for measuring GIT
biotransformation in fish do not currently exist
G.I. TractDietary
Uptake
Hepatic
portal
vein
Liver
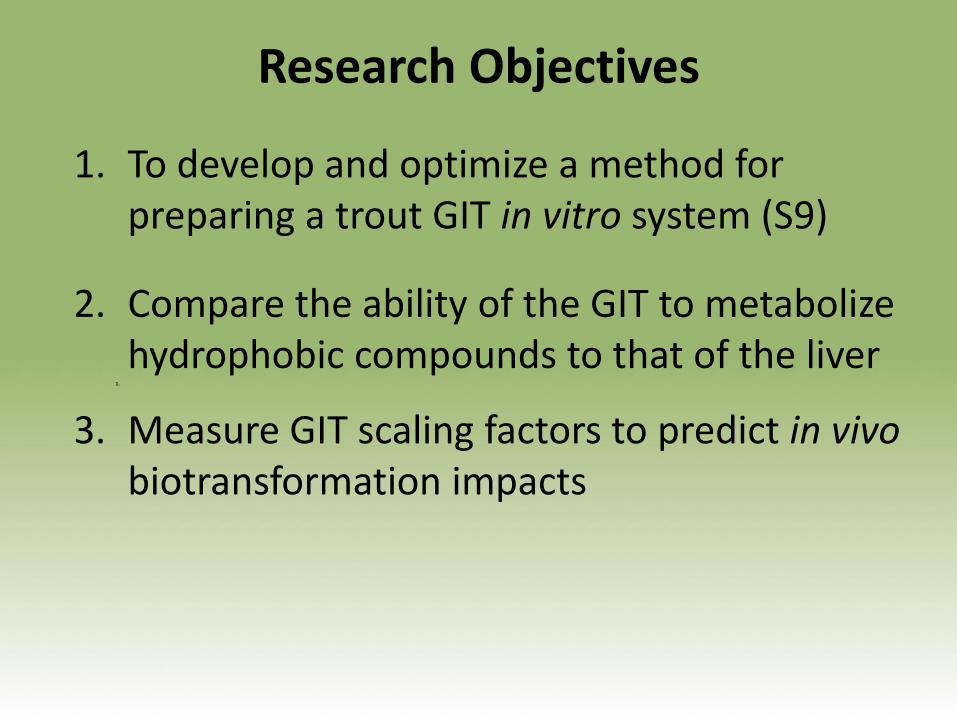
1. To develop and optimize a method for preparing a trout GIT in vitro system (S9)
2. Compare the ability of the GIT to metabolize hydrophobic compounds to that of the liver
1.
3. Measure GIT scaling factors to predict in vivobiotransformation impacts
Research Objectives
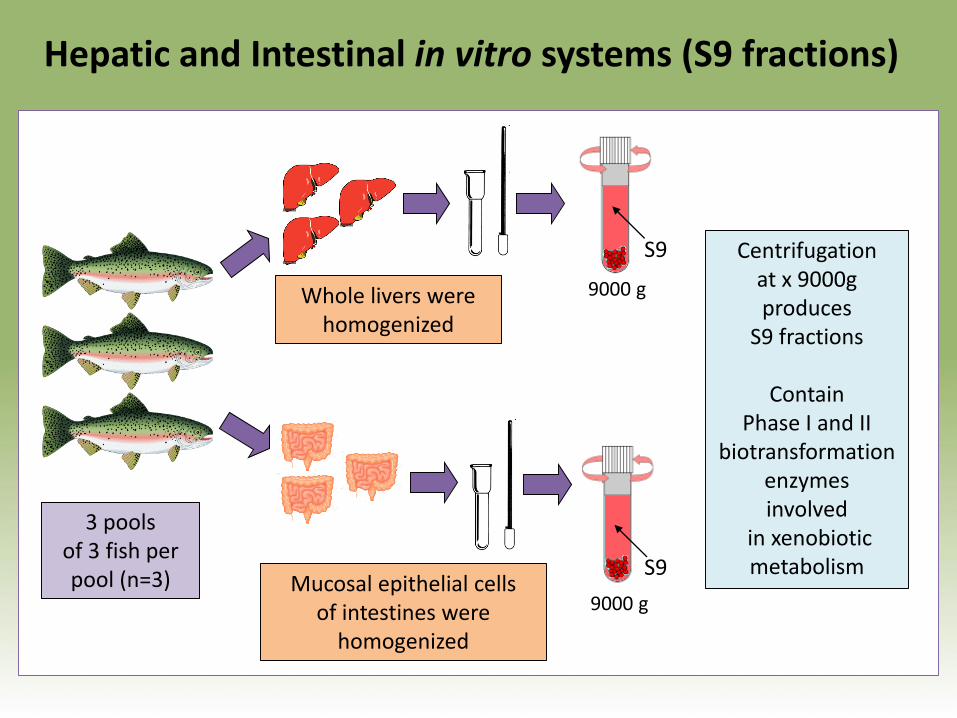
Hepatic and Intestinal in vitro systems (S9 fractions)
3 pools of 3 fish per pool (n=3)
S9
9000 g
S9
9000 g
Whole livers were homogenized
Mucosal epithelial cells of intestines were
homogenized
Centrifugation at x 9000g produces
S9 fractions
ContainPhase I and II
biotransformation enzymes involved
in xenobiotic metabolism
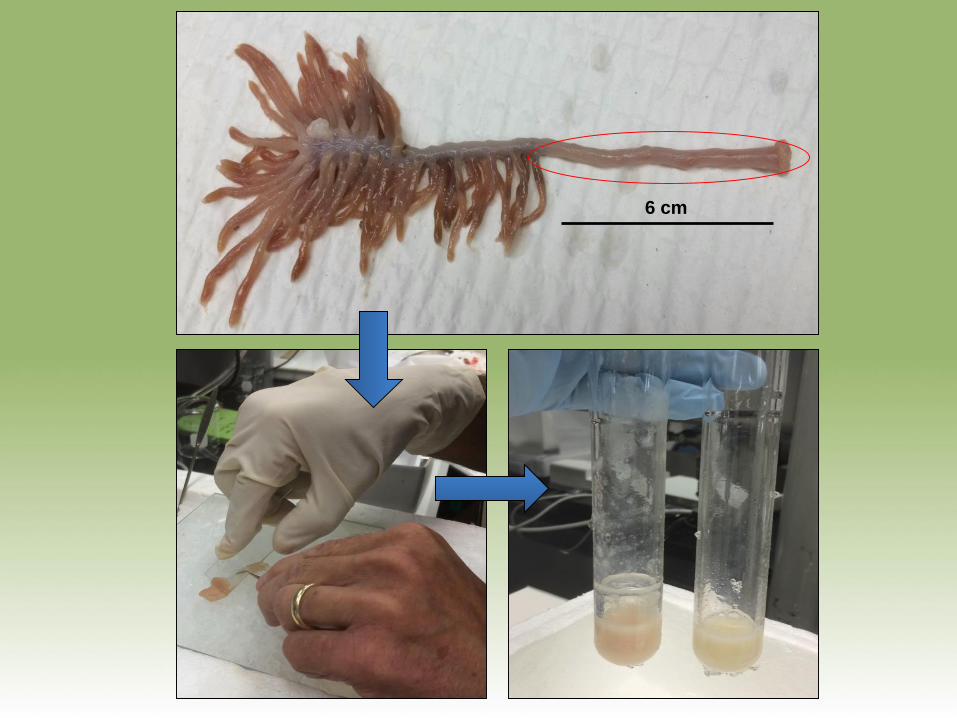
6 cm
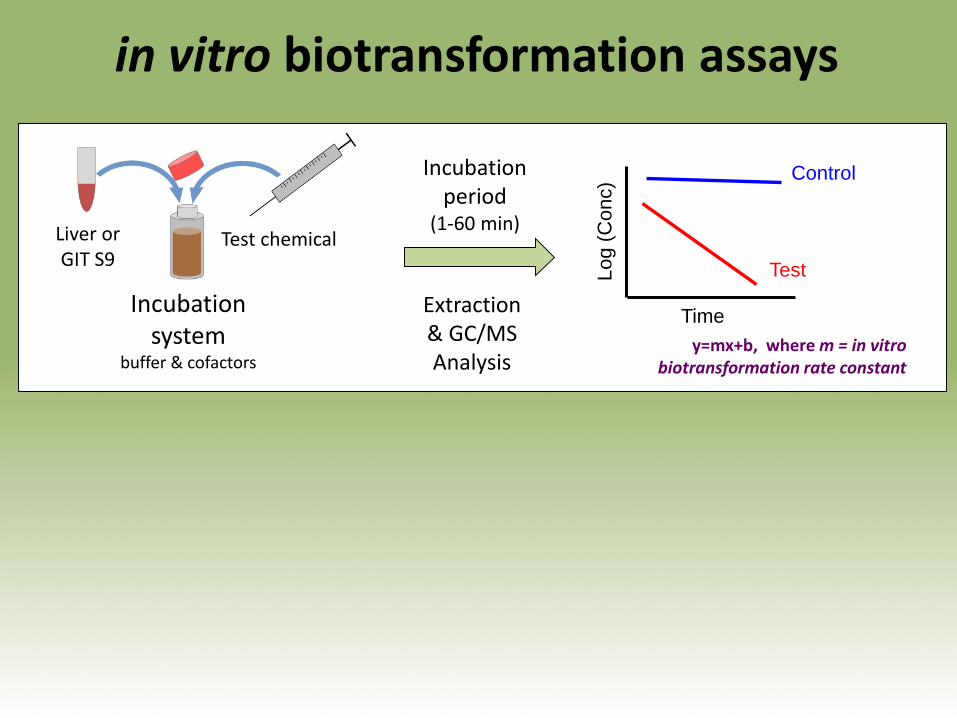
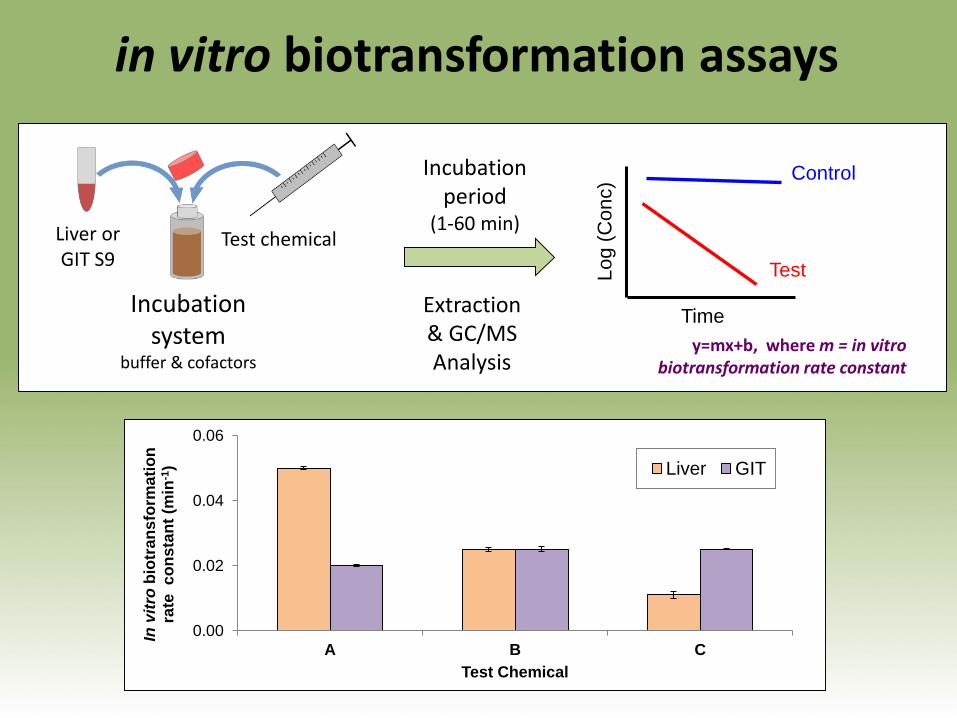
Incubation period
(1-60 min)
Lo
g (
Co
nc)
Time
Test
Control
Incubation system
buffer & cofactors
Test chemicalLiver orGIT S9
Extraction & GC/MS Analysis
in vitro biotransformation assays
y=mx+b, where m = in vitro biotransformation rate constant
Incubation period
(1-60 min)
Lo
g (
Co
nc)
Time
Test
Control
Incubation system
buffer & cofactors
Test chemicalLiver orGIT S9
Extraction & GC/MS Analysis
in vitro biotransformation assays
0.00
0.02
0.04
0.06
A B C
In v
itro
bio
tran
sfo
rma
tio
n
rate
c
on
sta
nt
(min
-1)
Test Chemical
Liver GIT
y=mx+b, where m = in vitro biotransformation rate constant
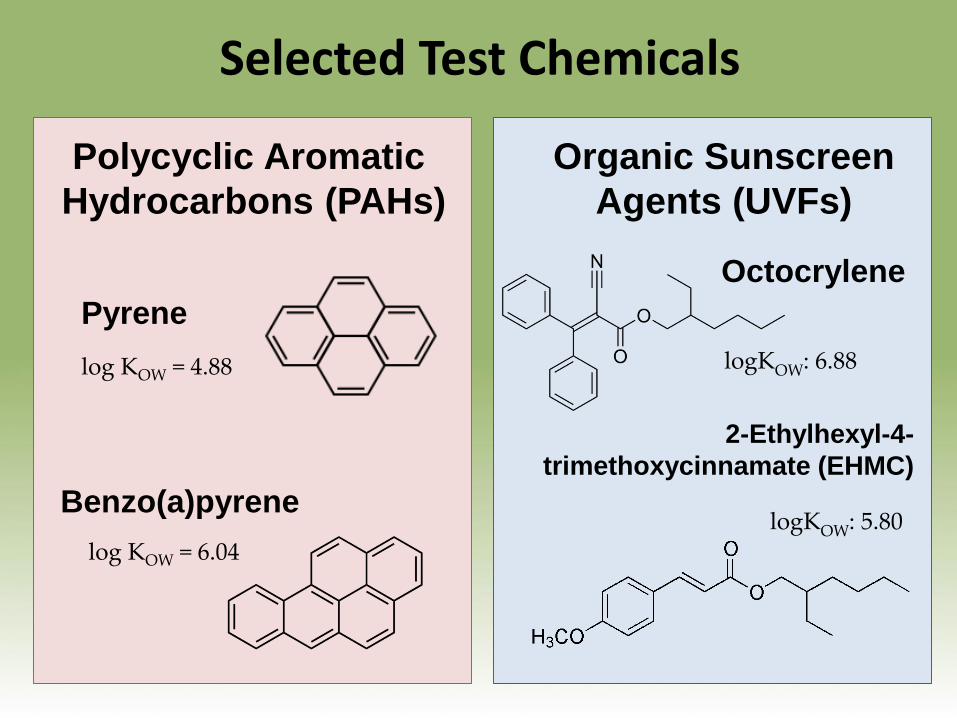
Selected Test Chemicals
Octocrylene
logKOW: 6.88
2-Ethylhexyl-4-
trimethoxycinnamate (EHMC)
logKOW: 5.80Benzo(a)pyrene
Pyrene
log KOW = 4.88
log KOW = 6.04
Polycyclic Aromatic
Hydrocarbons (PAHs)
Organic Sunscreen
Agents (UVFs)
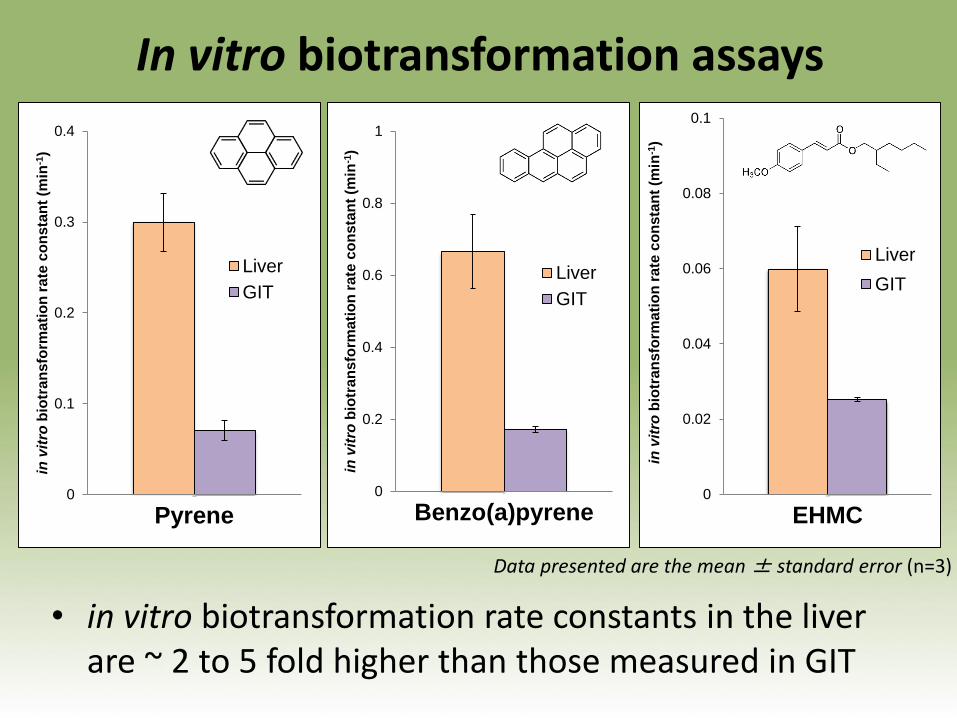
In vitro biotransformation assays
0
0.1
0.2
0.3
0.4
�Pyrene
in v
itro
bio
tra
nsfo
rma
tio
n r
ate
co
nsta
nt
(min
-1)
Pyrene
Liver
GIT
0
0.2
0.4
0.6
0.8
1
�BaP
in v
itro
bio
tra
nsfo
rma
tio
n r
ate
co
nsta
nt
(min
-1)
Benzo(a)pyrene
Liver
GIT
• in vitro biotransformation rate constants in the liver are ~ 2 to 5 fold higher than those measured in GIT
0
0.02
0.04
0.06
0.08
0.1
�EHMC
in v
itro
bio
tra
nsfo
rma
tio
n r
ate
co
nsta
nt
(min
-1)
EHMC
Liver
GIT
Data presented are the mean ± standard error (n=3)
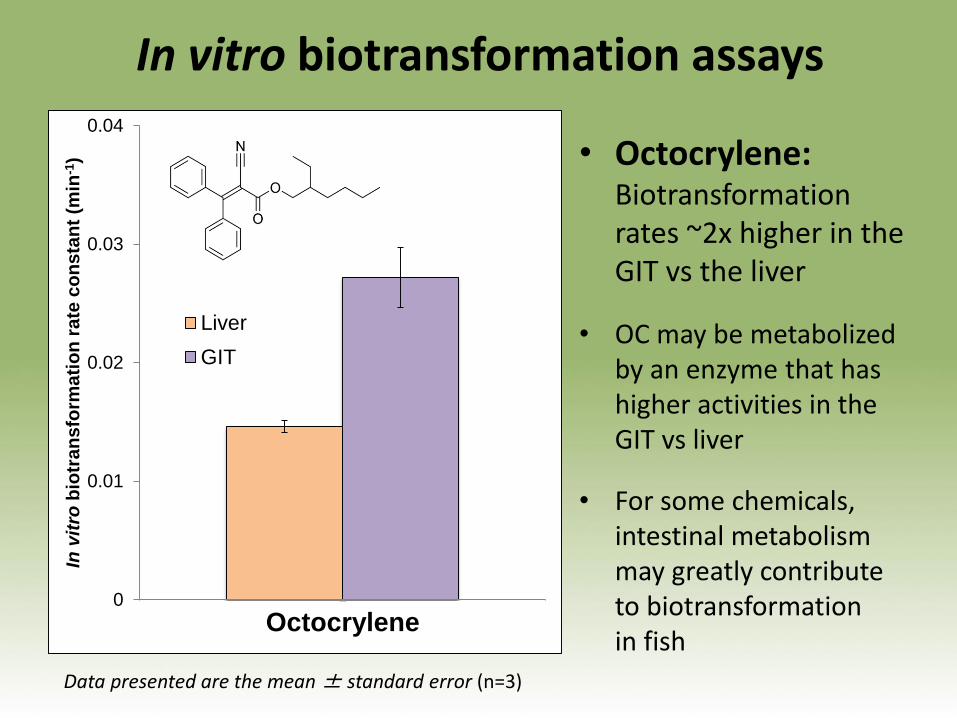
• Octocrylene: Biotransformation rates ~2x higher in the GIT vs the liver
• OC may be metabolized by an enzyme that has higher activities in the GIT vs liver
• For some chemicals, intestinal metabolism may greatly contribute to biotransformation in fish
0
0.01
0.02
0.03
0.04
�Octocrylene
In v
itro
bio
tra
ns
form
ati
on
ra
te c
on
sta
nt
(min
-1)
Octocrylene
Liver
GIT
In vitro biotransformation assays
Data presented are the mean ± standard error (n=3)
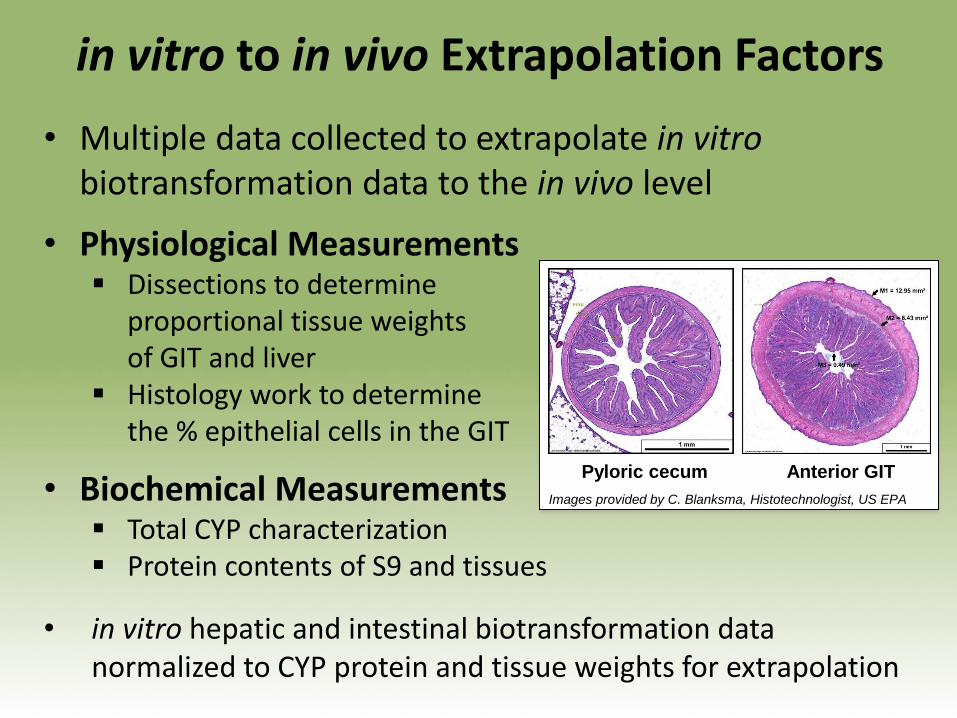
in vitro to in vivo Extrapolation Factors
• Physiological Measurements Dissections to determine
proportional tissue weightsof GIT and liver
Histology work to determine the % epithelial cells in the GIT
• Biochemical Measurements Total CYP characterization Protein contents of S9 and tissues
• in vitro hepatic and intestinal biotransformation data normalized to CYP protein and tissue weights for extrapolation
• Multiple data collected to extrapolate in vitrobiotransformation data to the in vivo level
Images provided by C. Blanksma, Histotechnologist, US EPA
Pyloric cecum Anterior GIT
0
0.1
0.2
0.3
0.4
0.5
1
in v
ivo
bio
tra
ns
form
ati
on
ra
te c
on
sta
nt
(da
y-1
) EHMC
in vivo predicted- Liver only
in vivo predicted - Liver & GIT
0.0
1.0
2.0
3.0
1
in v
ivo
bio
tra
ns
form
ati
on
ra
te c
on
sta
nt
(da
y-1
) Pyrene
in vivo predicted- Liver only
in vivo predicted - Liver & GIT
0.0
0.5
1.0
1.5
1
in v
ivo
bio
tra
ns
form
ati
on
ra
te c
on
sta
nt
(da
y-1
) BaP
in vivo predicted- Liver only
in vivo predicted - Liver & GIT
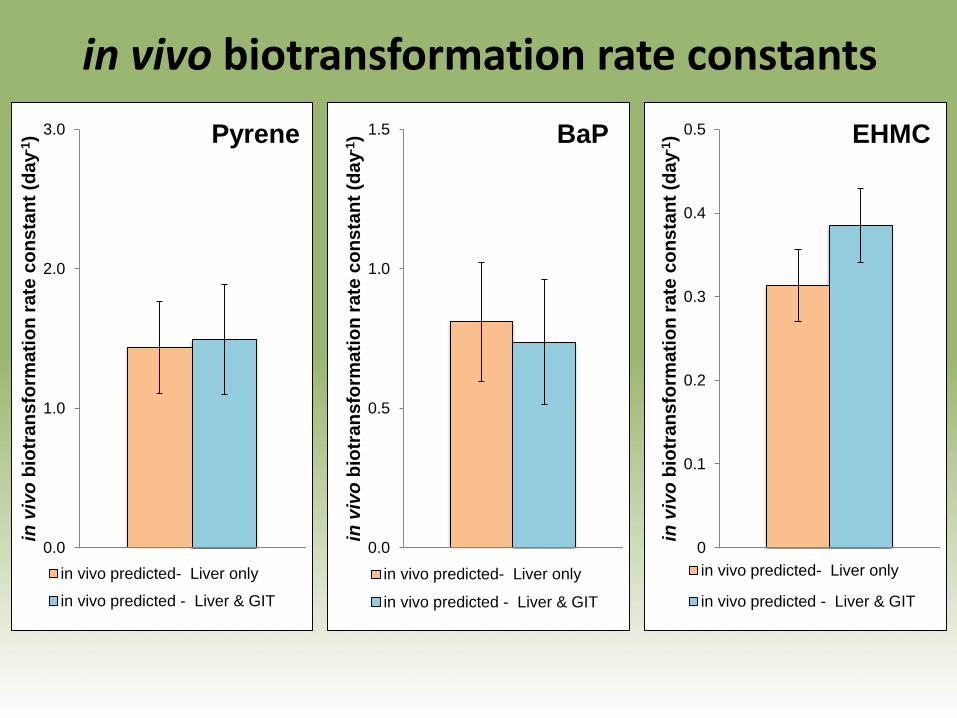
in vivo biotransformation rate constants
0
0.1
0.2
0.3
0.4
0.5
1
in v
ivo
bio
tra
ns
form
ati
on
ra
te c
on
sta
nt
(da
y-1
) EHMC
in vivo predicted- Liver only
in vivo predicted - Liver & GIT
in vivo measured
0.0
1.0
2.0
3.0
1
in v
ivo
bio
tra
ns
form
ati
on
ra
te c
on
sta
nt
(da
y-1
) Pyrene
in vivo predicted- Liver onlyin vivo predicted - Liver & GITin vivo measured
0.0
0.5
1.0
1.5
1
in v
ivo
bio
tra
ns
form
ati
on
ra
te c
on
sta
nt
(da
y-1
) BaP
in vivo predicted- Liver onlyin vivo predicted - Liver & GITin vivo measured
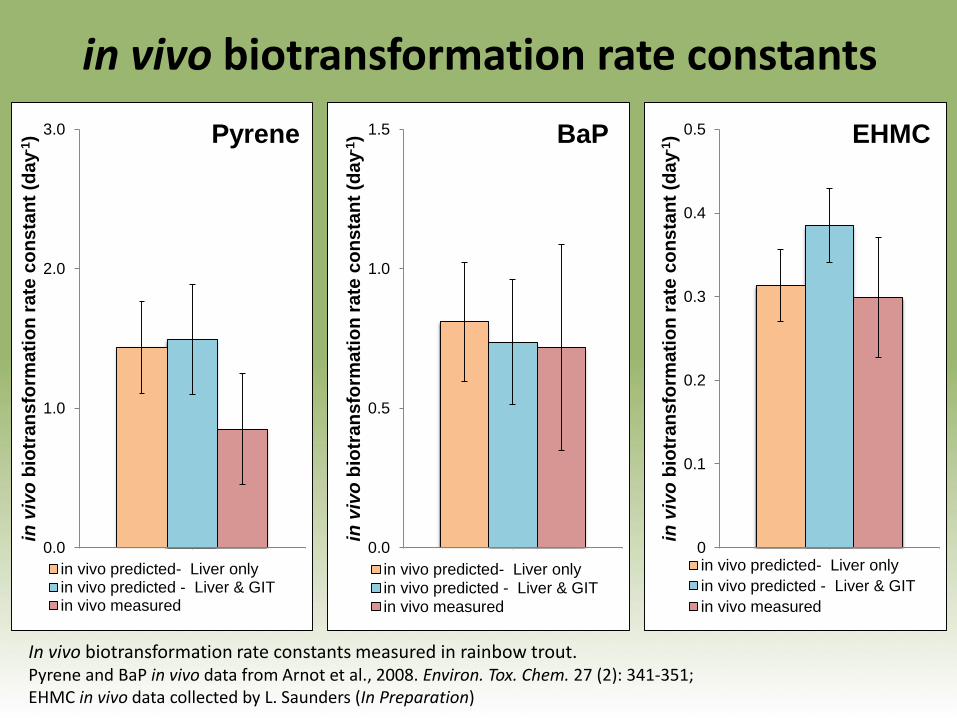
in vivo biotransformation rate constants
In vivo biotransformation rate constants measured in rainbow trout. Pyrene and BaP in vivo data from Arnot et al., 2008. Environ. Tox. Chem. 27 (2): 341-351; EHMC in vivo data collected by L. Saunders (In Preparation)
in vivo biotransformation rate constants
0.00
0.05
0.10
0.15
1
in v
ivo
bio
tran
sfo
rmati
on
rate
co
nsta
nt
(day
-1)
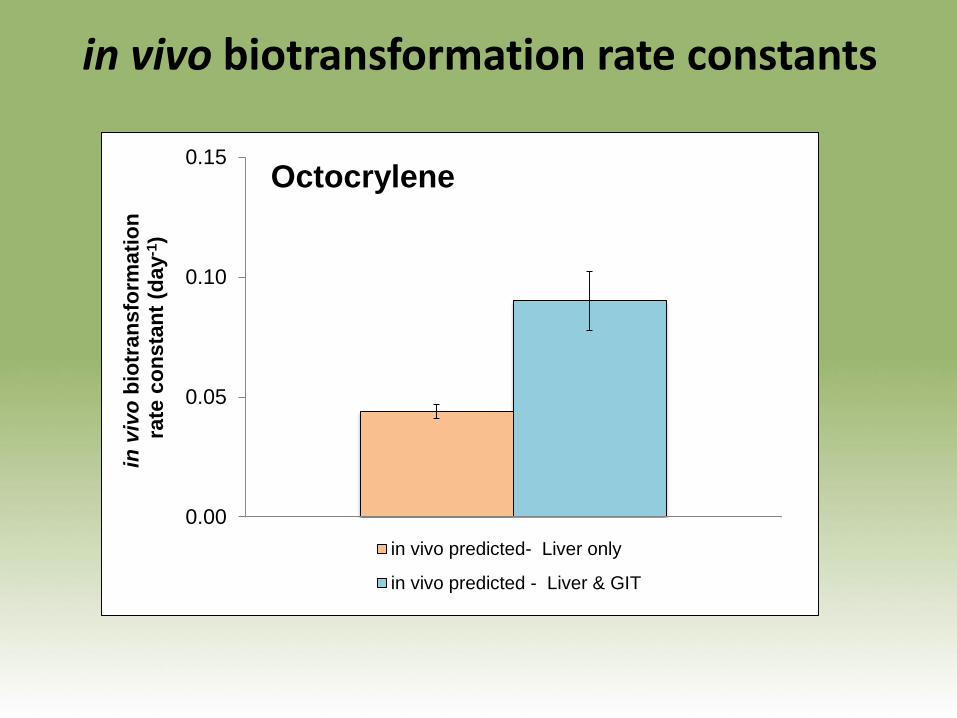
Octocrylene
in vivo predicted- Liver only
in vivo predicted - Liver & GIT
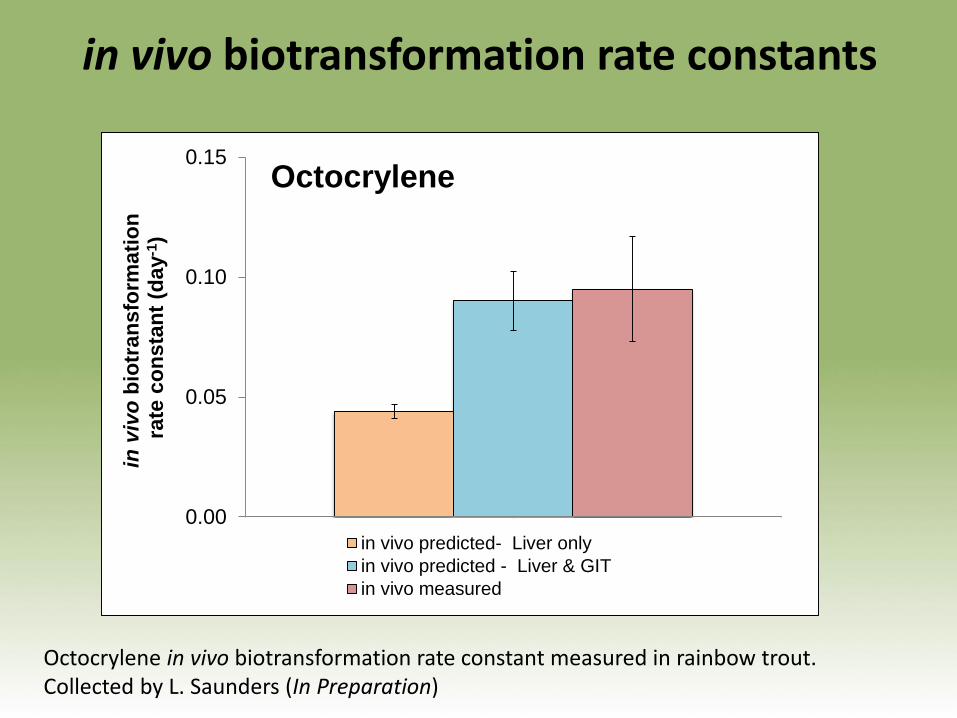
in vivo biotransformation rate constants
0.00
0.05
0.10
0.15
1
in v
ivo
bio
tran
sfo
rmati
on
rate
co
nsta
nt
(day
-1)
Octocrylene
in vivo predicted- Liver only
in vivo predicted - Liver & GIT
in vivo measured
Octocrylene in vivo biotransformation rate constant measured in rainbow trout. Collected by L. Saunders (In Preparation)
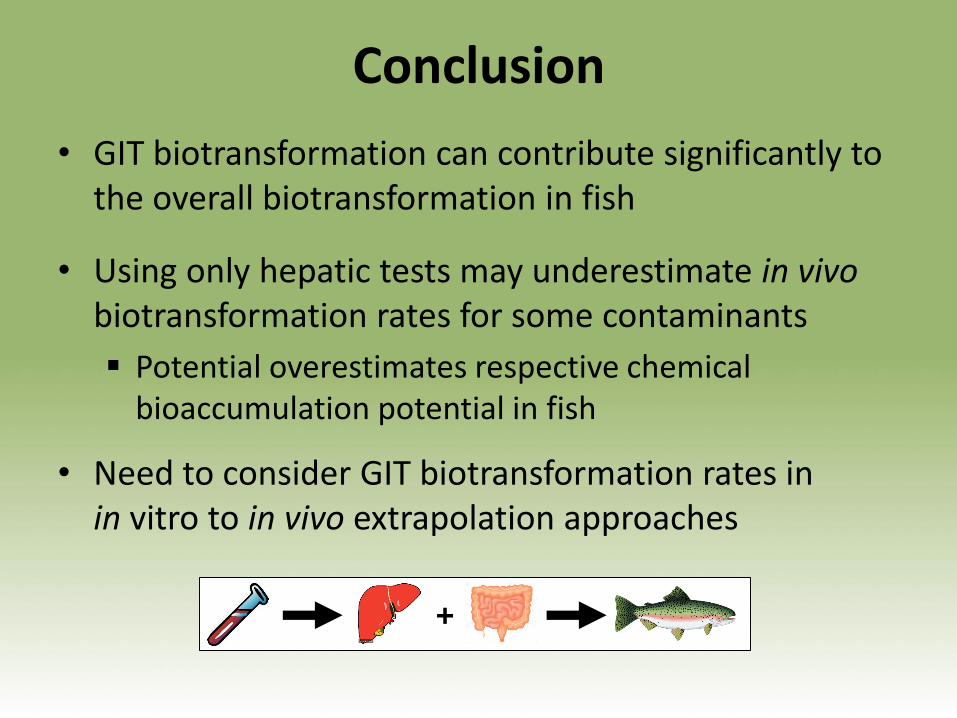
Conclusion
• GIT biotransformation can contribute significantly to the overall biotransformation in fish
• Using only hepatic tests may underestimate in vivobiotransformation rates for some contaminants
Potential overestimates respective chemical bioaccumulation potential in fish
• Need to consider GIT biotransformation rates in in vitro to in vivo extrapolation approaches
+
• Funding and Scholarships Unilever Research and Development
Natural Sciences and Engineering Research Council of Canada (NSERC)
Simon Fraser University
• Prof. Frank Gobas, SFU
• School of Resource and Environmental Management Toxicology Lab, Simon Fraser University
• Dr. John Nichols, US EPA
• Toxicokinetics Research Group
Alex Hoffman, Patrick Fitzsimmons, Melanie Ladd
Acknowledgements
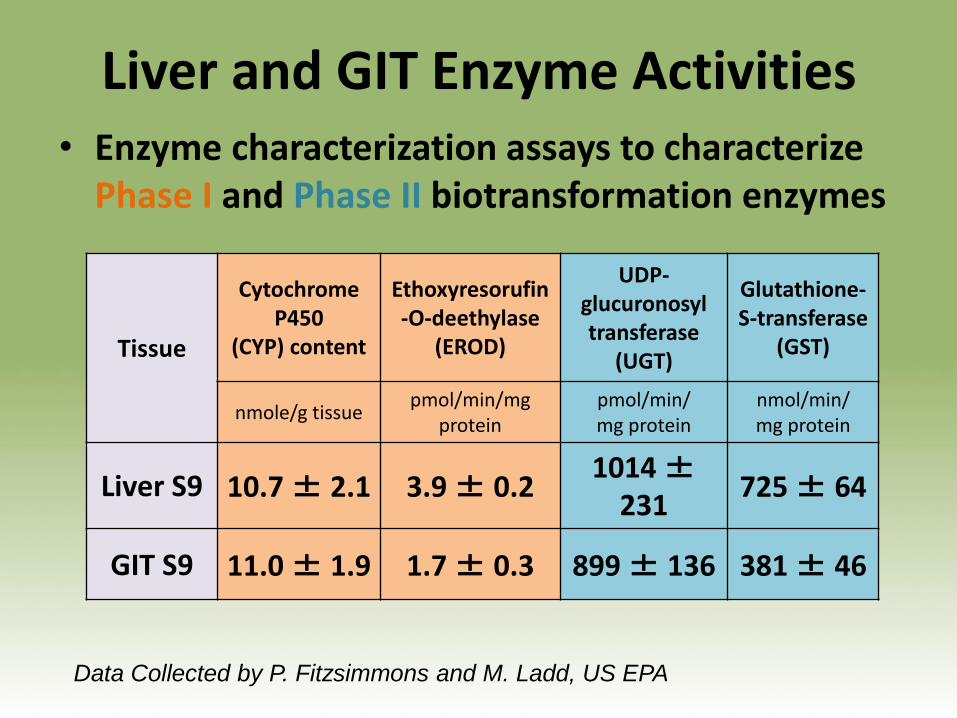
Liver and GIT Enzyme Activities
Tissue
Cytochrome P450
(CYP) content
Ethoxyresorufin-O-deethylase
(EROD)
UDP-glucuronosyltransferase
(UGT)
Glutathione-S-transferase
(GST)
nmole/g tissuepmol/min/mg
proteinpmol/min/mg protein
nmol/min/mg protein
Liver S9 10.7 ± 2.1 3.9 ± 0.21014 ±
231725 ± 64
GIT S9 11.0 ± 1.9 1.7 ± 0.3 899 ± 136 381 ± 46
• Enzyme characterization assays to characterize Phase I and Phase II biotransformation enzymes
Data Collected by P. Fitzsimmons and M. Ladd, US EPA
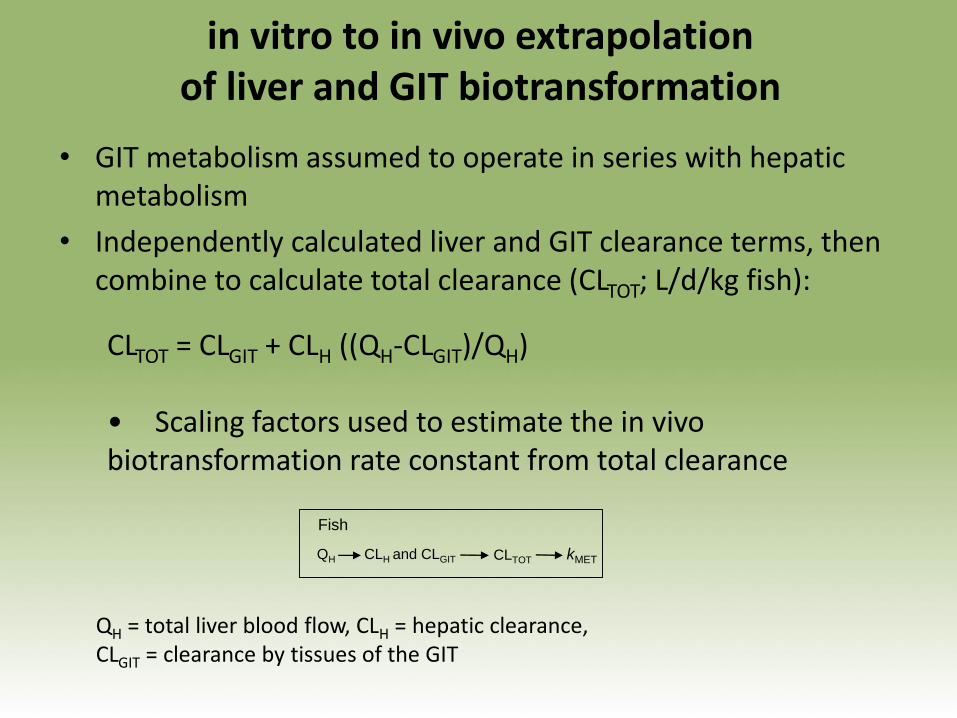
• GIT metabolism assumed to operate in series with hepatic metabolism
• Independently calculated liver and GIT clearance terms, then combine to calculate total clearance (CLTOT; L/d/kg fish):
CLTOT = CLGIT + CLH ((QH-CLGIT)/QH)
• Scaling factors used to estimate the in vivo biotransformation rate constant from total clearance
QH = total liver blood flow, CLH = hepatic clearance, CLGIT = clearance by tissues of the GIT
in vitro to in vivo extrapolation of liver and GIT biotransformation
Fish
QH CLTOTCLH and CLGIT kMET