Embed Size (px)
Citation preview
S1
Ortho-Chlorination of phenoxy 1,2-dioxetane yields superior chemiluminescence
probes for in vitro and in vivo imaging
Tal Eilon-Shaffera‡, Michal Roth-Konfortia‡, Anat Eldar-Boockb, Ronit Satchi-Fainarob,
and Doron Shabata*
‡T.E.-S. and M.R.-K. contributed equally
aSchool of Chemistry, Raymond and Beverly Sackler Faculty of Exact Sciences and
bDepartment of Physiology and Pharmacology, Sackler School of Medicine, Tel Aviv
University, Tel Aviv 69978 Israel.
Supporting Information
Supplementary Figures……….…………………………………………………..………………………...…S2
Synthetic Schemes and Experimental Procedures………..………….……………….......S8-S13
NMR and MS Spectra of Key Compounds…………………..………………….……...…….S14-S23
In Vitro Experiments……………….…….………………………………………………………….…………S24
In Vivo Experiments……………….…….………………………………………………………..………S24-S25
References……………………………………………………….……………………………………………….….S25
Electronic Supplementary Material (ESI) for Organic & Biomolecular Chemistry.This journal is © The Royal Society of Chemistry 2018
S2
Supplementary Figures
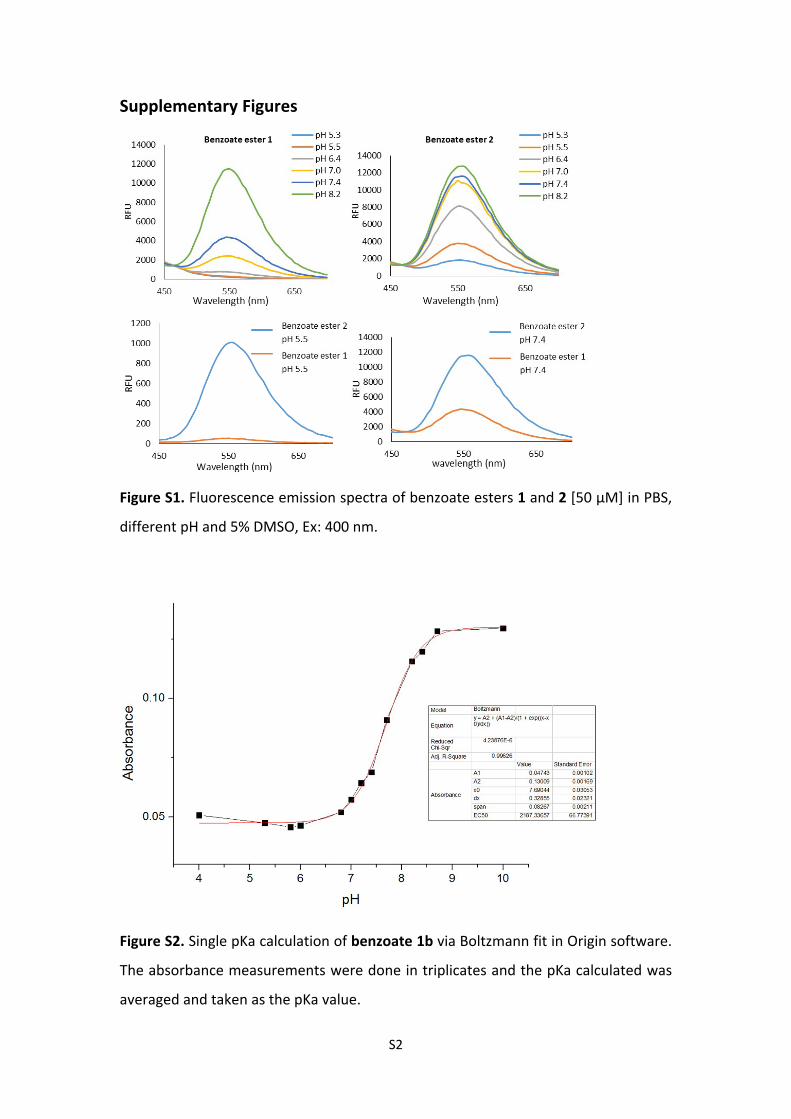
Figure S1. Fluorescence emission spectra of benzoate esters 1 and 2 [50 µM] in PBS,
different pH and 5% DMSO, Ex: 400 nm.
Figure S2. Single pKa calculation of benzoate 1b via Boltzmann fit in Origin software.
The absorbance measurements were done in triplicates and the pKa calculated was
averaged and taken as the pKa value.
S3
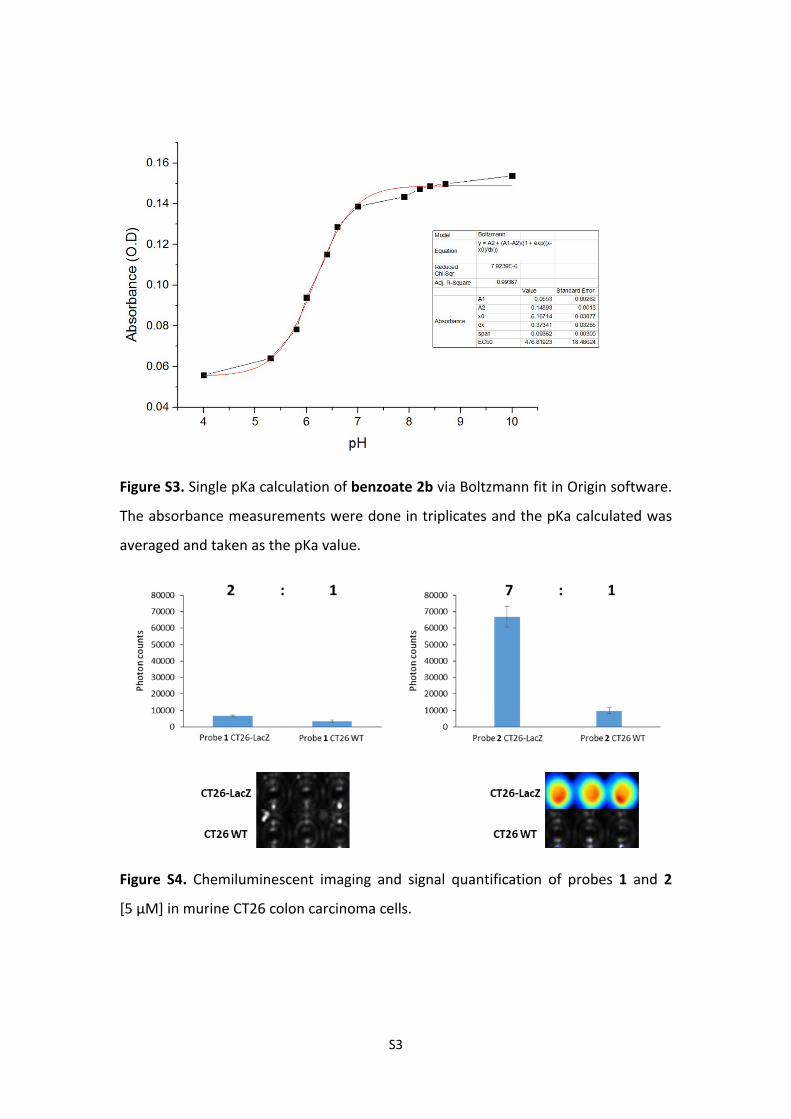
Figure S3. Single pKa calculation of benzoate 2b via Boltzmann fit in Origin software.
The absorbance measurements were done in triplicates and the pKa calculated was
averaged and taken as the pKa value.
Figure S4. Chemiluminescent imaging and signal quantification of probes 1 and 2
[5 µM] in murine CT26 colon carcinoma cells.
S4
Probe 2Probe 2a
Probe 1Probe 1a
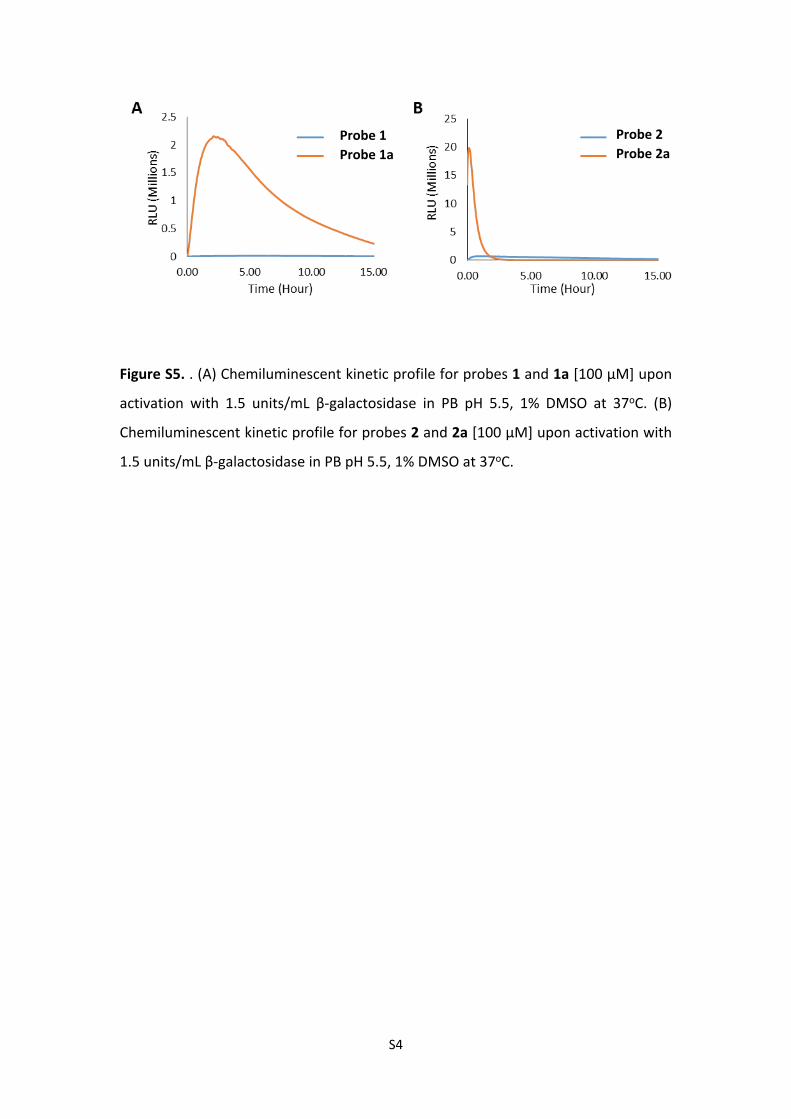
Figure S5. . (A) Chemiluminescent kinetic profile for probes 1 and 1a [100 µM] upon
activation with 1.5 units/mL β-galactosidase in PB pH 5.5, 1% DMSO at 37oC. (B)
Chemiluminescent kinetic profile for probes 2 and 2a [100 µM] upon activation with
1.5 units/mL β-galactosidase in PB pH 5.5, 1% DMSO at 37oC.
S5
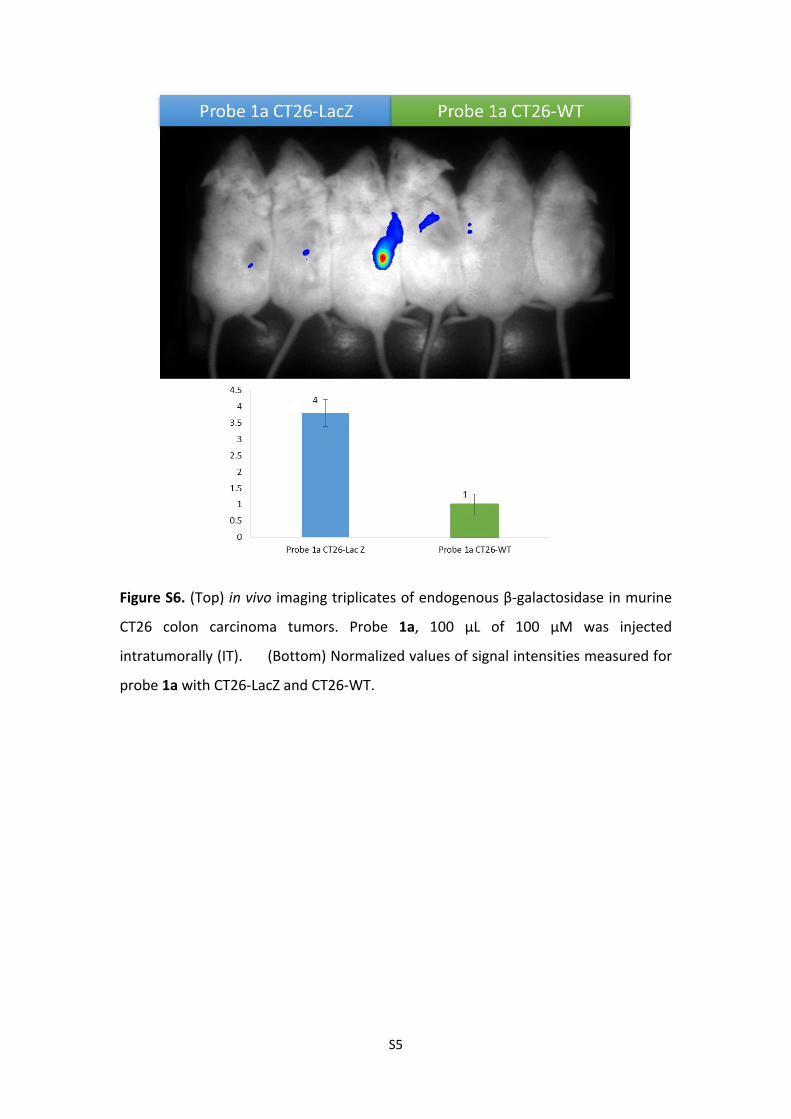
Figure S6. (Top) in vivo imaging triplicates of endogenous β-galactosidase in murine
CT26 colon carcinoma tumors. Probe 1a, 100 µL of 100 µM was injected
intratumorally (IT). (Bottom) Normalized values of signal intensities measured for
probe 1a with CT26-LacZ and CT26-WT.
S6
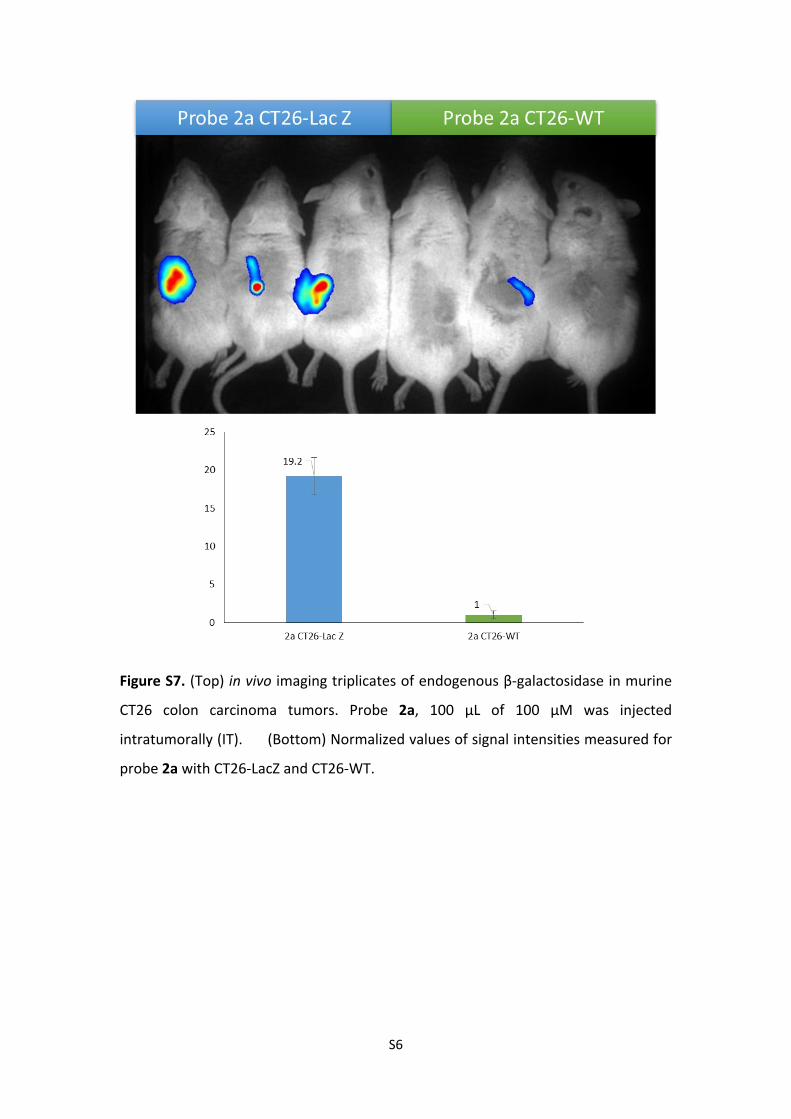
Figure S7. (Top) in vivo imaging triplicates of endogenous β-galactosidase in murine
CT26 colon carcinoma tumors. Probe 2a, 100 µL of 100 µM was injected
intratumorally (IT). (Bottom) Normalized values of signal intensities measured for
probe 2a with CT26-LacZ and CT26-WT.
S7
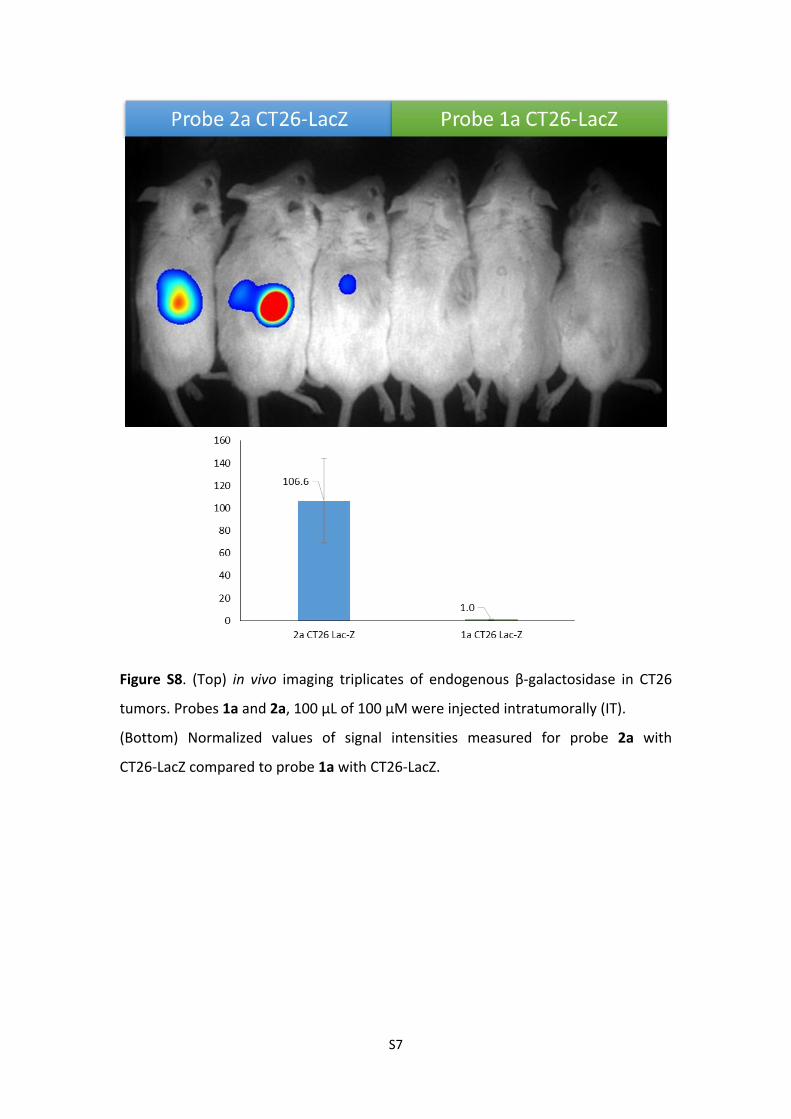
Figure S8. (Top) in vivo imaging triplicates of endogenous β-galactosidase in CT26
tumors. Probes 1a and 2a, 100 µL of 100 µM were injected intratumorally (IT).
(Bottom) Normalized values of signal intensities measured for probe 2a with
CT26-LacZ compared to probe 1a with CT26-LacZ.
S8
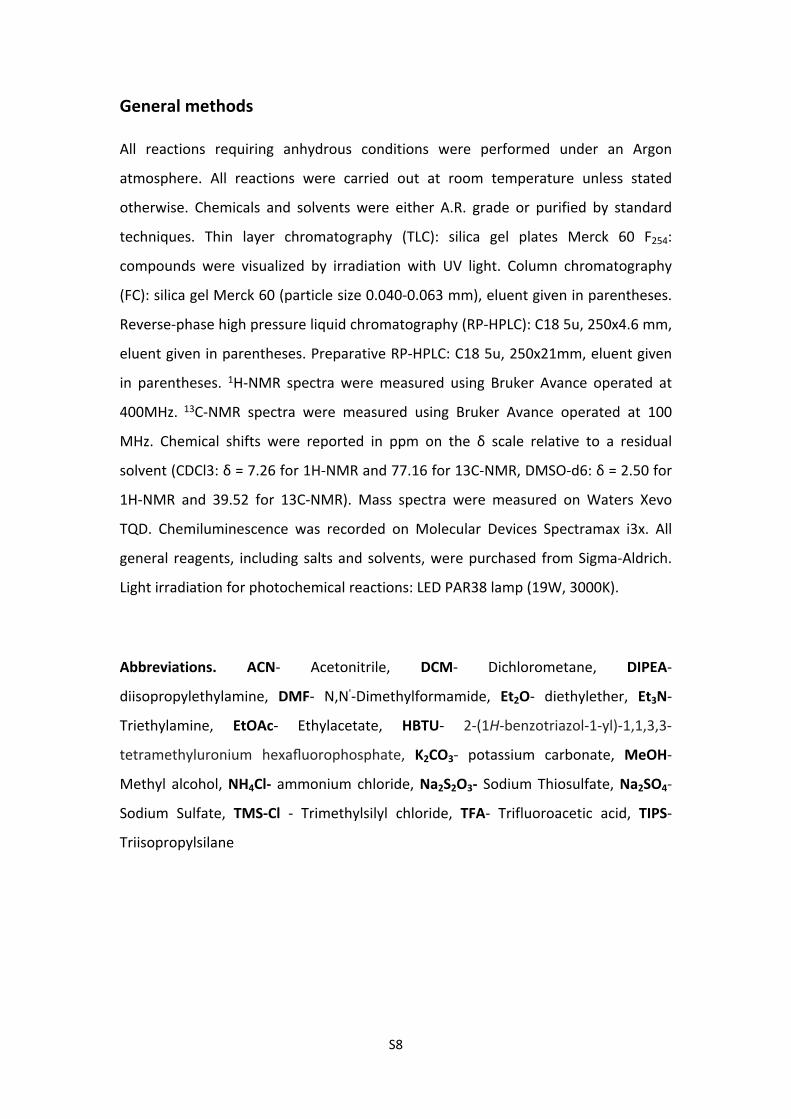
General methods
All reactions requiring anhydrous conditions were performed under an Argon
atmosphere. All reactions were carried out at room temperature unless stated
otherwise. Chemicals and solvents were either A.R. grade or purified by standard
techniques. Thin layer chromatography (TLC): silica gel plates Merck 60 F254:
compounds were visualized by irradiation with UV light. Column chromatography
(FC): silica gel Merck 60 (particle size 0.040-0.063 mm), eluent given in parentheses.
Reverse-phase high pressure liquid chromatography (RP-HPLC): C18 5u, 250x4.6 mm,
eluent given in parentheses. Preparative RP-HPLC: C18 5u, 250x21mm, eluent given
in parentheses. 1H-NMR spectra were measured using Bruker Avance operated at
400MHz. 13C-NMR spectra were measured using Bruker Avance operated at 100
MHz. Chemical shifts were reported in ppm on the δ scale relative to a residual
solvent (CDCl3: δ = 7.26 for 1H-NMR and 77.16 for 13C-NMR, DMSO-d6: δ = 2.50 for
1H-NMR and 39.52 for 13C-NMR). Mass spectra were measured on Waters Xevo
TQD. Chemiluminescence was recorded on Molecular Devices Spectramax i3x. All
general reagents, including salts and solvents, were purchased from Sigma-Aldrich.
Light irradiation for photochemical reactions: LED PAR38 lamp (19W, 3000K).
Abbreviations. ACN- Acetonitrile, DCM- Dichlorometane, DIPEA-
diisopropylethylamine, DMF- N,N'-Dimethylformamide, Et2O- diethylether, Et3N-
Triethylamine, EtOAc- Ethylacetate, HBTU- 2-(1H-benzotriazol-1-yl)-1,1,3,3-
tetramethyluronium hexafluorophosphate, K2CO3- potassium carbonate, MeOH-
Methyl alcohol, NH4Cl- ammonium chloride, Na2S2O3- Sodium Thiosulfate, Na2SO4-
Sodium Sulfate, TMS-Cl - Trimethylsilyl chloride, TFA- Trifluoroacetic acid, TIPS-
Triisopropylsilane
S9
OAcO
AcOOAc
OAc
O
OO
O
O
OHO
HOOH
OH
O
OO
HO
O
LiOHTHF, H2O
68%
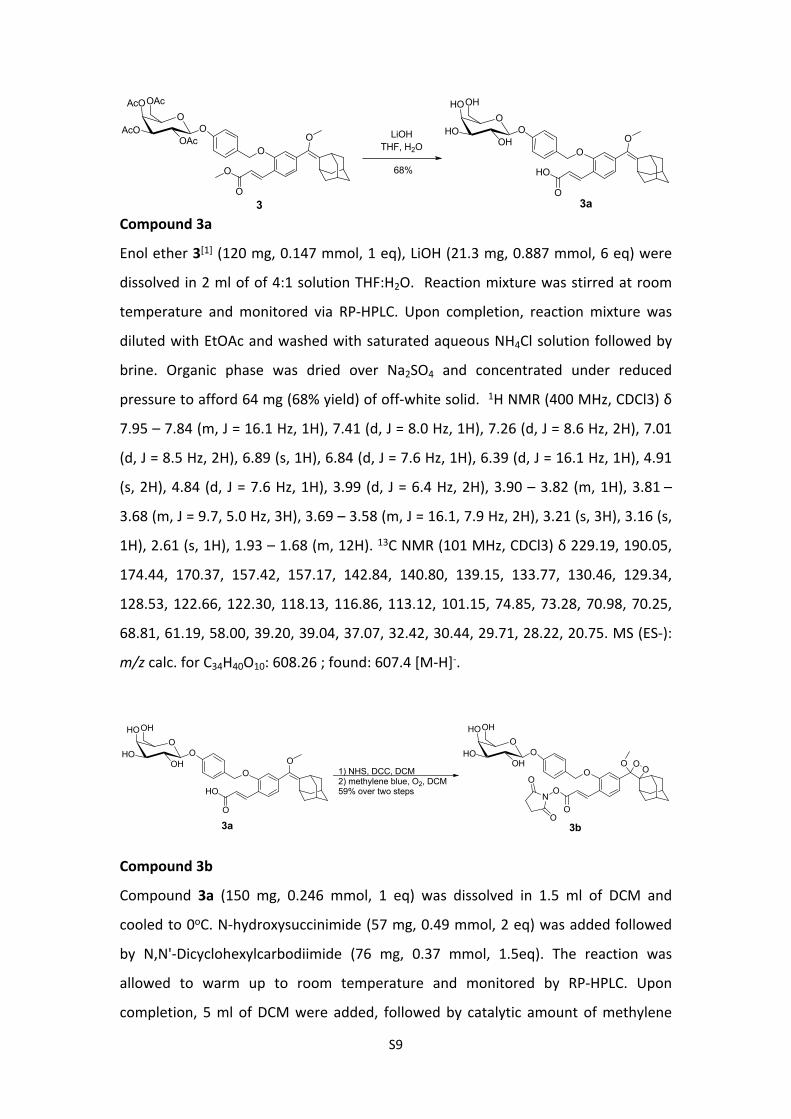
3 3a
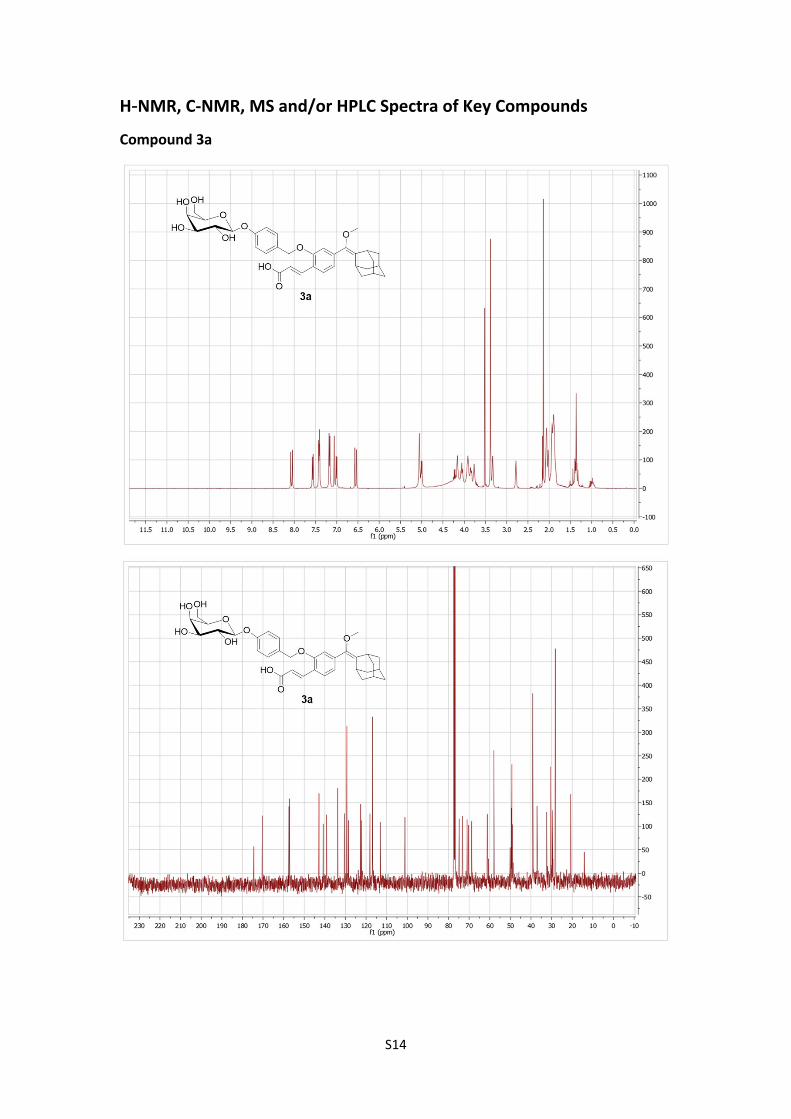
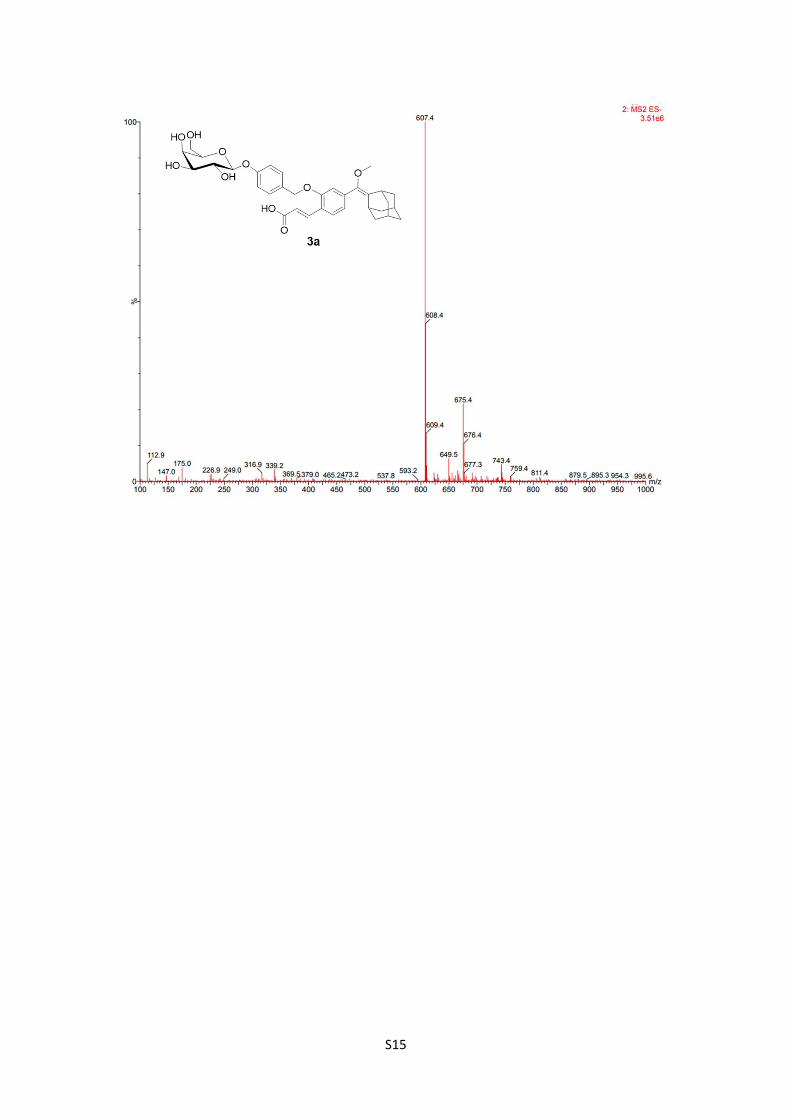
Compound 3a
Enol ether 3[1] (120 mg, 0.147 mmol, 1 eq), LiOH (21.3 mg, 0.887 mmol, 6 eq) were
dissolved in 2 ml of of 4:1 solution THF:H2O. Reaction mixture was stirred at room
temperature and monitored via RP-HPLC. Upon completion, reaction mixture was
diluted with EtOAc and washed with saturated aqueous NH4Cl solution followed by
brine. Organic phase was dried over Na2SO4 and concentrated under reduced
pressure to afford 64 mg (68% yield) of off-white solid. 1H NMR (400 MHz, CDCl3) δ
7.95 – 7.84 (m, J = 16.1 Hz, 1H), 7.41 (d, J = 8.0 Hz, 1H), 7.26 (d, J = 8.6 Hz, 2H), 7.01
(d, J = 8.5 Hz, 2H), 6.89 (s, 1H), 6.84 (d, J = 7.6 Hz, 1H), 6.39 (d, J = 16.1 Hz, 1H), 4.91
(s, 2H), 4.84 (d, J = 7.6 Hz, 1H), 3.99 (d, J = 6.4 Hz, 2H), 3.90 – 3.82 (m, 1H), 3.81 –
3.68 (m, J = 9.7, 5.0 Hz, 3H), 3.69 – 3.58 (m, J = 16.1, 7.9 Hz, 2H), 3.21 (s, 3H), 3.16 (s,
1H), 2.61 (s, 1H), 1.93 – 1.68 (m, 12H). 13C NMR (101 MHz, CDCl3) δ 229.19, 190.05,
174.44, 170.37, 157.42, 157.17, 142.84, 140.80, 139.15, 133.77, 130.46, 129.34,
128.53, 122.66, 122.30, 118.13, 116.86, 113.12, 101.15, 74.85, 73.28, 70.98, 70.25,
68.81, 61.19, 58.00, 39.20, 39.04, 37.07, 32.42, 30.44, 29.71, 28.22, 20.75. MS (ES-):
m/z calc. for C34H40O10: 608.26 ; found: 607.4 [M-H]-.
OHO
HOOH
OH
O
OO
HO
O
1) NHS, DCC, DCM2) methylene blue, O2, DCM59% over two steps
OHO
HOOH
OH
O
O
O
O
OO
O
N
O
O
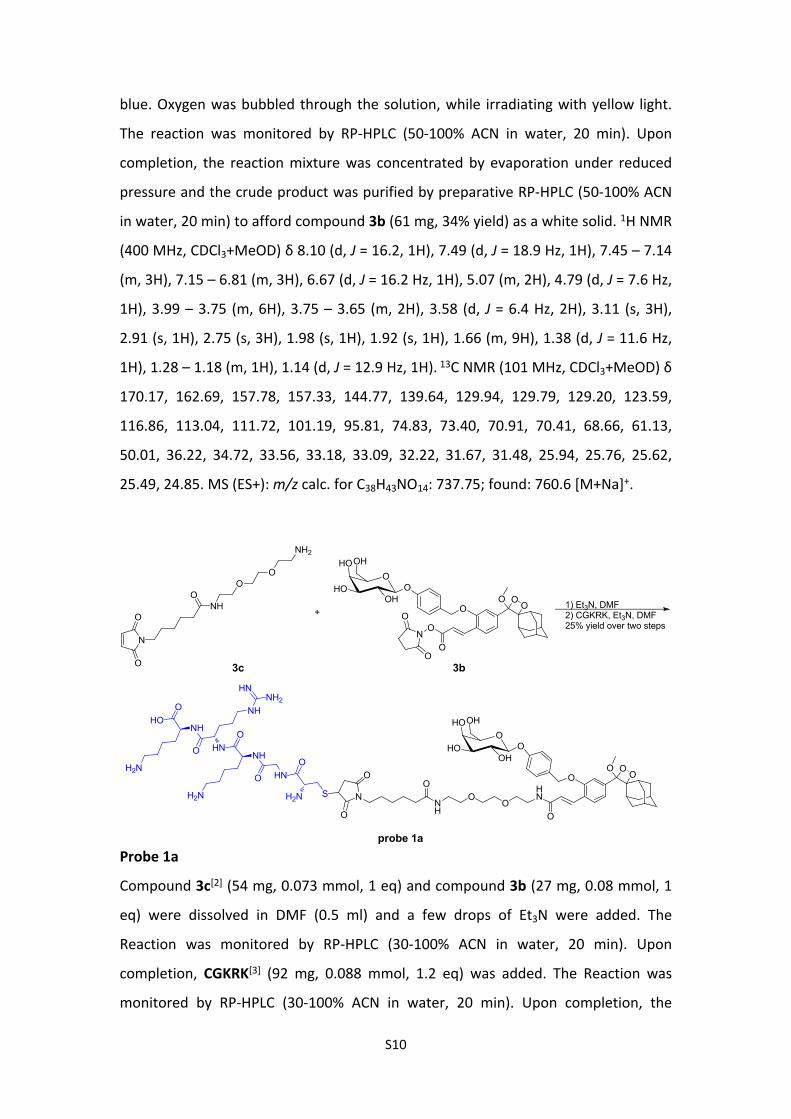
3a 3b
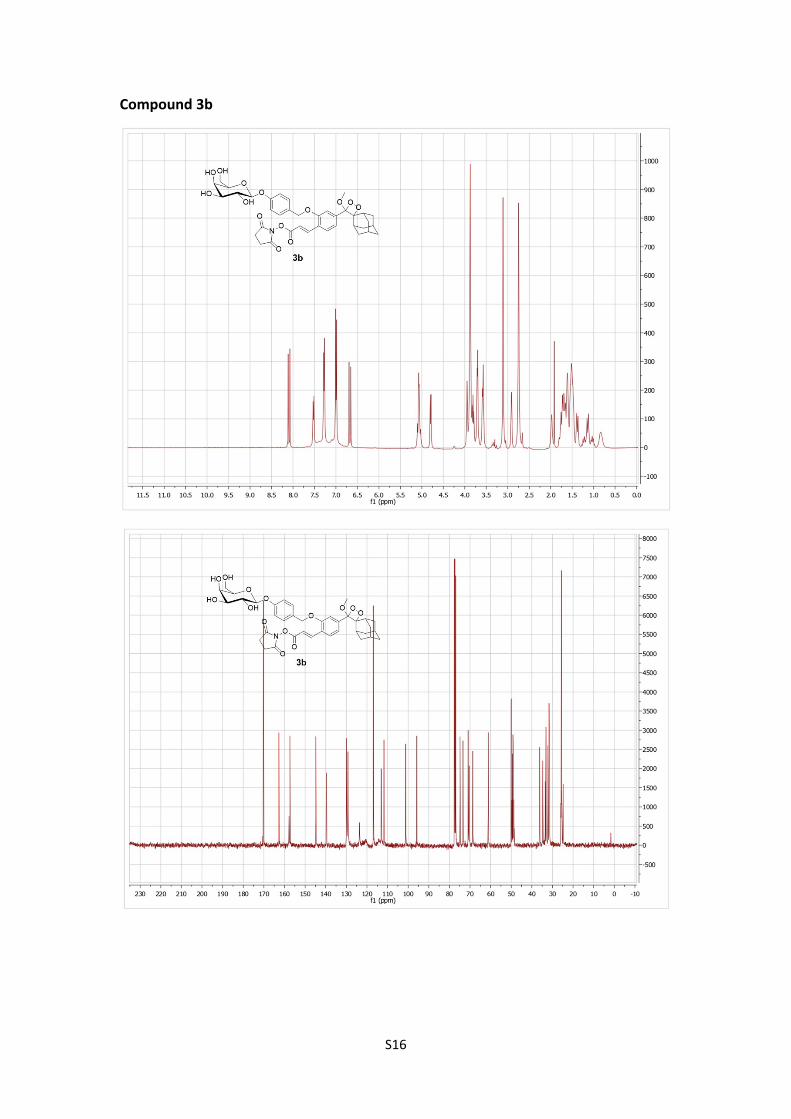
Compound 3b
Compound 3a (150 mg, 0.246 mmol, 1 eq) was dissolved in 1.5 ml of DCM and
cooled to 0oC. N-hydroxysuccinimide (57 mg, 0.49 mmol, 2 eq) was added followed
by N,N'-Dicyclohexylcarbodiimide (76 mg, 0.37 mmol, 1.5eq). The reaction was
allowed to warm up to room temperature and monitored by RP-HPLC. Upon
completion, 5 ml of DCM were added, followed by catalytic amount of methylene
S10
blue. Oxygen was bubbled through the solution, while irradiating with yellow light.
The reaction was monitored by RP-HPLC (50-100% ACN in water, 20 min). Upon
completion, the reaction mixture was concentrated by evaporation under reduced
pressure and the crude product was purified by preparative RP-HPLC (50-100% ACN
in water, 20 min) to afford compound 3b (61 mg, 34% yield) as a white solid. 1H NMR
(400 MHz, CDCl3+MeOD) δ 8.10 (d, J = 16.2, 1H), 7.49 (d, J = 18.9 Hz, 1H), 7.45 – 7.14
(m, 3H), 7.15 – 6.81 (m, 3H), 6.67 (d, J = 16.2 Hz, 1H), 5.07 (m, 2H), 4.79 (d, J = 7.6 Hz,
1H), 3.99 – 3.75 (m, 6H), 3.75 – 3.65 (m, 2H), 3.58 (d, J = 6.4 Hz, 2H), 3.11 (s, 3H),
2.91 (s, 1H), 2.75 (s, 3H), 1.98 (s, 1H), 1.92 (s, 1H), 1.66 (m, 9H), 1.38 (d, J = 11.6 Hz,
1H), 1.28 – 1.18 (m, 1H), 1.14 (d, J = 12.9 Hz, 1H). 13C NMR (101 MHz, CDCl3+MeOD) δ
170.17, 162.69, 157.78, 157.33, 144.77, 139.64, 129.94, 129.79, 129.20, 123.59,
116.86, 113.04, 111.72, 101.19, 95.81, 74.83, 73.40, 70.91, 70.41, 68.66, 61.13,
50.01, 36.22, 34.72, 33.56, 33.18, 33.09, 32.22, 31.67, 31.48, 25.94, 25.76, 25.62,
25.49, 24.85. MS (ES+): m/z calc. for C38H43NO14: 737.75; found: 760.6 [M+Na]+.
O
H2N S
O HN
O
NH
H2N
O HN
NH
HNNH2
O
NH
H2N
HO
OHO
HOOH
OH
O
O
O
O
OO
O
N
O
O
N
O
O
NHO
OO
NH2
+
OHO
HOOH
OH
O
O
O
OO
O
N
O
ONH
OO
OHN
1) Et3N, DMF2) CGKRK, Et3N, DMF25% yield over two steps
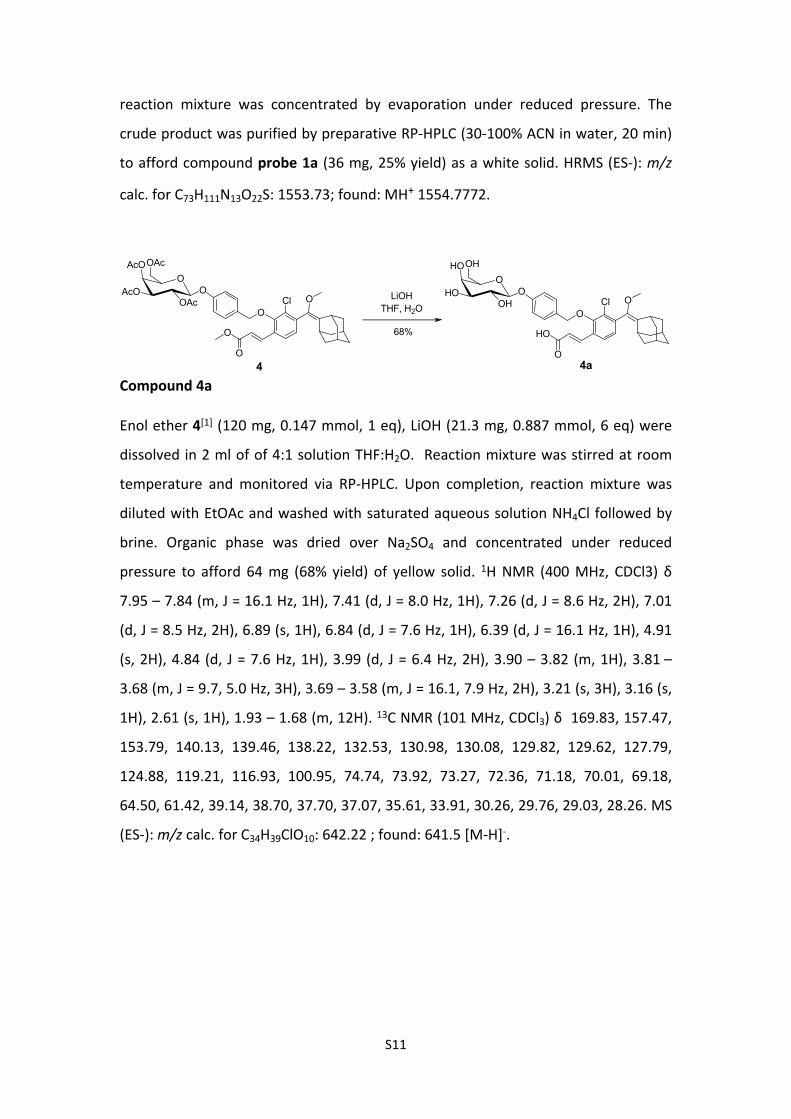
3b3c
probe 1a
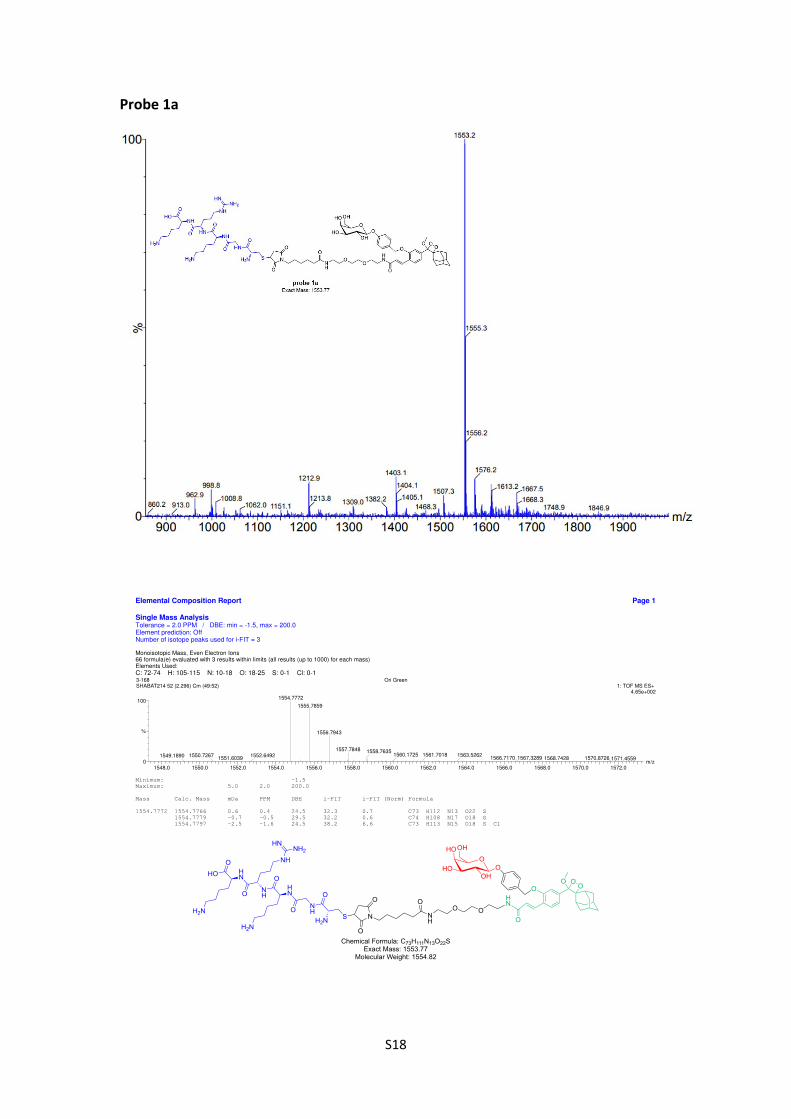
Probe 1a
Compound 3c[2] (54 mg, 0.073 mmol, 1 eq) and compound 3b (27 mg, 0.08 mmol, 1
eq) were dissolved in DMF (0.5 ml) and a few drops of Et3N were added. The
Reaction was monitored by RP-HPLC (30-100% ACN in water, 20 min). Upon
completion, CGKRK[3] (92 mg, 0.088 mmol, 1.2 eq) was added. The Reaction was
monitored by RP-HPLC (30-100% ACN in water, 20 min). Upon completion, the
S11
reaction mixture was concentrated by evaporation under reduced pressure. The
crude product was purified by preparative RP-HPLC (30-100% ACN in water, 20 min)
to afford compound probe 1a (36 mg, 25% yield) as a white solid. HRMS (ES-): m/z
calc. for C73H111N13O22S: 1553.73; found: MH+ 1554.7772.
OAcO
AcOOAc
OAc
O
OO
O
O
Cl
OHO
HOOH
OH
O
OO
HO
O
LiOHTHF, H2O
68%
Cl
4 4a
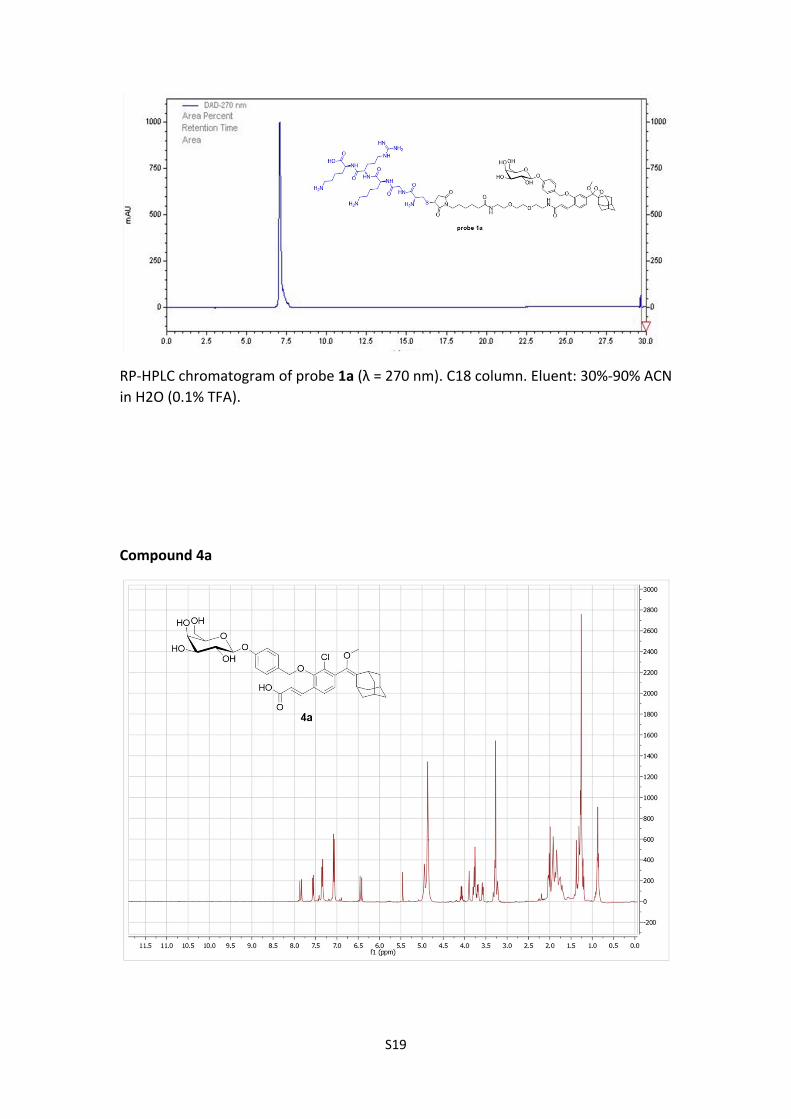
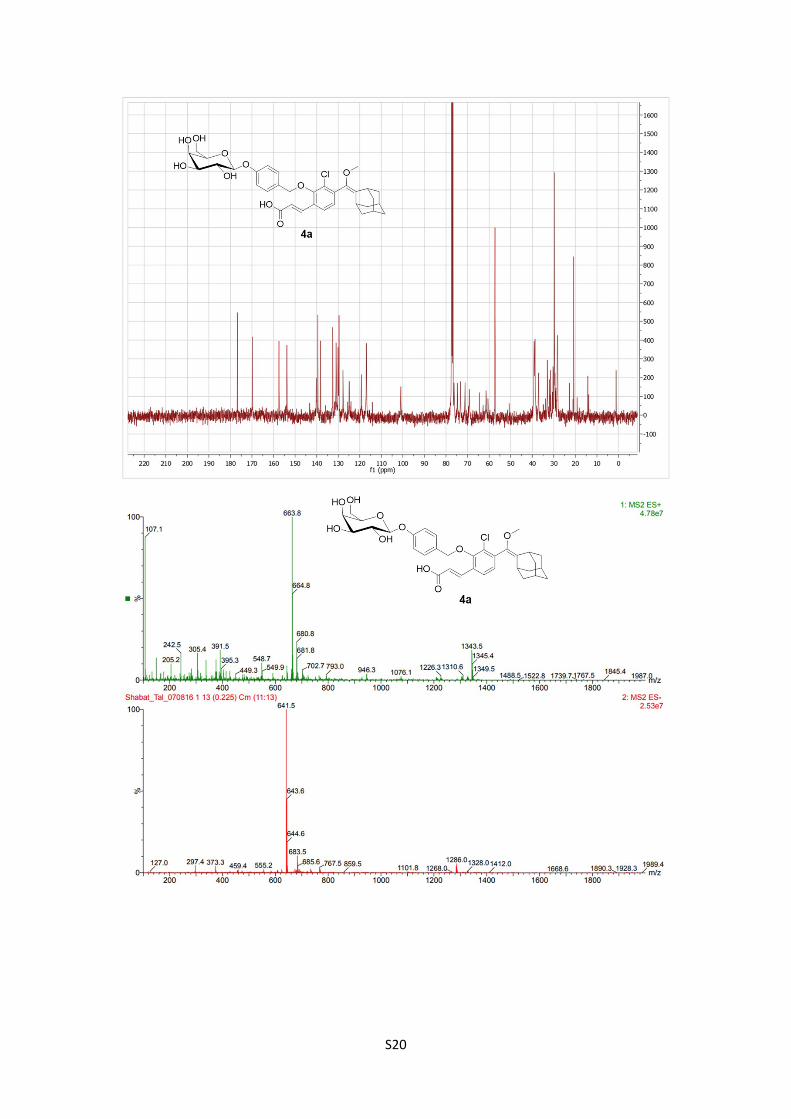
Compound 4a
Enol ether 4[1] (120 mg, 0.147 mmol, 1 eq), LiOH (21.3 mg, 0.887 mmol, 6 eq) were
dissolved in 2 ml of of 4:1 solution THF:H2O. Reaction mixture was stirred at room
temperature and monitored via RP-HPLC. Upon completion, reaction mixture was
diluted with EtOAc and washed with saturated aqueous solution NH4Cl followed by
brine. Organic phase was dried over Na2SO4 and concentrated under reduced
pressure to afford 64 mg (68% yield) of yellow solid. 1H NMR (400 MHz, CDCl3) δ
7.95 – 7.84 (m, J = 16.1 Hz, 1H), 7.41 (d, J = 8.0 Hz, 1H), 7.26 (d, J = 8.6 Hz, 2H), 7.01
(d, J = 8.5 Hz, 2H), 6.89 (s, 1H), 6.84 (d, J = 7.6 Hz, 1H), 6.39 (d, J = 16.1 Hz, 1H), 4.91
(s, 2H), 4.84 (d, J = 7.6 Hz, 1H), 3.99 (d, J = 6.4 Hz, 2H), 3.90 – 3.82 (m, 1H), 3.81 –
3.68 (m, J = 9.7, 5.0 Hz, 3H), 3.69 – 3.58 (m, J = 16.1, 7.9 Hz, 2H), 3.21 (s, 3H), 3.16 (s,
1H), 2.61 (s, 1H), 1.93 – 1.68 (m, 12H). 13C NMR (101 MHz, CDCl3) δ 169.83, 157.47,
153.79, 140.13, 139.46, 138.22, 132.53, 130.98, 130.08, 129.82, 129.62, 127.79,
124.88, 119.21, 116.93, 100.95, 74.74, 73.92, 73.27, 72.36, 71.18, 70.01, 69.18,
64.50, 61.42, 39.14, 38.70, 37.70, 37.07, 35.61, 33.91, 30.26, 29.76, 29.03, 28.26. MS
(ES-): m/z calc. for C34H39ClO10: 642.22 ; found: 641.5 [M-H]-.
S12
OHO
HOOH
OH
O
OO
HO
O
Cl1) NHS, DCC, DCM2) methylene blue, O2, DCM59% over two steps
OHO
HOOH
OH
O
O
O
O
Cl OO
O
N
O
O
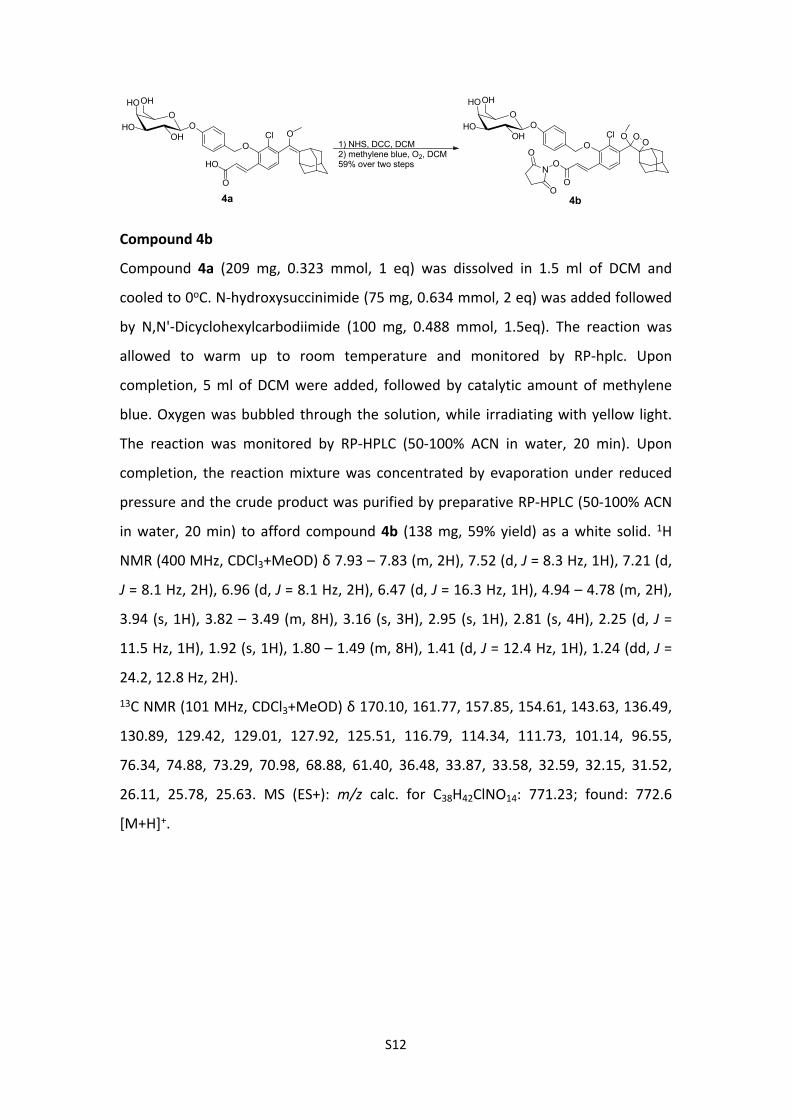
4a 4b
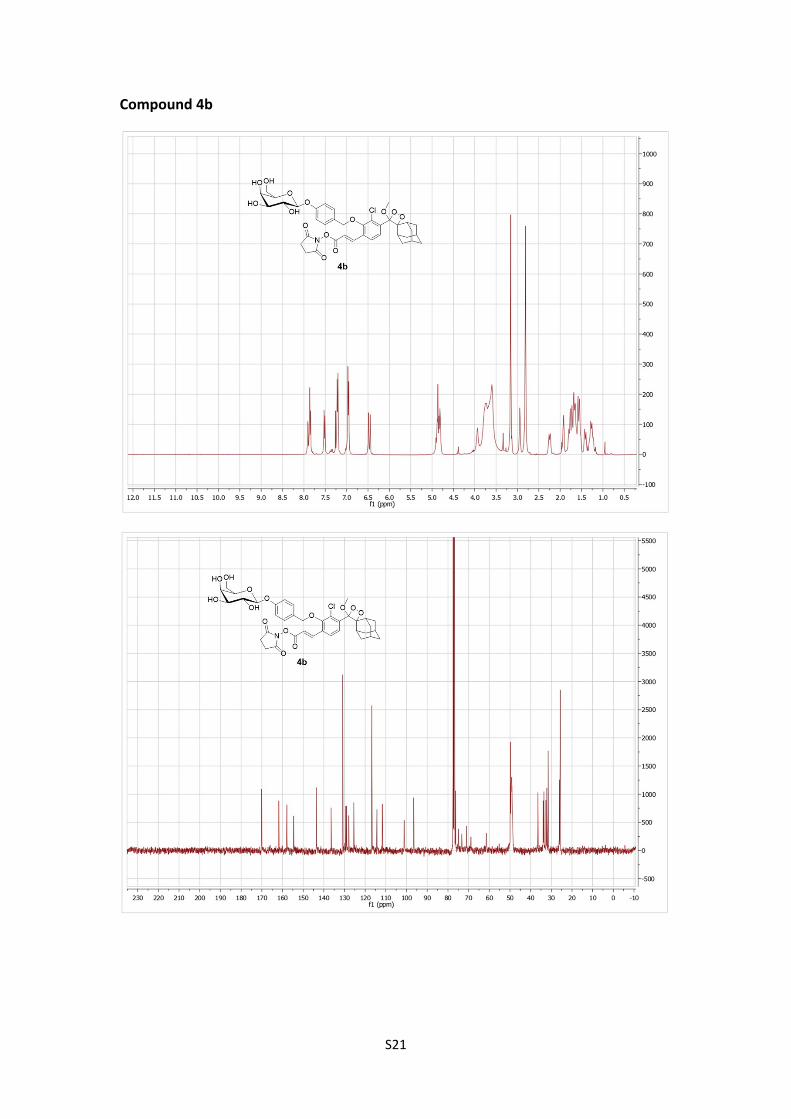
Compound 4b
Compound 4a (209 mg, 0.323 mmol, 1 eq) was dissolved in 1.5 ml of DCM and
cooled to 0oC. N-hydroxysuccinimide (75 mg, 0.634 mmol, 2 eq) was added followed
by N,N'-Dicyclohexylcarbodiimide (100 mg, 0.488 mmol, 1.5eq). The reaction was
allowed to warm up to room temperature and monitored by RP-hplc. Upon
completion, 5 ml of DCM were added, followed by catalytic amount of methylene
blue. Oxygen was bubbled through the solution, while irradiating with yellow light.
The reaction was monitored by RP-HPLC (50-100% ACN in water, 20 min). Upon
completion, the reaction mixture was concentrated by evaporation under reduced
pressure and the crude product was purified by preparative RP-HPLC (50-100% ACN
in water, 20 min) to afford compound 4b (138 mg, 59% yield) as a white solid. 1H
NMR (400 MHz, CDCl3+MeOD) δ 7.93 – 7.83 (m, 2H), 7.52 (d, J = 8.3 Hz, 1H), 7.21 (d,
J = 8.1 Hz, 2H), 6.96 (d, J = 8.1 Hz, 2H), 6.47 (d, J = 16.3 Hz, 1H), 4.94 – 4.78 (m, 2H),
3.94 (s, 1H), 3.82 – 3.49 (m, 8H), 3.16 (s, 3H), 2.95 (s, 1H), 2.81 (s, 4H), 2.25 (d, J =
11.5 Hz, 1H), 1.92 (s, 1H), 1.80 – 1.49 (m, 8H), 1.41 (d, J = 12.4 Hz, 1H), 1.24 (dd, J =
24.2, 12.8 Hz, 2H). 13C NMR (101 MHz, CDCl3+MeOD) δ 170.10, 161.77, 157.85, 154.61, 143.63, 136.49,
130.89, 129.42, 129.01, 127.92, 125.51, 116.79, 114.34, 111.73, 101.14, 96.55,
76.34, 74.88, 73.29, 70.98, 68.88, 61.40, 36.48, 33.87, 33.58, 32.59, 32.15, 31.52,
26.11, 25.78, 25.63. MS (ES+): m/z calc. for C38H42ClNO14: 771.23; found: 772.6
[M+H]+.
S13
O
H2N S
O HN
O
NH
H2N
O HN
NH
HNNH2
O
NH
H2N
HO
OHO
HOOH
OH
O
O
O
O
Cl OO
O
N
O
O
N
O
O
NHO
OO
NH2
+
OHO
HOOH
OH
O
O
O
Cl OO
O
N
O
ONH
OO
OHN
1) Et3N, DMF2) CGKRK, Et3N, DMF61% yield over two steps
4b4c
probe 2a
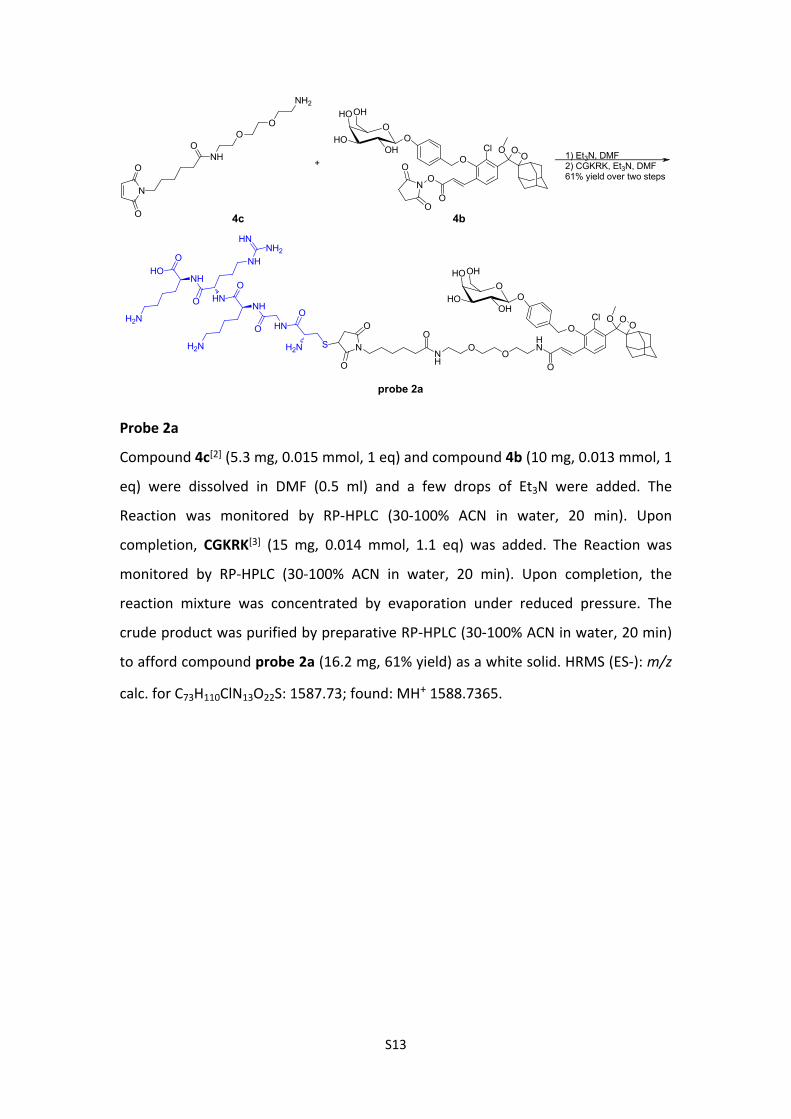
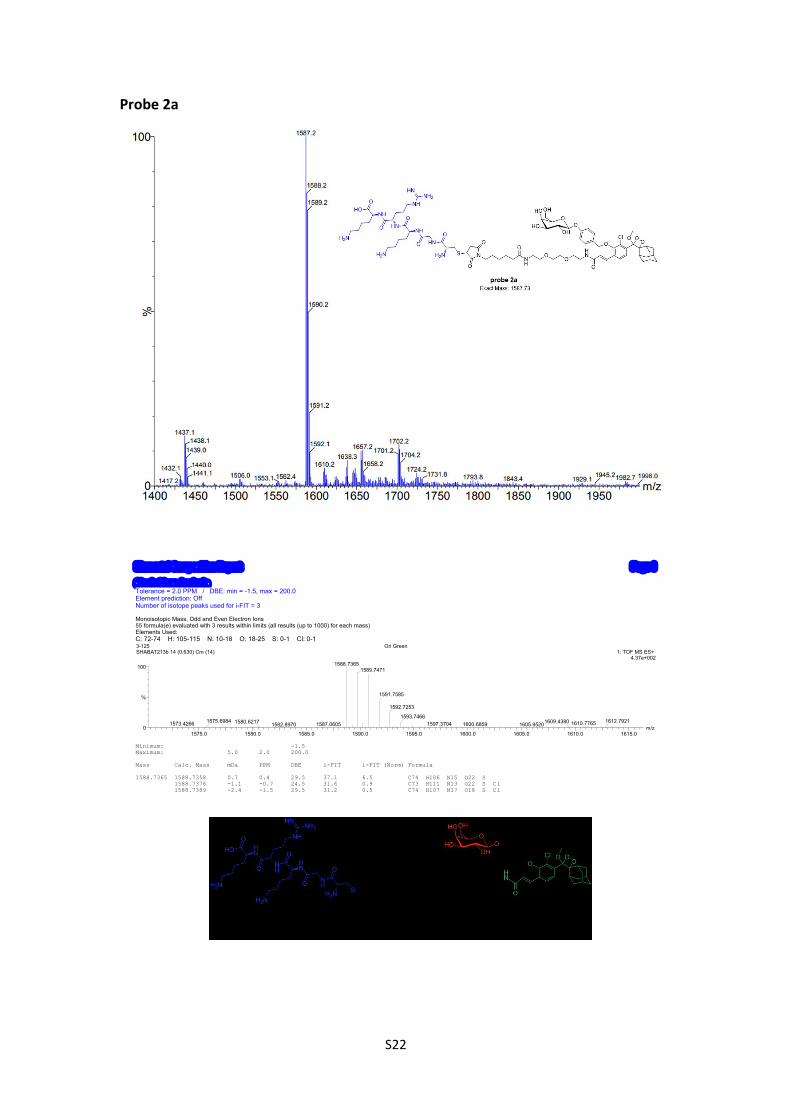
Probe 2a
Compound 4c[2] (5.3 mg, 0.015 mmol, 1 eq) and compound 4b (10 mg, 0.013 mmol, 1
eq) were dissolved in DMF (0.5 ml) and a few drops of Et3N were added. The
Reaction was monitored by RP-HPLC (30-100% ACN in water, 20 min). Upon
completion, CGKRK[3] (15 mg, 0.014 mmol, 1.1 eq) was added. The Reaction was
monitored by RP-HPLC (30-100% ACN in water, 20 min). Upon completion, the
reaction mixture was concentrated by evaporation under reduced pressure. The
crude product was purified by preparative RP-HPLC (30-100% ACN in water, 20 min)
to afford compound probe 2a (16.2 mg, 61% yield) as a white solid. HRMS (ES-): m/z
calc. for C73H110ClN13O22S: 1587.73; found: MH+ 1588.7365.
S14
H-NMR, C-NMR, MS and/or HPLC Spectra of Key Compounds
Compound 3a
S15
S16
Compound 3b
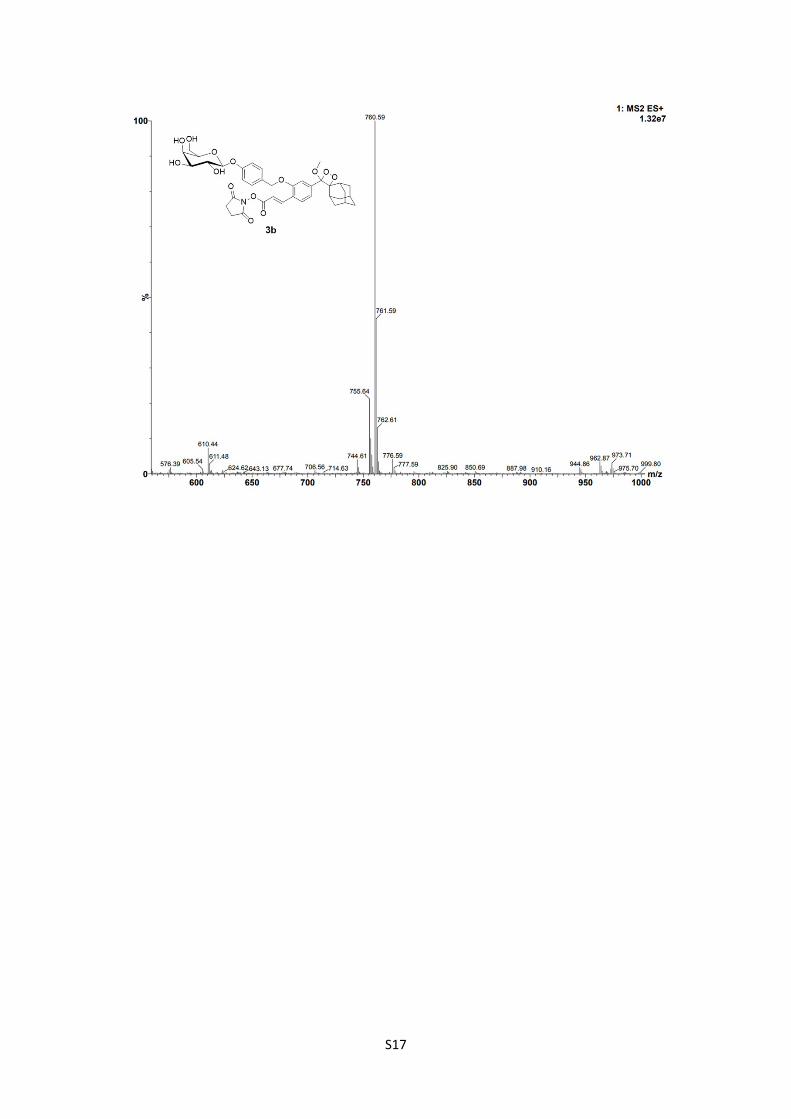
S17
S18
Probe 1a
S19
RP-HPLC chromatogram of probe 1a (λ = 270 nm). C18 column. Eluent: 30%-90% ACN in H2O (0.1% TFA).
Compound 4a
S20
S21
Compound 4b
S22
Probe 2a
Elemental Composition Report Page 1
Single Mass AnalysisTolerance = 2.0 PPM / DBE: min = -1.5, max = 200.0Element prediction: Off Number of isotope peaks used for i-FIT = 3
Monoisotopic Mass, Odd and Even Electron Ions55 formula(e) evaluated with 3 results within limits (all results (up to 1000) for each mass)Elements Used:C: 72-74 H: 105-115 N: 10-18 O: 18-25 S: 0-1 Cl: 0-1
m/z1575.0 1580.0 1585.0 1590.0 1595.0 1600.0 1605.0 1610.0 1615.0
%
0
100
Ori Green 3-125 SHABAT213b 14 (0.630) Cm (14) 1: TOF MS ES+
4.37e+0021588.7365
1573.4266 1575.6984 1587.06051582.89701580.6217
1589.7471
1591.7585
1592.7253
1593.74661610.77651597.3704 1600.6859 1609.43801605.9520 1612.7921
Minimum: -1.5Maximum: 5.0 2.0 200.0
Mass Calc. Mass mDa PPM DBE i-FIT i-FIT (Norm) Formula
1588.7365 1588.7358 0.7 0.4 29.5 37.1 6.5 C74 H106 N15 O22 S 1588.7376 -1.1 -0.7 24.5 31.6 0.9 C73 H111 N13 O22 S Cl 1588.7389 -2.4 -1.5 29.5 31.2 0.5 C74 H107 N17 O18 S Cl
S23
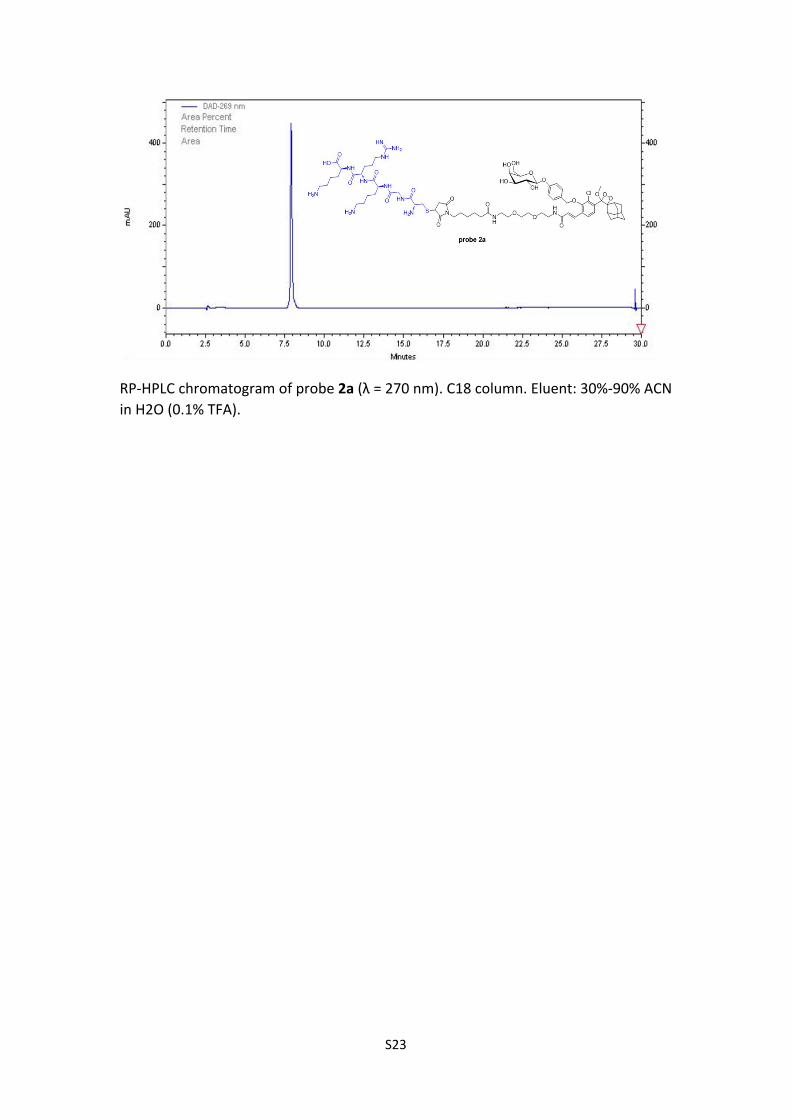
RP-HPLC chromatogram of probe 2a (λ = 270 nm). C18 column. Eluent: 30%-90% ACN in H2O (0.1% TFA).
S24
In vitro Experiments
Cell Culture
Murine colon carcinoma CT26.wt and CT26.CL5 cells were purchased from the
American Type Culture Collection (ATCC Manassas, VA, USA). CT26.WT cell line was
cultured in RPMI 1640 growing media supplemented with 10% FBS, 100 μg/mL
streptomycin, 100 units/mL penicillin, 12.5 units/mL nystatin and 2 mM L-glutamine.
CT26.CL25 cell line was cultured in RPMI 1640 growing media supplemented with
10% FBS, 100 μg/mL streptomycin, 100 units/mL penicillin, 12.5 units/mL nystatin, 2
mM L-glutamine, 4.5 g/L glucose, 10 mM HEPES and 1.0 mM sodium pyruvate and
supplemented with 0.1 mM non-essential amino-acids and 0.4 mg/ml G418. Cells
were grown at 37°C; 5% CO2.
Chemiluminescence imaging in living cells
CT26.wt and CT26.CL5 cells (40,000 cells/well) were seeded in 96 well corning clear
bottom plates with their growth medium. Following 24 h, medium was replaced and
to a fresh growth medium with materials 1, 1a, 2, 2a [5 μM]. Cells were immediately
imaged using BioSpace Lab PhotonIMAGERTM for 30 min. The experiment was
repeated 3 times.
In vivo Experiments
Ethics Statement
All animal procedures were performed in compliance with Tel Aviv University,
Sackler School of Medicine (Tel Aviv, Israel) guidelines, and protocols were approved
by the Tel Aviv University Institutional Animal Care and Use Committee (IACUC).
Intravital non-invasive chemiluminescence imaging
Six 7-weeks old BALB/c female mice (Harlan Laboratories Israel Ltd., Jerusalem,
Israel) were anesthetized using a mixture of ketamine (100 mg/kg) and xylazine (12
mg/kg) injected subcutaneously. Then, mice were injected subcutaneously with 50
μL of the materials 1, 1a, 2 or 2a, previously incubated in PBS 7.4 (in the presence or
absence of betagalactosidase) for 30 min. The mice were imaged and
S25
chemiluminescence was monitored for up to 30 min by intravital non-invasive
bioluminescence imaging system (Photon Imager; Biospace Lab, Paris, France).
Images were obtained by Photo-Acquisition software (Biospace Lab) and analyzed by
M3Vision Software (Biospace Lab). In addition, 30 6-weeks old BALB/c female mice
(Harlan Laboratories Israel Ltd., Jerusalem, Israel) were inoculated subcutaneously
with 1*106 murine CT26 cells. 15 mice were inoculated with CT26-wt and 15 with
CT26.Cl25. tumor growth was monitored q.o.d. until tumors were ~ 350 mm3. Mice
were anesthetized using a mixture of ketamine (100 mg/kg) and xylazine (12 mg/kg)
injected subcutaneously. Then, mice were injected with 100 μL of the materials A, B,
C or D, or saline control by intra-tumoral injection. The mice were imaged and
chemiluminescence was monitored for up to 30 min by intravital non-invasive
bioluminescence imaging system (Photon Imager; Biospace Lab, Paris, France).
Images were obtained by Photo-Acquisition software (Biospace Lab) and analyzed by
M3Vision Software (Biospace Lab).
Chemiluminescence signal was quantified as total signal of photons/exposure time
(sec)/ tumor size (mm3). Data is expressed as mean ± S.D.
References
[1] O. Green, T. Eilon, N. Hananya, S. Gutkin, C. R. Bauer, D. Shabat, ACS Cent. Sci.
2017, 3, 349–358.
[2] Chem. Biol. 2011, 18, 1261–1272.
[3] D. Shabat, M. Roth-Konforti, C. Bauer, Angew. Chemie Int. Ed. 2017, DOI
10.1002/anie.201709347.