Embed Size (px)
Citation preview
In vitro and ex vivo wettability of
hydrogel contact lenses
by
Ronan Rogers
A thesis
presented to the University of Waterloo
in fulfillment of the
thesis requirement for the degree of
Master of Science
in
Vision Science and Biology
Waterloo, Ontario, Canada, 2006
©Ronan Rogers 2006

ii
AUTHOR'S DECLARATION FOR ELECTRONIC SUBMISSION OF A THESIS I hereby declare that I am the sole author of this thesis. This is a true copy of the thesis, including any required final revisions, as accepted by my examiners. I understand that my thesis may be made electronically available to the public.
iii
Abstract
The wettability of contact lenses has become an area of intense research, with the belief
that the more “hydrophilic” or wettable the lens surface is, the more comfortable the lens may be,
as the posterior surface of the eyelid will move more smoothly over it, hence increasing comfort.
There are many ways to assess the wettability of a given material, namely sessile drop,1
captive bubble 2 or Wilhelmy plate. 3 This thesis used the sessile drop method to determine the
surface wettability of various hydrogel contact lens materials, by measuring the advancing contact
angle made between the lens surface and a pre-determined volume of HPLC-grade water. This was
followed by measuring the surface wettability following periods in which the lens materials were
soaked in various contact lens care regimens. Further studies determined wettability of lens
materials after various periods of in-eye wear and finally a study was undertaken to evaluate if a
novel biological technique could be used to differentiate proteins that deposit on hydrogel lens
materials that may affect wettability and cause discomfort.
A variety of hydrogel lenses, taken directly from their packaging and after soaking in
various care regimens, were analyzed to determine their sessile drop advancing contact angles, in
vitro. These studies indicated that poly-2-hydroxyethylmethacrylate (pHEMA)-based lenses are
inherently more wettable than silicone-based lenses, unless they have a surface treatment that
completely covers the hydrophobic siloxane groups. Additionally, certain combinations of lens
materials and care regimens produce inherently more wettable surfaces when measured in vitro.
Suitable methods to assess contact lens wettability ex vivo, or after subjects had worn
lenses for set periods of time, were developed. It was determined that using latex gloves to remove
lenses had no impact upon the lens surface wettability and that rinsing of the lens surface after
removal from the eye was required to determine the wettability of the underlying polymer.
iv
The final wettability studies involved an analysis of various lens materials from clinical
studies conducted within the Centre for Contact Lens Research (CCLR). These studies investigated
differences in wettability between silicone hydrogel lenses manufactured from differing polymers
and variations in ex vivo wettability of several combinations of lens materials and solutions, worn
for varying periods of time.
A novel method to investigate proteins extracted from lenses using 2D-Difference in Gel
Electrophoresis (DIGE) found that this technique could be used to analyze proteins extracted from
contact lenses. The data obtained showed that there was no difference between a group of subjects
who were symptomatic of lens-induced dryness or a control group, and that care solutions had a
minimal influence on the pattern of deposition seen.
The overall conclusion of these studies is that hydrogel lens wettability is affected by the
polymer composition and that care regimen components can modify the surface wettability.
v
Acknowledgements
The research involved in this thesis was undertaken through the support of numerous
people, for whom I have a great deal of respect and gratitude. Because of your unfaltering
assistance and genuine friendships over this time, I have gained much more than simply a degree.
Thanks goes to my two supervisors, Dr. Lyndon Jones and Dr. Matt Vijayan who have
given me guidance and access to their incredibly deep vaults of information as I made my way
through these uncharted waters.
I also need to express my appreciation to my committee members, Dr. Trefford Simpson
and Dr. Brendan McConkey without whom I would still be struggling though an aspect of vision
science or biology of which they were integral in pointing me the right way.
I would also like to acknowledge all the support that I received in the laboratories. From
Mary-Ann Glasier, Elizabeth Heikkila, Miriam Heynen and Andrea Spires, you truly were my four
wise (wo)men that always had a smile and an answer for my unending barrage of questions. I do
not know if I can ever thank you all enough.
Thanks also goes to Alcon Research Ltd for all the financial support through these two
years. I truly appreciate all the opportunities you have afforded me.
I would also like to thank all the support that I have received from fellow graduate students
from both vision science and biology, who gave constant friendship and understanding though all
the ups and downs.
Thanks to everyone at the school of optometry who truly make working there a joy.

vi
Last but not least, thanks to my family and loved ones whose resolute encouragement has
made this whole process an adventure that has made me a better person in the end. Thank you for
loving me back.
All of you together are so much greater than the parts.
vii
Table of Contents ABSTRACT ........................................................................................................................................ III ACKNOWLEDGEMENTS......................................................................................................................V TABLE OF CONTENTS ..................................................................................................................... VII LIST OF TABLES ............................................................................................................................... IX LIST OF FIGURES................................................................................................................................X CHAPTER 1 INTRODUCTION .............................................................................................................. 1
1.1 CONTACT LENS HISTORY ....................................................................................................... 1 1.2 MEASURING WETTABILITY..................................................................................................... 6 1.3 CONTACT LENS CARE SOLUTIONS........................................................................................ 15 1.4 TEAR FILM COMPONENTS AND CONTACT LENSES ............................................................... 23 1.5 TECHNIQUES TO ANALYSE PROTEIN DEPOSITION ON HYDROGEL LENSES .......................... 25
CHAPTER 2 MATERIALS AND METHODS ........................................................................................ 29 2.1 CONTACT LENSES ................................................................................................................. 29
2.1.1 Daily Disposable Lenses ............................................................................................. 29 2.1.2 pHEMA Based Frequent Replacement Lenses............................................................ 30 2.1.3 Silicone Hydrogel Lenses............................................................................................ 32
2.2 CARE SOLUTIONS.................................................................................................................. 33 2.3 WETTABILITY INSTRUMENTATION ....................................................................................... 36 2.4 PROTEIN DEPOSITION ON CONTACT LENSES ........................................................................ 42
CHAPTER 3 RESULTS AND DISCUSSION.......................................................................................... 49 3.1 IN VITRO DATA..................................................................................................................... 49
3.1.1 Blister Pack Solution Characteristics ......................................................................... 49 3.1.2 Variable Soak Time Study ........................................................................................... 50 3.1.3 Daily Wear Contact Lenses......................................................................................... 58 3.1.4 Silicone Hydrogel Lenses............................................................................................ 59 3.1.5 pHEMA Based Lenses ................................................................................................. 73
3.2 EX VIVO DATA...................................................................................................................... 80 3.2.1 Impact of Lens Removal on Ex Vivo Wettability Study ............................................... 80 3.2.2 Influence of Rinse vs Saline Soak Study...................................................................... 81 3.2.3 Influence of Saline Cycling on Contact Angle Assessment Study ............................... 84 3.2.4 Influence of Presoaking Galyfilcon A With Care Regimens ....................................... 87
viii
3.3 CLINICAL TRIALS.................................................................................................................. 89 3.3.1 DOSL Study................................................................................................................. 89 3.3.2 Influence of Presoaking Etafilcon A on Short Term Wettability ................................. 91
3.4 PROTEIN DEPOSITION ANALYSIS BY 2D GEL ELECTROPHORESIS ...................................... 106 3.4.1 Protein Assay – First Trial........................................................................................ 106 3.4.2 Protein Assay Final Samples .................................................................................... 109 3.4.3 2D DIGE Gels........................................................................................................... 112 3.4.4 Protein Identification ................................................................................................ 118
CHAPTER 4 SUMMARY AND FURTHER WORK ............................................................................. 122 4.1 IN VITRO WETTABILITY STUDIES ....................................................................................... 122 4.2 EX VIVO WETTABILITY STUDIES........................................................................................ 126 4.3 EX VIVO CLINICAL TRIAL ASSESSMENT OF LENS WETTABILITY ...................................... 127 4.4 PROTEIN DEPOSITION STUDIES........................................................................................... 129 4.5 SUMMARY ........................................................................................................................... 131
ix
List of Tables TABLE 1-1 FDA CATEGORIZATION OF CONVENTIONAL HYDROGELS................................................ 3 TABLE 1-2 MEDICINAL INGREDIENTS OF CONTACT LENS CARE SOLUTIONS46 ................................ 17 TABLE 1-3 HYDROPHOBIC AND HYDROPHILIC GROUPS USED WITHIN SURFACTANTS54 .................. 20 TABLE 2-1 DAILY DISPOSABLE CONTACT LENSES ........................................................................... 30 TABLE 2-2 PHEMA-BASED FREQUENT REPLACEMENT LENSES....................................................... 31 TABLE 2-3 CHARACTERISTICS OF SILICONE BASED CONTACT LENSES............................................ 32 TABLE 2-4 CONTACT LENS CARE SOLUTIONS .................................................................................. 34 TABLE 2-5 SDS EQUILIBRATION BUFFER ......................................................................................... 44 TABLE 2-6 EXPERIMENTAL DESIGN FOR DIGE CYDYE - SUBJECT COMBINATION .......................... 45 TABLE 2-7 POLYACRYLAMIDE GEL COMPOSITION............................................................................ 47 TABLE 2-8 CYDYE WAVELENGTH ACTIVATION ............................................................................... 47 TABLE 3-1 PHEMA BLISTER PACK SOLUTIONS CHARACTERISTICS ................................................ 50 TABLE 3-2 SILICONE HYDROGEL BLISTER PACK SOLUTION CHARACTERISTICS ............................. 50 TABLE 3-3 STATISTICALLY SIGNIFICANT DIFFERENCES - ACUVUE ADVANCE SOAKED LENSES ..... 64 TABLE 3-4 STATISTICALLY SIGNIFICANT DIFFERENCES - NIGHT AND DAY SOAKED LENSES ......... 66 TABLE 3-5 STATISTICALLY SIGNIFICANT DIFFERENCES - O2 OPTIX SOAKED LENSES ..................... 68 TABLE 3-6 STATISTICALLY SIGNIFICANT DIFFERENCES - PUREVISION SOAKED LENSES................. 70 TABLE 3-7 STATISTICALLY SIGNIFICANT DIFFERENCES - ACUVUE OASYS SOAKED LENSES ........ 72 TABLE 3-8 STATISTICALLY SIGNIFICANT DIFFERENCES - PROCLEAR SOAKED LENSES ................... 75 TABLE 3-9 STATISTICALLY SIGNIFICANT DIFFERENCES - SOFLENS 66 SOAKED LENSES ................. 77 TABLE 3-10 STATISTICALLY SIGNIFICANT DIFFERENCES WITH ACUVUE 2 SOAKED LENSES .......... 79 TABLE 3-11 CONTACT ANGLE RESULTS FOR GLOVE IMPACT STUDY .............................................. 81 TABLE 3-12 WETTABILITY MEASUREMENTS, CONTACT ANGLES (OUT OF EYE METHOD) ................ 92 TABLE 3-13 WETTABILITY MEASUREMENTS (RINSE METHOD)......................................................... 97 TABLE 3-14 WETTABILITY MEASUREMENTS (SOAK METHOD) ....................................................... 101 TABLE 3-15 PRELIMINARY PROTEIN ASSAY CONCENTRATIONS .................................................... 107 TABLE 3-16 FINAL PROTEIN ASSAY CONCENTRATIONS................................................................. 110 TABLE 3-17 FINAL 2-D GEL VOLUMES........................................................................................... 111 TABLE 3-18 CONTACT LENS TEAR FILM PROTEINS72 ..................................................................... 121
x
List of Figures FIGURE 1-1 ATOMIC FORCE MICROSCOPY OF VARIOUS CONTACT LENS SURFACES............................ 5 FIGURE 1-2 WETTABILITY – EXAMPLE OF THE CAPTIVE BUBBLE TECHNIQUE.................................. 9 FIGURE 1-3 WETTABILITY – EXAMPLE OF THE WILHELMY PLATE TECHNIQUE............................... 11 FIGURE 1-4 WETTABILITY – EXAMPLE OF THE SESSILE DROP TECHNIQUE ..................................... 14 FIGURE 1-5 OUTLINE OF 2D-DIGE PROCESS 75 ................................................................................. 27 FIGURE 1-6 SCHEMATIC OF CYDYE LABELING REACTION75 ............................................................. 28 FIGURE 2-1 MODEL 3320 OSMOMETER............................................................................................. 35 FIGURE 2-2 CAHN DCA 322 ............................................................................................................ 36 FIGURE 2-3 DATAPHYSICS OPTICAL CONTACT ANGLE ANALYZER ................................................. 37 FIGURE 2-4 LENS ON CUSTOM MANTLE BENEATH OCA SYRINGE .................................................. 39 FIGURE 2-5 DROP PROFILE EXAMPLES.............................................................................................. 40 FIGURE 2-6 SCREEN CAPTURE OF SCA SOFTWARE........................................................................... 41 FIGURE 2-7 STANDARD CURVE OF PROTEIN ASSAY......................................................................... 43 FIGURE 3-1 O2 OPTIX (LOTRAFILCON B) SOAKED IN RENU MOISTURELOC.................................... 51 FIGURE 3-2 O2 OPTIX (LOTRAFILCON B) SOAKED IN OPTIFREE EXPRESS ....................................... 53 FIGURE 3-3 ACUVUE 2 (ETAFILCON A) SOAKED IN RENU MOISTURELOC....................................... 54 FIGURE 3-4 ACUVUE 2 (ETAFILCON A) SOAKED IN OPTIFREE EXPRESS .......................................... 56 FIGURE 3-5 ACUVUE 2 (ETAFILCON A) SOAKED IN BOTH SOLUTION, SALINE PRE-WASH................. 57 FIGURE 3-6 DAILY WEAR DAILY DISPOSABLE CONTACT LENSES ................................................... 58 FIGURE 3-7 SILICONE HYDROGELS OUT OF PACK ............................................................................ 60 FIGURE 3-8 ACUVUE ADVANCE IN CARE SOLUTIONS ...................................................................... 63 FIGURE 3-9 FOCUS NIGHT & DAY IN CARE SOLUTIONS ................................................................... 65 FIGURE 3-10 O2 OPTIX IN CARE SOLUTIONS..................................................................................... 67 FIGURE 3-11 PUREVISION IN CARE SOLUTIONS ................................................................................ 69 FIGURE 3-12 ACUVUE OASYS IN CARE SOLUTIONS........................................................................ 71 FIGURE 3-13 PROCLEAR IN CARE SOLUTIONS .................................................................................. 74 FIGURE 3-14 SOFLENS 66 IN CARE SOLUTIONS................................................................................. 76 FIGURE 3-15 ACUVUE 2 IN CARE SOLUTIONS ................................................................................... 78 FIGURE 3-16 SUBJECT ONE RINSE VERSUS SOAK CONTACT ANGLE RESULTS................................. 82 FIGURE 3-17 SUBJECT TWO RINSE VERSUS SOAK CONTACT ANGLE RESULTS................................ 83 FIGURE 3-18 SUBJECT ONE SALINE CYCLING CONTACT ANGLE RESULTS ...................................... 85
xi
FIGURE 3-19 SUBJECT TWO SALINE CYCLING CONTACT ANGLE RESULTS ..................................... 86 FIGURE 3-20 SUBJECT THREE SALINE CYCLING CONTACT ANGLE RESULTS .................................. 86 FIGURE 3-21 ACUVUE ADVANCE CONTACT ANGLES ....................................................................... 88 FIGURE 3-22 ACUVUE ADVANCE COMFORT RATING ....................................................................... 88 FIGURE 3-23 DOSL EX VIVO WETTABILITY .................................................................................... 90 FIGURE 3-24 EX VIVO WETTABILITY FOR SOLUTIONS OVER TIME (OUT-OF-EYE METHOD) ............... 93 FIGURE 3-25 EX VIVO WETTABILITY FOR THE TWO GROUPS OVER TIME (OUT-OF-EYE METHOD) ..... 93 FIGURE 3-26 EX VIVO WETTABILITY FOR GROUPS VS SOLUTIONS (OUT-OF-EYE METHOD) ............... 94 FIGURE 3-27 EX VIVO WETTABILITY FOR GROUPS (OUT-OF-EYE METHOD)....................................... 94 FIGURE 3-28 EX VIVO WETTABILITY OVER TIME (OUT-OF-EYE METHOD) ......................................... 95 FIGURE 3-29 EX VIVO WETTABILITY FOR THE LENS CARE REGIMENS (OUT-OF-EYE METHOD) ........ 95 FIGURE 3-30 EX VIVO WETTABILITY FOR SOLUTIONS OVER TIME (RINSE METHOD).......................... 97 FIGURE 3-31 EX VIVO WETTABILITY FOR THE TWO GROUPS OVER TIME (RINSE METHOD)................ 98 FIGURE 3-32 EX VIVO WETTABILITY FOR GROUPS VS SOLUTIONS (RINSE METHOD) ......................... 98 FIGURE 3-33 EX VIVO WETTABILITY FOR GROUPS (RINSE METHOD) ................................................. 99 FIGURE 3-34 EX VIVO WETTABILITY OVER TIME (RINSE METHOD).................................................... 99 FIGURE 3-35 EX VIVO WETTABILITY FOR THE LENS CARE REGIMENS (RINSE METHOD)................. 100 FIGURE 3-36 EX VIVO WETTABILITY FOR SOLUTIONS OVER TIME (SOAK METHOD) ........................ 102 FIGURE 3-37 EX VIVO WETTABILITY FOR THE TWO GROUPS OVER TIME (SOAK METHOD) .............. 102 FIGURE 3-38 EX VIVO WETTABILITY FOR GROUPS VS SOLUTIONS (SOAK METHOD) ........................ 103 FIGURE 3-39 EX VIVO WETTABILITY FOR GROUPS (SOAK METHOD)................................................ 103 FIGURE 3-40 EX VIVO WETTABILITY OVER TIME (SOAK METHOD) .................................................. 104 FIGURE 3-41 EX VIVO WETTABILITY FOR THE LENS CARE REGIMENS (SOAK METHOD) ................. 104 FIGURE 3-42 EFFECT OF RINSE AND SOAK METHOD ON CONTACT ANGLES.................................. 105 FIGURE 3-43 PRELIMINARY PROTEIN ASSAY SILVER STAINING SYMPTOMATIC SAMPLE ............. 108 FIGURE 3-44 PRELIMINARY PROTEIN ASSAY SILVER STAINING ASYMPTOMATIC SAMPLE ........... 108 FIGURE 3-45 CYDYE2 STAINING FOR ALL GELS ............................................................................ 114 FIGURE 3-46 CYDYE3 STAINING FOR ALL GELS ............................................................................ 115 FIGURE 3-47 CYDYE5 STAINING FOR ALL GELS ............................................................................ 116 FIGURE 3-48 2D DIGE PROTEIN IDENTIFICATION ........................................................................... 120
1
Chapter 1 Introduction
1.1 Contact Lens History
Contact lenses, as we know them today, have been in use for just over half a century. A
large number of materials have been experimented with and the problems regarding each have
challenged manufacturers to produce more advanced and biocompatible devices. The origin of
these lenses dates back to the 1940’s, with the debut of perspex or polymethyl methacrylate
(PMMA). The major disadvantage of PMMA is that it was impermeable to oxygen and interferes
with corneal metabolism, due to the chronic hypoxia induced by the reduced oxygen supply. New
materials were needed that were permeable to oxygen and other gases, resulting in the development
of two new types of lens materials, one of which contained water (hydrogels) and one which was
water-free (gas permeable or GP materials). 4 The GP materials consisted of a combination of
PMMA and silicone or fluorine-based monomers, both of which greatly increased the transmission
of oxygen to the cornea. A benefit of these lenses was that the silicone/fluorine monomers were
chemically bound within the rigid lens matrix and thus cannot reorient themselves towards the
surface, resulting in a hydrophobic, lipophilic surface.5
Due to their initial discomfort and increased complexity when being fitted, softer, more
flexible hydrogel lenses have dominated the market since their development in the early 1970’s,
with over 90% of patients wearing this lens type.4 The dominance of hydrogels was primarily due
to their increased initial comfort and reduced sensation of dryness compared with GP lenses.
However, despite their success, an estimated 3 million wearers per year worldwide still “drop-out”
or cease lens wear due to irritation.6-11
The first hydrogel material was poly-2-hydroxyethyl methacrylate (pHEMA).12 Lenses
made from this material are cheap to manufacture and very consistent, due to the fact that changes
2
in temperature, pH and tonicity have relatively little effect on their water content, resulting in a lens
that is very stable to changes in their dimensions.13 Lenses based on this monomer are widely used
and are still extensively fitted today. The only disadvantage of this material is that it is still
relatively impermeable to oxygen when worn, which leads to various hypoxic conditions such as
slowing of mitosis, a reduced number of hemidesmosomes, as well as the occurrence of epithelial
microcysts.14
Oxygen transmission through contact lenses can be expressed by quoting a value based on
the amount of oxygen that gets though the thickness of the lens. This is referred to as the oxygen
transmissibility or “Dk/t” of the lens, with D representing the diffusion coefficient, or how fast
dissolved oxygen moves through a given material, k representing the constant of dissolved oxygen
molecules within the material and t the thickness of the lens in mm.
Manufacturers have developed variations of the polyHEMA material by adding other
monomers to polyHEMA, in an attempt to increase the water content and therefore increase the
amount of oxygen getting through to the cornea. The method by which this was initially achieved
was to add strongly hydrophilic monomers such as N-vinylpyrolidinone (NVP) and methacrylic
acid (MAA) to the matrix.15
The surface properties of these hydrogel materials and the way they interact with the tear
film is determined by the bulk properties of the lens, as well as the method by which it was created,
which is typically by cast molding or via a lathing technique.5 The choice of monomers used
depends on numerous factors, such as the stability and safety of the material as well as how it
interacts with the tear film. A highly important factor is the ionic charge of these monomers, which
directly affects the way the eventual lens material behaves on the eye. Materials consisting of
monomers that are relatively neutral in their charge tend to attract low amounts of protein from the
3
tear film, while those that are higher in charge attract materials of lower isoelectric point.5 Tear film
components that can be detected on hydrogel lenses include lactoferrin, albumin16-18 and
lysozyme.19-22
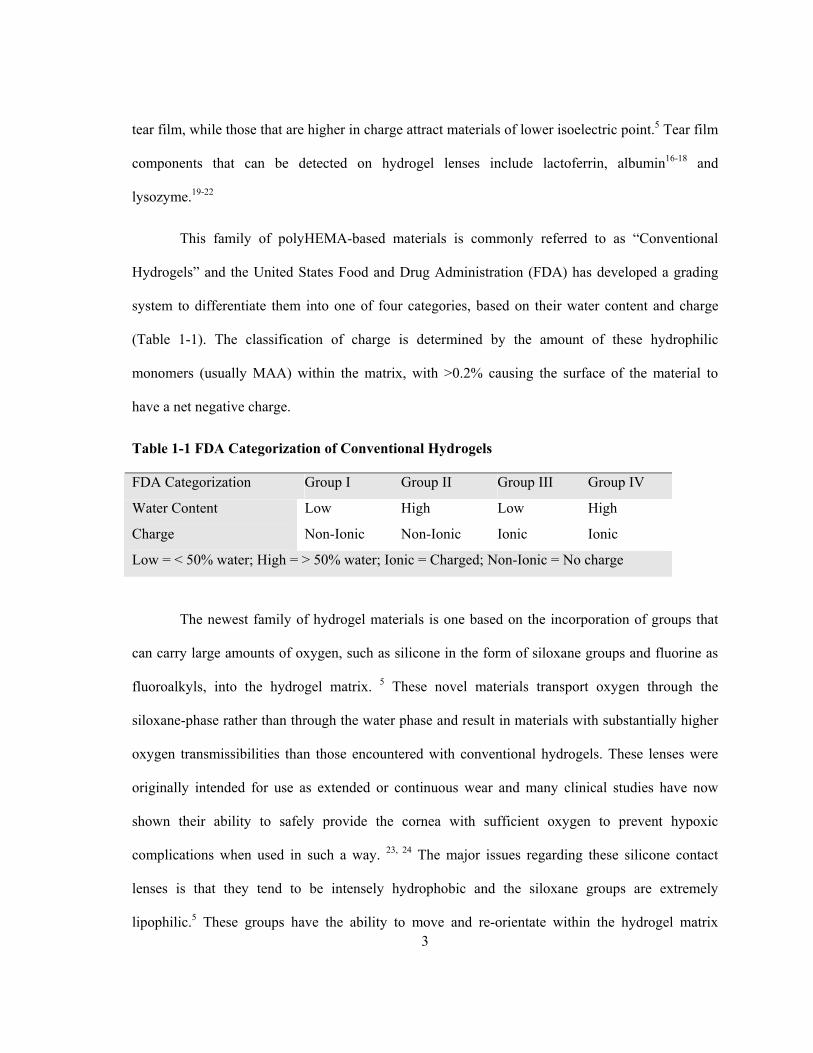
This family of polyHEMA-based materials is commonly referred to as “Conventional
Hydrogels” and the United States Food and Drug Administration (FDA) has developed a grading
system to differentiate them into one of four categories, based on their water content and charge
(Table 1-1). The classification of charge is determined by the amount of these hydrophilic
monomers (usually MAA) within the matrix, with >0.2% causing the surface of the material to
have a net negative charge.
Table 1-1 FDA Categorization of Conventional Hydrogels
FDA Categorization Group I Group II Group III Group IV
Water Content Low High Low High
Charge Non-Ionic Non-Ionic Ionic Ionic
Low = < 50% water; High = > 50% water; Ionic = Charged; Non-Ionic = No charge
The newest family of hydrogel materials is one based on the incorporation of groups that
can carry large amounts of oxygen, such as silicone in the form of siloxane groups and fluorine as
fluoroalkyls, into the hydrogel matrix. 5 These novel materials transport oxygen through the
siloxane-phase rather than through the water phase and result in materials with substantially higher
oxygen transmissibilities than those encountered with conventional hydrogels. These lenses were
originally intended for use as extended or continuous wear and many clinical studies have now
shown their ability to safely provide the cornea with sufficient oxygen to prevent hypoxic
complications when used in such a way. 23, 24 The major issues regarding these silicone contact
lenses is that they tend to be intensely hydrophobic and the siloxane groups are extremely
lipophilic.5 These groups have the ability to move and re-orientate within the hydrogel matrix
4
(which they cannot do within RGP lens materials) and since air is fairly hydrophobic, these groups
orient themselves preferentially to the lens surface. Once these groups have moved to the surface of
the lens they cause numerous problems, such as disrupting the tear film and causing dry areas on
the lens, which may result in discomfort to the wearer, as well as causing a large amount of lipids to
be deposited onto the surface.25
The silicone within these lenses is bound in siloxane groups (–Si(CH3)2–O–) and these are
primarily intended to carry the oxygen to the cornea, while the traditional hydrogel elements
control the movement of fluids and prevent the lens binding to the cornea.5
The other monomers included in silicone hydrogels are listed in Table 2-3. Through two
decades of research, manufacturers have finally been able to create a group of lens materials that
allow for greater oxygen transmissibility to the cornea, as well as more comfortable wear. At this
point, there are currently five different silicone-containing contact lenses available on the market,
each with its own specific characteristics (see Table 2-3).
To overcome the inherent hydrophobicity of siloxane lenses, companies have to modify the
surface of the lens material to “hide” the siloxane groups by using a variety of surface-treatment
strategies. One of the methods used is to place the lenses in a gas plasma reactive chamber to create
a “permanent, ultrathin, high refractive index, continuous hydrophilic surface”,15, 26, 27 as seen for
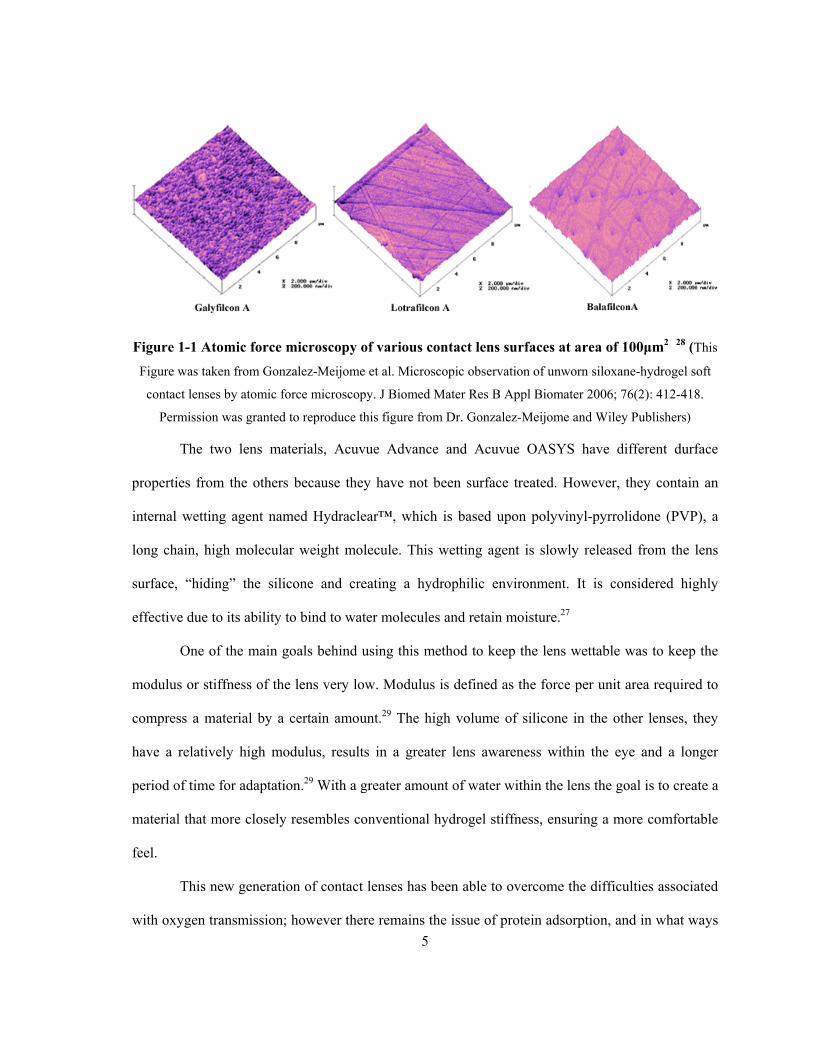
lotrafilcon A, in Figure 1-1. Another method used to modify the surface of the lens material is
found in the balafilcon A material, whereby the silicone components form silicate islands whose
hydrophilicity is meant to bridge over the fundamental hydrophobic nature of the silicone
material.27 This process aims to modify these groups in order to place more polar and wettable
groups at the surface and hide the hydrophobic components beneath. Both of these treatments can
be compared to the galyfilcon A material, which has no surface treatment.
5
Figure 1-1 Atomic force microscopy of various contact lens surfaces at area of 100μm2 28 (This
Figure was taken from Gonzalez-Meijome et al. Microscopic observation of unworn siloxane-hydrogel soft
contact lenses by atomic force microscopy. J Biomed Mater Res B Appl Biomater 2006; 76(2): 412-418.
Permission was granted to reproduce this figure from Dr. Gonzalez-Meijome and Wiley Publishers)
The two lens materials, Acuvue Advance and Acuvue OASYS have different durface
properties from the others because they have not been surface treated. However, they contain an
internal wetting agent named Hydraclear™, which is based upon polyvinyl-pyrrolidone (PVP), a
long chain, high molecular weight molecule. This wetting agent is slowly released from the lens
surface, “hiding” the silicone and creating a hydrophilic environment. It is considered highly
effective due to its ability to bind to water molecules and retain moisture.27
One of the main goals behind using this method to keep the lens wettable was to keep the
modulus or stiffness of the lens very low. Modulus is defined as the force per unit area required to
compress a material by a certain amount.29 The high volume of silicone in the other lenses, they
have a relatively high modulus, results in a greater lens awareness within the eye and a longer
period of time for adaptation.29 With a greater amount of water within the lens the goal is to create a
material that more closely resembles conventional hydrogel stiffness, ensuring a more comfortable
feel.
This new generation of contact lenses has been able to overcome the difficulties associated
with oxygen transmission; however there remains the issue of protein adsorption, and in what ways
6
this could potentially impact upon the comfort for the wearer. This issue shall be analyzed in an
upcoming section (Section 1.3).
1.2 Measuring Wettability
The majority of patients who cease lens wear do so because of problems relating to in-eye
compatibility, with discomfort and dryness being the principle reasons.6-11 Problems associated with
lens comfort may be inherently linked to wettability of the lens surfaces, as more wettable surfaces
may produce less interaction between the front surface of the lens and the back surface of the
eyelid.
Wettability may be determined either in-eye, by measuring the break-up time of the tears
over the lens surface,30, 31 or by using a variety of laboratory techniques that primarily determine the
“contact angle” of a fluid upon the lens surface.1-3, 32-35 When a fluid is placed on a given surface,
the degree to which it spreads dictates how hydrophilic or hydrophobic that material is to that given
liquid. As discussed earlier, when the contact lens surface has molecules that are hydrophilic or the
surface has been modified to be hydrophilic the resulting contact angles will be low. When a liquid
such as water is placed on an intensely hydrophobic surface such as silicone, it will not want to
spread at all, resulting in very high contact angles.
The goal of the experiments described in this thesis is to determine how these materials will
perform within the ocular environment. Within the eye, various elements will determine how they
function, most important being how the monomers on the surface react to being placed in a fluid
environment (eye closed) to that of a hydrophobic air environment (eye open). The monomers will
want to “flip back and forth”, exposing the side of the molecule that best interacts with the relative
environment it is in. This flipping, called chain rotation,34, 36 will ultimately determine how wettable
a lens material will be.
7
Holly et al.36 explained this chain rotation in their research in the 1970’s discussing the way
by which hydrophobic and hydrophilic parts of the hydrogel lens matrix will react to the
environment they are in. They state that the matrix of pHEMA hydrogels contains numerous
binding sites for water due to the hydroxyl groups within it, so that when this material is placed in
water there is sufficient energy from the interaction to overcome the hydrophobicity of the polymer
backbone. When the matrix of the gel is exposed to the air, in order to have the lowest surface free
energy, the polymer will orientate so that the hydrophobic side groups (non-polar parts of polymer
matrix) are in contact with the air interface, while the polar sites are buried into the aqueous phase
of the gel. This occurs because the molecular forces of the water molecules in the air interface are
much weaker than in the water interface. Therefore the lens surface appears hydrophobic regardless
of all the hydrophilic binding sites within the gel. When the lens in this configuration is then placed
in water the groups would re-orientate themselves, again to have the lowest surface free energy, so
that the hydrophobic sides are now buried into the matrix and the hydrophilic hydroxyl groups are
now exposed to the surface. This ability to ‘rotate’ within the gel matrix is an aspect of this
material’s surface structure which is very dynamic, as opposed to material the lenses made of
PMMA which have a surface that is locked in its conformation.36
When analyzing the wettability on the surface of these contact lenses, there are three
principle methods by which contact angles are determined on contact lens material:
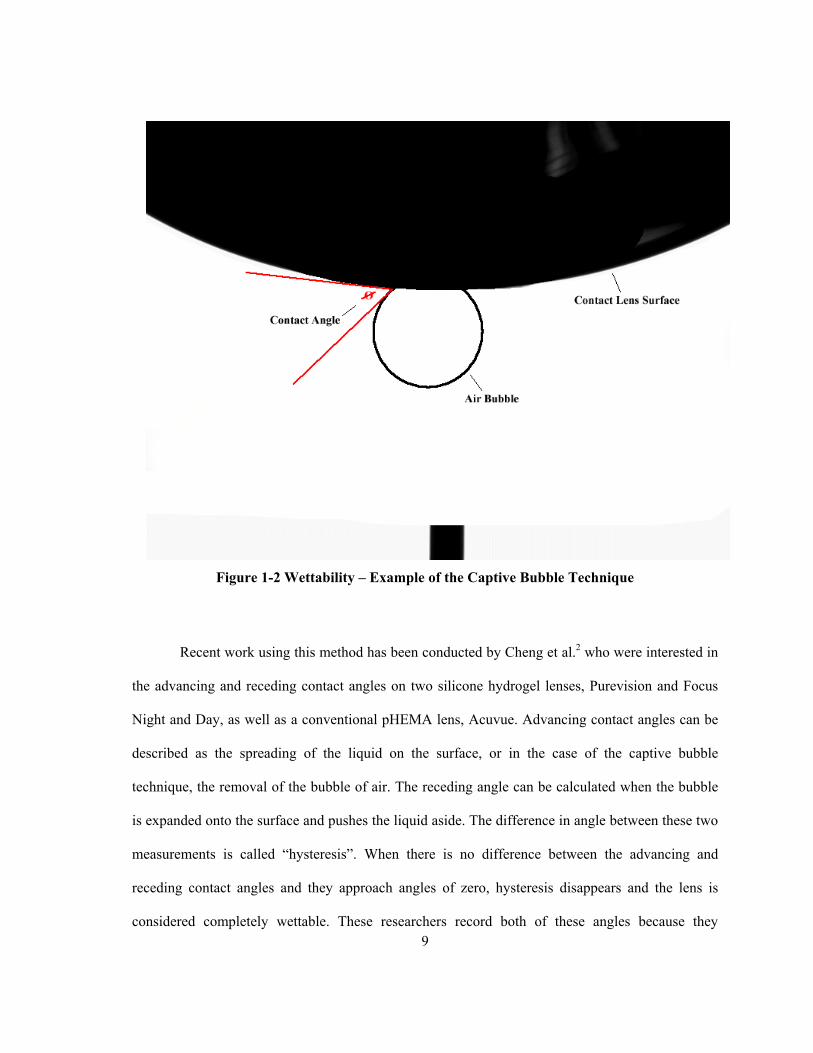
The first method is the “Captive Bubble” technique. This method was used to determine the
surface free energy of filters for water management systems.35 This surface energy could affect the
way bacteria and proteins are adsorbed onto the filters and by looking at contact angles, which are
an aspect of that energy, they could determine how those proteins would adhere. When utilizing the
captive bubble method, Zhang et al.35 inverted the substance of interest into a beaker of highly
distilled water, and then very carefully expanded a bubble of air through a fine tube until it made
8
contact with the surface. As the bubble of air makes contact it spreads to varying degrees, based on
how hydrophobic or hydrophilic the material is. In terms of contact lens research, this process
involves placing an inverted lens into a solution and blowing a bubble of air onto its surface and
seeing what contact angles are formed between the bubble and lens surface. In these preliminary
experiments, pictures were taken of the bubble and surface and they were then analyzed to
determine the contact angle (Figure 1-2). The equation by which the angles are determined is called
the Young-Dupree equation, which is as follows: cos θ = (γSV - γSL)/ γLV. , where θ is the contact
angle and γ represents the interfacial tension or energy between two phases. (S = solid, L = liquid,
V = vapor)2 The value that was modified in the experiments of this thesis were the interfacial
tension between the solid and liquid, with the other values remaining constant.
9
Figure 1-2 Wettability – Example of the Captive Bubble Technique
Recent work using this method has been conducted by Cheng et al.2 who were interested in
the advancing and receding contact angles on two silicone hydrogel lenses, Purevision and Focus
Night and Day, as well as a conventional pHEMA lens, Acuvue. Advancing contact angles can be
described as the spreading of the liquid on the surface, or in the case of the captive bubble
technique, the removal of the bubble of air. The receding angle can be calculated when the bubble
is expanded onto the surface and pushes the liquid aside. The difference in angle between these two
measurements is called “hysteresis”. When there is no difference between the advancing and
receding contact angles and they approach angles of zero, hysteresis disappears and the lens is
considered completely wettable. These researchers record both of these angles because they
10
represent what happens within the eye during each blink cycle. As you close your eye, the
advancing tear film creates advancing angles as it pushes over dry spots on the lens surface, and as
the eye is opened dry spots begin to form which create receding contact angles. Through their use
of this method they found that all the lenses had results which indicated low receding angles,
however they all had very high advancing angles when placed in an isotonic solution. When tear
film proteins were added to the solutions, it was observed that the high contact angles were reduced
to near zero levels, indicating that there was a definite effect upon the lens surface. In this solution,
they were unable to discriminate between the various lenses, and therefore the surface treatments
each has. A major result of this study was their suggestion that protein adsorption on the lens is
perhaps not a bad thing, and might be necessary to keep a lens wettable.
This method of determining contact angles has its problems due to the difficulties involved
in accurately expanding and contracting the air bubble onto the surface of the lens.3 Since the lens
is constantly submerged in a liquid, it is also seen as somewhat inaccurate when compared to the
actual characteristics of a lens in the eye, which most of the time is exposed to the air between
blinks.
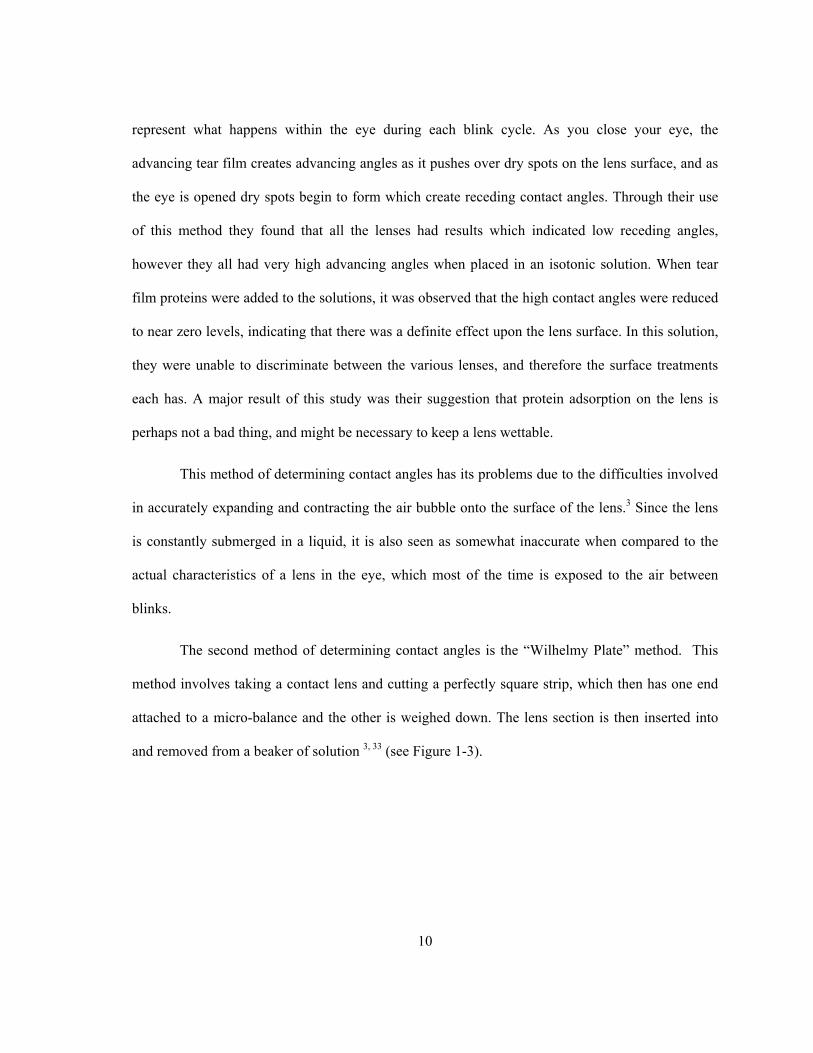
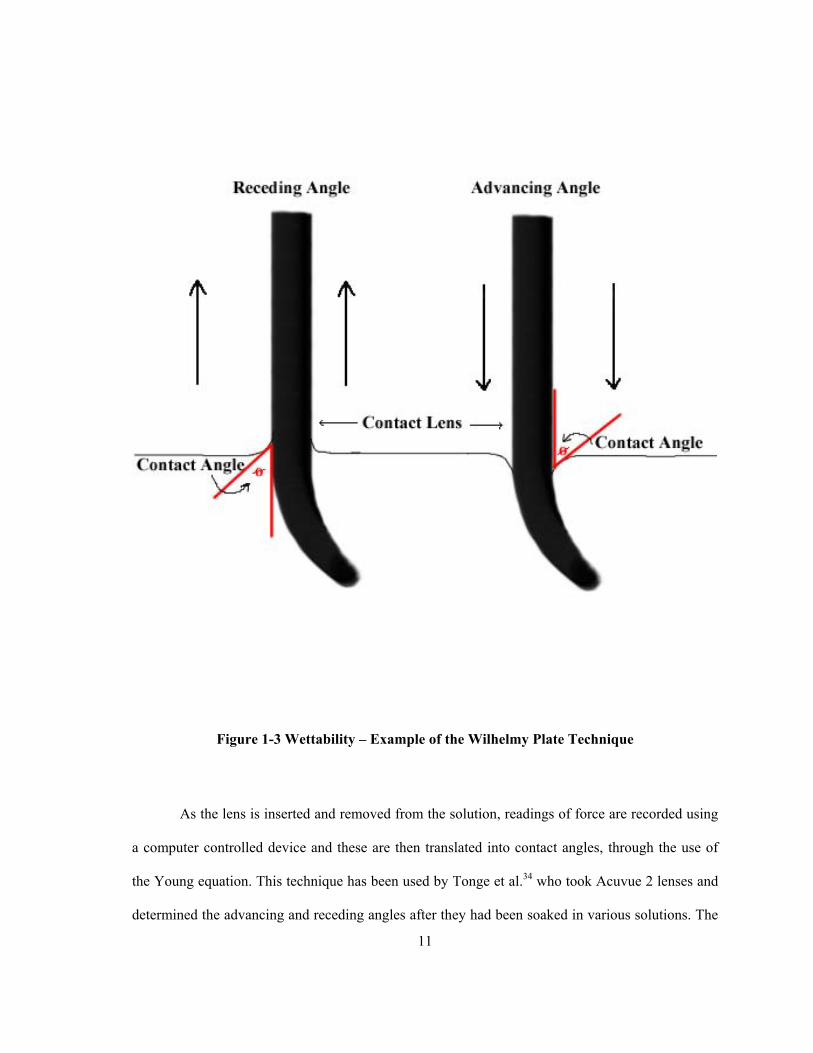
The second method of determining contact angles is the “Wilhelmy Plate” method. This
method involves taking a contact lens and cutting a perfectly square strip, which then has one end
attached to a micro-balance and the other is weighed down. The lens section is then inserted into
and removed from a beaker of solution 3, 33 (see Figure 1-3).
11
Figure 1-3 Wettability – Example of the Wilhelmy Plate Technique
As the lens is inserted and removed from the solution, readings of force are recorded using
a computer controlled device and these are then translated into contact angles, through the use of
the Young equation. This technique has been used by Tonge et al.34 who took Acuvue 2 lenses and
determined the advancing and receding angles after they had been soaked in various solutions. The
12
two solutions were saline based (control) and one that contained a surface active ingredient,
poloxamine 1107. The reason that this technique was used in this case is due to the fact that it is
more objective and does not rely on subjective assessment of an image and the consequent contact
angles that are derived from it.
Once again, this method aims to reproduce the effects that are seen within the eye, with the
advancing angle representing the closing of the lid and the receding angle that of it opening. The
primary goal of this study was to determine what effects lens wear had on contact angle assessment,
as well as looking at the impact of surfactants upon the measured results. It was determined that
lenses that were soaked in the surfactant had significantly lower advancing contact angles, and most
importantly, a greater degree of comfort.
In a recent study by Maldonado-Codina and Efron 3 the same technique was used, however,
it was slightly modified. As opposed to cutting the lens into a square strip, they use the whole lens
which is attached by suction to an arm that is held in place while a beaker of saline was raised until
contact is made and the forces involved in the advancing and receding solution are recorded. Titled
“Maximum Adherent Force (MAF) Method”, they looked at the differences that might exist
between various manufacturing methods, namely lathe-cutting, spin-casting and cast-moulding.
Another method they developed, again to investigate the differences between manufacturing
techniques, combines both the traditional Wilhelmy plate method along with the imaging of the
captive bubble method. Using a cut strip, the square piece of lens is lowered and removed from
solution, however as opposed to measuring the forces involved, pictures are taken and the angles
directly measured. They found that there was no significant difference between the various
manufacturing methods using both techniques.
13
There are downfalls to both of these procedures. For instance, with MAF the use of the
suction might change the shape of the lens as well the method used to remove the liquid that was on
the lens when removed from packaging may differ between trials. The photographic method suffers
from similar problems that all Wilhelmy plate analysis experiences, namely the difficulties
associated with cutting the lens into strips that are identical as well as the major concern of
dehydration while setting up the whole procedure. Considering these problems, this method was
also ruled out for use in this thesis.
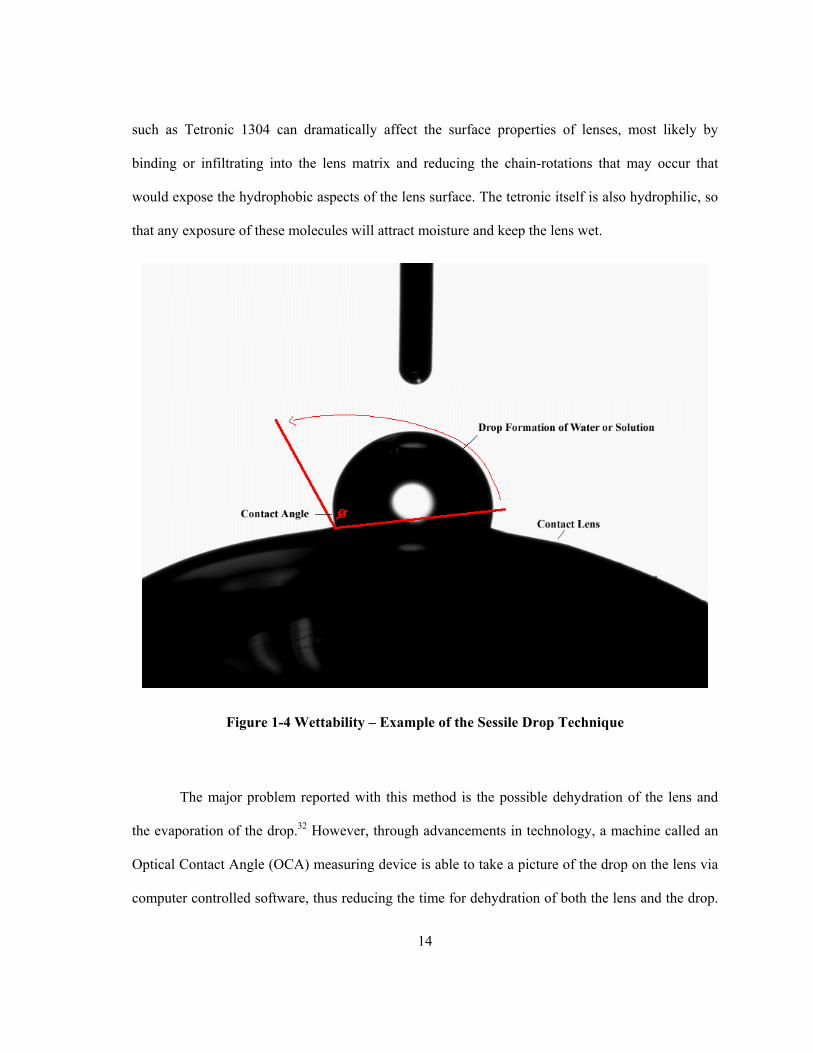
The final method, and the procedure that was used throughout this thesis, is called the
“Sessile Drop” method. This technique involves placing a contact lens or other material on a stage
upon which a high speed digital camera is focused, while above the sample a computer driven
syringe capable of dispensing a liquid drop on the microlitre scale is positioned. The lens is then
raised up to the drop of liquid which is hanging from the needle and allowed to make contact.
When the drop has stopped spreading across the surface, an image is taken and through the use of
custom software, the contact angles that formed on the interior of the two surfaces are measured.
Depending on how far the drop spreads across the surface this indicates how hydrophobic or
hydrophilic the material is. This method was also used by Zhang et al.,35 in conjunction with the
captive bubble technique. Giving rise to more recent work by Ketelson et al.,1 his group used the
same method to determine the wettability of contact lens hydrogels in combination with other
surfactants, similar to that of Tonge et al.34 Figure 1-4 demonstrates the image that would be taken
when the drop is placed onto a contact lens.
Ketelson’s research investigated specifically how lysozyme deposition and various
surfactants of differing molecular weight affected the wettability of lenses. It was found that one
specific surfactant, Tetronic 1304, made the lens extremely wettable, producing a surface whereby
the drop would spread completely. He concluded through his research that hydrophilic surfactants
14
such as Tetronic 1304 can dramatically affect the surface properties of lenses, most likely by
binding or infiltrating into the lens matrix and reducing the chain-rotations that may occur that
would expose the hydrophobic aspects of the lens surface. The tetronic itself is also hydrophilic, so
that any exposure of these molecules will attract moisture and keep the lens wet.
Figure 1-4 Wettability – Example of the Sessile Drop Technique
The major problem reported with this method is the possible dehydration of the lens and
the evaporation of the drop.32 However, through advancements in technology, a machine called an
Optical Contact Angle (OCA) measuring device is able to take a picture of the drop on the lens via
computer controlled software, thus reducing the time for dehydration of both the lens and the drop.
15
This machine is capable of both the sessile drop method and captive bubble; however all the
experiments in this thesis used the sessile drop method, because it was deemed to most closely
replicate the effects of a lens in the eye, as well as having the fewest possible complications.
The sessile drop method can report both advancing and receding angles of the drop, and
throughout the work of this thesis, the advancing angle is that which is reported. This is because the
advancing angle represents the movement of the inner surface of the eyelid as it moves over the
front surface of the contact lens. If the contact lens is wettable then the eyelid should move
smoothly over the surface and reduce any discomfort that would be felt if the eyelid had to move
over a non-wettable surface. The receding angle is seen when liquid is removed from the lens
surface, which in essence describes what is happening when the eye lid opens and how it slides
over the contact lens. Since the lens at this point is covered by the tear film, when the eyelid opens
there is minimal friction that would occur, causing no discomfort, which is the major problem
regarding contact lens wear.
All three methods have various advantages and disadvantages. However, as stated
previously, the sessile drop method was chosen for the research conducted in this thesis. It was
found that this technique most closely represents in-eye contact lens wear and the primary
drawbacks of dehydration are no longer an issue, in part due to the speed at which the lens can be
removed and tested.
1.3 Contact Lens Care Solutions
The most important factor for any care solution is how well it disinfects the lens and
prevents any buildup of bacteria, fungus and viruses. All the solutions that were used in this study,
which are aimed at eradicating these pathogens, are listed in section 2.2. Numerous studies have
been published indicating the efficacy of solutions against certain types of bacterial infections, such
16
as the most recently released product, ReNu MoistureLoc.37 Due to an epidemiological outbreak of
fungal keratitus related to the same solution it has since been removed from the market.38, 39 Fungal
keratitus is an infection that gains access to the corneal stroma through a defect in the epithelium
which then multiplies and causes necrosis of the tissue and an inflammatory response. This
infection can be very difficult to treat and may result in severe visual loss or even loss of the eye.40-
42
Many solutions have been tested in vivo and in vitro for efficacy in cleaning, with certain
regimens performing better or causing less complications. In a very recent study by Lievens et al.,43
they compared Complete Moisture Plus, ReNu MultiPlus and OptiFree Express and looked for
adverse clinical conditions that may have resulted in the cessation of use of the specific product
(drop-out). They reported that ReNu MultiPlus, when used frequently, may have contributed to
higher drop-outs, as compared to the other two solutions, due to corneal staining and a reduced tear
break up time. Abnormal tear break-up time is when a break in the film occurs in less than 10
seconds as measured by a fluorescein is staining.44, 45 This is important to contact lens wearers
because as mentioned previously, as the tear film breaks up it represents the receding angle on the
lens. When the lens is dry, the posterior surface of the upper eye lid has to move over this dry
surface which might be a cause of discomfort.
Solutions that are dispensed within Canada must follow strict regulations regarding the
medicinal ingredients that are used and the concentrations at which they can be found, as shown in
Table 1-2.
17
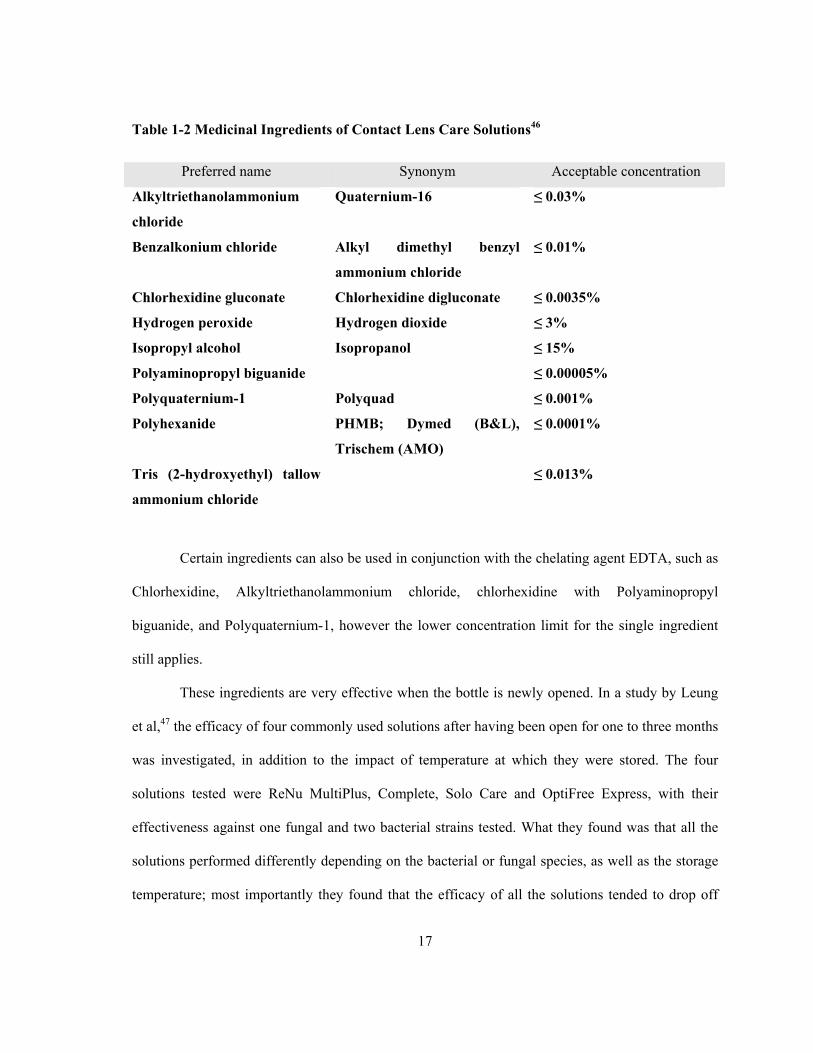
Table 1-2 Medicinal Ingredients of Contact Lens Care Solutions46
Preferred name Synonym Acceptable concentration
Alkyltriethanolammonium
chloride
Quaternium-16 ≤ 0.03%
Benzalkonium chloride Alkyl dimethyl benzyl
ammonium chloride
≤ 0.01%
Chlorhexidine gluconate Chlorhexidine digluconate ≤ 0.0035%
Hydrogen peroxide Hydrogen dioxide ≤ 3%
Isopropyl alcohol Isopropanol ≤ 15%
Polyaminopropyl biguanide ≤ 0.00005%
Polyquaternium-1 Polyquad ≤ 0.001%
Polyhexanide PHMB; Dymed (B&L),
Trischem (AMO)
≤ 0.0001%
Tris (2-hydroxyethyl) tallow
ammonium chloride
≤ 0.013%
Certain ingredients can also be used in conjunction with the chelating agent EDTA, such as
Chlorhexidine, Alkyltriethanolammonium chloride, chlorhexidine with Polyaminopropyl
biguanide, and Polyquaternium-1, however the lower concentration limit for the single ingredient
still applies.
These ingredients are very effective when the bottle is newly opened. In a study by Leung
et al,47 the efficacy of four commonly used solutions after having been open for one to three months
was investigated, in addition to the impact of temperature at which they were stored. The four
solutions tested were ReNu MultiPlus, Complete, Solo Care and OptiFree Express, with their
effectiveness against one fungal and two bacterial strains tested. What they found was that all the
solutions performed differently depending on the bacterial or fungal species, as well as the storage
temperature; most importantly they found that the efficacy of all the solutions tended to drop off
18
after 6-8 weeks, especially when stored at 30°C. The main finding of the study indicates that the
recommended replacement time of about three months may be too long, and proper education
concerning storage for patients is required.
Numerous other studies have looked at the effectiveness of these solutions,48-50 with all of
them constantly indicating the need for observance of the required care protocols as well as the
importance of the efficacy of the ingredients. It is known that there is an 80 fold increase in risk of
corneal infection to contact lens wearers as opposed to non-contact lens wearers,51 indicating how
serious the issue of contact lens care solutions must be taken.
The first of the care solutions used in this thesis was AMO’s Complete® MoisturePlus™
which is a multi-purpose, sterile, isotonic, buffered care solution that disinfects, cleans, rinses and
removes protein build up using a “no-rub” formula. Many of the solutions are titled “no-rub”,
indicating that it is unnecessary to rub the lens with the solution prior to the required overnight
soaking period to aid in the disinfection process. AOSEPT® Clear Care™ is an exception on this
list in the sense that it cleans and disinfects the lenses through the use of a peroxide reaction within
a single bottle. This solution contains 3% peroxide that is added to the lenses in a custom case,
which has a platinum disk at the bottom. Within six hours, a neutralization process occurs,
producing disinfected lenses and sterile saline solution within the case. It also contains Pluronic
17R4 which acts as a built-in cleaner as well as a surfactant, which separates it from other types of
peroxide systems. OptiFree® Express® No-rub™ and OptiFree® RepleniSH™ are of the same
family of no-rub contact lens care solutions, with the RepleniSH™ product being the latest release
from the company ALCON®. Both of these use Polyquad® (Polyquarternium-1) 0.001% as a
preservative and poloxamine (tetronic 1304) as surfactants, as well as Aldox® (myristamidopropyl
dimethylamine) 0.0005% as a preservative. RepleniSH™ also includes nonanoyl
ethylenediaminetriacetic acid in addition to the poloxamine to create a surfactant titled
19
TearGlyde™. ReNu® Multiplus® and ReNu® MoistureLoc® belong also to the same family
produced by Bausch and Lomb® yet contain different preservatives, namely polyhexanide within
Multiplus® and alexidine within MoistureLoc®. They both contain similar surfactants, primarily
poloxamine (tetronic 1107), however the MoistureLoc® product contains additional surfactants such
as polyquaternium 10 and poloxamer 407 (pluronic F127). A third product produced by Bausch and
Lomb® is Sensitive Eyes® which has half the amount of preservative polyhexanide at 0.00005% as
that of the Multiplus® product. Solocare Plus® and Solocare Aqua® are an old and a new
formulation respectively produced by CIBA Vision®. They both contain polyhexanide as
preservatives yet the surfactants within them are very different. The Plus® solution contains
cremophor RH40 and poloxamer 407 (pluronic F127) while the Aqua® solution contains
dexpanthenol, sorbitol, and pluronic F127.
The surfactants within these care solutions add another dimension to the ‘chain-rotations’
that are occurring at the surface of the contact lens. A surfactant or surface active agent, also has
hydrophilic and hydrophobic sites which may interact to various degrees with the surface of the
contact lens polymer, based upon the specific characteristics of that hydrogel. Traditionally, a
surfactant is described as a substance that when present at low concentrations within a system has
the property by which it can adsorb onto the surface or interface of the system and alter the free
energies of those surfaces.52 The term interface describes the boundary between two immiscible
phases, while surface describes an interface with a gas, usually air. When measuring the surface
tension of a liquid, the measurement is of the interfacial free energy per unit area of the boundary
between the liquid and the air above it.52 When measuring the influence that surfactants can have
between a solid and liquid interface there are a number of factors that can influence the result: 1)
the nature of the structural groups on the surface, whether they are charged or not, 2) the molecular
structure of the surfactant being adsorbed ie. ionic or nonionic, is the hydrophobic group long or
20
short, straight chain or branched, aliphatic or aromatic, 3) the environment of the aqueous solution
ie. pH, electrolyte content, temperature.52, 53
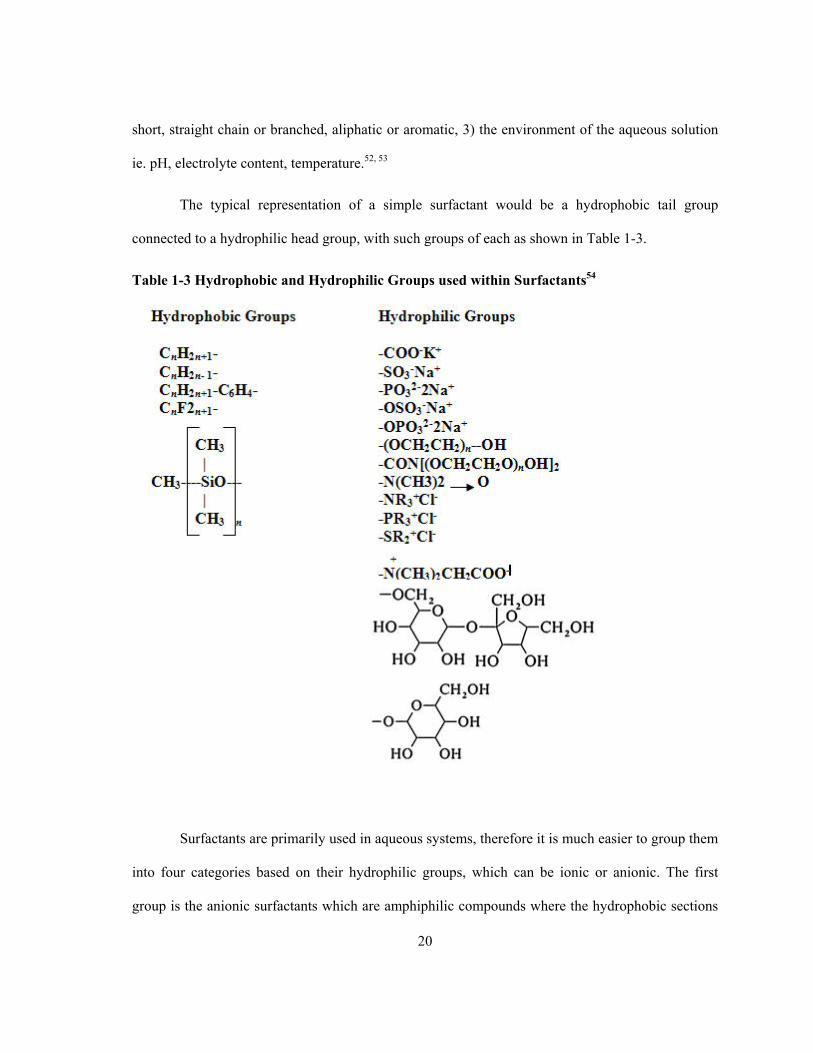
The typical representation of a simple surfactant would be a hydrophobic tail group
connected to a hydrophilic head group, with such groups of each as shown in Table 1-3.
Table 1-3 Hydrophobic and Hydrophilic Groups used within Surfactants54
Surfactants are primarily used in aqueous systems, therefore it is much easier to group them
into four categories based on their hydrophilic groups, which can be ionic or anionic. The first
group is the anionic surfactants which are amphiphilic compounds where the hydrophobic sections
21
carry anionic regions with small counterions such as potassium, sodium, or ammonium ions which
will slightly influence the surface active properties of this substance.54 Examples of these types of
surfactants are soaps and alkyl phosphates. A second grouping of surfactants is titled non-ionic,
which are also amphiphilic, however they are unable to dissociate into their respective ions in
solution, for example fatty acid alkylolamides. A third type of surfactant is cationic in which the
hydrophobic regions of the molecule exist as cations, such as chloride, sulfate or acetate, which
again only slightly influence the properties of the compound. The forth type of surfactant is called
amphoteric, and it has zwitterionic hydrophilic groups. 54 A zwitterion is a compound that has both
acidic and basic groups in the same molecule; carrying a neutral pH they have both negatively
charged anions and positively charged cations.
The interaction between a solid surface and the adsorption of surfactants is mostly
determined by the electrical interactions between the ion and the surface.53 Any net charge on the
surface itself will be neutralized by the opposite charge in the solution close to the interface. This
array of positive and negative charges that form along the solid liquid interface is known as the
electrical double layer.52, 53 This double layer occurs due to the unequal distribution of electrical
charges between the two phases, causing one side to acquire a net charge of a particular sign and
the other side to acquire a net charge of the opposite sign.52 The array of surface charges was
researched over the years and numerous theories as to how the surfaces would line were brought
forth dating back to 1879 with the Helmholtz model which depicted the surface as having all the
counterions lined up parallel to the charged surface at a distance of one molecular diameter.52 This
model proved to be untenable since the surface that had adsorbed the surfactant had not become
charged exactly opposite to that of the surface.52 The theory went through modifications until the
Stern model came about that divided the solution side of the double layer into two parts, 1) a layer
22
of strongly held counterions, adsorbed close to the charged surface at specific sites, and 2) a diffuse
layer of counterions further out with charge similar to that of the surface.
Surfactants may be specifically adsorbed onto a polymer surface in a variety of ways, the
first of which is ‘ion exchange’, which involves replacement of counterions adsorbed onto the
substrate from the solution by similarly charged surfactant ions. Second is ‘ion pairing’, where
adsorption of surfactant ions from solution occurs on oppositely charged sites unoccupied by
counterions. Third are ‘acid-base interactions’ where hydrogen bonds form between substrate and
surfactant. Fourth is ‘adsorption by polarization of π electrons’ which is when an attraction occurs
between electron rich aromatic nuclei of the surfactant and positive sited on the substrate. Fifth is
‘adsorption by dispersion forces’ which is London-van der Waals dispersion forces acting between
the surface and surfactant. The final way that surfactants may be adsorbed onto a polymer surface is
through ‘hydrophobic bonding’ which occurs when there is a mutual attraction between the
hydrophobic groups of the surfactant molecules. These groups have a tendency to escape the
aqueous environment they are in by aggregating their chains to each other.52
The numerous contact lens polymers on the market in combination with the numerous
surfactants available results in various combinations occurring where the surfactants may or may
not adhere to the lens surface due to the the multitude of factors listed previously. This can be seen
in a number of studies,1, 34, 36 which demonstrated the ability of these surfactants to bind to lens
surfaces truly does depends on the type of surfactant used. Once these surfactant adhere to a
specific surface they may be remove in a variety of ways as has been shown by in-vivo wear..1
With respect to the solutions within the blister packs the contact lenses are shipped in, there
is very little data available. The packaging indicates that the lenses are suspended in “phosphate
buffered saline; a solution containing sodium chloride, sodium phosphate and potassium
23
phosphate”. This idea of the buffer is to help maintain a constant pH and the concentration is
matched to the human body (isotonic). The pH, osmolality and surface tension (if possible) of all
the pHEMA and siloxane blister packs was therefore tested to determine the differences.
1.4 Tear Film Components and Contact Lenses
One of the major problems that can occur with contact lenses is the interaction they have
with the tear film and the possible degradation of the lens surface through deposition of numerous
proteins, lipids and mucins.19, 22, 55-59 As these depositions occur at very high levels they can
interfere with vision, for the build-up eventually becomes a whitish film over the surface of the
lens,16, 60 which can eventually cause discomfort. 61 There are many factors that can influence what
types and in what quantity these proteins will deposit onto lenses, such as the water content and
charge of the material, the charge and size of the protein21 as well as the environmental pH.19, 62
Some of the more frequent deposits that occur upon lenses are lysozyme and lactoferrin,16-18
however there are numerous other types as well.
In a study by Sack et al22 research was conducted to look at the lens-bound protein layer of
various lens types with differing water content and ionic-binding capacity. What they discovered
was that the deposition of proteins onto the lens surface is highly dependant upon the actual
hydrogel structure. Three types of hydrogels were looked at; low water content nonionic hydrogels
(e.g. polymacon), high water content non-ionic hydrogels (e.g. lidofilcon) and high water anionic
hydrogels (e.g. pHEMA). It was found that as opposed to the water content of the lens having the
most significant impact upon the adsorption of proteins it was the ionic-binding capacity. When
they looked more closely at what was being deposited, they found that on the anionic pHEMA
lenses there was primarily a thick, loosely bound layer of lysozyme, which for the most part retains
its conformational integrity. Lysozyme is believed to be able to penetrate into the matrix of the lens
24
due to its highly compact structure,63 and the fact that when looking at the nonionic hydrogels very
distinct differences were found, most obvious of which is that the thickness of the layer is much
thinner, likely due to the mixture of denatured proteins that adsorbed onto the surface. One of the
most important findings of this study was that careful control of certain charged contaminants such
as cations and amines within care solutions is required in order to prevent spoilage or
contamination, which could eventually lead to an inflammatory and immune response.
In another study by Bohnert et al,19 similar results were found regarding the amount and
type of protein uptake as related to the physical composition of the lens. Various lenses of the
polymers HEMA and methyl methacylate (MMA) were soaked in a mixture of labeled albumin,
lysozyme, and immunoglobulin G. They found that these proteins bound in very small amounts to
lenses that were composed of p(MMA-HEMA) that contained 50% or more HEMA, and the
majority of protein in this case was albumin. For lenses that were made of HEMA and methacrylic
acid (MAA) very large quantities of lysozyme were deposited onto the surface, whereas lenses
made of HEMA and N-vinyl pyrrolidone (NVP) or Acrylamide (AAm) had low levels of all
proteins.
When examining conventional hydrogel lenses available on the market, the various
groupings of the lenses based on their water content and charge (Table 1-1) dictate to what degree
proteins adhere to the lenses. Group IV lenses adhere the greatest amount of protein, with levels
around 400μg to 2000μg per lens while the other three groups have values between 10μg and 30μg.
19, 22, 25, 55, 57, 64 Silicone hydrogels, due to the hydrophobic addition of the siloxane groups, results in
higher levels of lipid deposition. 25, 65
25
1.5 Techniques to Analyse Protein Deposition on Hydrogel Lenses
There are a number of methods by which to analyze the deposition of proteins upon the
surface of contact lenses, most of which involve imaging the surface,66, 67 however the problem with
these methods is that it is difficult to quantify the amount of protein present. There are various other
methods by which to actually assess the type and amount of protein present, including Enzyme-
Linked Immunosorbent Assay68, 69 (ELISA), High Performance Liquid Chromatography65 (HPLC),
as well as 2-Dimensional Difference in Gel Electrophoresis 70-72 (2D-DIGE).
Enzyme-Linked Immunosorbent Assay is a method whereby antibodies are attached to a
solid substrate after which it is then coated with a serum containing the protein of interest. A second
solution is added and binds to the coated antibody complex which eventually will elicit a
chromogenic or fluorescent signal, which is then viewed using a spectrophotometer. There are both
advantages and disadvantages to this method, such as it can process a very high number of samples
at once and there is limited physical manipulation required, however it can sometimes pick up on
proteins that were not targeted, giving adverse results.73
High Performance Liquid Chromatography is a process whereby samples are forced
through a column of tightly packed medium (normally extremely fine beads) at extremely high
pressure. The column can separate proteins based on various parameters such isoelectric charge or
size. Normal pressures within these systems can reach up to 400 atmospheres, however there are
“ultra performance liquid chromatography” systems that can exert pressures of approximately 1000
atmospheres. A major advantage of this system is that it can analyze multiple proteins during a
single experiment.
The protein analysis method used for this thesis is 2D-DIGE, which allows for the labeling
of proteins prior to 2D electrophoresis. This technique allows for the separation of thousands of
26
proteins within a biological sample based on their isoelectric points and molecular weights. A
major benefit of this method is that it places an internal standard on every gel, which allows for
comparisons to be drawn within and between gels in order for correct quantitation between actual
samples with an associated statistical significance. The process used previously was 2D PAGE,
whereby each gel had only one sample which was then compared to the samples on different gels,
which introduces high experimental variability. This new variation was first introduced by Unlu et
al74 in 1997 and had two differing dyes for two different samples on one gel, which completely
circumvented the need to compare multiple gels.
The method used in this thesis involved three cyanine dyes, Cy2, Cy3, and Cy5 that are
added to different samples, one of which is for the pooled standard and the other two are for actual
samples.75 This process is still relatively new, with much work being undertaken in the last five
years to determine the quantitative variation and statistically valid thresholds.76 Today, this process
has become extremely robust in protein profiling because it is an accessible and powerful tool that
can now detect and quantify to a very high degree samples that are on the same gel or across
multiple gels due to the linked internal standard.77
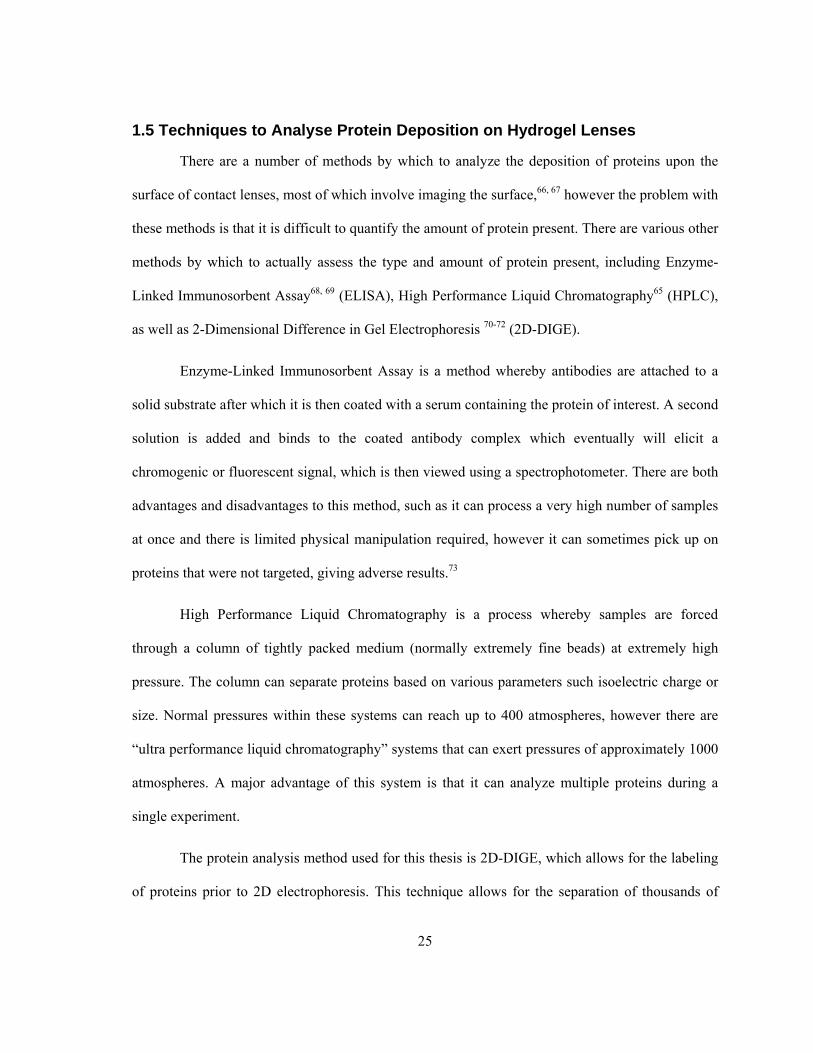
The basis of this method relies on the modification of protein extracts through the use of
fluorescent cyanine dyes that have distinctive emission and excitations, which also migrate to
specific locations on the 2D gel based on whatever protein they have been bound to. When each of
these dyes is exposed to a specific wavelength of laser, they are excited and fluoresce, which is then
picked up by a scanner and saved as an image. Three passes over the gel with the three different
excitatory wavelengths of light produces three images, with two of them expressing two protein
samples tested and the third representing the pooled standard. The resulting images are
superimposed and through the use of custom software called DeCyder75, the various locations and
quantities of different proteins based on sample can be compared (Figure 1-5). With new versions
27
of the software regularly being released, new techniques are also being proposed that improve in
the assessment of the differential protein expression, most recently by including normalization
techniques with novel statistical tests.78
Figure 1-5 Outline of 2D-DIGE process with the two different protein samples doped in the
different dyes to determine differences in protein expression75
28
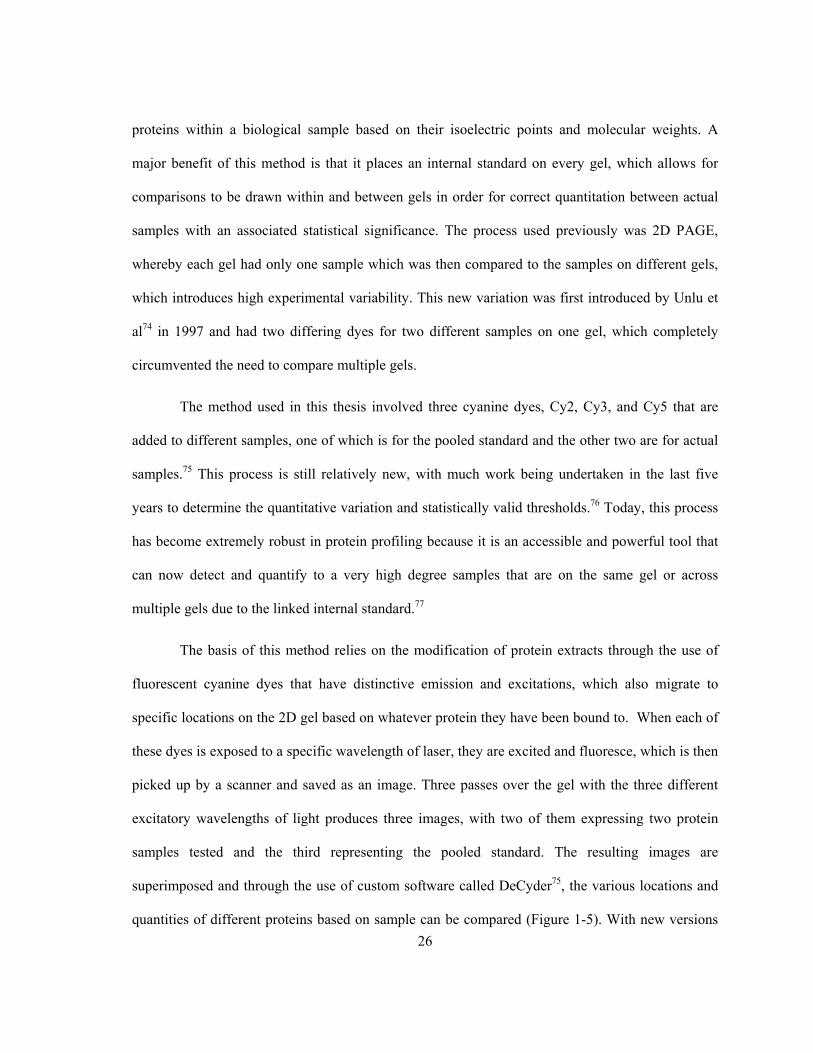
The method by which these fluorescing dyes attach to proteins is through an active NHS
ester group that is meant to covalently react and bind to the epsilon amino group of lysine via an
amide linkage.75 The ester group of the dye has an intrinsic charge of +1 (Figure 1-6), which will
directly replace the +1 charge of the lysine group it is binding to, which ensures that there is no
observable change to the pI of the protein, which is important during the first dimension (electrical
charge separation) of the gel.
Figure 1-6 Schematic of CyDye labeling reaction75
The weight of the dye when attached adds a total of 500 Da to the mass of the protein
which will not significantly affect the second dimension of the gel, where all the proteins are now
separated based on weight. This method of analysis is ideal for comparing multiple samples where
differences in protein expression may be present.74, 76
29
Chapter 2 Materials and Methods
2.1 Contact Lenses
Many types of contact lenses were used throughout all of the experimental procedures,
including lenses used for daily wear (removed each day and not worn overnight), extended wear
(worn overnight for 6 nights and then replaced) and continuous wear (worn overnight for up to 30
nights and then replaced). Daily wear lenses are removed at the end of each day and placed in a
care solution and then replaced sometime between one (in which case no solution is required) and
thirty days. When referring to the eyes and the lenses from which they were taken, the clinical
form shall be used; OD – right eye, OS – left eye.
2.1.1 Daily Disposable Lenses
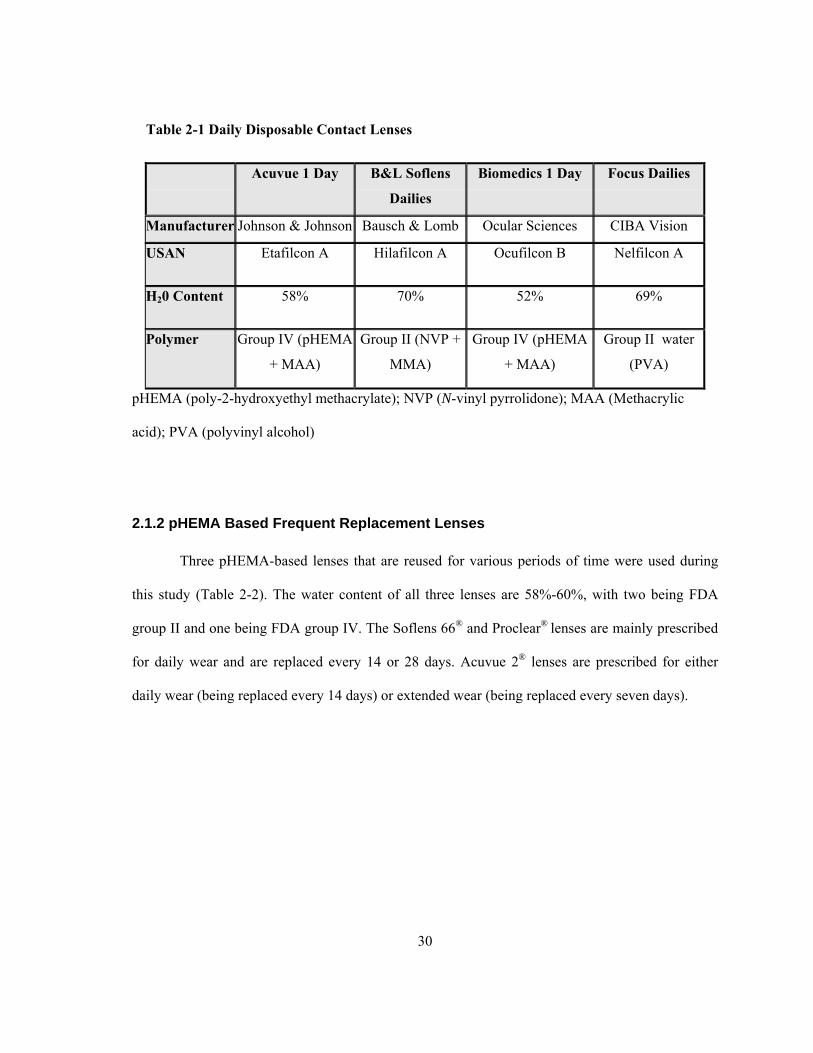
The daily disposable lenses used in this study are described in Table 2-1. Essential
differences between these daily disposable materials are that two are categorized as FDA group II
materials (high water content, non-ionic) and two are FDA group IV materials (high water, ionic).
These lenses are removed from the blister pack in the morning, worn for the day and then thrown
away in the evening.
30
Table 2-1 Daily Disposable Contact Lenses
Acuvue 1 Day B&L Soflens
Dailies
Biomedics 1 Day Focus Dailies
Manufacturer Johnson & Johnson Bausch & Lomb Ocular Sciences CIBA Vision
USAN Etafilcon A Hilafilcon A Ocufilcon B Nelfilcon A
H20 Content 58% 70% 52% 69%
Polymer Group IV (pHEMA
+ MAA)
Group II (NVP +
MMA)
Group IV (pHEMA
+ MAA)
Group II water
(PVA)
pHEMA (poly-2-hydroxyethyl methacrylate); NVP (N-vinyl pyrrolidone); MAA (Methacrylic
acid); PVA (polyvinyl alcohol)
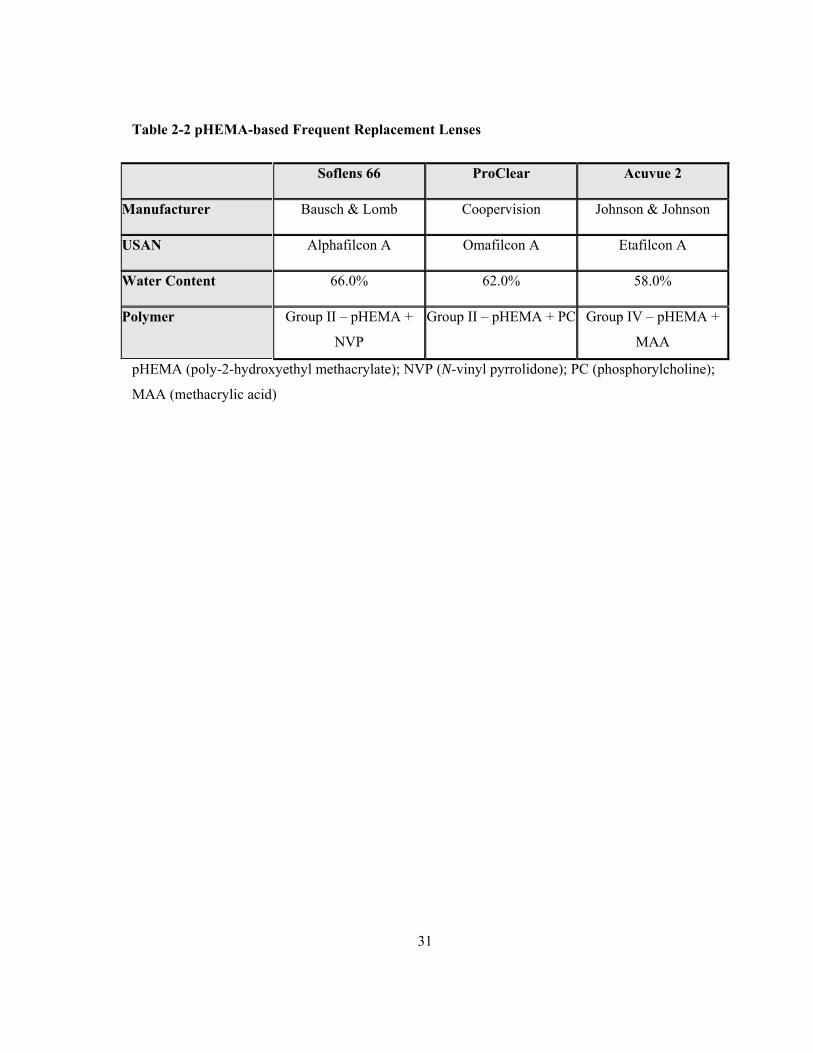
2.1.2 pHEMA Based Frequent Replacement Lenses
Three pHEMA-based lenses that are reused for various periods of time were used during
this study (Table 2-2). The water content of all three lenses are 58%-60%, with two being FDA
group II and one being FDA group IV. The Soflens 66® and Proclear® lenses are mainly prescribed
for daily wear and are replaced every 14 or 28 days. Acuvue 2® lenses are prescribed for either
daily wear (being replaced every 14 days) or extended wear (being replaced every seven days).
31
Table 2-2 pHEMA-based Frequent Replacement Lenses
Soflens 66 ProClear Acuvue 2
Manufacturer Bausch & Lomb Coopervision Johnson & Johnson
USAN Alphafilcon A Omafilcon A Etafilcon A
Water Content 66.0% 62.0% 58.0%
Polymer Group II – pHEMA +
NVP
Group II – pHEMA + PC Group IV – pHEMA +
MAA
pHEMA (poly-2-hydroxyethyl methacrylate); NVP (N-vinyl pyrrolidone); PC (phosphorylcholine);
MAA (methacrylic acid)
32
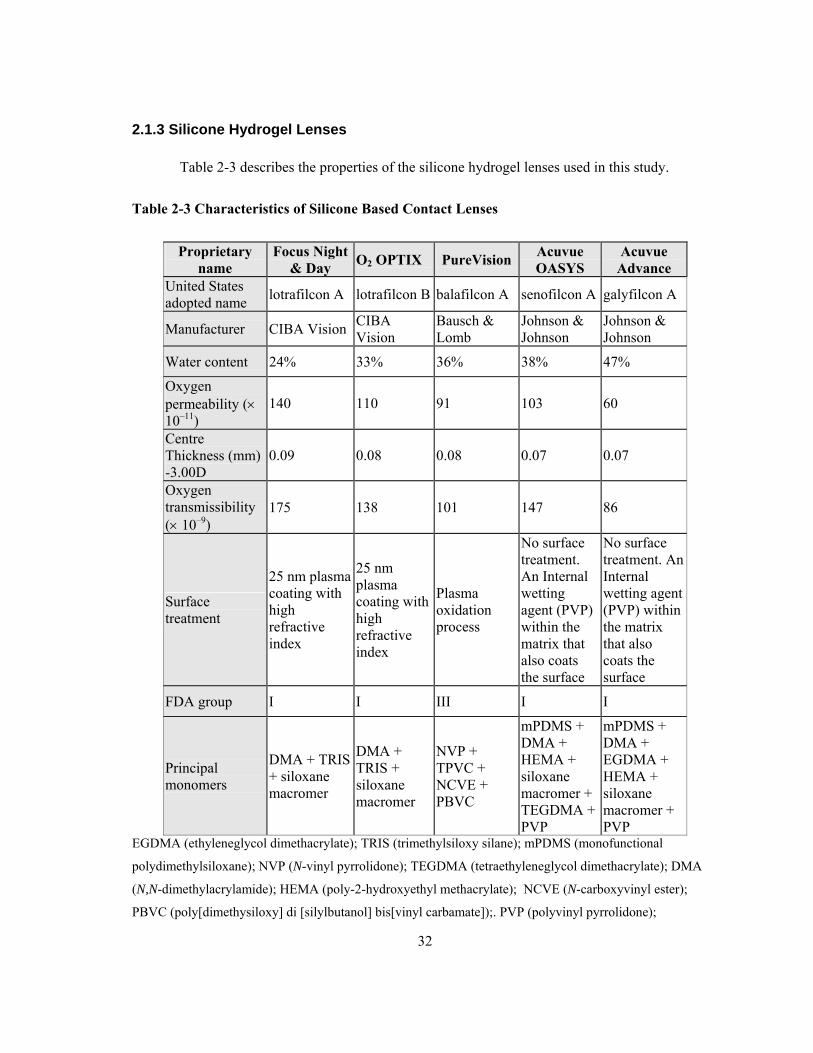
2.1.3 Silicone Hydrogel Lenses
Table 2-3 describes the properties of the silicone hydrogel lenses used in this study.
Table 2-3 Characteristics of Silicone Based Contact Lenses
Proprietary name
Focus Night & Day O2 OPTIX PureVision Acuvue
OASYS Acuvue
Advance United States adopted name lotrafilcon A lotrafilcon B balafilcon A senofilcon A galyfilcon A
Manufacturer CIBA Vision CIBA Vision
Bausch & Lomb
Johnson & Johnson
Johnson & Johnson
Water content 24% 33% 36% 38% 47%
Oxygen permeability (× 10–11)
140 110 91 103 60
Centre Thickness (mm) -3.00D
0.09 0.08 0.08 0.07 0.07
Oxygen transmissibility (× 10–9)
175 138 101 147 86
Surface treatment
25 nm plasma coating with high refractive index
25 nm plasma coating with high refractive index
Plasma oxidation process
No surface treatment. An Internal wetting agent (PVP) within the matrix that also coats the surface
No surface treatment. An Internal wetting agent (PVP) within the matrix that also coats the surface
FDA group I I III I I
Principal monomers
DMA + TRIS + siloxane macromer
DMA + TRIS + siloxane macromer
NVP + TPVC + NCVE + PBVC
mPDMS + DMA + HEMA + siloxane macromer + TEGDMA + PVP
mPDMS + DMA + EGDMA + HEMA + siloxane macromer + PVP
EGDMA (ethyleneglycol dimethacrylate); TRIS (trimethylsiloxy silane); mPDMS (monofunctional
polydimethylsiloxane); NVP (N-vinyl pyrrolidone); TEGDMA (tetraethyleneglycol dimethacrylate); DMA
(N,N-dimethylacrylamide); HEMA (poly-2-hydroxyethyl methacrylate); NCVE (N-carboxyvinyl ester);
PBVC (poly[dimethysiloxy] di [silylbutanol] bis[vinyl carbamate]);. PVP (polyvinyl pyrrolidone);
33
2.2 Care Solutions
The lens types that were reusable (those listed in Tables 2-2 and 2-3) were soaked in nine
care solutions and their wettability re-tested following a period of overnight soaking. Lenses were
also tested directly out of their blister packaging, which differed between products. This solution
was tested for its pH and osmolality, as described in Section 3.1.1.
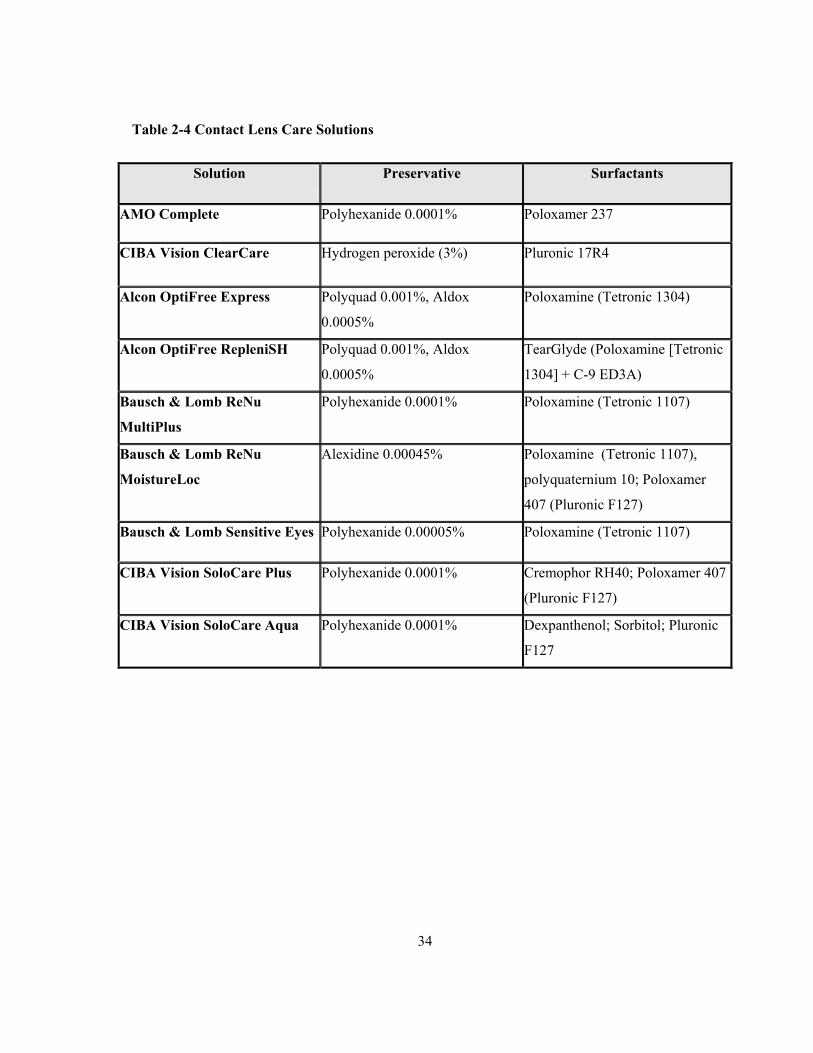
Table 2-4 lays out the numerous care solutions that were used, as well as the preservatives
and surfactants found within them. This is very important because each of the care regimens have
slightly different methods of disinfecting the lens, as well as differing preservatives and surfactants
which can affect the wettability of the lens. For instance, ReNu MultiPlus has tetronic 1107
incorporated as a surfactant, while OptiFree Express contains tetronic 1304, and the impact of each
on the wettability of a lens surface is quite different.
34
Table 2-4 Contact Lens Care Solutions
Solution Preservative Surfactants
AMO Complete Polyhexanide 0.0001% Poloxamer 237
CIBA Vision ClearCare Hydrogen peroxide (3%) Pluronic 17R4
Alcon OptiFree Express Polyquad 0.001%, Aldox
0.0005%
Poloxamine (Tetronic 1304)
Alcon OptiFree RepleniSH Polyquad 0.001%, Aldox
0.0005%
TearGlyde (Poloxamine [Tetronic
1304] + C-9 ED3A)
Bausch & Lomb ReNu
MultiPlus
Polyhexanide 0.0001% Poloxamine (Tetronic 1107)
Bausch & Lomb ReNu
MoistureLoc
Alexidine 0.00045% Poloxamine (Tetronic 1107),
polyquaternium 10; Poloxamer
407 (Pluronic F127)
Bausch & Lomb Sensitive Eyes Polyhexanide 0.00005% Poloxamine (Tetronic 1107)
CIBA Vision SoloCare Plus Polyhexanide 0.0001% Cremophor RH40; Poloxamer 407
(Pluronic F127)
CIBA Vision SoloCare Aqua Polyhexanide 0.0001% Dexpanthenol; Sorbitol; Pluronic
F127
35
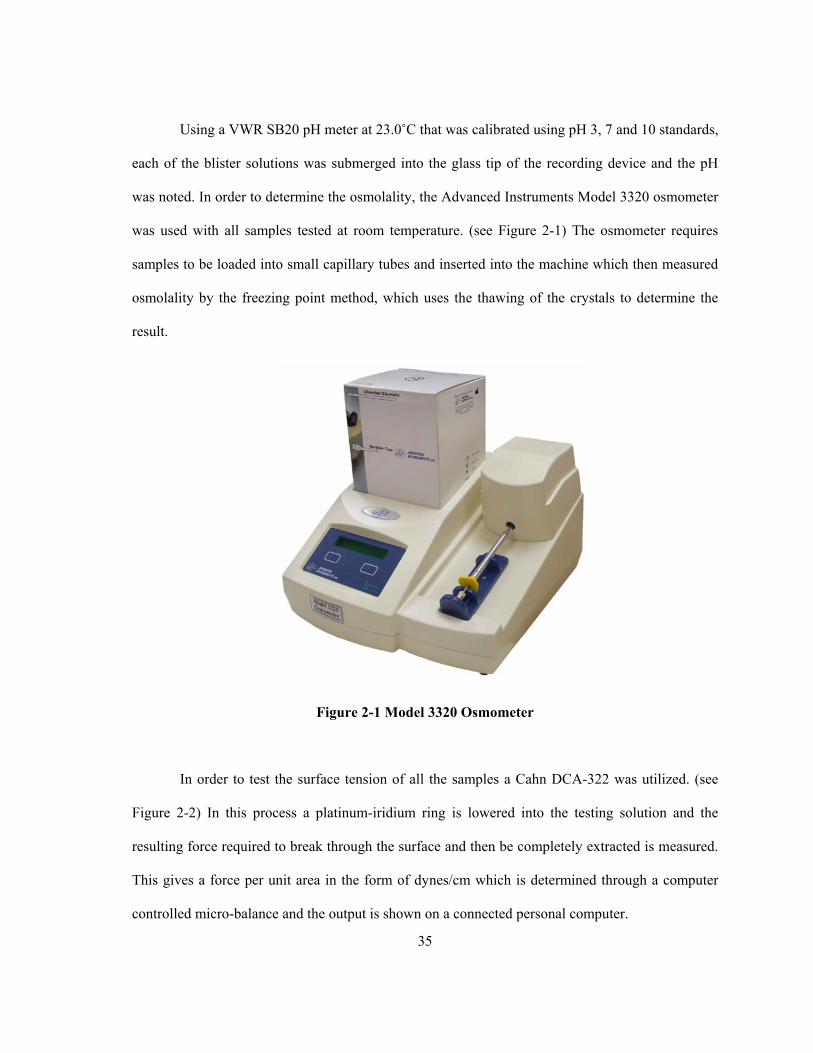
Using a VWR SB20 pH meter at 23.0˚C that was calibrated using pH 3, 7 and 10 standards,
each of the blister solutions was submerged into the glass tip of the recording device and the pH
was noted. In order to determine the osmolality, the Advanced Instruments Model 3320 osmometer
was used with all samples tested at room temperature. (see Figure 2-1) The osmometer requires
samples to be loaded into small capillary tubes and inserted into the machine which then measured
osmolality by the freezing point method, which uses the thawing of the crystals to determine the
result.
Figure 2-1 Model 3320 Osmometer
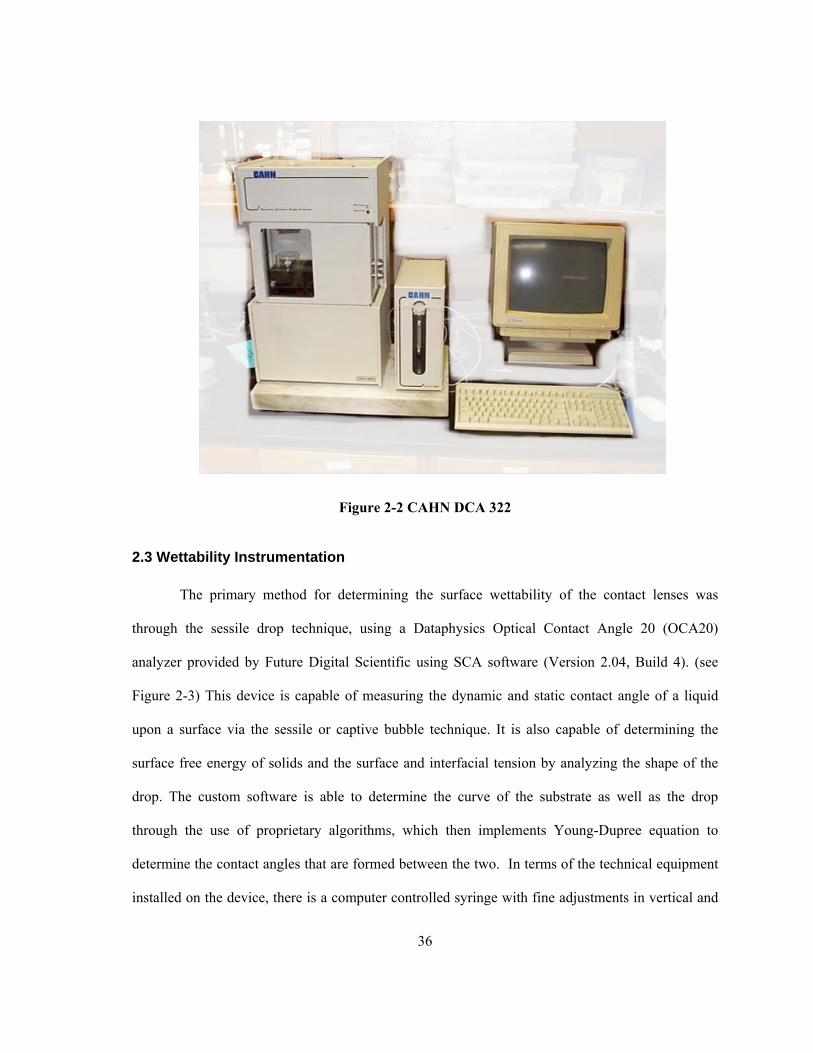
In order to test the surface tension of all the samples a Cahn DCA-322 was utilized. (see
Figure 2-2) In this process a platinum-iridium ring is lowered into the testing solution and the
resulting force required to break through the surface and then be completely extracted is measured.
This gives a force per unit area in the form of dynes/cm which is determined through a computer
controlled micro-balance and the output is shown on a connected personal computer.
36
Figure 2-2 CAHN DCA 322
2.3 Wettability Instrumentation
The primary method for determining the surface wettability of the contact lenses was
through the sessile drop technique, using a Dataphysics Optical Contact Angle 20 (OCA20)
analyzer provided by Future Digital Scientific using SCA software (Version 2.04, Build 4). (see
Figure 2-3) This device is capable of measuring the dynamic and static contact angle of a liquid
upon a surface via the sessile or captive bubble technique. It is also capable of determining the
surface free energy of solids and the surface and interfacial tension by analyzing the shape of the
drop. The custom software is able to determine the curve of the substrate as well as the drop
through the use of proprietary algorithms, which then implements Young-Dupree equation to
determine the contact angles that are formed between the two. In terms of the technical equipment
installed on the device, there is a computer controlled syringe with fine adjustments in vertical and
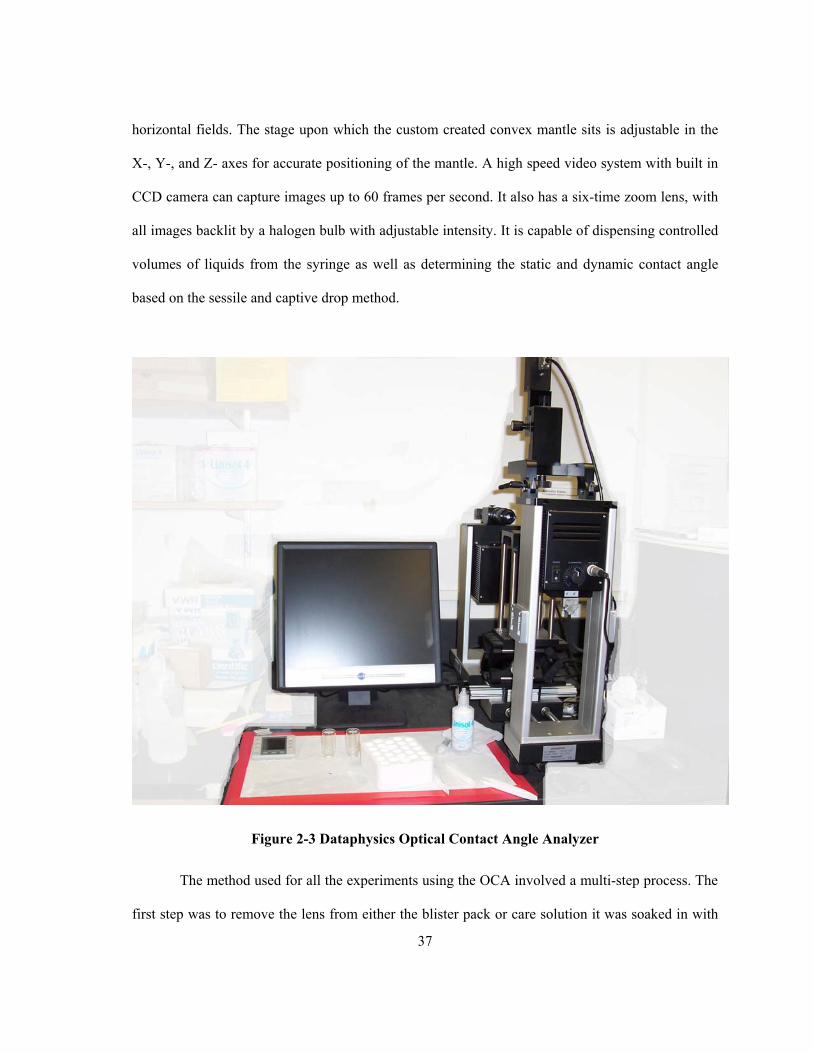
37
horizontal fields. The stage upon which the custom created convex mantle sits is adjustable in the
X-, Y-, and Z- axes for accurate positioning of the mantle. A high speed video system with built in
CCD camera can capture images up to 60 frames per second. It also has a six-time zoom lens, with
all images backlit by a halogen bulb with adjustable intensity. It is capable of dispensing controlled
volumes of liquids from the syringe as well as determining the static and dynamic contact angle
based on the sessile and captive drop method.
Figure 2-3 Dataphysics Optical Contact Angle Analyzer
The method used for all the experiments using the OCA involved a multi-step process. The
first step was to remove the lens from either the blister pack or care solution it was soaked in with
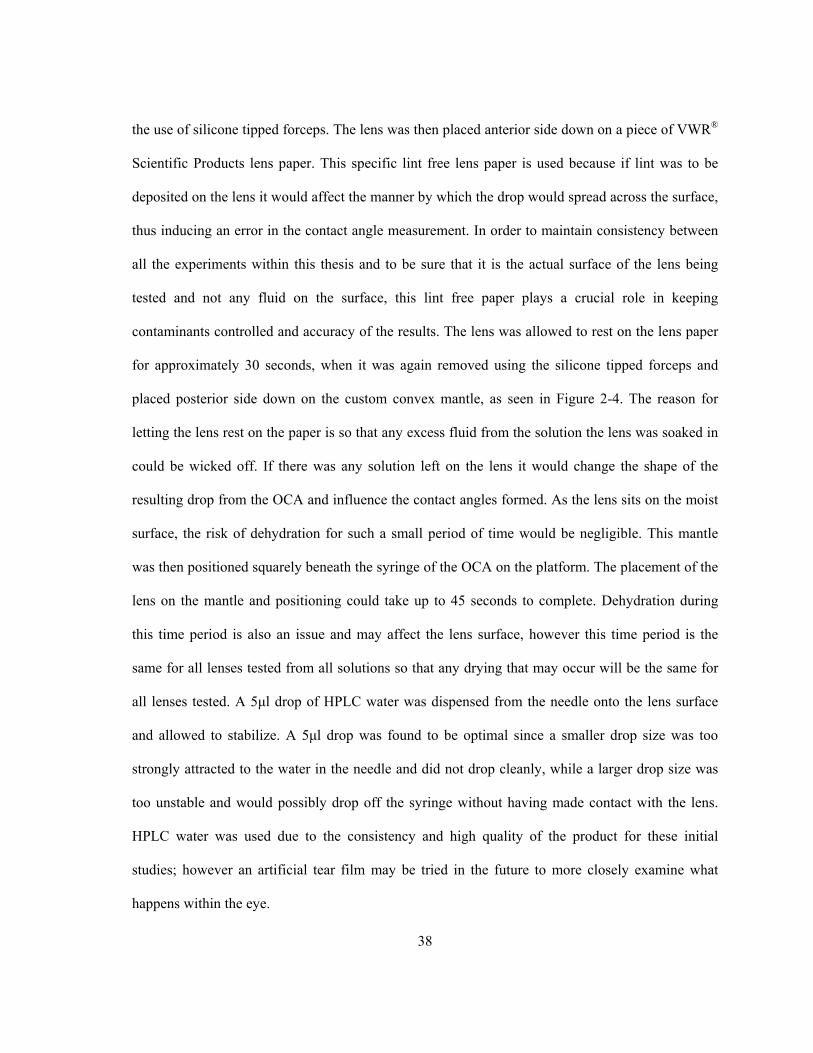
38
the use of silicone tipped forceps. The lens was then placed anterior side down on a piece of VWR®
Scientific Products lens paper. This specific lint free lens paper is used because if lint was to be
deposited on the lens it would affect the manner by which the drop would spread across the surface,
thus inducing an error in the contact angle measurement. In order to maintain consistency between
all the experiments within this thesis and to be sure that it is the actual surface of the lens being
tested and not any fluid on the surface, this lint free paper plays a crucial role in keeping
contaminants controlled and accuracy of the results. The lens was allowed to rest on the lens paper
for approximately 30 seconds, when it was again removed using the silicone tipped forceps and
placed posterior side down on the custom convex mantle, as seen in Figure 2-4. The reason for
letting the lens rest on the paper is so that any excess fluid from the solution the lens was soaked in
could be wicked off. If there was any solution left on the lens it would change the shape of the
resulting drop from the OCA and influence the contact angles formed. As the lens sits on the moist
surface, the risk of dehydration for such a small period of time would be negligible. This mantle
was then positioned squarely beneath the syringe of the OCA on the platform. The placement of the
lens on the mantle and positioning could take up to 45 seconds to complete. Dehydration during
this time period is also an issue and may affect the lens surface, however this time period is the
same for all lenses tested from all solutions so that any drying that may occur will be the same for
all lenses tested. A 5μl drop of HPLC water was dispensed from the needle onto the lens surface
and allowed to stabilize. A 5μl drop was found to be optimal since a smaller drop size was too
strongly attracted to the water in the needle and did not drop cleanly, while a larger drop size was
too unstable and would possibly drop off the syringe without having made contact with the lens.
HPLC water was used due to the consistency and high quality of the product for these initial
studies; however an artificial tear film may be tried in the future to more closely examine what
happens within the eye.
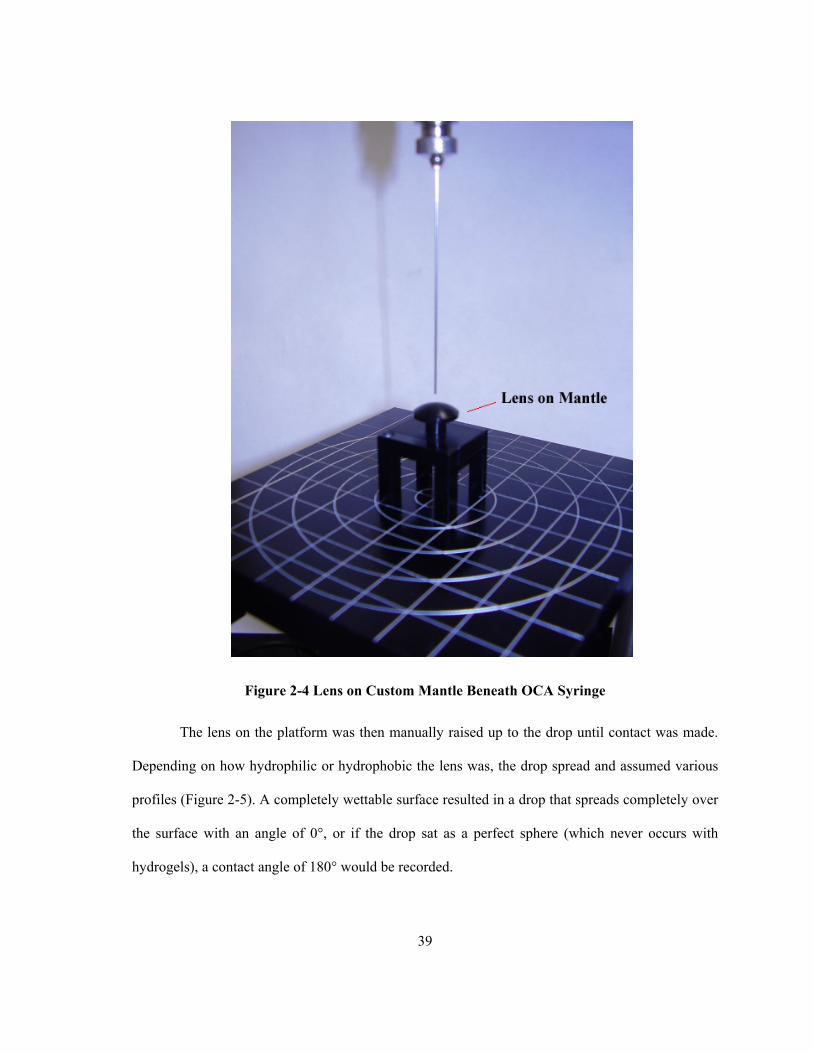
39
Figure 2-4 Lens on Custom Mantle Beneath OCA Syringe
The lens on the platform was then manually raised up to the drop until contact was made.
Depending on how hydrophilic or hydrophobic the lens was, the drop spread and assumed various
profiles (Figure 2-5). A completely wettable surface resulted in a drop that spreads completely over
the surface with an angle of 0°, or if the drop sat as a perfect sphere (which never occurs with
hydrogels), a contact angle of 180° would be recorded.
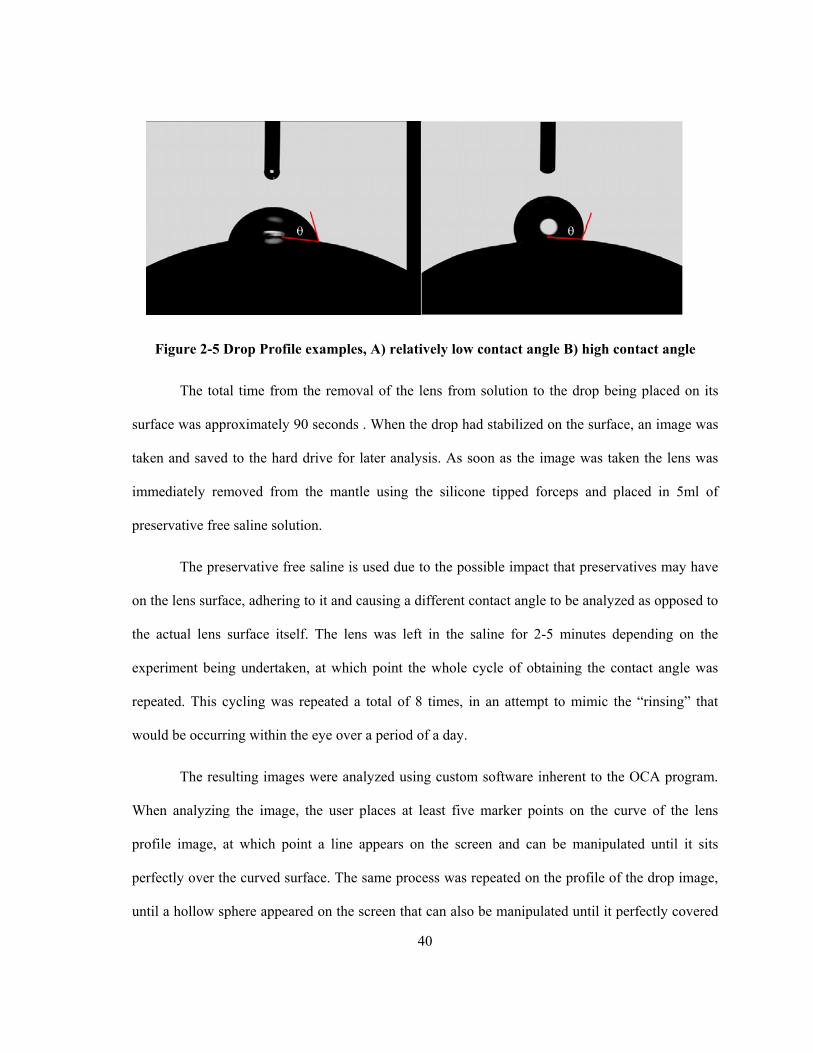
40
Figure 2-5 Drop Profile examples, A) relatively low contact angle B) high contact angle
The total time from the removal of the lens from solution to the drop being placed on its
surface was approximately 90 seconds . When the drop had stabilized on the surface, an image was
taken and saved to the hard drive for later analysis. As soon as the image was taken the lens was
immediately removed from the mantle using the silicone tipped forceps and placed in 5ml of
preservative free saline solution.
The preservative free saline is used due to the possible impact that preservatives may have
on the lens surface, adhering to it and causing a different contact angle to be analyzed as opposed to
the actual lens surface itself. The lens was left in the saline for 2-5 minutes depending on the
experiment being undertaken, at which point the whole cycle of obtaining the contact angle was
repeated. This cycling was repeated a total of 8 times, in an attempt to mimic the “rinsing” that
would be occurring within the eye over a period of a day.
The resulting images were analyzed using custom software inherent to the OCA program.
When analyzing the image, the user places at least five marker points on the curve of the lens
profile image, at which point a line appears on the screen and can be manipulated until it sits
perfectly over the curved surface. The same process was repeated on the profile of the drop image,
until a hollow sphere appeared on the screen that can also be manipulated until it perfectly covered
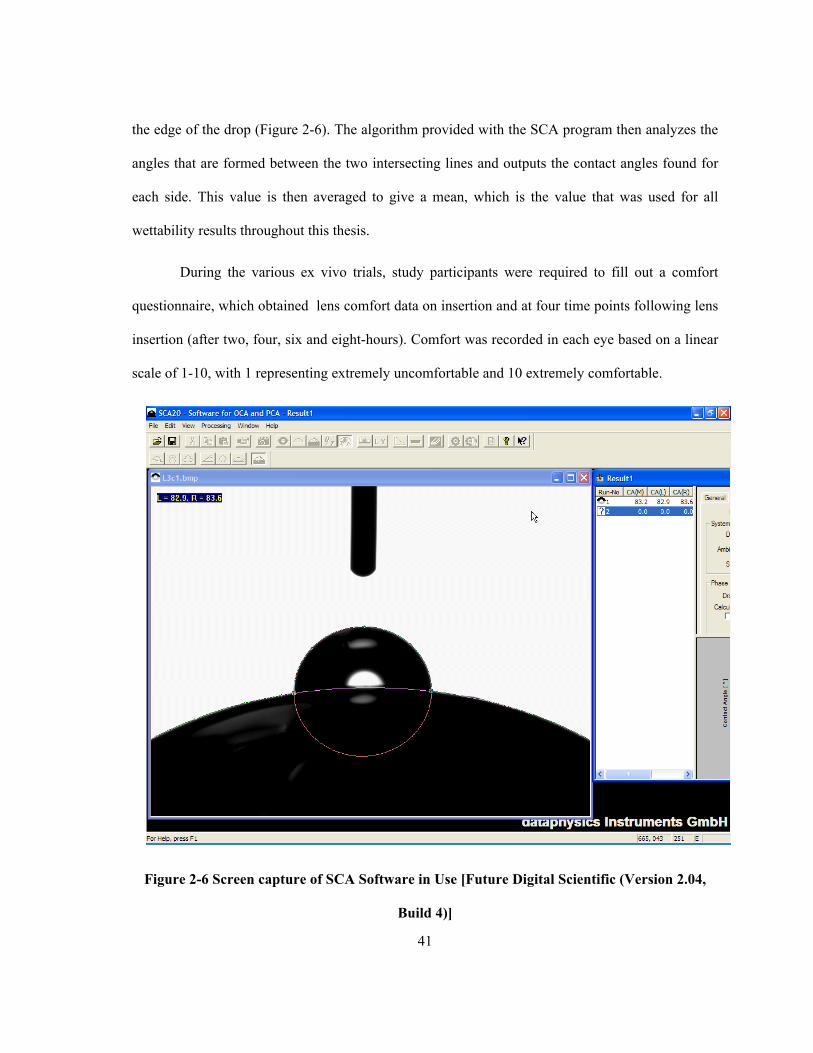
41
the edge of the drop (Figure 2-6). The algorithm provided with the SCA program then analyzes the
angles that are formed between the two intersecting lines and outputs the contact angles found for
each side. This value is then averaged to give a mean, which is the value that was used for all
wettability results throughout this thesis.
During the various ex vivo trials, study participants were required to fill out a comfort
questionnaire, which obtained lens comfort data on insertion and at four time points following lens
insertion (after two, four, six and eight-hours). Comfort was recorded in each eye based on a linear
scale of 1-10, with 1 representing extremely uncomfortable and 10 extremely comfortable.
Figure 2-6 Screen capture of SCA Software in Use [Future Digital Scientific (Version 2.04,
Build 4)]
42
2.4 Protein Deposition on Contact Lenses
Protein deposition can have a significant impact upon contact lens comfort. 16, 19, 22, 25, 55-61, 65
One further novel aspect of this thesis related to an investigation into the proteins that had adhered
to worn lenses, using an Ettan DIGE system (Amersham Pharmacia Biotech) to map and isolate
which proteins are present. The process involved in this experiment consisted of a pilot study and
then a final study. For the pilot study, four randomly selected Acuvue 2 lenses that were soaked in
one of three care solutions (OptiFree Express, ReNu MoistureLoc, or Solo-Care Aqua) for 12 to 24
hours and then worn for 8 hours were used. For the purpose of the main experiment, lenses were
randomly collected from four subjects, two of whom were symptomatic wearers of contact lenses
(suffered from lens-induced contact lens dryness) and two of whom were asymptomatic wearers. A
symptomatic patient was considered to be someone who experienced sensations of dryness and
discomfort within eight hours of wearing contact lenses, while an asymptomatic patient feels no
discomfort within this time period. For each subject in this case, three lenses that were worn for
eight hours were taken, each having been previously soaked in one of the three solutions for 12-24
hours prior to insertion.
In order to extract the proteins from these lenses they were placed in a solution containing
50:50 acetonitrile and 0.02% trifluoroacetic acid, using 2ml total for each lens. This method of
extraction was first developed by Keith et al and has shown to be very effective in removing
proteins from soft hydrophilic contact lenses.25, 79, 80 Each aliquot was 0.6ml of the 2.0ml, producing
a total of 3 aliquots. Each aliquot was then centrifuged down until a pellet formed, the excess fluid
was removed and the samples kept in a -20°C freezer until required for use.
In the pilot study the samples were removed from the freezer and rehydrated in a lysis
buffer which contained 7M urea, 2M thiourea, 4% CHAPS (3-[ (3-Cholamidopropyl)-
Dimethylammonio]-1-Propane Sulfonate) and 20mM of TRIS at a ph of 8 with the total volume of
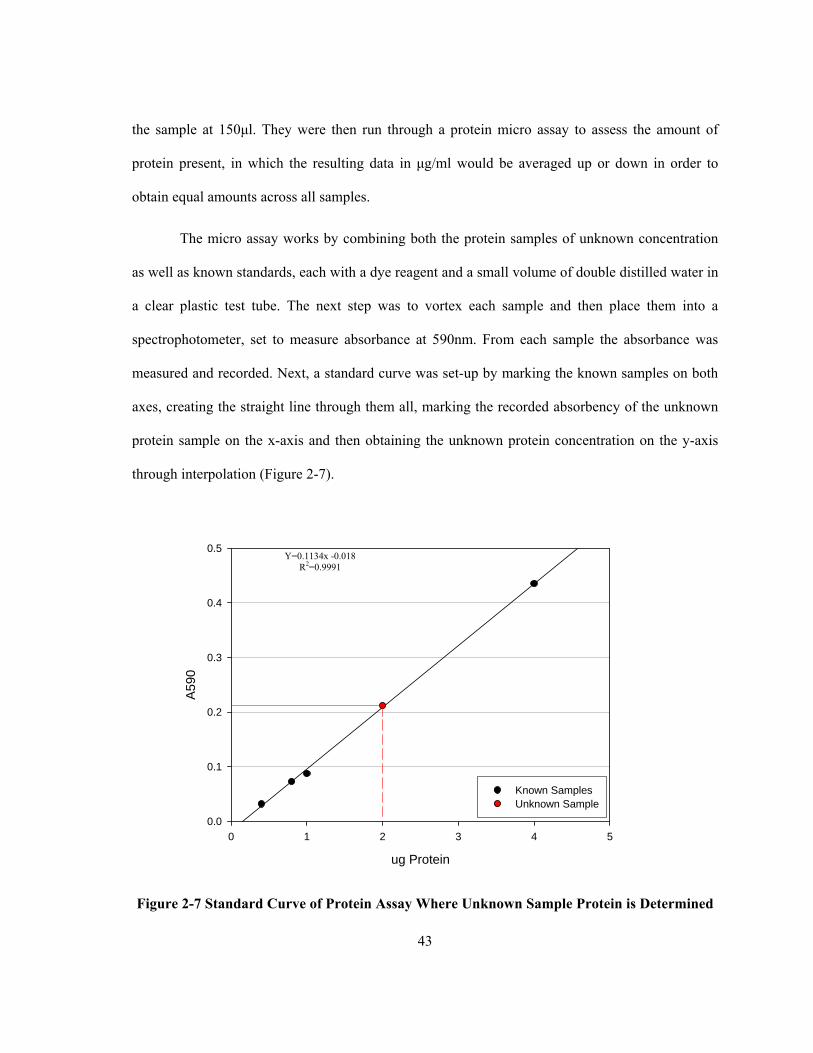
43
the sample at 150μl. They were then run through a protein micro assay to assess the amount of
protein present, in which the resulting data in μg/ml would be averaged up or down in order to
obtain equal amounts across all samples.
The micro assay works by combining both the protein samples of unknown concentration
as well as known standards, each with a dye reagent and a small volume of double distilled water in
a clear plastic test tube. The next step was to vortex each sample and then place them into a
spectrophotometer, set to measure absorbance at 590nm. From each sample the absorbance was
measured and recorded. Next, a standard curve was set-up by marking the known samples on both
axes, creating the straight line through them all, marking the recorded absorbency of the unknown
protein sample on the x-axis and then obtaining the unknown protein concentration on the y-axis
through interpolation (Figure 2-7).
ug Protein
0 1 2 3 4 5
A590
0.0
0.1
0.2
0.3
0.4
0.5
Known SamplesUnknown Sample
Y=0.1134x -0.018 R2=0.9991
Figure 2-7 Standard Curve of Protein Assay Where Unknown Sample Protein is Determined
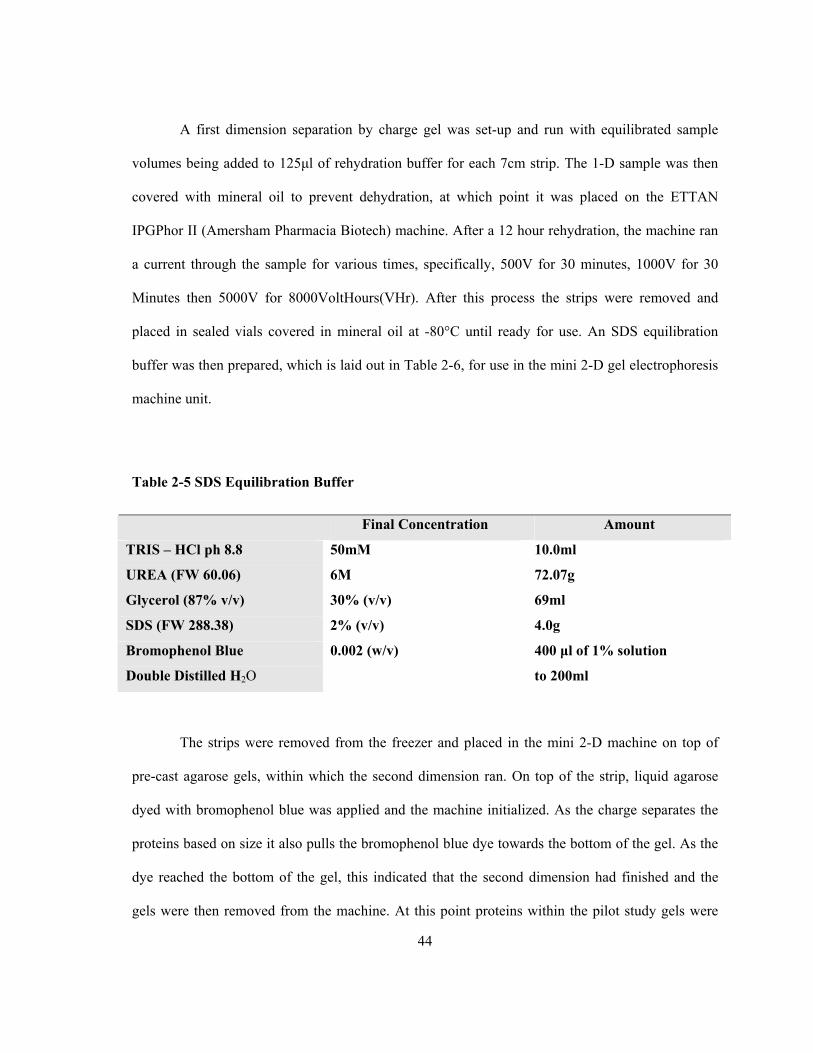
44
A first dimension separation by charge gel was set-up and run with equilibrated sample
volumes being added to 125μl of rehydration buffer for each 7cm strip. The 1-D sample was then
covered with mineral oil to prevent dehydration, at which point it was placed on the ETTAN
IPGPhor II (Amersham Pharmacia Biotech) machine. After a 12 hour rehydration, the machine ran
a current through the sample for various times, specifically, 500V for 30 minutes, 1000V for 30
Minutes then 5000V for 8000VoltHours(VHr). After this process the strips were removed and
placed in sealed vials covered in mineral oil at -80°C until ready for use. An SDS equilibration
buffer was then prepared, which is laid out in Table 2-6, for use in the mini 2-D gel electrophoresis
machine unit.
Table 2-5 SDS Equilibration Buffer
Final Concentration Amount
TRIS – HCl ph 8.8 50mM 10.0ml
UREA (FW 60.06) 6M 72.07g
Glycerol (87% v/v) 30% (v/v) 69ml
SDS (FW 288.38) 2% (v/v) 4.0g
Bromophenol Blue 0.002 (w/v) 400 μl of 1% solution
Double Distilled H2O to 200ml
The strips were removed from the freezer and placed in the mini 2-D machine on top of
pre-cast agarose gels, within which the second dimension ran. On top of the strip, liquid agarose
dyed with bromophenol blue was applied and the machine initialized. As the charge separates the
proteins based on size it also pulls the bromophenol blue dye towards the bottom of the gel. As the
dye reached the bottom of the gel, this indicated that the second dimension had finished and the
gels were then removed from the machine. At this point proteins within the pilot study gels were
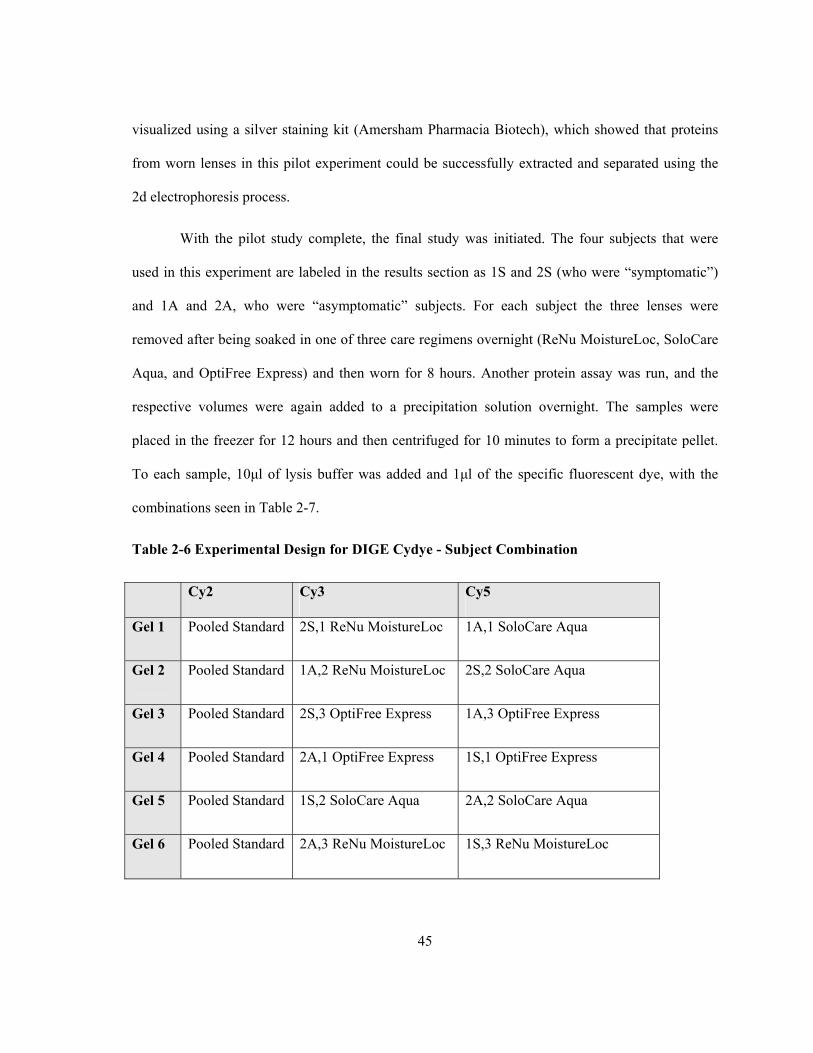
45
visualized using a silver staining kit (Amersham Pharmacia Biotech), which showed that proteins
from worn lenses in this pilot experiment could be successfully extracted and separated using the
2d electrophoresis process.
With the pilot study complete, the final study was initiated. The four subjects that were
used in this experiment are labeled in the results section as 1S and 2S (who were “symptomatic”)
and 1A and 2A, who were “asymptomatic” subjects. For each subject the three lenses were
removed after being soaked in one of three care regimens overnight (ReNu MoistureLoc, SoloCare
Aqua, and OptiFree Express) and then worn for 8 hours. Another protein assay was run, and the
respective volumes were again added to a precipitation solution overnight. The samples were
placed in the freezer for 12 hours and then centrifuged for 10 minutes to form a precipitate pellet.
To each sample, 10μl of lysis buffer was added and 1μl of the specific fluorescent dye, with the
combinations seen in Table 2-7.
Table 2-6 Experimental Design for DIGE Cydye - Subject Combination
Cy2 Cy3 Cy5
Gel 1 Pooled Standard 2S,1 ReNu MoistureLoc 1A,1 SoloCare Aqua
Gel 2 Pooled Standard 1A,2 ReNu MoistureLoc 2S,2 SoloCare Aqua
Gel 3 Pooled Standard 2S,3 OptiFree Express 1A,3 OptiFree Express
Gel 4 Pooled Standard 2A,1 OptiFree Express 1S,1 OptiFree Express
Gel 5 Pooled Standard 1S,2 SoloCare Aqua 2A,2 SoloCare Aqua
Gel 6 Pooled Standard 2A,3 ReNu MoistureLoc 1S,3 ReNu MoistureLoc
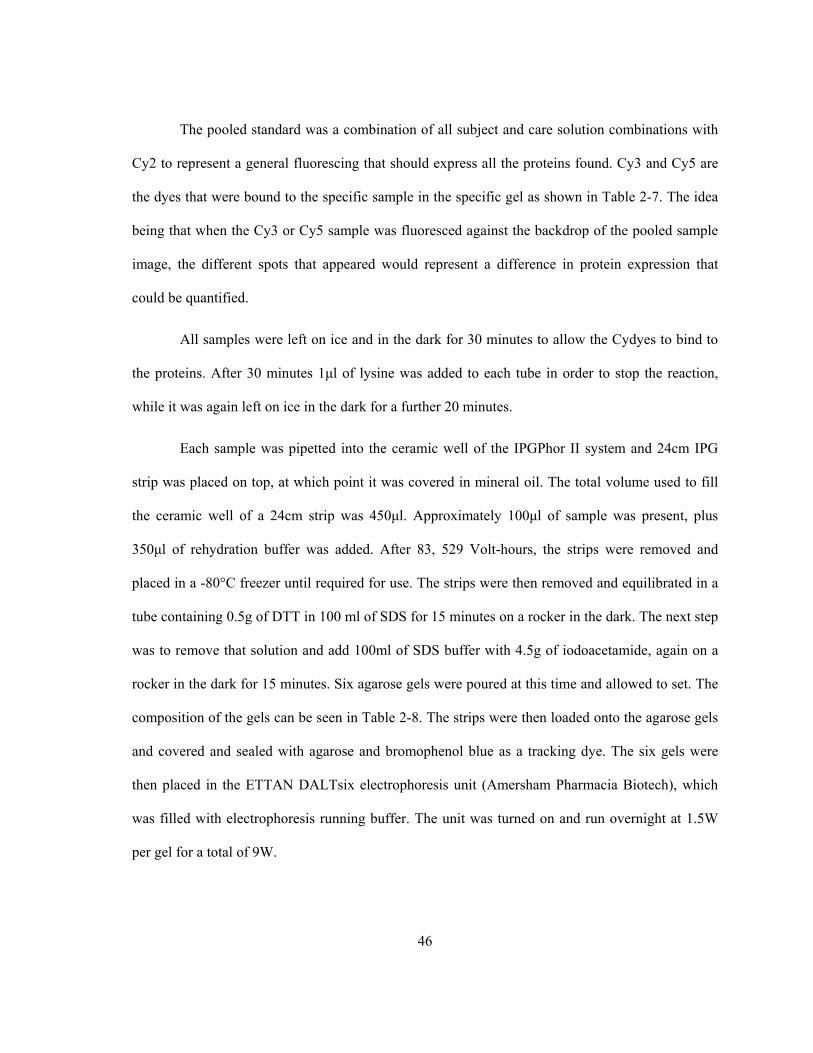
46
The pooled standard was a combination of all subject and care solution combinations with
Cy2 to represent a general fluorescing that should express all the proteins found. Cy3 and Cy5 are
the dyes that were bound to the specific sample in the specific gel as shown in Table 2-7. The idea
being that when the Cy3 or Cy5 sample was fluoresced against the backdrop of the pooled sample
image, the different spots that appeared would represent a difference in protein expression that
could be quantified.
All samples were left on ice and in the dark for 30 minutes to allow the Cydyes to bind to
the proteins. After 30 minutes 1μl of lysine was added to each tube in order to stop the reaction,
while it was again left on ice in the dark for a further 20 minutes.
Each sample was pipetted into the ceramic well of the IPGPhor II system and 24cm IPG
strip was placed on top, at which point it was covered in mineral oil. The total volume used to fill
the ceramic well of a 24cm strip was 450μl. Approximately 100μl of sample was present, plus
350μl of rehydration buffer was added. After 83, 529 Volt-hours, the strips were removed and
placed in a -80°C freezer until required for use. The strips were then removed and equilibrated in a
tube containing 0.5g of DTT in 100 ml of SDS for 15 minutes on a rocker in the dark. The next step
was to remove that solution and add 100ml of SDS buffer with 4.5g of iodoacetamide, again on a
rocker in the dark for 15 minutes. Six agarose gels were poured at this time and allowed to set. The
composition of the gels can be seen in Table 2-8. The strips were then loaded onto the agarose gels
and covered and sealed with agarose and bromophenol blue as a tracking dye. The six gels were
then placed in the ETTAN DALTsix electrophoresis unit (Amersham Pharmacia Biotech), which
was filled with electrophoresis running buffer. The unit was turned on and run overnight at 1.5W
per gel for a total of 9W.
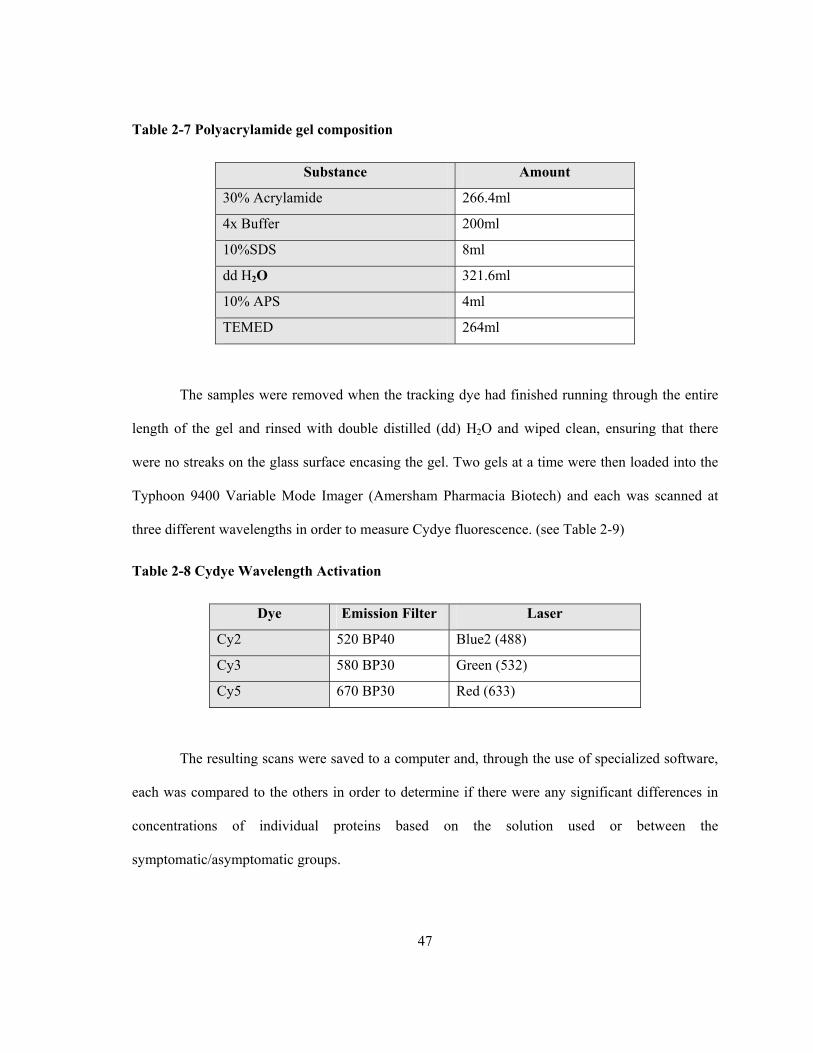
47
Table 2-7 Polyacrylamide gel composition
Substance Amount
30% Acrylamide 266.4ml
4x Buffer 200ml
10%SDS 8ml
dd H2O 321.6ml
10% APS 4ml
TEMED 264ml
The samples were removed when the tracking dye had finished running through the entire
length of the gel and rinsed with double distilled (dd) H2O and wiped clean, ensuring that there
were no streaks on the glass surface encasing the gel. Two gels at a time were then loaded into the
Typhoon 9400 Variable Mode Imager (Amersham Pharmacia Biotech) and each was scanned at
three different wavelengths in order to measure Cydye fluorescence. (see Table 2-9)
Table 2-8 Cydye Wavelength Activation
Dye Emission Filter Laser
Cy2 520 BP40 Blue2 (488)
Cy3 580 BP30 Green (532)
Cy5 670 BP30 Red (633)
The resulting scans were saved to a computer and, through the use of specialized software,
each was compared to the others in order to determine if there were any significant differences in
concentrations of individual proteins based on the solution used or between the
symptomatic/asymptomatic groups.
48
The software used was DeCyder Differential Analysis (Amersham Pharmacia Biotech)
system which has automated detection, quantitation matching and comparison of multiple 2D DIGE
gels. The software picks out all the spots that are found on each gel and automatically matches them
to those that are found on other gels, helped by the pooled standard that can be found across all
samples. Statistical analysis was then performed by the software and identified out spots that were
found to be differently expressed in one sample treatment as compared to all the others.
49
Chapter 3 Results and Discussion
3.1 In Vitro Data
3.1.1 Blister Pack Solution Characteristics
The first data that were acquired were the properties of the blister pack solutions. The
results of the pH, osmolality and surface tension of the blister pack solutions are described in Table
3-1 and Table 3-2, for the pHEMA and siloxane lenses respectively.
The pH of these solutions is important because it is known that the eye can tolerate a pH
within the range of 6.60 to 7.80,81 hence they need to match the pH of the ocular environment in
order to insure a quick adaptation of the lens within the eye and minimize discomfort. The
osmolality within the eye has values near 305mOsm/Kg,82 therefore by creating a solution that is
close to this value will also lead to faster adaptation of the lens within the eye. The surface tension
measurements also detail the differences that may exist between the solution and the in-eye value,
which is approximately 40-46 dynes/cm.83, 84 Even though the surface tension measurements of the
daily-wear lenses are similar, they do not produce similar results, as can be seen in Figure 3-6. This
is most likely due to the inability of the surfactants within the blister pack to adhere to the lens and
create a very hydrophilic surface, with the differences primarily seen between the Biomedics 1-Day
lens and all the rest. There are no surface tension measurements of the silicone hydrogel lenses due
to inhibitory cost of opening so many packs to get enough fluid to run the test.
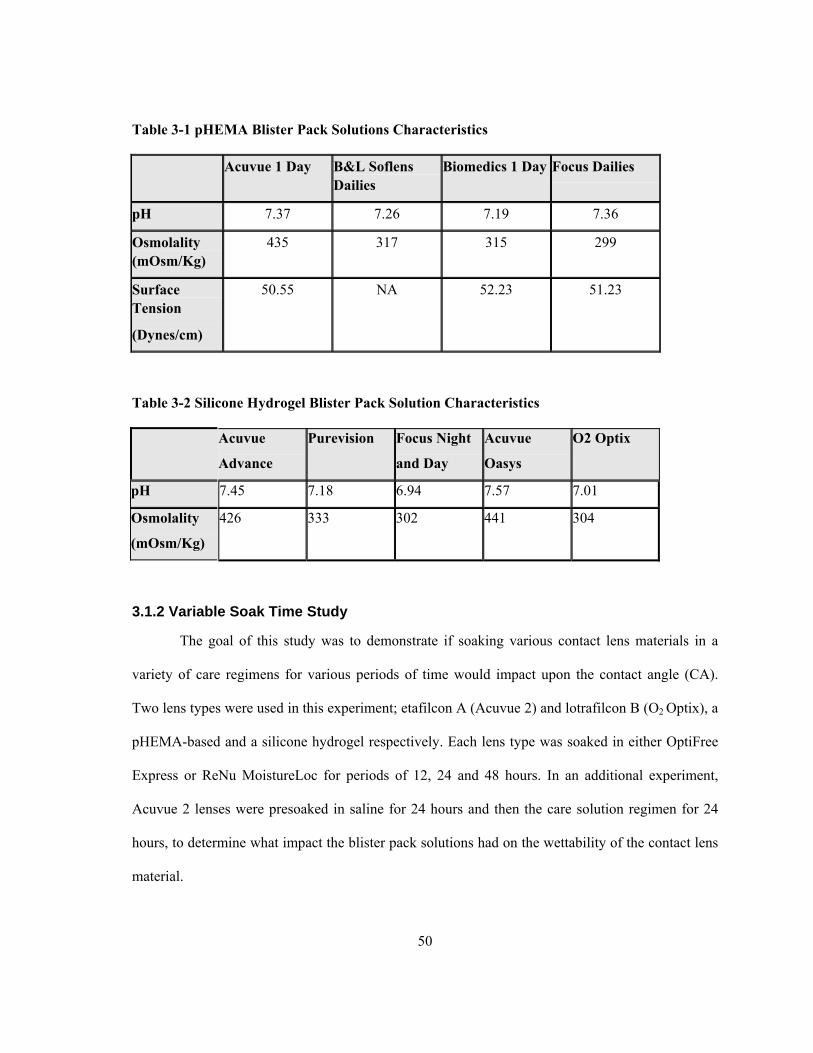
50
Table 3-1 pHEMA Blister Pack Solutions Characteristics
Acuvue 1 Day B&L Soflens Dailies
Biomedics 1 Day Focus Dailies
pH 7.37 7.26 7.19 7.36
Osmolality (mOsm/Kg)
435 317 315 299
Surface Tension
(Dynes/cm)
50.55 NA 52.23 51.23
Table 3-2 Silicone Hydrogel Blister Pack Solution Characteristics
Acuvue
Advance
Purevision Focus Night
and Day
Acuvue
Oasys
O2 Optix
pH 7.45 7.18 6.94 7.57 7.01
Osmolality
(mOsm/Kg)
426 333 302 441 304
3.1.2 Variable Soak Time Study
The goal of this study was to demonstrate if soaking various contact lens materials in a
variety of care regimens for various periods of time would impact upon the contact angle (CA).
Two lens types were used in this experiment; etafilcon A (Acuvue 2) and lotrafilcon B (O2 Optix), a
pHEMA-based and a silicone hydrogel respectively. Each lens type was soaked in either OptiFree
Express or ReNu MoistureLoc for periods of 12, 24 and 48 hours. In an additional experiment,
Acuvue 2 lenses were presoaked in saline for 24 hours and then the care solution regimen for 24
hours, to determine what impact the blister pack solutions had on the wettability of the contact lens
material.
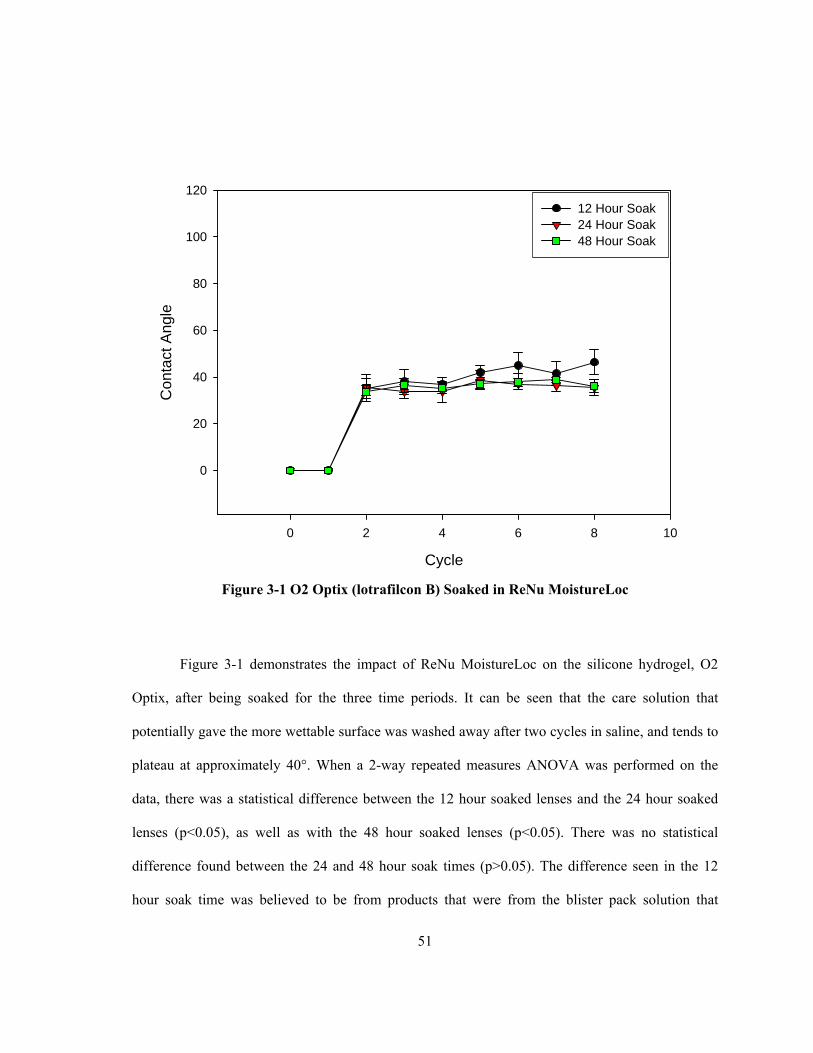
51
Cycle
0 2 4 6 8 10
Con
tact
Ang
le
0
20
40
60
80
100
12012 Hour Soak 24 Hour Soak 48 Hour Soak
Figure 3-1 O2 Optix (lotrafilcon B) Soaked in ReNu MoistureLoc
Figure 3-1 demonstrates the impact of ReNu MoistureLoc on the silicone hydrogel, O2
Optix, after being soaked for the three time periods. It can be seen that the care solution that
potentially gave the more wettable surface was washed away after two cycles in saline, and tends to
plateau at approximately 40°. When a 2-way repeated measures ANOVA was performed on the
data, there was a statistical difference between the 12 hour soaked lenses and the 24 hour soaked
lenses (p<0.05), as well as with the 48 hour soaked lenses (p<0.05). There was no statistical
difference found between the 24 and 48 hour soak times (p>0.05). The difference seen in the 12
hour soak time was believed to be from products that were from the blister pack solution that
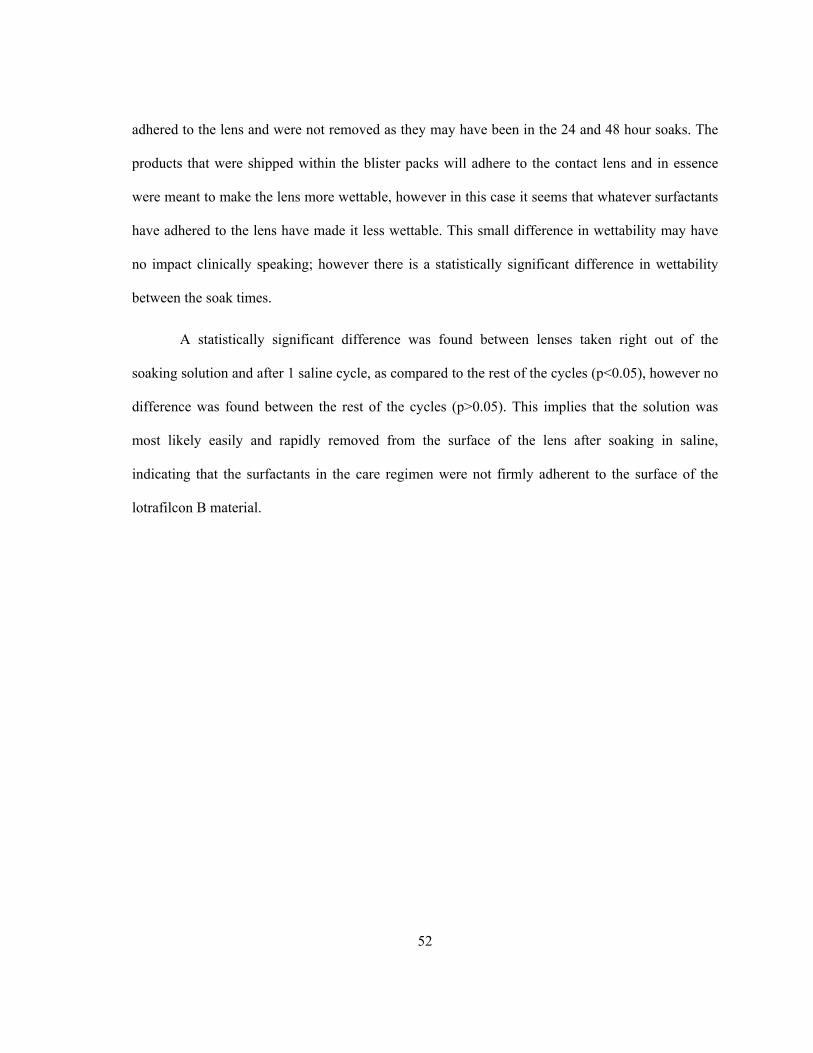
52
adhered to the lens and were not removed as they may have been in the 24 and 48 hour soaks. The
products that were shipped within the blister packs will adhere to the contact lens and in essence
were meant to make the lens more wettable, however in this case it seems that whatever surfactants
have adhered to the lens have made it less wettable. This small difference in wettability may have
no impact clinically speaking; however there is a statistically significant difference in wettability
between the soak times.
A statistically significant difference was found between lenses taken right out of the
soaking solution and after 1 saline cycle, as compared to the rest of the cycles (p<0.05), however no
difference was found between the rest of the cycles (p>0.05). This implies that the solution was
most likely easily and rapidly removed from the surface of the lens after soaking in saline,
indicating that the surfactants in the care regimen were not firmly adherent to the surface of the
lotrafilcon B material.
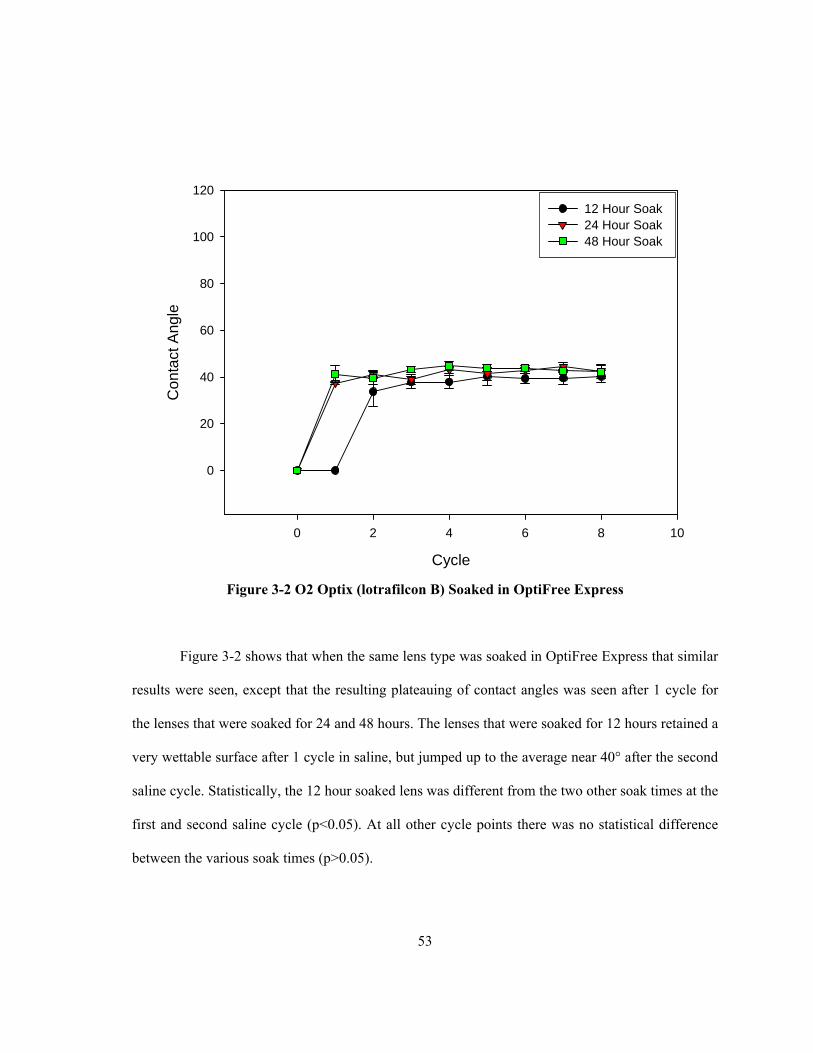
53
Cycle
0 2 4 6 8 10
Con
tact
Ang
le
0
20
40
60
80
100
12012 Hour Soak 24 Hour Soak 48 Hour Soak
Figure 3-2 O2 Optix (lotrafilcon B) Soaked in OptiFree Express
Figure 3-2 shows that when the same lens type was soaked in OptiFree Express that similar
results were seen, except that the resulting plateauing of contact angles was seen after 1 cycle for
the lenses that were soaked for 24 and 48 hours. The lenses that were soaked for 12 hours retained a
very wettable surface after 1 cycle in saline, but jumped up to the average near 40° after the second
saline cycle. Statistically, the 12 hour soaked lens was different from the two other soak times at the
first and second saline cycle (p<0.05). At all other cycle points there was no statistical difference
between the various soak times (p>0.05).
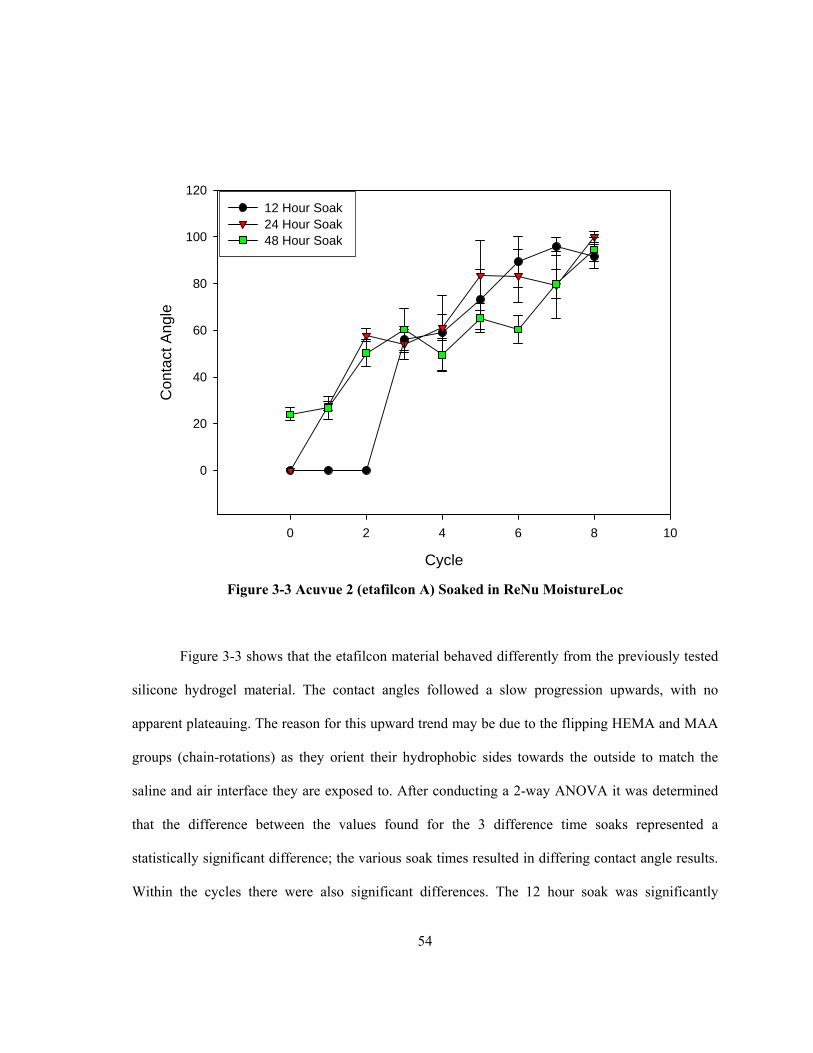
54
Cycle
0 2 4 6 8 10
Con
tact
Ang
le
0
20
40
60
80
100
12012 Hour Soak 24 Hour Soak 48 Hour Soak
Figure 3-3 Acuvue 2 (etafilcon A) Soaked in ReNu MoistureLoc
Figure 3-3 shows that the etafilcon material behaved differently from the previously tested
silicone hydrogel material. The contact angles followed a slow progression upwards, with no
apparent plateauing. The reason for this upward trend may be due to the flipping HEMA and MAA
groups (chain-rotations) as they orient their hydrophobic sides towards the outside to match the
saline and air interface they are exposed to. After conducting a 2-way ANOVA it was determined
that the difference between the values found for the 3 difference time soaks represented a
statistically significant difference; the various soak times resulted in differing contact angle results.
Within the cycles there were also significant differences. The 12 hour soak was significantly
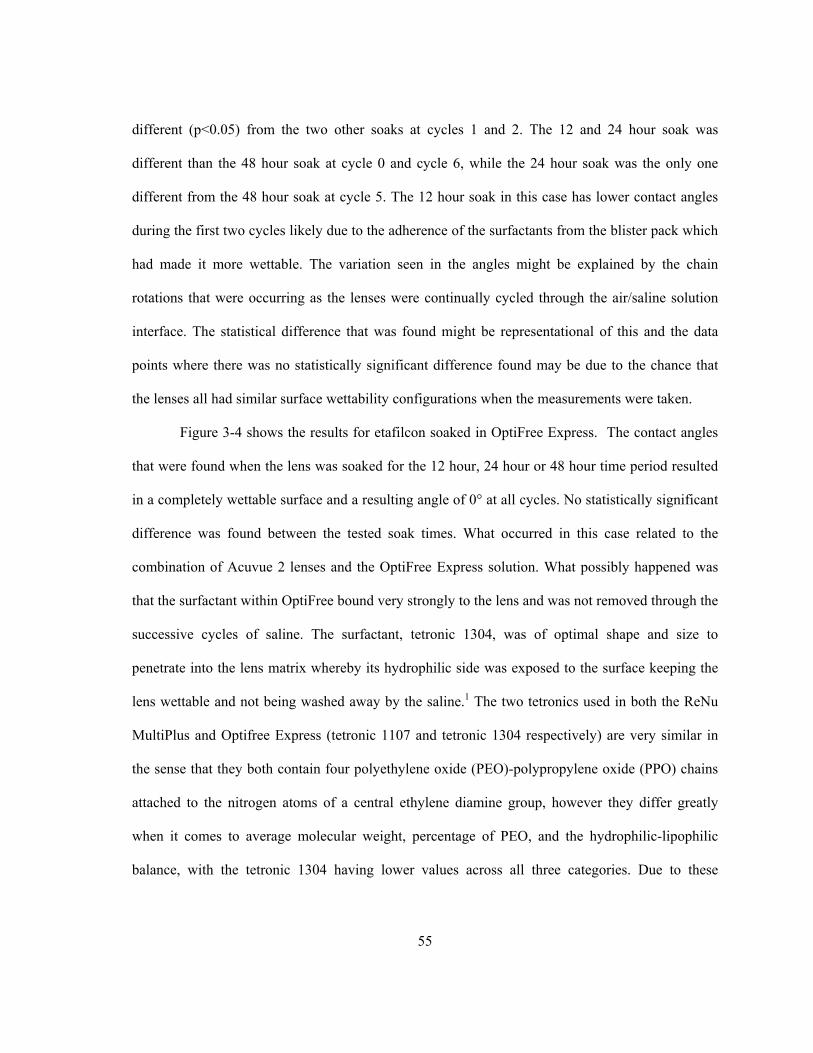
55
different (p<0.05) from the two other soaks at cycles 1 and 2. The 12 and 24 hour soak was
different than the 48 hour soak at cycle 0 and cycle 6, while the 24 hour soak was the only one
different from the 48 hour soak at cycle 5. The 12 hour soak in this case has lower contact angles
during the first two cycles likely due to the adherence of the surfactants from the blister pack which
had made it more wettable. The variation seen in the angles might be explained by the chain
rotations that were occurring as the lenses were continually cycled through the air/saline solution
interface. The statistical difference that was found might be representational of this and the data
points where there was no statistically significant difference found may be due to the chance that
the lenses all had similar surface wettability configurations when the measurements were taken.
Figure 3-4 shows the results for etafilcon soaked in OptiFree Express. The contact angles
that were found when the lens was soaked for the 12 hour, 24 hour or 48 hour time period resulted
in a completely wettable surface and a resulting angle of 0° at all cycles. No statistically significant
difference was found between the tested soak times. What occurred in this case related to the
combination of Acuvue 2 lenses and the OptiFree Express solution. What possibly happened was
that the surfactant within OptiFree bound very strongly to the lens and was not removed through the
successive cycles of saline. The surfactant, tetronic 1304, was of optimal shape and size to
penetrate into the lens matrix whereby its hydrophilic side was exposed to the surface keeping the
lens wettable and not being washed away by the saline.1 The two tetronics used in both the ReNu
MultiPlus and Optifree Express (tetronic 1107 and tetronic 1304 respectively) are very similar in
the sense that they both contain four polyethylene oxide (PEO)-polypropylene oxide (PPO) chains
attached to the nitrogen atoms of a central ethylene diamine group, however they differ greatly
when it comes to average molecular weight, percentage of PEO, and the hydrophilic-lipophilic
balance, with the tetronic 1304 having lower values across all three categories. Due to these
56
differences in chemical make-up, the tetronic 1304 was better able to adhere to this lens, making it
more hydrophilic.
Cycle
0 2 4 6 8 10
Con
tact
Ang
le
0
20
40
60
80
100
12012 Hour Soak 24 Hour Soak 48 Hour Soak
Figure 3-4 Acuvue 2 (etafilcon A) Soaked in OptiFree Express
The goal of this study was to soak the Acuvue 2 lens in a saline solution for 24 hours prior
to soaking it in the two care solutions to determine if the surfactants present in the blister pack have
an impact upon the wettability results. Lenses were pre-soaked in saline overnight, and then soaked
in either OptiFree Express or SoloCare Aqua for 24 hours. They were then exposed to the usual
saline cycling procedure (Figure 3-5). The results show that pre-soaking in saline had no significant
effect on lenses exposed to OptiFree Express, with the contact angle remaining at 0° through all
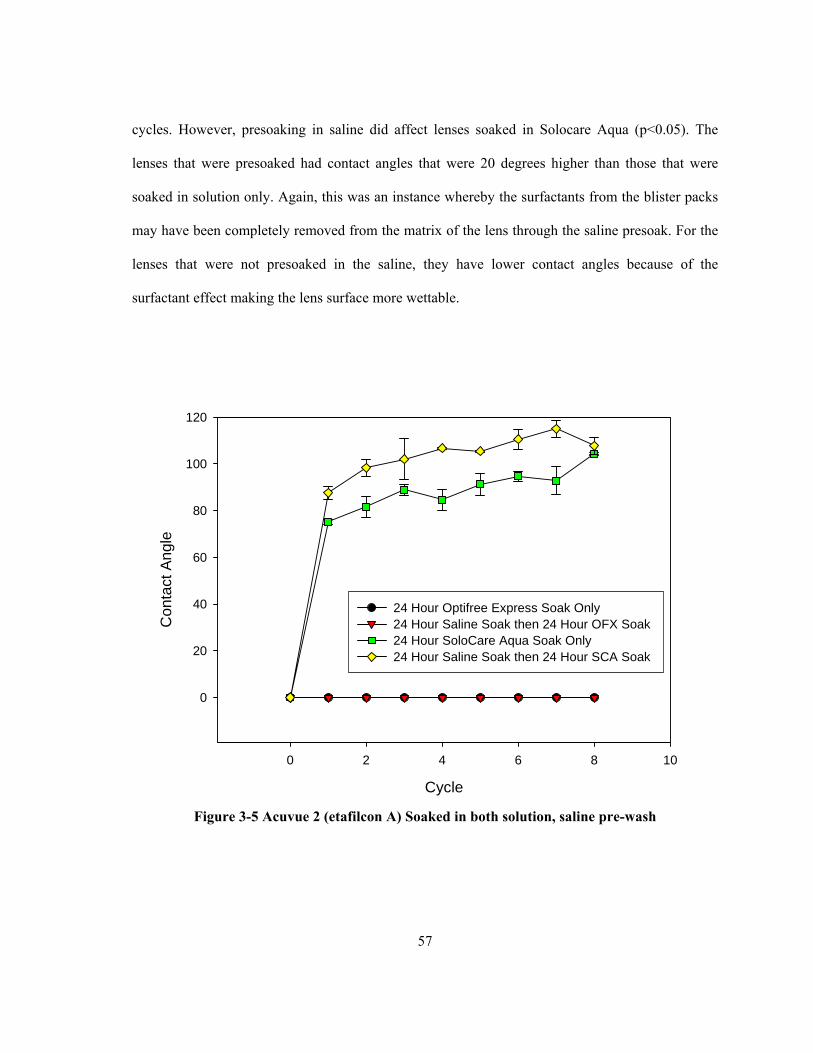
57
cycles. However, presoaking in saline did affect lenses soaked in Solocare Aqua (p<0.05). The
lenses that were presoaked had contact angles that were 20 degrees higher than those that were
soaked in solution only. Again, this was an instance whereby the surfactants from the blister packs
may have been completely removed from the matrix of the lens through the saline presoak. For the
lenses that were not presoaked in the saline, they have lower contact angles because of the
surfactant effect making the lens surface more wettable.
Cycle
0 2 4 6 8 10
Con
tact
Ang
le
0
20
40
60
80
100
120
24 Hour Optifree Express Soak Only24 Hour Saline Soak then 24 Hour OFX Soak 24 Hour SoloCare Aqua Soak Only24 Hour Saline Soak then 24 Hour SCA Soak
Figure 3-5 Acuvue 2 (etafilcon A) Soaked in both solution, saline pre-wash
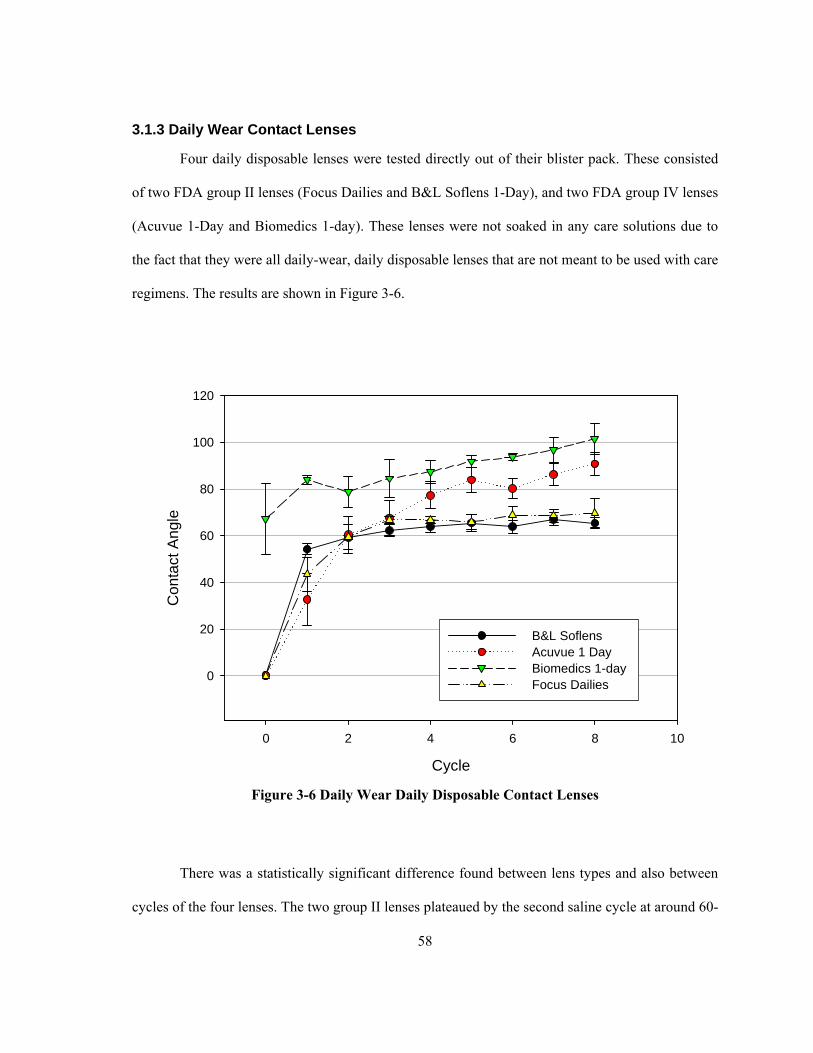
58
3.1.3 Daily Wear Contact Lenses
Four daily disposable lenses were tested directly out of their blister pack. These consisted
of two FDA group II lenses (Focus Dailies and B&L Soflens 1-Day), and two FDA group IV lenses
(Acuvue 1-Day and Biomedics 1-day). These lenses were not soaked in any care solutions due to
the fact that they were all daily-wear, daily disposable lenses that are not meant to be used with care
regimens. The results are shown in Figure 3-6.
Cycle
0 2 4 6 8 10
Con
tact
Ang
le
0
20
40
60
80
100
120
B&L Soflens Acuvue 1 Day Biomedics 1-day Focus Dailies
Figure 3-6 Daily Wear Daily Disposable Contact Lenses
There was a statistically significant difference found between lens types and also between
cycles of the four lenses. The two group II lenses plateaued by the second saline cycle at around 60-
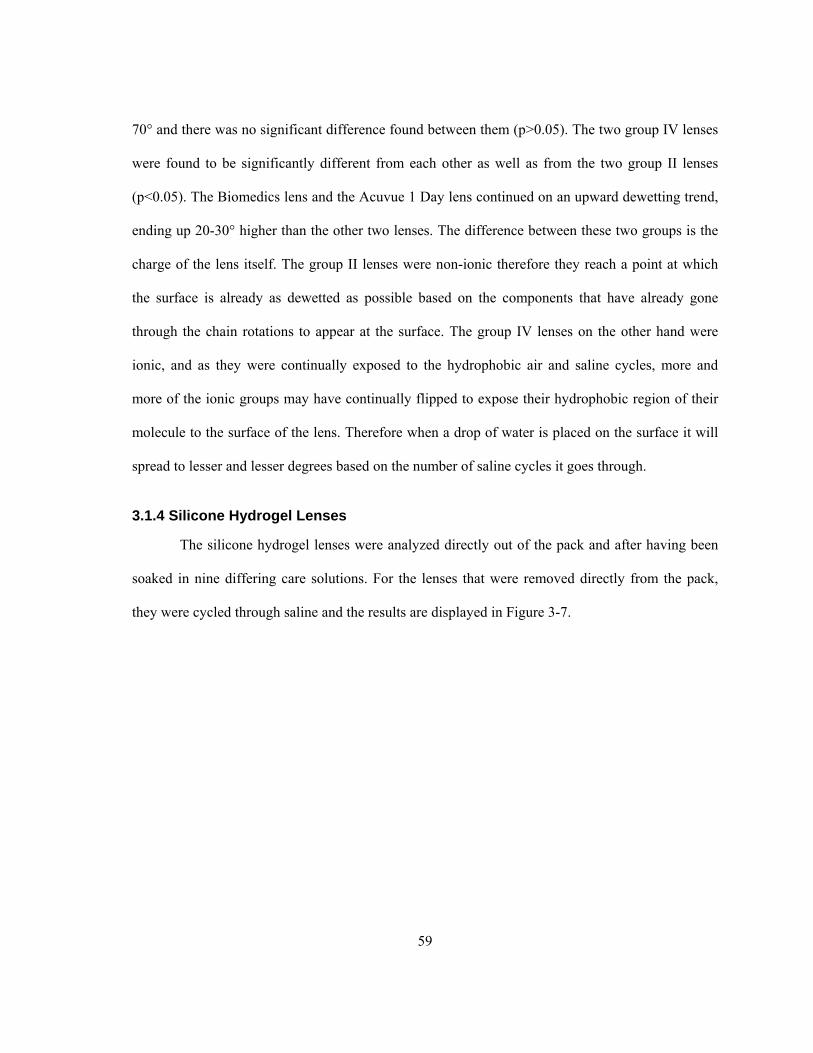
59
70° and there was no significant difference found between them (p>0.05). The two group IV lenses
were found to be significantly different from each other as well as from the two group II lenses
(p<0.05). The Biomedics lens and the Acuvue 1 Day lens continued on an upward dewetting trend,
ending up 20-30° higher than the other two lenses. The difference between these two groups is the
charge of the lens itself. The group II lenses were non-ionic therefore they reach a point at which
the surface is already as dewetted as possible based on the components that have already gone
through the chain rotations to appear at the surface. The group IV lenses on the other hand were
ionic, and as they were continually exposed to the hydrophobic air and saline cycles, more and
more of the ionic groups may have continually flipped to expose their hydrophobic region of their
molecule to the surface of the lens. Therefore when a drop of water is placed on the surface it will
spread to lesser and lesser degrees based on the number of saline cycles it goes through.
3.1.4 Silicone Hydrogel Lenses
The silicone hydrogel lenses were analyzed directly out of the pack and after having been
soaked in nine differing care solutions. For the lenses that were removed directly from the pack,
they were cycled through saline and the results are displayed in Figure 3-7.
60
Cycle
0 2 4 6 8 10
Con
tact
Ang
le
0
20
40
60
80
100
120
O2 Optix Acuvue Advance Focus Night and Day Purevision Acuvue Oasys
Figure 3-7 Silicone Hydrogels Out of Pack
A statistical difference was found between all the lenses through all cycles (p<0.001), with
various and distinct trends being seen. The Acuvue Advance lens demonstrated the lowest contact
angle directly out of the pack (0°) however after one cycle in saline the contact angle jumped up to
110°, where it plateaued for the rest of the cycles. The four other lens types each started at distinct
points, with the OASYS and Purevision lenses remaining at that same wettability through all cycles
(100° and 115° respectively). The two remaining lenses, Focus Night & Day and O2 Optix, which
were both produced by the same company and have a similar coating to hide the hydrophobic
silicone, behave in the same manner of slowly rising to a plateau point after 2 cycles in saline.
61
These two lenses also have the lowest wettability results of all five lenses tested. The Purevision
material had very high contact angles most likely due to the surface treatment it had received,
which leaves hydrophobic silicone exposed to the surface where the water drop made contact. A
similar possibility for the Acuvue products is given as well, since they have no surface treatment at
all, leaving all the silicone exposed to the surface. The Advance lens appearing more wettable only
out of the blister pack was most likely due to the blister pack solution and internal wetting agent
(PVP) that was still adhered to the surface of the lens. Even though the OASYS lens had similar
wetting agents {OASYS - TearGlyde (Poloxamine [Tetronic 1304] + C-9 ED3A), Advance -
Poloxamine (Tetronic 1304)}, it was not known exactly why it did not exhibit this initial wettability
as well, for OASYS had very high contact angles out of the pack. This might be due to the
difference in water content of the two lens types, with the surfactants not adhering as much to the
OASYS lens. The Focus Night & Day and 02 Optix lenses both had much lower contact angles
possibly due to the surface treatment that completely hides all aspects of the hydrophobic silicone
beneath.
The results for the galyfilcon A lens material (Acuvue Advance) soaked in all nine care
solutions is shown in Figure 3-8. Table 3-3 details all the potential significant and insignificant
combinations. A two-way ANOVA was conducted on all the following silicone and pHEMA
lens/solutions combinations (see sections 3.1.4 and 3.1.5) using the Holm-Sidak method, with all
‘yes’ markings within the table representing statistical significance between the solutions used.
Where a ‘yes’ is marked, the solution with the lower angles will be indicated.
For all results regarding the Advance material, the most obvious difference can be seen
regarding the lenses that were soaked in Solocare Plus, having contact angles approximately 30°
lower than the other solutions. Even though this product is no longer available, it was represented
62
here to exhibit the fact that the wettability (as assessed by sessile drop contact angle) of silicone
hydrogel lenses can be manipulated by soaking in various care solutions. The method by which the
Solocare Plus solution managed to bring the contact angles down so low could be explained by the
surfactants that were within the product (Cremophor RH40; Poloxamer 407) which may have
managed to bind within the lens matrix and could not be removed by rinsing in saline. This is
different from Solocare Aqua which does not have the Cremophor surfactant within it. The main
components of Cremophor are fatty acid esters of glycerol polyethylene glycol and fatty acid esters
of polyethylene glycol, which represent the hydrophobic aspects of the molecule. The hydrophilic
aspects consist of polyethylene glycols and ethoxylated glycerol.85 This surfactant bound very
strongly to this lens, exposing its hydrophilic parts, which resulted in the lower contact angles when
the drop of water was placed on the lens surface. The rest of the solutions represented also had very
low contact angles initially; however the solution was washed off after one or two saline cycles and
resulted in contact angles that hovered around 110°, indicating that their substantivity or surface
adherence was likely very limited. The exception to this was ClearCare, the hydrogen peroxide
system, which initially showed very high contact angles, even after soaking. It may be that the
bubbling action of this system removed any of the inherent PVP of the Advance lens sooner than
other systems, which might also disrupt the binding of its own inherent surfactant.
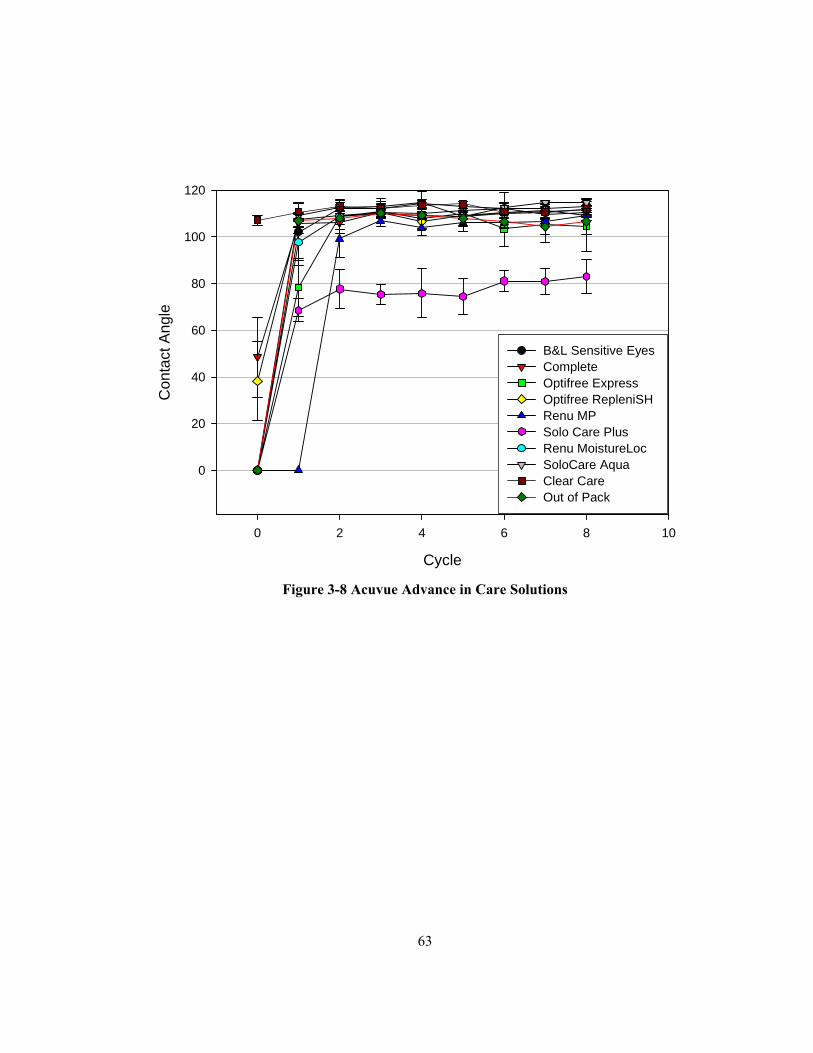
63
Cycle
0 2 4 6 8 10
Con
tact
Ang
le
0
20
40
60
80
100
120
B&L Sensitive Eyes Complete Optifree Express Optifree RepleniSH Renu MP Solo Care Plus Renu MoistureLoc SoloCare Aqua Clear Care Out of Pack
Figure 3-8 Acuvue Advance in Care Solutions
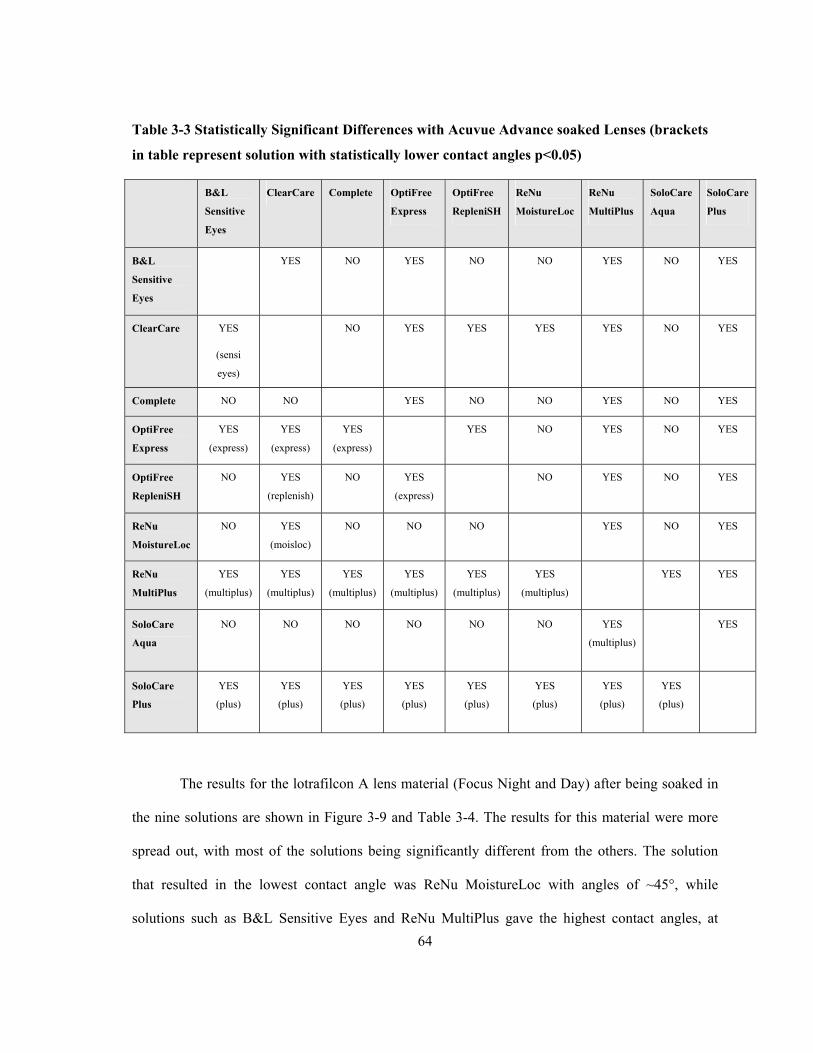
64
Table 3-3 Statistically Significant Differences with Acuvue Advance soaked Lenses (brackets
in table represent solution with statistically lower contact angles p<0.05)
B&L
Sensitive
Eyes
ClearCare Complete OptiFree
Express
OptiFree
RepleniSH
ReNu
MoistureLoc
ReNu
MultiPlus
SoloCare
Aqua
SoloCare
Plus
B&L
Sensitive
Eyes
YES NO YES NO NO YES NO YES
ClearCare YES
(sensi
eyes)
NO YES YES YES YES NO YES
Complete NO NO YES NO NO YES NO YES
OptiFree
Express
YES
(express)
YES
(express)
YES
(express)
YES NO YES NO YES
OptiFree
RepleniSH
NO YES
(replenish)
NO YES
(express)
NO YES NO YES
ReNu
MoistureLoc
NO YES
(moisloc)
NO NO NO YES NO YES
ReNu
MultiPlus
YES
(multiplus)
YES
(multiplus)
YES
(multiplus)
YES
(multiplus)
YES
(multiplus)
YES
(multiplus)
YES YES
SoloCare
Aqua
NO NO NO NO NO NO YES
(multiplus)
YES
SoloCare
Plus
YES
(plus)
YES
(plus)
YES
(plus)
YES
(plus)
YES
(plus)
YES
(plus)
YES
(plus)
YES
(plus)
The results for the lotrafilcon A lens material (Focus Night and Day) after being soaked in
the nine solutions are shown in Figure 3-9 and Table 3-4. The results for this material were more
spread out, with most of the solutions being significantly different from the others. The solution
that resulted in the lowest contact angle was ReNu MoistureLoc with angles of ~45°, while
solutions such as B&L Sensitive Eyes and ReNu MultiPlus gave the highest contact angles, at
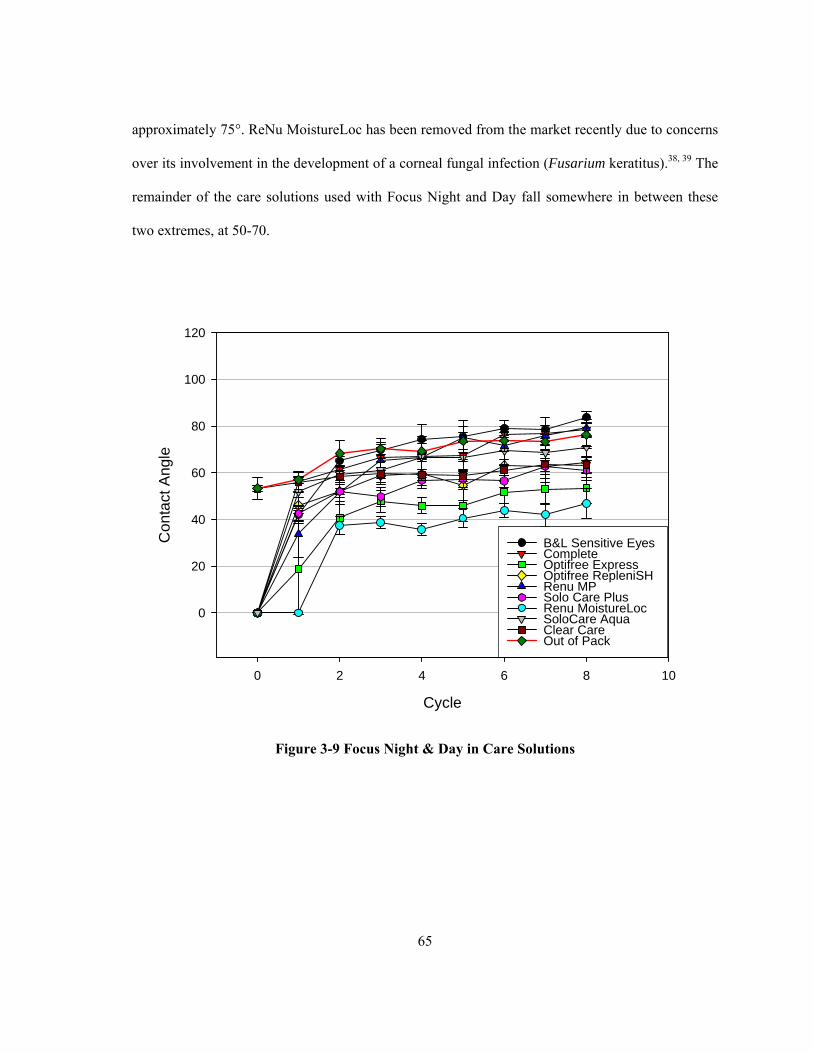
65
approximately 75°. ReNu MoistureLoc has been removed from the market recently due to concerns
over its involvement in the development of a corneal fungal infection (Fusarium keratitus).38, 39 The
remainder of the care solutions used with Focus Night and Day fall somewhere in between these
two extremes, at 50-70.
Cycle
0 2 4 6 8 10
Con
tact
Ang
le
0
20
40
60
80
100
120
B&L Sensitive Eyes Complete Optifree Express Optifree RepleniSH Renu MP Solo Care Plus Renu MoistureLoc SoloCare Aqua Clear Care Out of Pack
Figure 3-9 Focus Night & Day in Care Solutions
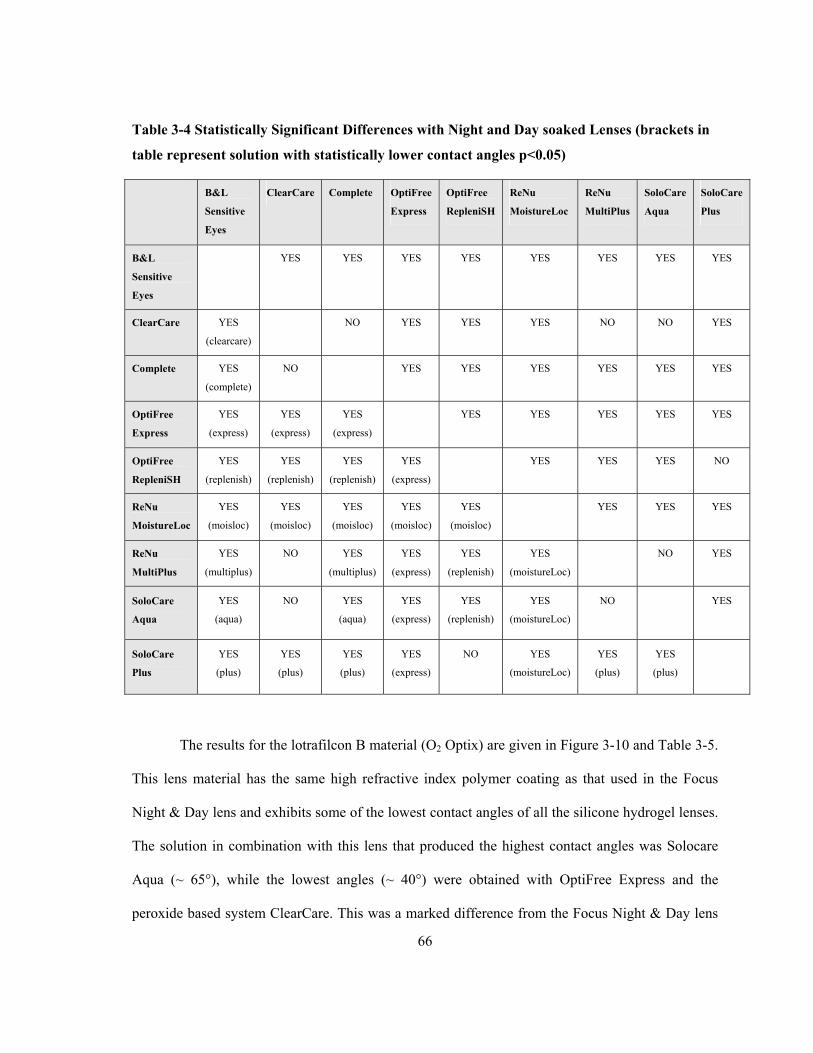
66
Table 3-4 Statistically Significant Differences with Night and Day soaked Lenses (brackets in
table represent solution with statistically lower contact angles p<0.05)
B&L
Sensitive
Eyes
ClearCare Complete OptiFree
Express
OptiFree
RepleniSH
ReNu
MoistureLoc
ReNu
MultiPlus
SoloCare
Aqua
SoloCare
Plus
B&L
Sensitive
Eyes
YES YES YES YES YES YES YES YES
ClearCare YES
(clearcare)
NO YES YES YES NO NO YES
Complete YES
(complete)
NO YES YES YES YES YES YES
OptiFree
Express
YES
(express)
YES
(express)
YES
(express)
YES YES YES YES YES
OptiFree
RepleniSH
YES
(replenish)
YES
(replenish)
YES
(replenish)
YES
(express)
YES YES YES NO
ReNu
MoistureLoc
YES
(moisloc)
YES
(moisloc)
YES
(moisloc)
YES
(moisloc)
YES
(moisloc)
YES YES YES
ReNu
MultiPlus
YES
(multiplus)
NO YES
(multiplus)
YES
(express)
YES
(replenish)
YES
(moistureLoc)
NO YES
SoloCare
Aqua
YES
(aqua)
NO YES
(aqua)
YES
(express)
YES
(replenish)
YES
(moistureLoc)
NO YES
SoloCare
Plus
YES
(plus)
YES
(plus)
YES
(plus)
YES
(express)
NO YES
(moistureLoc)
YES
(plus)
YES
(plus)
The results for the lotrafilcon B material (O2 Optix) are given in Figure 3-10 and Table 3-5.
This lens material has the same high refractive index polymer coating as that used in the Focus
Night & Day lens and exhibits some of the lowest contact angles of all the silicone hydrogel lenses.
The solution in combination with this lens that produced the highest contact angles was Solocare
Aqua (~ 65°), while the lowest angles (~ 40°) were obtained with OptiFree Express and the
peroxide based system ClearCare. This was a marked difference from the Focus Night & Day lens
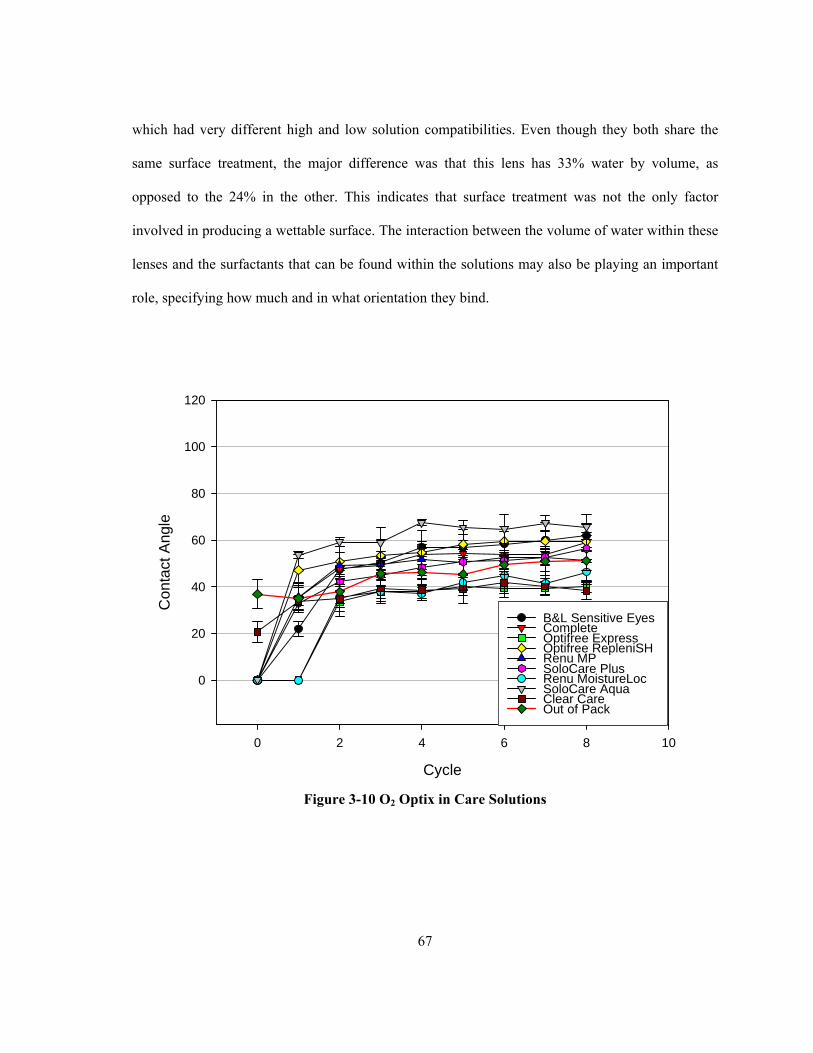
67
which had very different high and low solution compatibilities. Even though they both share the
same surface treatment, the major difference was that this lens has 33% water by volume, as
opposed to the 24% in the other. This indicates that surface treatment was not the only factor
involved in producing a wettable surface. The interaction between the volume of water within these
lenses and the surfactants that can be found within the solutions may also be playing an important
role, specifying how much and in what orientation they bind.
Cycle
0 2 4 6 8 10
Con
tact
Ang
le
0
20
40
60
80
100
120
B&L Sensitive Eyes Complete Optifree Express Optifree RepleniSH Renu MP SoloCare Plus Renu MoistureLoc SoloCare Aqua Clear Care Out of Pack
Figure 3-10 O2 Optix in Care Solutions
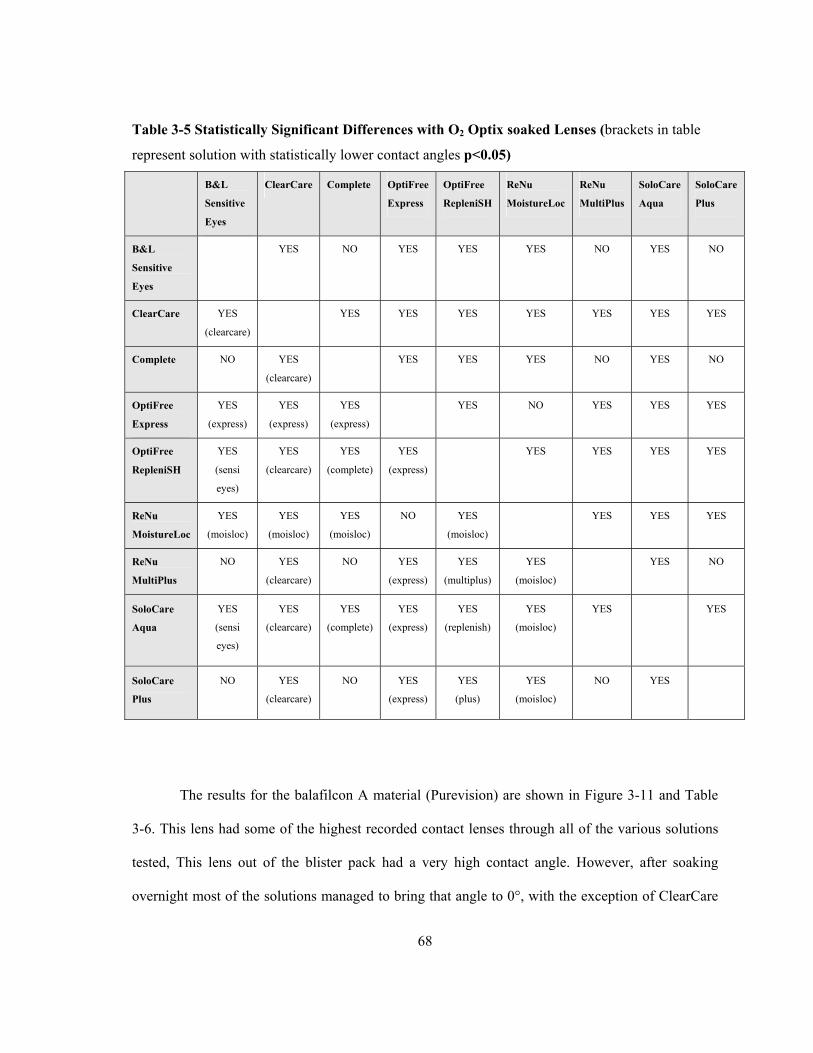
68
Table 3-5 Statistically Significant Differences with O2 Optix soaked Lenses (brackets in table
represent solution with statistically lower contact angles p<0.05)
B&L
Sensitive
Eyes
ClearCare Complete OptiFree
Express
OptiFree
RepleniSH
ReNu
MoistureLoc
ReNu
MultiPlus
SoloCare
Aqua
SoloCare
Plus
B&L
Sensitive
Eyes
YES NO YES YES YES NO YES NO
ClearCare YES
(clearcare)
YES YES YES YES YES YES YES
Complete NO YES
(clearcare)
YES YES YES NO YES NO
OptiFree
Express
YES
(express)
YES
(express)
YES
(express)
YES NO YES YES YES
OptiFree
RepleniSH
YES
(sensi
eyes)
YES
(clearcare)
YES
(complete)
YES
(express)
YES YES YES YES
ReNu
MoistureLoc
YES
(moisloc)
YES
(moisloc)
YES
(moisloc)
NO YES
(moisloc)
YES YES YES
ReNu
MultiPlus
NO YES
(clearcare)
NO YES
(express)
YES
(multiplus)
YES
(moisloc)
YES NO
SoloCare
Aqua
YES
(sensi
eyes)
YES
(clearcare)
YES
(complete)
YES
(express)
YES
(replenish)
YES
(moisloc)
YES YES
SoloCare
Plus
NO YES
(clearcare)
NO YES
(express)
YES
(plus)
YES
(moisloc)
NO YES
The results for the balafilcon A material (Purevision) are shown in Figure 3-11 and Table
3-6. This lens had some of the highest recorded contact lenses through all of the various solutions
tested, This lens out of the blister pack had a very high contact angle. However, after soaking
overnight most of the solutions managed to bring that angle to 0°, with the exception of ClearCare
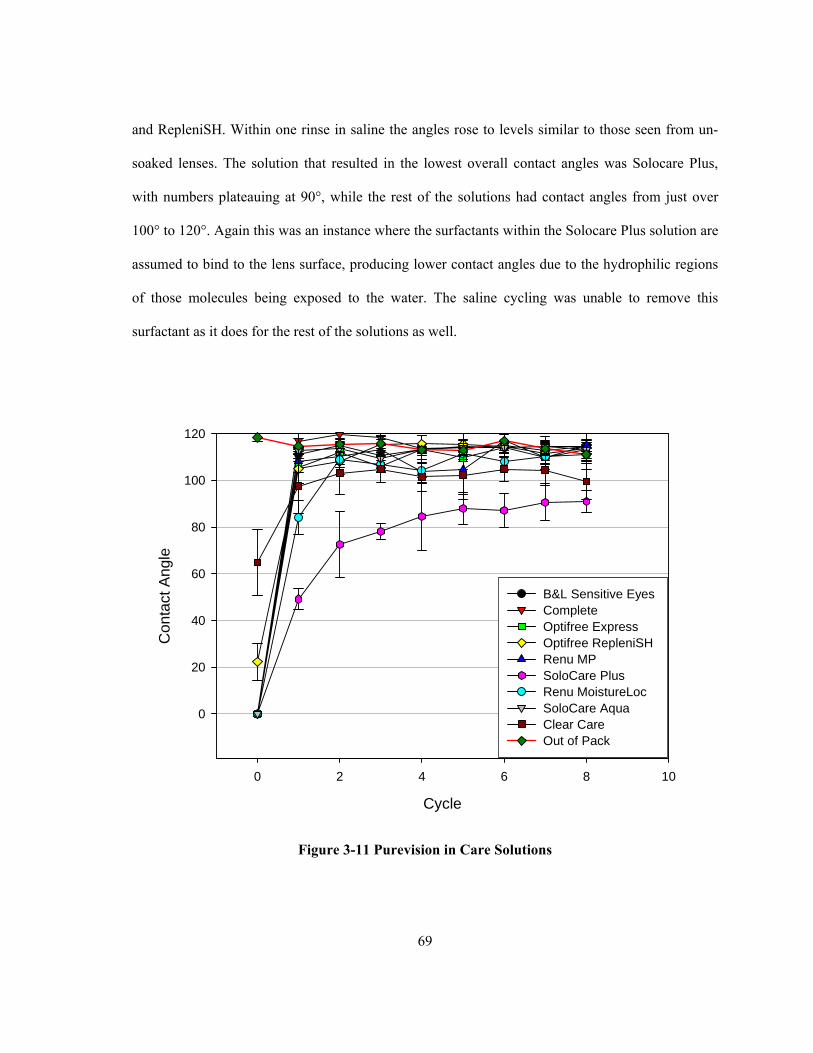
69
and RepleniSH. Within one rinse in saline the angles rose to levels similar to those seen from un-
soaked lenses. The solution that resulted in the lowest overall contact angles was Solocare Plus,
with numbers plateauing at 90°, while the rest of the solutions had contact angles from just over
100° to 120°. Again this was an instance where the surfactants within the Solocare Plus solution are
assumed to bind to the lens surface, producing lower contact angles due to the hydrophilic regions
of those molecules being exposed to the water. The saline cycling was unable to remove this
surfactant as it does for the rest of the solutions as well.
Cycle
0 2 4 6 8 10
Con
tact
Ang
le
0
20
40
60
80
100
120
B&L Sensitive Eyes Complete Optifree Express Optifree RepleniSH Renu MP SoloCare Plus Renu MoistureLoc SoloCare Aqua Clear Care Out of Pack
Figure 3-11 Purevision in Care Solutions
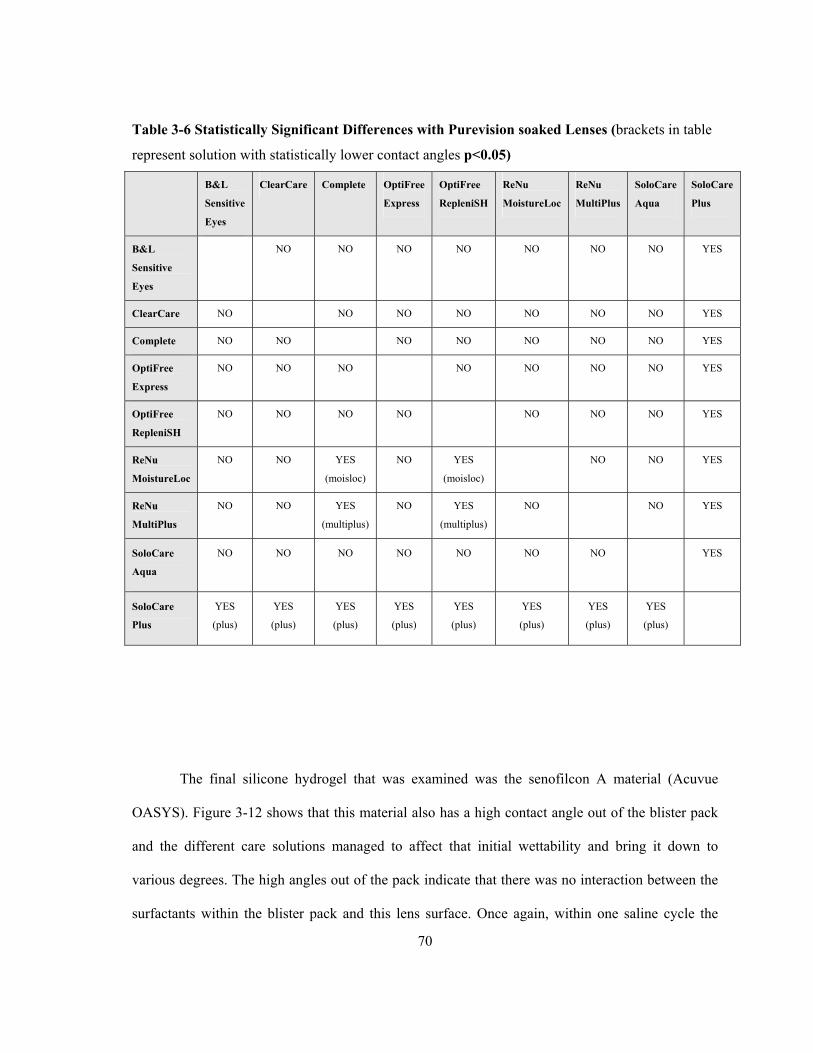
70
Table 3-6 Statistically Significant Differences with Purevision soaked Lenses (brackets in table
represent solution with statistically lower contact angles p<0.05)
B&L
Sensitive
Eyes
ClearCare Complete OptiFree
Express
OptiFree
RepleniSH
ReNu
MoistureLoc
ReNu
MultiPlus
SoloCare
Aqua
SoloCare
Plus
B&L
Sensitive
Eyes
NO NO NO NO NO NO NO YES
ClearCare NO NO NO NO NO NO NO YES
Complete NO NO NO NO NO NO NO YES
OptiFree
Express
NO NO NO NO NO NO NO YES
OptiFree
RepleniSH
NO NO NO NO NO NO NO YES
ReNu
MoistureLoc
NO NO YES
(moisloc)
NO YES
(moisloc)
NO NO YES
ReNu
MultiPlus
NO NO YES
(multiplus)
NO YES
(multiplus)
NO NO YES
SoloCare
Aqua
NO NO NO NO NO NO NO YES
SoloCare
Plus
YES
(plus)
YES
(plus)
YES
(plus)
YES
(plus)
YES
(plus)
YES
(plus)
YES
(plus)
YES
(plus)
The final silicone hydrogel that was examined was the senofilcon A material (Acuvue
OASYS). Figure 3-12 shows that this material also has a high contact angle out of the blister pack
and the different care solutions managed to affect that initial wettability and bring it down to
various degrees. The high angles out of the pack indicate that there was no interaction between the
surfactants within the blister pack and this lens surface. Once again, within one saline cycle the
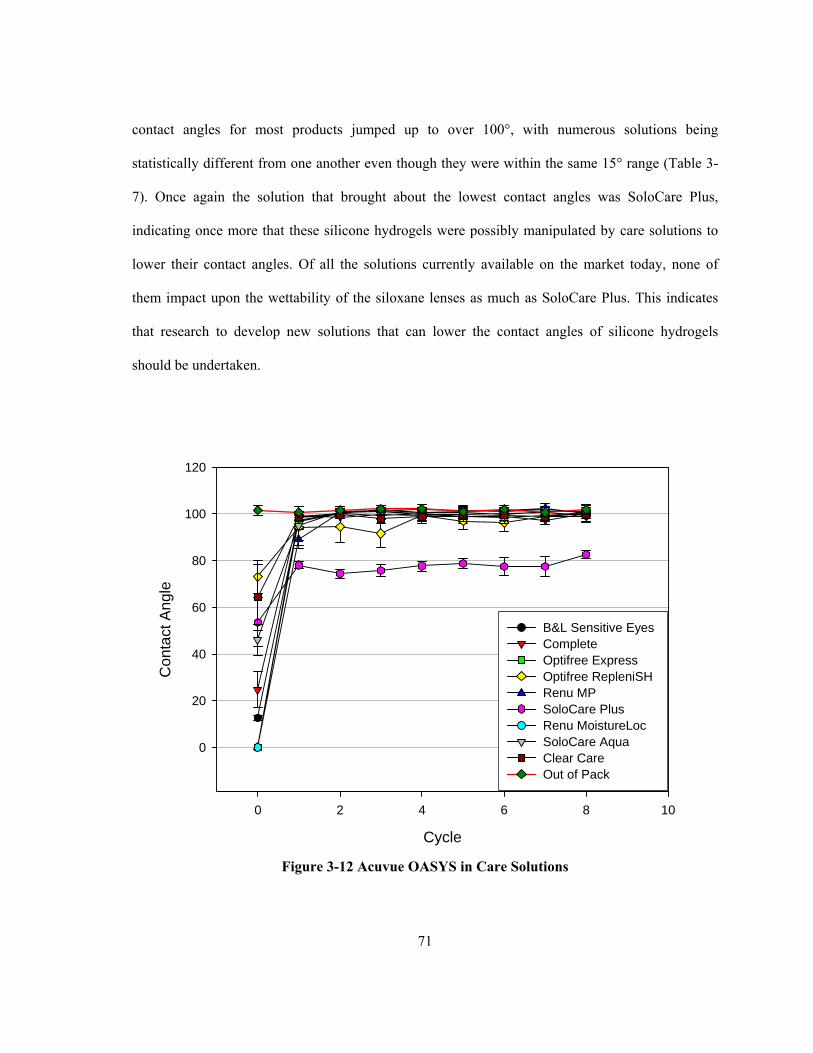
71
contact angles for most products jumped up to over 100°, with numerous solutions being
statistically different from one another even though they were within the same 15° range (Table 3-
7). Once again the solution that brought about the lowest contact angles was SoloCare Plus,
indicating once more that these silicone hydrogels were possibly manipulated by care solutions to
lower their contact angles. Of all the solutions currently available on the market today, none of
them impact upon the wettability of the siloxane lenses as much as SoloCare Plus. This indicates
that research to develop new solutions that can lower the contact angles of silicone hydrogels
should be undertaken.
Cycle
0 2 4 6 8 10
Con
tact
Ang
le
0
20
40
60
80
100
120
B&L Sensitive Eyes Complete Optifree Express Optifree RepleniSH Renu MP SoloCare Plus Renu MoistureLoc SoloCare Aqua Clear Care Out of Pack
Figure 3-12 Acuvue OASYS in Care Solutions
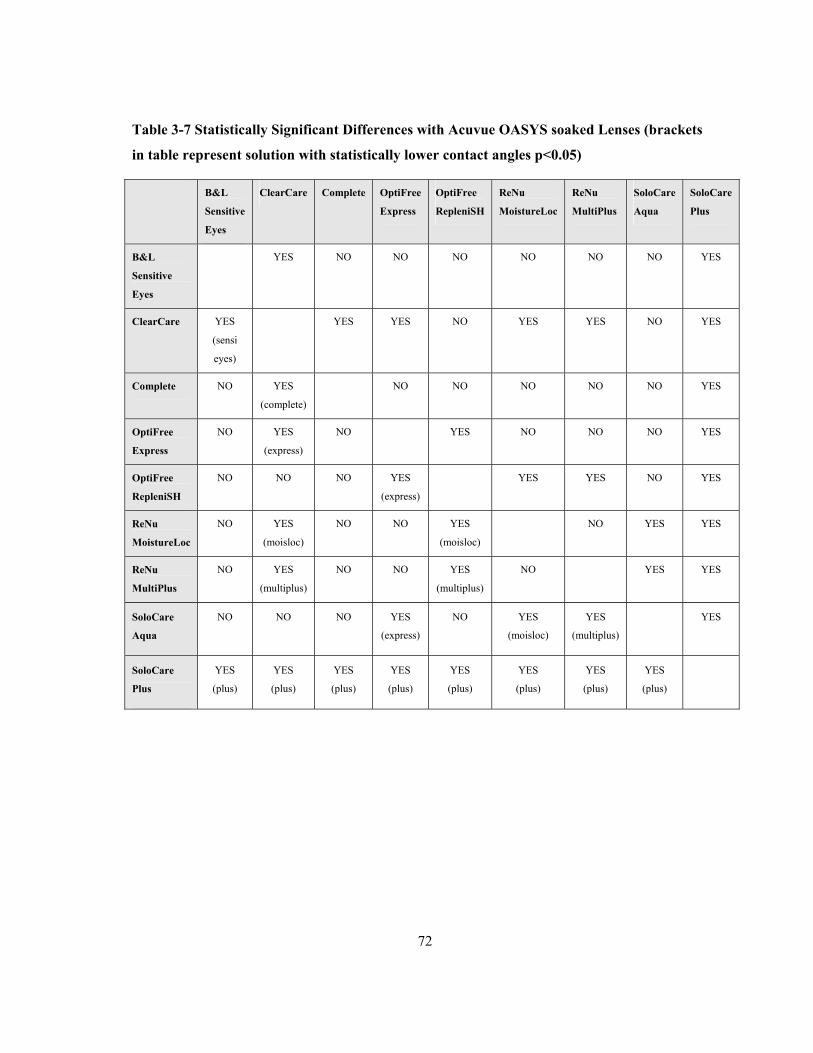
72
Table 3-7 Statistically Significant Differences with Acuvue OASYS soaked Lenses (brackets
in table represent solution with statistically lower contact angles p<0.05)
B&L
Sensitive
Eyes
ClearCare Complete OptiFree
Express
OptiFree
RepleniSH
ReNu
MoistureLoc
ReNu
MultiPlus
SoloCare
Aqua
SoloCare
Plus
B&L
Sensitive
Eyes
YES NO NO NO NO NO NO YES
ClearCare YES
(sensi
eyes)
YES YES NO YES YES NO YES
Complete NO YES
(complete)
NO NO NO NO NO YES
OptiFree
Express
NO YES
(express)
NO YES NO NO NO YES
OptiFree
RepleniSH
NO NO NO YES
(express)
YES YES NO YES
ReNu
MoistureLoc
NO YES
(moisloc)
NO NO YES
(moisloc)
NO YES YES
ReNu
MultiPlus
NO YES
(multiplus)
NO NO YES
(multiplus)
NO YES YES
SoloCare
Aqua
NO NO NO YES
(express)
NO YES
(moisloc)
YES
(multiplus)
YES
SoloCare
Plus
YES
(plus)
YES
(plus)
YES
(plus)
YES
(plus)
YES
(plus)
YES
(plus)
YES
(plus)
YES
(plus)
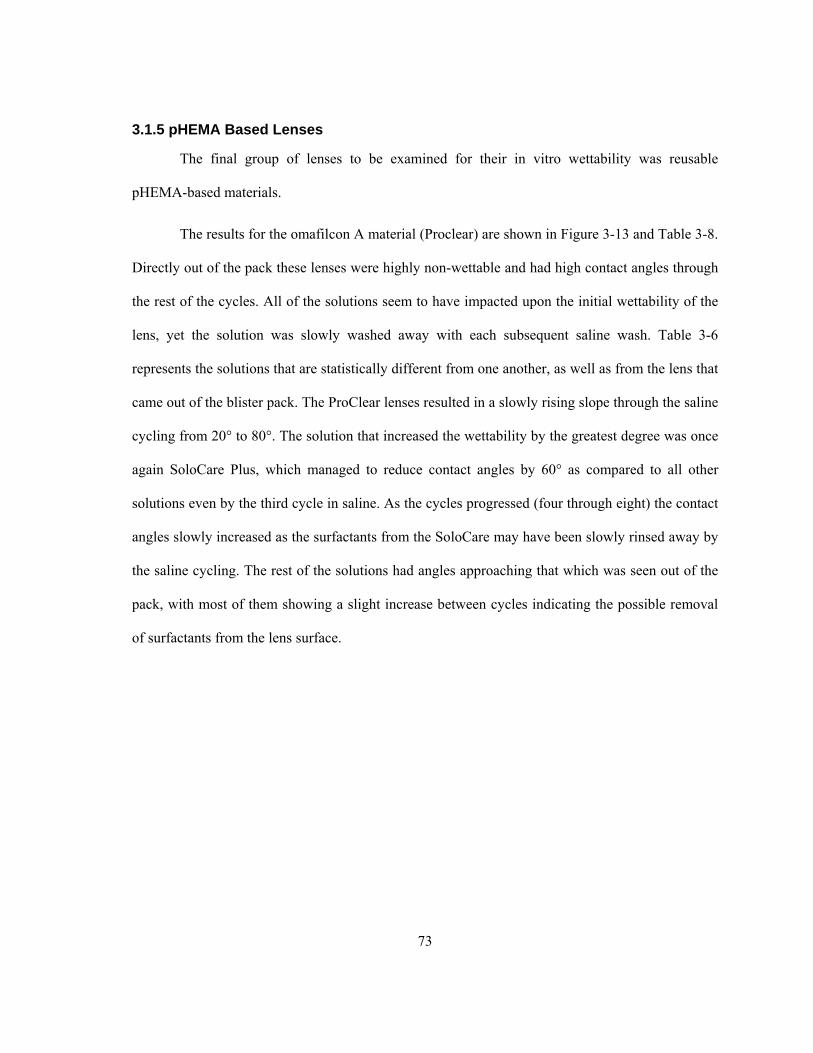
73
3.1.5 pHEMA Based Lenses
The final group of lenses to be examined for their in vitro wettability was reusable
pHEMA-based materials.
The results for the omafilcon A material (Proclear) are shown in Figure 3-13 and Table 3-8.
Directly out of the pack these lenses were highly non-wettable and had high contact angles through
the rest of the cycles. All of the solutions seem to have impacted upon the initial wettability of the
lens, yet the solution was slowly washed away with each subsequent saline wash. Table 3-6
represents the solutions that are statistically different from one another, as well as from the lens that
came out of the blister pack. The ProClear lenses resulted in a slowly rising slope through the saline
cycling from 20° to 80°. The solution that increased the wettability by the greatest degree was once
again SoloCare Plus, which managed to reduce contact angles by 60° as compared to all other
solutions even by the third cycle in saline. As the cycles progressed (four through eight) the contact
angles slowly increased as the surfactants from the SoloCare may have been slowly rinsed away by
the saline cycling. The rest of the solutions had angles approaching that which was seen out of the
pack, with most of them showing a slight increase between cycles indicating the possible removal
of surfactants from the lens surface.
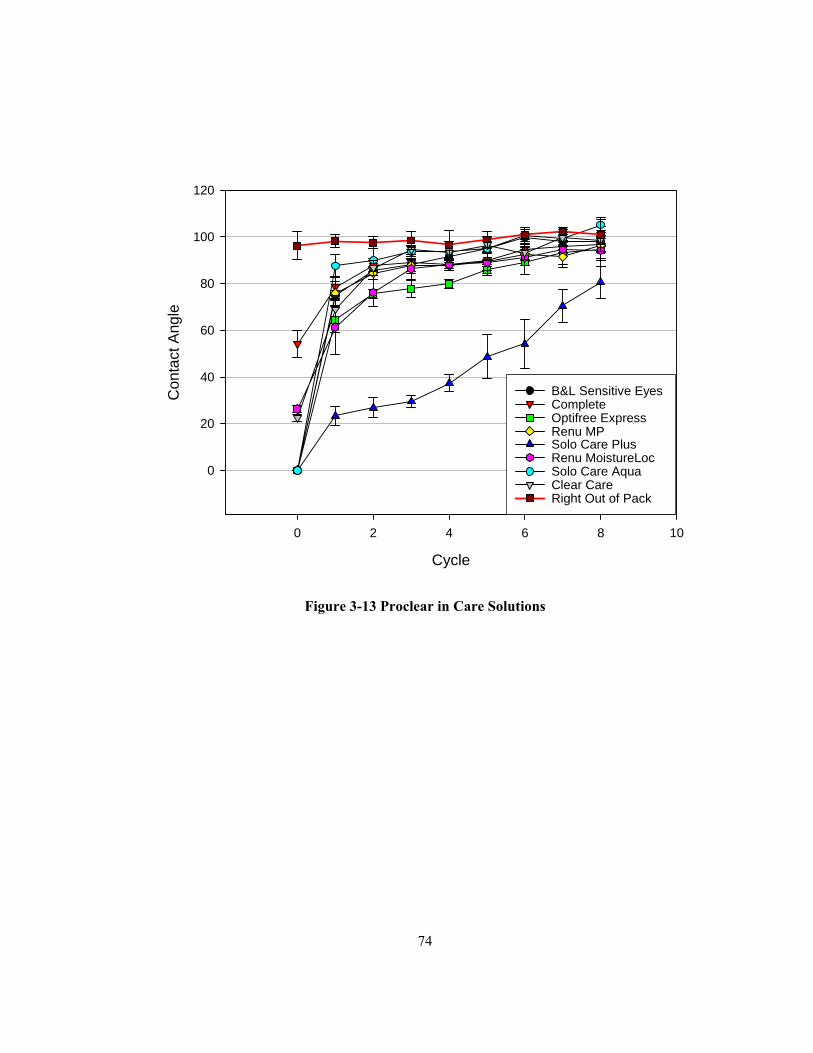
74
Cycle
0 2 4 6 8 10
Con
tact
Ang
le
0
20
40
60
80
100
120
B&L Sensitive Eyes Complete Optifree Express Renu MP Solo Care Plus Renu MoistureLoc Solo Care Aqua Clear Care Right Out of Pack
Figure 3-13 Proclear in Care Solutions

75
Table 3-8 Statistically Significant Differences with Proclear soaked Lenses (brackets in table
represent solution with statistically lower contact angles p<0.05)
B&L
Sensitive
Eyes
ClearCare Complete OptiFree
Express
ReNu
MoistureLoc
ReNu
MultiPlus
SoloCare
Aqua
SoloCare
Plus
Out of
Pack
B&L
Sensitive
Eyes
NO NO YES NO NO YES YES YES
ClearCare NO NO YES YES YES NO YES YES
Complete YES
(sensi
eyes)
NO YES YES YES NO YES YES
OptiFree
Express
YES
(express)
YES
(express)
YES
(express)
YES YES YES YES YES
ReNu
MoistureLoc
NO YES
(moisloc)
YES
(moisloc)
YES
(express)
NO YES YES YES
ReNu
MultiPlus
NO YES
(multiplus)
YES
(multiplus)
YES
(express)
NO YES YES YES
SoloCare
Aqua
YES
(sensi
eyes)
NO NO YES
(express)
YES
(moisloc)
YES
(multiplus)
YES YES
SoloCare
Plus YES
(plus)
YES
(plus)
YES
(plus)
YES
(plus)
YES
(plus)
YES
(plus)
YES
(plus)
YES
Out of Pack YES
(sensi
eyes)
YES
(clearcare)
YES
(complete)
YES
(express)
YES
(moisloc)
YES
(multiplus)
YES
(aqua)
YES
(plus)
The results for the alphafilcon A material (Soflens 66) is shown in Figure 3-14 and Table 3-
9. This lens was again very hydrophobic directly out of the pack yet each of the solutions managed
to initially lower the contact angles. After one wash in saline, a likely explanation is that most of
the care solutions were removed from the lens surface, as the contact angles increase to the same
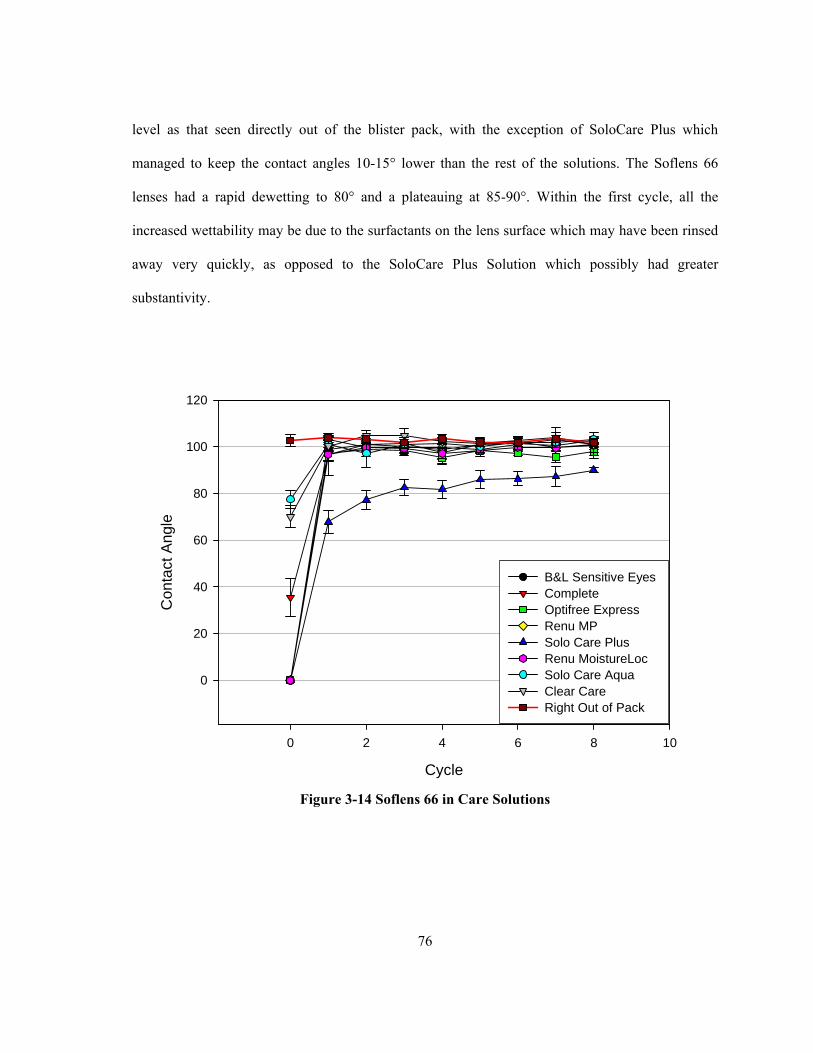
76
level as that seen directly out of the blister pack, with the exception of SoloCare Plus which
managed to keep the contact angles 10-15° lower than the rest of the solutions. The Soflens 66
lenses had a rapid dewetting to 80° and a plateauing at 85-90°. Within the first cycle, all the
increased wettability may be due to the surfactants on the lens surface which may have been rinsed
away very quickly, as opposed to the SoloCare Plus Solution which possibly had greater
substantivity.
Cycle
0 2 4 6 8 10
Con
tact
Ang
le
0
20
40
60
80
100
120
B&L Sensitive Eyes Complete Optifree Express Renu MP Solo Care Plus Renu MoistureLoc Solo Care Aqua Clear Care Right Out of Pack
Figure 3-14 Soflens 66 in Care Solutions
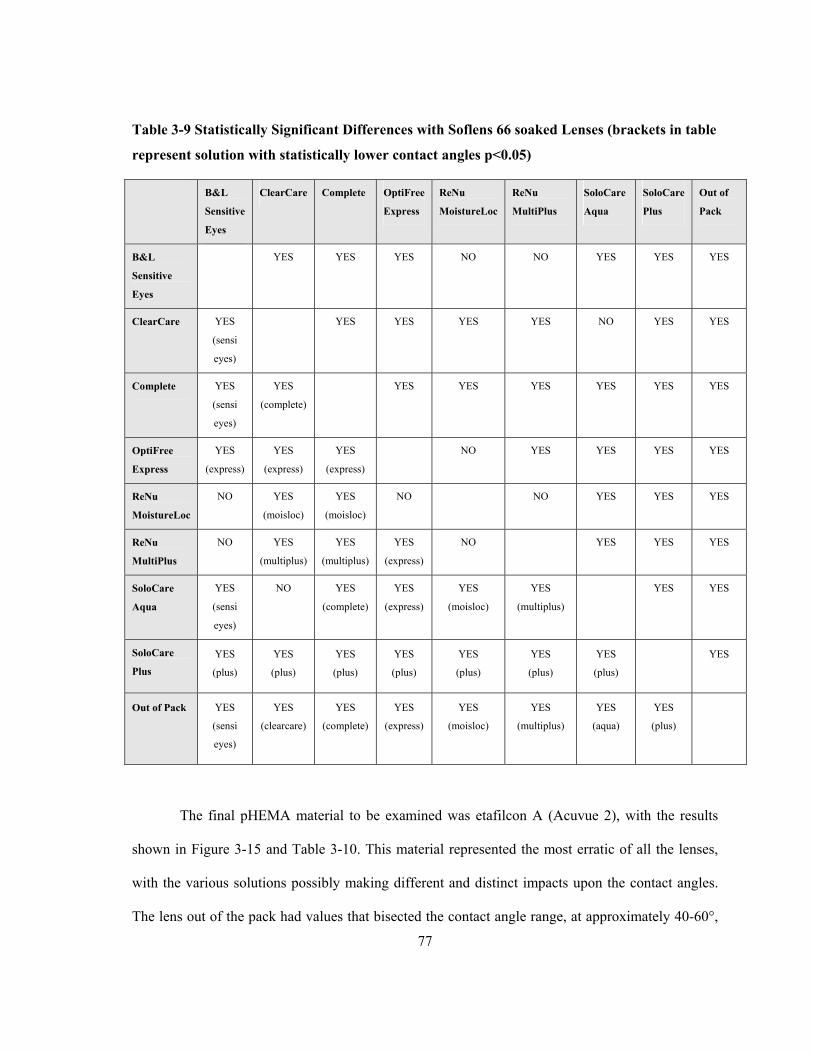
77
Table 3-9 Statistically Significant Differences with Soflens 66 soaked Lenses (brackets in table
represent solution with statistically lower contact angles p<0.05)
B&L
Sensitive
Eyes
ClearCare Complete OptiFree
Express
ReNu
MoistureLoc
ReNu
MultiPlus
SoloCare
Aqua
SoloCare
Plus
Out of
Pack
B&L
Sensitive
Eyes
YES YES YES NO NO YES YES YES
ClearCare YES
(sensi
eyes)
YES YES YES YES NO YES YES
Complete YES
(sensi
eyes)
YES
(complete)
YES YES YES YES YES YES
OptiFree
Express
YES
(express)
YES
(express)
YES
(express)
NO YES YES YES YES
ReNu
MoistureLoc
NO YES
(moisloc)
YES
(moisloc)
NO NO YES YES YES
ReNu
MultiPlus
NO YES
(multiplus)
YES
(multiplus)
YES
(express)
NO YES YES YES
SoloCare
Aqua
YES
(sensi
eyes)
NO YES
(complete)
YES
(express)
YES
(moisloc)
YES
(multiplus)
YES YES
SoloCare
Plus YES
(plus)
YES
(plus)
YES
(plus)
YES
(plus)
YES
(plus)
YES
(plus)
YES
(plus)
YES
Out of Pack YES
(sensi
eyes)
YES
(clearcare)
YES
(complete)
YES
(express)
YES
(moisloc)
YES
(multiplus)
YES
(aqua)
YES
(plus)
The final pHEMA material to be examined was etafilcon A (Acuvue 2), with the results
shown in Figure 3-15 and Table 3-10. This material represented the most erratic of all the lenses,
with the various solutions possibly making different and distinct impacts upon the contact angles.
The lens out of the pack had values that bisected the contact angle range, at approximately 40-60°,
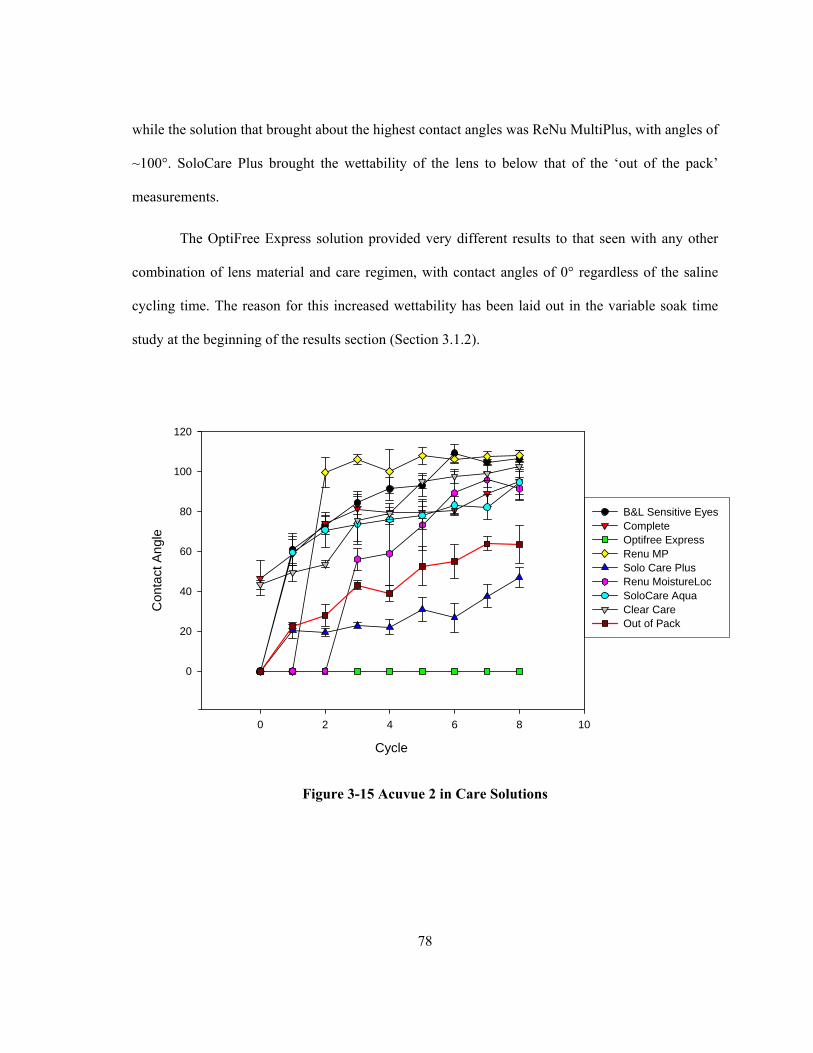
78
while the solution that brought about the highest contact angles was ReNu MultiPlus, with angles of
~100°. SoloCare Plus brought the wettability of the lens to below that of the ‘out of the pack’
measurements.
The OptiFree Express solution provided very different results to that seen with any other
combination of lens material and care regimen, with contact angles of 0° regardless of the saline
cycling time. The reason for this increased wettability has been laid out in the variable soak time
study at the beginning of the results section (Section 3.1.2).
Cycle
0 2 4 6 8 10
Con
tact
Ang
le
0
20
40
60
80
100
120
B&L Sensitive Eyes Complete Optifree Express Renu MP Solo Care Plus Renu MoistureLoc SoloCare Aqua Clear Care Out of Pack
Figure 3-15 Acuvue 2 in Care Solutions
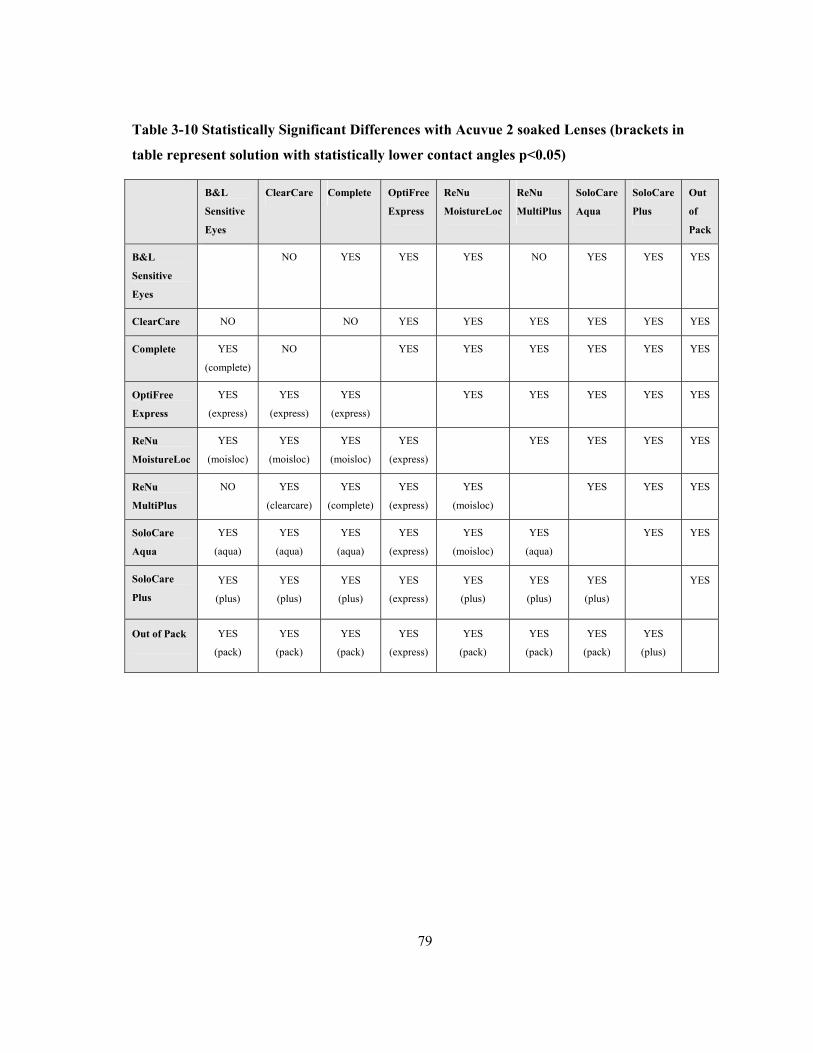
79
Table 3-10 Statistically Significant Differences with Acuvue 2 soaked Lenses (brackets in
table represent solution with statistically lower contact angles p<0.05)
B&L
Sensitive
Eyes
ClearCare Complete OptiFree
Express
ReNu
MoistureLoc
ReNu
MultiPlus
SoloCare
Aqua
SoloCare
Plus
Out
of
Pack
B&L
Sensitive
Eyes
NO YES YES YES NO YES YES YES
ClearCare NO NO YES YES YES YES YES YES
Complete YES
(complete)
NO YES YES YES YES YES YES
OptiFree
Express
YES
(express)
YES
(express)
YES
(express)
YES YES YES YES YES
ReNu
MoistureLoc
YES
(moisloc)
YES
(moisloc)
YES
(moisloc)
YES
(express)
YES YES YES YES
ReNu
MultiPlus
NO YES
(clearcare)
YES
(complete)
YES
(express)
YES
(moisloc)
YES YES YES
SoloCare
Aqua
YES
(aqua)
YES
(aqua)
YES
(aqua)
YES
(express)
YES
(moisloc)
YES
(aqua)
YES YES
SoloCare
Plus YES
(plus)
YES
(plus)
YES
(plus)
YES
(express)
YES
(plus)
YES
(plus)
YES
(plus)
YES
Out of Pack YES
(pack)
YES
(pack)
YES
(pack)
YES
(express)
YES
(pack)
YES
(pack)
YES
(pack)
YES
(plus)
80
3.2 Ex Vivo Data
The second piece of work investigating hydrogel wettability was conducted on lenses
removed from human volunteers after being worn for various periods of time and following various
times of soaking in care regimens. These “ex vivo” studies were conducted after suitable ethics
clearance had been obtained. Lenses were removed from subjects’ eyes and their ex vivo contact
angles assessed using the OCA, as described in section 2.3.
3.2.1 Impact of Lens Removal on Ex Vivo Wettability Study
A primary concern regarding all the ex vivo studies was how the physical removal of the
lens from the eye would impact upon the wettability result. A study was conducted to determine
what differences might occur if a lens was removed with latex gloves as opposed to using ungloved
hands. Three subjects took part in this pilot study, in which they were asked to wear Acuvue 2
lenses previously soaked overnight in either ReNu MultiPlus or OptiFree Express. Lenses were
worn for 8 hours and then removed either with or without gloves. Lenses were examined
immediately following removal, then following a 2 minute soak in saline to remove any
components of the tear film that may affect the resulting contact angle. Table 3-9 depicts the
averages of the various combinations of saline, glove, and solutions.
Due to the small sample size, statistical analysis was not able to show any significance.
However, the simple goal of this study was to see if there were any obvious changes in contact
angle that fell outside the range of other ex vivo studies that were currently ongoing. It is clear from
Table 3-11 that there was no systematic influence of handling with or without the glove on the
contact angle measured.
The data used in all the ex vivo studies were those taken after a soak in the preservative
free saline. The results in this study gave results of ~ 90° for those that were pre-soaked in ReNu
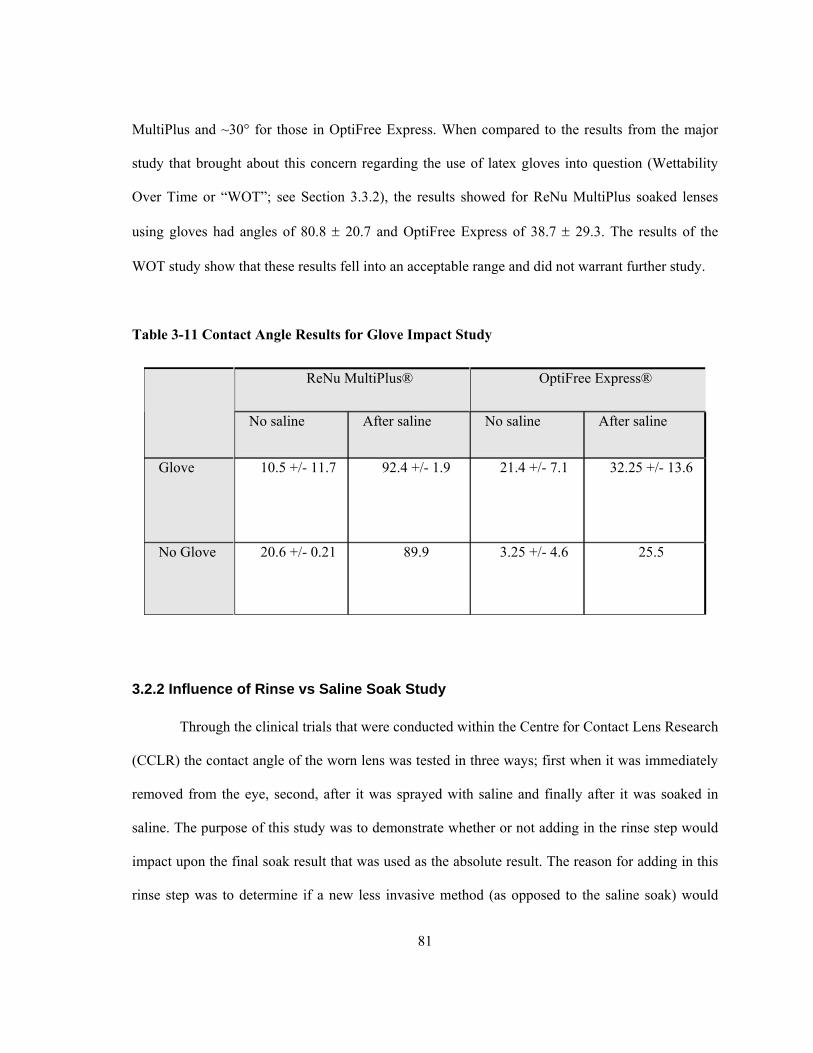
81
MultiPlus and ~30° for those in OptiFree Express. When compared to the results from the major
study that brought about this concern regarding the use of latex gloves into question (Wettability
Over Time or “WOT”; see Section 3.3.2), the results showed for ReNu MultiPlus soaked lenses
using gloves had angles of 80.8 ± 20.7 and OptiFree Express of 38.7 ± 29.3. The results of the
WOT study show that these results fell into an acceptable range and did not warrant further study.
Table 3-11 Contact Angle Results for Glove Impact Study
ReNu MultiPlus® OptiFree Express®
No saline After saline No saline After saline
Glove 10.5 +/- 11.7 92.4 +/- 1.9 21.4 +/- 7.1 32.25 +/- 13.6
No Glove 20.6 +/- 0.21 89.9 3.25 +/- 4.6 25.5
3.2.2 Influence of Rinse vs Saline Soak Study
Through the clinical trials that were conducted within the Centre for Contact Lens Research
(CCLR) the contact angle of the worn lens was tested in three ways; first when it was immediately
removed from the eye, second, after it was sprayed with saline and finally after it was soaked in
saline. The purpose of this study was to demonstrate whether or not adding in the rinse step would
impact upon the final soak result that was used as the absolute result. The reason for adding in this
rinse step was to determine if a new less invasive method (as opposed to the saline soak) would
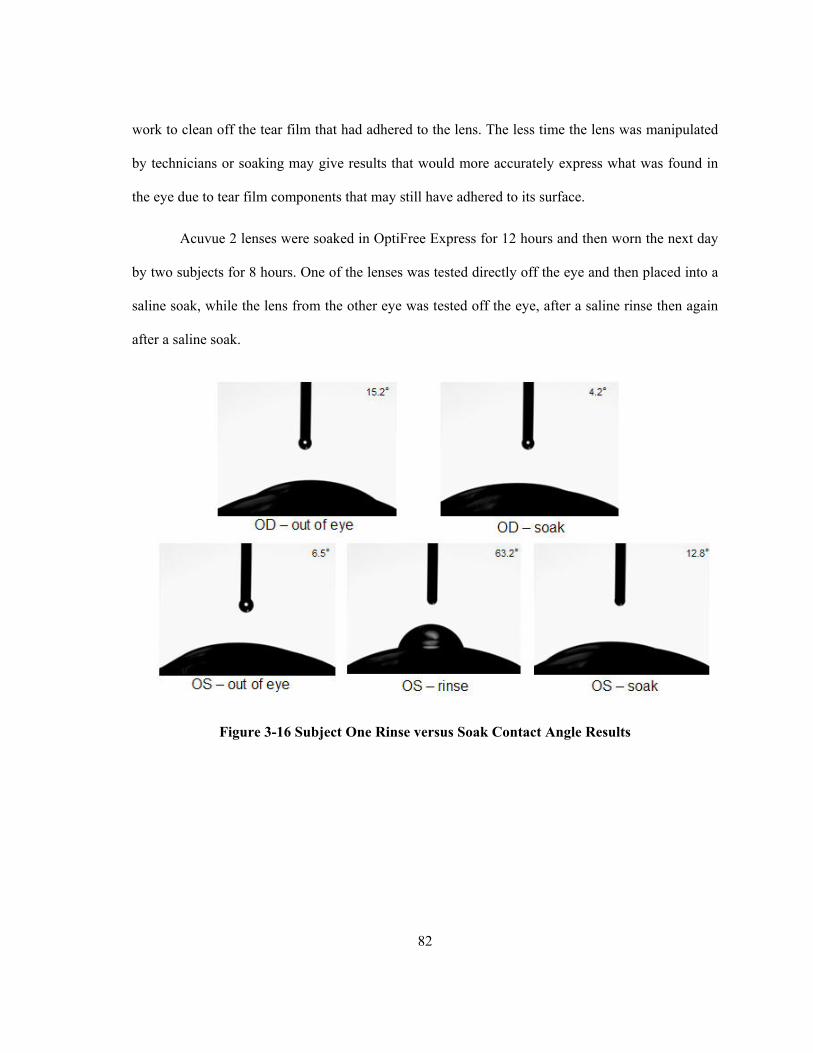
82
work to clean off the tear film that had adhered to the lens. The less time the lens was manipulated
by technicians or soaking may give results that would more accurately express what was found in
the eye due to tear film components that may still have adhered to its surface.
Acuvue 2 lenses were soaked in OptiFree Express for 12 hours and then worn the next day
by two subjects for 8 hours. One of the lenses was tested directly off the eye and then placed into a
saline soak, while the lens from the other eye was tested off the eye, after a saline rinse then again
after a saline soak.
Figure 3-16 Subject One Rinse versus Soak Contact Angle Results
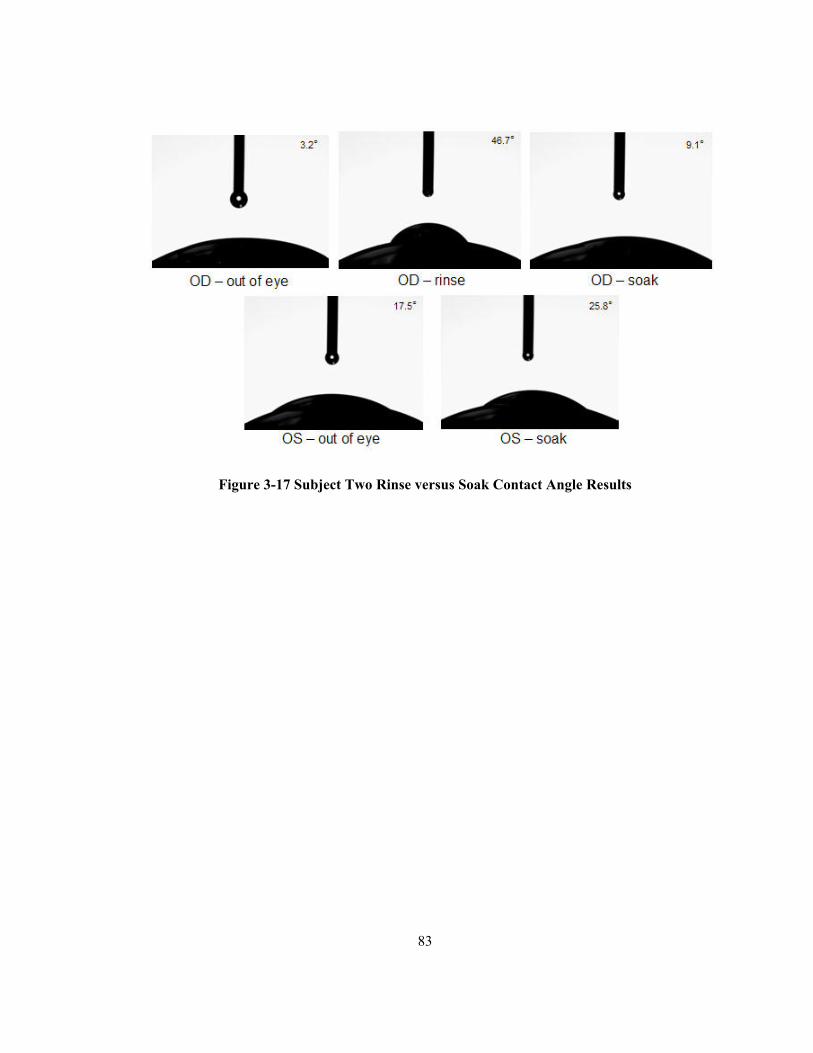
83
Figure 3-17 Subject Two Rinse versus Soak Contact Angle Results
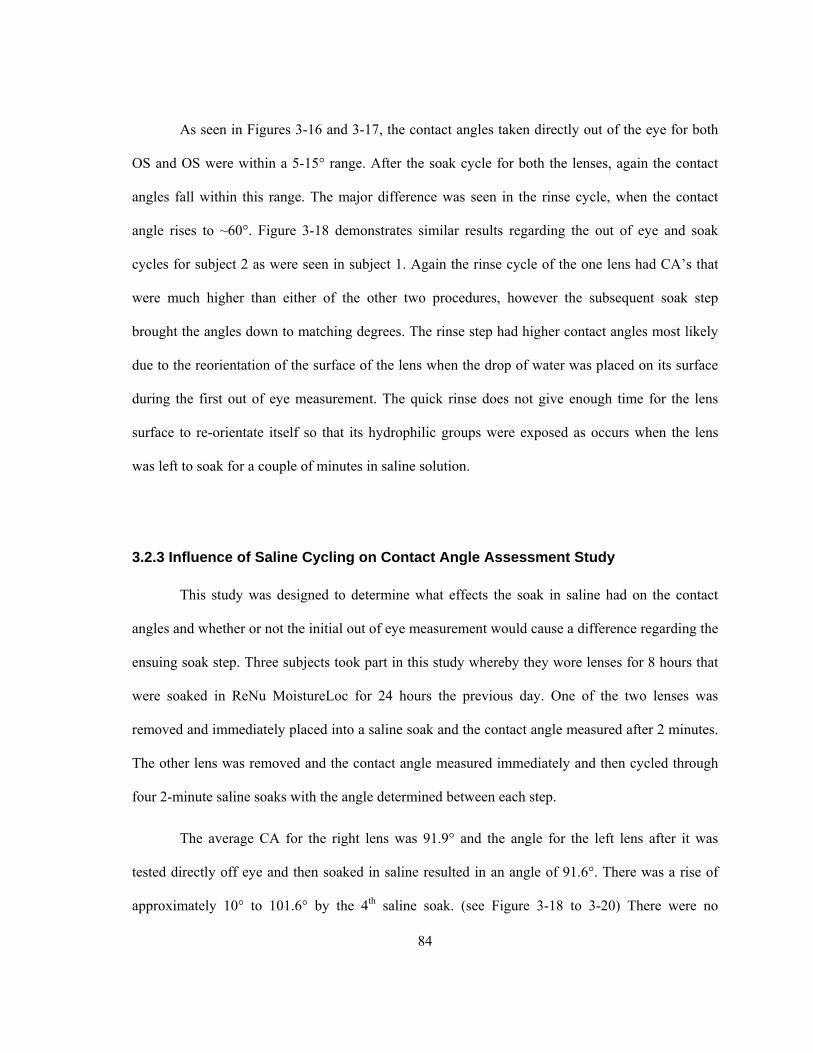
84
As seen in Figures 3-16 and 3-17, the contact angles taken directly out of the eye for both
OS and OS were within a 5-15° range. After the soak cycle for both the lenses, again the contact
angles fall within this range. The major difference was seen in the rinse cycle, when the contact
angle rises to ~60°. Figure 3-18 demonstrates similar results regarding the out of eye and soak
cycles for subject 2 as were seen in subject 1. Again the rinse cycle of the one lens had CA’s that
were much higher than either of the other two procedures, however the subsequent soak step
brought the angles down to matching degrees. The rinse step had higher contact angles most likely
due to the reorientation of the surface of the lens when the drop of water was placed on its surface
during the first out of eye measurement. The quick rinse does not give enough time for the lens
surface to re-orientate itself so that its hydrophilic groups were exposed as occurs when the lens
was left to soak for a couple of minutes in saline solution.
3.2.3 Influence of Saline Cycling on Contact Angle Assessment Study
This study was designed to determine what effects the soak in saline had on the contact
angles and whether or not the initial out of eye measurement would cause a difference regarding the
ensuing soak step. Three subjects took part in this study whereby they wore lenses for 8 hours that
were soaked in ReNu MoistureLoc for 24 hours the previous day. One of the two lenses was
removed and immediately placed into a saline soak and the contact angle measured after 2 minutes.
The other lens was removed and the contact angle measured immediately and then cycled through
four 2-minute saline soaks with the angle determined between each step.
The average CA for the right lens was 91.9° and the angle for the left lens after it was
tested directly off eye and then soaked in saline resulted in an angle of 91.6°. There was a rise of
approximately 10° to 101.6° by the 4th saline soak. (see Figure 3-18 to 3-20) There were no
85
statistically significant differences found between any of the saline soak cycles, however there were
significant differences between the saline and out of eye measurements (p<0.001), which was
expected. The out of eye result was very low because of the tear film that was covering the surface
of the lens, and placing a drop of water onto the already wet surface results in a greater degree of
spreading. The wettability for the out-of-eye step of figure 3-19 is different possibly due to the
interaction of the tear film on the surface of the lens which stops the test drop from spreading as
completely as it was seen in the other two examples. There should be no difference between the
saline soaks since the surfactants that were on the lens were likely removed after the first cycle, and
any subsequent cycles will have the same result.
Figure 3-18 Subject One Saline Cycling Contact Angle Results
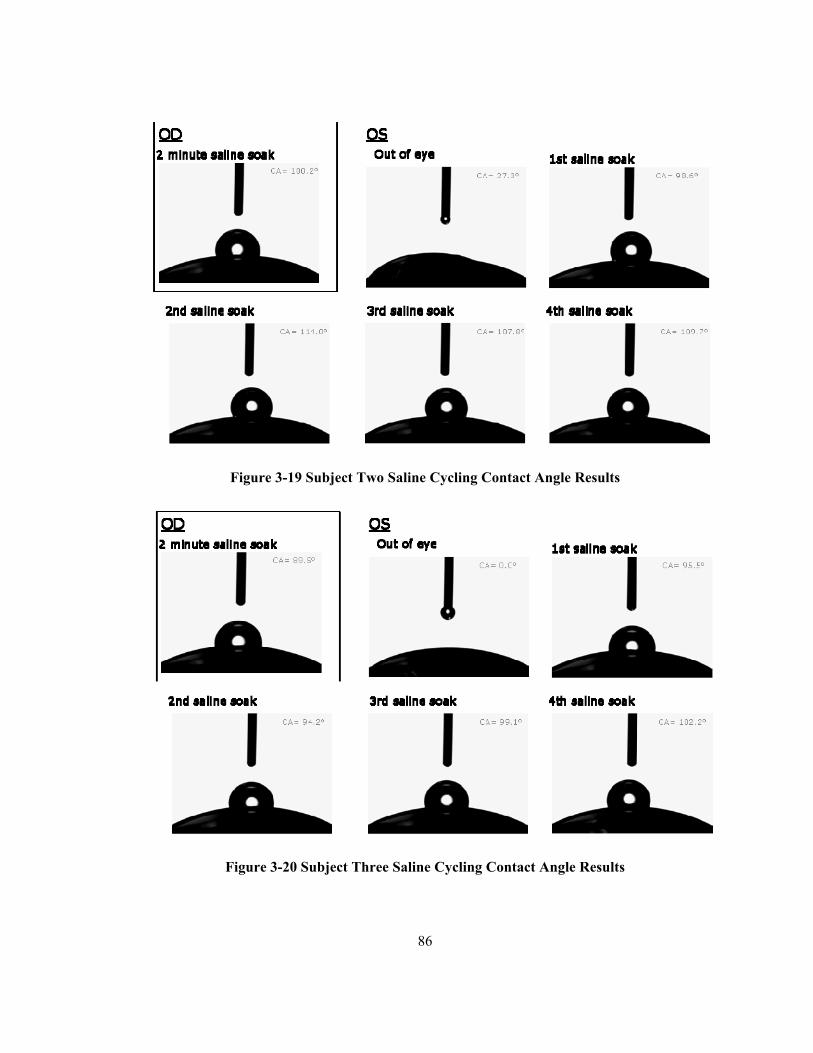
86
Figure 3-19 Subject Two Saline Cycling Contact Angle Results
Figure 3-20 Subject Three Saline Cycling Contact Angle Results
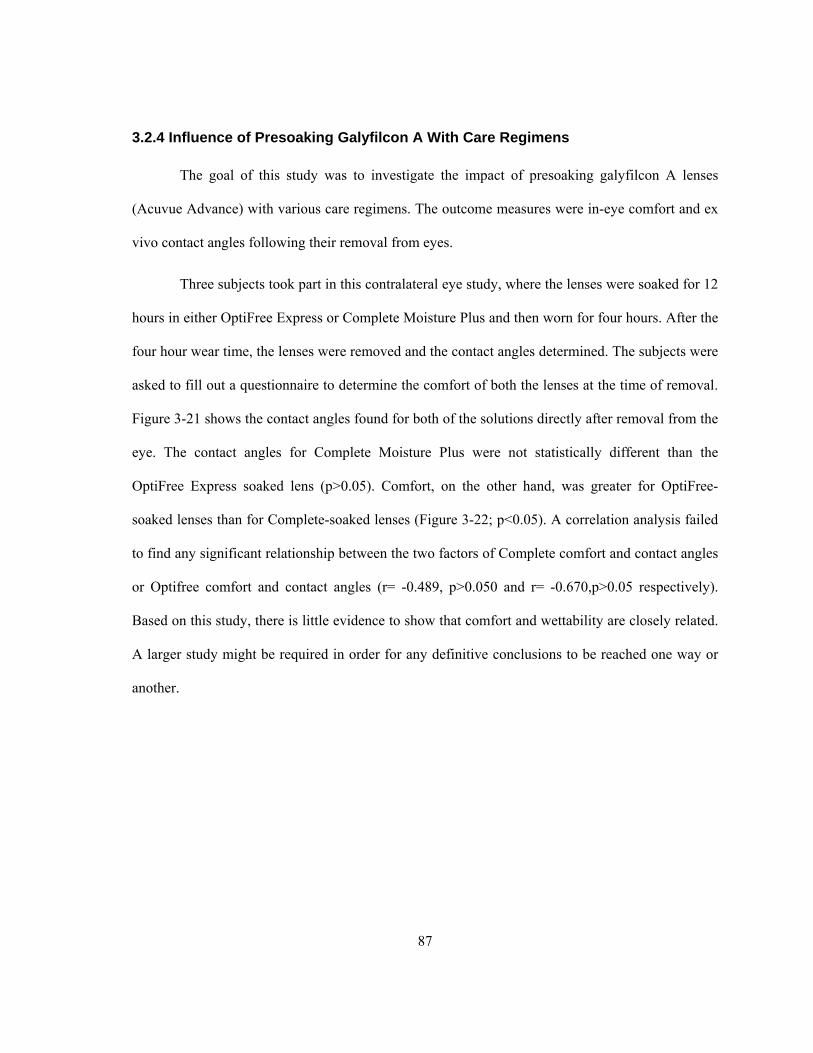
87
3.2.4 Influence of Presoaking Galyfilcon A With Care Regimens
The goal of this study was to investigate the impact of presoaking galyfilcon A lenses
(Acuvue Advance) with various care regimens. The outcome measures were in-eye comfort and ex
vivo contact angles following their removal from eyes.
Three subjects took part in this contralateral eye study, where the lenses were soaked for 12
hours in either OptiFree Express or Complete Moisture Plus and then worn for four hours. After the
four hour wear time, the lenses were removed and the contact angles determined. The subjects were
asked to fill out a questionnaire to determine the comfort of both the lenses at the time of removal.
Figure 3-21 shows the contact angles found for both of the solutions directly after removal from the
eye. The contact angles for Complete Moisture Plus were not statistically different than the
OptiFree Express soaked lens (p>0.05). Comfort, on the other hand, was greater for OptiFree-
soaked lenses than for Complete-soaked lenses (Figure 3-22; p<0.05). A correlation analysis failed
to find any significant relationship between the two factors of Complete comfort and contact angles
or Optifree comfort and contact angles (r= -0.489, p>0.050 and r= -0.670,p>0.05 respectively).
Based on this study, there is little evidence to show that comfort and wettability are closely related.
A larger study might be required in order for any definitive conclusions to be reached one way or
another.
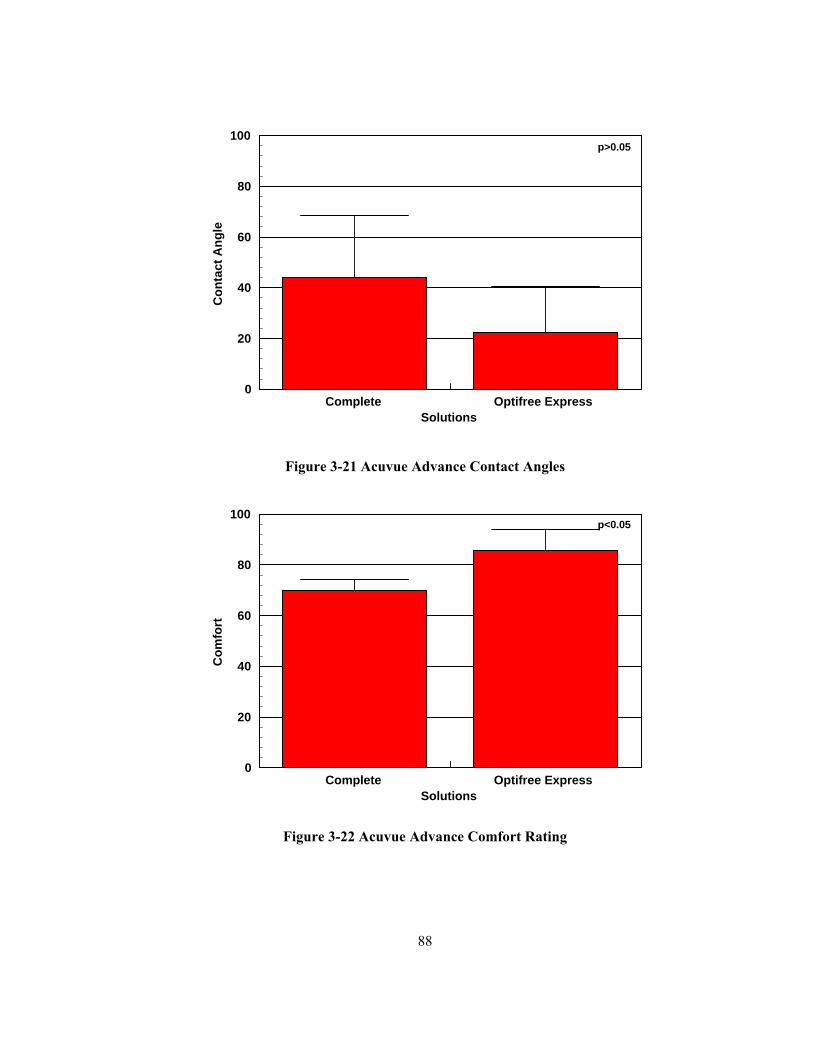
88
Complete Optifree ExpressSolutions
0
20
40
60
80
100
Con
tact
Ang
le
p>0.05
Figure 3-21 Acuvue Advance Contact Angles
Complete Optifree ExpressSolutions
0
20
40
60
80
100
Com
fort
p<0.05
Figure 3-22 Acuvue Advance Comfort Rating
89
3.3 Clinical Trials
All of the previous ex vivo studies were precursors to full clinical trials that were run
within the Centre for Contact Lens Research, indicating the best methodology to be used. Through
all clinical trials symptomatic patients were chosen based on whether they felt discomfort (dryness,
irritation etc.) with the contact lenses within 8 hours of wear. Asymptomatic patients were those
that felt no irritation within the 8 hour time period.
3.3.1 DOSL Study
The purpose of this study was to compare the wettability of a first generation silicone
hydrogel (balafilcon A; PureVision) that had been surface treated in order to make it wettable, to
that of a novel non-surface treated silicone hydrogel (comfilcon A; Biofinity).
There were 31 total subjects involved in a larger contralateral eye, double-masked clinical
study. At the 12 month visit, after 30 nights of wear, the ex vivo wettability of 12 subjects selected
at random was assessed and a subjective comfort score (graded on a 0-10 scale, with 0 being the
most uncomfortable and 10 the most comfortable) recorded. As seen in Figure 3-23 there was a
marked difference between the two lens types, with the balafilcon material having contact angles of
94±13° and the comfilcon material angles of 60±10°. A statistically significant difference was
found between the two lens materials, with the novel material having a more wettable surface
(p<0.001).
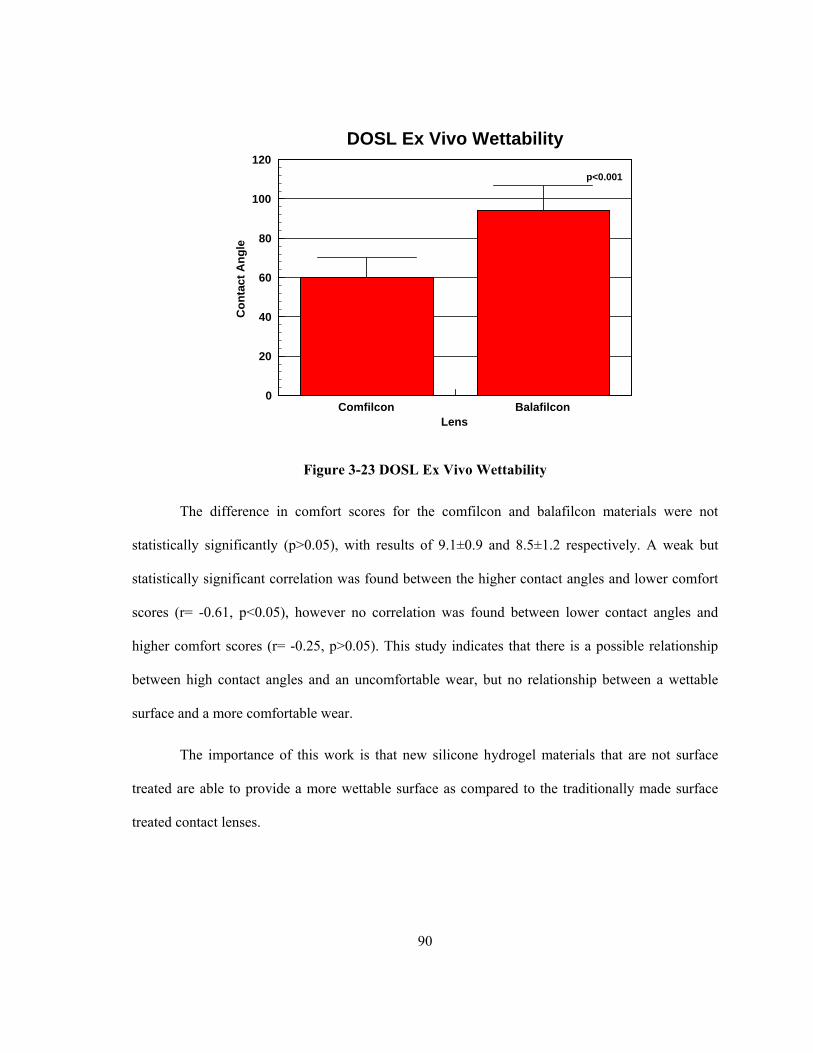
90
Comfilcon BalafilconLens
0
20
40
60
80
100
120
Con
tact
Ang
le
DOSL Ex Vivo Wettability
p<0.001
Figure 3-23 DOSL Ex Vivo Wettability
The difference in comfort scores for the comfilcon and balafilcon materials were not
statistically significantly (p>0.05), with results of 9.1±0.9 and 8.5±1.2 respectively. A weak but
statistically significant correlation was found between the higher contact angles and lower comfort
scores (r= -0.61, p<0.05), however no correlation was found between lower contact angles and
higher comfort scores (r= -0.25, p>0.05). This study indicates that there is a possible relationship
between high contact angles and an uncomfortable wear, but no relationship between a wettable
surface and a more comfortable wear.
The importance of this work is that new silicone hydrogel materials that are not surface
treated are able to provide a more wettable surface as compared to the traditionally made surface
treated contact lenses.
91
3.3.2 Influence of Presoaking Etafilcon A on Short Term Wettability
3.3.2.1 Out-of-Eye ex vivo Lens Wettability
The goal behind this study was to determine the wettability and comfort of the etafilcon A
material (Acuvue 2) that had been previously soaked in ReNu MoistureLoc, SoloCare Aqua, or
OptiFree Express, having been worn for various time periods between two and eight-hours. This
was the largest of all the studies conducted, with 55 participants involved, 24 of them categorized
as asymptomatic and 31 as symptomatic. The subjects were required to come in for four visits over
two days. On each day the two lenses were removed at pair of “times”, which were two, four, six,
or eight hours after lens insertion according to randomization schedule. On the following day the
same procedure was repeated, but the time of the visits were randomized to be different from those
of the first day. The lenses were removed from the eye and were immediately placed on a shaped
mantle, for the contact angle to be assessed using the video based Optical Contact Angle measuring
device and proprietary software.
The ex vivo wettability contact angles as assessed directly out of the eye can be seen in
Table 3-12.
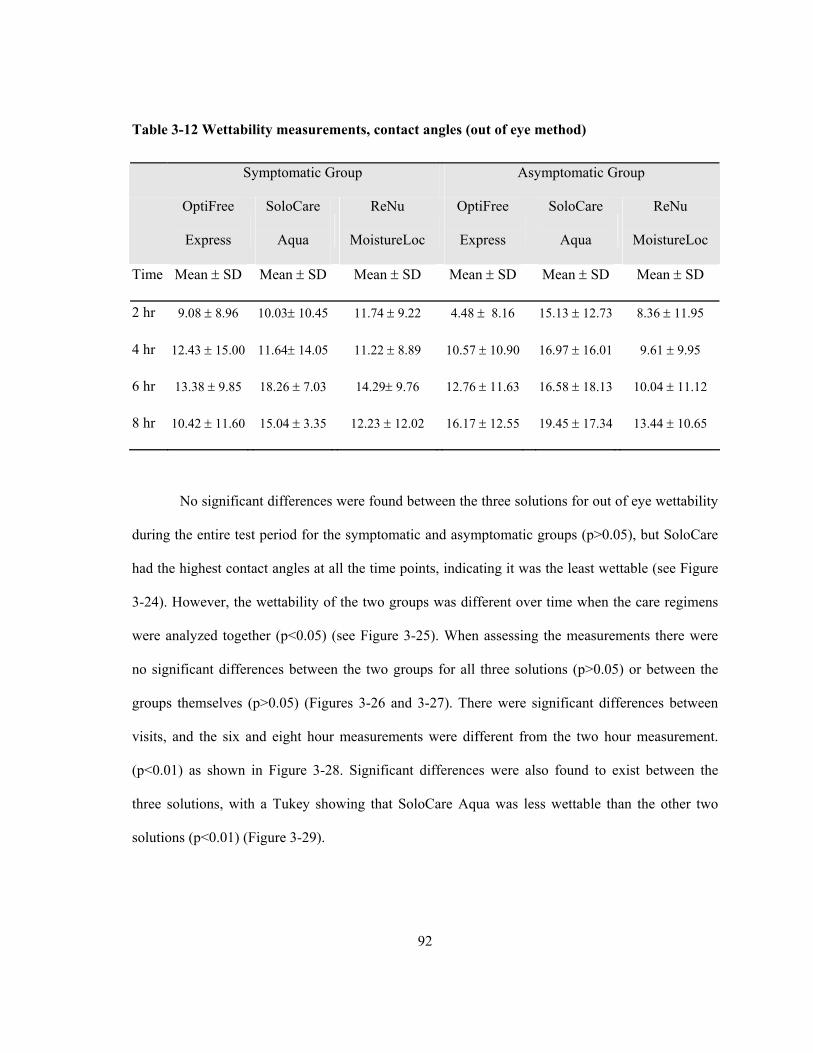
92
Table 3-12 Wettability measurements, contact angles (out of eye method)
Symptomatic Group Asymptomatic Group
OptiFree
Express
SoloCare
Aqua
ReNu
MoistureLoc
OptiFree
Express
SoloCare
Aqua
ReNu
MoistureLoc
Time Mean ± SD Mean ± SD Mean ± SD Mean ± SD Mean ± SD Mean ± SD
2 hr 9.08 ± 8.96 10.03± 10.45 11.74 ± 9.22 4.48 ± 8.16 15.13 ± 12.73 8.36 ± 11.95
4 hr 12.43 ± 15.00 11.64± 14.05 11.22 ± 8.89 10.57 ± 10.90 16.97 ± 16.01 9.61 ± 9.95
6 hr 13.38 ± 9.85 18.26 ± 7.03 14.29± 9.76 12.76 ± 11.63 16.58 ± 18.13 10.04 ± 11.12
8 hr 10.42 ± 11.60 15.04 ± 3.35 12.23 ± 12.02 16.17 ± 12.55 19.45 ± 17.34 13.44 ± 10.65
No significant differences were found between the three solutions for out of eye wettability
during the entire test period for the symptomatic and asymptomatic groups (p>0.05), but SoloCare
had the highest contact angles at all the time points, indicating it was the least wettable (see Figure
3-24). However, the wettability of the two groups was different over time when the care regimens
were analyzed together (p<0.05) (see Figure 3-25). When assessing the measurements there were
no significant differences between the two groups for all three solutions (p>0.05) or between the
groups themselves (p>0.05) (Figures 3-26 and 3-27). There were significant differences between
visits, and the six and eight hour measurements were different from the two hour measurement.
(p<0.01) as shown in Figure 3-28. Significant differences were also found to exist between the
three solutions, with a Tukey showing that SoloCare Aqua was less wettable than the other two
solutions (p<0.01) (Figure 3-29).
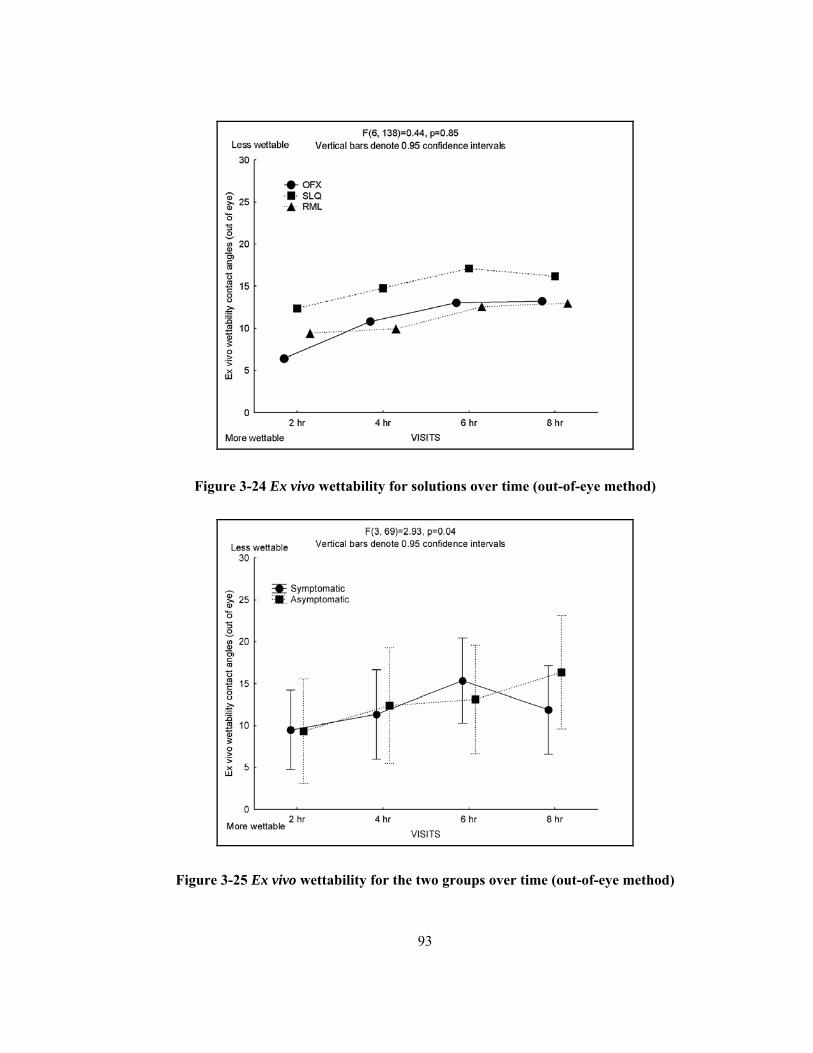
93
Figure 3-24 Ex vivo wettability for solutions over time (out-of-eye method)
Figure 3-25 Ex vivo wettability for the two groups over time (out-of-eye method)
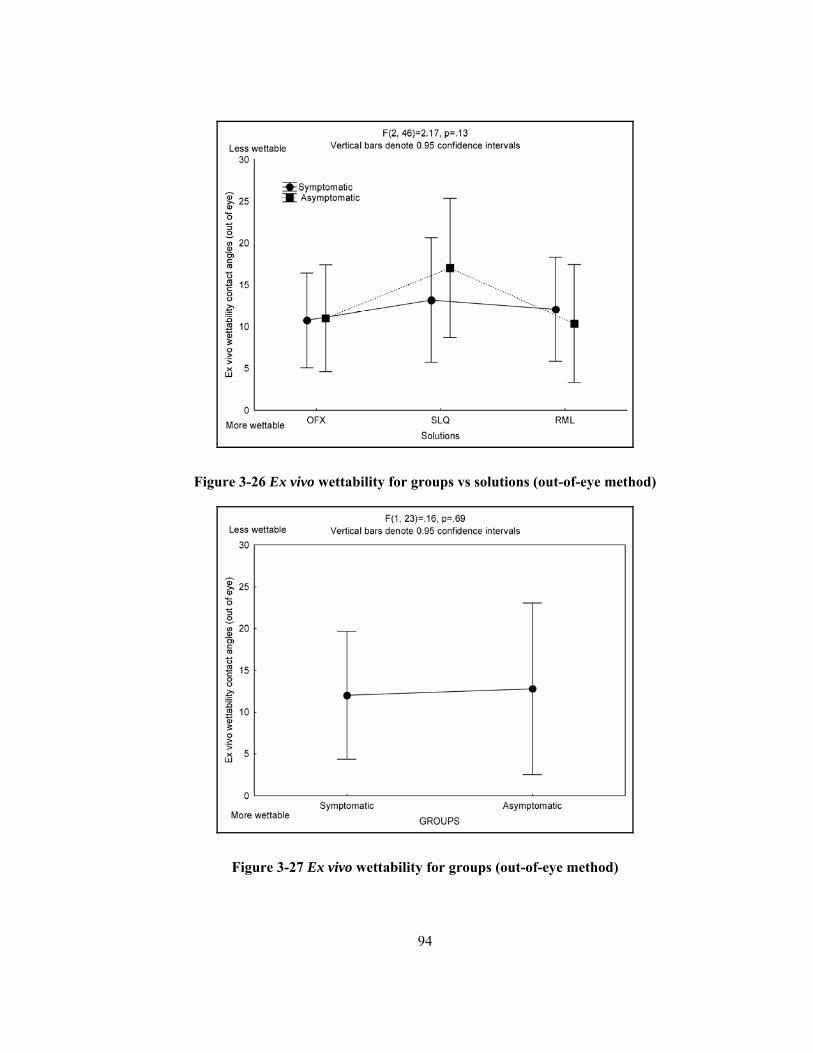
94
Figure 3-26 Ex vivo wettability for groups vs solutions (out-of-eye method)
Figure 3-27 Ex vivo wettability for groups (out-of-eye method)
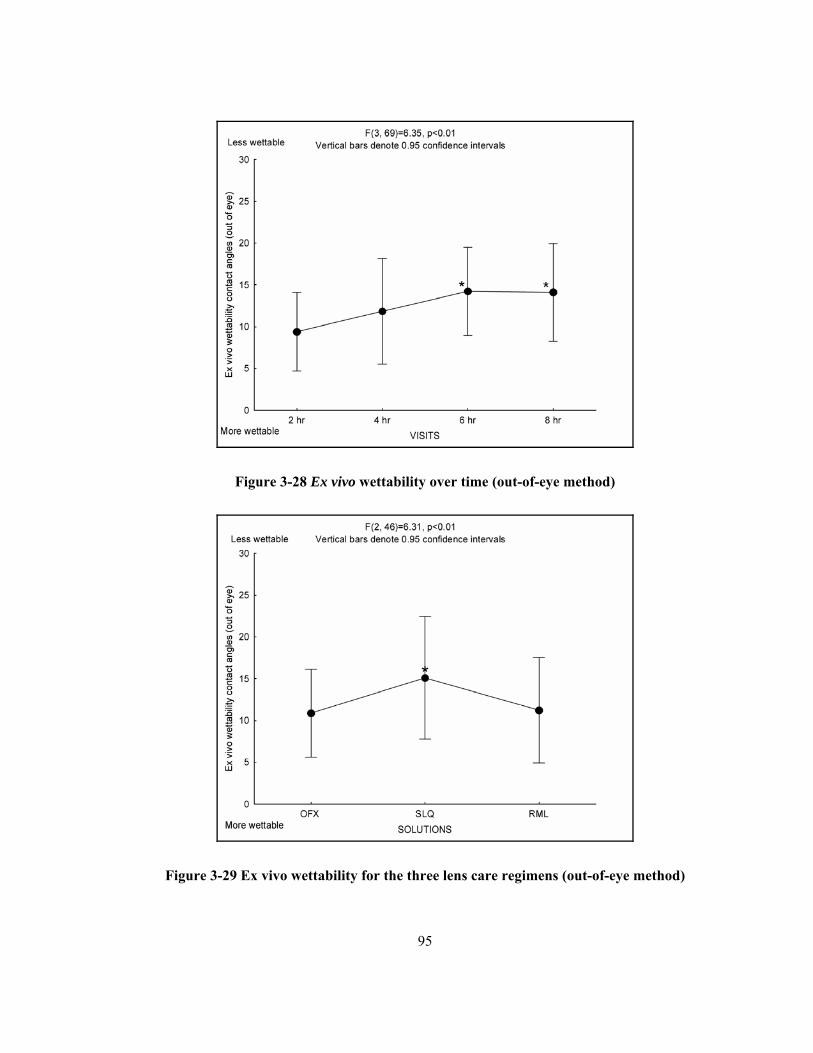
95
Figure 3-28 Ex vivo wettability over time (out-of-eye method)
Figure 3-29 Ex vivo wettability for the three lens care regimens (out-of-eye method)
96
3.3.2.2 Ex Vivo Lens Wettability with the Rinse Procedure
The rinse procedure consisted of a 2-3 second spray completely rinsing the lens with
preservative free saline to remove the tear film. The resulting contact angles are laid out in Table 3-
13. A significant difference was found over time between the three solutions using the rinse
method, as shown in Figure 3-30 (p<0.05). Measurements for the different visits of SoloCare Aqua
were not different from each other, but the four-hour visit was different from the eight-hour
measurement of ReNu MoistureLoc. The eight-hour measurement for SoloCare Aqua was not
different from the four-hour measurement of ReNu MoistureLoc, but is was different from the other
three (two, six, and eight hour) measurement. A significant difference was seen regarding OptiFree
Express with the two-hour time point being significantly different from the four, six and eight-hour
times. As well, OptiFree Express was the most wettable being significantly different from both
other solutions. There was no significant difference between the symptomatic and asymptomatic
groups (p>0.05) (see Figure 3-33), as well as there was no difference between the groups over time
(see Figure 3-31) (p>0.05). In both the symptomatic and asymptomatic groups there was no
difference between the SoloCare Aqua and ReNu MoistureLoc solutions (see Figure 3-32)
(p>0.05). However a significant difference was obtained between OptiFree Express and both
groups within the SoloCare and ReNu solutions (p<0.05), except for asymptomatic ReNu
MoistureLoc. When all the solutions and groups were collected together, no significant differences
were seen over the time points (Figure 3-34)(p=0.05). When comparing all three solutions, with all
time points and groups combined, significant differences were seen, as is shown in Figure 3-35
(p<0.01).
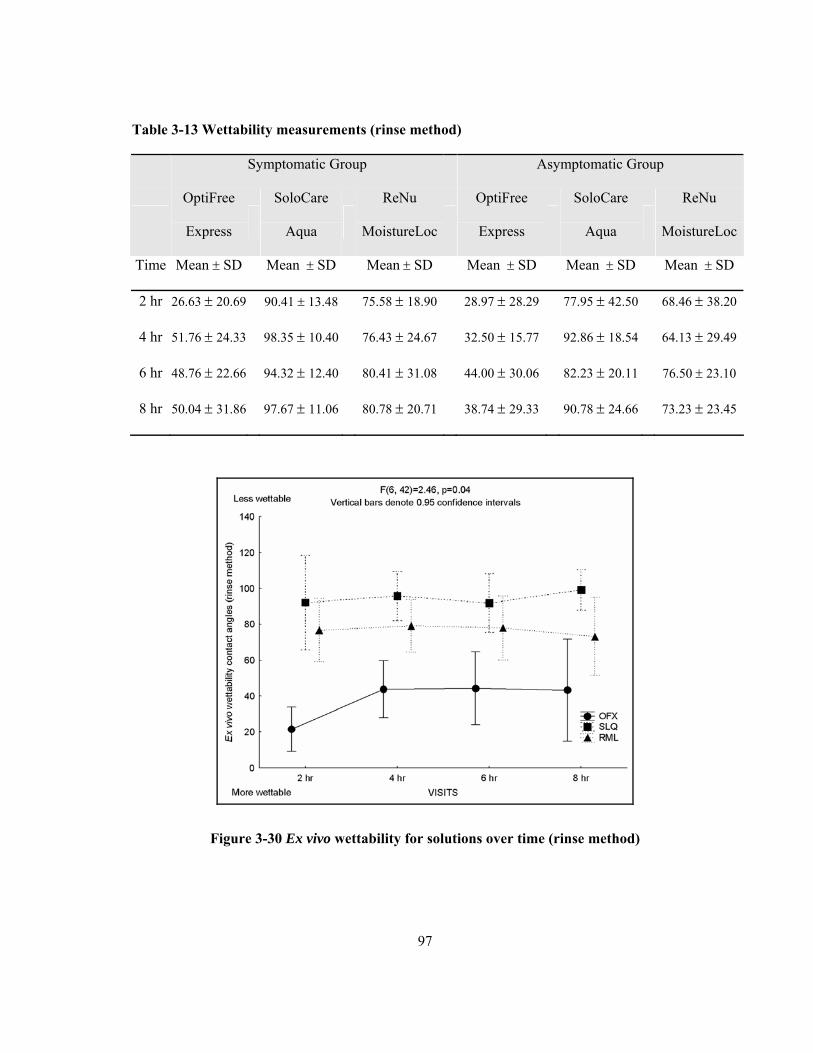
97
Table 3-13 Wettability measurements (rinse method)
Symptomatic Group Asymptomatic Group
OptiFree
Express
SoloCare
Aqua
ReNu
MoistureLoc
OptiFree
Express
SoloCare
Aqua
ReNu
MoistureLoc
Time Mean ± SD Mean ± SD Mean ± SD Mean ± SD Mean ± SD Mean ± SD
2 hr 26.63 ± 20.69 90.41 ± 13.48 75.58 ± 18.90 28.97 ± 28.29 77.95 ± 42.50 68.46 ± 38.20
4 hr 51.76 ± 24.33 98.35 ± 10.40 76.43 ± 24.67 32.50 ± 15.77 92.86 ± 18.54 64.13 ± 29.49
6 hr 48.76 ± 22.66 94.32 ± 12.40 80.41 ± 31.08 44.00 ± 30.06 82.23 ± 20.11 76.50 ± 23.10
8 hr 50.04 ± 31.86 97.67 ± 11.06 80.78 ± 20.71 38.74 ± 29.33 90.78 ± 24.66 73.23 ± 23.45
Figure 3-30 Ex vivo wettability for solutions over time (rinse method)
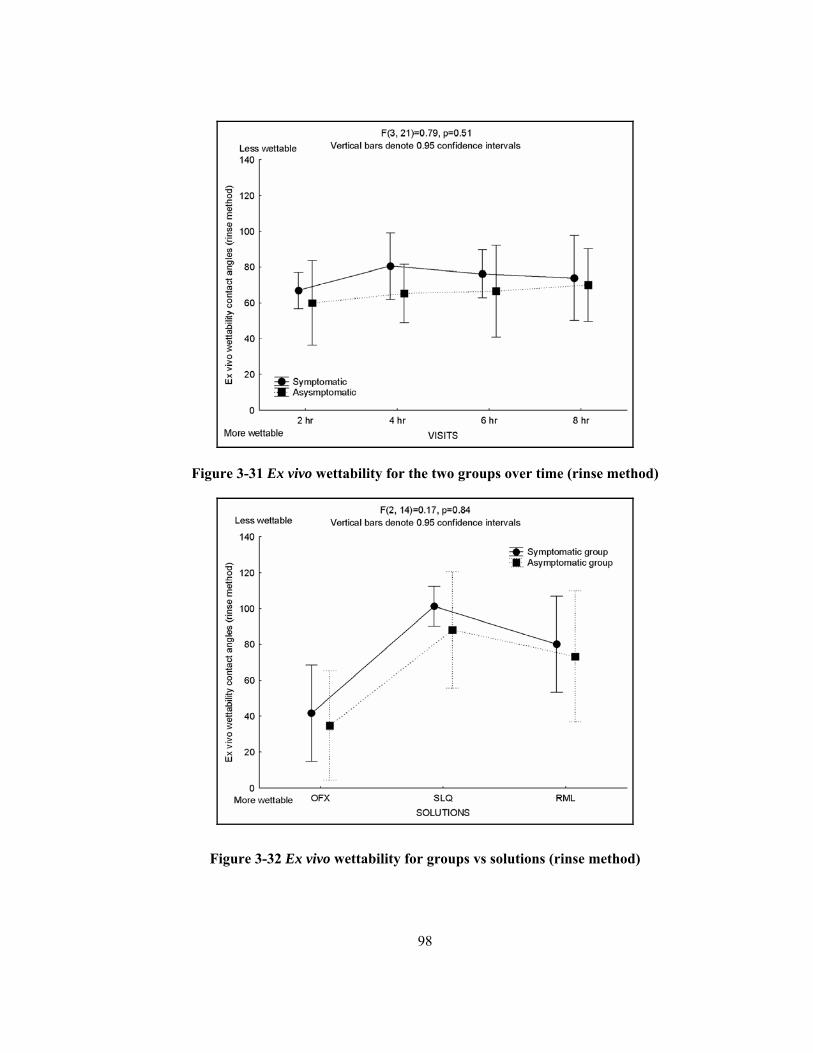
98
Figure 3-31 Ex vivo wettability for the two groups over time (rinse method)
Figure 3-32 Ex vivo wettability for groups vs solutions (rinse method)
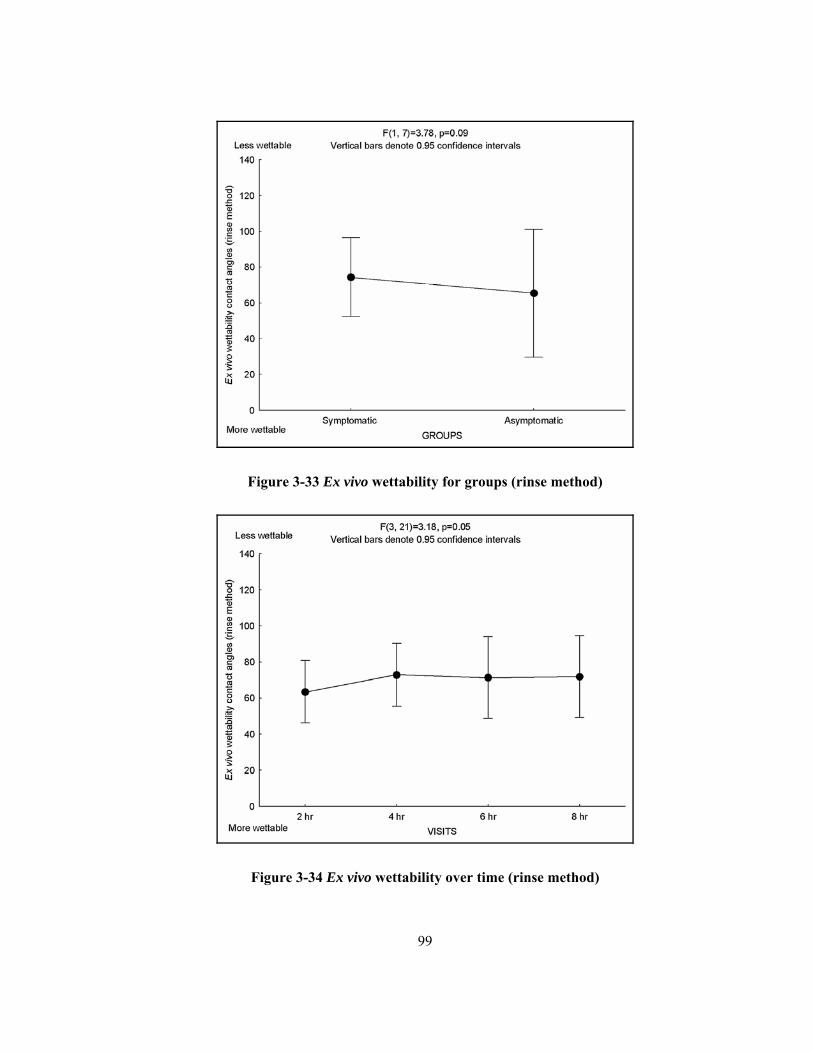
99
Figure 3-33 Ex vivo wettability for groups (rinse method)
Figure 3-34 Ex vivo wettability over time (rinse method)
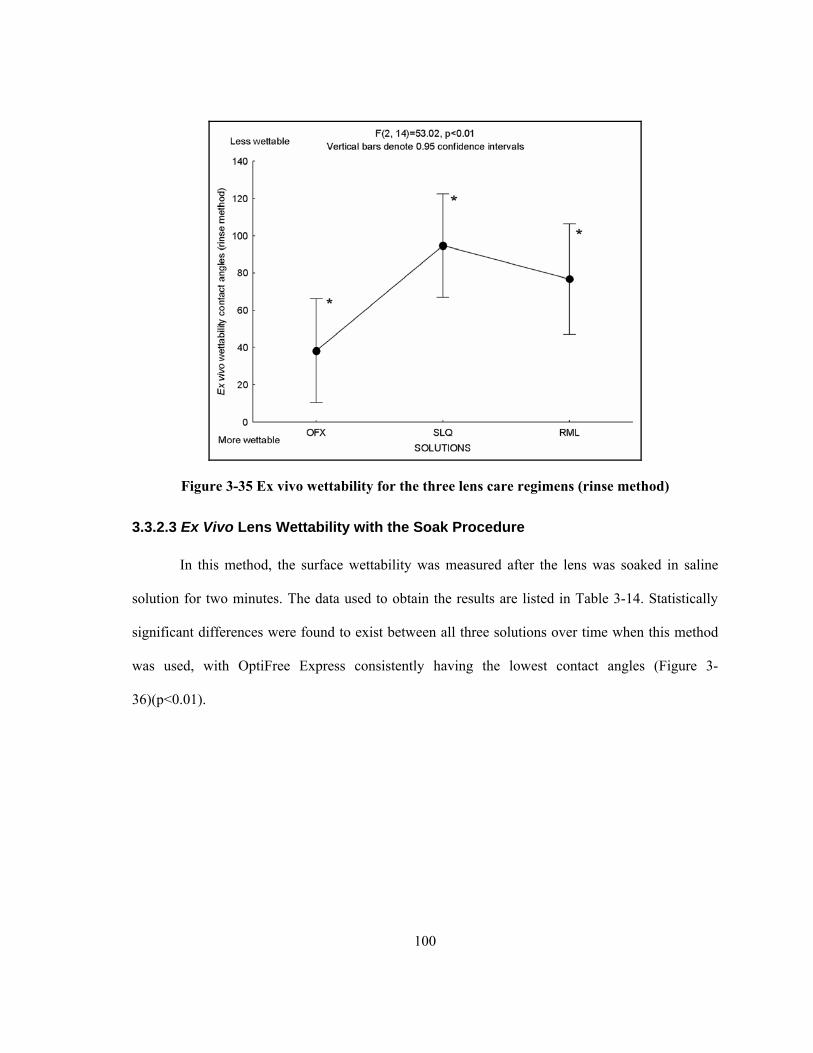
100
Figure 3-35 Ex vivo wettability for the three lens care regimens (rinse method)
3.3.2.3 Ex Vivo Lens Wettability with the Soak Procedure
In this method, the surface wettability was measured after the lens was soaked in saline
solution for two minutes. The data used to obtain the results are listed in Table 3-14. Statistically
significant differences were found to exist between all three solutions over time when this method
was used, with OptiFree Express consistently having the lowest contact angles (Figure 3-
36)(p<0.01).
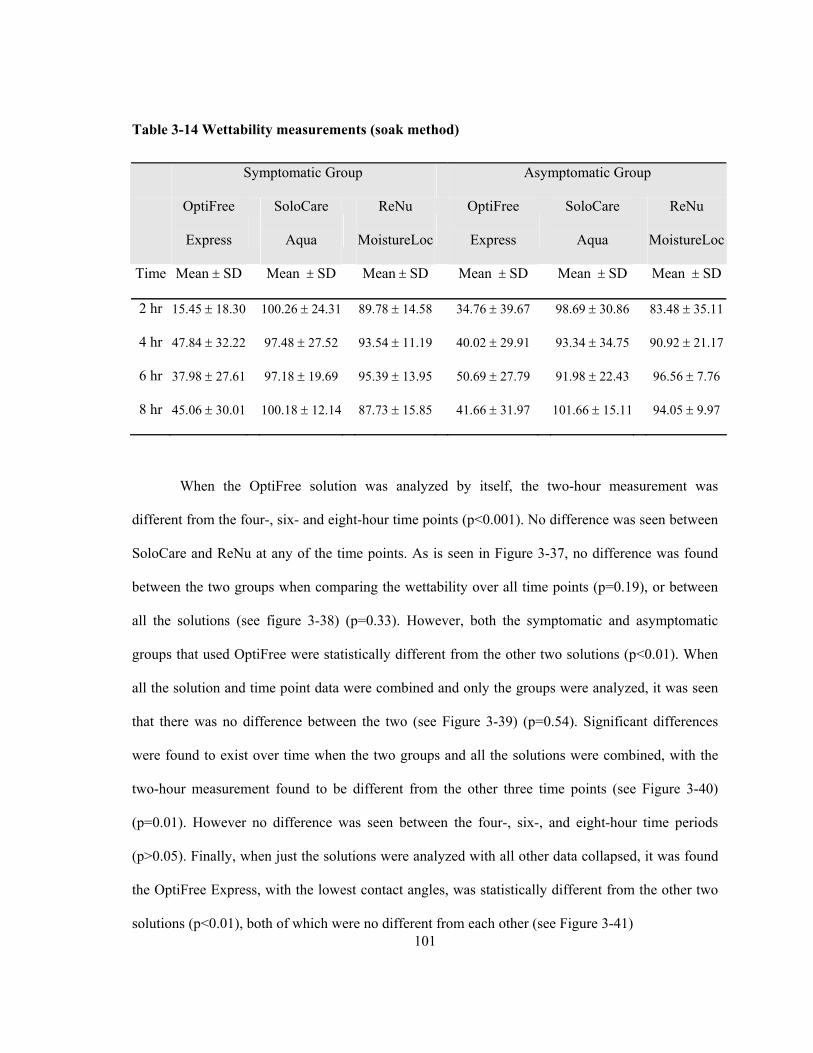
101
Table 3-14 Wettability measurements (soak method)
Symptomatic Group Asymptomatic Group
OptiFree
Express
SoloCare
Aqua
ReNu
MoistureLoc
OptiFree
Express
SoloCare
Aqua
ReNu
MoistureLoc
Time Mean ± SD Mean ± SD Mean ± SD Mean ± SD Mean ± SD Mean ± SD
2 hr 15.45 ± 18.30 100.26 ± 24.31 89.78 ± 14.58 34.76 ± 39.67 98.69 ± 30.86 83.48 ± 35.11
4 hr 47.84 ± 32.22 97.48 ± 27.52 93.54 ± 11.19 40.02 ± 29.91 93.34 ± 34.75 90.92 ± 21.17
6 hr 37.98 ± 27.61 97.18 ± 19.69 95.39 ± 13.95 50.69 ± 27.79 91.98 ± 22.43 96.56 ± 7.76
8 hr 45.06 ± 30.01 100.18 ± 12.14 87.73 ± 15.85 41.66 ± 31.97 101.66 ± 15.11 94.05 ± 9.97
When the OptiFree solution was analyzed by itself, the two-hour measurement was
different from the four-, six- and eight-hour time points (p<0.001). No difference was seen between
SoloCare and ReNu at any of the time points. As is seen in Figure 3-37, no difference was found
between the two groups when comparing the wettability over all time points (p=0.19), or between
all the solutions (see figure 3-38) (p=0.33). However, both the symptomatic and asymptomatic
groups that used OptiFree were statistically different from the other two solutions (p<0.01). When
all the solution and time point data were combined and only the groups were analyzed, it was seen
that there was no difference between the two (see Figure 3-39) (p=0.54). Significant differences
were found to exist over time when the two groups and all the solutions were combined, with the
two-hour measurement found to be different from the other three time points (see Figure 3-40)
(p=0.01). However no difference was seen between the four-, six-, and eight-hour time periods
(p>0.05). Finally, when just the solutions were analyzed with all other data collapsed, it was found
the OptiFree Express, with the lowest contact angles, was statistically different from the other two
solutions (p<0.01), both of which were no different from each other (see Figure 3-41)
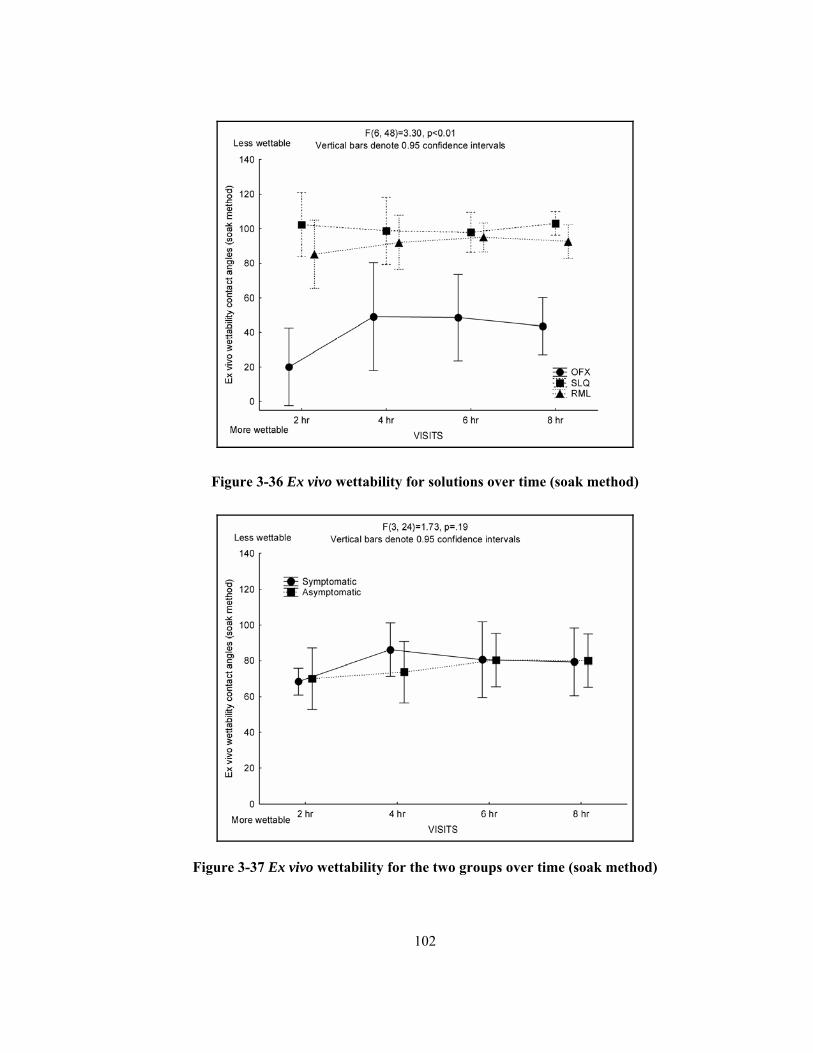
102
Figure 3-36 Ex vivo wettability for solutions over time (soak method)
Figure 3-37 Ex vivo wettability for the two groups over time (soak method)
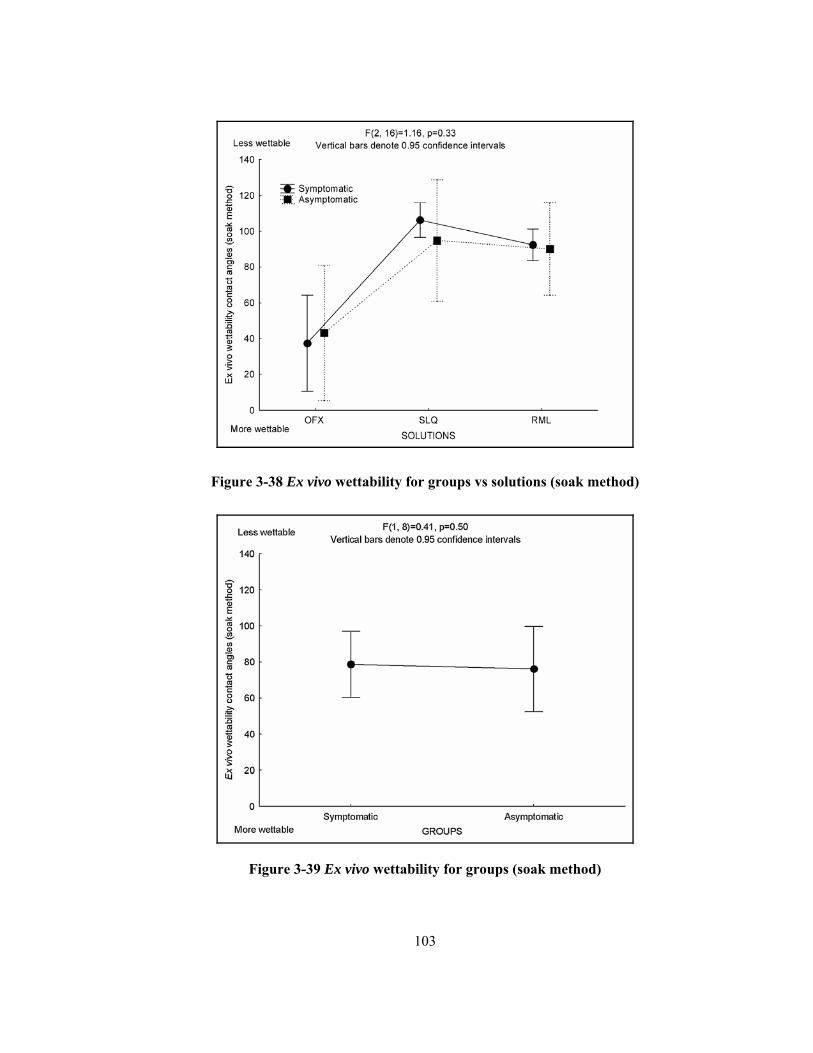
103
Figure 3-38 Ex vivo wettability for groups vs solutions (soak method)
Figure 3-39 Ex vivo wettability for groups (soak method)
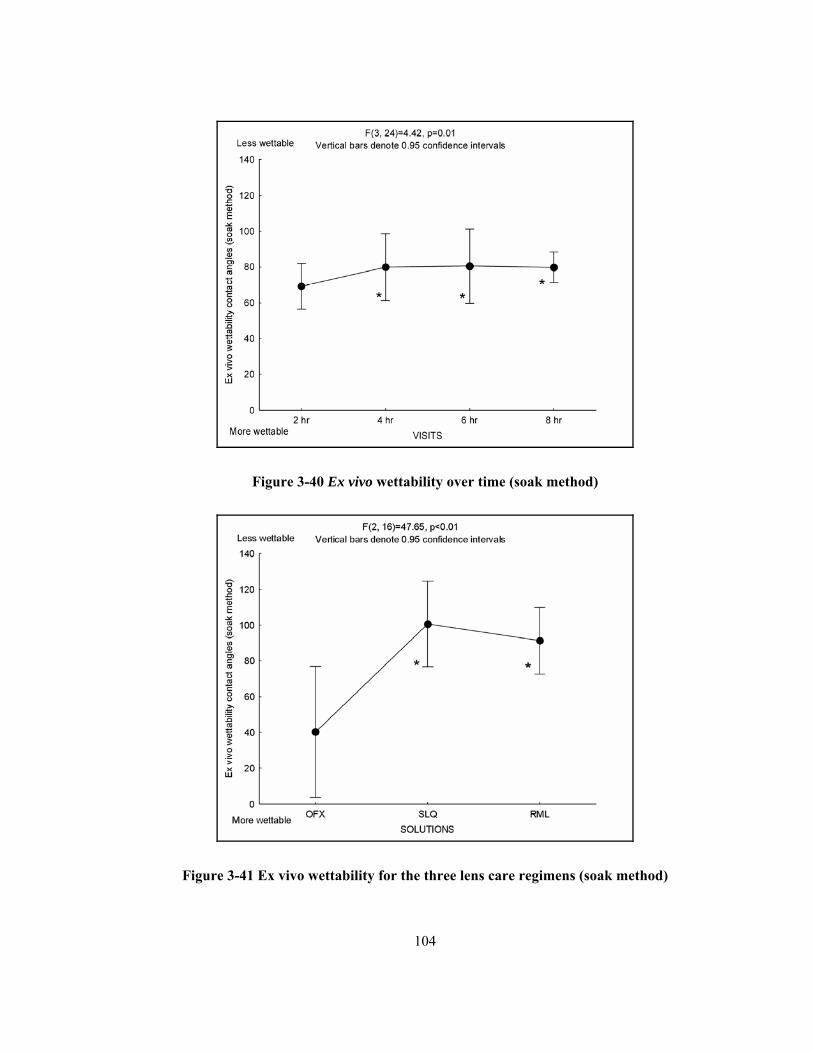
104
Figure 3-40 Ex vivo wettability over time (soak method)
Figure 3-41 Ex vivo wettability for the three lens care regimens (soak method)
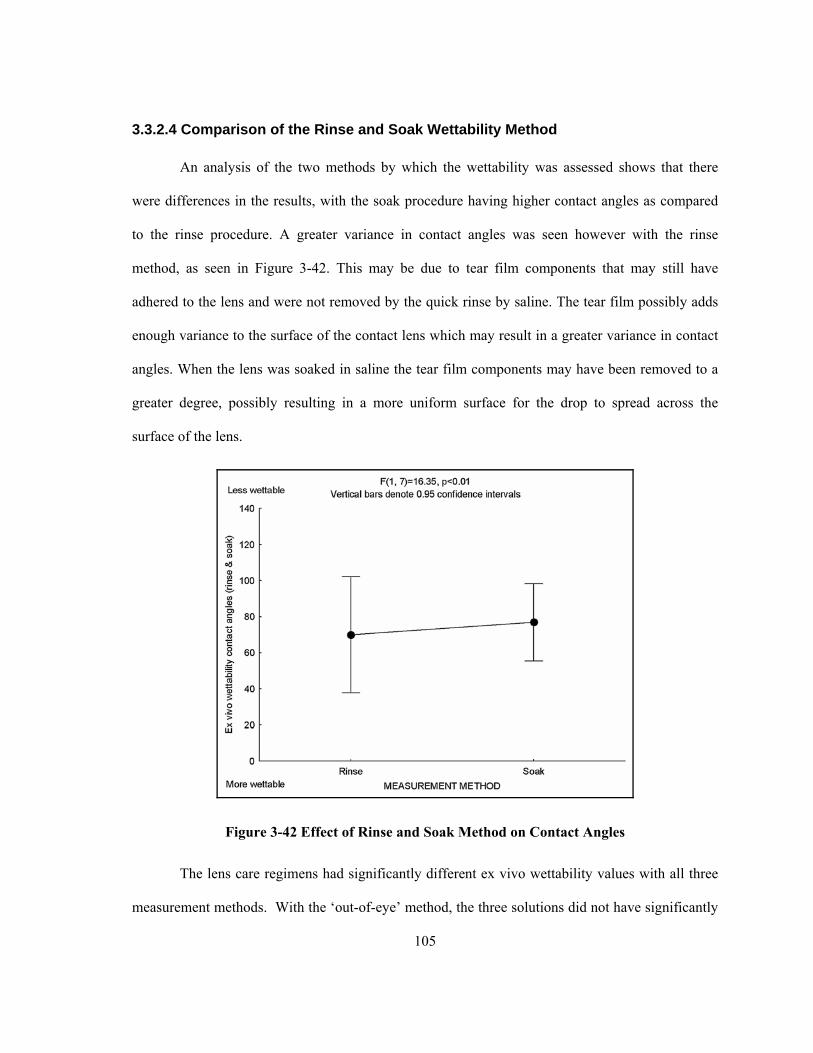
105
3.3.2.4 Comparison of the Rinse and Soak Wettability Method
An analysis of the two methods by which the wettability was assessed shows that there
were differences in the results, with the soak procedure having higher contact angles as compared
to the rinse procedure. A greater variance in contact angles was seen however with the rinse
method, as seen in Figure 3-42. This may be due to tear film components that may still have
adhered to the lens and were not removed by the quick rinse by saline. The tear film possibly adds
enough variance to the surface of the contact lens which may result in a greater variance in contact
angles. When the lens was soaked in saline the tear film components may have been removed to a
greater degree, possibly resulting in a more uniform surface for the drop to spread across the
surface of the lens.
Figure 3-42 Effect of Rinse and Soak Method on Contact Angles
The lens care regimens had significantly different ex vivo wettability values with all three
measurement methods. With the ‘out-of-eye’ method, the three solutions did not have significantly
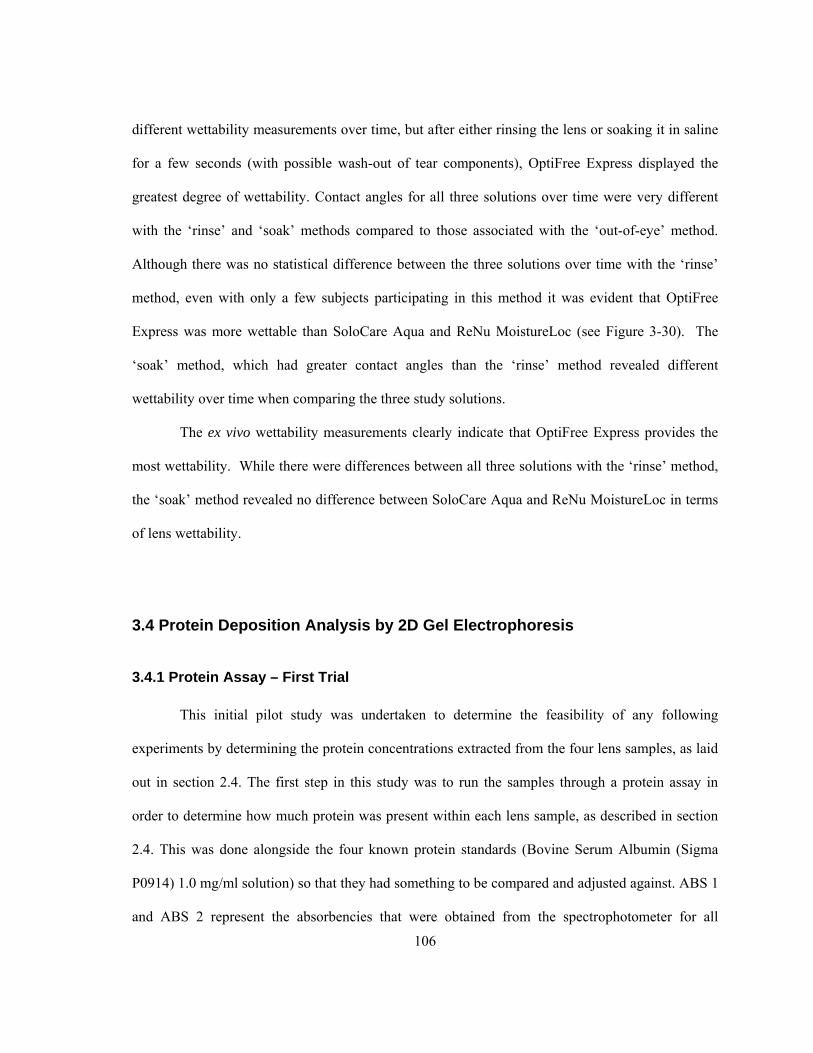
106
different wettability measurements over time, but after either rinsing the lens or soaking it in saline
for a few seconds (with possible wash-out of tear components), OptiFree Express displayed the
greatest degree of wettability. Contact angles for all three solutions over time were very different
with the ‘rinse’ and ‘soak’ methods compared to those associated with the ‘out-of-eye’ method.
Although there was no statistical difference between the three solutions over time with the ‘rinse’
method, even with only a few subjects participating in this method it was evident that OptiFree
Express was more wettable than SoloCare Aqua and ReNu MoistureLoc (see Figure 3-30). The
‘soak’ method, which had greater contact angles than the ‘rinse’ method revealed different
wettability over time when comparing the three study solutions.
The ex vivo wettability measurements clearly indicate that OptiFree Express provides the
most wettability. While there were differences between all three solutions with the ‘rinse’ method,
the ‘soak’ method revealed no difference between SoloCare Aqua and ReNu MoistureLoc in terms
of lens wettability.
3.4 Protein Deposition Analysis by 2D Gel Electrophoresis
3.4.1 Protein Assay – First Trial
This initial pilot study was undertaken to determine the feasibility of any following
experiments by determining the protein concentrations extracted from the four lens samples, as laid
out in section 2.4. The first step in this study was to run the samples through a protein assay in
order to determine how much protein was present within each lens sample, as described in section
2.4. This was done alongside the four known protein standards (Bovine Serum Albumin (Sigma
P0914) 1.0 mg/ml solution) so that they had something to be compared and adjusted against. ABS 1
and ABS 2 represent the absorbencies that were obtained from the spectrophotometer for all
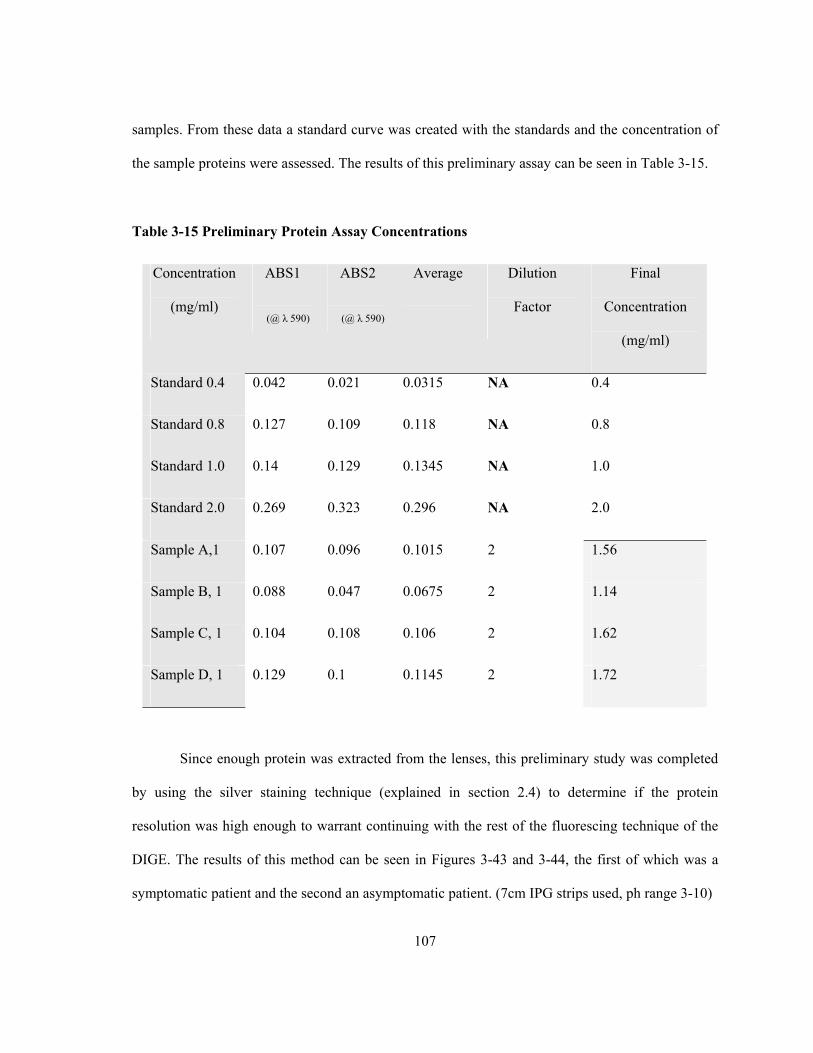
107
samples. From these data a standard curve was created with the standards and the concentration of
the sample proteins were assessed. The results of this preliminary assay can be seen in Table 3-15.
Table 3-15 Preliminary Protein Assay Concentrations
Concentration
(mg/ml)
ABS1
(@ λ 590)
ABS2
(@ λ 590)
Average Dilution
Factor
Final
Concentration
(mg/ml)
Standard 0.4 0.042 0.021 0.0315 NA 0.4
Standard 0.8 0.127 0.109 0.118 NA 0.8
Standard 1.0 0.14 0.129 0.1345 NA 1.0
Standard 2.0 0.269 0.323 0.296 NA 2.0
Sample A,1 0.107 0.096 0.1015 2 1.56
Sample B, 1 0.088 0.047 0.0675 2 1.14
Sample C, 1 0.104 0.108 0.106 2 1.62
Sample D, 1 0.129 0.1 0.1145 2 1.72
Since enough protein was extracted from the lenses, this preliminary study was completed
by using the silver staining technique (explained in section 2.4) to determine if the protein
resolution was high enough to warrant continuing with the rest of the fluorescing technique of the
DIGE. The results of this method can be seen in Figures 3-43 and 3-44, the first of which was a
symptomatic patient and the second an asymptomatic patient. (7cm IPG strips used, ph range 3-10)
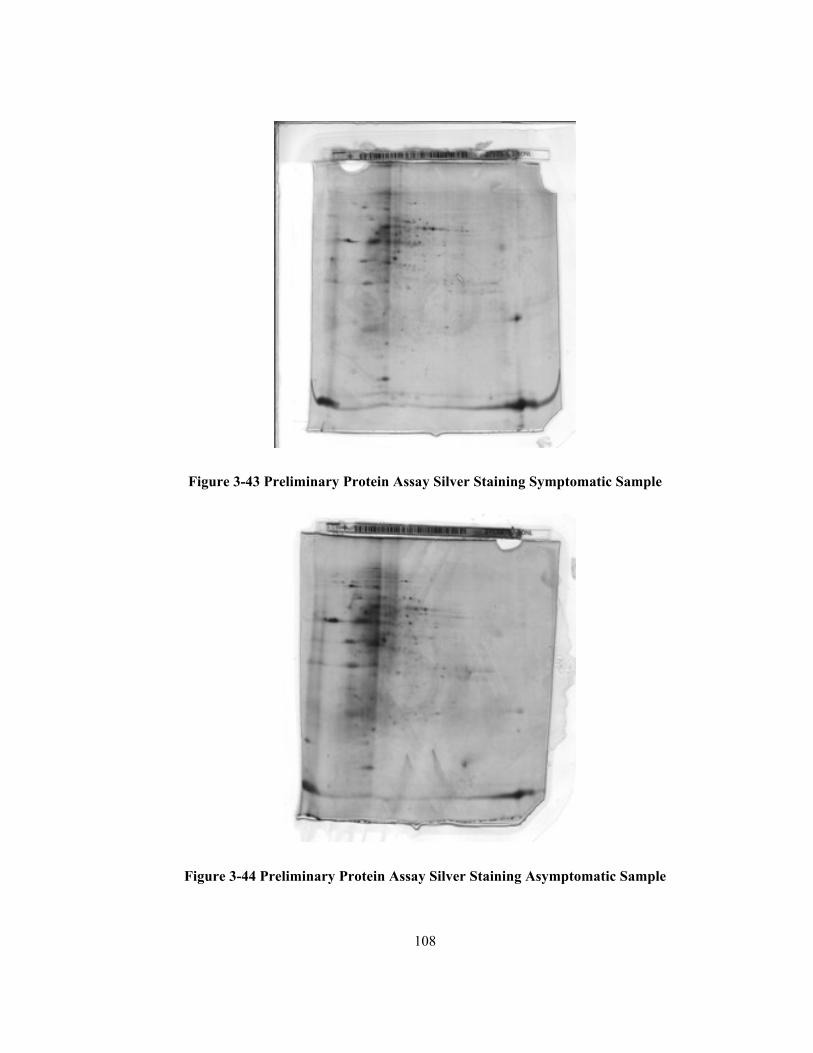
108
Figure 3-43 Preliminary Protein Assay Silver Staining Symptomatic Sample
Figure 3-44 Preliminary Protein Assay Silver Staining Asymptomatic Sample
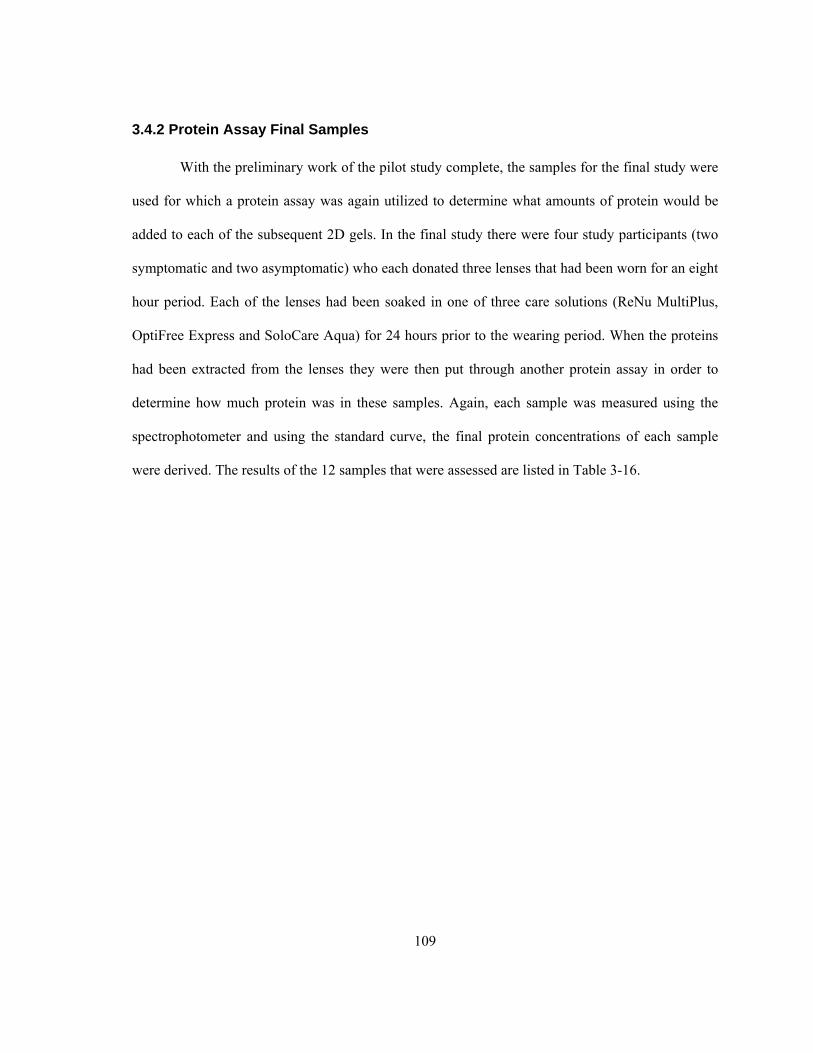
109
3.4.2 Protein Assay Final Samples
With the preliminary work of the pilot study complete, the samples for the final study were
used for which a protein assay was again utilized to determine what amounts of protein would be
added to each of the subsequent 2D gels. In the final study there were four study participants (two
symptomatic and two asymptomatic) who each donated three lenses that had been worn for an eight
hour period. Each of the lenses had been soaked in one of three care solutions (ReNu MultiPlus,
OptiFree Express and SoloCare Aqua) for 24 hours prior to the wearing period. When the proteins
had been extracted from the lenses they were then put through another protein assay in order to
determine how much protein was in these samples. Again, each sample was measured using the
spectrophotometer and using the standard curve, the final protein concentrations of each sample
were derived. The results of the 12 samples that were assessed are listed in Table 3-16.
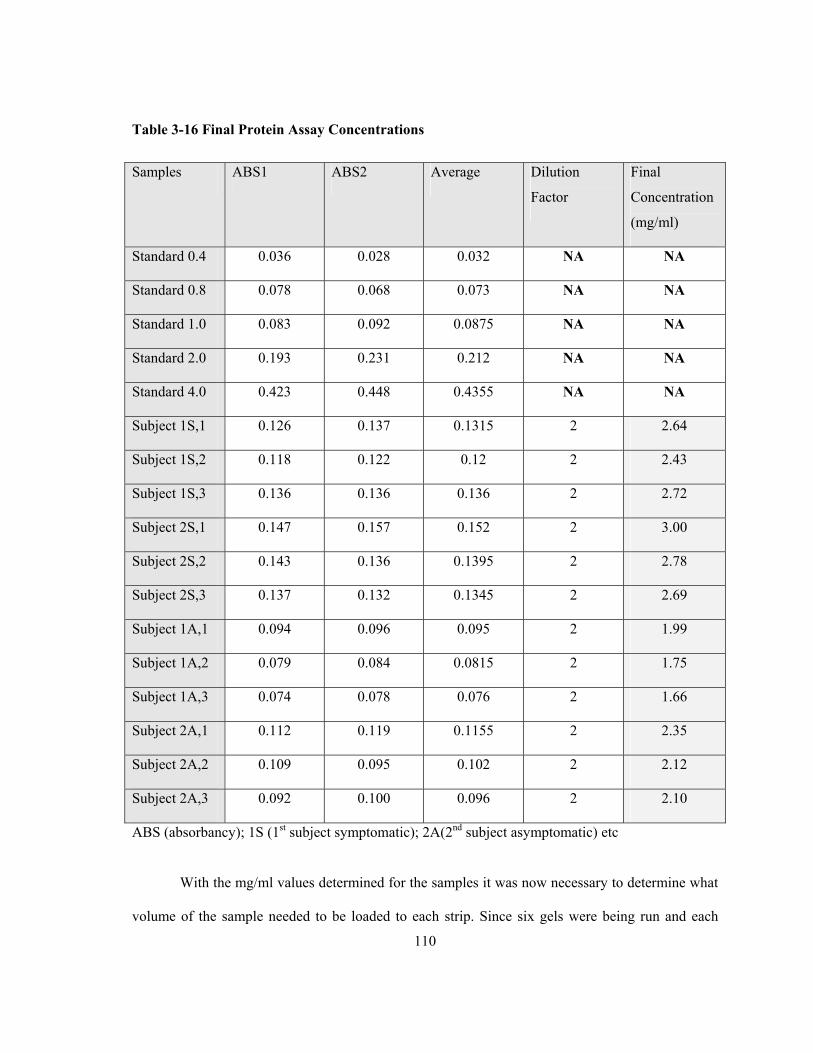
110
Table 3-16 Final Protein Assay Concentrations
Samples ABS1 ABS2 Average Dilution
Factor
Final
Concentration
(mg/ml)
Standard 0.4 0.036 0.028 0.032 NA NA
Standard 0.8 0.078 0.068 0.073 NA NA
Standard 1.0 0.083 0.092 0.0875 NA NA
Standard 2.0 0.193 0.231 0.212 NA NA
Standard 4.0 0.423 0.448 0.4355 NA NA
Subject 1S,1 0.126 0.137 0.1315 2 2.64
Subject 1S,2 0.118 0.122 0.12 2 2.43
Subject 1S,3 0.136 0.136 0.136 2 2.72
Subject 2S,1 0.147 0.157 0.152 2 3.00
Subject 2S,2 0.143 0.136 0.1395 2 2.78
Subject 2S,3 0.137 0.132 0.1345 2 2.69
Subject 1A,1 0.094 0.096 0.095 2 1.99
Subject 1A,2 0.079 0.084 0.0815 2 1.75
Subject 1A,3 0.074 0.078 0.076 2 1.66
Subject 2A,1 0.112 0.119 0.1155 2 2.35
Subject 2A,2 0.109 0.095 0.102 2 2.12
Subject 2A,3 0.092 0.100 0.096 2 2.10
ABS (absorbancy); 1S (1st subject symptomatic); 2A(2nd subject asymptomatic) etc
With the mg/ml values determined for the samples it was now necessary to determine what
volume of the sample needed to be loaded to each strip. Since six gels were being run and each
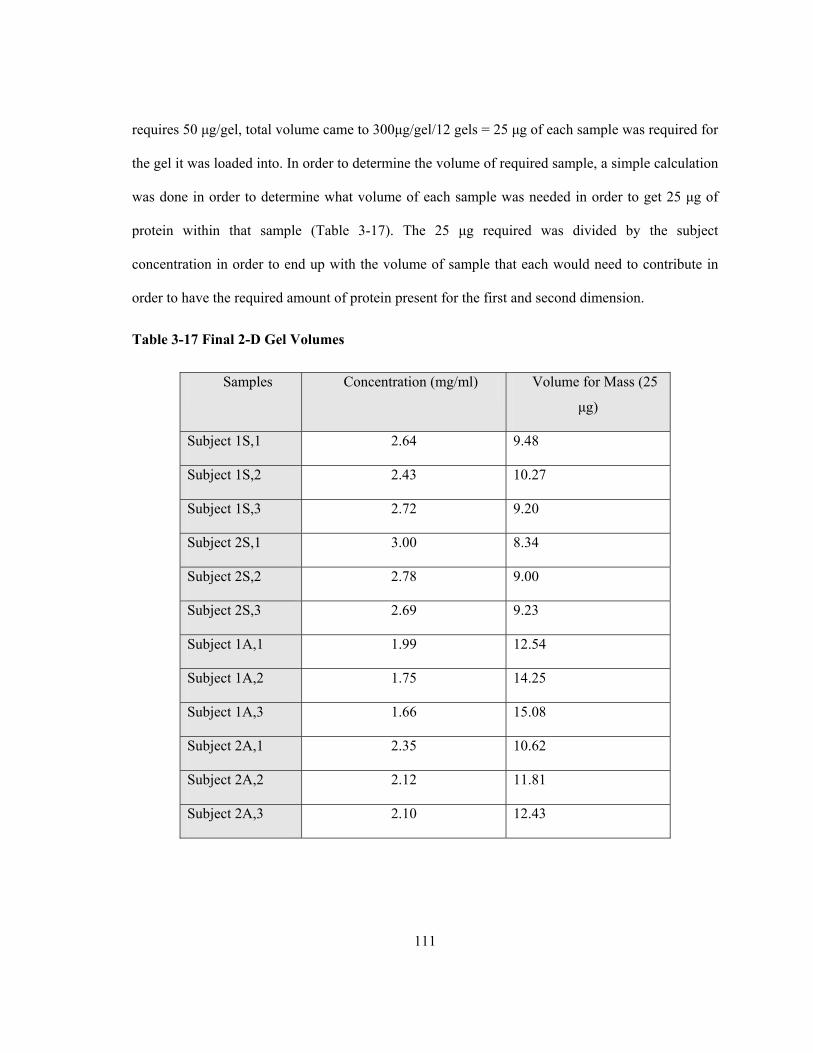
111
requires 50 μg/gel, total volume came to 300μg/gel/12 gels = 25 μg of each sample was required for
the gel it was loaded into. In order to determine the volume of required sample, a simple calculation
was done in order to determine what volume of each sample was needed in order to get 25 μg of
protein within that sample (Table 3-17). The 25 μg required was divided by the subject
concentration in order to end up with the volume of sample that each would need to contribute in
order to have the required amount of protein present for the first and second dimension.
Table 3-17 Final 2-D Gel Volumes
Samples Concentration (mg/ml) Volume for Mass (25
μg)
Subject 1S,1 2.64 9.48
Subject 1S,2 2.43 10.27
Subject 1S,3 2.72 9.20
Subject 2S,1 3.00 8.34
Subject 2S,2 2.78 9.00
Subject 2S,3 2.69 9.23
Subject 1A,1 1.99 12.54
Subject 1A,2 1.75 14.25
Subject 1A,3 1.66 15.08
Subject 2A,1 2.35 10.62
Subject 2A,2 2.12 11.81
Subject 2A,3 2.10 12.43
112
Each of these samples was combined with a specific CyDye and then added to one of the
six grouping as are shown in Table 2-7 along with the pooled standard that contained a portion of
each of the samples. Each sample was then separated by isoelectric point via the first dimension.
The next step was to separate all the extracted proteins based on their relative size via the second
dimension by running them through a polyacrylamide gel. The gels were run at 1.5W per gel for a
total of 9W within the Ettan DIGE (Amersham Pharmacia biotech) second dimension analyzer and
run overnight (19 hours). Each gel was then loaded into the Typhoon 9400 Variable Mode Imager
and scanned at the relative wavelength of light to fluoresce the specific CyDye. The imager scans
each gel with one of three specific wavelengths of light at a time in order to fluoresce the specific
Cydye that it activates. When all three dyes have been independently fluoresced, the three images
produced for each gel can then be overlaid and analyzed. The analysis involves looking for
fluorescing spots of one dye in a gel that was not present in one of the others, which indicates that
there was a variation in protein expression. This variation can then be traced back to possibly being
caused by the differences between the symptomatic or asymptomatic subjects.
3.4.3 2D DIGE Gels
The pooled standard CyDye for all gels should look similar since all the protein samples
were combined and then applied to each of the gels. The differences, if any, would be seen
between the Cy3 and Cy5 dyes, for they are the dyes that were bound to the specific subject
samples, and when they were scanned they would pick up only that sample. Each of the following
figures represents the scanned images taken in groups of dyes. For each gel, as it was run through
the Typhoon scanner, produced three images each relative to the specific dye and wavelength
combination. The three images from each gel have been separated based on the wavelength/dye
used, and grouped together with all the other samples from that same excitation. Figure 3-45
represents the pooled standard that was on each of the six gels. The images from all of these gels

113
should be the same because it was the same sample that was applied to all of them. Figure 3-46
represents all the scans for the Cydye3 within all six gels, while 3-47 represents all the scans that
were taken for the Cydye5 within all of the gels.
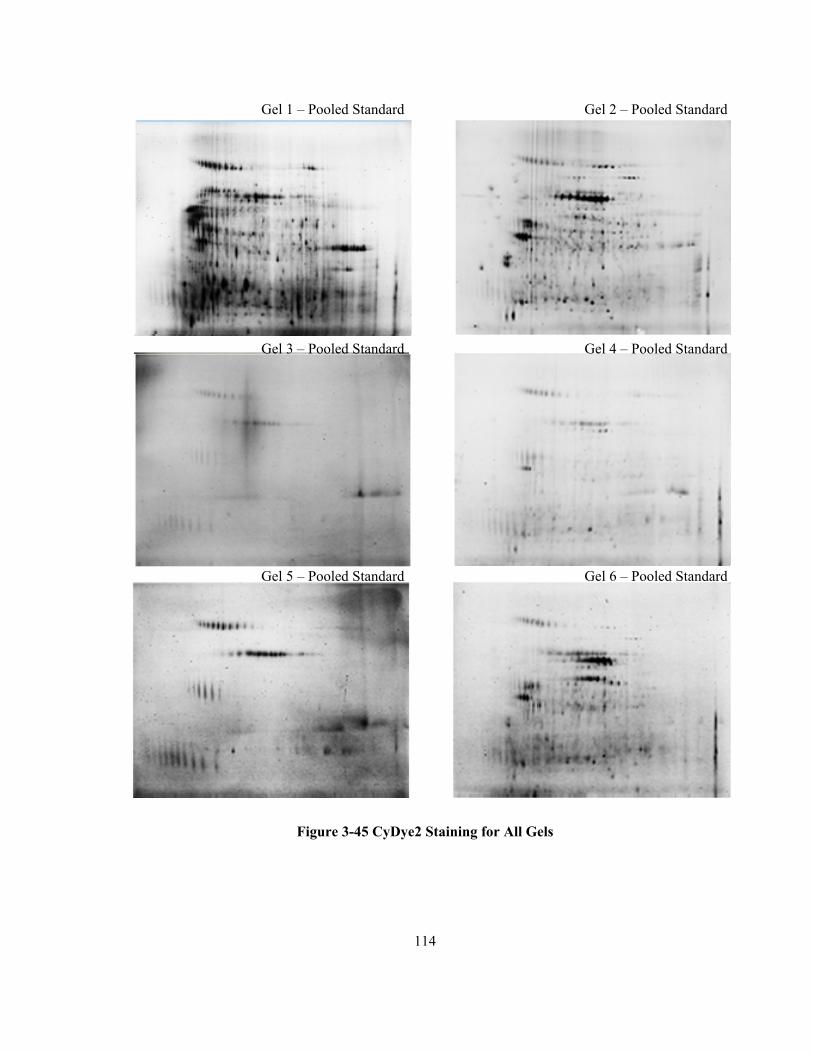
114
Gel 1 – Pooled Standard Gel 2 – Pooled Standard
Gel 3 – Pooled Standard Gel 4 – Pooled Standard
Gel 5 – Pooled Standard Gel 6 – Pooled Standard
Figure 3-45 CyDye2 Staining for All Gels
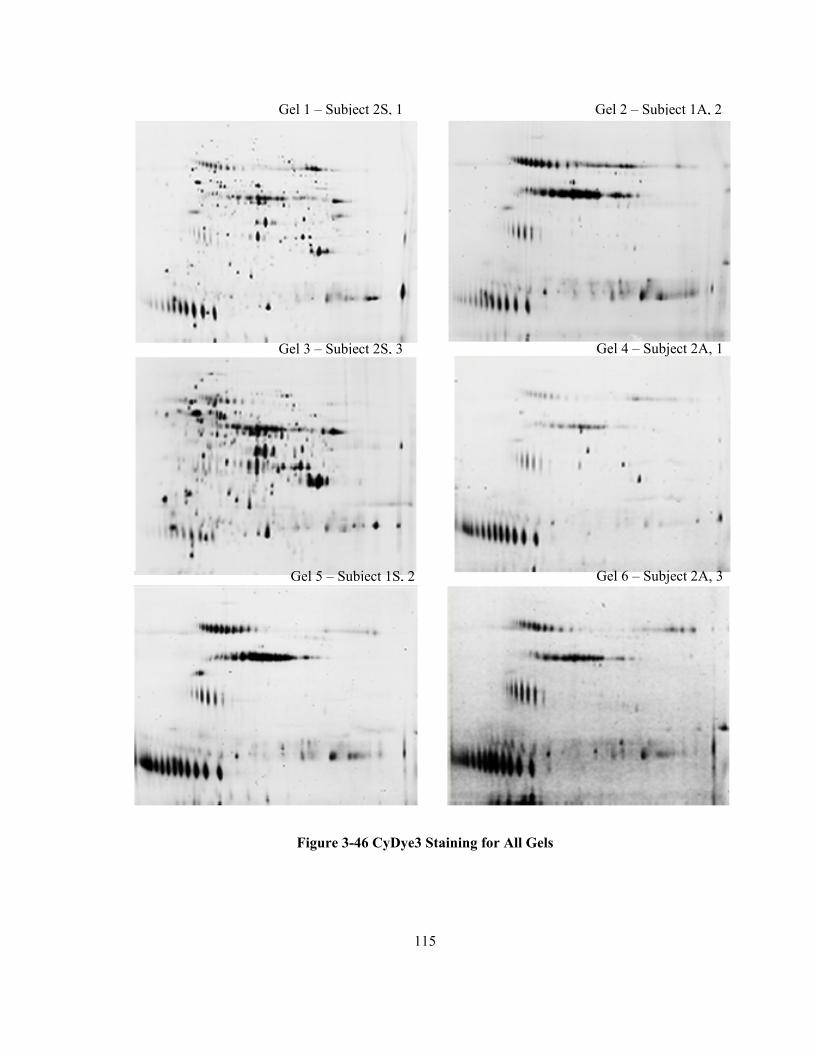
115
Gel 2 – Subject 1A, 2Gel 1 – Subject 2S, 1
Gel 4 – Subject 2A, 1 Gel 3 – Subject 2S, 3
Gel 6 – Subject 2A, 3 Gel 5 – Subject 1S, 2
Figure 3-46 CyDye3 Staining for All Gels
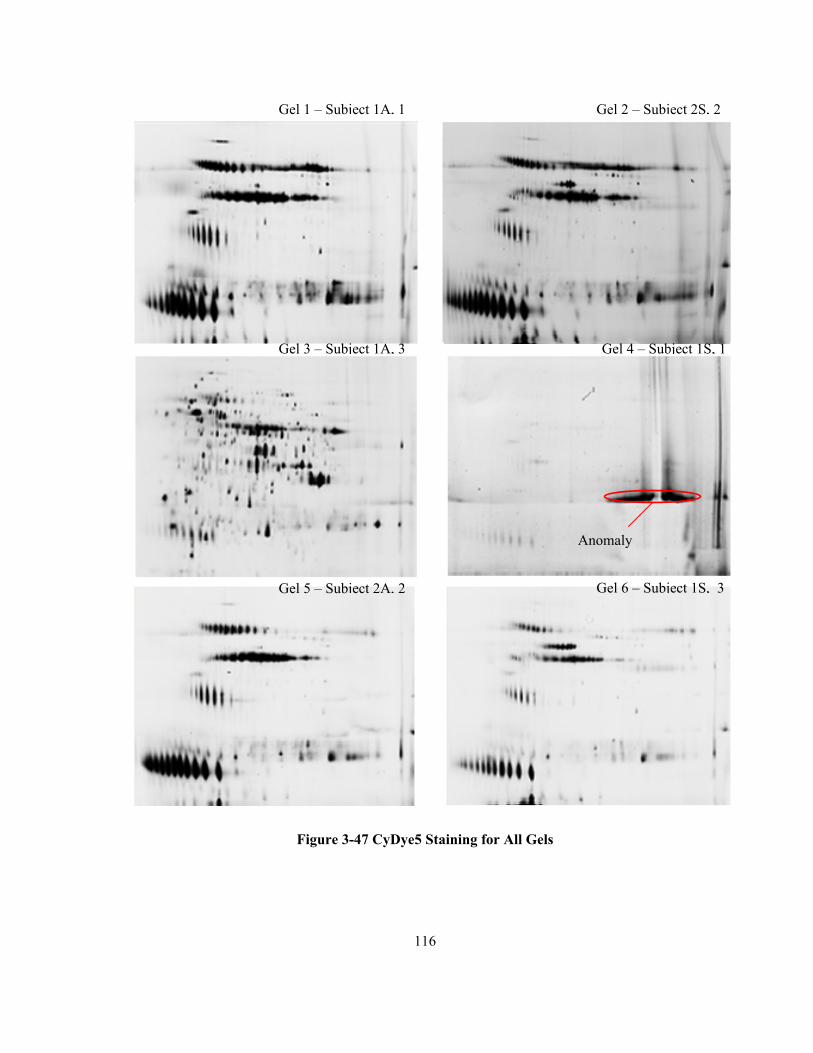
116
Gel 1 – Subject 1A, 1 Gel 2 – Subject 2S, 2
Gel 3 – Subject 1A, 3 Gel 4 – Subject 1S, 1
Anomaly
Gel 6 – Subject 1S, 3Gel 5 – Subject 2A, 2
Figure 3-47 CyDye5 Staining for All Gels
117
The images were then compared using the program Imagemaster and DeCyder, which ran
algorithms to match up the relative spots to their counterparts on the other gels. The software was
able to pick up spots too faint for the human eye to detect and indicate whether or not the match
was statistically significant. The spots that were found were then double checked by a technician to
ensure that the significance was not occurring from a speck of dust that happens to be in the same
relative place. One image that was found to be completely different from all others was that of
subject 1S in combination with the CyDye5 scan. The possible reason this occurred may be due to
improper loading technique or contamination, which would cause the overexpression seen.
However it is possible an insufficient mixing and binding of the dye to the proteins within the
sample might have also been a problem.
The first comparison that was looked at was between the symptomatic and asymptomatic
groups, and whether or not there were any statistically significant differences in protein volume
found. Through the use of the inherent ANOVA analysis of the program, it was shown that there
were no statistically significant points between either the symptomatic or asymptomatic groups (all
spots p>0.1).
However, qualitatively there seems to be two different types of gels that occurred both
within and between the symptomatic and asymptomatic groups as is seen between 1A3Cy3 and
1S2Cy3 as compared to 2S1Cy3 and 2S3Cy3 The two former gels look similar even though they
are from the different groups while the two latter groups look similar, but different from the first
two. This may be a result of certain epithelial cells that may have adhered to the lens or possibly
bacterial/fungal cells that might be present from an infection. Since these similarities were seen in
both the symptomatic and asymptomatic groups, when all the data for each group was combined it
might explain why no statistically significant difference was found.
118
When comparing between the solutions more proteins were found to be statistically
significant. The computer algorithm compared the gels of all three solutions, which found 27 spots
that were significant (p<0.005). However when they were visually inspected it was determined that
they were either flecks of dust on the glass or the computer made an incorrect position match
between proteins on the different gels. The computer will attempt to match proteins based on the
expression profile caused by the laser excitation on numerous gels, however it is still no perfect and
will match proteins that are obviously not the same when visually inspected. All the protein values
thought to be significant turned out to be false positives. Due to there being no significant
differences between the gels, it was decided that mass spectroscopy would not be used and a purely
qualitative comparison would be conducted on previous tear film papers. Mass spectroscopy is very
effective in determining the exact type of protein that is within a gel, and is especially powerful
when one protein is expressed in one sample while another is not. Since there was no significant
difference in protein expression found between the symptomatic or asymptomatic group, or
between the three solutions the idea of running a mass spectroscopy experiment was deemed not
worthwhile. For comparison purposes, the gel with the best resolution was used to exemplify the
proteins extracted from the contact lenses, even though all gels expressed the same proteins.
3.4.4 Protein Identification
The identification of the tear film proteins that were extracted from the contact lenses were
compared to the work of Molloy et al72 and Herber et al70 and numerous proteins were found to be
similar. These are laid out in Table 3-19. The proteins labeled 1-4 in Figure 3-48 represent von
Ebner’s gland tear protein, otherwise known as lipocalin. Just below these spots are 5-7, which are
separated by a dark horizontal band, are different isoforms of the same protein however these are
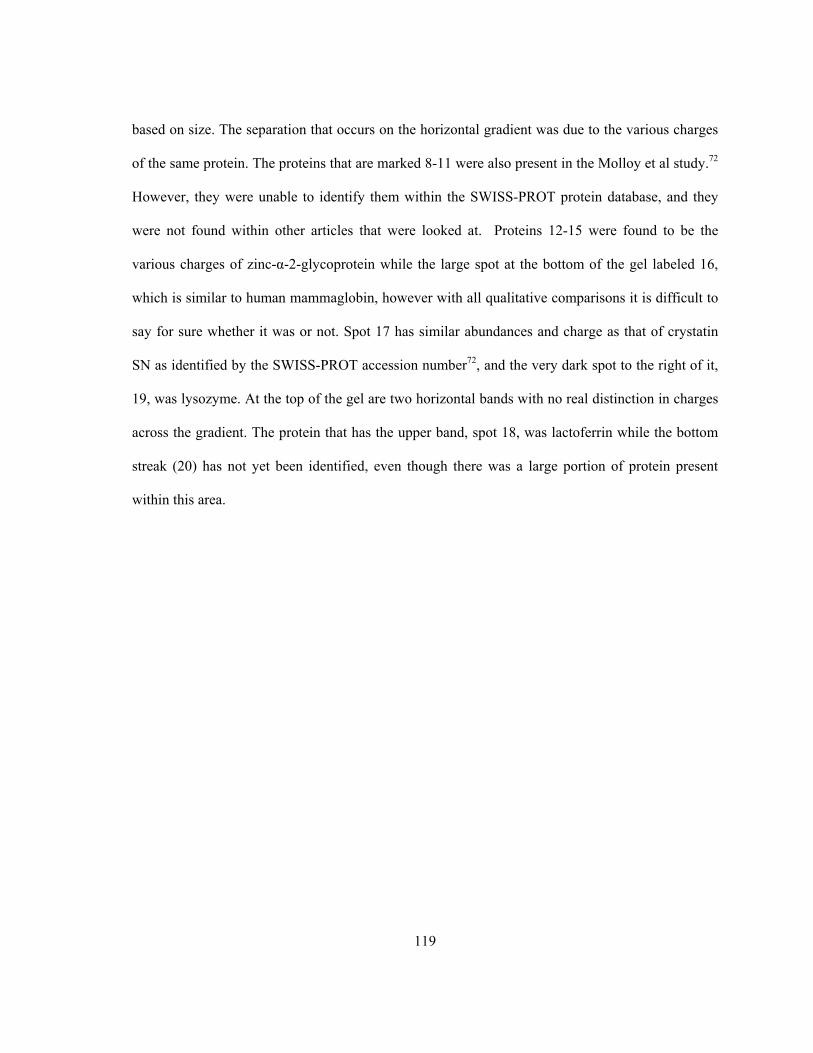
119
based on size. The separation that occurs on the horizontal gradient was due to the various charges
of the same protein. The proteins that are marked 8-11 were also present in the Molloy et al study.72
However, they were unable to identify them within the SWISS-PROT protein database, and they
were not found within other articles that were looked at. Proteins 12-15 were found to be the
various charges of zinc-α-2-glycoprotein while the large spot at the bottom of the gel labeled 16,
which is similar to human mammaglobin, however with all qualitative comparisons it is difficult to
say for sure whether it was or not. Spot 17 has similar abundances and charge as that of crystatin
SN as identified by the SWISS-PROT accession number72, and the very dark spot to the right of it,
19, was lysozyme. At the top of the gel are two horizontal bands with no real distinction in charges
across the gradient. The protein that has the upper band, spot 18, was lactoferrin while the bottom
streak (20) has not yet been identified, even though there was a large portion of protein present
within this area.
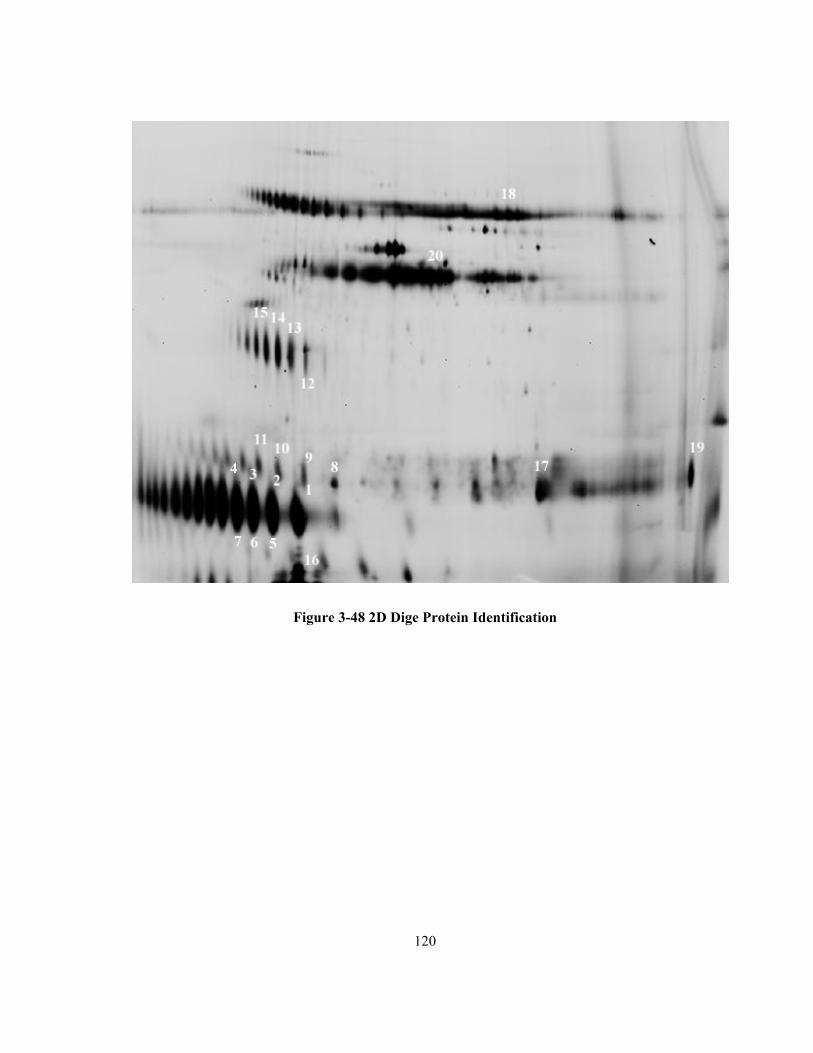
120
Figure 3-48 2D Dige Protein Identification
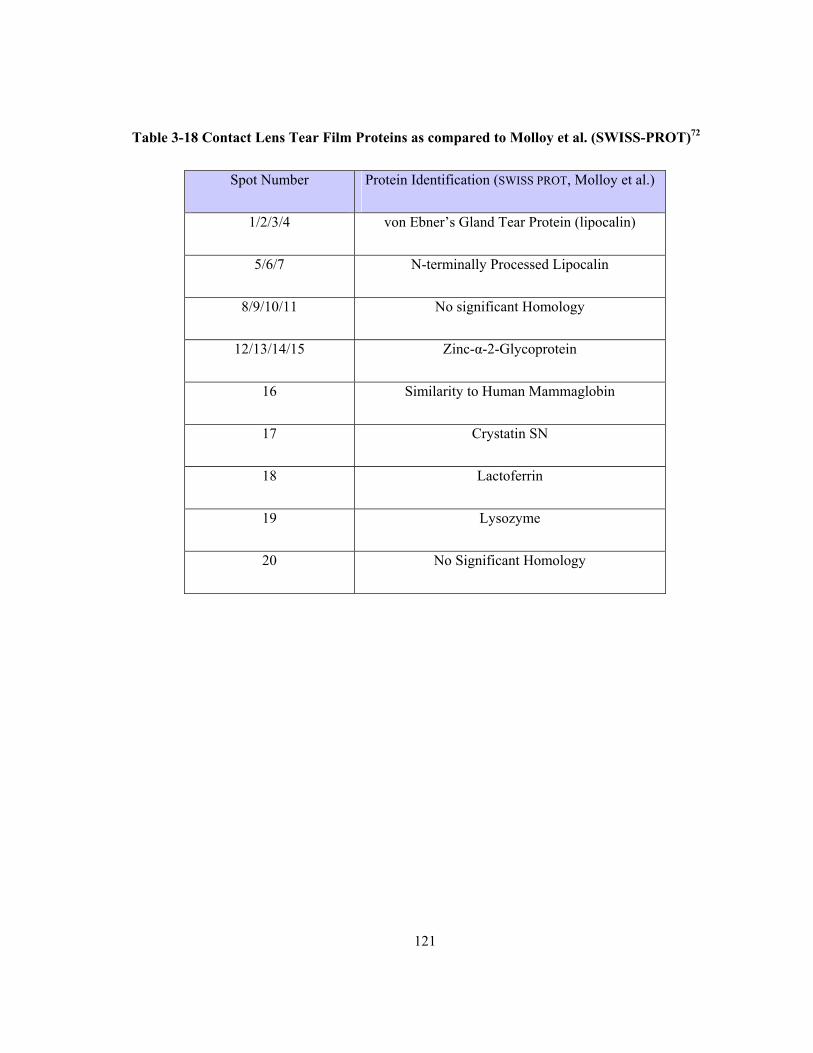
121
Table 3-18 Contact Lens Tear Film Proteins as compared to Molloy et al. (SWISS-PROT)72
Spot Number Protein Identification (SWISS PROT, Molloy et al.)
1/2/3/4 von Ebner’s Gland Tear Protein (lipocalin)
5/6/7 N-terminally Processed Lipocalin
8/9/10/11 No significant Homology
12/13/14/15 Zinc-α-2-Glycoprotein
16 Similarity to Human Mammaglobin
17 Crystatin SN
18 Lactoferrin
19 Lysozyme
20 No Significant Homology
122
Chapter 4
Summary and Further Work
The overall goal of this research was to examine modern day contact lenses and attempt to
clarify some of the factors that impact contact lens wettability and potentially comfort.
4.1 In Vitro Wettability Studies
The first studies undertaken were conducted to determine how long a lens should be soaked
for the relative surface active agents within the contact lens solutions to adequately bind to the lens
surface. The two lens types (pHEMA and siloxane-based) were soaked for 12, 24 or 48 hours. The
wettability of the silicone hydrogel material (lotrafilcon B; O2 Optix) when soaked in ReNu
MoistureLoc did not vary based upon the three soak times. It was seen that the shortest soaking
time was sufficient for the lens to become maximally wettable and that longer soak times did not
improve the wettability. Similar results were found for lotrafilcon B lenses soaked in OptiFree
Express.
When the polyHEMA-based material (etafilcon A; Acuvue 2) was soaked in ReNu
MoistureLoc there were significant differences between soak times, even though no “formal
pattern” could be established. The 12 hour soak time had the lowest contact angles at the beginning
of the cycling period, and this was potentially due to the surfactants present within the blister pack
not being completely rinsed off the lens in the short period of soaking time, while the 24 and 48
hour time periods allow for the blister solution to be rinsed away. The most significant of the results
seen in this experiment was that the etafilcon material soaked in OptiFree Express exhibited contact
angles with all three soak times of 0° through all subsequent saline cycling. It was apparent that the
surface active agents within OptiFree Express most probably bound tenaciously to the etafilcon
123
surface and were unable to be removed by saline cycling. 1 This was not the case with the ReNu
MoistureLoc care system, where the surfactants may have only adhered for short periods of time.
The next step of these in vitro experiments was to investigate the influence of a saline pre-
wash on lens wettability, to determine if packaging solutions had an effect on the subsequent
wettability measured. Lenses soaked in OptiFree Express had contact angles of 0° through all
cycles, regardless of the pre-cycling of the lenses. However, lenses soaked overnight in SoloCare
Aqua did display higher contact angles when previously soaked in saline. It would appear that
improved wettability offered by the blister pack solution was removed by the saline soak and thus
for some care regimens the lens packaging solution may be advantageous on the first day of wear.
Subsequent in vitro studies investigated the wettability of numerous contact lenses directly
from their packaging solutions, as well as after soaking in various care solutions. The first group of
pHEMA-based lens materials to be analyzed was the daily disposable lenses. The two major trends
seen were the constant rising or plateauing of contact angles, as seen in Figure 3-6. The two FDA
group II lenses tended to exhibit contact angles at approximately 65°, while the two FDA group IV
lenses continued rising though the last saline cycle. The difference between these two lenses was
that group II lenses have no charge (non-ionic), while the group IV lenses are charged (ionic). The
interaction between the saline and the charged surface caused a further dewetting of the lens, which
did not occur with the group II lenses. One possible explanation for this is the chain rotations that
occur within the Type IV lenses which continue to re-orientate themselves possibly due to the
charge within the lens itself from the MAA. As the lens was continually cycled these groups
continue to flip their hydrophobic ends towards the surface of the lens, which was seen as less
spreading of the drop from the OCA, in turn leading to successively higher contact angles. The
group II lenses with no charge might simply be losing whatever surfactant had adhered to the
124
surface of the lens, at which point they plateau since there was no major rotating of the polymers
within the matrix.
When investigating the silicone hydrogel lenses directly out of the pack, two important
trends were seen. The first was that the only lens that had a highly wettable surface was the
galyfilcon material (Acuvue Advance). This possibly occurs because of the surfactants within the
blister pack, which remain on the lens for the initial contact angle assessment. However, these were
rapidly washed away after one cycle in saline (see Figure 3-7). The second important trend was the
separation of the groups of lenses into those that are above 100° and those that hover near 60°. The
three lens types that have the higher contact angles either have no surface treatment (galyfilcon A
and senofilcon A) or a surface treatment that leaves a large amount of silicone still exposed
(balafilcon A), which might be repelling any water placed on its surface. The other two lenses
(lotrafilcon A and lotrafilcon B) have a plasma surface treatment that completely hides the silicone
undersurface, which in turns results in lower contact angles.
Examining the results seen when the galyfilcon material (Acuvue Advance) was soaked in
all solutions, the most interesting result comes from the SoloCare Plus solution, which gives a
lower contact angle than all other products (see Figure 3-8). Even though this solution was no
longer on the market it shows that these silicone hydrogel materials can be manipulated and
changed to produce a lower contact angle. A similar result was also seen for the senofilcon (Acuvue
Oasys) and balafilcon (Purevision) lenses (see Figures 3-11 and 3-12).
Lotrafilcon A (Focus Night and Day) and lotrafilcon B (O2 Optix) exhibited similar results
to each other (they have identical surface treatments) but very differing results to the other silicone
hydrogels, due to their unique surface treatment. ReNu MoistureLoc gave the lowest contact angles
for the lotrafilcon A material, while lower contact angles were found for lotrafilcon B with
125
OptiFree and ClearCare. Even though the lenses have the same surface treatment, they differ in
their water content, with the lotrafilcon B material having 33% and lotrafilcon A having 24%. The
various surfactants within each of the solutions are most likely penetrating differently into each of
the lenses due to this difference in water content, resulting in different contact angles.
The most important aspect of this component was that most of the solutions managed to
reduce the initial contact angle. Even though the substantivity was not very long lasting, it still
demonstrates that various solutions can make the lens more wettable for initial insertion, which
may make them more comfortable. However, further work on the influence of presoaking lenses in
various solutions or packaging solutions is warranted.
The final group of lenses examined in these in vitro studies was the multi-use pHEMA-
based materials. Two of these lens materials (omafilcon; Proclear and alphafilcon; Soflens 66)
behaved very similarly to the lenses tested previously, with the SoloCare Plus solution once again
having the greatest impact upon the wettability. The third lens material (etafilcon; Acuvue 2)
demonstrated an unusual and highly specific interaction between its polymer surface and the
surface active agents within one solution. When soaked for even short periods of time in OptiFree
Express, the surface becomes highly wettable and the surfactants within OptiFree Express cannot
easily be removed, despite soaking for many saline cycles (Figure 3-15).
One important aspect regarding all the lens materials, and it was especially visible with the
etafilcon A material, was the variation in contact angles measured and the relatively large standard
errors (see Figure 3-15). This has possibly been explained as the molecular motion and relaxation
that polymeric materials exhibit. 86 The purpose behind the rotations of the hydrophilic-to-
hydrophobic groups and back again was to minimize the amount of surface free energy present
within the system.34 When there was a solution present on that surface, the polymer will again react
126
accordingly in order to bring the surface free energy to its lowest possible point. The reason that
this can change on a contact lens may be due to the surfactants that were present on the lens
becoming bound and unbound while the dynamic hydrogel material flips between hydrophilic and
hydrophobic groups. Due to the nature of hydrogels and the interactions that occur with solutions,
there was going to be a certain degree of error within most of the combinations.
4.2 Ex Vivo Wettability Studies
Some preliminary studies were initially undertaken to investigate if the use of latex gloves
to remove lenses had any impact on lens wettability. This was important to consider as skin lipids
and other contaminants coming into contact with the lens surface during removal could affect
wettability. It was determined that the use of latex gloves in the ex vivo studies did not have a
detrimental effect upon the contact angles subsequently assessed.
A second preliminary study was conducted to determine if the various stages of the out-of-
eye/rinse/soak steps would interfere with subsequent contact angle measurement. None of the
measurements impacted upon the following stage in the process, most importantly, the rinse step
did not adversely affect the soak steps results, for those were the measurements that were used in all
subsequent clinical studies.
The final ex vivo preliminary study was an investigation looking at the impact of
wettability on the galyfilcon A silicone hydrogel material, following a period of soaking overnight
in two care regimens. The lenses were then worn for a period of time (4 hours), after which lenses
were removed and comfort and wettability measured. This study was the first to bring in the aspect
of comfort as it relates to wettability. As the results point out (Figures 3-22 and 3-23), there was no
statistically significant difference regarding the wettability of the two soaked lenses, however there
127
was difference in comfort. This difference in comfort can most likely be attributed to the small
sample size as opposed to actual differences of soaking solutions.
4.3 Ex Vivo Clinical Trial Assessment of Lens Wettability
The clinical trials were the culmination of all the previous work, with the goal of
comparing the wettability of numerous lenses in a clinical setting, while also testing for the comfort
while these lenses were being worn.
In a silicone hydrogel study (see Section 3.3.1), two different silicone hydrogel lens
materials were worn in a contralateral fashion for one month, after which wettability and comfort
were assessed. This study showed that newer silicone hydrogel lens materials were more wettable
than older materials, however no statistically significant difference could be found regarding
comfort. A correlation was found to exist between the less wettable surface having a lower comfort
rating, however there was no correlation regarding the more wettable surface having higher comfort
scores. These correlations may be related to the material properties such as modulus, since lenses
with a higher modulus may be more noticeable in the eye, resulting in lower comfort. In this case
the higher modulus material also happened to have high contact angles, however they may not be
related.
The final clinical study, which used a conventional polyHEMA-based material, was a
comprehensive look at one lens type (etafilcon A), in three various solutions, one of which was
known to make the lens more wettable (OptiFree Express), while the other two do not. Subjects
were either asymptomatic or symptomatic of dryness when wearing lenses.
Ex vivo wettability was assessed in three ways. During the immediate “out-of-eye method”,
in which lenses were examined immediately upon removal from the eye, no difference in contact
angle was seen between the three solutions or the two subject groups over time. However when
128
subjects and care regimen data were all collapsed into one group, with variations in time alone
being investigated, a difference was seen at the six and eight hour measurements, with reduced
wettability being seen at these points in time. This was to be expected since the lens was losing
whatever increased wettability it had gained from the care solution, in addition to the dewetting
influence of the deposited proteins and lipids from the tear film on the surface of the lens. SoloCare
Aqua was the only solution that was statistically different from the other two solutions, however
only by a few degrees. The only solution that came close to being similar to its actual in vitro
angles was the OptiFree solution, while the other two were much lower than expected. It was seen
from this work that contact angles obtained immediately upon removal of the lens from the eye will
have a lower value than in vitro lab measures possibly due to a residual tear film remaining on the
surface. Similar to placing a drop of water onto an already wet surface, the angles may not always
be representative of actual values.
To remove this adhered tear film, lenses were briefly rinsed in saline, resulting in the “rinse
method” data. Once again there were no statistical differences between groups, however the
difference between solutions became more apparent and more closely matched the in vitro work. At
this stage all three solutions had contact angles that were statistically different from each other, with
the OptiFree solution showing that the surfactants present were most likely better able to bind to the
etafilcon material and provide a more wettable surface. The other two solutions showed that they
were unable to bind to the lens for a substantial period of time (one saline cycle), as shown in the
previous in vitro studies.
The final “soak method” results provided the most obvious differences between products.
Using this method a statistically significant difference was found over time between the OptiFree
solution and the other two products. However, no difference was seen between the two subject
groups. The last comparison of solutions when all times and groups were collapsed together shows
129
how the only solution that had an impact upon the lens was OptiFree Express. The other two
solutions, as seen in the in vitro work (Figure 3-16) match up very closely with the ex vivo angles,
but the OptiFree soaked lenses were higher than would be expected. This was believed to be due to
the adhesion of proteins and other tear film components to the surface of the lens 58 that can change
the wettability of the surface.3
4.4 Protein Deposition Studies
The goal behind the 2D-DIGE protein work was to determine if it was possible to map
proteins extracted from worn contact lenses by this method, and if successful, determine any
differences in protein expression between a small sample of symptomatic and asymptomatic
groups, and between three care solutions.
Through the preliminary protein assay and ensuing silver stain, it was seen that proteins
could be processed using this methodology, hence the CyDye technique was applied to the actual
samples. Knowing that protein deposition on lenses increases with time 61 this now gives a great
opportunity to discover what possible proteins may cause discomfort for the wearer. Unfortunately,
because no proteins were found to exist in the symptomatic lenses as opposed to the asymptomatic
lenses, mass spectroscopy was not conducted.
Since this was a preliminary study to determine if two-dimensional difference gel
electrophoresis (2D-DIGE) was capable of this sort of analysis, the sample size was also kept small.
Due to this small size there was not enough comparative data in order to conclude definitively that
the group or solution had an impact upon the protein patterns. Possible suggestions for further work
would require the separation of group and solution into their own distinct studies, or increasing the
number of replicates. Even having the three solutions may have created too much variability within
130
this specific study with such a small sample size in order for statistical agreement to occur, and
cutting out solutions and increasing the number or subjects would help resolve these issues.
This was a great step in the direction of utilizing an extremely powerful tool within contact
lens research. There have been a few papers published utilizing this method to examine the tear
film, 70-72 yet none to date involving contact lenses and extracted tear proteins. The use of this
method may result in greater localization of protein expression for contact lens wearers who suffer
from complications to wear.
131
4.5 Summary
This thesis has demonstrated that contact angle analysis is a useful indicator of hydrogel
material wettability. Research to date suggests that in vitro analysis is a good predictor of ex vivo
performance but further work in this area is warranted, particularly with novel materials and care
systems.
First generation silicone hydrogel materials that have not been surface treated in order to
mask the inherent nature of this material (such as galyfilcon and senofilcon) are more hydrophobic
than their pHEMA counterparts. Newer silicone hydrogel materials (such as comfilcon) exhibit
good wettability, despite not having a surface treatment.
Silicone-based materials can benefit from being soaked in certain care solutions. Some
solutions work preferentially with certain lenses.
Contact angles and comfort seem to be linked in certain circumstances.
Proteins can be extracted from contact lenses and identified via 2d-DIGE. However, larger
studies need to be run in order to determine the impact of “solutions/symptoms and proteins” and
how they correlate to comfort.
132
References
1. Ketelson, H. and e. al., Dynamic wettability properties of a soft contact lens hydrogel. Colloids and Surfaces B: Biointerfaces, 2005(40): p. 1-9.
2. Cheng, L., S.J. Muller, and C.J. Radke, Wettability of silicone-hydrogel contact lenses in the presence of tear-film components. Curr Eye Res, 2004. 28(2): p. 93-108.
3. Maldonado-Codina, C. and N. Efron, Dynamic wettability of pHEMA-based hydrogel contact lenses. Ophthalmic Physiol Opt, 2006. 26(4): p. 408-18.
4. Efron, N., Contact lens practice. 2002, Oxford; Boston: Butterworth-Heinemann. xvi, 502.
5. Nicolson, P.C., Continuous wear contact lens surface chemistry and wearability. Eye Contact Lens, 2003. 29(1 Suppl): p. S30-2; discussion S57-9, S192-4.
6. Young, G., Veys, J, et al., A multi-centre study of lapsed contact lens wearers. Ophthalmic and Physiological Optics, 2002. 22(6): p. 516-527.
7. Fonn, D., Preventing contact lens dropouts. Contact Lens Spectrum, 2002. 17(8): p. 26-32.
8. Schlanger, J., A study of contact lens failures. J Am Optom Assoc, 1993. 64(3): p. 220-224.
9. Doughty, M., Fonn, D, et al, A patient questionnaire approach to estimating the prevalence of dry eye symptoms in patients presenting to optometric practices across Canada. Optom Vis Sci, 1997. 74(8): p. 624-631.
10. Fonn, D., Discontinuation of contact lens wear and its effect on the growth of the business. Contact Lens Spectrum (supple). 1996. 11(9): p. 4-5.
11. Pritchard, N., Fonn,D, et al., Discontinuation of contact lens wear: a survey. Int Cont Lens Clin, 1999. 26: p. 157 - 162.
12. Wichterle, O., Lim, D, Hydrophilic gels for biological use. Nature, 1960. 185: p. 117-118.
13. Tighe, B., Soft lens materials. In: N. Efron, eds. Contact lens practice. 2002, Oxford; Boston: Butterworth-Heinemann. 71-84.
14. Sweeney, D.F., Clinical signs of hypoxia with high-Dk soft lens extended wear: is the cornea convinced? Eye Contact Lens, 2003. 29(1 Suppl): p. S22-5; discussion S26-9, S192-4.
15. Nicolson, P., Vogt, J, Soft contact lens polymers: an evolution. Biomaterials, 2001. 22: p. 3273-3283.
16. Franklin, V., Bright, A, Pearce, E, Tighe, B, Hydrogel lens spoilation Part 5: Tear proteins and proteinaceous films. Optician, 1992. 204: p. 16-26.
133
17. Wedler, F., Illman, BL, Horensky, DS, Mowrey-McKee, K, Analysis of protein and mucin components deposited on hydrophilic contact lenses. Clin Exp Optom, 1987. 70: p. 59-68.
18. Wedler, F.C., Analysis of biomaterials deposited on soft contact lenses. J Biomed Mater Res, 1977. 11(4): p. 525-35.
19. Bohnert, J.L., et al., Adsorption of proteins from artificial tear solutions to contact lens materials. Invest Ophthalmol Vis Sci, 1988. 29(3): p. 362-73.
20. Castillo, E.J., et al., Protein adsorption on hydrogels. II. Reversible and irreversible interactions between lysozyme and soft contact lens surfaces. Biomaterials, 1985. 6(5): p. 338-45.
21. Garrett, Q., R.W. Garrett, and B.K. Milthorpe, Lysozyme sorption in hydrogel contact lenses. Invest Ophthalmol Vis Sci, 1999. 40(5): p. 897-903.
22. Sack, R.A., et al., Specificity and biological activity of the protein deposited on the hydrogel surface. Relationship of polymer structure to biofilm formation. Invest Ophthalmol Vis Sci, 1987. 28(5): p. 842-9.
23. Jones, L., Dumbleton, K., Silicone hydrogel contact lenses: Part 1 Evolution and current status. Optometry Today, 2002. 42: p. 26-31.
24. Jones, L., Modern contact lens materials: A clinical performance update. Contact Lens Spectrum, 2002. 17: p. 24-35.
25. Senchyna, M., et al., Quantitative and conformational characterization of lysozyme deposited on balafilcon and etafilcon contact lens materials. Curr Eye Res, 2004. 28(1): p. 25-36.
26. Grobe, G., Surface engineering aspects of silicone-hydrogel lenses. Contact Lens Spectrum (supple). 1999: p. 14-17.
27. Steffen, R., Schnider, CM, A next generation silicone hydrogel lens for daily wear. Part 1 - Material properties. Optician, 2004. 227: p. 23-25.
28. Gonzalez-Meijome, J.M., et al., Microscopic observation of unworn siloxane-hydrogel soft contact lenses by atomic force microscopy. J Biomed Mater Res B Appl Biomater, 2006. 76(2): p. 412-8.
29. Franklin, A., Stiffness and elasticity of contact lens materials. Optician, 2004. 227: p. 27-34.
30. Szczesna, D.H., et al., Interferometric measurements of dynamic changes of tear film. J Biomed Opt, 2006. 11(3): p. 34028.
31. Wang, J., et al., Precorneal and pre- and postlens tear film thickness measured indirectly with optical coherence tomography. Invest Ophthalmol Vis Sci, 2003. 44(6): p. 2524-8.
134
32. Fatt, I., Prentice Medal lecture: contact lens wettability--myths, mysteries, and realities. Am J Optom Physiol Opt, 1984. 61(7): p. 419-30.
33. Sarver M, B.L., Bauman E, DiMartino R, Lau D, Umeda W, Wettability of some gas-permeable hard contact lenses. ICLC, 1984. 11: p. 479-488.
34. Tonge, S., et al., The ex vivo wettability of soft contact lenses. Curr Eye Res, 2001. 23(1): p. 51-9.
35. Zhang, W., Walgren, M, Sivik, B, Membrane Characterization by the Contact Angle Technique II. Characterization of UF-Membranes and Comparison between the Captive Bubble and Sessile Drop as Methods to obtain Water Contact Angles. Desalination, 1989. 72: p. 263-273.
36. Holly, F. and M. Refojo, Wettability of hydrogels 1. Poly(2-hydroxyethyl methacrylate). J Biomed Mater Res, 1975. 9: p. 315–326.
37. Manuj, K., et al., Efficacy of contact lens disinfecting solutions against Staphylococcus aureus and Pseudomonas aeruginosa. Eye Contact Lens, 2006. 32(4): p. 216-8.
38. Update: Fusarium keratitis--United States, 2005-2006, in MMWR Morb Mortal Wkly Rep. 2006. p. 563-4.
39. Khor, W.B., et al., An outbreak of Fusarium keratitis associated with contact lens wear in Singapore. Jama, 2006. 295(24): p. 2867-73.
40. Florakis, G.J., et al., Scanning slit confocal microscopy of fungal keratitis. Arch Ophthalmol, 1997. 115(11): p. 1461-3.
41. Keyhani, K., et al., The incidence of fungal keratitis and endophthalmitis following penetrating keratoplasty. Cornea, 2005. 24(3): p. 288-91.
42. Rosa, R.H., Jr., D. Miller, and E.C. Alfonso, The changing spectrum of fungal keratitis in south Florida. Ophthalmology, 1994. 101(6): p. 1005-13.
43. Lievens, C.W., N. Hakim, and A. Chinn, The effect of multipurpose solutions on the ocular surface. Eye Contact Lens, 2006. 32(1): p. 8-11.
44. Dogru, M., et al., Tear function and ocular surface changes in keratoconus. Ophthalmology, 2003. 110(6): p. 1110-8.
45. Lemp, M.A., et al., The precorneal tear film. I. Factors in spreading and maintaining a continuous tear film over the corneal surface. Arch Ophthalmol, 1970. 83(1): p. 89-94.
46. Canada, G.o. Contact Lens Disinfectants. Non-Prescription Drugs: Category IV Monograph 1996 [cited; Available from: http://www.hc-sc.gc.ca/dhp-mps/prodpharma/applic-demande/guide-ld/cat-iv-mono/len_cat4_e.html.
135
47. Leung, P., M.V. Boost, and P. Cho, Effect of storage temperatures and time on the efficacy of multipurpose solutions for contact lenses. Ophthalmic Physiol Opt, 2004. 24(3): p. 218-24.
48. Beattie, T.K., et al., Determination of amoebicidal activities of multipurpose contact lens solutions by using a most probable number enumeration technique. J Clin Microbiol, 2003. 41(7): p. 2992-3000.
49. Codling, C.E., J.Y. Maillard, and A.D. Russell, Performance of contact lens disinfecting solutions against Pseudomonas aeruginosa in the presence of organic load. Eye Contact Lens, 2003. 29(2): p. 100-2.
50. McGrath, D., et al., Comparative antimicrobial activity of no-rub multipurpose lens care solutions in the presence of organic soil. Eye Contact Lens, 2003. 29(4): p. 245-9.
51. Brennan, N.A. and M.L. Coles, Extended wear in perspective. Optom Vis Sci, 1997. 74(8): p. 609-23.
52. Rosen, M.J., Surfactants and interfacial phenomena. 3rd ed. 2004, Hoboken, N.J.: Wiley-Interscience. xiii, 444 p.
53. Aveyard, R., Adsorption at the Air/Liquid, Liquid/Liquid and Soli/Liquid Interface, in Surfactants, T.F. Tadros, Editor. 1984, Academic Press: London. p. 153-174.
54. Ullmann, F., et al. Ullmanns Encyclopaedia of Industrial Chemistry. 2005 [cited; Available from: http://link.library.utoronto.ca/eir/EIRdetail.cfm?Resources__ID=55578&T=R.
55. Minarik, L. and J. Rapp, Protein deposits on individual hydrophilic contact lenses: effects of water and ionicity. Clao J, 1989. 15(3): p. 185-8.
56. Hart, D.E., R.R. Tidsale, and R.A. Sack, Origin and composition of lipid deposits on soft contact lenses. Ophthalmology, 1986. 93(4): p. 495-503.
57. Jones, L., et al., Lipid and protein deposition of N-vinyl pyrrolidone-containing group II and group IV frequent replacement contact lenses. Clao J, 1997. 23(2): p. 122-6.
58. Jones, L., et al., An in vivo comparison of the kinetics of protein and lipid deposition on group II and group IV frequent-replacement contact lenses. Optom Vis Sci, 2000. 77(10): p. 503-10.
59. Nason, R.J., et al., Multisite comparison of contact lens modalities. Daily disposable wear vs. conventional daily wear in successful contact lens wearers. J Am Optom Assoc, 1994. 65(11): p. 774-80.
60. Bowers, R.W. and B.J. Tighe, Studies of the ocular compatibility of hydrogels. A review of the clinical manifestations of spoilation. Biomaterials, 1987. 8(2): p. 83-8.
136
61. Jones, L., et al., Spoilation and clinical performance of monthly vs. three monthly Group II disposable contact lenses. Optom Vis Sci, 1996. 73(1): p. 16-21.
62. Leahy, C.D., R.B. Mandell, and S.T. Lin, Initial in vivo tear protein deposition on individual hydrogel contact lenses. Optom Vis Sci, 1990. 67(7): p. 504-11.
63. Refojo, M., Leong, FL, Microscopic determination of the penetration of proteins and polysaccharides on poly- (hydroxyethylmethac) similar hydrogels. Journal of Polymer Science, Part C Polymer Symposium, 1979. 66: p. 227.
64. Minno, G.E., et al., Quantitative analysis of protein deposits on hydrophilic soft contact lenses: I. Comparison to visual methods of analysis. II. Deposit variation among FDA lens material groups. Optom Vis Sci, 1991. 68(11): p. 865-72.
65. Jones, L., et al., Lysozyme and lipid deposition on silicone hydrogel contact lens materials. Eye Contact Lens, 2003. 29(1 Suppl): p. S75-9; discussion S83-4, S192-4.
66. Gudmundsson, O.G., et al., Identification of proteins in contact lens surface deposits by immunofluorescence microscopy. Arch Ophthalmol, 1985. 103(2): p. 196-7.
67. McArthur, S.L., et al., XPS and surface-MALDI-MS characterisation of worn HEMA-based contact lenses. Biomaterials, 2001. 22(24): p. 3295-304.
68. Glasson, M., F. Stapleton, and M. Willcox, Lipid, lipase and lipocalin differences between tolerant and intolerant contact lens wearers. Curr Eye Res, 2002. 25(4): p. 227-35.
69. Willcox, M.D. and J. Lan, Secretory immunoglobulin A in tears:functions and changes during contact lens wear. Clin Exp Optom, 1999. 82(1): p. 1-3.
70. Herber, S., et al., Two-dimensional analysis of tear protein patterns of diabetic patients. Electrophoresis, 2001. 22(9): p. 1838-44.
71. Koo, B.S., et al., Comparative analysis of the tear protein expression in blepharitis patients using two-dimensional electrophoresis. J Proteome Res, 2005. 4(3): p. 719-24.
72. Molloy, M.P., et al., Establishment of the human reflex tear two-dimensional polyacrylamide gel electrophoresis reference map: new proteins of potential diagnostic value. Electrophoresis, 1997. 18(15): p. 2811-5.
73. Seal, D.V., The effect of ageing and disease on tear constituents. Trans Ophthalmol Soc U K, 1985. 104 (Pt 4): p. 355-62.
74. Unlu, M., M.E. Morgan, and J.S. Minden, Difference gel electrophoresis: a single gel method for detecting changes in protein extracts. Electrophoresis, 1997. 18(11): p. 2071-7.
75. Amersham-Biosciences, Ettan DIGE User Manual, in User Manual Proteomics. 2002, Amersham Biosciences: Buckinghamshire. p. 386.
137
76. Tonge, R., et al., Validation and development of fluorescence two-dimensional differential gel electrophoresis proteomics technology. Proteomics, 2001. 1(3): p. 377-96.
77. Wu, T.L., Two-dimensional difference gel electrophoresis. Methods Mol Biol, 2006. 328: p. 71-95.
78. Fodor, I.K., et al., Statistical challenges in the analysis of two-dimensional difference gel electrophoresis experiments using DeCyder. Bioinformatics, 2005. 21(19): p. 3733-40.
79. Subbaraman, L.N., et al., Rewetting drops containing surface active agents improve the clinical performance of silicone hydrogel contact lenses. Optom Vis Sci, 2006. 83(3): p. 143-51.
80. Keith, D., B. Hong, and M. Christensen, A novel procedure for the extraction of protein deposits from soft hydrophilic contact lenses for analysis. Curr Eye Res, 1997. 16(5): p. 503-10.
81. Tang, I.e.a., The pH of multi-purpose soft contact lens solutions. Optom Vis Sci, 1996(73): p. 746-749.
82. Tomlinson, A. and S. Khanal, Assessment of tear film dynamics: quantification approach. The Ocular Surface, 2005. 3(2): p. 81-95.
83. Tiffany, J.M., J.C. Pandit, and A.J. Bron, Soluble mucin and the physical properties of tears. Adv Exp Med Biol, 1998. 438: p. 229-34.
84. Pandit, J.C., et al., Physical properties of stimulated and unstimulated tears. Exp Eye Res, 1999. 68(2): p. 247-53.
85. BASF, Cremophor RH Grades Technical Leaflet, in ME 125e (848). 1992.
86. Andrade J., C.-Y., Probing polymer surface and interface dynamics. Surface and Interface Analysis, 1986. 8(6): p. 253-256.