Embed Size (px)
Citation preview
____________________________________
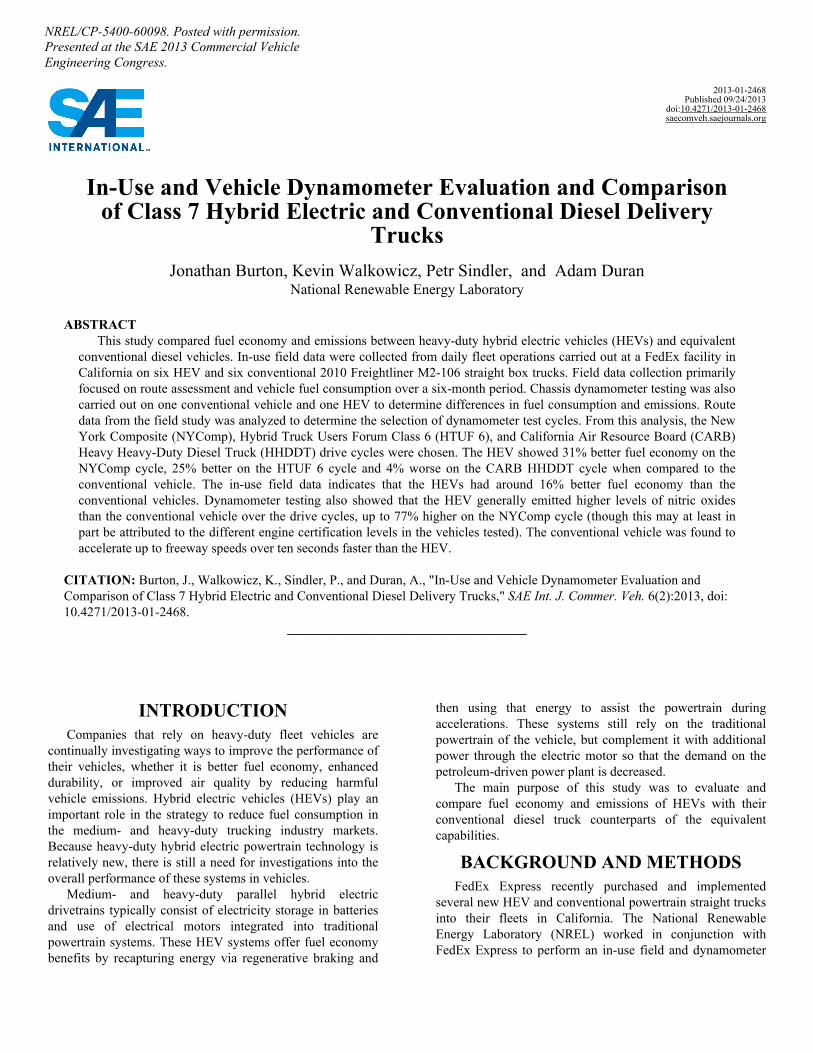
NREL/CP-5400-60098. Posted with permission. Presented at the SAE 2013 Commercial Vehicle Engineering Congress.
2013-01-2468 Published 09/24/2013
doi:10.4271/2013-01-2468saecomveh.saejournals.org
In-Use and Vehicle Dynamometer Evaluation and Comparisonof Class 7 Hybrid Electric and Conventional Diesel Delivery
TrucksJonathan Burton, Kevin Walkowicz, Petr Sindler, and Adam Duran
National Renewable Energy Laboratory
ABSTRACT This study compared fuel economy and emissions between heavy-duty hybrid electric vehicles (HEVs) and equivalent
conventional diesel vehicles. In-use field data were collected from daily fleet operations carried out at a FedEx facility in California on six HEV and six conventional 2010 Freightliner M2-106 straight box trucks. Field data collection primarily focused on route assessment and vehicle fuel consumption over a six-month period. Chassis dynamometer testing was also carried out on one conventional vehicle and one HEV to determine differences in fuel consumption and emissions. Route data from the field study was analyzed to determine the selection of dynamometer test cycles. From this analysis, the New York Composite (NYComp), Hybrid Truck Users Forum Class 6 (HTUF 6), and California Air Resource Board (CARB) Heavy Heavy-Duty Diesel Truck (HHDDT) drive cycles were chosen. The HEV showed 31% better fuel economy on the NYComp cycle, 25% better on the HTUF 6 cycle and 4% worse on the CARB HHDDT cycle when compared to the conventional vehicle. The in-use field data indicates that the HEVs had around 16% better fuel economy than the conventional vehicles. Dynamometer testing also showed that the HEV generally emitted higher levels of nitric oxides than the conventional vehicle over the drive cycles, up to 77% higher on the NYComp cycle (though this may at least in part be attributed to the different engine certification levels in the vehicles tested). The conventional vehicle was found to accelerate up to freeway speeds over ten seconds faster than the HEV.
CITATION: Burton, J., Walkowicz, K., Sindler, P., and Duran, A., "In-Use and Vehicle Dynamometer Evaluation andComparison of Class 7 Hybrid Electric and Conventional Diesel Delivery Trucks," SAE Int. J. Commer. Veh. 6(2):2013, doi:10.4271/2013-01-2468.
then using that energy to assist the powertrain during INTRODUCTION accelerations. These systems still rely on the traditional
Companies that rely on heavy-duty fleet vehicles are powertrain of the vehicle, but complement it with additional continually investigating ways to improve the performance of power through the electric motor so that the demand on the their vehicles, whether it is better fuel economy, enhanced petroleum-driven power plant is decreased.durability, or improved air quality by reducing harmful The main purpose of this study was to evaluate and vehicle emissions. Hybrid electric vehicles (HEVs) play an compare fuel economy and emissions of HEVs with their important role in the strategy to reduce fuel consumption in conventional diesel truck counterparts of the equivalentthe medium- and heavy-duty trucking industry markets. capabilities.Because heavy-duty hybrid electric powertrain technology is relatively new, there is still a need for investigations into the BACKGROUND AND METHODS overall performance of these systems in vehicles. FedEx Express recently purchased and implementedMedium- and heavy-duty parallel hybrid electric several new HEV and conventional powertrain straight trucks drivetrains typically consist of electricity storage in batteries into their fleets in California. The National Renewableand use of electrical motors integrated into traditional Energy Laboratory (NREL) worked in conjunction withpowertrain systems. These HEV systems offer fuel economy FedEx Express to perform an in-use field and dynamometer benefits by recapturing energy via regenerative braking and
Burton et al / SAE Int. J. Commer. Veh. / Volume 6, Issue 2(October 2013)
evaluation of many of the vehicles from this new fleet. The field evaluation took place in Ontario, California.
In-Use Field Evaluation Setup Vehicles with 2010 emissions certification levels were
evaluated in the field. These vehicles have diesel aftertreatment technology including diesel oxidation catalysts (DOCs), diesel particulate filters (DPFs), and selective catalytic reduction (SCR) systems in the exhaust. The Ontario, California, FedEx fleet included several 2010 Freightliner M2-106 Class 7 straight trucks that met these criteria. The fleet also included one HEV of the same make and model. Ontario was an ideal location for this evaluation as the fleet there operates over varying types of duty cycles, from city to highway driving.
Isaac Instruments DRU900/908 data loggers were deployed on 12 of the original Ontario vehicles in the fleet, including the one HEV, for three weeks. They recorded J1939 controller area network (CAN) bus communication and global positioning system (GPS) data as the FedEx drivers worked their usual daily routes. This data was then analyzed for drive cycle analysis, as described in the Drive™ Analysis section later.
After the drive cycle analysis was performed, five additional Freightliner M2-106s HEVs were transferred to Ontario from another FedEx Express location, making a total of six HEVs in the fleet. These six HEVs, in addition to six equivalent conventional diesel vehicles of the same make and model, were included in a six-month performance evaluation over routes selected for their representative kinetic intensities (KI) [1]. The drivers of these 12 vehicles were asked to complete fuel logs so that fuel economy comparisons could be made. Other maintenance records of vehicles included in the study were kept as well. Also, during the six-month study period, one conventional vehicle and one HEV recorded operational data with the Isaac loggers.
DRIVE™ Analysis NREL's Drive-cycle Rapid Investigation, Visualization,
and Evaluation (DRIVE™) analysis tool [2, 3] was used to filter and analyze the field data collected as part of the study. Employing NREL's DRIVE analysis tool, researchers were able to visualize collected drive cycle data to produce route maps using Google Earth software, which when coupled with daily vehicle mileage data, helped ensure high levels of data quality. In addition to data quality validation via route mapping and mileage distributions, NREL researchers employed DRIVE to analyze daily vehicle operation, producing a list of approximately 150 unique drive cycle metrics that were then used to characterize vehicle operating behavior and select representative chassis dynamometer test cycles. Drive cycle metrics calculated as part of the analysis ranged from vehicle energy level metrics such as kinetic power density consumed (watts per kilogram) and KI to high-level route descriptors such as average driving speed (mph) and stops per mile. All of the analytical metrics were
calculated using different variations of the fundamental road load equation. Due to a lack of reliable road grade and vehicle mass information, the effects of changes in road grade and vehicle mass were not included in calculations.
Chassis Dynamometer Testing Methods Chassis dynamometer test cycle selection
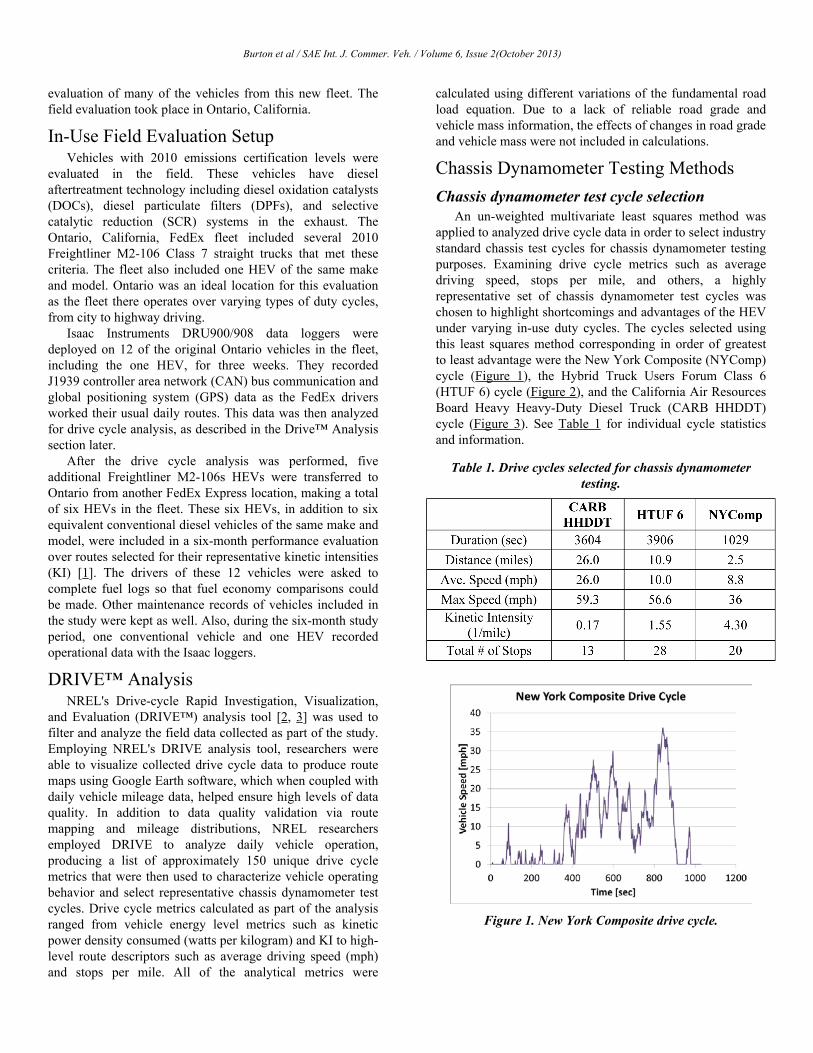
An un-weighted multivariate least squares method was applied to analyzed drive cycle data in order to select industry standard chassis test cycles for chassis dynamometer testing purposes. Examining drive cycle metrics such as average driving speed, stops per mile, and others, a highly representative set of chassis dynamometer test cycles was chosen to highlight shortcomings and advantages of the HEV under varying in-use duty cycles. The cycles selected using this least squares method corresponding in order of greatest to least advantage were the New York Composite (NYComp) cycle (Figure 1), the Hybrid Truck Users Forum Class 6 (HTUF 6) cycle (Figure 2), and the California Air Resources Board Heavy Heavy-Duty Diesel Truck (CARB HHDDT) cycle (Figure 3). See Table 1 for individual cycle statistics and information.
Table 1. Drive cycles selected for chassis dynamometer testing.
Figure 1. New York Composite drive cycle.
Burton et al / SAE Int. J. Commer. Veh. / Volume 6, Issue 2(October 2013)
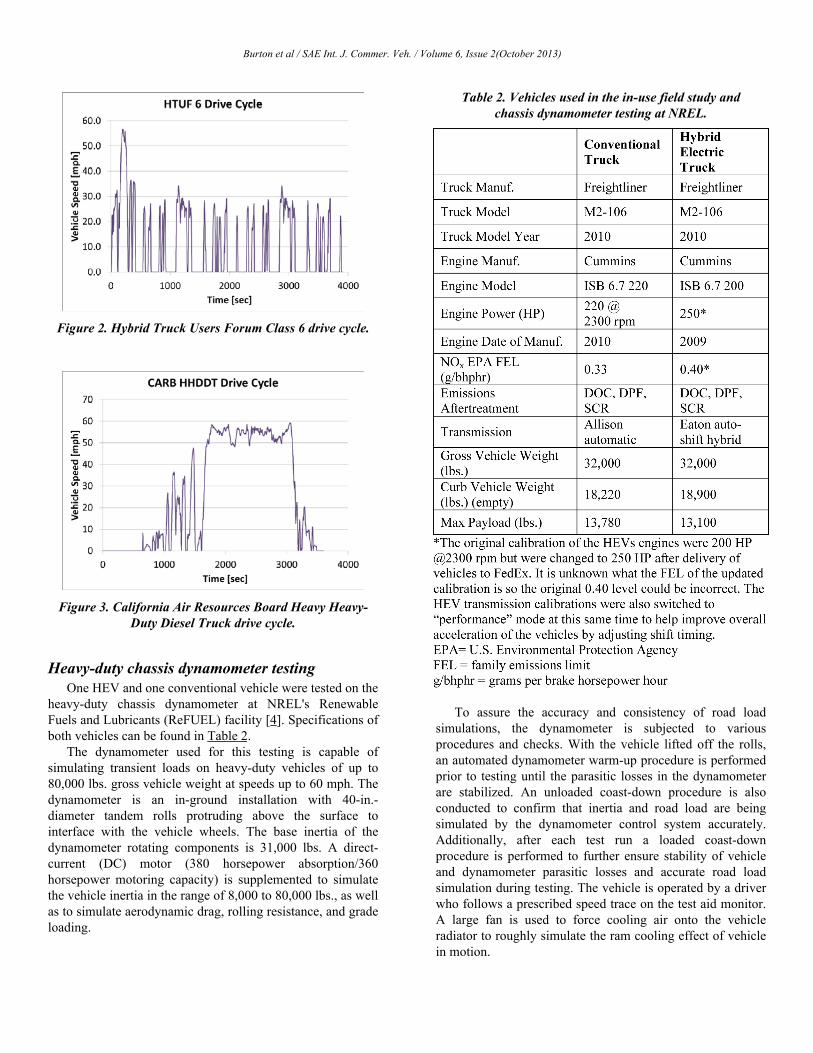
Figure 2. Hybrid Truck Users Forum Class 6 drive cycle.
Figure 3. California Air Resources Board Heavy Heavy-Duty Diesel Truck drive cycle.
Heavy-duty chassis dynamometer testing One HEV and one conventional vehicle were tested on the
heavy-duty chassis dynamometer at NREL's Renewable Fuels and Lubricants (ReFUEL) facility [4]. Specifications of both vehicles can be found in Table 2.
The dynamometer used for this testing is capable of simulating transient loads on heavy-duty vehicles of up to 80,000 lbs. gross vehicle weight at speeds up to 60 mph. The dynamometer is an in-ground installation with 40-in.-diameter tandem rolls protruding above the surface to interface with the vehicle wheels. The base inertia of the dynamometer rotating components is 31,000 lbs. A direct-current (DC) motor (380 horsepower absorption/360 horsepower motoring capacity) is supplemented to simulate the vehicle inertia in the range of 8,000 to 80,000 lbs., as well as to simulate aerodynamic drag, rolling resistance, and grade loading.
Table 2. Vehicles used in the in-use field study andchassis dynamometer testing at NREL.
To assure the accuracy and consistency of road load simulations, the dynamometer is subjected to various procedures and checks. With the vehicle lifted off the rolls, an automated dynamometer warm-up procedure is performed prior to testing until the parasitic losses in the dynamometer are stabilized. An unloaded coast-down procedure is also conducted to confirm that inertia and road load are being simulated by the dynamometer control system accurately. Additionally, after each test run a loaded coast-down procedure is performed to further ensure stability of vehicle and dynamometer parasitic losses and accurate road load simulation during testing. The vehicle is operated by a driver who follows a prescribed speed trace on the test aid monitor. A large fan is used to force cooling air onto the vehicle radiator to roughly simulate the ram cooling effect of vehicle in motion.
Burton et al / SAE Int. J. Commer. Veh. / Volume 6, Issue 2(October 2013)
Emissions measurement The chassis dynamometer lab uses a full-flow, constant
volume sampling dilution tunnel system. Engine intake air, which also serves as exhaust dilution air, is pre-conditioned for humidity, temperature, pressure, and HEPA filtered as per Code of Federal Regulation Part 86 and Part 1065 specifications [5]. The vehicle exhaust is transferred through an insulated pipe into an 18-in.-diameter stainless steel dilution tunnel where it is introduced to the pre-conditioned dilution air. The diluted exhaust is then passed through a static mixer and sampled far enough downstream to ensure thorough mixing. The flow rate in the dilution tunnel is controlled and metered using multiple critical flow venturis. The flow rate was set to 2,000 standard cubic feet per minute for this testing.
The diluted gaseous emissions samples were analyzed by a Horiba MEXA 7100DEGR bench. Total hydrocarbons (THC), oxides of nitrogen (NOx), oxygen (O2), carbon monoxide (CO), and carbon dioxide (CO2) were analyzed. The emissions analyzers are checked for zero, span, and background immediately before and after each test. The test results are then corrected using this information during the post processing of the data.
Fuel consumption measurement CARB ultralow-sulfur diesel reference fuel was used for
chassis dynamometer testing. Fuel consumption was measured by a gravimetric approach. The engine fuel supply and return lines were connected to a fuel container placed on an electronic scale. The fuel returning from the vehicle was cooled to maintain consistent temperatures. The scale mass measurements were recorded in real time on the data acquisition system. The scale used for this test was a Sartorius Midrics MAPP1U-60ED-L, which has an uncertainty error of 10 grams. Carbon balance calculations from the gaseous carbon exhaust emission constituents were also used to calculate fuel consumption and were compared against the scale measurements as a sanity check. The fuel economy results presented for chassis dynamometer testing are from the fuel scale.
HEV battery state of charge The SAE Recommended Practice J2711 procedure for
measuring fuel economy and emissions of hybrid-electric and conventional heavy-duty vehicles was used for this project. The standard provides protocols for HEV state-of-charge corrections for charge-sustaining HEVs to ensure that fuel economy and emissions data for an HEV are not unduly increased or decreased due to significant changes in energy storage levels over a single drive cycle. The procedure determines the percent change in the net energy of the hybrid energy storage system over each individual test cycle run. If the change is <1%, no correction is needed for any test results. If the change is >5%, the results are deemed invalid. However, if the storage energy change falls between 1% and
5%, a correction factor is applied to the resulting fuel economy and emissions results.
Data acquisition Temperatures, pressures, and other chassis dynamometer
test data is acquired using National Instruments laboratory equipment. The data is logged at a rate of 1 Hz.
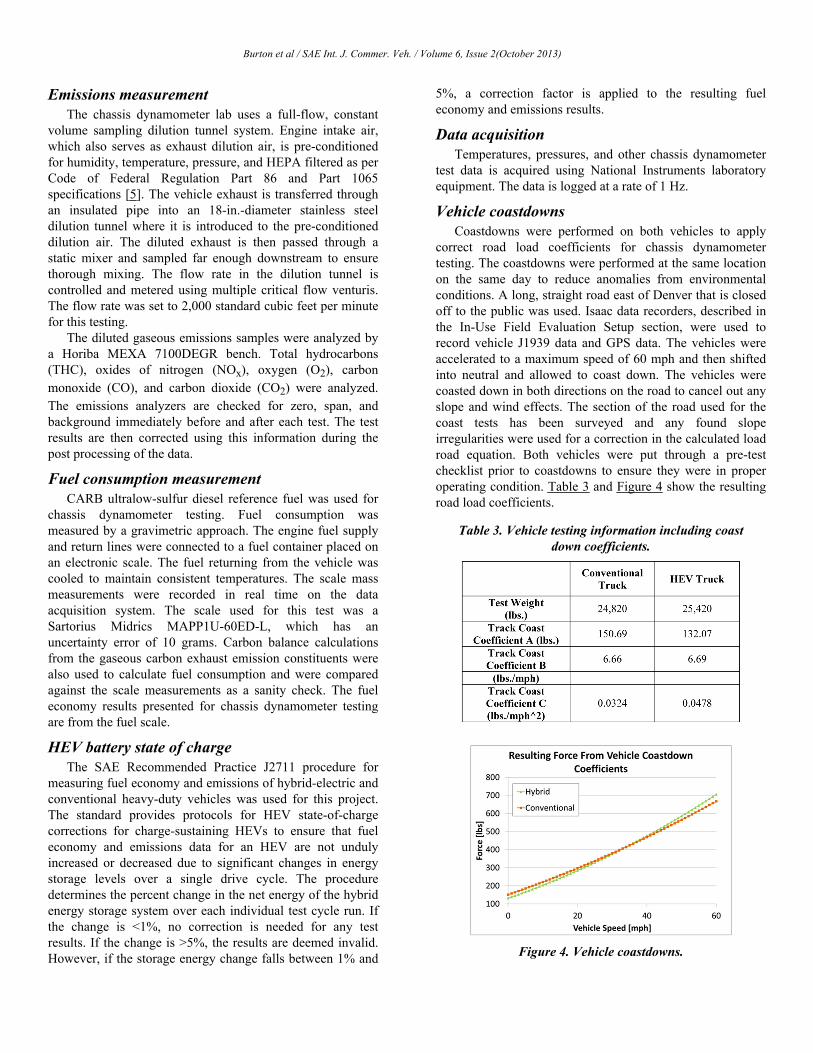
Vehicle coastdowns Coastdowns were performed on both vehicles to apply
correct road load coefficients for chassis dynamometer testing. The coastdowns were performed at the same location on the same day to reduce anomalies from environmental conditions. A long, straight road east of Denver that is closed off to the public was used. Isaac data recorders, described in the In-Use Field Evaluation Setup section, were used to record vehicle J1939 data and GPS data. The vehicles were accelerated to a maximum speed of 60 mph and then shifted into neutral and allowed to coast down. The vehicles were coasted down in both directions on the road to cancel out any slope and wind effects. The section of the road used for the coast tests has been surveyed and any found slope irregularities were used for a correction in the calculated load road equation. Both vehicles were put through a pre-test checklist prior to coastdowns to ensure they were in proper operating condition. Table 3 and Figure 4 show the resulting road load coefficients.
Table 3. Vehicle testing information including coast down coefficients.
Figure 4. Vehicle coastdowns.
Burton et al / SAE Int. J. Commer. Veh. / Volume 6, Issue 2(October 2013)
RESULTS Chassis Dynamometer Results
The two vehicles that were selected for chassis dynamometer testing were operated over the NYComp, HTUF 6, and HHDDT drive cycles, as described in the Background and Methods section.
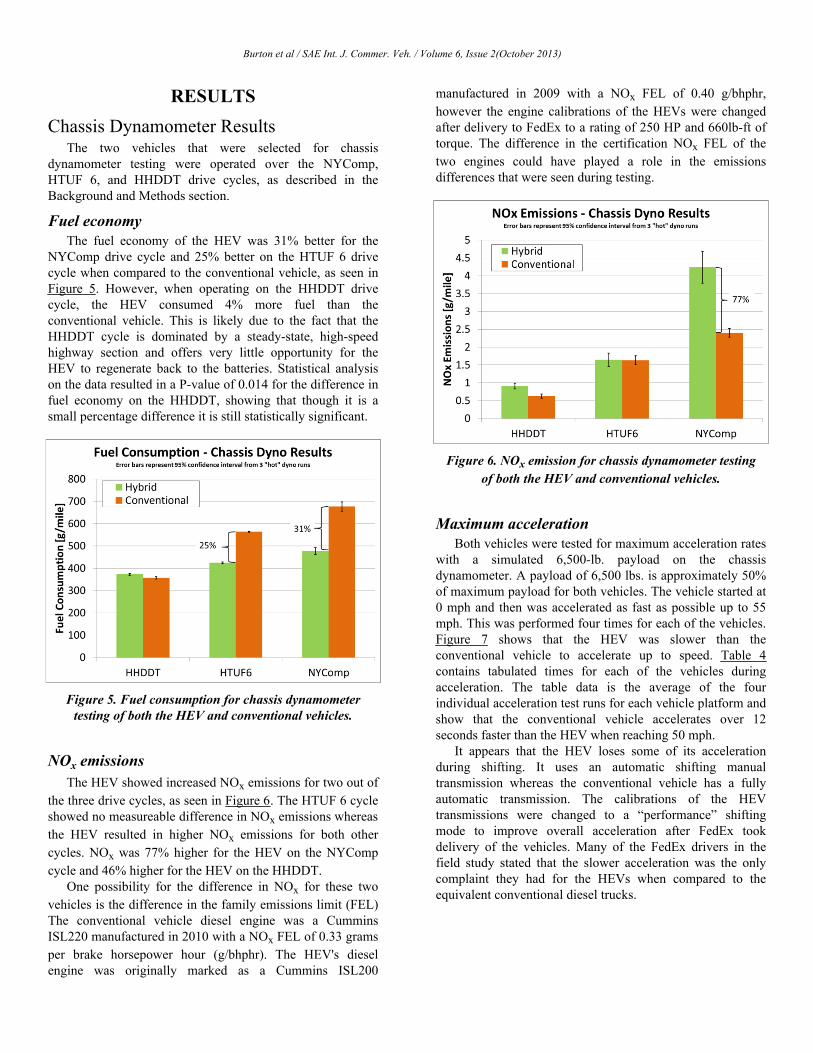
Fuel economy The fuel economy of the HEV was 31% better for the
NYComp drive cycle and 25% better on the HTUF 6 drive cycle when compared to the conventional vehicle, as seen in Figure 5. However, when operating on the HHDDT drive cycle, the HEV consumed 4% more fuel than the conventional vehicle. This is likely due to the fact that the HHDDT cycle is dominated by a steady-state, high-speed highway section and offers very little opportunity for the HEV to regenerate back to the batteries. Statistical analysis on the data resulted in a P-value of 0.014 for the difference in fuel economy on the HHDDT, showing that though it is a small percentage difference it is still statistically significant.
Figure 5. Fuel consumption for chassis dynamometer testing of both the HEV and conventional vehicles.
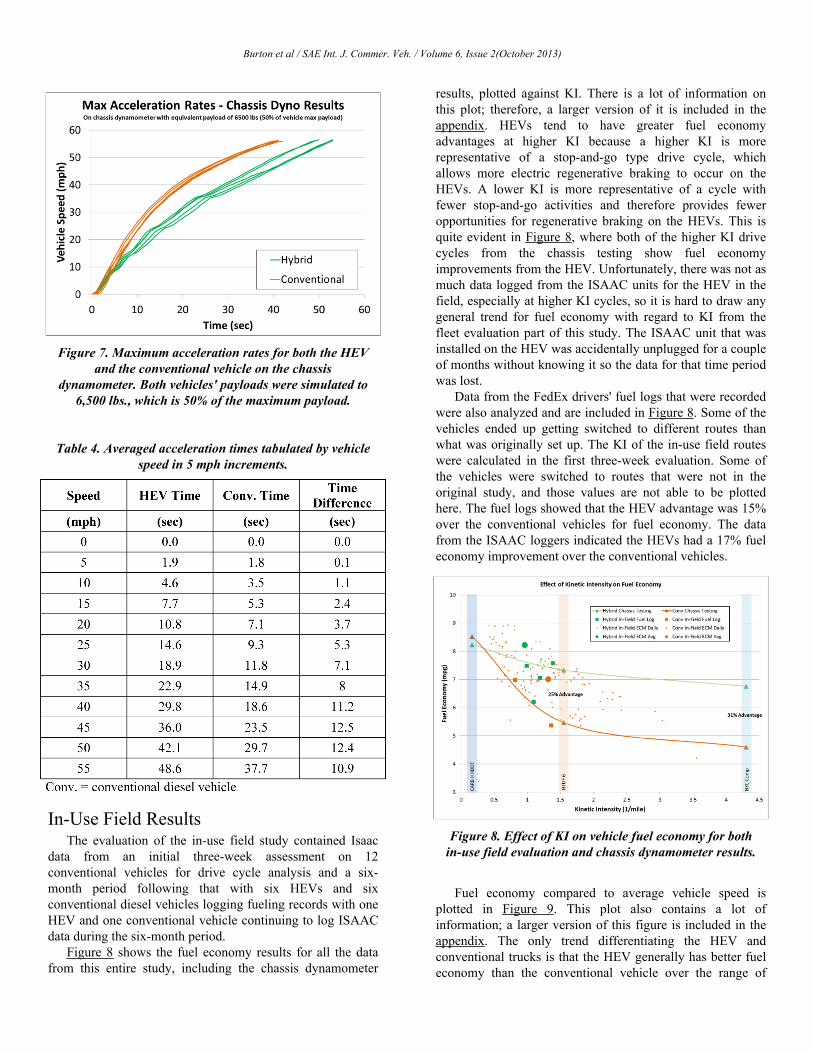
NOx emissions The HEV showed increased NOx emissions for two out of
the three drive cycles, as seen in Figure 6. The HTUF 6 cycle showed no measureable difference in NOx emissions whereas the HEV resulted in higher NOx emissions for both other cycles. NOx was 77% higher for the HEV on the NYComp cycle and 46% higher for the HEV on the HHDDT.
One possibility for the difference in NOx for these two vehicles is the difference in the family emissions limit (FEL) The conventional vehicle diesel engine was a Cummins ISL220 manufactured in 2010 with a NOx FEL of 0.33 grams per brake horsepower hour (g/bhphr). The HEV's diesel engine was originally marked as a Cummins ISL200
manufactured in 2009 with a NOx FEL of 0.40 g/bhphr, however the engine calibrations of the HEVs were changed after delivery to FedEx to a rating of 250 HP and 660lb-ft of torque. The difference in the certification NOx FEL of the two engines could have played a role in the emissions differences that were seen during testing.
Figure 6. NOx emission for chassis dynamometer testing of both the HEV and conventional vehicles.
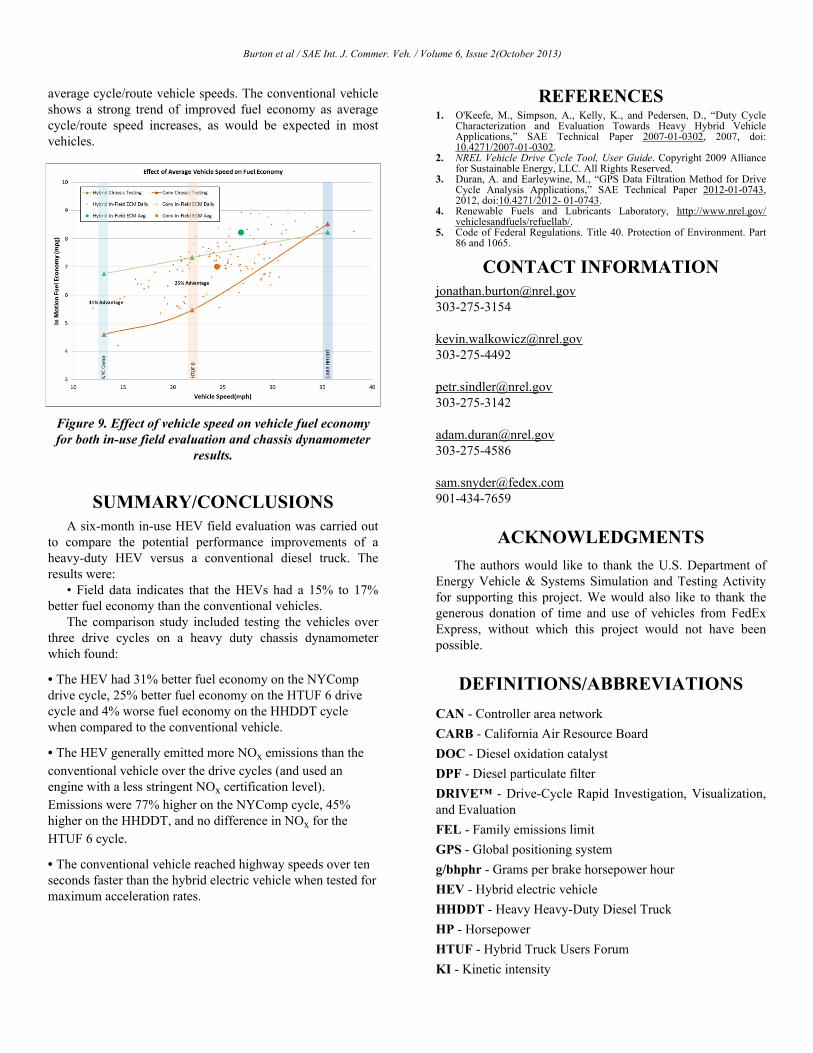
Maximum acceleration Both vehicles were tested for maximum acceleration rates
with a simulated 6,500-lb. payload on the chassis dynamometer. A payload of 6,500 lbs. is approximately 50% of maximum payload for both vehicles. The vehicle started at 0 mph and then was accelerated as fast as possible up to 55 mph. This was performed four times for each of the vehicles. Figure 7 shows that the HEV was slower than the conventional vehicle to accelerate up to speed. Table 4 contains tabulated times for each of the vehicles during acceleration. The table data is the average of the four individual acceleration test runs for each vehicle platform and show that the conventional vehicle accelerates over 12 seconds faster than the HEV when reaching 50 mph.
It appears that the HEV loses some of its acceleration during shifting. It uses an automatic shifting manual transmission whereas the conventional vehicle has a fully automatic transmission. The calibrations of the HEV transmissions were changed to a “performance” shifting mode to improve overall acceleration after FedEx took delivery of the vehicles. Many of the FedEx drivers in the field study stated that the slower acceleration was the only complaint they had for the HEVs when compared to the equivalent conventional diesel trucks.
Burton et al / SAE Int. J. Commer. Veh. / Volume 6, Issue 2(October 2013)
Figure 7. Maximum acceleration rates for both the HEV and the conventional vehicle on the chassis
dynamometer. Both vehicles' payloads were simulated to 6,500 lbs., which is 50% of the maximum payload.
Table 4. Averaged acceleration times tabulated by vehicle speed in 5 mph increments.
In-Use Field Results The evaluation of the in-use field study contained Isaac
data from an initial three-week assessment on 12 conventional vehicles for drive cycle analysis and a six-month period following that with six HEVs and six conventional diesel vehicles logging fueling records with one HEV and one conventional vehicle continuing to log ISAAC data during the six-month period.
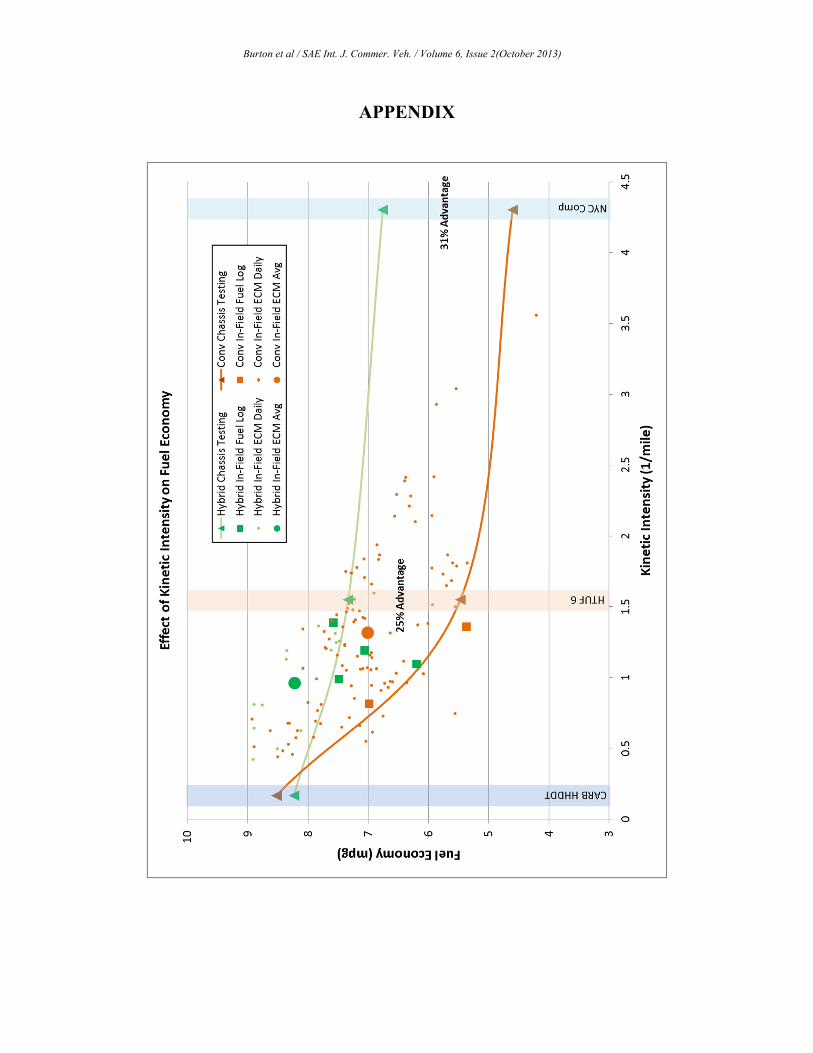
Figure 8 shows the fuel economy results for all the data from this entire study, including the chassis dynamometer
results, plotted against KI. There is a lot of information on this plot; therefore, a larger version of it is included in the appendix. HEVs tend to have greater fuel economy advantages at higher KI because a higher KI is more representative of a stop-and-go type drive cycle, which allows more electric regenerative braking to occur on the HEVs. A lower KI is more representative of a cycle with fewer stop-and-go activities and therefore provides fewer opportunities for regenerative braking on the HEVs. This is quite evident in Figure 8, where both of the higher KI drive cycles from the chassis testing show fuel economy improvements from the HEV. Unfortunately, there was not as much data logged from the ISAAC units for the HEV in the field, especially at higher KI cycles, so it is hard to draw any general trend for fuel economy with regard to KI from the fleet evaluation part of this study. The ISAAC unit that was installed on the HEV was accidentally unplugged for a couple of months without knowing it so the data for that time period was lost.
Data from the FedEx drivers' fuel logs that were recorded were also analyzed and are included in Figure 8. Some of the vehicles ended up getting switched to different routes than what was originally set up. The KI of the in-use field routes were calculated in the first three-week evaluation. Some of the vehicles were switched to routes that were not in the original study, and those values are not able to be plotted here. The fuel logs showed that the HEV advantage was 15% over the conventional vehicles for fuel economy. The data from the ISAAC loggers indicated the HEVs had a 17% fuel economy improvement over the conventional vehicles.
Figure 8. Effect of KI on vehicle fuel economy for both in-use field evaluation and chassis dynamometer results.
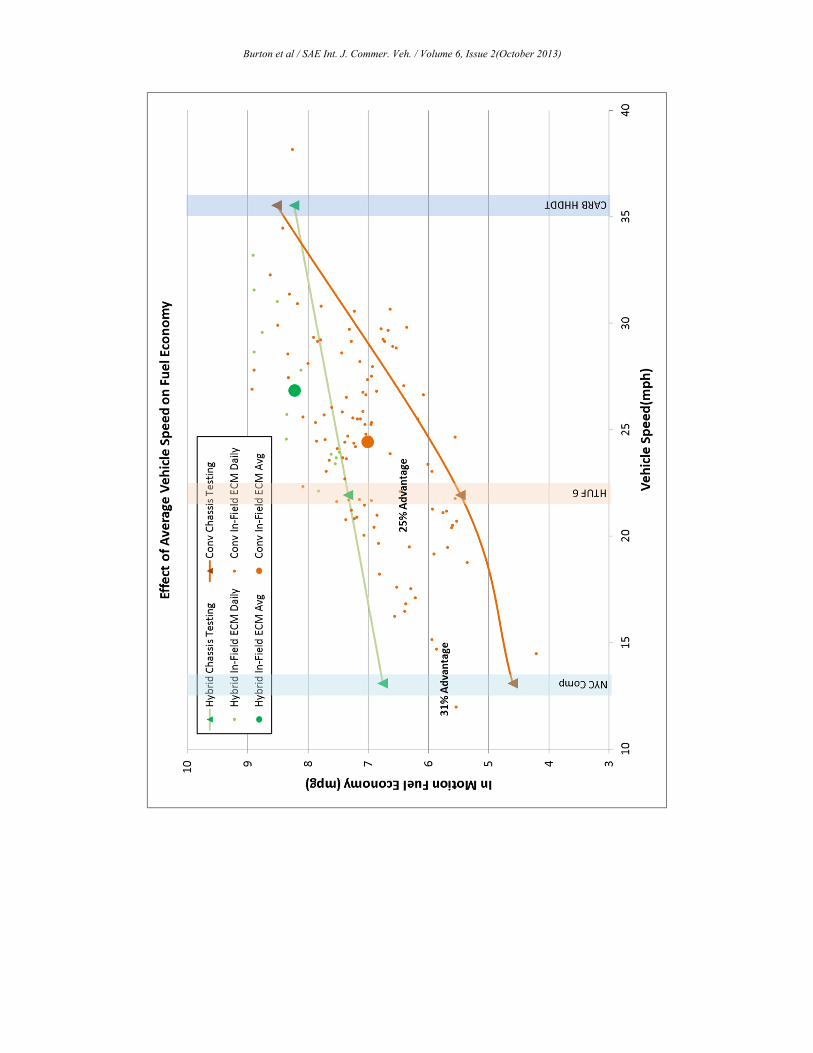
Fuel economy compared to average vehicle speed is plotted in Figure 9. This plot also contains a lot of information; a larger version of this figure is included in the appendix. The only trend differentiating the HEV and conventional trucks is that the HEV generally has better fuel economy than the conventional vehicle over the range of
Burton et al / SAE Int. J. Commer. Veh. / Volume 6, Issue 2(October 2013)
average cycle/route vehicle speeds. The conventional vehicle shows a strong trend of improved fuel economy as average cycle/route speed increases, as would be expected in most vehicles.
Figure 9. Effect of vehicle speed on vehicle fuel economy for both in-use field evaluation and chassis dynamometer
results.
SUMMARY/CONCLUSIONS A six-month in-use HEV field evaluation was carried out
to compare the potential performance improvements of a heavy-duty HEV versus a conventional diesel truck. The results were:
• Field data indicates that the HEVs had a 15% to 17% better fuel economy than the conventional vehicles.
The comparison study included testing the vehicles over three drive cycles on a heavy duty chassis dynamometer which found:
• The HEV had 31% better fuel economy on the NYComp drive cycle, 25% better fuel economy on the HTUF 6 drive cycle and 4% worse fuel economy on the HHDDT cycle when compared to the conventional vehicle.
• The HEV generally emitted more NOx emissions than the conventional vehicle over the drive cycles (and used an engine with a less stringent NOx certification level). Emissions were 77% higher on the NYComp cycle, 45% higher on the HHDDT, and no difference in NOx for the HTUF 6 cycle.
• The conventional vehicle reached highway speeds over ten seconds faster than the hybrid electric vehicle when tested for maximum acceleration rates.
REFERENCES1. O'Keefe, M., Simpson, A., Kelly, K., and Pedersen, D., “Duty Cycle
Characterization and Evaluation Towards Heavy Hybrid Vehicle Applications,” SAE Technical Paper 2007-01-0302, 2007, doi: 10.4271/2007-01-0302.
2. NREL Vehicle Drive Cycle Tool, User Guide. Copyright 2009 Alliancefor Sustainable Energy, LLC. All Rights Reserved.
3. Duran, A. and Earleywine, M., “GPS Data Filtration Method for DriveCycle Analysis Applications,” SAE Technical Paper 2012-01-0743, 2012, doi:10.4271/2012- 01-0743.
4. Renewable Fuels and Lubricants Laboratory, http://www.nrel.gov/vehiclesandfuels/refuellab/.
5. Code of Federal Regulations. Title 40. Protection of Environment. Part86 and 1065.
CONTACT INFORMATION [email protected] 303-275-3154
[email protected] 303-275-4492
[email protected] 303-275-3142
[email protected] 303-275-4586
[email protected] 901-434-7659
ACKNOWLEDGMENTS The authors would like to thank the U.S. Department of
Energy Vehicle & Systems Simulation and Testing Activity for supporting this project. We would also like to thank the generous donation of time and use of vehicles from FedEx Express, without which this project would not have been possible.
DEFINITIONS/ABBREVIATIONS CAN - Controller area network CARB - California Air Resource Board DOC - Diesel oxidation catalyst DPF - Diesel particulate filter DRIVE™ - Drive-Cycle Rapid Investigation, Visualization, and Evaluation FEL - Family emissions limit GPS - Global positioning system g/bhphr - Grams per brake horsepower hour HEV - Hybrid electric vehicle HHDDT - Heavy Heavy-Duty Diesel Truck HP - Horsepower HTUF - Hybrid Truck Users Forum KI - Kinetic intensity

Burton et al / SAE Int. J. Commer. Veh. / Volume 6, Issue 2(October 2013)
mph - Mile per hour NOx - Oxides of nitrogen
NREL - National Renewable Energy Laboratory NYComp - New York Composite ReFUEL - Renewable Fuels and Lubricants Laboratory at NREL SCR - Selective catalytic reduction
Burton et al / SAE Int. J. Commer. Veh. / Volume 6, Issue 2(October 2013)
APPENDIX
Burton et al / SAE Int. J. Commer. Veh. / Volume 6, Issue 2(October 2013)