Embed Size (px)
Citation preview

FundManagers’Report
APRIL | 2017
Message fromCIO's Desk
Review and OutlookEquity Funds
Review and OutlookMoney Market Funds
Fund Wise Performanceand ReviewAl Meezan Funds
I N S I D E T H I S R E P O R T
Available on Social Mediawww.almeezangroup.com
In Touch Monthly

“Disclaimer: This publication is for informational purpose only and nothing herein should be construed as a solicitation, recommendation or an o�er to buy or sell any fund. All investments in mutual funds are subject to market risk. The NAV based prices of units and any dividends/returns thereon are dependent on force and factors a�ecting the capital markets. These may go up or down based on market conditions. Past performance is not necessarily indicative of future results. Performance data does not include cost incurred by investor in the form of sales-load etc. (This report has been prepared in line with MUFAP’s recommended Format)”
Dear Investor, The stock market closed another month amidst persisting volatility on account of a simmering political front; the benchmark KMI-30 Index closed the month 3.23% up at 84,468 pts while the KSE-100 index closed 2.38% higher at 49,301 pts. Some respite came from the positive sentiment generated post the Panama Case verdict towards the end of the month in which the Supreme Court ordered the formulation of a Joint Investigation Team (JIT) for further scrutiny. Investors took it as a sign of political stability and the ensuring run-up took the stock market to a green zone closing. Shortly though, varying anticipations regarding the probable outcomes of the JIT started emerging which triggered a slight jitteriness in investors’ sentiment and brought the market back into a volatile zone. The con�dence of the local investors was highlighted once again with the stock market sustaining a rising trend amid another month of net foreign selling; FIPI clocked in at a net sell of USD 36 million for the month taking the total net sell value for 10MFY17 at USD 519 million.
On the international front, the global markets also generally remained �at to positive and the only signi�cant developments were USA’s bombings in Syria and Afghanistan along with threats to North Korea; resultantly, with a rise in such tensions, gold witnessed a rise of 2.91% at one point during the period under review but the gains partially eroded towards the close of the month whereby the precious metal closed 1.52% up at USD 1,268.29/oz. International oil prices also dipped as a production increase by Saudi Arabia led to concerns regarding supply cut agreements and resultantly Brent Crude closed 2.08% down at USD 51.73/barrel.
On the local front, apart from the political developments mentioned above, regulatory developments were also witnessed with the SECP continuing to work on its tightening measures, this time on mutual funds; the commission has altered some exposure limits which are expected to bring further improvement in the quality as well as liquidity of the portfolios managed by Mutual Funds.
OutlookWith consistently improving economic fundamentals, fast paced development under CPEC and political continuity, the economic future of Pakistan appears bright which shall translate into a thriving stock market in the long-term. In the short-term however, the most immediate trigger is eyed to be the MSCI’s inclusion of Pakistan’s stock market in its Emerging Market Index scheduled to occur during the next month; this development is expected to bring in signi�cant foreign investment in�ow to the country thereby keeping the stock market performing. Volatility may persist on account of political hiccups but overall the sentiment remains strong and positive and the market will pick up on its momentum gradually.
Investors with relevant risk pro�les and investment horizons are advised to go through our Fund Manager Report hereunder for a detailed performance review of our mutual funds and select a scheme for investment according to their risk preferences.
From the CIO’s Desk
Fund Manager’s Report - April 2017 I I N TO U C H M O N T H LY
Stock Market Continues to be Volatile; Key to Winning Will Be Holding Your Ground
KSE-100 Index Performance
90,000
85,000
80,000
75,000
70,000
65,000
KMI 30 Index51,000Points Points
49,000
47,000
45,000
43,000
41,000
39,000
37,000
Jul-1
6
Aug
-16
Sep-
16
Oct
-16
Nov
-16
Dec
-16
Jan-
17
Feb-
17
Mar
-17
Apr
-17
KSE 100 Index
Market 31-Mar-17 30-Apr-17 MTDEgyptKuwaitChinaDubaiUKVietnamRussiaSaudi ArabiaBrazilMSCIUSAIndiaGermanyMSCiUSAJapanMSCIHong KongIndonesiaUSAPakistanFrancePakistanTurkeySri LankaVenezula
IndexEGX-30
KSESSECDFMFTSEVN
RTSITASI
BovespaFrontier Markets
S&P 500BSE 30
DAXDeveloped Markets
DJIN225
Emerging MarketsHISJSX
NasdaqKSE 100CAC 40KMI 30XU 100ASPIIBVC
12,9957,0293,2233,4807,3237221,114
7,00264,984
5372,36329,62112,3131,854
20,66318,909
95824,1125,5685,912
48,1565,123
81,82588,9476,06243,877
12,4346,8433,1553,4157,2047181,1147,013
65,403541
2,38429,91812,4381,878
20,94119,197978
24,6155,6856,04849,3015,267
84,46894,6556,610
57,692
-4.32%-2.65%-2.11%-1.88%-1.62%-0.63%0.06%0.17%0.65%0.74%0.91%1.01%1.02%1.33%1.34%1.52%2.04%2.09%2.10%2.30%2.38%2.83%3.23%6.42%9.05%31.49%

1
2
3
4
5
6
7
8
9
10
11
12
13
Islamic Equity
Islamic Equity
Islamic Index Tracker
Islamic Balanced
Islamic Asset Allocation
Islamic Income
Islamic Income
Islamic Money Market
Islamic Commodity
Islamic Equity
Islamic Fund of Funds Scheme
Islamic Fund of Funds Scheme
Islamic Fund of Funds Scheme
Islamic Fund of Funds Scheme
Islamic Fund of Funds Scheme
Islamic Fund of Funds Scheme
Islamic Fund of Funds Scheme
Islamic Fund of Funds Scheme
Islamic Fund of Funds Scheme
Islamic Fund of Funds Scheme
Islamic Fund of Funds Scheme
Islamic Voluntary Pension Scheme
Al Meezan Mutual Fund
Meezan Islamic Fund
KSE Meezan Index Fund
Meezan Balanced Fund
Meezan Asset Allocation Fund
Meezan Islamic Income Fund
Meezan Sovereign Fund
Meezan Cash Fund
Meezan Gold Fund
Meezan Energy Fund
Meezan Financial Planning Fund of Fund
MFPF-Aggressive Allocation Plan
MFPF-Moderate Allocation Plan
MFPF-Conservative Allocation Plan
Meezan Asset Allocation Plan-I
Meezan Asset Allocation Plan-II
Meezan Asset Allocation Plan-III
Meezan Asset Allocation Plan-IV
Meezan Strategic Allocation Fund
Meezan Strategic Allocation Plan-I
Meezan Strategic Allocation Plan-II
Meezan Strategic Allocation Plan-III
Meezan Strategic Allocation Plan-IV
MTPF-Equity sub Fund
MTPF-Debt sub Fund
MTPF-Money Market sub Fund
MTPF-Gold sub Fund
AMMF
MIF
KMIF
MBF
MAAF
MIIF
MSF
MCF
MGF
MEF
MFPF - AGG
MFPF - MOD
MFPF - CON
MFPF - MAAP-I
MFPF - MAAP-II
MFPF - MAAP-III
MFPF - MAAP-IV
MSAP - I
MSAP - II
MSAP - III
MSAP - IV
MTPF-EQT
MTPF-DEBT
MTPF-MMKT
MTPF-Gold
9,607
55,179
1,185
9,434
2,713
10,532
5,707
4,900
410
1,177
767
453
418
1,460
1,068
3,226
954
2,827
1,767
1,872
19
5,971
2,464
623
43
13-Jul-95
8-Aug-03
23-May-12
20-Dec-04
18-Apr-16
15-Jan-07
10-Feb-10
15-Jun-09
13-Aug-15
29-Nov-16
11-Apr-13
11-Apr-13
11-Apr-13
10-Jul-15
24-Nov-15
26-Jan-16
23-May-16
19-Oct-16
21-Dec-16
16-Feb-17
20-Apr-17
28-Jun-07
28-Jun-07
28-Jun-07
4-Aug-16
32.1
32.3
26.5
19.7
27.3
5.3
6.3
6.4
-5.2
14.9
22.8
17.2
11.2
26.3
25.4
25.7
24.7
15.4
4.6
2.4
-0.2
29.3
5.1
4.6
-7.2
27.7
27.7
27.7
16.1
22.4
2.9
4.3
3.0
-1.8
17.5
19.3
15.3
9.1
23.9
23.2
23.5
21.7
14.5
3.1
0.5
0.1
-
-
-
-
17.1
22.6
25.8
16.9
-
14.4
11.0
11.1
2.8
-
21.3
16.8
11.7
21.0
29.2
32.7
-
-
-
-
-
20.7
11.4
11.2
-
16.8
19.3
28.8
14.5
-
5.2
6.5
6.4
7.8
-
20.4
17.4
10.6
21.7
30.3
34.2
-
-
-
-
-
-
-
-
-
“Disclaimer: This publication is for informational purpose only and nothing herein should be construed as a solicitation, recommendation or an o�er to buy or sell any fund. All investments in mutual funds are subject to market risk. The NAV based prices of units and any dividends/returns thereon are dependent on force and factors a�ecting the capital markets. These may go up or down based on market conditions. Past performance is not necessarily indicative of future results. Performance data does not include cost incurred by investor in the form of sales-load etc. (This report has been prepared in line with MUFAP’s recommended Format)”
Return (net of all expenses including Management Fee)
FY17TD (%) Since Inception CAGR (%)Sr. No. Funds Category Fund Name Symbol Fund size(Rs. in
million)
Inceptiondate
Fund FundBenchmark Benchmark
Stock Market Continues to be Volatile; Key to Winning Will Be Holding Your Ground
Meezan Taha�uz Pension Fund
Fund Manager’s Report - April 2017 I I N TO U C H M O N T H LY

Disclaimer: This publication is for informational purpose only and nothing herein should be construed as a solicitation, recommendation or an o�er to buy or sell any fund. All investments in mutual funds are subject to market risk. The NAV based prices of units and any dividends/returns thereon are dependent on force and factors a�ecting the capital markets. These may go up or down based on market conditions. Past performance is not necessarily indicative of future results. Performance data does not include cost incurred by investor in the form of sales-load etc.
Al Meezan Investments, the company in operation since 1995, has one of the longest track record of managing mutual funds in the private sector in Pakistan. Al Meezan Investments manages thirteen mutual funds; namely Al Meezan Mutual Fund, Meezan Balanced Fund, Meezan Islamic Fund, Meezan Islamic Income Fund, Meezan Taha�uz Pension Fund, Meezan Cash Fund, Meezan Sovereign Fund, Meezan Financial Planning Fund of Funds, KSE Meezan Index Fund, Meezan Gold Fund, Meezan Asset Allocation Fund, Meezan Strategic Allocation Fund and Meezan Energy Fund.
The total funds under management of Al Meezan, the only full-�edged Shariah compliant asset management company in Pakistan, have reached Rs. 119.92 billion as on April 28, 2017. With an AM1 credit rating denoting high management quality, the company clearly stays well ahead of all its competitors in the Islamic asset management market in Pakistan.
Stock Market Review During the month of April 2017, the KSE-100 index appreciated by 2.38% to close at 49,301 points. Autos and Banks were positive contributors whereas Fertilizer stocks were negative contributors. The average daily volume of the market was 238.9 mn shares, down by 2.4% on a MoM basis.
Foreigners reported a net sell of USD 36.2 mn in April. Individuals reported a net sell of USD 53mn and Banks reported a net sell of USD 19.8mn whereas Mutual Funds remained major buyers with a net buy of USD 107.9mn. During the month, the decision on the Panama case was announced by the Supreme Court where a Joint Investigation Team was to be created to investigate the matter and present its report in 60 days. Even though the decision was e�ectively deferred, the market gained as the uncertainty surrounding the case went away for the time being and investors geared up for the MSCI Emerging market reclassi�cation at the end of May.
Going forward, the upcoming inclusion of Pakistan into the MSCI emerging market Index is due by the end of May and the inclusion of Pakistan by FTSE in its Index series is likely to keep foreign interest alive in the market. We expect market volumes and foreign �ows to improve in the coming months whereas the JIT’s report on the Panama case will remain a potential concern as the case progresses.
Money Market ReviewThe money market has generally been facing a tight liquidity scenario since the start of calendar year 2017 as evidenced by Rs. 18.3 trillion worth of OMO injections by the SBP along with Rs. 206 billion worth of discounting availed by various counters in comparison to just Rs. 21 billion worth of OMO mop-ups and Rs. 119 billion worth of �oor placements during the �rst four months of the year. The Islamic end of the money market however has remained much more liquid in comparison to the conventional counterparts.
The market participants have been anticipating an increase in the discount rate as evidenced by the bid patterns in T-bill and PIB auctions; two T-bill auctions were conducted during the month in which cumulatively Rs. 629 billion was accepted against a total participation of Rs. 751 billion (major participation and acceptance in the 3 months category) while a PIB auction was also carried out by the SBP in which participation worth Rs. 31 billion was received but the bids were rejected. Apart from these skewed auction participations, the interest rates and yields in the secondary market have generally remained very stable during the month.
In�ation for the month of April 2017 clocked in at 4.78% taking the 10MFY17 average to 4.09% in comparison to 2.79% in the same period last year. On the forex front, the rupee closed 4 paisas stronger at Rs. 104.81/$ in the interbank market while in the open market, it closed 30 paisas stronger at Rs. 106.10/$.
AL Meezan Investment
Management Limited
KSE-100 Index Performance
50,400
49,600
48,800
48,000
47,200
46,400
45,600
44,800
Index (RHS)Vol (mn) (LHS)500
400
300
200
100
0
3-A
pr
6-A
pr
11-A
pr
14-A
pr
19-A
pr
24-A
pr
28-A
pr
Fund Manager’s Report - April 2017 I I N TO U C H M O N T H LY
6 Month KIBOR
5.80
6.00
6.20
6.40
6.60
6.80
1-A
pr
4-A
pr
7-A
pr
10-A
pr
13-A
pr
16-A
pr
19-A
pr
22-A
pr
25-A
pr
28-A
pr

SWWF Disclosure: The Fund has provided an amount of Rs. 390.05 million against Sindh Workers’ Welfare Fund (SWWF) Liability. Had that not been provided, the NAV per unit/return for the period would have been higher by Rs. 0.62 / 0.71%.Disclaimer: This publication is for informational purpose only and nothing herein should be construed as a solicitation, recommendation or an o�er to buy or sell any fund. All investments in mutual funds are subject to market risk. The NAV based prices of units and any dividends/returns thereon are dependent on force and factors a�ecting the capital markets. These may go up or down based on market conditions. Past performance is not necessarily indicative of future results. Performance data does not include cost incurred by investor in the form of sales-load etc.
Cement
Power Generation & Distribution
Oil & Gas Exploration Companies
Fertilizer
Oil & Gas Marketing Companies
Others
Performance - Cumulative Returns
Fund Details
Mar' 1752,06984.97
Apr' 1755,17987.63
MoM%5.97%3.13%
Net Assets (Rs mn)NAV Per Unit (Rs)
Fund Net Assets
To maximize total investor returns by investing in Shariah Compliant equities focusing on both capital gains and dividend income.
Investment Objective Fund’s Performance
Mar' 17 Apr' 17Equity (%) 88.55 87.87Cash (%) 10.75 11.31Other receivables (%) 0.70 0.82P/E 11.92Expense Ratio* 3.87% *This includes 1.42% representing government levy, Worker's Welfare Fund and SECP fee. (Annualized)
(Selling and Marketing expenses - for the period ended April 28, 2017, Rs. 34.84 million)
Asset Allocation
MIF KSE-100 index KMI-30 IndexStandard Deviation (%) 12.68 11.71 13.58Sharpe Ratio 2.94 3.17 2.56
Risk Measures – April‘17
Top Ten Equity Holdings: (% of Total Assets):
Sector Allocation:
Engro Corporation 8% Honda Atlas Cars 5%Lucky Cement Ltd. 7% Oil & Gas Development Co. Ltd. 5%Packages Ltd. 6% Sui Northern Gas Pipelines Ltd. 4%Mari Petroleum Ltd. 6% Pakistan State Oil Co. Ltd. 3%The Hub Power Co. Ltd. 5% DG Khan Cement Co. Ltd. 3%
Net assets of Meezan Islamic Fund stood at Rs. 55.18 billion as on April 28, 2017. The fund’s NAV increased by 3.13% during the month of April as compared to 3.23% increased in benchmark index (KMI-30) while KSE-100 Index during the same period increased by 2.38%. As on April 28, the fund was 88% invested in equities.
Fund Review
EQU
ITY
1M 3M 6M FYTD 1Yr 3Yr 5Yr PSD* CAGR*MIF 3% 3% 26% 32% 42% 95% 262% 1,533% 23%Benchmark# 3% 1% 27% 28% 40% 83% 249% 1,032% 19%*Performance start date of August 08, 2003, CAGR since inception# KMI-30 replaced DJIIMPK as the Fund’s benchmark from July 01, 2009, while KSE-100 index remained as the benchmark till June 30, 2006, ^ NAV to NAV with dividend reinvested
Annual ReturnsFY16 FY15 FY14 FY13 FY12 FY11 FY10 FY09
MIF 17% 22% 29% 51% 19% 39% 31% -30%Benchmark 16% 20% 30% 54% 14% 44% 37% -35%
Meezan IslamicFund (MIF)
Fund Type: Open EndRisk Level HighLaunch Date 8th Aug 2003Trustee CDCAuditors KPMG Taseer Hadi & Co.Registrar Meezan Bank Ltd.Unit Types A, B and CManagement Fee 2%Front End Load 2%Fund Category EquityBack End Load NilBenchmark KMI-30Leverage NilListing PSXAMC Rating AM1Rating Agency JCRVISPricing Mechanism ForwardValuation Days Mon-Fri Subscription/Redemption Days Mon-Fri 9am – 4pmFund Manager Muhammad Asad
AMC RATING AM1 (STABLE OUTLOOK)
i s l a m i c f u n d
MIF Benchmark
Members of Investment Committee Mohammad Shoaib, CFAMuhammad AsadAli AsgharAli Khan, CFA, FRM Ahmed Hassan, CFAAsif Imtiaz, CFAZain Malik, CFAAsmar Hamoodi, CFAImad Ansari
Fund Manager’s Report - April 2017 I I N TO U C H M O N T H LY
-
200
400
600
800
1,000
1,200
1,400
1,600
1,800
Aug
-03
Apr
-04
Dec
-04
Aug
-05
May
-06
Jan-
07
Sep
-07
May
-08
Jan-
09
Oct
-09
Jun-
10
Feb-
11
Oct
-11
Jul-
12
Mar
-13
Nov
-13
Jul-
14
Mar
-15
Dec
-15
Aug
-16
Apr
-17
39%
20%8%
13%
12%
8%

SWWF Disclosure: The Fund has provided an amount of Rs. 59.25 million against Sindh Workers’ Welfare Fund (SWWF) Liability. Had that not been provided, the NAV per unit/return for the period would have been higher by Rs. 0.15 / 0.62%.Disclaimer: This publication is for informational purpose only and nothing herein should be construed as a solicitation, recommendation or an o�er to buy or sell any fund. All investments in mutual funds are subject to market risk. The NAV based prices of units and any dividends/returns thereon are dependent on force and factors a�ecting the capital markets. These may go up or down based on market conditions. Past performance is not necessarily indicative of future results. Performance data does not include cost incurred by investor in the form of sales-load etc.
Performance - Cumulative Returns
Fund Details
Mar' 179,01722.96
Apr' 179,60723.76
MoM%6.53%3.48%
Net Assets (Rs mn)NAV Per Unit (Rs)
Fund Net Assets
The objective of Al Meezan Mutual Fund is to optimize the total investment returns, both capital gains and dividend income, through prudent investment management.
Investment Objective Investment Growth from FY 1996-to Date
Mar' 17 Apr' 17Equity (%) 90.97 90.05Cash (%) 8.69 8.98Other receivables (%) 0.54 0.97P/E 12.11Expense Ratio* 3.80%*This includes 1.29% representing government levy, Worker's Welfare Fund and SECP fee. (Annualized)
(Selling and Marketing expenses - for the period ended April 28, 2017, Rs. 6.12 million)
Asset Allocation
AMMF KSE-100 index KMI-30 IndexStandard Deviation (%) 12.62 11.71 13.58Sharpe Ratio 2.93 3.17 2.56
Risk Measures – April‘17
Top Ten Equity Holdings: (% of Total Assets):
Sector Allocation:
Lucky Cement Ltd. 8% Oil & Gas Development Co. Ltd. 4%Engro Corporation 8% Sui Northern Gas Pipelines Ltd. 4%Packages Ltd. 6% Honda Atlas Cars 4%Mari Petroleum Ltd. 6% Pakistan State Oil Co. Ltd. 3%The Hub Power Co. Ltd. 5% DG Khan Cement Co. Ltd. 3%
The net assets of Al Meezan Mutual Fund (AMMF) as at April 28, 2017 stood at Rs. 9.61 billion. The fund’s NAV increased by 3.48% during the month of April as compared 3.23% increased in benchmark index (KMI-30) while KSE-100 Index during the same period increased by 2.38%. As on April 28, the fund was 90% invested in equities.
Fund Review
EQU
ITY
1M 3M 6M FYTD 1Yr 3Yr 5Yr PSD* CAGR*AMMF 3% 3% 26% 32% 42% 94% 256% 3,129% 17%Benchmark# 3% 1% 27% 28% 40% 83% 249% 2,841% 17%* Performance start date of July 13, 1995, CAGR since inception
# KMI-30 replaced DJIIMPK as the Fund’s benchmark from July 01, 2009, while KSE-100 index remained as the benchmark till June 30, 2006. ^NAV to NAV with dividend reinvested
Annual ReturnsFY16 FY15 FY14 FY13 FY12 FY11 FY10 FY09
AMMF 16% 22% 30% 51% 19% 37% 31% -32%Benchmark 16% 20% 30% 54% 14% 44% 37% -35%
Al Meezan MutualFund (AMMF)
Fund Type: Open EndRisk Level HighLaunch Date 13th July 1995Trustee CDCAuditors KPMG Taseer Hadi & Co.Registrar Meezan Bank Ltd.Unit Types A, B,C and DManagement Fee 2%Front End Load 2%Fund Category EquityBack End Load Contingent LoadBenchmark KMI-30Leverage NilListing PSXAMC Rating AM1Rating Agency JCRVISPricing Mechanism ForwardValuation Days Mon-Fri Subscription/ Redemption Days Mon-Fri 9am – 4pmFund Manager Ahmed Hassan, CFA
Cement
Power Generation & Distribution
Oil & Gas Exploration Companies
Fertilizer
Oil & Gas Marketing Companies
Others
Members of Investment Committee Mohammad Shoaib, CFAMuhammad AsadAli AsgharAli Khan, CFA, FRM Ahmed Hassan, CFAAsif Imtiaz, CFAZain Malik, CFAAsmar Hamoodi, CFAImad Ansari
AMC RATING AM1 (STABLE OUTLOOK)
Fund Manager’s Report - April 2017 I I N TO U C H M O N T H LY
3,500,00
3,000,00
2,500,00
2,000,00
1,500,00
1,000,00
500,00
-
July
95
June
01
June
06
June
11
Nov 1
1
Apr 1
2
Sep 1
2
Feb 1
3
Jul 1
3
Dec 1
3
May
14
Oct 1
4
Mar
15
Aug 1
5
Jan 1
6
Jun 1
6
Nov 1
6
Apr 1
7
100,000 122,800
1,172,192
487,122
968,549
3,228,740
Conversion from close end fund to open end fund
36%
21%8%
14%
12%
9%
Fund Details
Mar' 1710,62553.38
Apr' 1710,53253.522.16%
MoM%-0.87%0.26%
Net Assets (Rs mn)NAV Per Unit (Rs)Expense Ratio*
Fund Net Assets
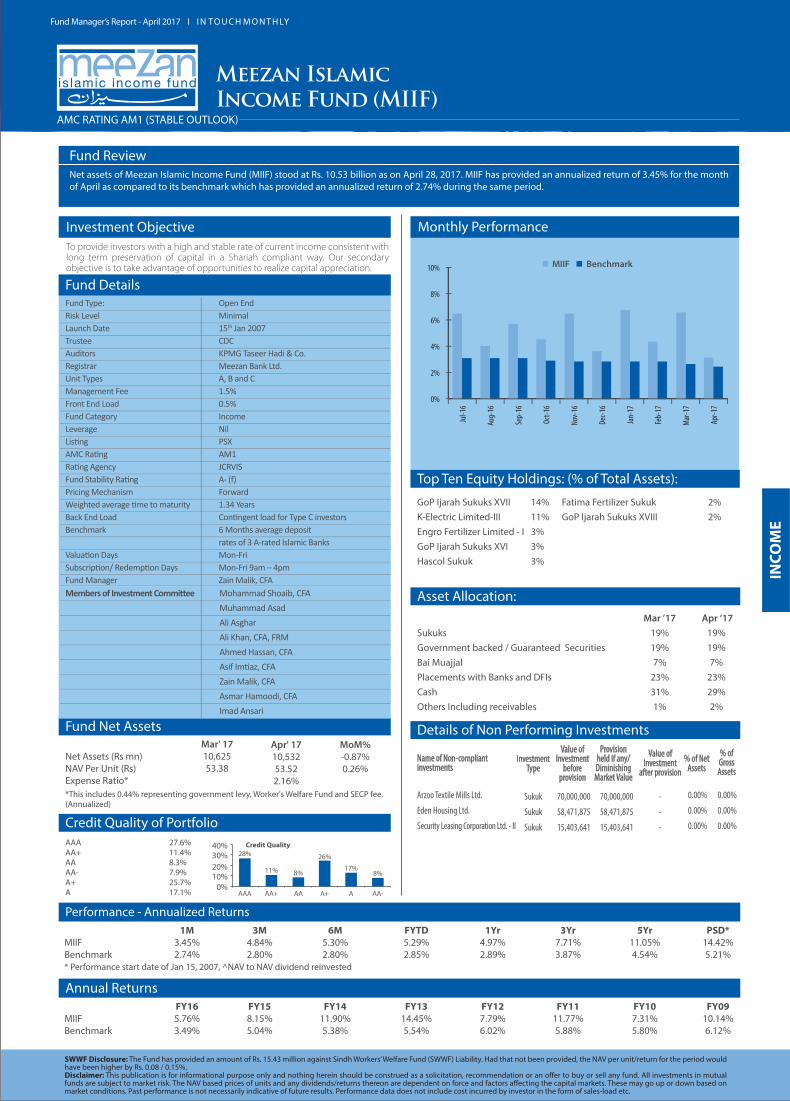
To provide investors with a high and stable rate of current income consistent with long term preservation of capital in a Shariah compliant way. Our secondary objective is to take advantage of opportunities to realize capital appreciation.
Investment Objective Monthly Performance
AAA 27.6%AA+ 11.4%AA 8.3%AA- 7.9%A+ 25.7%A 17.1%
Credit Quality of Portfolio
Top Ten Equity Holdings: (% of Total Assets):
Asset Allocation:
GoP Ijarah Sukuks XVII 14% Fatima Fertilizer Sukuk 2%K-Electric Limited-III 11% GoP Ijarah Sukuks XVIII 2%Engro Fertilizer Limited - I 3% GoP Ijarah Sukuks XVI 3% Hascol Sukuk 3%
Net assets of Meezan Islamic Income Fund (MIIF) stood at Rs. 10.53 billion as on April 28, 2017. MIIF has provided an annualized return of 3.45% for the month of April as compared to its benchmark which has provided an annualized return of 2.74% during the same period.
Fund Review
INCO
ME
Performance - Annualized Returns1M 3M 6M FYTD 1Yr 3Yr 5Yr PSD*
MIIF 3.45% 4.84% 5.30% 5.29% 4.97% 7.71% 11.05% 14.42%Benchmark 2.74% 2.80% 2.80% 2.85% 2.89% 3.87% 4.54% 5.21%* Performance start date of Jan 15, 2007, ^NAV to NAV dividend reinvested
Annual ReturnsAnnual Returns FY16 FY15 FY14 FY13 FY12 FY11 FY10 FY09MIIF 5.76% 8.15% 11.90% 14.45% 7.79% 11.77% 7.31% 10.14%Benchmark 3.49% 5.04% 5.38% 5.54% 6.02% 5.88% 5.80% 6.12%
Meezan IslamicIncome Fund (MIIF)
Fund Type: Open EndRisk Level MinimalLaunch Date 15th Jan 2007Trustee CDCAuditors KPMG Taseer Hadi & Co.Registrar Meezan Bank Ltd.Unit Types A, B and CManagement Fee 1.5%Front End Load 0.5%Fund Category IncomeLeverage NilListing PSXAMC Rating AM1Rating Agency JCRVISFund Stability Rating A- (f)Pricing Mechanism ForwardWeighted average time to maturity 1.34 YearsBack End Load Contingent load for Type C investorsBenchmark 6 Months average deposit
rates of 3 A-rated Islamic Banks Valuation Days Mon-Fri Subscription/ Redemption Days Mon-Fri 9am – 4pmFund Manager Zain Malik, CFA
SWWF Disclosure: The Fund has provided an amount of Rs. 15.43 million against Sindh Workers’ Welfare Fund (SWWF) Liability. Had that not been provided, the NAV per unit/return for the period would have been higher by Rs. 0.08 / 0.15%.Disclaimer: This publication is for informational purpose only and nothing herein should be construed as a solicitation, recommendation or an o�er to buy or sell any fund. All investments in mutual funds are subject to market risk. The NAV based prices of units and any dividends/returns thereon are dependent on force and factors a�ecting the capital markets. These may go up or down based on market conditions. Past performance is not necessarily indicative of future results. Performance data does not include cost incurred by investor in the form of sales-load etc.
*This includes 0.44% representing government levy, Worker's Welfare Fund and SECP fee.(Annualized)
40%
AAA
28%30%20%10%
0%AA+
11%
Credit Quality
AA
8%
A+
26%
A
17%
AA-
8%
MIIF Benchmark
Mar ’17 Apr ’17Sukuks 19% 19%Government backed / Guaranteed Securities 19% 19%Bai Muajjal 7% 7%Placements with Banks and DFIs 23% 23%Cash 31% 29%Others Including receivables 1% 2%
Details of Non Performing Investments
Arzoo Textile Mills Ltd.
Eden Housing Ltd.
Security Leasing Corporation Ltd. - II
Name of Non-compliantinvestments
Investment Type
Value ofInvestment
beforeprovision
Provisionheld if any/ DiminishingMarket Value
Value ofInvestment
after provision% of Net
Assets
% ofGross Assets
0.00%
0.00%
0.00%
0.00%
0.00%
0.00%
70,000,000
58,471,875
15,403,641
70,000,000
58,471,875
15,403,641
-
-
-
Sukuk
Sukuk
Sukuk
Members of Investment Committee Mohammad Shoaib, CFAMuhammad AsadAli AsgharAli Khan, CFA, FRM Ahmed Hassan, CFAAsif Imtiaz, CFAZain Malik, CFAAsmar Hamoodi, CFAImad Ansari
AMC RATING AM1 (STABLE OUTLOOK)
Fund Manager’s Report - April 2017 I I N TO U C H M O N T H LY
10%
8%
6%
4%
2%
0%
Jul-1
6
Aug-
16
Sep-
16
Oct-1
6
Nov-
16
Dec-1
6
Jan-
17
Feb-
17
Mar
-17
Apr-1
7

SWWF Disclosure: The Fund has provided an amount of Rs. 7.05 million against Sindh Workers’ Welfare Fund (SWWF) Liability. Had that not been provided, the NAV per unit/return for the period would have been higher by Rs. 0.08 / 0.14%.Disclaimer: This publication is for informational purpose only and nothing herein should be construed as a solicitation, recommendation or an o�er to buy or sell any fund. All investments in mutual funds are subject to market risk. The NAV based prices of units and any dividends/returns thereon are dependent on force and factors a�ecting the capital markets. These may go up or down based on market conditions. Past performance is not necessarily indicative of future results. Performance data does not include cost incurred by investor in the form of sales-load etc.
Performance - Annualized Returns
Fund Details
To seek maximum possible preservation of capital and a reasonable rate of return via investing primarily in liquid Shariah compliant money market and debt securities.
Investment Objective
Mar' 174,05352.64
Apr' 174,90052.791.68%
MoM%20.92%0.29%
Net Assets (Rs mn)NAV Per Unit (Rs)Expense Ratio*
Fund Net Assets
Net assets of Meezan Cash Fund (MCF) stood at Rs. 4.90 billion as on April 28, 2017. MCF has provided an annualized return of 3.82% for the month of April as compared to its benchmark which has provided an annualized return of 2.46% during the same period.
Fund Review
MO
NEY M
ARKET
1M 3M 6M FYTD 1Yr 3Yr 5Yr PSD*MCF 3.82% 4.19% 7.46% 6.38% 6.12% 6.52% 7.93% 11.06%Benchmark 2.46% 2.56% 2.64% 2.98% 3.20% 4.71% 5.56% 6.44%* Performance start date of June 15, 2009, ^ NAV to NAV with dividend reinvested
Annual ReturnsFY16 FY15 FY14 FY13 FY12 FY11 FY10 FY09
MCF 4.59% 7.46% 7.08% 8.78% 10.71% 11.02% 10.09% 8.03%*Benchmark 4.49% 6.24% 6.55% 6.91% 8.13% 8.24% 7.50% 7.60%
Meezan CashFund (MCF)
Fund Type: Open EndRisk Level MinimalLaunch Date 15th June 09Trustee CDCAuditors KPMG Taseer Hadi & Co.Registrar Meezan Bank Ltd.Unit Types A, B and CManagement Fee 1%Front End Load NilBack End Load* 0.1% if redemption within 3 daysFund Category Money MarketLeverage NilListing PSXAMC Rating AM1Rating Agency JCRVISFund Stability Rating AA (f) Pricing Mechanism ForwardWeighted average time to maturity 1 DaysBenchmark 3 Months average deposit rates of 3 AA
rated Islamic BanksValuation Days Mon-Fri Subscription/ Redemption Days Mon-Fri 9am – 4pmFund Manager Zain Malik, CFA
*This includes 0.44% representing government levy, Worker's Welfare Fund and SECP fee.(Annualized)
Rating ExposureAAA 43.46%AA+ 9.92%AA 41.16%
Asset Allocation
Portfolio CompositionMar’17 Apr’17
Cash 97% 95%Other Including receivables 3% 5%
Portfolio: Salient FeaturesKey Bene�ts Maximum Preservation of Principal Investment
High Liquidity (Redemption within two working days) *No Sales Load (No Entry or Exit charges) Tax Credit as per tax laws
Investment Policy and Strategy
Investments in High Grade & Liquid avenues:Instrument/Issuer Rating : Minimum ‘AA’Maximum Maturity of Instruments : Six MonthsAverage Time to Maturity of Portfolio : Three Months
Benchmark Average return on 6-month Islamic bank deposits
Monthly Performance
* 15 days of operations
Sep-16
Oct-16
Nov-16
Dec-16
Jan-17
Feb-17
Mar-17
Apr-17
Aug-16
Jul-16
0%
24%
20%
16%
12%
8%
4%
Cash
Other Including Receivables
Members of Investment Committee Mohammad Shoaib, CFAMuhammad AsadAli AsgharAli Khan, CFA, FRM Ahmed Hassan, CFAAsif Imtiaz, CFAZain Malik, CFAAsmar Hamoodi, CFAImad Ansari
AMC RATING AM1 (STABLE OUTLOOK)
Fund Manager’s Report - April 2017 I I N TO U C H M O N T H LY
MCF Benchmark
95%
5%

Fund Details
To seek maximum possible preservation of capital and a reasonable rate of return.
Investment Objective Monthly Performance
Asset Allocation:
Net assets of Meezan Sovereign Fund (MSF) stood at Rs. 5.71 billion as on April 28, 2017. For the month of April, the fund has provided an annualized return of 1.80% as compared to its benchmark which has provided an annualized return of 4.77% during the same period.
Fund Review
INCO
ME
Meezan SovereignFund (MSF)
Fund Type: Open EndRisk Level MinimalLaunch Date 10th Feb 2010Trustee CDCAuditors KPMG Taseer Hadi & Co.Registrar Meezan Bank Ltd.Unit Types A, B, C and DManagement Fee 1%Front End Load 0.5%Back End Load NilFund Category IncomeLeverage NilListing PSXAMC Rating AM1 Rating Agency JCRVISFund Stability Rating AA (f)Pricing Mechanism ForwardWeighted average time to maturity 1.53 yearsBenchmark 6 Months PKISRV RateValuation Days Mon-Fri Subscription/ Redemption Days Mon-Fri 9am – 4pmFund Manager Zain Malik, CFA
SWWF Disclosure: The Fund has provided an amount of Rs. 13.27 million against Sindh Workers’ Welfare Fund (SWWF) Liability. Had that not been provided, the NAV per unit/return for the period would have been higher by Rs. 0.12 / 0.23%.Disclaimer: This publication is for informational purpose only and nothing herein should be construed as a solicitation, recommendation or an o�er to buy or sell any fund. All investments in mutual funds are subject to market risk. The NAV based prices of units and any dividends/returns thereon are dependent on force and factors a�ecting the capital markets. These may go up or down based on market conditions. Past performance is not necessarily indicative of future results. Performance data does not include cost incurred by investor in the form of sales-load etc.
20%
16%
12%
8%
4%
0%
-4%
Jul-1
6
Aug-
16
Sep-
16
Oct
-16
Nov
-16
Dec-
16
Jan-
17
Feb-
17
Mar
-17
Apr-1
7
MSF Benchmark
Performance - Annualized Returns1M 3M 6M FYTD 1Yr 3Yr 5Yr PSD*
MSF 1.80% -0.05% 5.48% 6.30% 6.08% 6.51% 8.38% 11.03%Benchmark 4.77% 4.36% 4.13% 4.31% 4.31% 5.08% 5.78% 6.49%* Performance start date of Feb 10, 2010, ^NAV to NAV with dividend reinvested
Annual ReturnsFY16 FY15 FY14 FY13 FY12 FY11 FY10 FY09
MSF 5.12% 6.81% 8.50% 9.11% 11.19% 11.45% 9.76%* -Benchmark 4.49% 6.24% 6.55% 6.91% 8.13% 8.24% 7.50% -
Fund Net Assets
Asset Rating
Mar '17 Apr '17 MoM %Net Assets (Rs mn) 6,774 5,707 -15.75%NAV Per Unit (Rs) 53.38 53.45 0.14%Expense Ratio 1.60%
Asset AllocationMar ’17 Apr ’17
Government Guaranteed 81% 87%Cash 18% 11%Other Including receivables 1% 2%
AAA 93.92%AA+ 0.22%AA 0.78%A+ 3.28%
*This includes 0.37% representing government levy, Worker's Welfare Fund and SECP fee. (Annualized)
* 140 days of operations
Portfolio: Salient FeaturesKey Bene�ts Maximum Preservation of Principal Investment
Primary Investments in securities issued by Government of PakistanVery Low RiskLiquidity (Redemption on average in 2-3 working days)Tax Credit as per tax laws
Investment Policy and Strategy
Investments in High Grade & Liquid Avenues:Minimum 70% Investment in Government backed / issued securities (rated ‘AAA’)Placements in top rated banks and �nancial institutionsWeighted Average Time to Maturity of Portfolio: Not more than 4 years
Benchmark Average return on 6-month Islamic bank deposits
Members of Investment Committee Mohammad Shoaib, CFAMuhammad AsadAli AsgharAli Khan, CFA, FRM Ahmed Hassan, CFAAsif Imtiaz, CFAZain Malik, CFAAsmar Hamoodi, CFAImad Ansari
AMC RATING AM1 (STABLE OUTLOOK)
Fund Manager’s Report - April 2017 I I N TO U C H M O N T H LY
Government Guaranteed
Cash
Other Including Recevables87%
2%11%

Fund Details
To provide participants a regular Halal income stream after retirement/disability when they can no longer earn regular income to support their living so that they are not dependent on other members of the society.
Investment Objective
As at April 28, 2017, total size of net assets of Meezan Taha�uz Pension Fund (MTPF) stood at Rs. 9,100 million. For the month of April, the NAV of equity sub fund increased by 2.84%, gold sub fund increased 0.43%, while the NAV of debt and money Market sub funds provided an annualized return of 2.07% and 2.41% respectively.
Fund Review
PENSIO
N
Meezan TahaffuzPension Fund(MTPF)
Fund Type: Open EndRisk Level Investor DependentLaunch Date 28th June 2007Trustee CDCAuditors Deloitte Yousuf AdilRegistrar Meezan Bank Ltd.Fund Category PensionManagement Fee 1.5% Front End Load 3%Leverage NilAMC Rating AM1Rating Agency JCRVISPricing Mechanism ForwardValuation Days Mon-Fri Subscription/ Redemption Days Mon-Fri 9am – 4pmFund Manager Asmar Hamoodi, CFA
Fund Net AssetsRs (mn) Mar '17 Apr '17 MoM %MTPF- Equity 5,720 5,971 4.38%MTPF- Debt 2,425 2,464 1.61%MTPF- MMkt 600 623 3.84%MTPF- Gold 44 43 -2.43%Total Fund 8,789 9,100 3.54%
NAV per unitRs Mar '17 Apr '17 MoM %MTPF- Equity 618.46 636.03 2.84%MTPF- Debt 211.94 212.28 0.16%MTPF- MMkt 209.79 210.18 0.19%MTPF- Gold 92.40 92.80 0.43%
Sukuk Holdings – MTPF(MMKT fund)GoP Ijarah Sukuks XVIII 22.85%GoP Ijarah Sukuks XVI 15.87%GoP Ijarah Sukuks XVII 3.54%
Annual Returns FY16 FY15 FY14 FY13 FY12 FY11 FY10 FY09MTPF- Equity 18.1% 26.6% 32.4% 54.9% 16.8% 36.0% 31.5% -25.8%MTPF- Debt 4.5% 6.4% 7.7% 8.3% 9.5% 10.9% 8.5% 10.2%MTPF- MMkt 4.0% 6.9% 6.9% 7.8% 10.9% 10.7% 8.5% 11.1%
MTPF - Allocation Schemes 1M 3M 6M YTD 1Yr 3Yr 5Yr PSD* CAGR*High Volatility 2.3% 1% 20% 24% 31% 84% 235% 451% 19%Med. Volatility 1.5% 1% 13% 17% 21% 58% 160% 324% 16%Low Volatility 0.8% 1% 7% 10% 13% 37% 98% 218% 12%Lower Volatility 0.2% 0.5% 2% 4% 4% 16% 36% 111% 8%MTPF – Gold** 0.4% 2% -2% -7% - - - -7% -* Performance start date of June 28, 2007. CAGR since inception, ** Performance state of August 04, 2016, ^NAV to NAV with dividend reinvested
SWWF Disclosure: The Fund has provided an amount of Rs. 45.67mn (Equity), Rs. 3.91 mn (Debt) and Rs. 0.83mn (MMKT) against Sindh Workers’ Welfare Fund (SWWF) Liability. Had that not been provided, the NAV per unit/return for the period would have been higher by Rs. 4.86/0.76% (Equity), Rs. 0.34/0.16% (Debt.) and Rs. 0.28/0.13 (MMKT).Disclaimer: This publication is for informational purpose only and nothing herein should be construed as a solicitation, recommendation or an o�er to buy or sell any fund. All investments in mutual funds are subject to market risk. The NAV based prices of units and any dividends/returns thereon are dependent on force and factors a�ecting the capital markets. These may go up or down based on market conditions. Past performance is not necessarily indicative of future results. Performance data does not include cost incurred by investor in the form of sales-load etc.
(MTPF – Equity) Sector Allocation & Top Holdings (Apr’17)
MTPF Debt Sub Fund
MTPF Money Market Sub Fund
Cement 21%Oil & Gas Exploration Companies 14%Fertilizer 13%Oil & Gas Marketing Companies 9%Power Generation & Distribution 7%Other Sectors 30%Cash & Others including receivable 6%
Engro Corporation 7.95%Lucky Cement Ltd. 6.56%Packages Ltd. 6.33%Mari Petroleum Ltd. 5.34%Sui Northern Gas Pipelines Ltd. 4.65%Oil & Gas Development Co. Ltd. 4.37%The Hub Power Co. Ltd. 4.18%Honda Atlas Cars 4.17%Pioneer Cement Co. Ltd. 4.06%DG Khan Cement Ltd. 3.73%
GoP Guaranteed Securities
Sukuk
Placement
Cash & Other Including receivables
GoP Guaranteed Securities
Cash & Other Including receivables
Assets Allocation: MTPF (Gold Fund) Mar '17 Apr '17Gold (%) 84.0 86.9Cash (%) 13.6 10.6Other Including receivables (%) 2.4 2.5
EQT DEBT MMKT GOLDExpense Ratio* 3.06% 2.05% 2.06% 2.87% This includes EQT 1.27%, Debt 0.45%, MMKT 0.42% and Gold 0.22% representing government levy, Worker's Welfare Fund and SECP fee (Annualized)
Members of Investment Committee Mohammad Shoaib, CFA Muhammad Asad Ali Asghar Ali Khan, CFA, FRM Ahmed Hassan, CFA Asif Imtiaz, CFA Zain Malik, CFA Asmar Hamoodi, CFA Imad Ansari
Allocation Scheme Equity Debt Money MarketHigh Volatility 80% 20% 0%Medium Volatility 50% 40% 10%Low Volatility 25% 60% 15%Lower Volatility 0% 50% 50%
AMC RATING AM1 (STABLE OUTLOOK)
Fund Manager’s Report - April 2017 I I N TO U C H M O N T H LY
52.9%28.9%
17.0%
1.2%
57.7%42.3%

Performance - Cumulative Returns
Fund Details
KSE Meezan Index Fund (KMIF) is a Shariah Compliant Index Fund that aims to provide investors an opportunity to track closely the performance of the KSE-Meezan Index 30 (KMI 30) by investing in companies of the Index in proportion to their weightages.
Investment Objective
Sector Allocation
As at April 28, 2017, the net assets of KSE-Meezan Index Fund (KMIF) stood at Rs. 1.19 billion. For the month of April, KMIF provided a return of 3.19%.
Fund Review
IND
EX T
RACK
ER
1M 3M 6M FYTD 1Yr 3Yr 5Yr PSD* CAGRKMIF 3.2% 0.5% 26.5% 26.54% 38.0% 72.9% - 210.3% 25.8%Benchmark 3.2% 0.8% 26.7% 27.67% 39.5% 83.2% - 248.7% 28.8%* Performance start date of May 23, 2012. ^NAV to NAV with dividend reinvested
Annual Returns FY16 FY15 FY14 FY13 FY12 FY11 FY10 FY09KMIF 13.3% 17.1% 26.5% 49.6% -2.4%* - - -Benchmark 15.5% 20.1% 29.9% 54.4% -1.9% - - -
KSE-Meezan IndexFund (KMIF)
Fund Type: Open EndRisk Level HighLaunch Date 23rd May 2012Trustee CDCAuditors KPMG Taseer Hadi & Co.Registrar Meezan Bank Ltd.Unit Types A and BManagement Fee 1% Front End Load 2%Fund Category Index Tracker SchemeBack End Load NilLeverage NilListing PSXAMC Rating AM1Rating Agency JCRVISPricing Mechanism ForwardBenchmark KMI-30 IndexValuation Days Mon-Fri Subscription/ Redemption Days Mon-Fri 9am – 1pmFund Manager Asmar Hamoodi, CFA
SWWF Disclosure: The Fund has provided an amount of Rs. 8.50 million against Sindh Workers’ Welfare Fund (SWWF) Liability. Had that not been provided, the NAV per unit/return for the period would have been higher by Rs. 0.72/0.72%.Disclaimer: This publication is for informational purpose only and nothing herein should be construed as a solicitation, recommendation or an o�er to buy or sell any fund. All investments in mutual funds are subject to market risk. The NAV based prices of units and any dividends/returns thereon are dependent on force and factors a�ecting the capital markets. These may go up or down based on market conditions. Past performance is not necessarily indicative of future results. Performance data does not include cost incurred by investor in the form of sales-load etc.
Fund Net Assets
Assets Allocation
Mar '17 Apr '17 MoM %Net Assets (Rs mn) 1,131 1,185 4.07%NAV Per Unit (Rs) 96.77 99.85 3.19%Expense Ratio* 2.73%
Mar '17 Apr '17Equity (%) 97.8 98.1Cash (%) 1.5 0.9Other Including receivables (%) 0.7 1.0
*This includes 1.12% representing government levy, Worker's Welfare Fund and SECP fee.(Annualized)
* 38 days of operations
Fund’s Performance
KMIF Benchmark
Top Ten Equity Holdings: (% of Total Assets)
Lucky Cement Ltd. 10% Pakistan Oil�elds Ltd. 4%Oil & Gas Development Co. Ltd. 9% Dawood Hercules 4%The Hub Power Co. Ltd. 9% The Searle Co. Ltd. 4%Engro Corporation 8% Engro Fertilizer Ltd. 3%Pakistan Petroleum Ltd. 7% Mari Petroleum Ltd. 3%
Cement
Power Generation & Distribution
Oil & Gas Exploration Comanies
Fertilizer
Oil & Gas Marketing Companies
Others
Members of Investment Committee Mohammad Shoaib, CFA Muhammad Asad Ali Asghar Ali Khan, CFA, FRM Ahmed Hassan, CFA Asif Imtiaz, CFA Zain Malik, CFA Asmar Hamoodi, CFA Imad Ansari
AMC RATING AM1 (STABLE OUTLOOK)
Fund Manager’s Report - April 2017 I I N TO U C H M O N T H LY
90110130150170190210230250270290310330350370390
May-12
Jul-12Sep-12
Nov-12
Jan-13M
ar-13M
ay-13Jul-13Sep-13
Nov-13
Jan-14M
ar-14M
ay-14Jul-14Sep-14
Nov-14
Jan-15M
ar-15M
ay-15Jul-15Sep-15
Nov-15
Jan-16M
ar-16M
ay-16Jul-16Sep-16
Nov-16
Jan-17Apr-17
6%
22%
20%11%
24%
17%

Fund Details
To generate returns on Investment as per respective allocation plans by investing in Shariah Compliant Fixed Income and Equity Mutual Funds in line with the risk tolerance of the Investor.
Investment Objective
As at April 28, 2017, total size of net assets of Meezan Financial Planning Fund of Fund (MFPFOF) stood at Rs. 8,345 million. For the month of April, the NAV of Aggressive plan increased by 2.21% while the NAV of moderate, Conservative plan, MAAP-I, MAAP-II, MAP-III and MAAP-IV provided a return of 1.63%, 0.88%, 2.58%, 2.57%, 2.70% and 2.83% respectively.
Fund Review
FUN
D O
F FUN
DS
Fund Type: Open EndRisk Level Plan specific Launch Date 11th April 2013Trustee CDCAuditors KPMG Taseer Hadi & Co.Registrar Meezan Bank Ltd.Unit Types A and BManagement Fee Same as underlying
Funds and 1% on CashFront End Load Aggressive Plan 2.0%
Moderate Plan 1.5%Conservative Plan 1.0%Other Plans 0% to 3%
Fund Category Fund of FundsBack End Load NilLeverage NilListing PSXAMC Rating AM1Rating Agency JCRVISPricing Mechanism ForwardFund Manager Ahmed Hassan, CFABenchmark Aggressive Allocation Plan Weighted avg. return of KMI 30 Index and Moderate Allocation Plan Fixed Income/Money Market Scheme as per Conservative Allocation Plan actual allocation.MCPP – Plan II MAAP – I, II, III & IV Valuation Days Mon-FriSubscription/ Redemption Days Mon-Fri 9am – 4pm
Disclaimer: This publication is for informational purpose only and nothing herein should be construed as a solicitation, recommendation or an o�er to buy or sell any fund. All investments in mutual funds are subject to market risk. The NAV based prices of units and any dividends/returns thereon are dependent on force and factors a�ecting the capital markets. These may go up or down based on market conditions. Past performance is not necessarily indicative of future results. Performance data does not include cost incurred by investor in the form of sales-load etc.
Fund Net AssetsRs (Mn) Mar '17 Apr '17 MoM %Aggressive 758 767 1.18%Moderate 459 453 -1.29%Conservative 415 418 0.68%MAAP - I 1,444 1,460 1.16%MAAP - II 1,051 1,068 1.56%MAAP - III 3,313 3,226 -2.64%MAAP - IV 957 954 -0.31%
Annual ReturnsFY16 FY15 FY14 FY13 FY12 FY11 FY10 FY09
Aggressive 13.3% 16.5% 22.1% 9.0%* - - - -Benchmark 11.7% 15.1% 21.7% 7.9% - - - -Moderate 11.3% 13.6% 17.3% 6.5%* - - - -Benchmark 10.0% 12.9% 18.2% 6.2% - - - -Conservative 8.7% 10.1% 12.6% 3.8%* - - - -Benchmark 6.7% 8.6% 11.2% 3.6% - - - -MCPP – II2 6.5% 0.4%*** - - - - - -Benchmark 5.6% 2.0% - - - - - -MAAP - I3 11.7% - - - - - - -Benchmark 14.9% - - - - - - -MAAP - II4 14.8% - - - - - - -Benchmark 18.3% - - - - - - -MAAP – III5 13.5% - - - - - - -Benchmark 17.1% - - - - - - -MAAP – IV6 0.7% - - - - - - -Benchmark 0.4% - - - - - - -* 80 days of operations, 2 196 days of operations, 3 356 days of operation, 4 219 days of operation, 5 156 days of operation, 6 37 days of operation.
NAV per unitRs Mar '17 Apr '17 MoM%Aggressive 88.13 90.07 2.21%Moderate 75.32 76.55 1.63%Conservative 66.92 67.51 0.88%MAAP - I 66.53 68.25 2.58%MAAP - II 66.96 68.68 2.57%MAAP - III 66.12 67.91 2.70%MAAP - IV 58.70 60.36 2.83%
MFPFOF - Allocation Plan1M 3M 6M FYTD 1Yr 3Yr 5Yr PSD*
Aggressive 2.2% 2.2% 17.6% 22.8% 29.4% 66.0% - 115.5%Benchmark 2.1% 0.6% 18.1% 19.3% 27.5% 59.4% 109.2%Moderate 1.6% 1.6% 12.8% 17.2% 21.6% 51.1% - 85.1%Benchmark 1.74% 0.9% 13.9% 15.3% 21.1% 49.2% 89.1%Conservative 0.9% 0.7% 7.9% 11.2% 13.9% 35.2% - 55.4%Benchmark 1.0% 0.9% 7.8% 9.1% 12.3% 28.8% 48.9%MAAP – I**** 2.6% 2.4% 20.3% 26.3% 33.8% - - 41.0%Benchmark 2.7% 0.9% 21.7% 23.9% 33.3% - - 42.5%MAAP – II***** 2.6% 2.5% 19.9% 25.4% 32.6% - - 44.0%Benchmark 2.7% 0.9% 21.1% 23.2% 32.3% - - 45.8%MAAP – III# 2.7% 2.7% 20.3% 25.7% 32.4% - - 42.6%Benchmark 2.7% 0.8% 21.4% 23.5% 32.1% - - 44.6%MAAP – IV## 2.8% 3.0% 20.9% 24.7% - - - 25.6%Benchmark 2.8% 0.9% 21.3% 21.7% - - - 22.3%
* Performance start date of April 12, 2013.**** Performance start date of July 10, 2015,
***** Performance start date of November 24, 2015.
^NAV to NAV with dividend reinvested # Performance start date of January 26, 2016. ## Performance start date of May 24, 2016.
Meezan FinancialPlanning Fund ofFunds (MFPFOF)
Members of Investment Committee Mohammad Shoaib, CFAMuhammad AsadAli AsgharAli Khan, CFA, FRM Ahmed Hassan, CFAAsif Imtiaz, CFAZain Malik, CFAAsmar Hamoodi, CFAImad Ansari
AMC RATING AM1 (STABLE OUTLOOK)
Fund Manager’s Report - April 2017 I I N TO U C H M O N T H LY

Fund Details
To generate returns on Investment as per respective allocation plans by investing in Shariah Compliant Fixed Income and Equity Mutual Funds in line with the risk tolerance of the Investor.
Investment Objective
As at April 28, 2017, total size of net assets of Meezan Financial Planning Fund of Fund (MFPFOF) stood at Rs. 8,345 million. For the month of April, the NAV of Aggressive plan increased by 2.21% while the NAV of moderate, Conservative plan, MAAP-I, MAAP-II, MAP-III and MAAP-IV provided a return of 1.63%, 0.88%, 2.58%, 2.57%, 2.70% and 2.83% respectively.
Fund Review
FUN
D O
F FU
ND
S
Fund Type: Open EndRisk Level Plan specific Launch Date 11th April 2013Trustee CDCAuditors KPMG Taseer Hadi & Co.Registrar Meezan Bank Ltd.Unit Types A and BManagement Fee Same as underlying
Funds and 1% on CashFront End Load Aggressive Plan 2.0%
Moderate Plan 1.5%Conservative Plan 1.0%Other Plans 0% to 3%
Fund Category Fund of FundsBack End Load NilLeverage NilAMC Rating AM1 Rating Agency JCRVISPricing Mechanism ForwardFund Manager Ahmed Hassan, CFABenchmark Aggressive Allocation Plan Weighted avg. return of Moderate Allocation Plan KMI 30 Index and Fixed Conservative Allocation Plan Income/ Money Market MCPP – Plan II Scheme as per actual MAAP – I, II , III & IV Allocation.Valuation Days Mon-Fri Subscription/ Redemption Days Mon-Fri 9am – 4pm
SWWF Disclosure: The Fund has provided an amount of Rs. 4.36mn (Aggressive), Rs.2.27mn (moderate), Rs.1.32mn (Conservative), 8.95mn (MAAP – I), 6.89mn (MAAP – II), 20.45mn (MAAP – III) and 3.85mn (MAAP – IV) against Sindh Workers’ Welfare Fund (SWWF) Liability. Had that not been provided, the NAV per unit/return for the period would have been higher by Rs. 0.51/0.57% (Aggressive), Rs. 0.38/0.50% (Moderate), Rs. 0.21/0.32% (Conservative), Rs. 0.42/0.61% (MAAP - I), Rs. 0.44/0.65% (MAAP - II), Rs. 0.43/0.63% (MAAP - III) and Rs. 0.24/0.40% (MAAP - IV).Disclaimer: This publication is for informational purpose only and nothing herein should be construed as a solicitation, recommendation or an o�er to buy or sell any fund. All investments in mutual funds are subject to market risk. The NAV based prices of units and any dividends/returns thereon are dependent on force and factors a�ecting the capital markets. These may go up or down based on market conditions. Past performance is not necessarily indicative of future results. Performance data does not include cost incurred by investor in the form of sales-load etc.
Expense RatioApril '17
Aggressive 1.14% 0.92%*Moderate 0.84% 0.61%*Conservative 0.71% 0.44%*MAAP - I 1.04% 0.84%*MAAP - II 1.07% 0.86%*MAAP - III 1.03% 0.84%*MAAP - IV 0.80% 0.60%*
*This represents government levy, Worker's Welfare Fund and SECP fee. (Annualized)
Asset Allocation:
Portfolio: Salient Features (MFPF)Bene�ts • Strategy re�ective of investor’s risk appetite as market
conditions change• Up to 100% equity Participation possible, based on
fund managers outlook on the market• Actively managed by experienced Fund Managers• Tax Rebate as per Section 62 of ITO
Investment Policy Based on the Fund Manager’s outlook on asset classes, the allocation plan will actively allocate its portfolio between the Equity asset Schemes and Fixed Income/Money Market Schemes based on the macroeconomic view and outlook of such asset classes.For exposure to equities, this Plan shall primarily be invested in Islamic Equity and Islamic Index Funds managed by Al Meezan and also other Asset Management Companies. Whereas for taking exposure to Fixed Income/Money Market, the Plan shall invest in Islamic Money Market and Islamic Fixed Income Scheme(s) managed by Al Meezan or any other Asset Management Company as well as in Cash at Bank Accounts of Islamic Banks and licensed Islamic Banking windows of conventional Banks.
Trading Strategy The allocation plan will actively allocate its portfolio between the Equity Schemes and Fixed Income/Money Market Schemes based on the Fund Manager’s view on macroeconomic outlook of such asset classes.
Aggressive 69.7% 28.8% 1.2% 0.3%Moderate 49.4% 47.6% 3.0% 0.0%Conservative 24.7% 71.4% 3.8% 0.1%MAAP-I 82.1% 17.6% 0.2% 0.0%MAAP-II 82.9% 16.8% 0.2% 0.0%MAAP-III 85.0% 14.4% 0.6% 0.0%MAAP-IV 86.5% 13.3% 0.2% 0.0%
Equity/IndexFunds (%)
Income/Moneymarket Funds (%) Cash (%) Other Including
receivables (%)
Meezan FinancialPlanning Fund ofFunds (MFPFOF)
Members of Investment Committee Mohammad Shoaib, CFAMuhammad AsadAli AsgharAli Khan, CFA, FRM Ahmed Hassan, CFAAsif Imtiaz, CFAZain Malik, CFAAsmar Hamoodi, CFAImad Ansari
AMC RATING AM1 (STABLE OUTLOOK)
Fund Manager’s Report - April 2017 I I N TO U C H M O N T H LY

Fund Details
“Meezan Gold Fund (MGF)” aims to provide maximum exposure to prices of Gold in a Shariah Compliant (Islamic) manner, by investing a significant portion of the Fund’s net assets in deliverable gold based contracts available on Pakistan Mercantile Exchange (PMEX).
Investment Objective
Net assets of Meezan Gold Fund (MGF) as at April 28, 2017 stood at Rs. 410 million. The fund’s NAV increased by 0.44% during the month.
Fund Review
GO
LD FU
ND
S
Meezan GoldFund (MGF)
Fund Net AssetsRs (mn) Mar '17 Apr '17 MoM %Net Assets (Rs mn) 372 410 10.12%NAV Per Unit (Rs) 51.49 51.72 0.44%Expense Ratio* 3.88%*This includes 0.54% representing government levy, Worker's Welfare Fund andSECP fee. (Annualized)
SWWF Disclosure: The Fund has provided an amount of Rs. 0.53 million against Sindh Workers’ Welfare Fund (SWWF) Liability. Had that not been provided, the NAV per unit/return for the period would have been higher by Rs. 0.07 / 0.13%.Disclaimer: This publication is for informational purpose only and nothing herein should be construed as a solicitation, recommendation or an o�er to buy or sell any fund. All investments in mutual funds are subject to market risk. The NAV based prices of units and any dividends/returns thereon are dependent on force and factors a�ecting the capital markets. These may go up or down based on market conditions. Past performance is not necessarily indicative of future results. Performance data does not include cost incurred by investor in the form of sales-load etc.
Performance - Cumulative Returns (net of expenses)
Annual Returns
FY16 FY15 FY14 FY13 FY12 FY11 FY10 FY09MGF 10.5%* - - - - - - -Benchmark 16.0% - - - - - - -
1M 3M 6M FYTD 1Yr 3Yr 5Yr PSD*MGF 0.4% 2.4% -1.7% -5.15% -2.3% - - 4.83%Benchmark 0.9% 2.7% 0.3% -1.75% 0.7% - - 13.7%* Performance start date of Aug 13, 2015, ^NAV to NAV with dividend reinvested.
Fund Type: Open EndRisk Level HighLaunch Date 13th Aug 2015Trustee CDCAuditors KPMG Taseer Hadi & Co.Registrar Meezan Bank Ltd.Unit Types A, B and CManagement Fee 1%Front End Load 2%Fund Category Commodity FundBack End Load NilBenchmark Combination of 70% PKR base closing price
of physical gold and 30% 3 Month averagedeposit rates of 3 AA rated Islamic Bank
Leverage NilListing To be listed on PSXAMC Rating AM1Rating Agency JCRVISPricing Mechanism ForwardValuation Days Mon-FriSubscription/Redemption Days Mon-Fri 9am – 4pmFund Manager Ali Hassan, CFA, FRM
Mar '17 Apr '17Gold (%) 89.7 87.5Cash (%) 10.2 12.4Other Including receivables (%) 0.1 0.1
Assets Allocation
Portfolio: Salient FeaturesKey Advantages Fully Shariah Compliant means of investing in gold
E�cient Store of value, thereby providing investors the opportunity to invest in a high priced (valuable) commodity through unit certi�cates (mutual funds)Tracks price performance of gold
Maximum exposure to gold prices
Good hedge against In�ation
Investment Strategy
MGF, in line with its Investment Objectives, will invest in Authorized Investments as approved by the Shariah AdvisorTo meet Fund’s investment objective, at least seventy percent (70%) of Fund’s net assets, will remain invested in deliverable gold based contracts available at a Commodity Exchange, during the year based on quarterly average investment calculated on daily basis.Remaining net assets of the Fund shall be invested in cash and near cash instruments which include cash in bank accounts of Islamic banks and licensed Islamic banking windows of conventional banks (excluding TDR). However, at least 10% of the net assets of the Fund shall remain invested in cash and near cash instruments at all times.Weighted Average Time to Maturity of Portfolio: Not more than 4 years
Investment Horizon
Long term(Investors are advised to take a long term view of aminimum of 3 to 5 years)
* 322 days of operations.
Members of Investment Committee Mohammad Shoaib, CFAMuhammad AsadAli AsgharAli Khan, CFA, FRM Ahmed Hassan, CFAAsif Imtiaz, CFAZain Malik, CFAAsmar Hamoodi, CFAImad Ansari
AMC RATING AM1 (STABLE OUTLOOK)
Fund Manager’s Report - April 2017 I I N TO U C H M O N T H LY

Performance - Cumulative Returns
Fund Details
To seek long term capital appreciation through investments in Shariah compliant equity stocks, primarily from the energy sector / segment / industry, as defined in the constitutive documents.
Investment Objective
Net assets of Meezan Energy Fund (MEF) as at April 28, 2017 stood at Rs. 1.12 billion. The fund’s NAV increased by 4.41% during the month.
Fund Review
SECT
OR
SPEC
IFIC
FU
ND
1M 3M 6M FYTD 1Yr 3Yr 5Yr PSD*MEF 4.4% 4.9% - 14.9% - - - 14.9%Benchmark 3.2% 0.8% - 17.5% 17.5%* Performance start date of November 29, 2006, ^ NAV to NAV with dividend reinvested
Annual ReturnsFY16 FY15 FY14 FY13 FY12 FY11 FY10 FY09
MEF - - - - - - - -Benchmark - - - - - - - -
Meezan EnergyFund (Mef)
Fund Type: Open EndRisk Level HighLaunch Date 29th Nov 2016Trustee CDCAuditors KPMG Taseer Hadi & Co.Registrar Meezan Bank Ltd.Unit Types A, B and CManagement Fee 2%Front End Load 3%Fund Category Sector (Equity) SchemeBack End Load NilBenchmark KMI-30Leverage NilListing To be listed on PSXAMC Rating AM1Rating Agency JCRVISPricing Mechanism ForwardValuation Days Mon-Fri Subscription/ Redemption Days Mon-Fri 9am – 4pmFund Manager Ahmed Hassan, CFA
SWWF Disclosure: The Fund has provided an amount of Rs. 3.12 million against Sindh Workers’ Welfare Fund (SWWF) Liability. Had that not been provided, the NAV per unit/return for the period would have been higher by Rs. 0.15 / 0.27%.Disclaimer: This publication is for informational purpose only and nothing herein should be construed as a solicitation, recommendation or an o�er to buy or sell any fund. All investments in mutual funds are subject to market risk. The NAV based prices of units and any dividends/returns thereon are dependent on force and factors a�ecting the capital markets. These may go up or down based on market conditions. Past performance is not necessarily indicative of future results. Performance data does not include cost incurred by investor in the form of sales-load etc.
Fund Net Assets
Assets Allocation
Mar '17 Apr '17 MoM %Net Assets (Rs mn) 1,102 1,117 6.82%NAV Per Unit (Rs) 55.04 57.47 4.41%
Equity (%) 80.27Cash (%) 19.08Other receivables (%) 0.65Expense Ratio* 2.74%
*This includes 0.78% representing government levy, Worker's Welfare Fund andSECP fee. (Annualized)
(Selling and Marketing expenses -for the period ended April 28, 2017, Rs. 0.66 million)
Sector Allocation
Top Ten Equity Holdings: (% of Total Assets)
Sui Northern Gas Pipelines Ltd. 14% Pakistan Oil�elds Ltd. 6%Oil & Gas Development Co. Ltd. 12% Hi-Tech Lubricants Ltd. 6%Mari Petroleum Ltd. 8% Hub Power Co. Ltd. 4%K-Electric Ltd. 8% Shell Pakistan Ltd. 4%Hascol Petroleum Ltd. 8% Sui Southern Gas Co. Lid. 3%
Portfolio: Salient FeaturesBene�ts Up to 100% equity Participation possible in energy sector,
based on fund managers outlook on the marketParticipation in a mature sector that is envisioned to bene�t from the Flagship CPEC projects.Actively managed by experienced Fund ManagersTax Rebate as per Section 62 of ITO
InvestmentPolicy
MEF shall primarily invest in Shariah compliant equity securities of the energy sector / segment / Industry as de�ned in the o�ering document. In case the fund manager expects the stock market to drop, based on his analysis of macroeconomic factors such as interest rates, economic growth rates, political climate, corporate earnings, stock market valuations, etc, portfolio may be temporarily allocated to other allowable asset classes, subject to the prescribed limits. While making stock selection decisions, fundamental and technical models will be employed and qualitative and quantitative analysis will be conducted to identify undervalued stocks.
Oil & Gas Exploration Companies
Oil & Gas Marketing Companies
Power Generation & Distribution
Re�nery
Others
Members of Investment Committee Mohammad Shoaib, CFAMuhammad AsadAli AsgharAli Khan, CFA, FRM Ahmed Hassan, CFAAsif Imtiaz, CFAZain Malik, CFAAsmar Hamoodi, CFAImad Ansari
AMC RATING AM1 (STABLE OUTLOOK)
37%
29%
20%
12%2%
Fund Manager’s Report - April 2017 I I N TO U C H M O N T H LY

Fund Details
To actively allocate its portfolio between the equity schemes and fixed income/money market schemes based on the macroeconomic view of the fund manager on such asset classes.
Investment Objective
As at April 28, 2017, total size of net assets of Meezan Strategic Allocation Fund (MSAF) stood at Rs. 6.49 billion. For the month of April, the NAV of Meezan Strategic Allocation Plan- I (MSAP-I) increased by 2.56%, Meezan Strategic Allocation Plan- II (MSAP-II) increased by 2.60% and Meezan Strategic Allocation Plan- III (MSAP-II) increased by 2.56% respectively.
Fund Review
FUN
D O
F FUN
DS
Fund Type: Open EndRisk Level Low to ModerateLaunch Date 19th Oct 2016 (MSAP I)
21th Dec 2016 (MSAP II)16th Feb 2017 (MSAP III)20th Apr 2017 (MSAP IV)
Trustee CDCAuditors KPMG Taseer Hadi & Co.Registrar Meezan Bank Ltd.Unit Types B and CManagement Fee Nil (1% if investment) is made in CIS
of other AMCs) Front End Load 3%Fund Category Fund of FundsBack End/Contingent Load Contingent Load of 3% if redeemed within
one year of close of Initial Subscription PeriodNil after one year.
Benchmark Weighted avg. return of KMI 30Index and Fixed Income/Money MarketScheme as per actual allocation
Leverage NilListing To be listed on PSXAMC Rating AM1 Rating Agency JCRVISPricing Mechanism ForwardValuation Days Mon-Fri Subscription/ Redemption Days Mon-Fri 9am – 4pmFund Manager Ahmed Hassan, CFAMembers of Investment Committee Mohammad Shoaib, CFA
Muhammad AsadAli AsgharAli Khan, CFA, FRM Ahmed Hassan, CFAAsif Imtiaz, CFAZain Malik, CFAAsmar Hamoodi, CFAImad Ansari
SWWF Disclosure: The Fund has provided an amount of Rs. 7.71mn (MSAP - I), 1.60mn (MSAP - II) and 0.91mn (MSAP-III) against Sindh Workers’ Welfare Fund (SWWF) Liability. Had that not been provided, the NAV per unit/return for the period would have been higher by Rs. 0.16 / 0.27% (MSAP - I), Rs. 0.05 / 0.09% (MSAP - II) and Rs. 0.02 / 0.05% (MSAP - III).Disclaimer: This publication is for informational purpose only and nothing herein should be construed as a solicitation, recommendation or an o�er to buy or sell any fund. All investments in mutual funds are subject to market risk. The NAV based prices of units and any dividends/returns thereon are dependent on force and factors a�ecting the capital markets. These may go up or down based on market conditions. Past performance is not necessarily indicative of future results. Performance data does not include cost incurred by investor in the form of sales-load etc.
NAV per unitRs Mar '17 Apr '17 MoM%MSAP I 56.27 57.71 2.56%MSAP II 51.00 52.32 2.60%MSAP III 49.94 51.22 2.56%MSAP IV 49.92
Expense Ratio
Performance - Cumulative Returns1M 3M 6M FYTD 1Yr 3Yr 5Yr PSD*
MSAP-I* 2.6% 2.6% 15.3% 15.4% - - - 15.4%Benchmark 2.7% 0.8% 14.4% 14.5% - - - 14.5%MSAP-II** 2.6% 2.1% - 4.6% - - - 4.6%Benchmark 2.6% 0.8% - 3.1% - - - 3.1%MSAP-III*** 2.6% - - 2.4% - - - 2.4%Benchmark 2.0% - - 0.5% - - - 0.5%MSAP-IV**** -0.2% - - -0.2% - - - -0.2%Benchmark 0.1% - - 0.1% - - - 0.1%* Performance start date of October 19, 2016. ** Performance start date of December 21, 2016. *** Performance start date of February 16, 2017. **** Performance start date of April 20, 2017 ^ NAV to NAV with dividend reinvested
Annual ReturnsFY16 FY15 FY14 FY13 FY12 FY11 FY10 FY09
MSAP-I - - - - - - - -Benchmark - - - - - - - -MSAP-II - - - - - - - -Benchmark - - - - - - - -MSAP-III - - - - - - - -Benchmark - - - - - - - -MSAP-IV - - - - - - - -Benchmark - - - - - - - -
Portfolio: Salient FeaturesBene�ts
• Strategy re�ective of investor’s risk appetite as market conditions change• Up to 100% equity Participation possible, based on fund managers
outlook on the market• Actively managed by experienced Fund Managers• Tax Rebate as per Section 62 of ITO
InvestmentPolicy
Based on the Fund Manager’s outlook on asset classes, the allocation plan will actively allocate its portfolio between the Equity asset Schemes and Fixed Income/Money Market Schemes based on the macroeconomic view and outlook of such asset classes.For exposure to equities, this Plan shall primarily be invested in Islamic Equity and Islamic Index Funds managed by Al Meezan and also other Asset Management Companies. Whereas for taking exposure to Fixed Income/Money Market, the Plan shall invest in Islamic Money Market and Islamic Fixed Income Scheme(s) managed by Al Meezan or any other Asset Management Company as well as in Cash at Bank Accounts of Islamic Banks and licensed Islamic Banking windows of conventional Banks.
TradingStrategy
The allocation plan will actively allocate its portfolio between the Equity Schemes and Fixed Income/Money Market Schemes based on the Fund Manager’s view on macroeconomic outlook of such asset classes.
Fund Net AssetsMar '17 Apr '17 MoM %
MSAP I 2,761 2,827 2.40%MSAP II 1,741 1,767 1.47%MSAP III 1,779 1,872 5.25%MSAP IV 19
Asset Allocation:
MSAP I 81.5% 18.4% 0.1% 0.1%MSAP II 79.3% 20.5% 0.2% 0.0%MSAP III 79.2% 19.3% 1.5% 0.0%MSAP IV 40.9% 2.9% 55.9% 0.2%
Equity/ IndexFunds (%)
Income/MoneyMarket Funds (%) Cash (%) Other Including
receivables (%)
Meezan Strategic Allocation Fund (MSAF)
AMC RATING AM1 (STABLE OUTLOOK)
Fund Manager’s Report - April 2017 I I N TO U C H M O N T H LY
Apr'17MSAP I 0.67% 0.51%*MSAP II 0.36% 0.23%*MSAP III 0.35% 0.23%*MSAP IV 0.38% 0.04%**This represents government levy, Worker's Welfare Fund and SECP fee. (Annualized)

Performance - Cumulative Returns
Fund Details
The objective of Meezan Asset Allocation Fund (MAAF) is to earn a potentially high return through asset allocation between Shariah Compliant Equity Instruments, Shariah Compliant Fixed Income Instruments, Shariah Compliant Money Market Instruments and any other Shariah Compliant instrument as permitted by the SECP and Shariah Advisor.
Investment Objective
Net assets of Meezan Asset Allocation Fund (MAAF) as at April 28, 2017 stood at Rs. 2.71 billion. The fund’s NAV increased by 3.50% during the month.
Fund Review
ASS
ET A
LLO
CATI
ON
1M 3M 6M FYTD 1Yr 3Yr 5Yr PSD*MAAF 3.5% 3.2% 24.4% 27.3% 31.1% - - 30.8%Benchmark 2.5% 0.8% 22.7% 22.4% 28.7% - - 28.9%* Performance start date of Apr 18, 2016, ^ NAV to NAV with or without dividend reinvested
Annual ReturnsFY16 FY15 FY14 FY13 FY12 FY11 FY10 FY09
MAAF 2.8%* - - - - - - -Benchmark 5.0% - - - - - - -* 37 days of operations.
Fund Type: Open EndRisk Level Low to ModerateLaunch Date 18th Apr 2016Trustee CDCAuditors KPMG Taseer Hadi & Co.Registrar Meezan Bank Ltd.Management Fee 1.5% Fund Category Asset AllocationFront End Load 3%Back End Load NilLeverage NilListing To be listed on PSXAMC Rating AM1 Rating Agency JCRVISPricing Mechanism ForwardValuation Days Mon-Fri Subscription/ Redemption Days Mon-Fri 9am – 4pmBenchmark Weighted avg. return of KMI 30
Index and Fixed Income/Money MarketScheme as per actual allocation
Fund Manager Ahmed Hassan, CFA
SWWF Disclosure: The Fund has provided an amount of Rs. 12.10 million against Sindh Workers’ Welfare Fund (SWWF) Liability. Had that not been provided, the NAV per unit/return for the period would have been higher by Rs. 0.29 / 0.45%. Disclaimer: This publication is for informational purpose only and nothing herein should be construed as a solicitation, recommendation or an o�er to buy or sell any fund. All investments in mutual funds are subject to market risk. The NAV based prices of units and any dividends/returns thereon are dependent on force and factors a�ecting the capital markets. These may go up or down based on market conditions. Past performance is not necessarily indicative of future results. Performance data does not include cost incurred by investor in the form of sales-load etc.
Fund Net AssetsMar '17 Apr'17 MoM %
Net Assets (Rs mn) 2,069 2,713 31.13%NAV Per Unit (Rs) 62.78 64.98 3.50%Expense Ratio* 4.18% *This includes 1.73% representing government levy, Worker's Welfare Fund and SECP fee. (Annualized)
Assets Allocation Mar'17 Apr '17
Equity (%) 70.1 72.3Money Market (%) 0.0 0.0Cash (%) 29.3 27.1Other Including receivables (%) 0.6 0.7
Sector Allocation
Top Ten Equity Holdings: (% of Total Assets)
Engro Corporation 8% Pak Elektron Ltd. 3%
Sui Northern Gas Pipelines Ltd. 7% Packages Ltd. 3%
Lucky Cement Ltd. 7% The Searle Co. Ltd. 3%
DG Khan Cement Ltd. 6% Engro Fertilizer 3%
K-Electric Ltd. 3% Oil & Gas Development Co. Ltd. 3%
Fund’s Performance
Cement
Oil & Gas Exploration Companies
Oil & Gas Marketing Companies
Fertilizer
Pharmaceuticals
Others
Meezan AssetAllocation Fund(MAAF)
Members of Investment Committee Mohammad Shoaib, CFAMuhammad AsadAli AsgharAli Khan, CFA, FRM Ahmed Hassan, CFAAsif Imtiaz, CFAZain Malik, CFAAsmar Hamoodi, CFAImad Ansari
AMC RATING AM1 (STABLE OUTLOOK)
Fund Manager’s Report - April 2017 I I N TO U C H M O N T H LY
69.00
67.00
65.00
63.00
61.00
59.00
57.00
55.00
53.00
51.00
49.00
MAAFBenchmark
(Selling and Marketing expenses -for the period ended April 28, 2017, Rs. 1.33 million)
20-A
pr
16-M
ay
9-Ju
n
12-Ju
l
5-Au
g
31-A
ug
30-S
ep
27-O
ct
22-N
ov
19-D
ec
12-Ja
n
7-Fe
b
3-M
ar
30-M
ar
28-A
pr
46%
19%
6%
12%
12%
5%
Fund Details
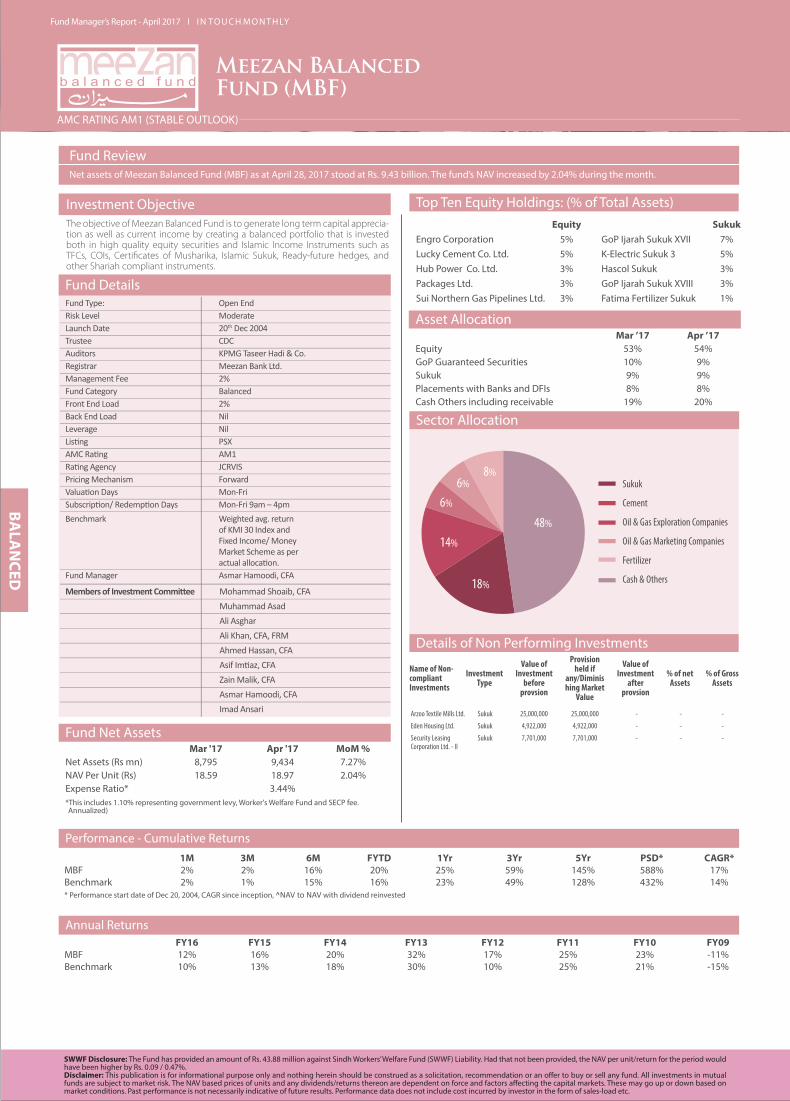
The objective of Meezan Balanced Fund is to generate long term capital apprecia-tion as well as current income by creating a balanced portfolio that is invested both in high quality equity securities and Islamic Income Instruments such as TFCs, COIs, Certificates of Musharika, Islamic Sukuk, Ready-future hedges, and other Shariah compliant instruments.
Investment Objective
Net assets of Meezan Balanced Fund (MBF) as at April 28, 2017 stood at Rs. 9.43 billion. The fund’s NAV increased by 2.04% during the month.
Fund Review
BALA
NCED
Fund Type: Open EndRisk Level ModerateLaunch Date 20th Dec 2004Trustee CDCAuditors KPMG Taseer Hadi & Co.Registrar Meezan Bank Ltd.Management Fee 2% Fund Category BalancedFront End Load 2%Back End Load NilLeverage NilListing PSXAMC Rating AM1Rating Agency JCRVISPricing Mechanism ForwardValuation Days Mon-Fri Subscription/ Redemption Days Mon-Fri 9am – 4pmBenchmark Weighted avg. return
of KMI 30 Index andFixed Income/ MoneyMarket Scheme as peractual allocation.
Fund Manager Asmar Hamoodi, CFA
SWWF Disclosure: The Fund has provided an amount of Rs. 43.88 million against Sindh Workers’ Welfare Fund (SWWF) Liability. Had that not been provided, the NAV per unit/return for the period would have been higher by Rs. 0.09 / 0.47%.Disclaimer: This publication is for informational purpose only and nothing herein should be construed as a solicitation, recommendation or an o�er to buy or sell any fund. All investments in mutual funds are subject to market risk. The NAV based prices of units and any dividends/returns thereon are dependent on force and factors a�ecting the capital markets. These may go up or down based on market conditions. Past performance is not necessarily indicative of future results. Performance data does not include cost incurred by investor in the form of sales-load etc.
Performance - Cumulative Returns1M 3M 6M FYTD 1Yr 3Yr 5Yr PSD* CAGR*
MBF 2% 2% 16% 20% 25% 59% 145% 588% 17%Benchmark 2% 1% 15% 16% 23% 49% 128% 432% 14%* Performance start date of Dec 20, 2004, CAGR since inception, ^NAV to NAV with dividend reinvested
Annual ReturnsFY16 FY15 FY14 FY13 FY12 FY11 FY10 FY09
MBF 12% 16% 20% 32% 17% 25% 23% -11%Benchmark 10% 13% 18% 30% 10% 25% 21% -15%
Meezan BalancedFund (MBF)
Asset Allocation Mar ’17 Apr ’17
Equity 53% 54%GoP Guaranteed Securities 10% 9%Sukuk 9% 9%Placements with Banks and DFIs 8% 8%Cash Others including receivable 19% 20%
Fund Net AssetsMar '17 Apr '17 MoM %
Net Assets (Rs mn) 8,795 9,434 7.27%NAV Per Unit (Rs) 18.59 18.97 2.04%Expense Ratio* 3.44% *This includes 1.10% representing government levy, Worker's Welfare Fund and SECP fee.Annualized)
Sector Allocation
Top Ten Equity Holdings: (% of Total Assets)Equity Sukuk
Engro Corporation 5% GoP Ijarah Sukuk XVII 7%Lucky Cement Co. Ltd. 5% K-Electric Sukuk 3 5%Hub Power Co. Ltd. 3% Hascol Sukuk 3%Packages Ltd. 3% GoP Ijarah Sukuk XVIII 3%Sui Northern Gas Pipelines Ltd. 3% Fatima Fertilizer Sukuk 1%
Sukuk
Cement
Oil & Gas Exploration Companies
Oil & Gas Marketing Companies
Fertilizer
Cash & Others
Details of Non Performing Investments
Arzoo Textile Mills Ltd. Sukuk 25,000,000 25,000,000 - - -
Eden Housing Ltd. Sukuk 4,922,000 4,922,000 - - -
Security Leasing Sukuk 7,701,000 7,701,000 - - -Corporation Ltd. - II
InvestmentType
Name of Non-compliantInvestments
Value ofInvestment
beforeprovsion
Value ofInvestment
afterprovsion
% of netAssets
% of GrossAssets
Provisionheld if
any/Diminishing Market
Value
Members of Investment Committee Mohammad Shoaib, CFAMuhammad AsadAli AsgharAli Khan, CFA, FRM Ahmed Hassan, CFAAsif Imtiaz, CFAZain Malik, CFAAsmar Hamoodi, CFAImad Ansari
AMC RATING AM1 (STABLE OUTLOOK)
Fund Manager’s Report - April 2017 I I N TO U C H M O N T H LY
48%
18%
14%
6%
6%8%

Disclaimer: This publication is for informational purpose only and nothing herein should be construed as a solicitation, recommendation or an o�er to buy or sell any fund. All investments in mutual funds are subject to market risk. The NAV based prices of units and any dividends/returns thereon are dependent on force and factors a�ecting the capital markets. These may go up or down based on market conditions. Past performance is not necessarily indicative of future results. Performance data does not include cost incurred by investor in the form of sales-load etc.
MIF 17.4% 21.6% 29.2% 50.7% 19.5% 38.7% 30.9% -29.5% 0.3% 28.8%Benchmark 15.5% 20.1% 29.9% 54.4% 13.6% 43.7% 36.9% -35.4% 0.9% 17.2%
AMMF 15.5% 22.0% 29.9% 50.6% 19.0% 37.4% 31.0% -32.0% 0.4% 27.0%Benchmark 15.5% 20.1% 29.9% 54.4% 13.6% 43.7% 36.9% -35.4% 0.9% 17.2%
MIIF 5.8% 8.2% 11.9% 14.5% 7.8% 11.8% 7.3% 10.1% 9.3% 10.1%Benchmark 3.5% 5.0% 5.4% 5.5% 6.0% 5.9% 5.8% 6.1% 5.8% 5.0%
MCF 4.6% 7.5% 7.1% 8.8% 10.7% 11.0% 10.1% 8.0% - -Benchmark 4.5% 6.2% 6.6% 6.9% 8.1% 8.2% 7.5% 7.6% - -
MSF 5.1% 6.8% 8.5% 9.1% 11.2% 11.5% 9.8% - - -Benchmark 4.5% 6.2% 6.6% 6.9% 8.1% 8.2% 7.5% - - -
MTPF- Equity 18.1% 26.6% 32.4% 54.90% 16.8% 36.0% 31.5% -25.8% 3.1% -MTPF- Debt 4.5% 6.4% 7.7% 8.30% 9.5% 10.9% 8.5% 10.2% 8.3% -MTPF- MMKT 4.0% 6.9% 6.9% 7.80% 10.9% 10.7% 8.5% 11.1% 7.7% -
KMIF 13.3% 17.1% 26.5% 49.6% -2.4% - - - - -Benchmark 15.5% 20.1% 29.9% 54.4% -1.9% - - - - -
MBF 12.1% 15.9% 19.6% 31.8% 16.8% 25.4% 22.7% -10.8% 1.0% 25.5%Benchmark 9.5% 12.6% 17.7% 30.0% 9.8% 24.8% 21.3% -14.5% 3.4% 11.1%
Aggressive 13.3% 16.5% 22.1% 9.0% - - - - - -Benchmark 11.7% 15.1% 21.7% 7.9% - - - - - -
Moderate 11.3% 13.6% 17.3% 6.5% - - - - - -Benchmark 10.0% 12.9% 18.2% 6.2% - - - - - -
Conservative 8.7% 10.1% 12.6% 3.8% - - - - - -Benchmark 6.7% 8.6% 11.2% 3.6% - - - - - -
MCPP - I 10.5% 7.8% - - - - - - - -Benchmark 8.7% 8.5% - - - - - - - -
MCPP – II 6.5% 0.4% - - - - - - - -Benchmark 5.6% 2.0% - - - - - - - -
MAAP – I 11.7% - - - - - - - - -Benchmark 14.9% - - - - - - - - -
MAAP – II 14.8% - - - - - - - - -Benchmark 18.3% - - - - - - - - -
MAAP – III 13.5% - - - - - - - - -Benchmark 17.1% - - - - - - - - -
MAAP – IV 0.7% - - - - - - - - -Benchmark 0.4% - - - - - - - - -
MGF 10.5% - - - - - - - - -Benchmark 16.0% - - - - - - - - -
MAAF 2.8% - - - - - - - - -Benchmark 5.0% - - - - - - - - -
FY16 FY15 FY14 FY13 FY12 FY11 FY10 FY09 FY08 FY07
Performance- Fiscal Year Returns
AMC RATING AM1 (STABLE OUTLOOK)
Fund Manager’s Report - April 2017 I I N TO U C H M O N T H LY
^ NAV to NAV with dividend reinvested

Registered Office
Ground Floor, Block B, Finance and Trade Centre (FTC),Sharah-e-Faisal, Karachi, 74400