Embed Size (px)
Citation preview

1
In this Issue1 India-Myanmar Trade
and Investment: Prospects and Way Forward
3 Non-Tariff Measures on Indian Exports
5 Impact of Union Budget on Select Sectors
6 India-Africa Partnership in Agriculture and Farm Mechanisation
8 Export-Import Bank of India Supports Pashmina Women Weavers in Ladakh District, J&K
9 Exim Bank’s Lines of Credit
10 The Quarter That Was
12 India’s Bilateral Trade with BIMSTEC
13 Currency Currents
14 Country Scan
15 Snippets on Indian Economy
16 Trade and Partnership Opportunities
A Quarterly Publication by: EXPORT-IMPORT BANK OF INDIA
www.eximbankindia.in www.eximmitra.in
Head Office: Centre One Building, Floor 21, World Trade Centre Complex, Cuff Parade, Mumbai 400 005.
Tel.: 022 2217 2600 Email : [email protected]
India-Myanmar Trade and Investment: Prospects and Way Forward
JuNe 2019 VOL. XXXV ISSUE II
Myanmar’s geographic location gives it a natural advantage as it forms a strategic link between South Asian and Southeast Asian markets. India-Myanmar is a crucial link to the ASEAN market, and an avenue for development of India’s North East Region (NER). Myanmar shares a land border of over 1600 kms with India, through its NER states of Arunachal Pradesh, Manipur, Mizoram and Nagaland, as well as a maritime boundary in the Bay of Bengal.
Myanmar is the seventh-largest economy in the ASEAN region, accounting for 2.3% of the region’s GDP in 2018, with an average annual growth rate at 6% during 2014-2018. Going forward, Myanmar is forecast to grow at an annual average of 6.7% during 2019-2023, driven by an expected rise in foreign and domestic investment.
INDIA’S TRADE RELATIONS WITh MyANMARMyanmar’s membership in ASEAN, BIMSTEC and Mekong Ganga Cooperation has introduced a regional/sub-regional dimension to bilateral relations and imparted an added significance in the context of India’s ‘Act East’ policy. Myanmar is also associated with SAARC as an observer since 2008.
India’s exports to Myanmar increased at a CAGR of 17.9% to US$ 1.2 billion in 2018, from US$ 237.3 million in 2008. India’s imports from Myanmar, however, stood lower at US$ 445.3 million during 2018, decreasing from US$ 906.3 million in 2008 (Chart 1).
India’s export basket to Myanmar in 2018 primarily comprised mineral fuels, oils and its products, pharmaceutical products, and sugars and sugar confectionery, which together accounted for 44% of India’s total exports to Myanmar. Myanmar is India’s second largest destination for sugar exports in 2018. In 2015, the Government of Myanmar permitted the import of commodities such as sugar and diesel from India and Thailand for the purpose of re-export to meet high demand and boost local export income. However, in 2018, the Ministry of Commerce of Myanmar, suspended re-exports of sugar to stabilise the falling kyat. This may have a likely impact on India’s overall exports to Myanmar in the years to come.
India’s imports from Myanmar are largely dominated by edible vegetables and certain roots and tubers and wood and articles, which together accounted for 88% of imports from the Myanmar in 2018.
Chart 1: India’s Trade with Myanmar
1.11.4 1.4
1.71.9
2.12.3
1.92.2
1.8 1.7
--
- - -- -
-
0.71.0
0.8 0.8 0.80.6 0.5
0.2 0.1
(US$
bn)
Exports Imports Total Trade Trade Balance
2008 2009 2010 2011 2012 2013 2014 2016 2017 20182015
0.2 0.
2 0.3
0.5
0.5 0.
7 0.9
0.9 1.
1
1.1 1.
2
0.9 1.
2
1.1 1.
3
1.3 1.
4
1.4
1.0 1.
1
0.40.3
0.8
0.7
Source: ITC Trademap, derived from UN Comtrade; and Exim Bank Analysis
2
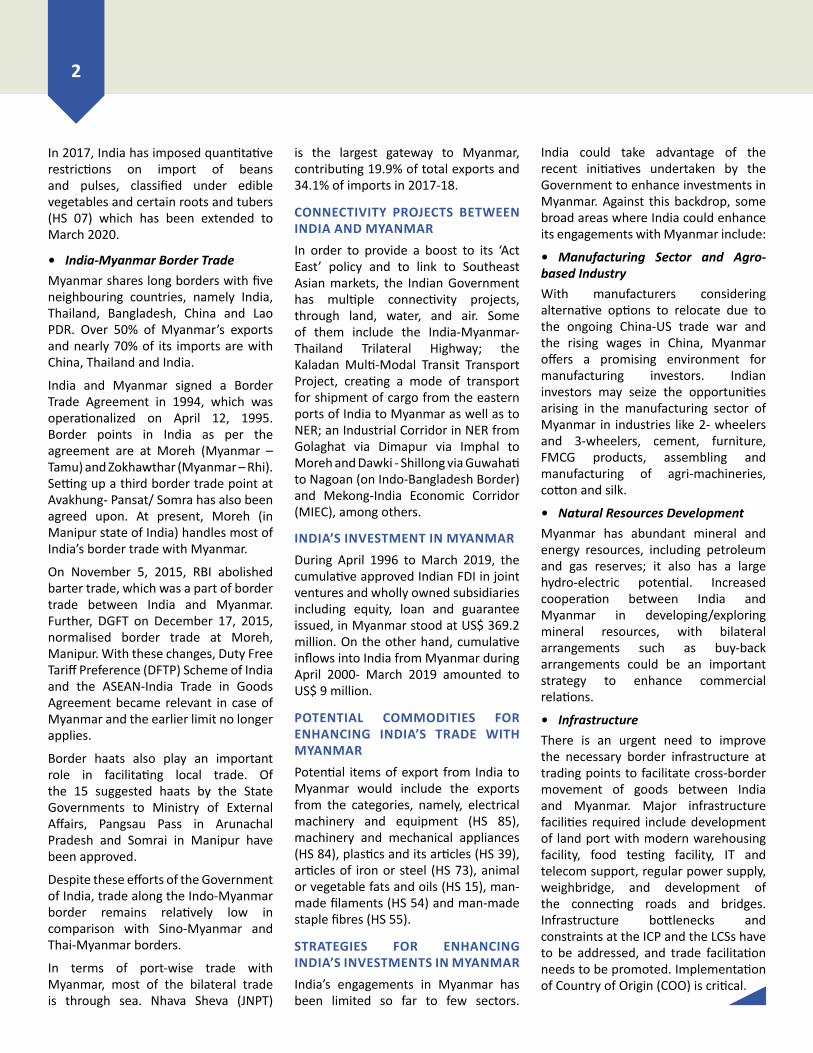
In 2017, India has imposed quantitative restrictions on import of beans and pulses, classified under edible vegetables and certain roots and tubers (HS 07) which has been extended to March 2020.
• India-MyanmarBorderTradeMyanmar shares long borders with five neighbouring countries, namely India, Thailand, Bangladesh, China and Lao PDR. Over 50% of Myanmar’s exports and nearly 70% of its imports are with China, Thailand and India.
India and Myanmar signed a Border Trade Agreement in 1994, which was operationalized on April 12, 1995. Border points in India as per the agreement are at Moreh (Myanmar –Tamu) and Zokhawthar (Myanmar – Rhi). Setting up a third border trade point at Avakhung- Pansat/ Somra has also been agreed upon. At present, Moreh (in Manipur state of India) handles most of India’s border trade with Myanmar.
On November 5, 2015, RBI abolished barter trade, which was a part of border trade between India and Myanmar. Further, DGFT on December 17, 2015, normalised border trade at Moreh, Manipur. With these changes, Duty Free Tariff Preference (DFTP) Scheme of India and the ASEAN-India Trade in Goods Agreement became relevant in case of Myanmar and the earlier limit no longer applies.
Border haats also play an important role in facilitating local trade. Of the 15 suggested haats by the State Governments to Ministry of External Affairs, Pangsau Pass in Arunachal Pradesh and Somrai in Manipur have been approved.
Despite these efforts of the Government of India, trade along the Indo-Myanmar border remains relatively low in comparison with Sino-Myanmar and Thai-Myanmar borders.
In terms of port-wise trade with Myanmar, most of the bilateral trade is through sea. Nhava Sheva (JNPT)
is the largest gateway to Myanmar, contributing 19.9% of total exports and 34.1% of imports in 2017-18.
CONNECTIvITy PROJECTS BETWEEN INDIA AND MyANMARIn order to provide a boost to its ‘Act East’ policy and to link to Southeast Asian markets, the Indian Government has multiple connectivity projects, through land, water, and air. Some of them include the India-Myanmar-Thailand Trilateral Highway; the Kaladan Multi-Modal Transit Transport Project, creating a mode of transport for shipment of cargo from the eastern ports of India to Myanmar as well as to NER; an Industrial Corridor in NER from Golaghat via Dimapur via Imphal to Moreh and Dawki - Shillong via Guwahati to Nagoan (on Indo-Bangladesh Border) and Mekong-India Economic Corridor (MIEC), among others.
INDIA’S INvESTMENT IN MyANMARDuring April 1996 to March 2019, the cumulative approved Indian FDI in joint ventures and wholly owned subsidiaries including equity, loan and guarantee issued, in Myanmar stood at US$ 369.2 million. On the other hand, cumulative inflows into India from Myanmar during April 2000- March 2019 amounted to US$ 9 million.
POTENTIAL COMMODITIES FOR ENhANCINg INDIA’S TRADE WITh MyANMARPotential items of export from India to Myanmar would include the exports from the categories, namely, electrical machinery and equipment (HS 85), machinery and mechanical appliances (HS 84), plastics and its articles (HS 39), articles of iron or steel (HS 73), animal or vegetable fats and oils (HS 15), man-made filaments (HS 54) and man-made staple fibres (HS 55).
STRATEgIES FOR ENhANCINg INDIA’S INvESTMENTS IN MyANMARIndia’s engagements in Myanmar has been limited so far to few sectors.
India could take advantage of the recent initiatives undertaken by the Government to enhance investments in Myanmar. Against this backdrop, some broad areas where India could enhance its engagements with Myanmar include:
• Manufacturing Sector and Agro-basedIndustryWith manufacturers considering alternative options to relocate due to the ongoing China-US trade war and the rising wages in China, Myanmar offers a promising environment for manufacturing investors. Indian investors may seize the opportunities arising in the manufacturing sector of Myanmar in industries like 2- wheelers and 3-wheelers, cement, furniture, FMCG products, assembling and manufacturing of agri-machineries, cotton and silk.
• NaturalResourcesDevelopmentMyanmar has abundant mineral and energy resources, including petroleum and gas reserves; it also has a large hydro-electric potential. Increased cooperation between India and Myanmar in developing/exploring mineral resources, with bilateral arrangements such as buy-back arrangements could be an important strategy to enhance commercial relations.
• InfrastructureThere is an urgent need to improve the necessary border infrastructure at trading points to facilitate cross-border movement of goods between India and Myanmar. Major infrastructure facilities required include development of land port with modern warehousing facility, food testing facility, IT and telecom support, regular power supply, weighbridge, and development of the connecting roads and bridges. Infrastructure bottlenecks and constraints at the ICP and the LCSs have to be addressed, and trade facilitation needs to be promoted. Implementation of Country of Origin (COO) is critical.

3Non-Tariff Measures on Indian exports
INTRODUCTION
Non-Tariff Measures (NTMs) impose huge costs on exporters, particularly from developing countries. Interestingly both the developed and developing nations impose NTMs on imports, in order to address safety, health, environment and other similar concerns. The reality, however, is that NTMs are often imposed to protect domestic producers. There is a thin line between NTMs and Non-Tariff Barriers (NTBs) and the discourse around NTMs often has one side defending its action while the other tries to prove that these measures cause obstacles to the smooth flow of trade.
GATT (General Agreement on Trade and Tariffs) was created primarily to bring down import duties (tariffs) which nations had imposed to protect their producers and help the State generate revenue for funding its sovereign functions. Trading nations brought down their tariffs significantly to encourage liberal flows of goods across political borders. While tariffs have come down significantly, global trade flows have been severely impacted by the emerging NTMs that nations have adopted. These measures are created through various policy instruments such as laws, regulations and regulatory practices, presumably to serve national objectives but often used to create new barriers at the borders.
TARIFFS
While addressing NTBs has become critical to a nation’s pursuit of promoting its exports, tariffs continue to engage their attention. It is a common perception that tariffs in the developed world have come down substantially whereas in the developing
world they are still significantly higher. This perception is not far from reality, but the fact remains that even in the developed world many tariff peaks can be observed, which form major barriers to exports from the developing world.
Tariffs serve many purposes. They protect infant industry in developing economies and allow them space to grow and are instruments to help countries deal with external competition. Tariffs have often been used as tools to promote import substitution-based industrialisation. Lately, tariffs have been used to create barriers on grounds of national security, such as the recent imposition by the United States on aluminium and steel.
The examination of average and peak tariff on products of export interest in India’s major export destinations shows that they are higher than the simple average of the country. For example, USA’s average tariff is 3% whereas for product categories where India has an export interest the simple average rises to 4%. Similarly, for EU, which has an average tariff of 5%, the products of interest to India carry a tariff of 8%.
An examination of countries within the medium tariff range imposing an average tariff of 6% to 15%, shows imposition of high tariffs on several products of interest to India. For example, labour-intensive products like coffee, leather and footwear, several food items and light manufacturing products, incur tariff rates of over 10% in the Chinese market.
CLASSIFICATION OF NTMS
NTMs cover a wide variety of measures, based on a widely accepted
classification for these measures. The international classification includes sanitary and phytosanitary measures; technical barriers to trade; pre-shipment inspection and other formalities; price control measures; licences, quotas, prohibitions and other quantity control measures; charges, taxes and other para-tariff measures; finance measures; anti-competitive measures; trade-related investment measures; distribution restrictions; restrictions on post-sales services; subsidies (excluding export subsidies); government procurement restrictions; intellectual property; rules of origin; and export-related measures.
NTMs can be classified into various categories but the most significant ones for exporters are the Technical Barriers to Trade (TBT) and Sanitary and Phytosanitary Measures (SPS). Among others import licenses, trade remedial measures, Rules of Origin, investment measures and technical regulations are covered under the SPS and TBT agreements of the WTO.
EXIM BANK SURvEy’S RESULTS
EXIM Bank, as a part of its recently concluded study on ‘Non-Tariff measures on Indian exports’, interviewed 587 firms of which around 75% reported NTM-related problems.
Most of the firms surveyed were small-scale and hence their reactions are of material interest. While the firms themselves could not identify detailed SPS and TBT measures they did report that quality control measures were further aggravated by a complement of other non-tariff measures such as port restrictions, tighter use of conformity assessment procedures, specific tests within the importing countries or

4
inspectors from importing country regulatory agencies to exporting countries and the exporters to bear the costs of these tests and inspections, etc.
It is observed that complexity of standards is increasing both in developed and developing countries. However, the problems faced by exporters to developing countries mostly relate to tariffs, port clearances or bureaucratic delays. Trade defence measures are used by both developed and developing countries. The more sophisticated measures are used by developed countries and their conformity assessment procedures have been expensive and difficult to meet. In some cases, this has led to a rejection of consignments, e.g. shrimp, and it has taken over a year to restore these firms to the accepted list.
The primary survey shows that India’s exporting community is quite diversified in terms of their understanding of the international trade eco-system and their articulation also varies with the extent of the scale at which they operate. The perceptions recorded at the grassroot level offer some learnings. The average exporter is not concerned whether the hurdle to export is from within the exporting country’s trade eco-system or at the destination or in between. Any measure which he perceives as a hurdle in the smooth flow of his exports, has a certain cost implication for him, which makes the process that much more expensive and quite often he might lose the market to a competitor. There are some exporters, who have adapted to non-tariff measures and do not consider them as obstacles, either out of ignorance or simply as a result of their entrepreneurial zeal.
They have adapted to these measures in a business-as-usual way. However, a large number of exporters recognise the costly implications of non-tariff measures and would like to see them out of the way.
The fact that many exporters are relatively less informed about the institutional framework available to them for trade, is a commentary on major inadequacies in the trade policy framework. Many exporters are still not aware of the multilateral, plurilateral or bilateral institutional mechanisms available for preferential trading. Even when they may be exporting under a preferential mechanism, it is likely that they may not be able to distinguish between a bilateral trade agreement and a unilateral General System of Preferences (GSP).
These experiences point to a strong need for in-depth advocacy and extension programmes, which will include creating awareness not just on institutional frameworks but on more important details such as Rules of Origin, Non-Tariff Measures and ways of getting around those measures.
TRADE EFFECTS OF NTMS
The EXIM Bank study used the inventory-based frequency measure approach to understand the impact of NTMs. However, trade defence measures offer direct equivalent tariffs, so initially all such measures were used in a Computable General Equilibrium Framework (CGE) to project an overall effect. NTMs may also have positive effects by depressing cost of inputs in the domestic economy. Netting out the positive and the negative effects at the economy-wide level shows the
following effects – Exports: -0.01%, Imports: -0.2%, Employment: -0.05%, GDP: -0.02%, Output of Export Sectors: -0.03%. While at the aggregate levels these figures may look small, the sectoral effects are considerable.
CONCLUSION
A developing country is faced with a serious dilemma when it comes to compliance with the NTM regulations. While on the one hand, trading nations have brought their tariffs down significantly, apparently making access to their markets easy, on the other hand the adoption of NTMs increases compliance costs and also introduces new trade restrictions.
For a developing country like India this experience can be mitigated by adopting a few measures. First of all, information on these measures, their changes and coping strategies should be collected on a bi-annual basis and disseminated to exporters through their Export Promotion Councils. Second, Red Alert systems should be instituted to identify stringent existing and emerging standards. Third, the WTO process should be fully used to challenge these standards as necessary. Fourth, compliance issues should be more intensively and strategically discussed bilaterally through trade forums already established by the government of India. Lastly, domestic capacity to set and meet standards should be improved through both the hardware such as laboratories, better science and software which includes improving standards incrementally, raising awareness and building a database of best practices.

5Impact of Union Budget on Select Sectors
The Indian economy has undergone a significant overhaul in the past five years, with decisive steps taken by the Government of India for ensuring inclusive growth and easing the business environment. The Union Budget 2019-20 was aimed to provide a roadmap for fulfilling the aspirations of the people. The government has laid down the blueprint to catapult India into a US$ 5 trillion economy by 2025.
Consistent with the vision of the Government, inclusive investment-led growth were the central theme of this year’s budget, with focus on strengthening the country’s infrastructure, uplifting the rural economy (with a focus on agriculture), supporting MSMEs and start-ups, revival of NBFC and the banking sector, reducing the carbon footprint, and promoting FDI, among others.
KEy POLICy ANNOUNCEMENTS IN uNION BudgeT 2019-20
• Rural Economy: The overall allocation for rural development has been increased; Self-Help Groups (SHGs) interest subvention programme has been expanded; overdraft facility of ₹ 5,000 and loans of upto ₹ 1 lakh would be provided to women SHGs; allocation to PM Kisan has been set at ₹ 75,000 crore, and allocation to National Rural Drinking Water Mission has been nearly doubled to ₹ 10,001 crore from ₹ 5,500 crore.
• MSME & Start-ups: New payment platform has been introduced; interest subvention of 2% would be provided for GST registered MSMEs; e-verification of investor identity will now be possible for start-ups; scrutiny in valuations of share premiums of start-ups will also be minimized.
• Banking, NBFCs & Insurance: Banking recapitalization of ₹ 70,000 cr. has been announced; partial credit guarantee to Public Sector Banks (PSBs) would be provided for the first loss up to 10% for investing in NBFCs; debenture redemption reserve norms have been modified; regulatory authority of RBI has been strengthened by transferring
the regulatory power in housing finance sector from NHB to RBI; and 100% FDI in insurance intermediaries has been announced.
• Make in India: Investment in sunrise and advanced technology areas is being promoted through investment linked income tax exemptions under section 35 AD of the Income Tax Act, and other indirect tax benefits; customs duty on raw material imports has been reduced and duties on certain final goods has been increased to achieve higher domestic value addition and reducing
import dependence in sectors such as petrochemicals, power sector, steel, auto components and electronics (including household appliances such as AC).
• Capital Market: Credit Enhancement Corporation will be set up for increasing sources of capital for infrastructure financing; FPIs have been allowed to subscribe to listed debt securities issued by ReITs and InvITs; current minimum public shareholding norms would be increased from 25% to 35%; social stock exchange for social entrepreneurs is also proposed to be set up.
IMPACT ON SELECT SECTORS
Agriculture & Allied Sectors
Overall Impact: Positive
• Increases in the allocations for crop insurance scheme, irrigation, price support scheme, crop husbandry etc. will positively impact the sector.
• Setting up of 100 new clusters during 2019-20 under the Scheme of Fund for Upgradation and Regeneration of Traditional Industries’ (SFURTI) scheme is likely to enable 50,000 artisans to join the economic value chain in the focus sectors viz. Bamboo and Honey.
• The launch of Pradhan Mantri Matsya Sampada Yojana (PMMSY) is likely to address critical gaps in the value chain in fisheries sector.
Automotive and ancillaries
Overall Impact: Neutral
• Electric Vehicles (EVs) are likely to receive demand side push on account of additional income tax deduction on interest paid on loan to purchase EVs, reduction in GST for EVs, as well as supply side push in the form of customs duty reduction on select EV components to nil and tax incentives for mega-manufacturing plants in areas like lithium storage batteries.
• However, apart from EVs, there is no significant impact on the overall automobile sector.
BFSIOverall Impact:
Positive
• Recapitalization of PSBs, focus on improving NBFCs liquidity and better regulatory oversight of the RBI are likely to positively impact the sector.
• Easing FDI norms in insurance intermediaries would help in widening distribution channels for insurance companies; lowering requirement for branches of foreign re-insurance companies will improve competitiveness in this space.
Infrastructure
Overall Impact: Positive
• Roads and railways continue to get higher budgetary allocations; outlay for civil aviation also witnessed a 42% hike vis-à-vis the previous fiscal year.
• Public Private Partnership will be a key strategy to mobilize the proposed ₹ 50 lakh cr. investment in the railway infrastructure development by 2030.
• Given the investment target of ₹ 20 lakh crore per year over the next five years, it would require nearly 60% of private participation.
• Nevertheless, the increase in road and infrastructure cess is likely to aid the higher budgetary allocations to some extent.

6India-Africa Partnership in Agriculture and Farm Mechanisation
BRIEF AgRICULTURE STATUS: INDIA AND AFRICA
India• The total food grains production in India was registered
at 284.8 MT in 2017-18, which was an all-time high for the Indian agriculture.
• During 2013-14 to 2017-18, the AAGR registered for India’s total food grains production was at 2%.
• Major agricultural products produced in India include sugarcane, rice, wheat, potatoes, amongst others.
• Sugarcane alone contributed to more than 30% of the Indian agricultural produce in 2017.
• India had 156.4 million hectare of arable land available in 2016, the highest in the world.
• The per capita arable land in India was approximately, 0.118 hectares, making India not even among the top 100 countries in the world.
Africa• African soil remains greatly underutilized, with the region
having more than half of the world’s fertile unused land.
• Some of the African countries that have a high percentage of agricultural land (as a % of the total land area) at their disposal include South Africa (79.8%), Burundi (79.2%), Nigeria (77.7%), Lesotho (77.6%) and Eretria (75.2%).
• Agricultural products such as cassava (60.9%); yams (97.2%); sweet potatoes (24.6%); sorghum (47.3%); and plantains (60.1%). contribute in double digits to the global production.
• While Africa has the highest area of arable uncultivated land in the world, most farms occupy less than 2 hectares.
• Post-harvest losses in sub-Saharan Africa average 30% of total production, meaning that the region loses over US$ 4 billion of agricultural produce each year.
AgRICULTURE ORIENTATION INDEX
Agriculture Orientation Index (AOI) for Government Expenditures, compares the central government contribution to agriculture with the sector’s contribution to GDP. An AOI less than 1 indicates a lower orientation of the central government towards the agricultural sector relative to the sector’s contribution to the economy, while an AOI greater than 1 indicates a higher orientation of the central government towards the agricultural sector relative to the sector’s contribution to the economy. It may be observed that globally AOI has declined from 0.42 in 2001 to 0.26 to 2017. As on 2017, while the North Africa and West Africa regions exhibited an AOI of 0.12
each, Middle Africa had an AOI of 0.24, East Africa, 0.15, and Southern Africa, 0.74. This calls for more Government intervention in a region like Africa, where not much private players are willing to put money.
INdIA-AFrICA AgrICulTure TrAde1
The India-African Agricultural trade was registered at US$ 5.4 billion in 2018, up from the level of US$ 4.8 billion in 2014. Interestingly, while India continues to maintain a surplus in the trade of agriculture with Africa, the value has fallen consistently in the last 5 years from US$ 1.4 billion in 2014 to US$ 0.6 billion in 2018. The imports by India from Africa in agriculture sector, increased from US$
1.7 billion in 2014 to US$ 2.4 billion, recording a decent AAGR of over 8.6%, during this period.
The top five products contribute to almost 97% of the agricultural imports from Africa by India. The main products were ‘Edible fruit and nuts’ (share of 66.2%); ‘Oil seeds and oleaginous fruits’ (10.2%); ‘Edible vegetables and certain roots’ (10%); ‘Coffee, tea, maté and spices’ (7.8%); and ‘Cocoa and cocoa preparations’ (2.6%).
Agriculture contributed to around 10% of Africa’s total exports in 2018. The African exports of agricultural products were recorded at US$ 48.4 billion in 2018, up from US$ 40.7 billion in 2014.
1 HS codes 06-23 considered
The United Nations, amongst other Sustainable Development Goals is committed to end all forms of hunger and malnutrition by 2030. Around 795 million in the world are undernourished.
Things could worsen when a quarter of the 9 billion estimated population by 2050, resides in Africa – a region which faces huge productivity issues in agriculture. A McKinsey analysis
shows that Africa could produce 2 to 3 times more cereals and grains, which would add 20% more cereals and grains to the current worldwide output.

7
eXIM Bank’s Study released at 6th Africa-India Partnership DayExim Bank of India’s study on ‘India-Africa Partnership in Agriculture and Farm Mechanisation’ was released by Mr. Prashant Goyal, Joint Secretary (DEA), Ministry of Finance, GOI at the sixth edition of India-Africa Partnership Day, held in Malabo, Equatorial Guinea, as part of the events associated with Annual Meetings of the African Development Group. The event was organized on June 13, 2019, with the objective of sharing India’s experiences in
implementing projects involving regional integration in Africa.
This Study attempts to bring forth the possible areas of collaboration between Africa and India which could be of potential benefits to both the regions. India, which was once an importer of food grains, has today a net surplus. Since the launch of Green Revolution in India around 50 years ago, a number of programs and institutional and technological strengthening in the field
of agriculture has happened in India, which could be replicated in the African context.
The event also had panel discussions on the theme ‘Accelerating Regional Integration in Africa’, with speakers from Indian and African nations. The event was attended by several dignitaries including ministers and senior officials from African nations, CEOs of developmental financial institutions, banks and corporate houses from India and Africa.
Africa’s imports of agricultural products stood at US$ 63.9 billion in 2018, down from 2014 when it touched US$ 66.6 billion. Agriculture imports contributed to 11.1% of Africa’s total imports in 2018, importing substantially to feed its more than a billion population, largely because of un-utilisation of the arable land and limited mechanisation of the existing farming systems.
In products such as cereals; sugars and sugar confectionery; prepared animal fodder; coffee, tea, maté and spices; and oil seeds and oleaginous fruits; miscellaneous grains, seeds and fruit, where India has registered a decent share in the global export market and is also ranked well, Africa can strengthen its trade with India, in order to further deepen its relationship.
TrAde IN AgrO-MACHINery India’s trade with the world in agro-machinery was recorded at US$ 2039.5 million in 2018, up from US$ 1810.5 million in 2014. India has maintained a decent surplus in the trade of agro-machinery in the last 5 years, with the surplus being registered at US$ 794.6 million in 2018.
Whilst India has a deficit in overall trade with Africa, in terms of agro-machinery, India has a huge surplus. India’s exports to Africa in the last decade, that is, during 2009 to 2018, have more than tripled, from US$ 104.9 million to US$ 323.5 million, registering an AAGR of 17.7%.
The total trade for agro-machinery by Africa was recorded at US$ 6.1 billion in 2018, a level down from what was recorded in 2014 at US$ 6.9 billion. However, trade in agro-machinery showed signs of recovery in 2017, when it grew at 9.5% vis-à-vis 2016 and at 12.9% during 2018 over 2017. Most of this trade of agro-machinery is due to high imports, rather than export. As a result, Africa has a huge deficit in the trade of agro-machinery.
This further signifies a huge existing market for agro-machinery in Africa, and where India can play an increasing role to work collaboratively and match their needs. Africa imported over 5% of the total agro-machinery imported in the world by value in 2018, providing India enough reasons to explore the market.
SCOPE FOR COOPERATION IN A g r I C u lT u r e A N d A g r O -PROCESSINg
Since India is still largely an agrarian country, and one that has traditionally had close relationship with Africa, India can share its vast experience across the agro value chain in enabling Africa to become a net exporter of agriculture products.
In the agriculture space, India can share its learnings in the field of green revolution; contract farming; drip irrigation; agricultural markets; precision farming; robotics; ivnstitutional support; and marketing. Further, in terms of the cooperation in the farm machination, ‘diversification in trade of farm equipment’; ‘newer business models’; ‘creating an enabling private environment for the private sector’; and ‘R&D support by the government’ are some of the factors which can we be worked upon by the governments in Africa along with the Indian institutions. The possibility of setting up a India-Africa Agri Fund could also be explored for mutual benefit.
2 53 commodities at HS 6-digit level

8
Exim Bank, through its Grassroots Initiatives for Development (GRID) and Marketing Advisory Services (MAS) programs, has been extending all round (financial/advisory) support to promote grass roots initiatives, and innovative technologies, particularly the ones with export potential. The principal objective has been to augment operational efficiency, achieve higher value addition, and widen market access for the products a play a promotional role to create and enhance export capabilities and international competitiveness of the micro-Indian enterprises, through specific interventions such as assistance in skill development, product development and obtaining export market certifications.
In this context, Exim Bank has been supporting and curating grassroots enterprises and craftsmen across India, in the areas of product development, design & packaging sensitization, with the twin-objective of reviving the traditional arts and crafts of India, besides affording a sustainable means of livelihood to the artisans. The Bank, through its training programmes and workshops, has been able to motivate second generation artisans into learning ancestral crafts, build a sustainable business and help gain due recognition for the various arts and crafts, at several platforms across India and overseas.
Exim Bank along with Looms of Ladakh Women’s Cooperative (LLWC) organized a skill development program in advanced technology for the knitters, spinners & weavers of LLWC. This cluster development programme aimed at imparting skill upgradation/ design development training to the pashmina weavers that would serve to widen the weaver base going forward. The workshop was based on the tenets of ‘Guru Shishya Parampara’, aimed at roping in the next generation of artisans
Export-Import Bank of India Supports Pashmina Women Weavers in Ladakh District, J&K
for helping sustain the ancient art that aimed at bringing together unemployed women from remote villages of the district. A total of 42 weavers participated from the cooperative using pashmina, sheep wool, yak wool, and bactrian camel wool as raw materials for producing woolen wear products including accessories, such as gloves, capes, hoodies, bandanas, scarves, stoles, etc.
The objective of this skill training programme was to transfer traditional knowledge to the next generation and also to train more women folk from different villages, in pashmina weaving, which would enable expansion of the network of centres of LLWC across Ladakh. Two weavers who were trained from the Handloom School of Maheshwar, Madhya Pradesh in advanced weaving techniques of pashmina, yak wool and merino blends were hired for conducting the program. They were trained on small looms of eight frames each that enable producing mufflers, high end products and calculating advanced weaving yardage. These two master trainers along with the oldest master trainer and a designer conducted the programme that had participation from seven clusters of LLWC.
ADvANCED SKILL DEvELOPMENT TrAININg PrOgrAMMe - llWC
A total of 42 sample prototypes were developed by the end of the advanced training programme and a total of 6 weavers were skilled at each centre. The Bank supported filing a copyright patent
for a motif pattern native to the Ladakh region, proposed to be named, ‘Ladakhi pashmina shawl’, woven in multi shuttle, 60” wide looms, and based on yardage by LLWC.
PAShMINA PRODUCTS
This training has benefitted not only the Ladakh weaving cluster that faces the challenge of creating and developing a brand name for itself, but also prepared the next generation of weavers who can take this unique legacy forward. This is one of the key mandates of the Bank’s GRID program viz. sustenance of India’s rich cultural heritage.
WOMEN AT WORK IN ChUChOT vILLAgE
WOMEN PREPARINg RAW MATERIAL FOR SPINNINg

9
Exim Bank extends Lines of Credit (LOC) to overseas financial institutions, regional development banks, sovereign governments and other entities overseas, to enable buyers in those countries to import developmental and infrastructural projects, equipment, goods and services from India. Under the LOC extended with the support of Government of India (GOI), Exim Bank reimburses 100% of contract value to the Indian exporters, upfront upon the shipment of goods and at least 75% of goods and services of total contract value should be sourced from India. LOCs have enabled India to demonstrate project execution capabilities in the emerging markets. LOCs have helped to gather considerable momentum in the recent years, especially in the developing countries of Africa, Asia, Latin America, Oceania and the CIS. The Bank has now in place 248 LOC, covering over 62 countries in Africa, Asia, Latin America, Oceania and the CIS, with credit commitments of over US$ 24.66 billion, available for financing exports from India. LOCs are thus an
effective instrument for promoting and facilitating India’s exports of projects, goods and services.
Exim Bank, with the support of Government of India, has signed three LOCs as given below during the period Apr-Jun 2019:
(i) Two LOCs of US$ 30 million and US$ 150 million were extended to the Government of Republic of Ghana for rehabilitation and upgradation of Potable Water System in Yendi and strengthening of Agriculture Mechanization Service Centres, respectively. With the above LOCs, Exim Bank till date, has extended nine LOC to Ghana, with the support of the GOI, taking the total value of LOCs extended to US$ 388.26 million. Projects covered under these LOCs include rural electrification projects, agriculture and transportation projects, construction of Presidential Office, railway corridors and agro processing plant, Foreign Policy training institution, fish processing
plant, sugar plant and sugarcane development and irrigation project.
(ii) An LOC of US$ 500 million was extended to the Government of Bangladesh for financing defence related procurement. With the above LOCs, Exim Bank, till date, has extended four LOC to Bangladesh, with the support of the GOI, taking the total value of LOCs extended to US$ 7,862 million. Projects covered under these LOCs include development of railway infrastructure, dredging, construction of bridges, procurement of buses, locomotives, coaches, and various other social and infrastructure development projects.
For further information, please contactMs. Meena VermaGeneral ManagerExport-Import Bank of India,Office Block, Tower 1, 7th FloorAdjacent Ring RoadKidwai Nagar (East)New Delhi-110023Telephone: (011) 24607700[E-mail: [email protected]]
SUCCESS STORy: CôTE D’IvOIRE
A project for construction of Mahatma Gandhi IT and Biotechnology Park has been financed under the LOC of US$ 25.50 million to the Government of Côte d’Ivoire. The project valued at US$ 20 million was inaugurated on June 27, 2019. The project has been executed by Shapoorji Pallonji & Company Limited and the scope of work comprised of design, architectural & technical study, construction of the building hosting IT enterprises, and construction of compound wall around the campus. The equipment
for computer assembly plant, DNA lab, satellite earth station, audio-video studio, telecom lab, generator, and data storage network has been supplied and installed by United Telecom Limited. This dedicated Free Trade Zone (FTZ) for IT and Biotechnology will help in promoting research and development through offering tax incentives to companies operating from FTZ in Grand-Bassam, Côte d’Ivoire.
Exim Bank’s Lines of Credit

10 The Quarter That Was
eXIM BANk POSTS PAT OF ₹ 82 CrOre IN Fy 2018-19Mr. David Rasquinha, Managing Director and Mr. Debasish Mallick, Deputy Managing Director, Exim Bank, announced the Bank’s results for the financial year 2018-19 at a press conference in Mumbai on May 30, 2019. Key highlights of the Bank’s performance during 2018-19 are as under:
FINANCIAL PERFORMANCE(in ₹ crore)
Loan Portfolio 93,617Non-funded Portfolio 14,096Operating Profit 2,068Net worth 14,674Profit after Tax 82Balance of Profit transferred to Government of India
8.17
Business per Employee 571Provision Coverage Ratio 84.72%Capital to Risk Assets Ratio 19.07 %Net NPAs 2.44 %
Lines of Credit (LOCs): During 2018-2019, 18 LOCs amounting to US$ 2.31 billion were extended. Credit commitments touched US$ 24.28 billion during the year, through a total of 246 LOCs as on March 31, 2019, to 63 countries across Africa, Asia, Latin America and the CIS.
Project Exports: Towards supporting project exports from India under its commercial window, the Bank disbursed loans and issued guarantees aggregating ₹ 4,895 crore and the total value of contracts supported amounted to ₹ 23,500 crore. The Bank supported project exports in countries like Thailand, UAE, USA and 14 countries in Africa.
Buyers’ Credit under National export Insurance Account (BC-NEIA): As on March 31, 2019, Exim Bank has sanctioned Buyers’ Credit of US$ 2.10 billion, under the National Export Insurance Account to finance 21 projects. Some key projects include a water treatment and distribution project in Sri Lanka; transmission line projects in Cameroon, Ethiopia, Mauritania, Senegal and Zambia; railway line project
in Ghana; road projects in Maldives and Zambia; and an irrigation project in Suriname. The Bank has also given in-principle commitments for an aggregate amount of US$ 5.32 billion at the behest of several leading Indian project exporters to support 43 projects.
Overseas Investment Finance: During 2018-19, the Bank sanctioned funded and non-funded assistance aggregating ₹ 1,136 crore to Indian companies, to finance their overseas investments in 8 countries. So far, Exim Bank has funded 621 ventures set up by 467 companies in 78 countries, with the value of support aggregating ₹ 58,427 crore.
Profit after Tax (PAT) of the Bank stood at ₹ 82 crore for 2018-19.
REgIONAL INTEgRATION DISCUSSED AT THe 6th AFrICA-INdIA PARTNERShIP DAyExim Bank, with the support of the Government of India and the African Development Bank (AfDB) Group, organized an ‘Africa-India Partnership Day’ during the Annual Meetings of AfDB Group, held at Malabo, Equatorial Guinea. This was the 6th edition of the Africa-India Partnership Day, which now has become an integral part of the events associated with the Annual Meetings of African Development Bank Group. The theme for this year’s event
was ‘Accelerating Regional Integration in Africa’.The broad framework of ‘Sharing India’s Experiences with Africa’ also gels with India’s own efforts towards integrating its vast territory within itself, and also with neighbours through numerous landmark projects. Hence, the experiences of India in the developing country context bodes well with Africa, and thus places this Africa-India partnership at a higher pedestal, wherein there is a mutual respect and understanding of the challenges and opportunities that both geographies face.Delivering the key note address, Mr. Prashant Goyal, Joint Secretary (DEA), Ministry of Finance, GoI, delineated the role and the success of some of the Indian projects. Examples cited were related to coastal and inland waterways, integrating road network, bringing regional power grids under a national grid, apart from successfully implementing India-Bangladesh Water Treaty, signing the four nation vehicle movement treaty with Bangladesh, Bhutan, and Nepal, and operationalizing the multimodal transport system with Myanmar.On the occasion, Mr. Goyal also released an Exim Bank Study titled “India-Africa Partnership in Agriculture and Farm Mechanisation”.
REDUCTION IN TRADE COST CAN INCREASE TRADE BETWEEN INDIA AND lAC By uS$ 16 BIllION: eXIM BANk ANd INTer-AMerICAN develOPMeNT BANK’S JOINT STUDyExim Bank’s joint study with the Inter-American Development Bank titled, “A Bridge between India and Latin America- Policy Options for Deeper Economic Cooperation” was released at the hands of Mr. G.V. Srinivas, Joint Secretary (LAC), Government of India, Ministry of External Affairs; Mr. James Scriven, CEO of IDB Invest; and Mr. Debasish Mallick, Deputy Managing Director, Exim Bank in the presence of senior officials of FICCI, during the Industry Interaction Seminar on “India-LAC Trade and Investment” organized by IDB in association with FICCI on June 11, 2019 at New Delhi.The study outlines immense opportunities that are present for both India and the LAC region in the areas of trade, investment and mutual cooperation. It highlights that the current bilateral trade between regions stands close to US$ 40 billion in 2018.The study notes that the cost of trading goods between LAC and India is a hurdle that needs to be addressed. Trade costs are driven by tariffs, non-tariff barriers (NTBs), and inefficiencies along transport and logistics routes. It is estimated that in the medium term, with a reduction in trade costs, LAC exports to India may increase by 42%, while Indian exports may increase by 46%. In current value terms it means an increase in exports by US$ 7.6 billion by LAC and US$ 8.6 billion by India.

11
eXIM BAZAAr – AN eXCluSIve EXhIBITION OF hANDICRAFT AND hANDLOOM PRODUCTS, ORgANIZED FOR ThE FIRST TIME IN WEST BENgALExim Bank launched, in September 2017, its initiative ‘Exim Bazaar’, an exclusive handicraft & handloom exhibition, enabling direct sales to the end buyer. Through ‘Exim Bazaar’ Exim Bank envisages augmenting its support to the grassroots enterprises and craftsmen across India by way of product positioning in local & overseas markets for their sustainable livelihood generation. The 4th edition of ‘Exim Bazaar’ was held at the Ice Skating Rink, Kolkata, during April 12-14, 2019.
A total of 42 participants, representing the rich artistic traditions of more than 21 states including Maharashtra, Gujarat, Rajasthan, West Bengal, Odisha, Himachal Pradesh, Uttarakhand, and Delhi showcased their handmade products. The products sold during the exhibition included Dhokra crafts, Sanjhi Painting, Terracotta & Black Pottery items, Miniature, Phad & Pichwai Paintings, Appliqued & Embroidered textiles & garments, Jute bags & mats, Punjabi jutti, Footwear, Ikat textiles, Leather Puppetry, Grass Weaving Baskets, Madhubani and Pattachitra Paintings etc. The event attracted a large number of visitors. The artisans were able to generate high sales during the exhibition, and besides many artisans secured valuable contacts for future bulk orders.
For further information, please contact: [email protected]
ACTIvITIES OF EXIMIUS CENTRE FOR LEARNINgExim Bank partnered with the Asian Development Bank (ADB) to organise a seminar on business opportunities in ADB-funded projects. The seminar was held on June 27, 2019 in New Delhi and was attended by representatives of more than 100 companies.
With a view to disseminate information related to international trade for export
capability creation and reach out to audience spread across geographies, Exim Bank has launched its webinar series titled Exim Bank’s Masterclass. The first Masterclass was held on the theme of ‘India’s Merchandise Exports: Drivers and Growth Prospects’ on June 21, 2019 and was imparted by Exim Bank’s economist Ms. Jahanwi. The webinar was attended by more than 100 users across the country as well as overseas. The speaker session was followed by an online question and answer session.
During the quarter of April-June 2019, the Bank partnered with Indo-American Chamber of Commerce for the Food Processing and Technology Summit held in Kolkata in April 2019. Exim Bank, in association with the Associated Chambers of Commerce and Industry of India, organised a session on ‘Strategy to Promote Merchandise Export Competitiveness’ in Mumbai in May 2019. Exim Bank, along with Bharat Chamber of Commerce, organised a conference on ‘Doing Business with Africa’. The conference was held in Kolkata in June 2019.
Exim Bank organises various seminars and workshops across India on themes related to international trade and export capability creation.
To know about upcoming events in your region, visit https://www.eximbankindia.in/upcoming-events.
EXIM BANK FORECASTS INDIA’S MerCHANdISe eXPOrTS ANd NON-OIL EXPORTS TO WITNESS A POSITIvE gROWTh MOMENTUM IN ThE FIRST QuArTer OF Fy2020
Exim Bank forecasts India’s merchandise exports to increase from US$ 81.9 billion to US$ 84.0 billion (with an expected growth rate of 2.5%) and non-oil exports to increase from US$ 70.1 billion to US$ 73.0 billion (with an expected growth rate of 4.2%), during the first quarter of 2019-20 viz. April-June 2019, over the
corresponding quarter of the previous year. The forecasts are based on Exim Bank’s Export Leading Index (ELI), which continued to show a positive growth momentum. Forecast of growth in India’s total merchandise exports and non-oil exports would continue to be released on a quarterly basis, during the first week of the months of June, September, December, and March for the corresponding quarters, with continuous improvisation to the model. The next growth forecasts for India’s exports for the quarter July-September 2019 would be released during the first week of September 2019.
For the year 2018-19, Exim Bank, based on the ELI model, had forecasted India’s merchandise exports to amount to US$ 331.8 billion, which compares well with the official estimates of US$ 331.02 billion.
The model and the forecast results have been reviewed by a standing technical committee of domain experts comprising Professor Saikat Sinha Roy, Professor & Coordinator, Centre for Advanced Studies, Department of Economics, Jadavpur University, Kolkata; Dr. Sarat Dhal, Director, Department of Economic and Policy Research, Reserve Bank of India, Mumbai; Professor N. R. Bhanumurthy, Professor, National Institute of Public Finance and Policy (NIPFP), New Delhi; and Professor C. Veeramani, Professor, Indira Gandhi Institute of Development Research (IGIDR), Mumbai.
As part of its continued research initiatives, Exim Bank has developed an in-house model to generate an Export Leading Index (ELI) for India to track and forecast the movement in India’s exports on a quarterly basis. The ELI gauges the outlook for the country’s exports and is essentially developed as a leading indicator to forecast growth in total merchandise and non-oil exports of the country, on a quarterly basis, based on several external and domestic factors that could impact exports of the country.

12
BACKgROUNDThe Bay of Bengal Initiative for Multi-Sectoral Technical and Economic Cooperation (BIMSTEC) is a regional multilateral organization formed in 1997. Its members lie in the littoral and adjacent areas of the Bay of Bengal constituting a contiguous regional unity. Of the 7 members, five are from South Asia – Bangladesh, Bhutan, India, Nepal and Sri Lanka and two are from Southeast Asia – Myanmar and Thailand. BIMSTEC comprises 1.67 billion people – around 22% of the world population, and a combined GDP of over US$ 3.7 trillion, accounting for 4.3% of Global GDP in 2018. Unlike many other regional groupings, BIMSTEC is a sector-driven cooperative organization, focusing on sectors such as trade, technology, energy, transport, tourism and fisheries, agriculture, public health, poverty alleviation, counter-terrorism, environment, culture, people-to-people contact and climate change.
The strategic importance of BIMSTEC lies in the fact that it acts a bridge between South Asia and Southeast Asia and serves as a common platform for intra-regional trade and cooperation among the SAARC and ASEAN members. With SAARC taking a back foot because of lack of consensus with Pakistan, BIMSTEC can serve as an alternative for regional integration and economic cooperation for South Asian nations and India.
TOTAL TRADE OF BIMSTEC COUNTRIESTotal Trade of BIMSTEC countries witnessed a CAGR of 7.5% over the last decade to US$ 1.5 trillion in 2018 from US$ 790.4 billion in 2009. Total export of the BIMSTEC countries stood at US$ 646.1 billion and imports at US$ 864.2 billion in 2018. India alone accounted for 54% of total trade of BIMSTEC, 59% of BIMSTEC’s exports and 50% of its imports in 2018. Other major trading countries in the region include Thailand (accounting for 33.2% of total
trade of BIMSTEC), Bangladesh (6.6%), Myanmar (2.4%), and Sri Lanka (2.1%). With intra-regional trade accounting for a marginal 6% of total trade, the region has lots of potential to enhance level of economic engagements between members, and take the cooperation to new heights.
The BIMSTEC Free Trade Area Framework Agreement signed in 2004, is yet to be made operational due to lack of consensus in areas such as modalities of tariff reduction and elimination, size of the negative list, criteria for rules of origin, mechanism of dispute settlement, safeguard measures, customs operations and negotiations on the agreements on service and investment.
INDIA’S TRADE WITh BIMSTECThe robust trends in bilateral trade between India and other BIMSTEC countries is the testimony of existing potential that may be exploited by the two regions, to take the commercial relationship to a higher level. Total trade between India and other BIMSTEC member countries have more than trebled from US$ 12.3 billion in 2009 to US$ 37.9 billion in 2018. India’s exports to BIMSTEC countries increased almost four-fold from US$ 7.3 billion in 2009 to US$ 27 billion in 2018, while India’s imports from the BIMSTEC region more than doubled from US$ 5.1 billion in 2009 to US$ 11 billion in 2018.
India-BIMSTEC trade accounted for 4.6% of India’s total international trade in 2018; with India’s exports to BIMSTEC accounting for 8.3% of India’s total exports and India’s imports from BIMSTEC accounting for only 2.2% of India’s total imports. Thailand, with a 31.7% share remains India’s major trading partner among BIMSTEC countries in 2018. Bangladesh was the major export destination of India among BIMSTEC countries, accounting for 32.5% of total exports to BIMSTEC, followed by Nepal (27%), Sri Lanka (17.3%), and Thailand (16.2%). Almost
70% of India’s imports from BIMSTEC came from Thailand in 2018. Sri Lanka and Bangladesh followed with 12% and 8.1% share in India’s imports.
India majorly exported mineral fuels, oil and their products (14.4%), vehicles other than railway or tramway (10.3%), cotton (9.3%) and mechanical appliances (8.2%) to BIMSTEC. From BIMSTEC, India majorly imported machinery and mechanical appliances (13.2% share in total imports); plastic and articles (9.7%), electrical machinery and equipment (9%) and inorganic chemical (6.7%).
INdIA-BIMSTeC relATIONS: WAy FORWARDIndia is focusing on connectivity projects in and around the Bay of Bengal region, as this could help unleash the potential of the seven northeastern states in India. The Sittwe port in Myanmar is closer to the northeast region of India than India’s own ports. Furthermore, physical connectivity with BIMSTEC would also help India integrate itself with ASEAN’s Master Plan of Connectivity 2025. India has already invested in the India-Myanmar-Thailand Trilateral Highway, the Kaladan Multimodal Transit Transport Project and the BIMSTEC Motor Vehicle Agreement. Better connectivity projects would help India leverage the untapped potential of BIMSTEC’s possible trade linkages.
The focus of BIMSTEC is very wide, including 14 areas of cooperation, it is suggested that BIMSTEC should remain committed to small focus areas and cooperate in them efficiently. The formation of another sub-regional initiative, the Bangladesh-China-India-Myanmar (BCIM) Forum, with the proactive membership of China, has created more doubts about the exclusive potential of BIMSTEC. India being the largest and most developed country in this grouping, the onus of steering the organisation forward lies with India.
India’s Bilateral Trade with BIMSTEC

13
ThAI BAhTThe currency that was at the epicentre of the 1997 Asian financial crisis is emerging as the region’s safest bet. The Thai baht has remained little changed during the recent trade war turbulence, while peers such as the rupee and the won have weakened almost 3%. It is expected that the currency isn’t likely to lose its newfound status as a haven anytime soon, thanks to Thailand’s rising current-account surplus and record foreign reserves.
Global emerging markets have been hit by the triple whammy of the Federal Reserve, the US President, and the Chinese yuan. Unlike Taiwan and South Korea, which run current-account surpluses as well, Thailand is not in the direct line of fire in terms of the supply-chain impact of the global trade wars.
• As on June 27, 2019, the benchmark SET Index has risen almost 7%, poised for its best monthly performance since 2012. It is also the biggest gainer in Asia.
• The baht has advanced more than 3%, and reached a six-year high. It’s vying for the top spot in Asia with the won.
• Local-currency bonds have returned more than 5%, the most among emerging Asian peers.
Thailand’s markets have been boosted by almost $4 billion of foreign inflows in June 2019 as the central bank held off from interest-rate cuts, helping support bonds and the currency. But even the Bank of Thailand has voiced concern over the baht’s strength and said it has intervened in the market, while economic growth prospects are worsening.
hONg KONg DOLLARHong Kong’s currency, while pegged to the greenback, is also influenced by the yuan due to the city’s close economic
ties with China. It fell the most in more than three-and-a-half years on August 5, 2019, tracking losses across Asia. The Hong Kong dollar’s 12-month forward points briefly spiked to 163 on August 6, 2019, in a sign that some global hedge funds may betting against the currency. That was the highest level since early 2017.
The moves are affecting local borrowing costs, which underpin mortgages in one of the world’s least affordable housing markets. The rates are already facing pressure from tightening liquidity, which sent some tenors to decade-highs in July. One-month Hong Kong dollar interbank rates, known as Hibor, jumped the most since 2008 on August 6, 2019.
Rates have remained ultra-low in Hong Kong since the financial crisis, while a huge amount of cash sloshing around in the financial system has helped fuel rallies in the stock and property markets. Now, stocks are falling and the July home sales fell 32% in value from a year earlier, while volume was down 21%.
Hong Kong has a track record of resilience in the face of crises. From Asia’s financial implosion during the late 1990s to the SARS outbreak in 2003 and the global credit crunch of 2008, the city has always found a way to come out stronger. That doesn’t mean a turnaround is near, however. The recent turmoil is making it almost impossible for investors to discern the outlook for Hong Kong assets.
SINgAPORE DOLLARA slide in Singapore money market rates and currency weakness are signalling the central bank may be about to ease policy.
• Short-term interest rates indicate the degree to which the Monetary Authority of Singapore is working
to maintain its target for the local dollar’s nominal effective exchange rate.
• Three-month interbank offered rate has been on an upward path until recently, with its increase suggesting liquidity is tightening as MAS works to maintain the NEER path.
• Sibor has since dropped abruptly in the last few days, and SGD NEER is heading back toward the midpoint of its projected range.
• This may be a clue to a possible imminent announcement by MAS that it’s about to shift its policy stance.
NOTE: MAS typically announces policy twice a year: once in April and once in October.
The yen and the Singapore and Australian dollars will be the prime targets in Asia Pacific if the U.S. decide to intervene in the currency market, according to Citigroup Inc.
Although the yuan has a significant weight in the dollar’s effective exchange rate index and could be bought, it may be politically awkward for the U.S. to hold Chinese government securities amid an unreceptive environment between the two nations.
With the dollar’s trade-weighted index close to its highest since 2002 even after the Federal Reserve’s rate cut, speculation has risen that the Trump administration may seek to weaken the greenback. China let the yuan fall below 7 per dollar for the first time in more than a decade, prompting the Treasury department to label the country ‘a currency manipulator’.
The yen has historically been a target for U.S. intervention, while the Singapore and Australian dollars could be also bought because of their liquidity and accessibility.
Currency Currents

14
BANgLADESh
The economy of Bangladesh is expected to have grown by 8.1% in 2018-19, on the back of robust growth in exports of readymade garments. The economic growth is expected to average 7.8% during 2020-23. Investment in infrastructure projects, especially transport and energy sectors will support strong economic expansion. Capital flows from multilateral institutions and international partners are expected to fund these big ticket infrastructure projects. Private consumption, supported by string remittance inflows, will also support economic growth in the forecast period. Inflation is expected to average at 5.5% during 2019. With softening global oil prices, inflation will ease to 5% in 2020, before increasing to 5.3% on an average during 2021-23, on the back of rising private consumption and commodity prices. Bangladesh relies heavily on imported fuel, and with surge in infrastructural spending capital equipment imports have also increased. As a result, Bangladesh’s current account is expected to remain in deficit during 2020-23, with the deficit averaging around 2.2% of GDP. A persistent current account deficit will also lead to depreciating taka. Thus, taka is expected to depreciate to an annual average of Tk 90.5: US$ 1 in 2023, from Tk 83.5: US$ 1 in 2018.
ChILE
Chile is an open market high income economy. The GDP growth rate has come down to 2.6% in 2019, compared to 4% in 2018. Chile’s exports volume have slowed down because of uncertainty in global economic landscape. During 2021-23, the average
growth rate of Chile is expected to be around 3.2%. The economic growth will be supported by rising copper prices (main export item of Chile), recovery in global trade, and growth in private consumption (as unemployment falls). Moderating prices of energy and food products will keep the consumer price inflation under control, averaging at 2.3% in 2019. During 2020-23 inflation will remain within the target range of 2-4%. The peso remains vulnerable to shifts in copper prices and global economic risks. However, ample forex reserves and increasing copper prices are expected to strengthen the peso from Ps695.7: US$1 to Ps664.5: US$1 in 2023. Chile runs a trade surplus, but has a current account deficit on account of services and primary income deficit. The current account deficit is expected to narrow down to 1.9% of GDP by 2023, from 3.1% of GDP in 2018. This is on the back of rising exports (with increasing price of copper).
EThIOPIA
The GDP is expected to grow at 7.4% in 2019. During the persistent global economic uncertainty also Ethiopia is expected to attract foreign investments as business confidence in the economy grows. Continuing economic reforms in the country like disinvestment will lead to an average growth rate of 7.6% per year during 2019-23. The agriculture and agro-food industry will benefit from rising global food prices in 2020-21. The sector however, remains vulnerable to weather shocks. Increased power supply and easier norms for importing capital goods will give positive impetus to the industrial sector. Inflation is expected to moderate from 13.8% in 2018 to 8.3% in 2020 as a result of fall in food
and oil prices. Ethiopia’s central bank follows a price-setting mechanism and allows the birr to gradually depreciate. The birr is expected to weaken to an average of Birr 34.12: US$ 1 in 2023 from an average of Birr 27.43: US$ 1 in 2018. Ethiopia runs a large trade deficit, as a result the current account deficit stood at 7.5% of GDP in 2018. With softening global crude oil prices and increased exports, Ethiopia’s trade deficit is expected to reduce, therefore, the current account deficit is also expected to shrink to 4.9% of GDP by 2023.
RUSSIA
The real GDP of Russia grew by 2.2% in 2018, which is the highest rate since 2012. The growth is primarily driven by construction and extractive sectors. But the growth rate is set to moderate to 1.3% in 2019 and 1.5% in 2020. During the years 2021-23 the growth rate will average at 1.8% per year. Declining workforce, heavy dependence on natural resources and low productivity growth will put downward pressure on the economic growth. After witnessing deflation during 2015 to mid-2018, Russia experienced inflation to the tune of 4.3% in 2018. The inflation is set to rise further to 5.1% in 2019 as a result of increasing VAT. The rouble depreciated to an average of Rb 62.7: US$ 1, from Rb 58.3: US$ 1 in 2017, owing to the imposition of US sanctions. The rouble is expected to depreciate further to Rb 65.9: US$ 1 in 2019. In 2018, the current account surplus rose to 6.9% of GDP, from 2.1% in 2017 on the back of rising oil exports and moderating exports. The current account is expected to remain in surplus during 2021-23 owing to large hydrocarbon exports.
Country Scan

154 163 195 208 55
FY 15 FY 16 FY 17 FY 18 FY 19 FY 20 (Apr-June)
Exports Imports Trade Balance
158
82 85 96 118126
3677 70 67 78 8220
Foreign Direct Investment Flows
FY 15 FY 16 FY 17 FY 18 FY 19
45.1
6.712.4
15.3 14.712.4
55.660.1 61.0
64.4
Consumer Price Inflation
FY15
FY16
FY17
5.8%
4.9%
4.5% 3.6%
3.4%
3.2%
FY18
FY19
FY20(June)
FY 15 FY 16 FY 17 FY 18 FY 19E
Sectoral Output
7.4%
51.8% 52.3% 52.7% 53.5% 54.3%
29.6%29.3%29.4%30.0%30.0%
18.2% 17.7% 17.9% 17.2% 16.1%
2043.3 2148.4 2287.2 2625.9 2785.6
8.0% 8.2%
7.2% 6.8%
Agriculture % Industry % Services % Real GDP Growth (%)Note: E – es�mated
Services Trade
Source: DIPP & RBI
Source: IIF & MOSPI
Source: MOCI
Source: RBI
Source: RBI
US$
Bill
ion
US$
Bill
ion
FY 15
FY 16
FY 17
FY 18
-1.3% -26.8
-1.1% -22.1
-0.7% -14.4
-1.9% -48.7
FY 19-2.1% -57.2
Current Account Balance (US$ bn) % of GDP
Current Account Deficit
Merchandise Trade
448
310
-138 -119 -108 -162 -184 -46
262
381
276
384
304
466
330
513
81
127
US$
Bill
ion
Exports Imports Trade BalanceSource: MOCI
FY 15 FY 16 FY 17 FY 18 FY 19 FY 20(Apr-June)
15Snippets on Indian Economy

16
Bhadohi CarpetsMicro enterprise engaged in exports of carpets to Australia, Europe, North America and South America. Creations are inspired by global trends in design, fashion and art. However, weaving carpets that are unique and relevant to local taste.
BastarExporter engaged in manufacturing and selling traditional Dhokra (Bell Metal). Crafts are made by tribals from Chhatisgarh, following the ancient and traditional way of manufacturing the Dhokra. The process is practiced by the tribal people from the last 200 years.
PatchworkAn SHG offering handcrafted apparel and lifestyle products created by rural artisans from across India. They encourage women from less privileged backgrounds to acquire new skills and confidence to the wider world.
kutchi PotteryProducts designed by artisans and designers; helping them with market needs, design skills, packaging and marketing. Catering to products such as creative diyas and teracotta articles from Kutch.
DhokraCommunity based organization trying to develop sustainable livelihood of artisans at a micro level and capacity building of the traditional and tribal artists/artisans society.
PaithaniHandlooms Corporation providing employment to handloom weavers for Paithani art of the state. The primary objective is to ensure the overall welfare and growth of the artisans and weavers.
Partnership Opportunities
Project Opportunities
(I) An international tender released in Bangladesh by Power Grid Corporation of Bangladesh Limited, Government of Bangladesh. The tender is for a 400 kV transmission line project and funded by Government of Bangladesh for designing, supplying, installing, testing and commissioning double circuit transmission line.
Interested parties may like to reach out to Marketing Advisory Services Group on contact details mentioned as under.
For more details, please contact:- Phone: 2217 2600, extn : 2822/2737, Fax: 2218 8268, email: [email protected]
Trade And Partnership OpportunitiesTrade Opportunities