Embed Size (px)
Citation preview

mwm
CONSUMER PRICESIN THE UNITED STATES ,
1953-58Price Trends and Indexes
Bulle tin No. 1256\ UNITED STATES DEPARTMENT OF LABOR
•) James P. Mitchell, SecretaryBUREAU o f l a b o r s t a t is t ic s
. A ' Ewan Clague, Commissioner
Digitized for FRASER http://fraser.stlouisfed.org/ Federal Reserve Bank of St. Louis

Digitized for FRASER http://fraser.stlouisfed.org/ Federal Reserve Bank of St. Louis

U. S. DEPARTMENT OF LABORB U R E A U O F L A B O R S T A T I S T I C S
W a s h i n g t o n 25, D. C.
Errata Sheet
ELS Bulletin 1256, ” Consumer Prices in the United States,1953- 58.»
Index numbers (191:7-1:9 = ICO) appearing in Tables B -2 , B -l i , B-5, and C -2 have been revised, as follows:
Tables: B-2, B-U, B-5 . C-2 C-2City: U.S. City A'verage Los Angeles Los AngelesGroup: Medical care All items Medical care
Revised Revised RevisedDate index index index
1958: Average T O i ^ u nroJune lhli.2 125.5 11:3.8July Hi 5.0 125.7 lUli.3Aug. 11:5.3 125.5 Hill.5Sent. Ui6.5 126.0 ll|li.6Oct. Hi 7.1 125.9 11,5.8Nov. lhl.h 126.5 11:5.8Dec. 11:7.6 126.5 11:5.8
Digitized for FRASER http://fraser.stlouisfed.org/ Federal Reserve Bank of St. Louis

Digitized for FRASER http://fraser.stlouisfed.org/ Federal Reserve Bank of St. Louis

CONSUMER PRICES IN THE UNITED STATES1953-58
Price Trends and Indexes
Bulletin No. 1256UNITED STATES DEPARTMENT OF LABOR James P. Mitchell, Secretary
B U R E A U O F LA B O R S TA T IS T IC S Ewan Clague. Commissioner
For sole by the Superintendent of Documents, U .S . Government Printing O ffice , Washington 2 5 , D.C. Price 65 cents
Digitized for FRASER http://fraser.stlouisfed.org/ Federal Reserve Bank of St. Louis

Preface
n ils b u lle tin presents an a n a lysis o f the trend o f r e t a il p rio e s fo r the 6 -ye a r period 1953-58, ta b le s o f indexes and re la te d data fa r these and e a rlie r ye a rs , and a d e s c rip tio n o f the 1952 re v is io n o f the Consumer Price Index. B u lle tin 1165 covered the y e a n 1949-52. In 1953, the Consumer Rrioe Index was rebased from 1935-39=100 to 1947-49=100, and indexes fo r e a rlie r years were converted to the new base to p ro vid e h is t o r ic a lly eoaparable data. T h is b u lle tin presents ta b le s o f indexes on the new base not o n ly fo r the yea rs under study (1953-58), but a lso fo r pre viou s ye a rs .
A number o f new index groupings were established a t the tin e o f the 1952 re v is io n and subsequently. Data fo r these new ly constructed groups are summarised in the ta b u la r summary.
The b u lle tin was prepared by members o f the s ta ff o f the Bureau's D iv is io n o f P rices and Coat o f L iv in g , under the general d ire c tio n o f A lla n D. S e a rle , A ctin g C h ie f, Index Methodology and R eporting Branch. Preparation o f the b u lle tin waa the re s p o n s ib ility o f Joseph H. Freeman, assisted b y C a rlyle P. S ta llin g s , E lisa b e th P. Deutermann, and Charles H. Lewie.
i i
Digitized for FRASER http://fraser.stlouisfed.org/ Federal Reserve Bank of St. Louis

Contents
£US
Preface....................................................... ii
Price trends.................................................................. . 1Background........ ............................. .............. ............ 1The economy and pricess 1953-58.**,.................. ............. ...... . 1Special groupsi 1953-58........................ ......................... . 4Major groups of goods and services: 1953-58...... ...................... . 5
Retail prices of food.................. ............................... 5Meats, poultry, and fish.......... .......................... . 5Fruits and vegetables.......... 7Dairy products................................................ 8Cereals and bakery products...... ........................... •••••• 8Other foods at boos.............. ............................... 8
Housing.................. 8Apparel......... 9Transportation. ....... ............................................. . 10Medical care.......................................................... 12Personal care............ 13Reading and recreation.•••«................... ..... .................... 13Other goods and services................ ......................... ..... 13
History, scope,and meaning of the Consumer Price Index.....•••..».............. 14Revision of 1934-36........................................................ 14World War II............................................................... 14Postwar revision........ 14Description of old, adjusted, aid revised series.............•••••.••••••••••••• 15The current index.................. ..... .............. .......... 16
Technical notes......•••....•.... 19The comprehensive revision of 1952........................................ . 19
Revision of housing concept................................................. 19Revising the index........................................... ......... 19
Revision of city sample........................ ..........*.... . 20Converting expenditure data to index weights.................. ..... . 20
General description.••••.......................................... 201952 weights............. 21Food and alcoholic beverages......... ..................... 21Automobiles....................................................... 21Television.......... 22Other goods and services*............. ............... 22
Item sample......................... 22CXitlat sample.................... 22Population weights........................... 23
Some limitations.............................. ....<>• 23Limitations on use............. 23Limitations of measurement........................ 23
Relative importance of Consumer Price Index c o m p o n e n t s . ........... 24Correction procedure for published price indexes and prioea............ . 27
Brices or indexes for individual items............. 27Subgroup, group, or all items indexes........ ...... ............ ...... . 27
iii
Digitized for FRASER http://fraser.stlouisfed.org/ Federal Reserve Bank of St. Louis
Tables
Page
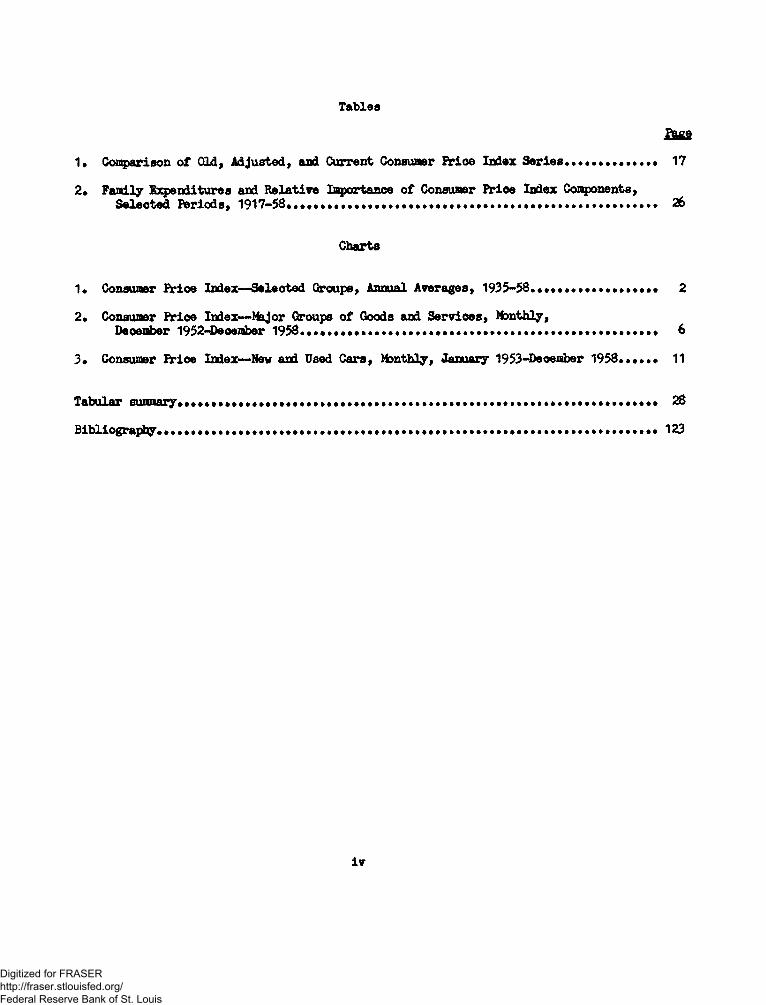
1, Comparison of Old, Adjusted, and Current Consumer Price Index Series............. 17
2. Family Expenditures and Relative Importance of Consumer Price Index Components,Selected Periods, 1917-58............................ ......... . 26
Charts
1. Consumer Price Index— Selected Croups, Annual Averages, 1935-58......... 2
2. Consumer Price Index— Major Groups of Goods and Services, Ninthly,Deoenber 1952-Deoember 1958................................ . 6
3. Consumer fries Index— New and Used Cars, Ninthly, January 1953-Deceaber 1958...... 11
Tabular sunmary............... ...................... ................... . 28
Bibliography ••».••••.•». ............ ............. ........ 123
i v
Digitized for FRASER http://fraser.stlouisfed.org/ Federal Reserve Bank of St. Louis

CONSUMER PRICES IN THE UNITED STATES, 1953-58
Price Treads
In the 12 years preceding 1953, the United States was engaged in World War II and the Korean conflict and, as a result, experienced several periods of severe price inflation* Between 1940 and 1952, annual average consumer prices rose nearly 90 percent (chart 1 )•
As the United States increased its armed strength and later became involved in World War II, consumer prices climbed rapidly upward* From spring (March) 1941 through May 1943, the Consumer Price Index advanced 24 percent* However, toward the latter part of this period, the Government's economic stabilization program began to take effect and the rate of advance was retarded* Because of the success of the stabilization program, the period from May 1943 to June 1946 was one of relatively moderate price advance* Alter July 1946, however, controls were removed and prices soared, rising at the sharpest rate ever measured by the CPI* Largely responsible for this rise was the pent-up demand for consumer goods growing out of wartime shortages, supported by the increase in incomes and purchasing power generated by Government war expenditures* This postwar price advance lifted the CPI level more than 30 percent in a little over 2 years (June 1946-August 1943)*
The inflation was temporarily halted by the recession of late 1943-49* More plentiful supplies and more cautious consumer buying helped check the price rise* As in the previous recession (1937-38 ) 2/, however, the CPI declined only moderately* Between the September 1948 index peak and February 1950, the subsequent low for this period, consumer- prices in general fell 4 percent, primarily because of price decreases of 9 and 8 percent for food and apparel, respectively* Price movements were mixed, however; partially offsetting these declines was a steady increase in the costs of the services, including rent, which responded promptly to the relaxation of wartime rent controls*
With the outbreak of the Korean conflict in June 1950, prices moved quickly upward with all groups of goods and services joining in the rise* Between June 1950 and February 1951, the CPI advanced 8 percent or at a rate of 1 percent per month* After February 1951, the effects of the General Ceiling Price Regulation (GCPR) of January 25, 1951, placing controls over most prices, began to be felt and, from February through December 1951, the rate of advance was slowed, prices rising about 3 percent or 0*3 percent per month*
The year 1952 was one of comparative price stability* With the immediate crisis past by early 1952, it was possible to relax price controls gradually* Despite the loosening of controls, the index rose less than 1 percent over the year, December 1951-December 1952*
The Economy and P r ^ s.l. 1953-58
During the years 1953 through 1958, America experienced a peacetime economic expansion, twice interrupted by recessions— once in 1953-54 and again in 1957-58* Over the entire 6-year period (December 1952-December 1958), the CPI rose 8*4 percent* During the first 3 years, there was almost complete price stability, but during the last 3-year period there was a renewed price rise* Between December 1952 and December 1955, the index advanced only 0*5 percent* j From December 1955 to December 1958, however, it rose 7*8 percent*
JJ See Bureau of Labor Statistics Bulletins 710, 966, and 1165 for detailed analyses of price trends during the years 1941-52*
2J For a discussion of the 1937-38 recession and the CPI, see The Consumer Price Index in the Business Cycle, by Ewan Clague (in Monthly Labor Review, June 1958, pp* 616-620)*
l
Digitized for FRASER http://fraser.stlouisfed.org/ Federal Reserve Bank of St. Louis

Digitized for FRASER http://fraser.stlouisfed.org/ Federal Reserve Bank of St. Louis
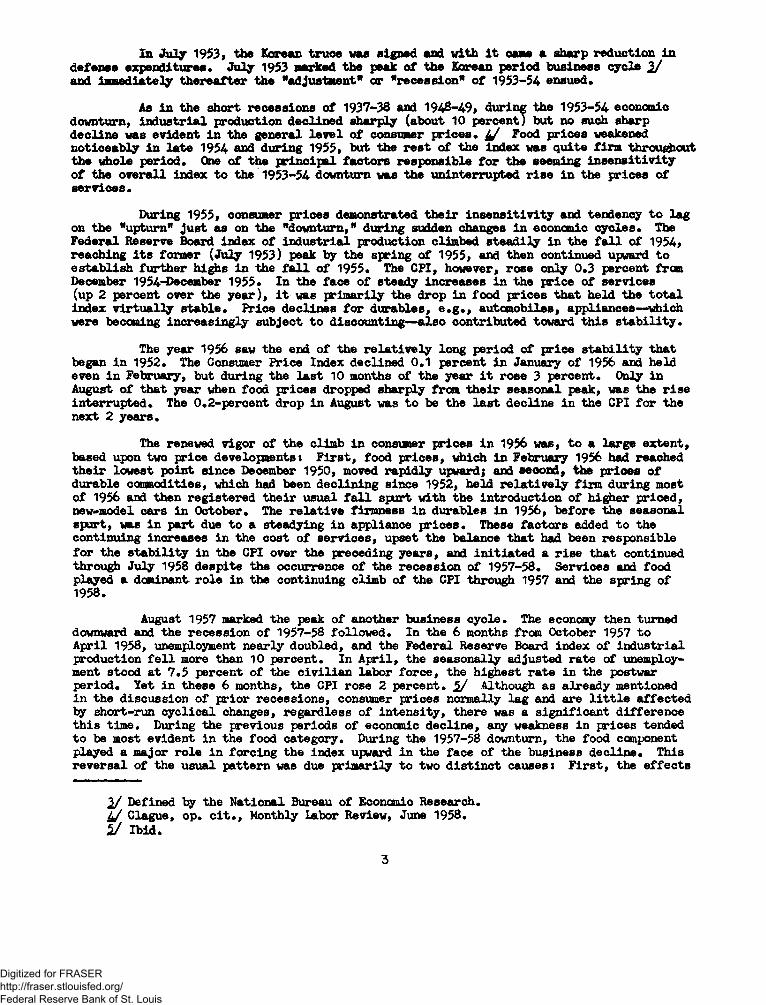
In J u ly 1953, the Korean truce was signed and w ith i t cane a sharp reduction in defense expenditures. J u ly 1953 narked the peak o f the Korean period business cycle 2/ and inm ediately th e re a fte r the "adjustment" o r "recession" o f 1953-54 ensued.
A8 in the short recessions o f 1937-38 and 1948-49, during the 1953-54 economic downturn, in d u s tria l production declined sh a rp ly (about 10 percent} but no such sharp declin e was evid en t in the general le v e l o f consumer p ric e s , j j Food p rice s weakened n o tice a b ly in la te 1954 and during 1955, but the re s t o f the index was q u ite firm throughout the whole p eriod . One o f the p rin c ip a l fa c to rs responsible fo r the seeming in s e n s it iv ity o f the o v e ra ll index to the 1953-54 downturn was the uninterrupted r is e in the p rices o f s e rvic e s .
During 1955, consumer prices demonstrated their insensitivity and tendency to lag on the "upturn" just as on the "downturn," during sudden changes in economic cycles. The Federal Reserve Board index of industrial production climbed steadily in the fall of 1954, reaching its former (July 1953) peak by the spring of 1955, and then continued upward to establish further highs in the fall of 1955. The CPI, however, rose only 0.3 percent from December 1954-December 1955* In the face of steady increases in the price of services (up 2 percent over the year), it was primarily the drop in food prices that held the total index virtually stable. Price declines for durables, e.g., automobiles, appliances— which were becoming increasingly subject to discounting— also contributed toward this stability.
The year 1956 saw the end of the relatively long period of price stability that began in 1952. The Consumer Price Index declined 0.1 percent in January of 1956 and held even in February, but during the last 10 months of the year it rose 3 percent. Only in August of that year when food prices dropped sharply from their seasonal peak, was the rise interrupted. The 0.2-percent drop in August was to be the last decline in the CPI for the next 2 year3.
The renewed vigor of the climb in consumer prices in 1956 was, to a large extent, based upon two price developments: First, food prices, which in February 1956 had reachedtheir lowest point since December 1950, moved rapidly upward; and second, the prices of durable commodities, which had been declining since 1952, held relatively firm during most of 1956 and then registered their usual fall spurt with the introduction of higher priced, new~model cars in October. The relative firmness in durables in 1956, before the seasonal spurt, was in part due to a steadying in appliance prices. These factors added to the continuing increases in the cost of services, upset the balance that had been responsible for the stability in the CPI over the preceding years, and initiated a rise that continued through July 1958 despite the occurrence of the recession of 1957-58. Services and food played a dominant role in the continuing climb of the CPI through 1957 and the spring of 1958.
August 1957 marked the peak of another business cycle. The economy then turned downward and the recession of 1957-58 followed. In the 6 months from October 1957 to April 1958, unemployment nearly doubled, and the Federal Reserve Board index of industrial production fell more than 10 percent. In April, the seasonally adjusted rate of unemployment stood at 7.5 percent of the civilian labor force, the highest rate in the postwar period. Yet in these 6 months, the CPI rose 2 percent. 2/ Although as already mentioned in the discussion of prior recessions, consumer prices normally lag and are little affected by short-nan cyclical changes, regardless of intensity, there was a significant difference this time. During the previous periods of economic decline, any weakness in prices tended to be most evident in the food category. During the 1957-58 downturn, the food component played a major role in forcing the index upward in the face of the business decline. This reversal of the usual pattern was due primarily to two distinct causes: First, the effects
2/ Defined by the National Bureau of Economic Research. j j Clague, op. cit., Monthly Labor Review, June 1958.y ibid.
3
Digitized for FRASER http://fraser.stlouisfed.org/ Federal Reserve Bank of St. Louis

of abnormally bad weather during the winter of 1957-58, which destroyed much of the fresh fruit and vegetable crops and hence forced prices of these items upward; and second, longer range factors which encouraged withholding of cattle and hogs from market and thus pushed up meat prices* 6/ Contributing to the rise in the index was the upward pressure of these food prices during this period coupled with the continued climb of the services group*
The CPI reached an all-time high (123*9) in July of 1958* Then in August as the result of a sharp drop in food prices, the index registered its first decrease since August 1956, dropping 0*2 percent* For the next 2 months (September and October), prices on the average remained unchanged due to the effect of further declines in the foods group offsetting increases in other components* In November, prices rose 0*2 percent to equal the July high, because of the seasonal effect of the introduction of higher priced, new-model automobiles• But at the year*s end, December 1958, the CPI dropped back 0.2 percent as the result of a further decline in food and minor decreases in several other groups*
Over the second half of 1958 (since June), consumer prices registered no net change; temporarily, a new price stability had been established*Special Groups; 1953-58
The "all items" CPI is subdivided according to two systems: (l) commodities versusservices, i.e., the so-called "special groups," and (2) specific end use, i.e*, the so-called "major groups" (food, housing, apparel, etc*)* In the special groups, the two broad categories, commodities and services, are further divided into such subcategories as nondurable commodities, nondurable commodities less food, durable commodities, etc*; services are divided into household operation services, transportation services, medical care services, etc* 2/
The special groups originated out of the need for groupings of CPI items that could be more readily related to trends of other economic indicators, e*g., wholesale or primary—market prices, the Department of Commerced general business indicators, the Federal Reserve Board index of industrial production, etc. Price movements among the principal special groups core shown in chart 1, which plots the movement of selected special group indexes from the year 1935 (the first year for which such indexes are available) forward.
The most significant movements among the special groups over the years 1953-58 were the strong, steady rise of prices in the services category and the weakness of durable commodities* During the previously described periods of wartime and immediate postwar inflation, services, though moving upward, did not register increases of the amplitude recorded for commodities--between 1940 and 1952, peryices rose 48 percent as against an increase of 114 percent for commodities• However, in the 6 years, December 1952 through December 1958, while commodities were rising only 4 percent, the cost of consumer services rose 18 percent* In this same 6—year period, prices of durable commodities fell 1 percent*
All major components of the services group contributed to its sustained upward movement* Over the period December 1952 through December 1958, rents, which had already been partially freed from controls prior to 1953 and which were almost completely decontrolled after the summer of 1953, rose 15 percent. Transportation services advanced 23 percent, led by a 32-percent increase in public transportation (mostly local transit fares)* Medical care services increased 25 percent with all its component elements contributing,i.e*, professional services (doctor, dentist, optometrist, etc*), hospital rates, and group hospitalization insurance* These individual items along with others are discussed in more detail in the following sections of the bulletin.
6/ Fo r more d e ta il see sectio n on Foods, p. 5#2/ Indexes fo r "special groups" from 1935 to 1958 are shown in the ta b u la r summary,
ta b les B—4 and B—5*
4
Digitized for FRASER http://fraser.stlouisfed.org/ Federal Reserve Bank of St. Louis
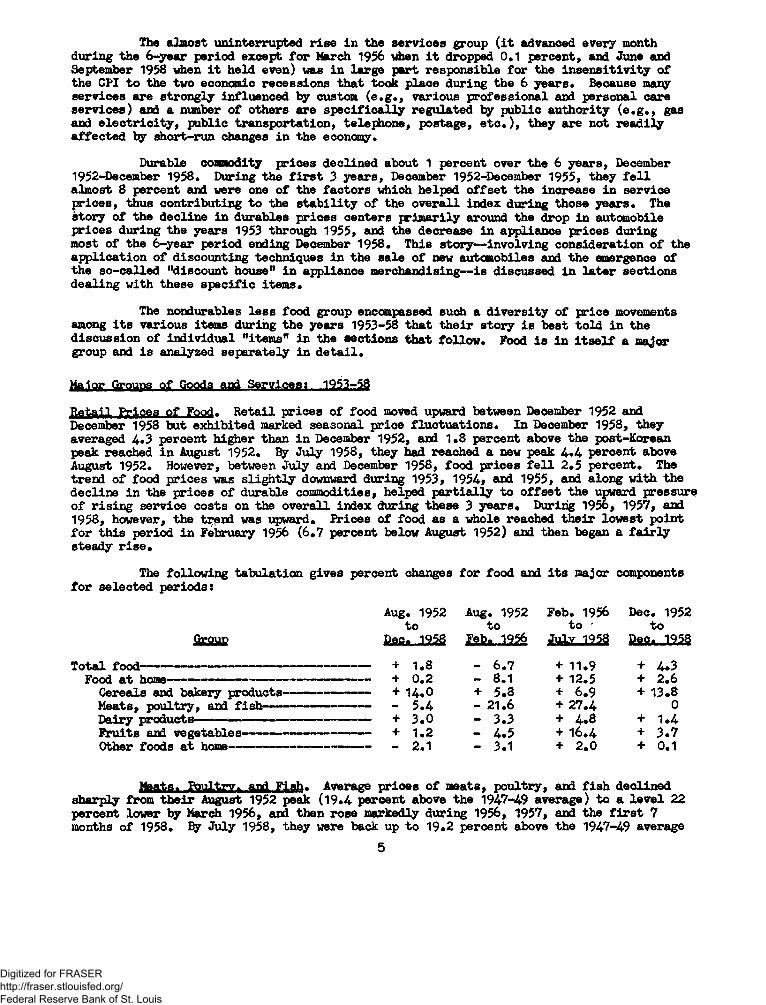
The almost uninterrupted rise in the services group (it advanced every month during the 6-year period except for March 1956 when it dropped 0.1 percent, and June and September 1958 when it held even) was in large part responsible for the insensitivity of the CPI to the two economic recessions that took place during the 6 years* Because many services are strongly influenced by custom (e.g., various professional and personal care services) and a number of others are specifically regulated by public authority (e.g., gas and electricity, public transportation, telephone, postage, etc.), they are not readily affected by short-run changes in the economy.
Durable commodity prices declined about 1 percent over the 6 years, December 1952-December 1958. During the first 3 years, December 1952-December 1955, they fell almost 8 percent and were one of the factors which helped offset the increase in service prices, thus contributing to the stability of the overall index during those years. The story of the decline in durables prices centers primarily around the drop in automobile prices during the years 1953 through 1955, and the decrease in appliance prices during most of the 6-year period ending December 1958. This story— involving consideration of the application of discounting techniques in the sale of new automobiles and the emergence of the so-called ''discount house" in appliance merchandising— is discussed in later sections dealing with these specific items.
The nondurables less food group encompassed such a diversity of price movements among its various items during the years 1953-58 that their story is best told in the discussion of individual "items" in the sections that follow. Food is in itself a major group and is analyzed separately in detail.
Major Groups of Goods Sargisesi__1222::2g
Retail Prices of Food* Retail prices of food moved upward between December 1952 and December 1958 but exhibited marked seasonal price fluctuations. In December 1958, they averaged 4.3 percent higher than in December 1952, and 1.8 percent above the post-Korean peak reached in August 1952. By July 1958, they had reached a new peak 4*4 percent above August 1952. However, between July and December 1958, food prices fell 2.5 percent. The trend of food prices was slightly downward during 1953, 1954* and 1955, and along with the decline in the prices of durable commodities, helped partially to offset the upward pressure of rising service costs on the overall index during these 3 years# During 195o, 1957, and 1958, however, the trend was upward# Prices of food as a whole reached their lowest point for this period in February 1956 (6#7 percent below August 1952) and then began a fairly steady rise#
The following tabulation gives percent changes for food and its major components for selected periods:
Aug. 1952 Aug. 1952 Feb. 1956 Dec. 1952to to to ' to
Group J22S Feb. 1956 Hites,* 122STotal food-------------------------- — + 1.8 - 6.7 + 11.9 + 4.3
Food at home---------------------- — + 0 .2 - 8.1 + 12.5 + 2.6Cereals and bakery products-----— - + 14.0 + 5.3 + 6.9 + 13.8Meats, poultry, and fish— ---- - - - 5.4 - 21.6 + 27.4 0Dairy products— ----- —— — ---- — + 3.0 - 3.3 + 4.8 + 1.4Fruits and vegetables--------------- — + 1.2 - 4.5 + 16.4 + 3.7Other foods at hone------------- — - 2.1 - 3.1 + 2.0 + 0.1
Meats. PpwltFYt ft*** Fish. Average prices of meats, poultry, and fish declined sharply from their August 1952 peak (19.4 percent above the 1947-49 average) to a level 22 percent lower by March 1956, and then rose markedly during 1956, 1957, and the first 7 months of 1958. By July 1958, they were back up to 19.2 percent above the 1947-49 average
5
Digitized for FRASER http://fraser.stlouisfed.org/ Federal Reserve Bank of St. Louis

CONSUMER PRICE INDEXMajor Groups of Goods and Services
INDEX (1947-49 = 100)December 1952-December 1958
1952 1953 1954 1955 1956 1957 1958UNITED STATES DEPARTMENT OF LABORBUREAU OF LABOR STATISTICS
Digitized for FRASER http://fraser.stlouisfed.org/ Federal Reserve Bank of St. Louis

and only 0.2 percent below the August 1952 peak. From. July to December 1958, however, they dropped 5.2 percent and thus, at the year*s end, the meat, poultry, and fish index was 5.4 percent below the August 1952 peak and at exactly the same level (113*0) as it was in December 1952.
The behavior of prices was different for beef and veal, pork, and poultry. Beef ani veal had quite sharp and contrasting upward and downward movements, while poultry moved rather steadily downward. At the beginning of 1953, beef and veal prices were declining rapidly from 1951 levels, which were more than 30 percent above the 1947-49 average.Record production caused prices to continue steadily downward through March 1956, but, as farmers cut down on their herds in response to the low prices, the number of cattle available for market decreased. Because of the resultant short supplies, prices turned up sharply, rising more than 36 percent from March 1956 to June 1958. From the June 1958 peak, beef and veal prices fell for 3 months and then rose during the last 3 months of the year; at the end of 1958, they were 1.3 percent below the June level.
Pork prices, in contrast, began a substantial rise in 1953 in response to decreased production, reaching a peak in May 1954 of 22 percent above the 1947-49 average, at a time when beef and veal prices were below the 1947-49 base. As production increased under the encouragement of large supplies and low prices of corn for feed, pork prices dropped sharply. By December 1955, they were 29 percent below the May 1954 peak. They turned up in 1956 and 1957 and rose sharply in 1958 through July. However, during the last 5 months of 1958, pork prices dropped 9*4 percent.
Poultry prices responded to record supplies resulting from the rapid growth of the commercial broiler industry, declining more than 30 percent from December 1952 to December 1957. In the first half of 1958, poultry prices turned up despite record supplies because of demand for poultry as a substitute for high priced red meats. In the last half of the year, however, these record supplies made themselves felt and poultry prices declined in every month except one.
Fruits and Vegetables. Fruits and vegetables, as usual, exhibited sharp upward and downward price fluctuations depending upon the availability of supplies. During 1953, 1954, and 1955, price changes were generally seasonal in character, but unfavorable weather caused shortages in 1956 and again in 1958 and unusually sharp price rises occurred.Average prices were up 3*7 percent from December 1952 to December 1958.
Prices of fresh fruits and vegetables during 1953-55 averaged somewhat below 1952, reaching summer peaks each year about 20 percent above the 1947-49 base. In July 1956 and July 1957, they reached peaks considerably higher, while freezing weather in Florida in December 1957 brought especially sharp price rises and seasonal peaks occurred several months early in 1958.
The precipitate drop in the price of potatoes from $1.31 for 15 pounds in July 1952 to 64J cents in March 1954 was one of the major influences in the 1953 decline. With adverse weather in growing areas, potatoes jumped to a level in May 1955 almost as high as in July 1952, and to $1.74 for 15 pounds in July 1956, the highest price on record.
Prices of other fresh fruits and vegetables responded to varying supplies. Tomato prices jumped 29 percent in the month of March 1956 to an average of 42 cents a pound, dropped to less than 17 cents in September 1956, and reached 46 cents a pound in April 1958. Green beans were very high priced and unavailable in many stores in early 1958 as a result of damage to the Florida crop.
Apples rose to a peak level of 23 cents a pound in 1957. Oranges were unusually high priced in 1958 because of the serious damage to the Florida crop. In July 1958, they sold at 80 cents a dozen and reached 87 cents a dozen in September and October before dropping off. Beaches were scarce in 1955 because of virtual destruction of that year *s southeastern crop. In July 1955, they averaged 31 cents a pound compared to only 17 cents
7
Digitized for FRASER http://fraser.stlouisfed.org/ Federal Reserve Bank of St. Louis

ig"July 1958, due to a good crop in the latter year.
Processed fruits and vegetables exhibit less marked price fluctuations than the fresh items. They decreased slightly during 1953-54 in response to large packs, began a steady rise in early 1955 which lasted well into 1956* and then turned down until mid-1957.In 1958, prices of frozen orange juice rose markedly as a result of persistently strong demand in the face of shortages of fresh oranges, reaching 29 cents for a 6-ounce can.Canned orange juice also increased in price but by a smaller amount. In December 1958, frozen fruits and vegetables averaged 22 percent above December 1952, and canned fruits and vegetables, 10 percent.
Dairy Products- Dairy products dropped 8.7 percent in price from December 1952 to June 1954# with a sharp drop in early April 1954 as a result of the reduction in support prices from 90 to 75 percent of parity, and the increase in production. Prices rose in subsequent years, partly as a result of Government efforts. In December 1958, prices averaged 11.1 percent above June 1954*
i
Cereals and Bakery Products. Unlike other food groups, cereals and bakery products moved upward in price by small amounts but rather steadily, from December 1952 to December 1958. The total increase over the period was 13.8 percent. The steady rise was largely the result of higher manufacturing and operating costs.
Other Foods at Home. The other foods at home group, which includes coffee and other beverages, fats and oils, sugar and sweets, eggs, and other miscellaneous foods, showed fairly sharp price fluctuations over the period due to changes in the prices of eggs, but relatively little distinct trend. From December 1952 to December 1958, average prices rose only 0.1 percent.
Egg prices dropped sharply during 1954 as a result of abundant supplies. Egg production in 1954 was nearly double that of 1935-39# reflecting developments in nutrition and methods of raising poultry, and rose to even higher levels in following years. In January 1955# prices averaged only 52 cents a dozen, and in June 1957, 48 cents a dozen.By June 1958, the low point for the year, prices had increased somewhat to 55 cents a dozen.
From an average price of 87 cents a pound for bag and can coffee combined in December 1952, prices rose sharply to an all-time high of $1.23 a pound in August 1954 because of frosts and drought in Brazil. As a result, consumers shifted to instant coffee, tea, and other substitutes, and prices declined, by June 1955# to an average of 89 cents or a little less than $1 a pound for vacuum pack coffee. Greatly increased planting of trees was reflected in price decreases beginning in the second half of 1957 and by December1958, coffee prices had declined below the December 1952 level.
Housing- The CPI housing group includes residential rents and all items of expense connected with the acquisition and operation of a home. Subgroups of this index are rent, other shelter costs, gas and electricity, solid fuels and fuel oils, housefurnish-ings, and household operation. Due to the comprehensive nature of the housing group, whichencompasses a variety of durable and nondurable commodities and services, there are often important differences in price movements within the group.
Two-thirds of the items included in housing costs in the CPI are consumer services, such as rent, charges involved in purchasing a home, and home maintenance and repair items. Their steady upward trend was largely responsible for the 10-percent increase in total housing costs during the 6 years, December 1952 through December. 1958. Housing costs to the consumer rose 2.1 percent in 1953 (December to December) but increased less than 1 percent per year in 1954 end 1955. The climb accelerated in 1956, and the following year, and leveled again through 1958.
Underlying the sharp increase in housing costs in the beginning of the 6-year period was the rise in residential rents, as Federal wartime controls were completely lifted in July 1953 and rapid local decontrol followed. The increase in rents between December
8
Digitized for FRASER http://fraser.stlouisfed.org/ Federal Reserve Bank of St. Louis

1952 and December 1953 was equal to more than one-third (38 peroent) of the 14.9-percent increase which occurred over the entire 6-year period. The 5.7-percent advance in rents between December 1952 and December 1953 was followed by an average annual (December to December) increase of 1.7 percent in the next 5 years.
On a national average, the cost of buying a home rose moderately during the 1953-58 period, although about a third of the index cities reported lower costs. For the Nation as a whole, the 6-year (December 1952-December 1958) increase in mortgage interest rates was about 14 percent, and a very large part of this occurred between mid-1956 and raid-1957, in response to a tighter Government credit policy.
Homeowners' maintenance and repair expenses climbed a total of 17 percent over the 6 years, December 1952 to December 1958. The services associated with maintenance and repair, such as repainting, refinishing floors, and reshingling roofs, advanced more than twice as much as did the prices of commodities used in maintaining and repairing a house (house paint, porch flooring, water heaters, kitchen sinks, and faucets).
From December 1952 to December 1958, the family bill for gas and electricity rose11.9 percent. The gas increase, however, was five times larger than that of electricity,20 percent and 4 percent, respectively. Although prices of home fuels naturally vary with the seasons, the trend has been upward. Coal prices were higher, with bituminous rising considerably more than anthracite. The fuel oil price increase, a total 13.5 percent over the period, was precipitated by the Suez crisis in the summer of 1956.
In contrast to most housing expenses, prices of housefurnishings were lower in December 1958 than in December 1952, by 4.3 percent. They were relatively stable during1953 but declined steadily in the next 2 years with intensified competition and price cutting in the retail appliance market. Brices steadied in 1956 and 1957 and again drifted lower in 1958.
The price fluctuations of individual housefurnishings items were varied. The major cause of the general decline was the drop in appliance prices (15 percent) over the 6-year period, December 1952 through December 1958. This trend was due primarily to the radical change in retail merchandising of appliances. Discount houses made inroads into the market and competition for customers became severe. Regular outlets that did not give reductions from list prices were caught, at first, between the discount houses and the need to maintain their prices under so-called "fair trade" statutes. From 1955 to 1957, manufacturers gradually dropped fair trade pricing and discount competition intensified. Appliance prices steadied somewhat during the latter part of 1956 and in 1957, but fell again during the first half of 1958.
The furniture and bedding index decreased 0.3 peroent from December 1952 to December 1958. Slices for these items declined 3 percent from December 1952 to June 1955 and showed a subsequent increase of 4.3 percent from March 1956 to June 1957, partially in response to higher labor and material costs (especially steel), and freight rates. The pressures of consumer demand arising during the general boom in the sales of household durables also were partly responsible for the price increases during this period.
Until 1955, textile housefurnishing prices fell from peaks reached during the Korean conflict, led by a 19-percent drop in sheet prices between the end of 1952 and September 1955. Textile items strengthened slightly the next year and remained fairly steady through 1958. Floor coverings rose in price through 1957 as material and other costs increased, though prices in 1958 were reduced.
Apparel, December 1952, apparel prices had declined 3.8 percent from the high point in the fall of 1951 during the Korean conflict. Only relatively small changes in prices occurred during the following 6 years. There was a downward drift in prices for about 2& years, except for the usual fall increases. This slow downtrend was reversed in the fall of 1955 and by October 1956, apparel prices were 2.1 percent higher than in
9
Digitized for FRASER http://fraser.stlouisfed.org/ Federal Reserve Bank of St. Louis

October of the preceding year* Some lesser increases occurred during 1957 but in 1958 apparel prices were almost stable (except for seasonal influences), primarily due to an adequate supply of clothing and limited increases in manufacturing costs* Over the 6-year period from December 1952 to December 1958, the average increase for apparel was 2*3 percent, the smallest Increase shown for any of the major groups*
Among the apparel subgroups, the only significant departures from this general trend were for prices of footwear and of apparel made of rayon or other manmade fibers*
Footwear prices, after declining 4*8 percent from a high point in October of 1951 to a low in January 1953, edged up slowly until the fall of 1955* From September 1955 to December 1956, prices rose 7*0 percent, reflecting higher wholesale prices for leather and higher operating costs* During the next 2 years, the rate of increase was considerably slower* In December 1958, footwear prices were 3*2 percent higher than in December 1956, for a total increase over 6 years (December to December) of 14 percent*
In contrast to footwear, prices for apparel made of rayon and other manmade fibers declined slowly but almost continuously over the 6 years from December 1952 to December 1958, aside from some fluctuation due to seasonal factors* Although most of these commodities participated in the decline for a large part of the time and were lower in December 1958 than in December 1952, the major factor was the persistently lower prices for nylon hosiery* By the end of 1958, nylon hose prices were 15 percent lower than 6 years earlier* In addition, rayon and nylon slips and nightgowns had only small price increases during the upturn in 1955 and then remained stable or were further reduced* Since women1 s and girls1 apparel of manmade fibers are more important in the index than similar apparel for men and boys, the lowered prices for these articles was the main reason for a small decrease for women *s and girls* apparel for the 6-year period* All men*s and boys* apparel increased 0*9 percent, and all women*s and girls* decreased 0*2 percent from December 1952 to December 1958*
Brices of wool and cotton apparel went down slowly during 1953 and 1954* Both classes then showed general increases of moderate amounts until 1958, when some decreases were reported* From December 1952 to December 1958, the increase for wool garments amounted to 2*6 percent and for cotton apparel, 3*9 percent*
Transportation. The transportation group includes both public and private transportation* Public transportation is comprised of city bus, streetcar, and subway fares, and railroad coach fares* Private transportation includes prices paid for new and used cars, gasoline and motor oil, tires, automobile repairs, insurance, and registration fees*
The overall transportation index remained relatively stable from 1952 to mid-1956 and then moved firmly upward to the end of 1958* Over the 6 years from December 1952 to December 1958, the cost of public transportation increased about 32 percent, while the price of private transportation rose a little more than 9 percent*
The advances in local transit and railroad fares resulted from a combination of increased operating costs and a decline in patronage* Nationwide population movements to suburbs and a concomitant preference for private transportation caused a decline in the use of existing methods of service so that companies were unable to sustain profitable operations without substantial fare increases*
Within the private transportation subgroup, dealers* selling prices of new cars averaged 13*5 percent higher in December 1958 than in December 1952. (See chart 3.) This price increase did not reflect higher prices resulting from voluntary quality upgrading by consumers, such as the increasing preference for 8-cylinder cars, automatic transmissions, etc* It did, though, reflect price increases attributable to the introduction of certain design and styling features, such as wider windshields, increased use of chrome, etc*
IO
Digitized for FRASER http://fraser.stlouisfed.org/ Federal Reserve Bank of St. Louis
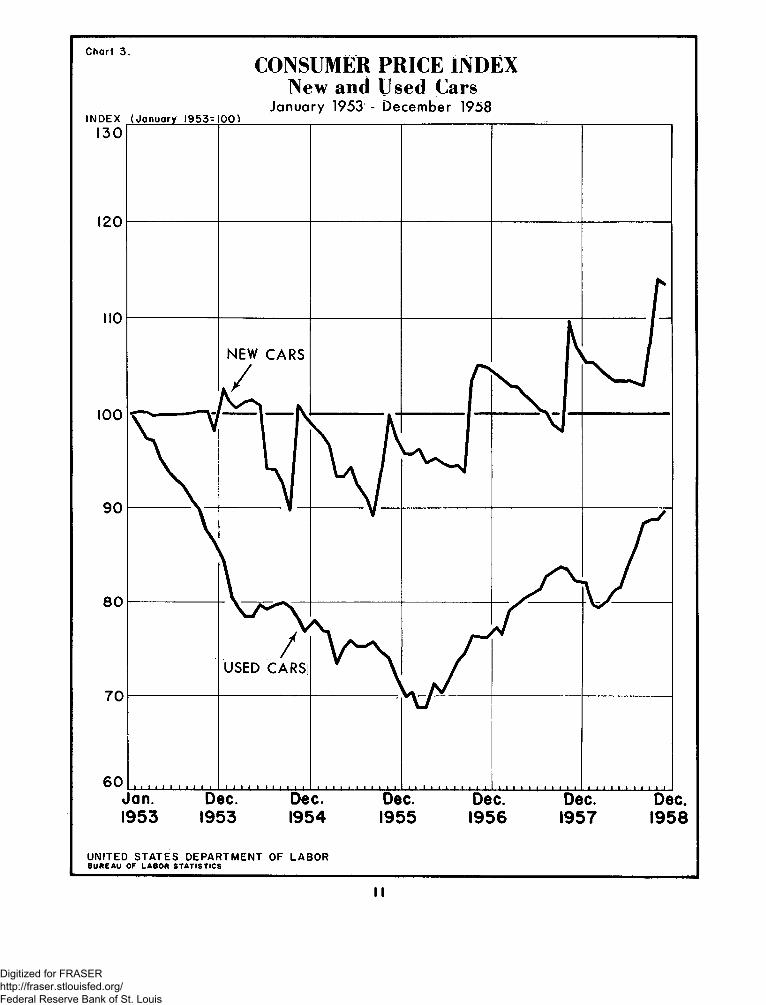
Chart 3.CONSUMER PRICE INDEX
New and Used CarsJanuary 1953 - December 1958
UNITED STATES DEPARTMENT OF LABORBUREAU OF LABOR STATISTICS
Digitized for FRASER http://fraser.stlouisfed.org/ Federal Reserve Bank of St. Louis

Each fall, as new model cars were brought on to the market, the new car index registered a seasonal increase* Then as the model year progressed, dealers tended to grant price concessions* Reported prices after June 1954 reflected the growing practice of larger price concessions as the model year progressed*
In the 6-year period (December 1952-December 1958), the volume of new car purchases moved inversely to price* Sales of new automobiles rose steadily to a record high in 1955, a year in which production reached a peak of 8 million cars* However, prices of new automobiles declined 2*8 percent between December 1952 and December 1955* In 1956, though, purchases were not quite as great as in the year before* Demand also dropped sharply in the winter of 1957-58. As of December 1958, however, prices of new cars were 16.7 percent higher than in December of 1955*
Used car prices first appeared in the revised index in January 1953* They declined sharply until March 1956 when prices were a little more than 30 percent below the January 1953 level. This drop occurred as automobile ownership grew from an average of slightly less than one car per household in 1952 to 1*12 in 1957, 8/ and was indicative of a growing consumer preference for new rather than used cars* From the summer of 1956 to autumn 1957, prices strengthened, declined in the disappointing market of the following winter, and resumed their climb at a more rapid rate to the end of 1958* At this point, used car prices were still 10 percent below their level at the beginning of 1953*
Rising labor and other operating costs were mainly responsible for the 21 •4-per- cent increase in automobile repair charges over the 6-year period (December 1952-December 1958)* A small rise in prices of tires despite a much larger increase in wholesale prices was due to an extremely competitive market to which retailers responded with trade-in allowances, "sale" prices, and discounts from list prices* Auto insurance rates increased moderately until 1958, when the rising cost of claims precipitated a 10-percent rate increase in the first quarter (from December 1957 to Ifarch 1958). Registration fees averaged 18*9 percent higher in 1958 than in 1953, with States increasing their charges as new cars became heavier and more powerful*
Gasoline and motor oil, the most important of the automobile operating expenses, were both considerably higher in December 1958 than they were 6 years earlier. Oil prices were persistently strong but the gasoline prices moved erratically as a result of tax changes political disturbances in the Middle East* The Federal gasoline tax of July 1, 1956, raised average prices more than 3 percent and State increases were comparable. When the Suez Canal closed in November of 1956, American producers geared production to satisfy probable European requirements* Then when the Canal opened sooner than expected, stocks were overexpanded* Also at that time, there occurred a reduction in the growth rate of U*S* consumption. As a result, price wars flared in many areas of the country as operators tried to move their stocks*
Modi cal Care, In the 6 years, December 1952 to December 1958, the medical care index increased 23*5 percent* During this period* all of the medical care items rose, although the degree of price movement varied widely* In December 1958, group hospitalization premiums, reflecting the advance in hospital rates, were higher by 49*1 percent than 6 years earlier; whereas the optometric examination and eyeglasses advanced only 5*2 percent. Hospital rates increased 40.2 percent during the same period, as labor and operating costs continued to mount* Physicians * and dentists1 fees also increased 21*3 percent and 16*1 percent, respectively. Prices of prescriptions and drugs rose 11.9 percent as higher production and distribution costs were passed on by the manufacturers*
When price changes for the various physicians1 services are compared, the
8/ Estimated from Automobile Facts and Figures, Mctor Vehicle Registrations in U.S*, (p* 18), 1958 Edition Automobile Manufacturers Association*
I2
Digitized for FRASER http://fraser.stlouisfed.org/ Federal Reserve Bank of St. Louis

differences are not quite as marked, ranging from a rise of 26*1 percent for an obstetrical case to 6.1 percent for an appendectomy. Physicians* office and house visits advanced 22.3 percent and 23*5 percent, respectively, and a tonsillectomy was higher by 14*9 percent.
In the 6-year period (December 1952-December 1958), the annual (December-to- December) increase for the medical care index averaged 3*9 percent. The smallest increase was 2.2 percent in 1954* due to the smaller-than-average increase for medical services other than hospital rates and group hospitalization premiums. The largest annual increase was reported in 1958 with group hospitalization higher by 10.8 percent and hospital rates by 3#9 percent, resulting in an overall annual, increase of 4*6 percent for medical care.
Family expenses for personal care, which include such items as men's haircuts, beauty shop services, and toilet articles, advanced a total of 15 percent from December 1952 to the end of 1958. An important factor in the persistent price advance was the fact that half of the personal care items are services. The personal care price trend generally paralleled that of all services in the CPI for much of the 6-year period.A major cause of the price increase for personal care was the advance in men's haircuts, which were priced 24 percent higher in December 1958 than 6 years earlier. Beauty shop services rose about 19 percent during the same period, reflecting price increases for such items as shampoo and wave set. Toilet goods price movements were mixed but in general they were higher.
RsfitfUftfl ftrci Recreation. The cost of reading and recreation to the urban family rose only 8.2 percent between December 1952 and the close of 1958, slightly less than the average of all consumer prices. Prices fell slightly from December 1952 to the summer of 1955 and remained fairly stable until the following summer, but in the next 2§- years (June 1956 to December 1958), they rose almost 9 percent. Within the group, there were divergent movements: Commodities declined while services increased. Prices of televisionsets, affected by competition between discount houses and regular outlets, dropped almost 7 percent between December 1952 and the end of 1958. In contrast, movie admissions rose28.9 percent in the same period. To combat declining attendance, theaters introduced special features and improved screens and techniques. To offset the resultant increased costs, they raised prices. Newspaper prices increased sharply after remaining relatively stable for a number of years. By December 1958, newspaper prices had increased 19*7 percent over the December 1952 levels.
Other Goods and Services. During most of the 6-year interval, from December 1952 to December 1958, other goods and services, which consist primarily of tobacco and alcoholic beverages, moved similarly to the total CPI, increasing almost 10 percent. Prices of alcoholic beverages did not advance as rapidly as prices of tobacco products. Cigarette prices rose 16.3 percent, reflecting industrywide price increases in February 1953 and June 1957. Higher manufacturing costs and increased State taxes contributed to price increases for both alcoholic beverages and tobacco.
I3
Digitized for FRASER http://fraser.stlouisfed.org/ Federal Reserve Bank of St. Louis

H is to ry, Scope , and Meaning o f the Consumer P rice Index
The Bureau o f Labor S ta tis tic s ' Consumer P rice Index measures changes in re t a il p ric e s o f goods and se rvice s purchased by c it y wage-earner and c le ric a l-w o rk e r fa m ilie s .I t is an index o f p rice change, and th e refore does not in d ica te changes in the kinds and amounts o f goods and se rvice s fa m ilie s buy o r the to ta l amounts fa m ilie s spend fo r liv in g , o r d iffe re n ce s in p rice le v e ls o r l iv in g costs in d iffe re n t places.
The Consumer P rice Index in ro u gh ly i t s present form was f i r s t published in 1921 w ith data back to 1913* The basic features o f the e a rly 11 c o s t-o f-liv in g ' ’ in d e x, as the s e rie s was then known, included: ( l) An index designed to measure changes in p rice s paidb y a sp e c ific population group— urban wage-earner fa m ilie s ; (2) a n a tion a l " a ll items'* in d e x, published re g u la rly , based on a c it y sample re p resen ta tive o f a l l U .S. c it ie s included in the scope o f the measure ( in it ia lly the index was lim ite d to la rg e c it ie s ) ; (3) a w eighting stru ctu re which represented the re la tiv e importance o f item s in the ty p ic a l wage-earner and c le ric a l-w o rk e r fa m ily consumption p a ttern as d erived from consumer expenditure su rve ys; and (4) system atic c o lle c tio n o f p ric e s from r e t a il stores and se rvice establishm ents t y p ic a lly patronized by the "index fa m ilie s" .
The CPI, as published in 1921, was based on data developed from surveys o f fa m ily expenditures during the years 1917 to 1919* D e ta ils o f cost o f goods in the fa m ily "market basket" were obtained from 12,100 wage-earner and c le ric a l-w o rk e r fa m ilie s in 92 in d u s tria l centers* P rice data were co lle cte d re g u la rly fo r about 145 commodities, and se rvic e s and indexes were constructed fo r 32 c it ie s and fo r the U .S. as a whole. Two other c it ie s were added la te r and the 3 4 -c ity sample was maintained u n t il the re vis io n o f the index in 1952. The base period o f the e a rly CPI was 1913=100, la te r changed to 1923-25=100.
R evision o f 1934-36. In 1934 through 1936, the Bureau undertook a comprehensive fa m ily expenditure su rvey and In s titu te d marked improvements in methods o f c o lle c tin g r e t a il p rice s. The su rvey covered buying patterns o f n e a rly 14,500 fa m ilie s in 42 c it ie s , each w ith a popula tio n o f 50,000 o r more. The 1934-36 su rvey revealed th a t expenditures fo r food, housing, and c lo th in g had a l l changed m arkedly in the kinds o f goods purchased and in d o lla r volume as a percent o f to ta l fa m ily Income and expenditure. The re s u lts o f the survey were used to rew eight the in d e x. Sim ultaneously, new commodities were added and the base period sh ifte d to 1935-39=100. A s ig n ific a n t development was the in it ia t io n o f p ric in g according to predetermined q u a lity d e sc rip tio n s. The work o f re vis io n was completed in 1940.
W orld War I I . During World War I I , the Bureau attempted to take account o f the e ffe c t o f shortages, ra tio n in g and p ric e c o n tro l, and q u a lity d e c lin e s, on r e t a il p ric e s . Proper allowance fo r q u a lity change could not be made, however. No s a tis fa c to ry method e xiste d f o r measuring "black market" p ric e s , which apparently were frequent during th a t p e rio d . The Bureau was able to re vis e the l i s t o f a rtic le s p ric e d , however, and take cognizance o f the e ffe c t o f ra tio n in g b y s h iftin g the importance o f weights f o r c e rta in fo o d stu ffs (meat and sugar, fo r example). Wartime product sp e c ific a tio n s replaced those o f peacetime, c o lle c tio n o f re n t inform ation d ire c t ly from tenants was in s titu te d , and oth er changes were made to meet the w art line s itu a tio n .
Postwar R e visio n . In 1949, the Bureau o f Labor S ta tis tic s commenced a 3 -yea r program to re vis e the in d e x. Before th is was completed, however, the Korean c o n flic t occurred in 1950 and i t was decided th a t immediate changes in the index were necessary, even though based on Incomplete survey re s u lts . Consequently, an "interim adjustment" was made, using inform atio n then a va ila b le and embracing (1) re vis io n o f c it y population weights using 1950 Census
14
Digitized for FRASER http://fraser.stlouisfed.org/ Federal Reserve Bank of St. Louis

data; (2) co rre ctio n o f the re n t index fo r the "new u n it b ias," 2/ to take account o f the re n t d iffe re n tia l between housing constructed prewar and postwar (Vorld War I I ) ; (3) additio n o f soae 25 new ite a s ; and (4) re vis io n o f w eights fo r groups o f ite a s and fo r sone co a n od ities.
Meanwhile, the 3 -yea r comprehensive re vis io n program continued and was completed in December 1952. The index base was sh ifte d to 1947-49=100. New w eights representing 1951-52 spending p a tterns were derived from the 1950 consumer expenditure study* T h is re v is io n o f the market basket was the f i r s t basic step in re vis io n o f the CPI.
An in te g ra l p a rt o f th is re vis io n was a complete reexam ination o f the c it ie s chosen fo r in c lu sio n in the to ta l C PI. The form er index represented o n ly la rg e c it ie s , but the re vise d index is based on a s c ie n tific a lly chosen sample o f 46 urbanised areas, includin g la rg e , m edium -site, and small c it ie s w ith more than 2,500 p op ulation. IQ/
The fo llo w in g ta b u la tio n shows the expenditure bases fo r weights in the o rig in a l index and in each m ajor re vis io n and the period during which these weights were used:
Date o f expenditure WffTpy______
Period used in index
O rig in a l index----------------------------------------- 1917-191940 1/-------------------------------------------------- 1934-361951 V -------------------------------------------------- 1947-49 U1953------------------------------------------------------- 1950
1913-39 1935-52 2/ 1950-52 1953 to date
1/ In the 1940 re vis io n , a ll-ite m s indexes fo r the ye a rs 1925-29 were re vise d re tro - a c t iv e ly b y re ve ig h tin g group indexes w ith weights calculated as averages o f group expenditu re s derived from the surveys o f 1917*19 and 193-4*36; a ll-ite m s indexes fo r the yea rs 1930*34 were re vise d re tro a c tiv e ly b y rew eighting group indexes w ith weights derived from the 1934-36 su rve y; fo r the ye a rs 1935*3% indexes fo r a ll item s and m ajor groups were comp le te ly recalculated w ith re vise d weights derived from the 1934*36 su rve y.
2/ Weights based on the 1934-36 expenditure survey were used in the "old s e rie s ” index through June 1953*
Jj In the 1951 re vis io n (in te rim adjustm ent), a ll-ite m s and group indexes fo r January to December 1950 were re vise d re tro a c tiv e ly ; indexes fo r re n t and a l l item s were corrected fo r the new u n it b ia s from 1940.
lJ 7 c it ie s only*
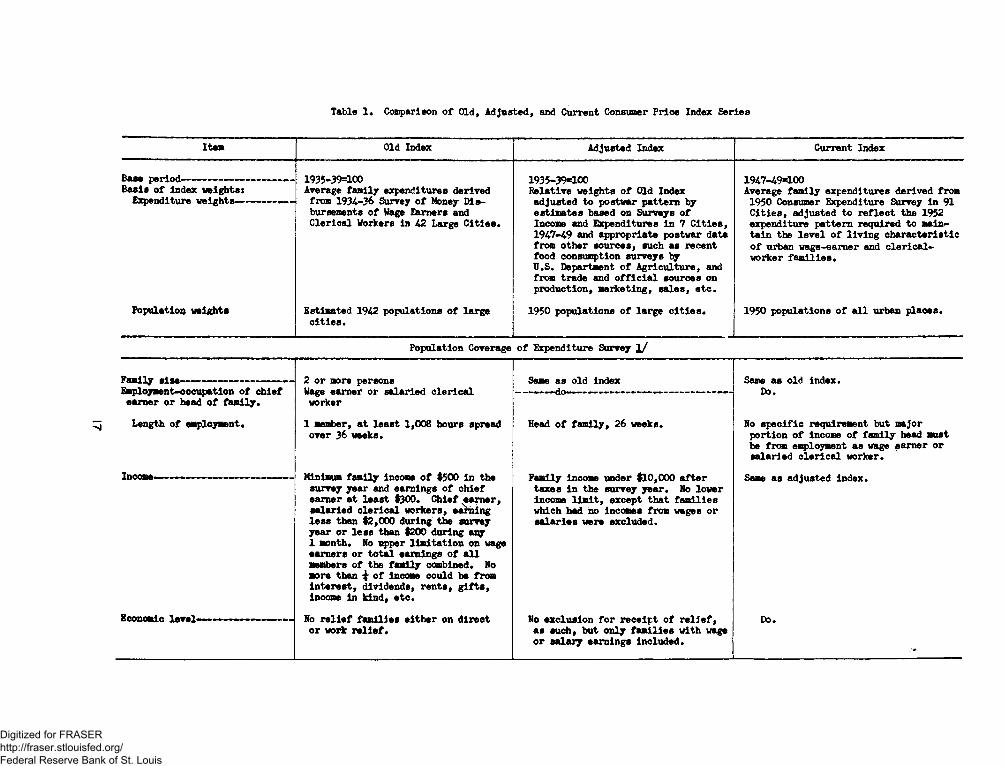
D escrip tion o f Old* Adjusted. and Revised S e rie s, The "old s e rie s91 index measured average p ric e changes through June 1953 w ith weights based on 1934-36 spending p a tte rn s. The "adjusted s e rie s 91 index measured average p rice changes from 1950 through 1952 w ith w eights based on estim ated 1949 expenditures, w ith a re tro a c tive c o rre ctio n fo r the new u n it b ia s in the re n t index back to 1940. Both the old and adjusted se rie s were published fo r the period 1940-52. The "revised se rie s," which is the index c u rre n tly published, measures p ric e changes from 1953 to date w ith w eights based on 1950 expenditure patterns from the expendi-
2/ The rent component had understated the actual ris e in re n ts a fte r 1940 because the index techniques fa ile d to re fle c t the s ig n ific a n t d iffere n ce between re n ts fo r new d w ellin g s when they f i r s t came on the re n ta l market and those o f comparable dw e llin gs a lrea d y on the market. In a market fre e from c o n tro ls there is no consistent d iffe re n tia l between the "old" and "new" u n its , but under the p ro vis io n s o f re n t c o n tro l, rents fo r o ld e r u n its were co n tro lle d w h ile most new u n its were exempt. See In te rim Adjustment o f CPI (BLS B u ll. 1039)#
10/ F o r a more d e ta ile d d iscu ssion , see S election o f C itie s fo r Consumer Expenditures S u rvey, 1950 (in M onthly Labor Review, A p r il 1951, pp# 430-436; a lso issued as R eprint R. 2060).
15
Digitized for FRASER http://fraser.stlouisfed.org/ Federal Reserve Bank of St. Louis

tu re su rve y, adjusted f o r income and p ric e change to 1952* A continuous s e rie s extending back to 1913 was achieved by lin k in g the re vise d se rie s to the adjusted se rie s a t December 1952♦ The old se rie s vas discontinued in June 1953♦ Table 1 presents a comparison o f the cu rren t index w ith e a r lie r series*
The Current Index* The current index is based on p ric e s o f some 300 item s which were sele cted to represent average p rice movements o f a ll goods and se rvice s bought b y the fa m ilie s o f urban wage earners and c le r ic a l w orkers, as shown by the Survey o f Consumer Expenditures in 1950* P ric e s are co lle cted from a sample o f r e t a il sto res and se rvic e establishm ents in the 46 urbanised areas and sm aller c itie s # The establishm ents where p ric e s are obtained are those most fre q u e n tly patronised b y wage-earner and c le ric a l-w o rk e r fa m ilie s and represent the im portant types o f m erchandising operations, such as chain, Independent, department, and s p e c ia lty sto re s, and others* Rental data are obtained from tenants liv in g in u n its represe n ta tive o f a ll re n ta l dw ellings in the urbanised areas*
The goods and se rvice s Included are priced in accordance w ith d e ta ile d sp e cifica tio n s which define q u a lity* To the exten t p o ssib le , p ric e s are obtained fo r commodities o f constant q u a lity from month to month so th a t the index shows p ric e change o n ly and is not affected by q u a n tity o r q u a lity d iffe re n c e s. U / In a d d itio n to v e r ify in g the product d e s c rip tio n , the Bureau's agents check on discounts o r tra d e -in allowances to obtain re a lis t ic net prices* These net p ric e s paid by customers, in c lu d in g sales and excise ta xe s, are used to calculate the CPI*
The na tion a l index (U.S. c it y average) includes p ric e s from the 20 la rg e urbanized areas fo r which separate indexes are published and fo r 26 a d d itio n a l medium-size and sm all c itie s * 12/ For the 5 la rg e s t c it ie s , indexes are published each month fo r a ll m ajor groups and subgroups o f item s (see Tabular Summary tables C-2 and C-3)* Fo r the oth er 15 la rge c it ie s , indexes are published m onthly fo r food and it s subgroups and q u a rte rly fo r a ll items, in c lu d in g food* The p u b lica tio n schedule fo r the c it y a ll-ite m s indexes is as fo llo w s :
Monthly a?*»J u ly , Oct*F e b ., May, A u g ., Nov.
Mar*, June, Sept*, Dec*
Chicago D e tro it Los Angeles New York P h ila d elp h ia
Boston Kansas C ity M inneapolis P ittsb u rgh Portland
ClevelandHoustonScrantonS eattleWashington, D* C.
A tla n ta Baltim ore C in c in n a ti St* Lou is San Francisco
Indexes fo r selected items and fo r special groupings o f item s are published f o r the months o f March, June, September, and December based on data fo r c it ie s priced in these months*
. u / See Average R e ta il P ric e s: C o lle c tio n and C alcu la tion Techniques and Problems(BLS B u ll. 1182).
12/ See footnote 10.
16
Digitized for FRASER http://fraser.stlouisfed.org/ Federal Reserve Bank of St. Louis
T a b le 1 . Com parison o f O ld , A d ju s t e d , and C u rren t Consumer P r i c e In d ex S e r ie s
Item O ld In d ex A d ju s te d In d ex C u rren t In d ex
B ase p e r i o d - ™ - — — — ----------— — 1935 -39= 100 1 9 3 5 -3 9= 1 0 0 194 7 -4 9= 1 0 0B a s is o f in d e x w e ig h t s :
E x p en d itu re w e ig h ts — ------------— -A verage fa m ily e x p e n d itu r e s d e r iv e d
from 1 9 3 4 -3 6 Survey o f Money D is bursem ents o f Vage E arn ers and C le r i c a l W orkers in 42 L a rge C i t i e s *
R e la t iv e w e ig h ts o f O ld In d ex a d ju s t e d t o p o stw a r p a t t e r n b y e s t im a t e s b a se d on S u rv eys o f Incom e and E x p e n d itu re s in 7 C i t i e s , 1 9 4 7 -4 9 and a p p r o p r ia te p o stw a r d a ta from o t h e r s o u r c e s , su ch a s r e c e n t fo o d con su m p tion s u rv e y s b y U .S . D epartm ent o f A g r i c u l t u r e , and from t r a d e and o f f i c i a l s o u r c e s on p r o d u c t io n , m a r k e t in g , s a l e s , e t c .
A verage fa m i ly e x p e n d itu r e s d e r iv e d from 1950 Consumer E xp en d itu re S urvey in 91 C i t i e s , a d ju s te d t o r e f l e c t th e 1952 e x p e n d itu r e p a t t e r n r e q u ir e d t o m aint a i n th e l e v e l o f l i v i n g c h a r a c t e r i s t i c o f u rban w a g e -e a rn e r and c l e r i c a l - w ork er fa m i l i e s *
P o p u la t io n w e ig h ts E stim a ted 1942 p o p u la t io n s o f l a r g e c i t i e s *
1950 p o p u la t io n s o f la r g e c i t i e s * 1 95 0 p o p u la t io n s o f a l l u rban p la c e s *
P o p u la t io n C o rera ge o f E x p e n d itu re S u rvey 1 /
F a m ily s i s e — - — ---------------------------- —E m p loy m en t-occu p a tion o f c h i e f
e a r n e r o r head o f fa m ily *
2 o r more p e rs o n s Wage e a rn e r o r s a la r ie d c l e r i c a l
w ork er
Same a s o ld in d e x Same a s o l d in d e x . D o.
L ength o f em ploym ent* 1 member, a t l e a s t 1 ,0 0 8 h o u rs sp re a d o v e r 36 w eek s .
Head o f f a m i l y , 26 w eeks* No s p e c i f i c re q u irem en t b u t m a jo r p o r t i o n o f incom e o f f a m i ly head must be from em ploym ent a s wage e a rn e r o r s a la r i e d c l e r i c a l w orker*
Minimum fa m ily incom e o f $500 In th e su rv e y y e a r and e a rn in g s o f c h i e f e a r n e r a t l e a s t $300* C h ie f e a r n e r , s a la r i e d c l e r i c a l w o r k e rs , e a rn in g l e s s than $ 2 ,0 0 0 d u r in g th e su rv ey y e a r o r l e s s than $200 d u r in g any 1 month* No u p p er l i m i t a t i o n on wage e a r n e r s o r t o t a l e a rn in g s o f a l l members o f th e fa m ily com bined* No m ore than £ o f incom e c o u ld be from i n t e r e s t , d iv id e n d s , r e n t s , g i f t s , incom e in k in d , e t c .
F a m ily incom e u n d er $ 1 0 ,0 0 0 a f t e r t a x e s in th e s u rv e y y e a r* No lo w e r in com e l i m i t , e x c e p t t h a t f a m i l i e s w h ich had no in com es from w ages o r s a l a r i e s w ere e x c lu d e d .
Same a s a d ju s t e d in d ex*
E conom ic l e v e l — — — — — — — — — No r e l i e f f a m i l i e s e i t h e r on d i r e c t o r w ork r e l i e f *
No e x c lu s i o n f o r r e c e i p t o f r e l i e f , a s s u c h , b u t o n l y f a m i l i e s w ith wage o r s a la r y e a r n in g s in c lu d e d *
Do*
Digitized for FRASER http://fraser.stlouisfed.org/ Federal Reserve Bank of St. Louis
T ab le 1* Comparison o f O ld , A d ju sted , and C urrent Consumer P r ic e Index S e r ie s - Continued
Item Old Index A d ju sted Index Current Index
C ity C overage
________________________________ 34 la rg e c i t i e s — none l e s s than 50,000 Same a s o ld in d e x . 46 c i t i e s rang ing in s i s e from M a d ill ,p o p u la tio n ; o n ly 1 w ith 1950 p o p u la - O kla , (abou t 2 ,5 0 0 p o p u la t io n ) t ot io n o f l e s s than 1 00 ,0 0 0 , (56 c i t i e s New York C ity .f o r f o o d ) .
Food and f u e l p r ic e d m onthly In a l l _ - T r ----- ,----- ,-------------- t---------------- ,----- -------- fitml mvu4 m fm o m a l 4fmnm« w w p wllu A luN vOXev vOU J» v^Moc i t i e s . p r ic e d m onthly in a l l c i t i e s .
Other com m odities and s e r v ic e s p r ic e d __— ___________________ - __- _____— ___________ Other com m odities and s e r v ic e s p r ic e dm onthly in 10 c i t i e s , q u a r te r ly in m onthly in 5 la r g e s t c i t i e s , q u a r te r ly2 4 . in 15 la r g e c i t i e s and 26 m edlum -sise
and sm all c i t i e s .
Commodity Coverage
Number o f item s p r i c e d -— ----------- 200 225 310Food— — — — - — ----------------------- 51 60 87Housing— — — — — --------- — 46 52 66
S h e lte r ------------------------------------ - 1 1 15
House purchase and upkeep-X
14Gas and e l e c t r i c i t y --------- — - 2 3 3S o lid f u e l s and f u e l o i l -------- 8 8 7H ou se fu m ish in gs— — - - - - - 25 29 30H ousehold o p e ra t io n — — — — 10 11 11
A pparel— — --------------------- ------------ 62 66 73T ra n sp orta tion — ---------— — 10 10 18M edica l ca re ---------------— --------- — 15 16 18P erson a l ca re — --------- ------------- - — 11 12 13Reading and r e c r e a t io n — ------- -- - 2 5 31Other goods and s e r v ic e s ------------ 3 4 4
P ublish ed group in d exes— — — F ood , r e n t , a p p a re l, f u e l , h ou se- Same a s o ld in d e x . F ood , h ou sin g , a p p a r e l, t r a n s p o r ta t io n ,fu r n is h in g s , and m isce lla n eou s goods m ed ica l c a r e , p e rso n a l c a r e , rea d in gand s e r v ic e s . and r e c r e a t io n , and o th e r goods and
s e r v ic e s .Im portant ch an ges:
I ?m 4 4 n k e 4 a /4 4 a tia w m enny> m 4 a * P m m fa n w t t n t t r a a I a r\T*4 a a /44 * 0 w lM clw u U b O H A V O BHHW p r i v O h m v O W Q v
a s fo o d consumed a t home.i B o w a U i a U b 1 U O U 0 p i l v V U e
Used ca rs— — — — — — Estim ated t o have same p r ic e movement — —— — d o—— —— — — — — — — —— — — Used ca rs p r ic e d .a s new o a rs .
H ousing:Rent— — — — — — — — No adjustm ent f o r new u n it b ia s . A d ju sted f o r new u n it b ia s from 1940, No adjustm ent need ed .Home-ownership c o s t s - --------- — Home purchase n ot Inclu ded in in d e x . Same as o ld in d e x . Home purchase in c lu d e d . Home m ainte
Maintenance c o s t s estim ated t o have nance item s p r ic e d and purchase p r i c esame p r ic e movement as r e n ts . o f home rep resen ted by d i r e c t p r i c in g .
1 / F or the o ld in d e x , exp en d itu re surveys were lim ite d t o w age-earner and c le r lc a l* w o r k e r f a m i l i e s . F or the a d ju s te d and cu rre n t in d exes the surveys In clu ded a l l urban consum ers. The p o p u la tion coverage in form a tion presen ted h e r e , how ever, r e f e r s o n ly t o the w age-earn er and c le r ic a l -w o r k e r fa m il ie s o f the su rveys .
Digitized for FRASER http://fraser.stlouisfed.org/ Federal Reserve Bank of St. Louis

Technical Motes
Thft ftrngton gf. 12gRevision «f Hnnaing Concent. Although the current (revised) index is not fundamentally different Aron prior series, important changes in the pattern of living in the U.S. between 1939 and 1950 Bade certain conceptual revisions desirable. In that period, the expenditures of city-workers' families for housing changed radically, requiring revision of the housing concept. When the index was initiated, the identification and classification of expenditures for housing were relatively simple. Families either owned or rented their dwellings (shelter only) and paid for fuel and furnishings separately. But as the manner of living altered, housing became an ever-changing group of goods and services. According to early family living studies, most city workers rented their homes and the purchase price of homes and payments on mortgage principal were treated as savings. By 1950, the increased proportion of homeowners among wage-earner families required a revised measurement of homeowner shelter costs. In the light of the revised housing concept, the emission of home purchase from the index was no longer valid.
In the early versions of the index, prloes of homeowner's maintenance items were assumed to move like rents, on the grounds that owner housing had been in competition with rental housing, and many factors which affected rents affected owner maintenance costs similarly. The assumption that rents and maintenance costs moved together became invalid during World War II as rents cams under control but home owners' costs in general did not. Therefore, in revising the index, the Bureau broadened the housing definition to include all items of expense connected with the acquisition and operation of a home. The purchase of a home was included in the weights and pricing of both beam purchase and maintenance items was instituted.
The revised housing ooncept led to seme changes in classification of items in the index, frier to the revision, the individual items of housing expense, Insteed ef comprising a separate housing index, appeared in four of the six major components of the CPI: rent} fuel, light, and refrigeration} housefttrnishings} and miscellaneous goods and services. The rent component included expenditures by renters for shelter and other items in the rental price, combined with expenses of owners for mortgage interest, taxes, insurance, repairs, ground rent, and financing charges in connection with sale or purchase. With the 1953 revision, the calculation of a housing index was started. Subgroups of this index now include shelter, gas and electricity, solid fuels and fuel oils, housefurnishings, and household operation. The weights for the new shelter component include residential rents, home purchase and upkeep, and housing away from home.
The rent segment measures the effect of price change on the cost of renting dwelling units in proportion to the number of tenants among city-workers' families in 1952. It reflects changes in contract rents charged for dwellings which represent all types of family rental units. Rent information is obtained directly from the tenant by personal interview.
The homeowner segment measures the effect of price change on the costs of acquiring and operating homes in current markets at the ownership level in 1952. These costs consist of such items as financing services required to buy similar qualities of housing under the same mortgage risk conditions as existed in the reference year} the same level of protection against fire and other hazards as existed in 1952 for a similar quality of house and typo of risk} property tax payments levied on the same quality of beams owned in 1952; and maintenance and repairs at the same rate as observed in 1952.
Revising the Index. One of the first steps in the revision program was collection of information on rent and housing characteristics for a large sample of dwelling units. These dwelling unit surveys served two purposes: (1) They provided addresses from which a representative sample of households could be selected for a detailed study of family expenditures,
19
Digitized for FRASER http://fraser.stlouisfed.org/ Federal Reserve Bank of St. Louis

and (2) they provided the baeie data needed to ealeolate and sake the necessary correction for the understatement in the rent index. 13/
The f sally expenditure data for the 1952 index revision were obtained during the early souths of 1951. Bureau field interviewers obtained Aron each family in the staple a comprehensive accounting of its lncoaw, savings, and expenditures during the calendar year 1950. The data obtained included the kinds and amounts of goods and services bought, the anounts spent for each iteei, and where purchases were aade. 14/ Price Information was also obtained for an expanded list of goods and services in additional types of stores, to provide data on comparative price movements required for selection of iten and store samples.
Revision of City Sample. By the addition of small and medium-size cities, the city sample was made representative of all urban places. Selection of the cities to be included in the expenditure survey was based on two major considerationss (1) To provide a good sample of the total urban population on which estimates of the U.S. urban spending pattern could be based, and (2) to make possible reasonably reliable estimates of expenditure weights for any city in the D.S.
Thirteen large urbanised areas 15/ having a total population of 35.5 million were included because of their extreme importance from any point of view. The remainder of the 46 cities were chosen by scientific sampling methods Aram among 2,785 cities with a total population of 55.2 million. In selecting the sample, consideration was given to temperature, population density, community income level, and (in the case of the smallest cities) distance to a market center.
To expand the sample for expenditure data, 50 additional cities were selected.Of the total of 96 cities in the sample, 6 had been surveyed during the previous 3 years and were not included in the 1950 program. Only the national sample of 46 cities is included in the revised Consumer Price Index. 16/
Converting Expenditure Data to Index Weights. The consumer expenditure surveys yielded expenditure data which could serve adequately as a firm basis for weights for the national "all items11 CPI and for the various groupings within the TI.S. index. The same reliability attached to the weights for the large cities.
General Description. As usual with samples, however, the finer the detail required, the more sampling error, other things being equal. Thus, the expenditure data for a group of items for any one small city would have mere sampling error than for the U.S. as a whole. This error was reduced by peeling the data for a number of related cities and using the average expenditures for the city-groups to develop weights which were then used for each city in the group.
Under this general procedure, the first step in the adjustment of the survey data was the classification of items into three broad categories of consumption which previous studies had indicated were related to level of income. These groupings were: (1) food and alcoholic beverages, (2) housing, and (3) all other goods and services. Within each of these categories, items were further classified into subcategories, groups, subgroups and item classes.
13/ See footnote 9.14/ Methodology of the Survey of Consumer Expenditures in 1950, Helen Humes Lamale,
Bureau of Labor Statistics, U.S. Department of Labor, in conjunction with Study of Consumer Expenditures, Incomes, and Savings, University of Pennsylvania, 1959.
15/ Two urbanised areas, Hew Tork City and northeastern Hew Jersey, were later combined for use In the index.
16/ See footnote 10.
20
Digitized for FRASER http://fraser.stlouisfed.org/ Federal Reserve Bank of St. Louis

Beginning with the saalleat classification:1. The relative importance of each item in total expenditure for mall groups
of related items was calculated for each city.2. Distributions of cities by these relative importance figures were examined
for similarities or differences in expenditure patterns.3. Expenditure data for eities having similar family expenditure distributions
were averaged for each city grouping separately and the resulting average relative importance was used for each city in the group. The average was assumed to give a more representative pattern and minor intercity differences were regarded as sampling errors. Where the range was extremely large, several city groupings were made. The objective was to minimise the adjustments due to sampling and reporting errors, but to preserve city differences which were felt to represent real differences in consumption patterns by city.This same procedure was used at successively higher levels, subgroups, groups, etc.,
up to but not including the three major categories of consumption— food, housing, and all other goods and services, which ware derived by procedures to be discussed later.
1952 Weights. The Consumer Expenditure Survey data relate to the year 1950, but the new weights were not introduced into the CPI until 1952. Accordingly, two broad types of adjustment were needed: (1) to take account of changes in basic spending patterns between 1950 and 1952, and (2) to take account of price changes between 1950 and 1952.
The first step in estimating 1952 expenditures was derivation of estimated family income for each city. Family income for 1952 was estimated from a straight-line regression of 1950 income of wage-earner and clerical-worker families and gross weekly earnings of production workers in manufacturing industries. Two sets of regression coefficients were calculated, one for use with cities having populations of 240,000 and over and another for cities of under 240,000 papulation. The equations thus developed were then applied to 1952 earnings data to obtain estimated family income by city in 1952.
A number of aspects of the method of converting statistics from the expenditure survey to weights in the Consumer Price Index have been described in various articles in the Monthly Labor Review and in BLS Bulletin 1165, Consumer Prices in the U.S., 1949-52.The following discussion, therefore, deals with certain aspects ef the weight revision which are of general interest and have not been treated elsewhere. The method of deriving the weights far housing are covered in considerable detail in two issues of the Monthly Labor Review. 22/
Food and Alcoholic Beverages. Expenditures for total food and alcoholic beverages were derived from the 1950 expenditure survey, adjusted for changes in consumption between 1950 and 1952 on the basis of observed relationships between food expenditures and net money income. More specifically, the 1952 estimated expenditures for food were computed by region and city-sise class from regression equations of food expenditures and net money income in 1950. From these equations and 1952 estimated income, derived as described above, 1952 estimated food expenditures were obtained. In addition, a variety of data were used to correct for the under-reporting of expenditures for alcoholic beverages.
Automobiles. Automobile purchases data reported in the expenditure survey indicated abnormally high rates of acquisition, probably resulting from advanced buying because of the Korean conflict and delayed buying caused by World War II shortages. It was decided, therefore, to adjust the reported data on purchases to eliminate the effect of unusually high purchase rates. For new and used cars separately, a normal purchase rate was calcu-
17/ Housing Costs in the Consumer Price Index (in Monthly Labor Review, February and April 1956, pp. 189-196 and 442-446).
21
Digitized for FRASER http://fraser.stlouisfed.org/ Federal Reserve Bank of St. Louis
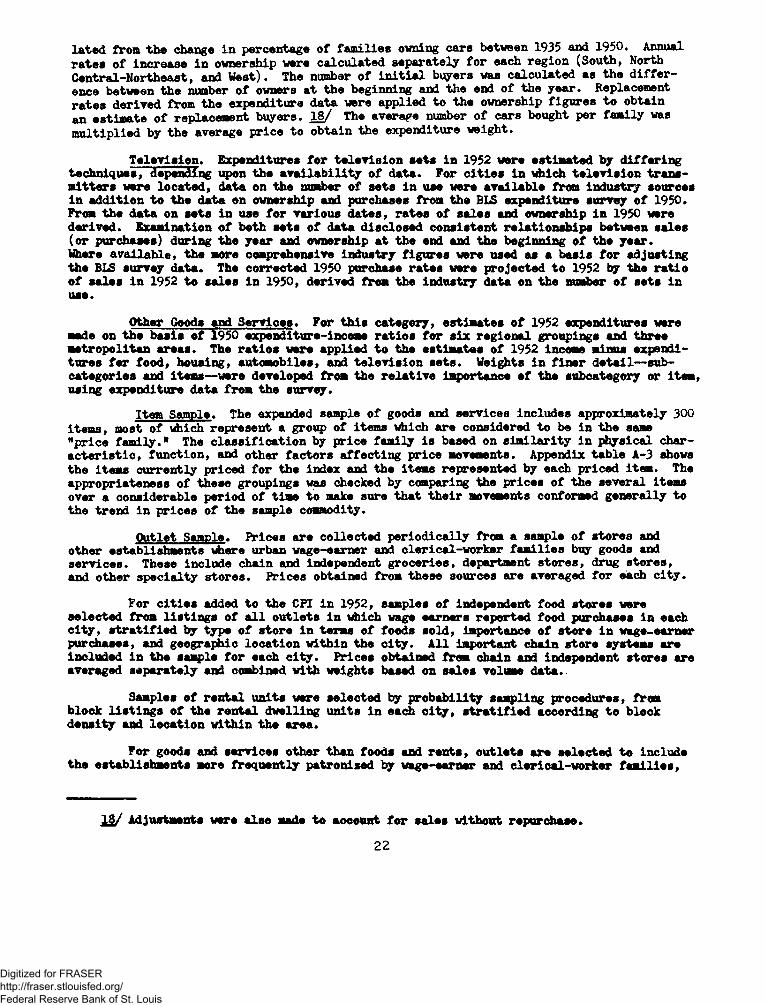
lated from the change in percentage of families owning cars between 1935 and 1950* Annual rates of increase in ownership were calculated separately for each region (South, North Central-Northeast, and West). The number of initial buyers was calculated as the difference between the number of owners at the beginning and the end of the year. Replacement rates derived from the expenditure data were applied to the ownership figures to obtain an estimate of replacement buyers. 18/ The average number of cars bought per family was multiplied by the average price to obtain the expenditure weight.
Television. Expenditures for television sets in 1952 were estimated by differing techniques, depending upon the availability of data. For cities in which television transmitters were located, data on the number of sets in use were available from industry sources in addition to the data on ownership and purchases from the BLS expenditure survey of 1950. From the data on sets in use for various dates, rates of sales and ownership in 1950 were derived. Examination of both sets of data disclosed consistent relationships between sales (or purchases) during the year and ownership at the end and the beginning of the year.Where available, the more comprehensive industry figures were used as a basis for adjusting the BLS survey data. The corrected 1950 purchase rates were projected to 1952 by the ratio of sales in 1952 to sales in 1950, derived from the industry data on the number of sets in use.
Other Goods and Services. For this category, estimates of 1952 expenditures were made on the basis of 1950 expenditure-income ratios for six regional groupings and three metropolitan areas. The ratios were applied to the estimates of 1952 Income minus expenditures for food, housing, automobiles, and television sets. Weights in finer detail— subcategories and items— were developed from the relative importance of the subcategory or item, using expenditure data from the survey.
Item Sample. The expanded sample of goods and services includes approximately 300 items, most of which represent a group of items which are considered to be in the same "price family." The classification by price family is based on similarity in physical characteristic, function, and other factors affecting price movements. Appendix table A-3 shows the items currently priced for the index and the items represented by each priced item. The appropriateness of these groupings was checked by comparing the prices of the several items over a considerable period of time to make sure that their movements conformed generally to the trend in prices of the sample commodity.
Outlet Sample. Prices are collected periodically from a sample of stores and other establishments where urban wage-earner and clerical-worker families buy goods and services. These include chain and independent groceries, department stores, drug stores, and other specialty stores. Prices obtained from these sources are averaged for each city*
For cities added to the CPI in 1952, samples of independent food stores were selected from listings of all outlets in which wage earners reported food purchases in each city, stratified by type of store in terms of foods sold, importance of store in wage-earner purchases, and geographic location within the city. All important chain store systems are included in the sample for each city. Prices obtained from chain and independent stores are averaged separately and combined with weights based on sales volume data.
Samples of rental units were selected by probability sampling procedures, from block listings of the rental dwelling units in each city, stratified according to block density and location within the area.
For goods and services other than foods and rents, outlets are selected to include the establishments more frequently patronised by wage-earner and clerical-worker families,
18/ Adjustments ware also made to account for sales without repurchase.22
Digitized for FRASER http://fraser.stlouisfed.org/ Federal Reserve Bank of St. Louis
and which represent all inport ant typo* of nor chandi ling operations. In the newly added cities, the importance of individual stores in family laying was established by asking families where they bought the goods and serrices reported as expenditures in 1950* Stores of different types mentioned most frequently were selected after checking with local business associations.
In small cities, where mail-order buying is important, prices obtained from catalogs are included in the calculation of price change for the city. Also, for small cities, an appropriate part of price changes for commodities bought "out of town," such as furniture, is represented by the price change in large cities. Thus, the movements of prices in small cities included in the national average are based on prices from outlets in the sample cities, from mail-order catalogs, and from outlets in large marketing centers, weighted in accordance with the importance of such buying as reported in the 1950 survey.
Population Weights. City indexes are combined into the TJ.S. index by use of weights proportionate to the population of wage-earner and clerical-worker families in cities represented in the index. Each of the 12 largest urbanised areas has a weight proportionate to its own population. These 12 cities combined have about two-fifths of the total weight. The other nine large cities combined represent a class of cities having about one-fifth of the urban population and were, therefore, assigned about one-fifth of the weight. In addition to its own population, each city’s weight represents all other cities with similar classification characteristics. Similarly, the 9 medium-sise oities have about one-fifth and the 16 small cities about one-fifth of the weight. The importance of cities in the index is based on the 1950 Census of Population.So— Limitations.
T.<«lt.tlona on Ue.. The CPI is design*! to reflect price movement of a fixed quantity and quality of goods and services relating to a well-defined class of consumers. The index therefore cannot be used to measure changes in living standards or cost of living, since both are responsive to many factors other than changes in prices. Living costs may vary with changes in family size, income, tastes, and for numerous other reasons not directly related to price fluctuation.
As a measure of average price change, the CPI dees not necessarily correspond with the price experience of any one family er small group of families. Strictly speaking, the index is not applicable to families with very lev or very high Incomes, elderly couples, ingle workers, rural families, or other groups whose level or manner of living and spending differ from the average of all city-worker families. These groups may spend their Incomes differently and are therefore affected differently by price changes. On the ether hand, when the index is used to estimate price change for all city families, the limitations are not considered to be serious, since the wage-earner and clerical-family group represents such a large proportion (nearly two-thirds) of total urban population. The CPI measures only price change over time and does not measure differences in price levels between the various cities for which indexes are computed. A higher index for one city moans that prices have advanced more since the base period in this city than in others, not that prices are higher than in cities with lover indexes.Limitations of Measurement. The Consumer ftrice Index is subject to the usual limitations of statistical calculations. Certain limitations or errors are inherent in sampling procedures. Expenditures for goods and services which form the basis for index weights were obtained from interviews with about 8,000 families; price changes are based on prices of about 300 items, collected in about 1600 food stores and 4,500 other retail stores and establishments; rents are obtained from approximately 30,000 tenants. Prices are collected in a sample of 46 cities. There is also a sample of time, since information is collected only at certain periods. Because sampling is dene at various levels— cities, items, outlets— it is not possible to determine such measures of statistical reliability as the standard error of estimate for the CPI as a whole.
23
Digitized for FRASER http://fraser.stlouisfed.org/ Federal Reserve Bank of St. Louis
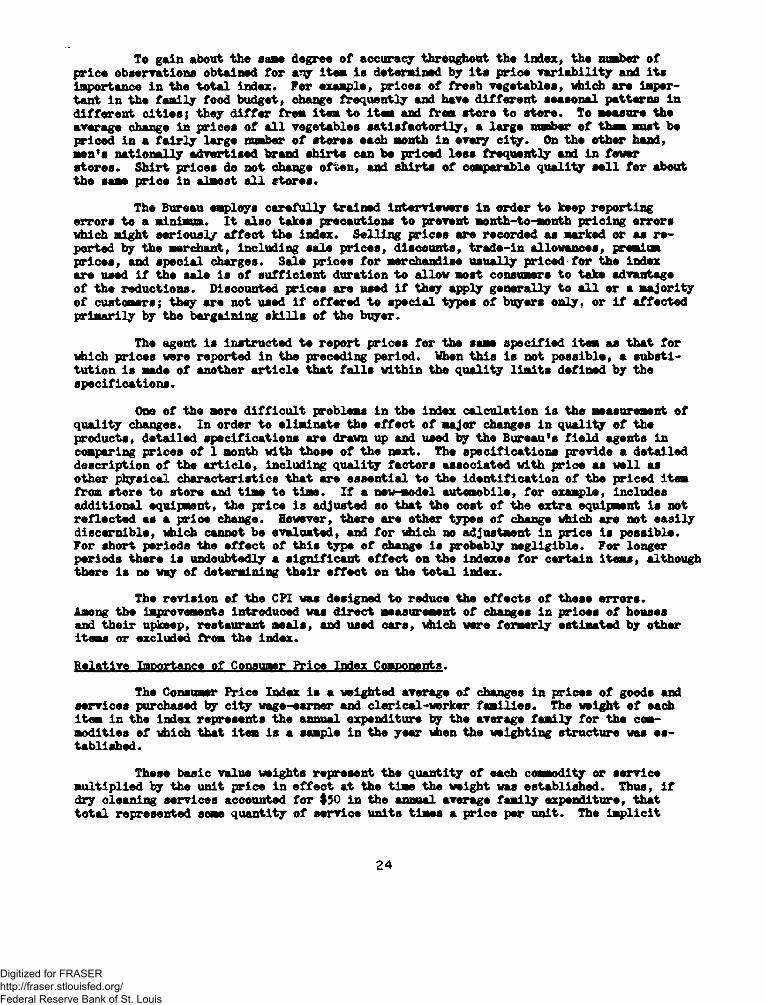
To gain about the ease degree o f accuracy throughout the in d e x, the number o f p ric e obeerrationa obtained fo r a^y item la determined by it a p ric e v a r ia b ilit y and ita Importance in the to ta l index. F o r example, pricea o f fre sh vegetablea, which are importa n t in the fa m ily food budget, change fre q u e n tly and have d iffe re n t aeaaonal patterns in d iffe re n t c it ie s ; th e y d if fe r from item to item and from sto re to sto re . To measure the average change in pricea o f a l l vegetables s a tis fa c to r ily , a la rg e number o f them must be p riced in a f a i r l y la rg e number o f stores each month in e ve ry c it y . On the other hand, men1 a n a tio n a lly a dvertised brand s h irts can be priced le ss fre q u e n tly and in fe ve r sto re s. S h irt p ric e s do not change ofte n , and s h irts o f comparable q u a lity s e ll fo r about the same p ric e in almost a l l sto re s.
The Bureau employs c a re fu lly tra in e d in te rvie w e rs in order to keep re p o rtin g e rro rs to a minimum. I t also takes precautions to prevent month-to-month p ric in g e rro rs which m ight s e rio u s ly a ffe c t the in d e x. S e llin g p rice s are recorded as marked o r as re ported by the merchant, in clu d in g sale p ric e s , discounts, tra d e -in allowances, premium p ric e s , and sp ecia l charges. Sale p ric e s fo r merchandise u s u a lly priced fo r the index are used i f the sale is o f s u ffic ie n t dura tion to a llo w most consumers to taka advantage o f the re d u ction s. Discounted p rice s are used i f th e y apply g e n e ra lly to a l l o r a m a jo rity o f customers; they are not used i f o ffe re d to sp e cia l types o f buyers o n ly, o r i f affected p rim a rily by the bargaining s k ills o f the buyer.
The agent is In stru cted to re p o rt p ric e s fo r the same sp e cifie d item as th a t fo r which p ric e s were reported in the preceding p e rio d . When th is is not p o ssib le , a su b stitu tio n is made o f another a rt ic le th a t f a lls w ith in the q u a lity lim its defined b y the s p e c ific a tio n s •
One o f the more d if f ic u lt problems in the index c a lc u la tio n is the measurement o f q u a lity changes. In order to elim inate the e ffe c t o f m ajor changes in q u a lity o f the products, d e ta ile d sp e c ific a tio n s are drawn up and used b y the Bureaufs f ie ld agents in comparing p ric e s o f 1 month w ith those o f the n ext. The sp e c ific a tio n s provide a d e ta ile d d e sc rip tio n o f the a rt ic le , in clu d in g q u a lity fa c to rs associated w ith p ric e as w e ll as other p h ysic a l c h a ra c te ristic s th a t are e sse n tia l to the id e n tific a tio n o f the p riced item from sto re to sto re and time to tim e. I f a new-model autom obile, fo r example, includes a d d itio n a l equipment, the p ric e is adjusted so th a t the cost o f the e xtra equipment is not re fle c te d as a p ric e change. However, there are other types o f change which are not e a s ily d is c e rn ib le , which cannot be evaluated, and fo r which no adjustment in p ric e is p o ssib le .F o r sh ort periods the e ffe c t o f th is type o f change is probably n e g lig ib le . F o r longer periods th e re is undoubtedly a s ig n ific a n t e ffe c t on the indexes fo r c e rta in item s, although there is no way o f determ ining th e ir e ffe c t on the to ta l index.
The re v is io n o f the CPI was designed to reduce the e ffe c ts o f these e rro rs .Among the improvements introduced was d ire c t measurement o f changes in p ric e s o f houses and th e ir upkeep, restaurant m eals, and used cars, which were fo rm e rly estim ated by other items o r excluded from the index.
R e la tive Im portanc. o f Consumer P rice index Components.
The Consumer P rice Index ia a weighted average o f changes in p rica s o f goods and se rvic e s purchased by c it y wage-earner and c le ric a l-w o rk e r fa m ilie s . The weight o f each item in the index represents the annuel expenditure by the average fa m ily fo r the comm odities o f which th a t item is a sample in the ye a r whan the w eighting stru ctu re was esta b lis h 'd .
These basic value weights represent the q u a n tity o f each commodity o r se rvic e m u ltip lie d by the u n it p ric e in e ffe c t at the tim e the weight was esta blish ed . Thus, i f d ry cleaning se rvice s accounted fo r $50 in the annuel average fa m ily expenditure, th a t to ta l represented some q u a n tity o f se rvic e u n ite tim es a p ric e per u n it. The im p lic it
24
Digitized for FRASER http://fraser.stlouisfed.org/ Federal Reserve Bank of St. Louis

quantity might involved in this aggregate remain* constant daring tho pariods batmen might revisions. 19/
The percentage relationship of the currant Talus might (implicit quantity tines price) for each item to the total of all item* is referred to as its relatiTe importance.At the tine of the introduction of new mights, the relatiTe importance of each item is equiTalent to its importance in the average f amity expenditures. With subsequent changes in prices, howerer, the importance of the various c w o dities and services nay change in relationship to one another. Thus, if food prices rise and clothing prices fall, food will increase in relative importance to clothing.
A comparison o f data in columns A, 5, and 10 o f ta b le 2 illu s tra te s the d iffe re n ce between changes in re la tiv e importance and changes in expenditures. Expenditures fo r food a c tu a lly accounted fo r a l i t t l e more than 35 percent o f the fa m ily budget in 1935*39. By 1950, p ric e s fo r food had increased re la tiv e to other o o m o d itle s and se rvic e s , and the re la tiv e importance o f food rose to n e a rly 42 percent o f the in d e x. That is , the 1935-39 q u a n titie s o f food, in 1950, m o ld have cost 42 percent o f the narket basket valued a t 19^0 p rim s . But the 1950 consumer expenditure su rvey revealed (column 10) th a t food expenditures took o n ly about 30 percent o f the budget. The explanation is , o f course, th a t fa m ily incomes had ris e n more than p ric e s and, th e re fo re , fa m ilie s had more to spend on nonfood item s. As a re s u lt, the re la tiv e expenditures fo r food were lo v e r, not h ig h e r, in 1950 than in the 1930's. Thus, changes in the re la tiv e importance o f a component re s u lt from (a) major weight re vis io n s based on comprehensive consumer expenditure su rve ys, such as th a t completed in December 1952; (b) minor w eight adjustments to take account o f changes in the l i s t o f items p ric e d , such as the discontinuance o f se ve ra l items in 1955; and (c) d iffe re n t ra te s o f p ric e change among the va rio u s item s. In the absence o f a weight re v is io n in the index, i f p ric e s o f a l l ite a s changed at the same ra te , th e ir importance in the index would not change.
I t fo llo w s then th a t, except fo r an in te rv a l fo llo w in g a weight change, current re la tiv e importance fig u re s do not n e c e ssa rily represent a d is trib u tio n o f current fa m ily expenditures. Fam ily spending patterns are affected b y many fa c to rs other than p ric e change, such as income, fa m ily s is e , and re la tiv e a v a ila b ilit y o f goods o f d iffe re n t kinds and q u a litie s , e tc . The re la tiv e importance fig u re s in d ica te how urban fa m ilie s o f wage earners and c le ric a l workers would d is trib u te th e ir expenditures i f th e y continued to bqy the sane kinds and amounts o f goods and se rvice s th a t th e y purchased when the preceding expenditure study was made (e .g . 1950 as adjusted to 1952). The re la tiv e importance fig u re s should not be used as estim ates o f current spending patterns or as in d ic a to rs o f changing consumer expenditures. These data sim ply represent the o ld market basket re p ric e d , not a now market basket.
Table 2 shows d is trib u tio n s o f fa m ily expenditures and index value weights in the o rig in a l index and a t the re v is io n dates. The 1917-19 d is trib u tio n o f expenditures is shown in column 1. Comparison o f column 2 w ith column 3, column 5 w ith column 6, and column 7 w ith column 8 shows the e ffe c t o f the va rio u s weight re vis io n s as consumer spendin g h abits changed. On the other hand, comparison o f column 1 w ith column 2, o r column 4 w ith coloan 5, o r column 6 w ith column 7, o r column 8 w ith column 9 shews the e ffe c t o f p ric e change o n ly.
12/ See p. 15 fo r dates when weights ware re vis e d .
25
Digitized for FRASER http://fraser.stlouisfed.org/ Federal Reserve Bank of St. Louis

Table 2. Fam ily Expenditures and R elative Importance o f CPI Components, Selected Periods, 1917-58(percent)
1917-19 __________________________ 1935-39___________ _______________Group Family expenditures Index value weights before Fam ily expenditures and revised
re vis io n 1/ index value weights 2/<u (2) <3)
A ll items ----------------------------- 100.0 100.0 100.0Food — —— — ————————— — - 39.3 31.1 33.9Apparel ----------------------------- 16.2 13.8 10.5Rent — — — — — — — — 14.3 16.0 18.1Fu e l, e le c tric ity , and ice 5.0 6.3 6.4Housefurnishlngs -------------- 4.6 4.7 4.2Miscellaneous — -------------- 20.6 28.1 26.9
1935-39 January 1950 December 1952 December1958 _
1950
Fam ily ex Index value Estimated Index Fam ily expenditures weights be fam ily ex value penditures Index Fam ily exand revised fore interim penditures weights and revised value pendituresindex value adjustment tj and adjusted before index value weights 2/weights "iJ index value re vis io n weights 7/ y
weights 5/ 6/(4) (5) (6) (7) (8) (9) (10)
A ll items ----------------------------- 100.0 100.0 100.0 100.0 100.0 100.0 100.0F o o d ---------------------------------- 35.4 41.6 33.3 34.5 29.6 28.7 30.3H ousing----------------------------- 33.7 27.4 25.1 25.7 12/32.5 12/32.7 25.7A p p a re l---------------------——— 11.0 12.2 12.8 11.3 9.2 8.9 11.6Transportation — - — ------ 8.2 8.0 11.4 11.4 11.3 11.7 13.2Medical c a re -------------- ------ 4.0 3.3 5.2 5.2 5.1 5.4 5.2Personal c a re -------------— - 2.4 2.5 2.4 2.4 2.0 2.2 2.3Reading and recreation — 2.9 2.9 5.8 5.4 5.3 5.3 6.1Other goods and services— 2.4 2.1 4.0 4.1 5.0 5.1 5.6
1/ Data in column 1 modified by price change to 1935-39*y Compare w ith column 2, Shove effect of introduction o f new weights based on expenditure surrey o f 1934-36, jj/ Data in column 3 regrouped in accordance with current item groupings and to exclude expenditures fo r g ifts ,
contributions, and miscellaneous services,lj Data in column 4 modified by price change to January 1950,5/ Compare with column 5* Shows effect of introduction o f new weights based on "interim adjustment”. See te xt p,14« 6/ Data in column 6 modified by price change to December 1952,7/ Compare column 7, Shows effect o f introduction o f new weights based on estimate o f fam ily expenditures in 1952,
from Consumer Expenditure Survey, 1950,8/ Data in column 8 modified by price change to December 1953,2/ Based on comprehensive expenditure survey. See te xt section Comprehensive Revision* Data in th is column used as
basis fo r estimate in column 8,10/ Includes "home purchase" not included in e a rlie r re la tive importance figures and not in column 10.
Digitized for FRASER http://fraser.stlouisfed.org/ Federal Reserve Bank of St. Louis

R e la tive iaportanoe data have two p rin c ip a l uses. They show the Importance w ith in the CPI o f the va riou s items and hence provide an in d ic a tio n o f the sig n ifica n c e which should be attached to p ric e change fo r any s p e c ific item . Secondly, the re la tiv e importance fig u re s can be used to recombine the data o f the CPI to form special index groupings. That is , the re la tiv e importance fig u re s fo r the appropri ate periods can, w ith care, be used as weights to approximate combined p ric e movements fo r any two o r more component s e rie s . 20/
C orrection Procedure fo r Published P ric e Indexes and P rices.
The Bureau's r e t a il p rice s and indexes norm ally are considered f in a l when issued. Necessary estim ates fo r m issing data are made a t the tin e o f re le a se . Subsequent corrections o f estim ates are re fle c te d in the next month's index. E ve ry e ffo rt is made to elim inate e rro rs in the computation o f the Consumer P rice Index. However, as e rro rs do a ris e , the Bureau has set up the fo llo w in g co rre c tio n procedure:
P rices o r Indexes fo r In d lvf^ «| i A c o rre c tio n o f le ss than 1.0 percent in an averagep ric e o r in an item index w i l l not be made fo r p u b lic a tio n unless the e n tire index is re calculated.
A c o rre c tio n in an average p ric e and/or in an item index o f 1.0 percent o r more w i l l be published in the next subsequent release which norm ally c a rrie s the se rie s a ffe cte d , and norm ally fo r as fa r back as the month in which the in c o rre c t data entered in to the index c a lc u la tio n .
Subgroup. Qt o u p . or All Items Indexes. A correction which would cause a change o f not more one-tenth (0.1) of an index point at any level will not be published although adjustments for the error will be made in current index calculations.
A co rre ctio n which would cause a change o f s ix-te n th s (0.6) o r more o f an index p o in t a t a U.S. subgroup o r a c it y subgroup o r group le v e l w i l l be made in published subgroup and group indexes.
A c o rre c tio n which would cause a change o f tw o-tenths (0.2) o r more o f an index p o in t in a U .S. m ajor group o r a l l item s.index o r in a ll items indexes fo r the 20 c it ie s fo r which Indexes are published w i l l be made in the index a t the group and subgroup le ve ls re gardless o f the amplitude a t the low er le v e ls . A co rre c tio n o f th is magnitude, which is extrem ely ra re , would re q u ire the consideration b y the Bureau o f the s ta t is t ic a l, economic, and other fa c to rs in vo lve d , to determine whether the p re vio u s ly published c it y o r U.S. a l l items index is to be corrected o r an adjustment made in ca lcu la tin g the current index number.
20/ A d e ta ile d d e sc rip tio n o f the method fo r doing th is was published in the a rt ic le R e la tive Importance o f Items in the C P I(in M onthly Labor Review, August 1954, PP> 891-896).
27
Digitized for FRASER http://fraser.stlouisfed.org/ Federal Reserve Bank of St. Louis
Ta b u la r SamaryPlage
1 -1 . Consumer P ric e Index— U nited S tates c it y averages R e la tive im portanceo f components, selected d a te s* .......................................... .................................... .. 29
1 -2 . Consumer P ric e Index— 20 la rg e c it ie s : R e la tive im portance o f m ajorgroups and subgroups, December 1952*.•••••••••».••»••••*•••••»»................ 32
1 -3 . A llo c a tio n o f fa m ily expenditures in the Consumer P ric e I n d e x . . . . . . .......... . 33
B -1 . Consumer P ric e Index— U nited S ta te s o it y average t Indexes o f a l l item sand selected groups o f goods and s e rvic e s , annual averages, 1913-46................... 39
B -2 . Consumer ftrioe Index— U nited S tates o it y averages Indexes o f a l l item sand m ajor groups o f goods and s e rvio e s , b y ye a r and month, 1947-58.»*............. 40
B -3 . Consumer P rio e Index— U nited S ta te s c it y average * Indexes o f fo o d , housing,a p p a re l, tra n s p o rta tio n , and th e ir subgroups, b y ye a r and month, 1947-58............ 42
B -4 . Consumer P ric e Index— U nited S tates o it y average* Indexes o f selecteditem s and groups, annual averages, 1 9 3 5 -5 8 .,,.................................... ............... 44
B-5. Consumer P rio e Index— U nited S tates o it y average* Indexes o f selecteditem s and groups, q u a rte rly , 1 9 4 7 -5 8 ............................................ ..................... 52
C—1. Consumer P ric e Index— 20 la rg e c itie s * Indexes o f a l l item s and selectedgroups o f goods and s e rvio e s , annual averages, 1 9 1 5 - 4 6 . . . . . . . . . . . . . . . . . . .......... . 68
C -2 . Consumer P ric e Index— 20 la rg e c itie s * Indexes o f a l l item s and m ajor groupso f goods and s e rvio e s , b y ye a r and month, 1 9 4 7 - 5 8 . . . . . . . . 0 . . . . . . . . . . . . . . . . . . . . . 76
C -3. Consumer P rio e Index— 20 la rg e c it ie s j Indexes o f fo o d , housing, a p p a re l,tra n s p o rta tio n , and th e ir subgroups, b y ye a r and month, 1 9 4 7 -5 8 ........•••»•••• 97
28
Digitized for FRASER http://fraser.stlouisfed.org/ Federal Reserve Bank of St. Louis

Table A-l* Consumer Price Index— united State city average: Relative importance of components, selected dates
Percent of all-items total19h7-U r January December Decemberaverage 1950 1952 1958
U2 .7 33 .3 2 9 .6 28*7
U2 .7 3 3 .3 25 .0 23 .95.8 3 .9 3 .0 3 .21 .7 .9 1 .0 .9
.9 .6 .5 .5 .- .2 .1
.2 .1 .1 ol.3 .1 .1 ol.2 (1 / ) ( 1/ ) (1/ ).1 ” .l ” .l .1
a .i 3 .0 2 .0 2.33 .U 2 .2 loh 1 .6
. .1 .2.7 .8 .5 .5
1 3 .U 1 0 .6 7 .7 7 .15 .2 3 .5 2 .3 2 .02 .0 loh .9 .8
.7 .6 .6 .51 .8 .1 .2 .2
.7 1 .1 .6 .5
.8 .3 .2 .23 .U 2 .1 2 .2 2 .U1 .5 .9 .7 .9
.9 .6 .7 .6
.8 .5 .8 .9
.2 .1 - -1 .3 .8 .2 .2- .9 .7 .7- - .3 .3
l.U 2 .0 1 .2 .71 .U • •. 2 .0 1 .2 .7
1 .3 1 .0 .6 .6.9 .7 .3 .3oh .3 .1 .1- - .2 .2
8 .3 6 .1 U.l 3 .92 .8 .9 .5 •U.7 .6 .5 .5
2.7 2 .1 1 .2 1 .21.7 1 .6 1 .3 1 .2ol .3 .3 .3» .6 .3 .3
8 .7 7 . 0 ' U.5 U.32 .8 1 .5 l.U 1 .31 .1 .7 *3 ol
.1 (1/ )- .1 ’ .1
1.0 .3 .3 .3.7 .5 .2 .2- . ol .1- - .1 .1- . .1 ( 1/ )- - .1 “ .1
U.o 3 .2 l.U 1 .3l.U .9 .5 .U
.2 .1 .1 .1
.3 .3 . 1 •1
.3 .2 s n 1 (y >.5 .3 .i .ioh .3 ol . i. 1 .6 .2 .2- - .1 .1.6 .5 .2 .2.2 m me weoh .5 •6 .7- - .2 .3.2 .3 .2 .2.2 •2 . 1 .1- - .1 .1.9 1 .3 .6 .5.2 .3 .1 .1.2 .3 .2 .1.5 .5 .2 .2- .2 .1 .1- .2 .1 .1- .1 .1 .1- . 1 <3/> (1/ )- .1 .2 .2- .1 .1 .1- - .1 .1.6 .2 .2 .2.3 .1 .1 .1.3 . 1 .1 .1
6 .5 5 .7 5 .7 5.1:- .6 .5
- - •h -- - - *3
.2 .2
Percent of all-items totall?U7-h? January [December December average 1950 1952 1958
FOOD----------------------------------
Food at hone---------------- —Cereals end bakery products— —
Cereals-— -------— -----------Flour—----------- --------- —---------Biscuit mix— — ►-------------Corn flakes— — — -------- —Rolled oats------- — ----- —Corn m e a l - - — — — — — —Rice---------------------------
Bakery products-— — — — — —
Soda crackers— ------------Vanilla cookies----- ---- ----
Meats, poultry, and fish— ------Beef................... .........
Round steak— — — — — — —Chuck r o a s t - — -----— ------Rib roast— — — — ---------Hamburger— — -— — — -------
Veal cutlets----- — ----------Pork--------------------------------------------
Pork chons— — — — ---Smoked ham-— — ------ — — —Bacon-— -— ------ — — — —Salt pork— ----- ------- -----
Lamb, leg— — ------------------Frankfurters— — — — ----- -Canned luncheon meat— ----- -Poultry— ----- ---- ----- ------
Roasting chickens— ------Frying chickens— ------ — —
Fish-----------------------------Fresh and frozen fin fish— -Canned salmon----— -------Canned tuna------ — — — -----
Dairy products— — — —— —Butter— — -— — — — — — -—Cheese, American process— Milk, fresh (delivered)— — —Milk, fresh (grocery)---------Milk, evaporated------- -------Ice cream— ---------------------
Fruits and vegetables— — -------Fresh fruits— -----— — ------
Grapefruit------------ -------
Bananas----- — -----------—
Graoes-*— — — — — -Strawberries— — — ---Watermelons— ----------------
Fresh vegetables— — — ------Potatoes— — — ----— ----Sweet potatoes— -----------Beans, green— — — — —Cabbage— — — -----------Carrots-----------------—Onions— — — — — — -Toraat oes— — -— — — •
Spinach— ----— — -------Canned fruits— — -— ---------
Orange juice— -----------— ■
Pineapple---------------------Fruit cocktail---- -— — — ■
Canned vegetables— --------—Corn— -------------------- —Peas--------------------------Tomatoes------ — ------------£ trained baby food— —
Frozen fruits-— -— -— ------Orange juice concentrate— Strawberries— — — — —
Frozen vegetables— --- -Peas-— — — ----- — — — — .Beans, green-— ---— — —
Dried fruits aid vegetables— Prunes-— — — — — — — —Beans— — — ---— — — —
Other foods at home--------------Partially prepared foods— —
Soup, vegetable-— ----------3 o j d , tomato— — — — — — —Beans with pork----- — ------
Food at hcxne— ContinuedOther foods at home— Continued
Condiments and sauces-— ------ —Sweet pickles— — — — -— -----Tomato catsup— ------------------
Nonalcoholic beverages— ------ -Coffee— — --------------------- -Tea— ----------- — -------- —Cola drinks— ----—
Fats aid oils— ------Margarine— ----------lard-Vegetable shortening---- -------Salad dressing— -----------------Tfe snut butter— — ----- ------- -
Sugar aid sweets— -------------- -Sugar— ---------------------- —Corn syrup— ------------ ------Grape jelly--------------------- -Chocolate bar— — — — ----- ----
Eggs---------------------------------Miscellaneous: Flavored gelatin
dessert— ---------------------—Food away from home: Restaurant meals
HOUSING—
Rent— — — — — ---— — ------Home purchase and upkeep— ---------
Home purchase— — --------------- -Real estate taxes— — — ------- -Mortgage interest------ -----------Property insurance— ------ -— —Repairs and maintenance— — -----
Repainting garage— -----— —Exterior house paint— — — -— -Repainting rooms— --- -----------Paint brush-— — — — ---- ----Reshingling house roof— — — —Forced air furnace— ---------Water heater— — — -— — ----Cabinet kitchen sink----------Sink faucet— ---- ------ — — —P.efinishing floors------ ------Porch flooring— — — — ----- —
Ges and electricity------ ----- ------Gas, residential heating— ----- —Gas, other than residential heatingElectricity— -----------------
Solid fuels and fuel oil— ------Anthracite— — ----- ---------—Bituminous coal— — --- — —Briquets------------------------
Range oil— — ---Wood— ----------- —Coke— ---- ----------Kerosene— — — ----------------
Housefumishings-— ------ ------------Textile housefurnishings— ---------
Sheets<Blankets— — — — — — -—Bedspre ads— ---------------------Towels— -----------— -— — — ----Table cloths— — — ----------- ----Drapery fabric— ---- — --------—Cur tain 8— — ------ — ---------—
Floor coverings— — ---------— —Broadloom, velvet— ------------- —Rugs, wool, axminster— ----------Rugs, cotton, scatter— — —Broadloom, rayon— ----- — —Rugs, felt base— -------
Furniture and bedding----- ---Living room suites— ----- —Dinette seta, wood— --------Dinette sets, chrome— -----Bedroom suites— — --------Sofa beds
Major household appliances— Radios— — — — — — —Radio p h o n o g r a p h s - - ---------—Refrigerators, electric— — — — — Cook stoves— — — — — —Washing machines, electric----- —Vacuum cleaners, electric— — — Sewing machines, electric— ----- -
Uhl.U
1„?.2oh.2.3•1
1.31*3
2.6
26*9
13.513.5
1.9
1.0.9
2.7.8
io2(1/)
.3
(1/)
.6 • 2 .1
Tl
ol1.7.7.2
•5.1.1.1
2.0,2»
.3
.3
.1
.1
2.U1.8
.6
.9
.2
.1ol.2
1.0.7
loh
.3
. 2.1
1.5l.l.1.3.9. 2.1.3.2•1.9ol.1.1.3
loh
.1lu6
25.1 32.5
11.611.6
2.1.3.7
1.11.U
ll
"ol.1
.9
.2•3
.1
i
u />
ol1.6.5.1.1»l.1.2•2
2.3«/>"o9.3.8.2.1
17.8 2/ 6 .0
11.8 6.1 1.0 1.5 .2
3.0 .1 .3 .3 .3 .3
.1
.3
. 2
.31.9.3.6
1.01.3 .3
4a / )£ 0
6~06.9• 2 .1
4.2.6.1:
•1
.31.8
.5 .1 • 2 .5 .2 .1 .2
2.3 (3/)
.9
.5
.5
.2
.2
.3
.2
.11.51.0
.1oh.9.2.1.3.2.1.9.1:.1.1.3
1.2
.1l.B
32.7
18.3 2/ 6.2
12.15.9 1.2 1.7. .2 3.1
.2
.6
.3
15.2.1.U.2.3
2.0ol.7.9
1.3.2.6
(< $
ioi.8.2.1.1*1
"o2.1.5.1.2
"ol.1
1.6.5.1.2ol.2
"ot1.9(3/)
"06ol.5.2.2
See footnotes at end o f ta b le .
29
Digitized for FRASER http://fraser.stlouisfed.org/ Federal Reserve Bank of St. Louis

Table A -l. Consumer Price Index—United State city average: Relative importance of components, selected dates—Continued
HOUSING— Continued-
Small household appliances:Toasters, electric-—------------
H<xise wares--— --------------------------Dinners are, 53-piece set-------Saucepans, aluminum— ————Brooms— --------------------------- — ~
Miscellaneous—--------------------------Napkins, naoer—--------— -------Toilet tissue— --------------- —Electric light bulbs— —-------
Household ODeratian----------------Laundry soap and detergents—Dry cleaning— ----------------------Laundry service—-------------------Automatic laundry service—Domestic services—— ------ ——Telephone service— —— -------Water-— --------------------------- —Postage— ----------—-------------—Toilet tissue-------------------------Ic e -------------------------——----------
APPAREL—
Men's and bays' apoarel— ------ —Men's aprcrel— — ■— — -------
Overcoats-— ------------- -----— —
Jackets--------— —— ----------------Sweaters— — ------ —— —-----------Suits, heavyweight wool— — Suits, heavyweight wool—Suits, ray or.— — — ------ —Suits, cotton— - —— ------Slacks, wool— ---------------------Slacks, rayon— —— — — —Trousers, work— ------------------Overalls— — --------------—-------Dungarees—— ------------------------Shirts, work—-------- ----------------Gloves, work— ——— — -----Shirts, snort— — ——— ——Shirts, business— ——— ——
Undershirts ———------ --------------Union suits— — —— — —Pajamas— — ----------- --------------Socks, cotton— — ---------— —Socks, rayon— ------------ — —Socks, nylon stretch—-----------Hats, fe lt -------------------------------
Bays' apparel— -----— ------------Overcoats— ------ -— — — —Suits, wool— — — — -Jackets— — — — ---------—Slacks— ------------------------------Mackinaws— . . . . . . -------- .---Dungarees-—--------------------Shirts----------- — - — ----------------Shorts— — ■---------- — «
Women’ s and girls* apparel-----------Women's apparel— -------- -------- -----
Coats, heavyweight wool-— Coats, heavyweight wool-— -Coats, fur— —— ------------—Suits, wool— — — — —Suits, rayon—-------------- -— -Dresses, wool— -------- -------Dr ess es, rayon— — -------Dresses, cotton, street—Rousedresses— — —-------- -------Skirts, wool—-------------- —------Skirts, rayon— —— - — —- Blouses, manmade ----------——Blouses, cotton-
Shorts, cotton, sport— — — Slips, rayon and nylon— — -Panties, rayon— — -------------Girdles— — — — — —Brassieres— — -------------Nightgowns -----------------------------Stockings, nylon— —— — —Gloves—— —— —— — —Handbags— — ——------ ---------
Percent of all-items total
19U7-U9 January December Decemberaverage 1950 19$ 2 1958
.1 ©2 .1.1 oh .5 ©5.1 o2 ,2 .2. .2 • 2 •3
<*/> (V ) .1 -— ©3 ©3
. • (1 /) (1 /)a n cy> .2 " .2
• *» •1 oliuO U.3 ho9 5.U
.9 .7 •6 7
% 1.2.7
l l ’lo8
_ .1 ol.2 1©1 .6 •6.6 •7 1.1 lol.2 o2 .3 oh.1 .1 o2 .3.»4 .3 (6 /) (6/>•6 *2 ~ .l
12.6 12©8 ___ 9»2_ 8*9
UoU 3*7 2.9 2.8U .l 3o2 2.5 2.5
.3 • 2 - -ol •1 .2 ©3.1 ,1 .1 .2.1 ol ,1 ol
1*6 1,1 oh ©5ol .1
. ©1 ol ol(1 /)"o l ol ~ol
ol (i/>.1 I l ©2 ” .2<>3 •1 ©1 -* • * .1•1 ol •1 .1
©1 (1 /) (1 /)• “ .1 ” . l•6 .2 .2.1 *1*1 •1 •2 •2•1 (2 /) -.1 ol .1 •1.1 •1 •1 ©1ol •1 .1
ol .1 ©1©3 •5 •U •3
a n - - -.1 ol ol ©1
.1 a n
( I /)I iol
a n <y>
•1 *i .1
(V ) (in©1
(1 /)U.6 5.3 H©i 7 .9lio2 li©9 3oh 3.2
•6 •6 ©5 .5.3 .3 • ? .2©1 oh .1 ol©3 •6 •3 .3. . ,1 olol ©1 •1 .1©7 ,6 oh Ji•3 ©2 ©2 ©2oil ol ol .1
(1 /) a n -. — .1 .1- .2 •1 •1
- - ©1.1 m
. - (1 /) .
o3 .3 •2 .2.1 ©1 .1 ol•1 oh .1 •1. m •1 -.1 ol .1 •1•7 .8 oU ©u©1 a a / ) -
»i
A PBAREL—Continued
Girls' a p p a r e l - Coats— — Drosses, cotton- Skirts, wool—— Swe aters—-------- -Slips— -----------------------------------
Anklsts— — — ---------------Footwear— — —------ --------------------------
Shoes— --------------------------------------Men's sboes, street—------------- —Men's shoes, work— -----------------Men's rubbers, dress— -------- -----Women's shoes, street-— --------Women's shoes, play-— -------- —Children' s shoes, oxford— ——
Shoe repairs------ ---------------------------Other apparel—--------------------------------
Diapers— -------------------------------Yard goods—----------------------------------
Cotton— —------—----------------------Rayon— ------------------------------------
Miscellaneous if ------------------------ —Apparel services? Dry cleaning—
TRANSPORTATION------------------------------------
Private— —------ ----------------------------------Automobiles, new—----------— -----------Automobiles, used--------------------------Auto repairs— --------------- —--------Tires— ------------------------------------- —Gasoline—*— — — — — —Motor o il---------- -----Auto insurance— — — — — —Auto registration— — — -----------
Public-------------------------------------------------Transit fares— — ---------------------Railroad fares— ----------- -----------
MEDICAL CARE---------------------------------------
Medical care services-------- --------------General p ra ctition er— ------ —
Office v is it— ——------ ---------Home v is it -------------------—-----------Obstetrical care— --------------- — ■
Surgeon: Appendectomy----------- ------Tonsillectomy— ——-------------------
Dentist— --------------------------------F illin g---------------------------------------Extraction— ------------- —
Optometrie examination andeyeglasses— —-----------------------— ■
Hospital services— --------------—Men's pay ward— -----------------------Semiprivate room— — ----------------Private room— ------------------------
Group hospitalization— — —-------Accident and health insurance-----
Prescriptions and drugs— ------------Prescriptions, narcotic «id
nonnarcotic------- -------------------------Penicillin tablets— — ----------Multiple vitamin concentrates—
Milk of magnesia— — -----------------Tinctur-j of iodine—------------——
PERSONAL CARE------------------------------------Men's haircuts— --------- ---------- —Permanent waves— ------------- —Shampoos and wave sets—------ ---------Toilet soap-------------------------- —Cleansing tissues— ---------------— - —Toothpaste— -----— —------ —---------—Shnnpoo-— — — — — — — —Shaving cream— — --------------------Hone permanent r e f i l l - --------------------Face powder— ----------------------------------Face cream— ------------------ ----- -----------Razor blades-------------------------------------Sanitary napkins— — --------------------
Percent of all-item s total
19U7- U9 January December Decemberaverage 1950 195? 1958
oh . 7 .7ol .2 .2 .2.3 •1 •1 . 1
. .1 .1. ©1 ol
(1/ )an .1 .1
an "o l .1 .17 . 0 2 .2 1 ,U 1 ,52 .7 1 .8 1 .3 1 .3
*9 .5 .3 .3ol ©l .1 .2
(1/ ) (1/ ) .1 -" o9 " , 5 oh .3
©2 ©1 ©2Tq .5 .3 03o3 oh .1 c.2o2 .5 ©8 o l
©2.3
©2ol
ol.1
.1 .2 ©1 .1ol .1 (i / )
©5an"©5
i l l a n
7ol lloJl l lo 3 11 .7
U.8 7 .9 1 0 .0 10ol2 oh 3 .7 2 .9 3 .1
. 2 .0 1 .7©2 .7 1 .1 1©2.1 .2 .3 ©3
l ©5 2 .1 2 .2 2.3©2 •2 .2 ©2.3 o l 1 .0 1 .0©1 ©3 •3 .3
2 .3 3 .5 1 .3 1 .62 .2 2 .8 1 .0 1 .3
©1 o7_ .3 .3
3 .3 5 .2 5 .1 5 .U
2 .9 hoh a .2 li.51 .1 1©3 1©6 1 .6
.6 .6 .7 o l<' .U .5 .7 o l
.1 ©2 • 2 .2•1 •1 .2 .2©1 ©3 o3 .1o? 1 .2 .8 .8©5 .9 .6 .6©2 .3 .2 ©2
ol ©2 .3 .3•6 .5 .2 .3.2 ©2 ©1 ©1oh .3 ©1 .1
.1. 1 ,0 1 .0 1 .2©2 . . -oh ©8 ©9 c9
©2 oh .3 •3. m .1 .1• • . 2 •2
(V ) ol ©2 . 2“ •1 ©2 .1 .1
ol .1 -
2 o5 2 ©!t 2 .0 2©2
1©0 ©7 .6 o l•2 .2 .1 o l©3 .3 ©2 ©2©l! •3 .2 o2. . .1 ol.3 •3 ©2 .2. . .1 ©1
•1 ol- Q/> ( V ) ol.1 .3 ©1 ©1. - .1 ©1©1 .1 .1 .1©1 ©2 .1 ©1
See footnotes at end of table.
3 0
Digitized for FRASER http://fraser.stlouisfed.org/ Federal Reserve Bank of St. Louis
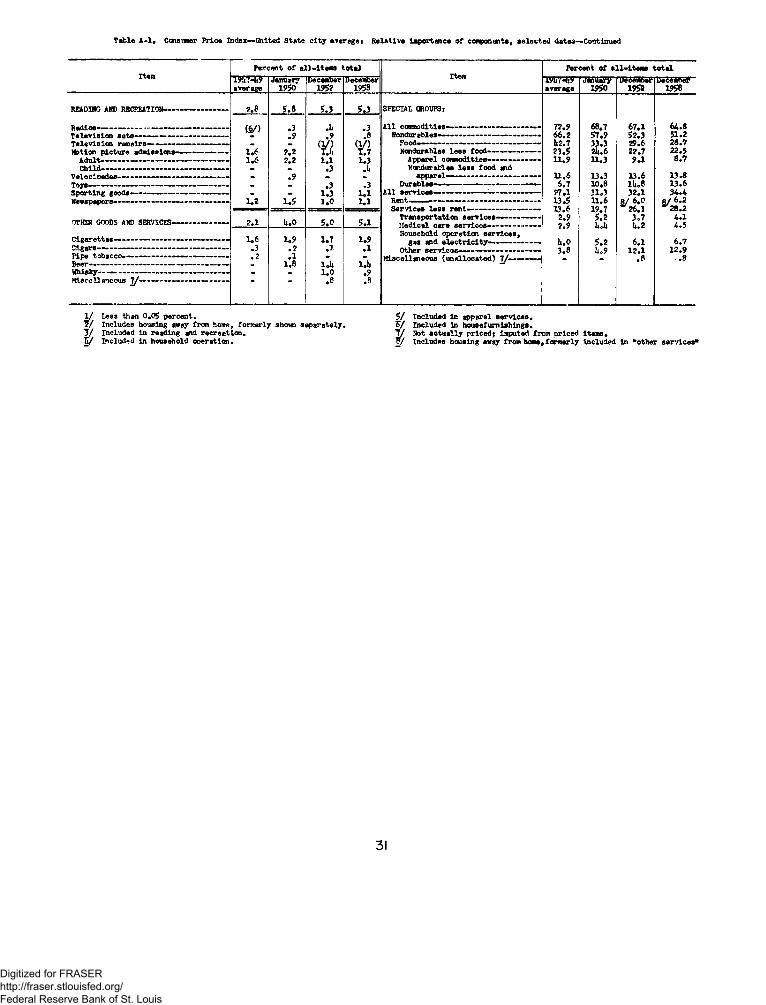
Table A -l . Consumer Price Index— Uhited State city average* Relative Importance of components, selected dates—Continued
ItemPercent of all-items total
ItemPercent of all-items total
j.9U7- u9^average
January1950
December1952
December1958
19U7 - U9average
January1950
December195a
December1958
READING AND RECREATION--------------------------- 2 .8 5 .8 5 .3 5 .3 .. SPECIAL CROUPS:
Radios---------------------- -------------------------------- (£ /) .3 .3 A ll commodities— — — — —— — 7 2 .9 68 .7 6 7 .1 64.8Television sets—— — — — — —------ .9 .9 .8 Nondurables— — — ——— — —— 6 6 .2 5 7 .9 5 2 .3 51 .2Television repairs— —— *— — ----------- . (V ) (1/ ) Food------- ------------------------------------------ U2 .7 33 .3 29 .6 2 8 .7Notion picture admissions— — ------------- 1 .6 2 .2 i .u T.7 Nondurables less food—— — — — 2 3 .5 2U.6 22 .7 22 .5
Adult----------------- — ------------------------- . . . 1 .6 2 .2 1 .1 1 .3 Apparel commodities— — — — 1 1 .9 11 .3 9 .1 8 .7Child----------------------------------------------------- . w3 .U Nordurafcles less food
Velocipedes— - — — — — - ——— — . .9 apparel— --------------------- -------------- 11 .6 13 .3 13 .6 1 3 .8Toys— . .3 .3 Durables— — — — — —— — 6 .7 10 .8 1U.8 1 3 .6
1 .3 1 .1 A H flotrlcfliO—* ------------------- -------r -------------- 27.1 3 1 .3 3 2 .1 3 4 .4d pH /T v in ^ J O O u o * * * * w» ,»*,* * * * * * * » w -'*w» « * *1 .2 1 A 1.3 1 3 .5 1 1 .6 a / 6 -0 f t / 6 .2l ie ws papers—— ——— ———————— — ———— — — Ip l* 8 / ° . v 2 / Z.Services less rent—-*—*— —— —— 1 3 .6 19 .7 26 .1 28 .2
Transportation services— ---------------- 2 .9 5 .2 3 .7 4 .1OTHER GOODS AND SERVICES------------------------- 2 .1 U.O 5.0 5.1 Medical care services-— —*— — — 2 .9 U.U U.2 4 .5Household operation services,
Cigarettes— ------------------------------------------- — 106 1 .9 1 .7 1 .9 gas and electricity— — — — — U.O 5 .2 6 .1 6 .7Cigars---------------------------------------------------------- •3 . 2 .1 .1 Other services— — — — — — — 3 .8 U.9 1 2 .1 1 2 .9Pipe tobacco— ------------------------------------- —Beer—-------------- ------------------- — — —
o 2 .11 .8 1 .U 1 .U
Miscellaneous (unallocated) 7/ - — ------- .8 .8
lilhislcy— — ---------------- -------------------------- - * 1 .0 .9Miscellaneous 7/ — ------ -------- —-------------- .8 . 8
1 / Less than 0.0£ percent.7 / Includes housing away from home, formerly shown separately. 3 / Included in reading and recreation.It/ Included in household ooeration.
5/ Included in apparel services.? / Included In housefumishlngs.7 / Mot actually priced; imputed from priced items.F / Includes housing away from home, formerly included in "other services*
31
Digitized for FRASER http://fraser.stlouisfed.org/ Federal Reserve Bank of St. Louis
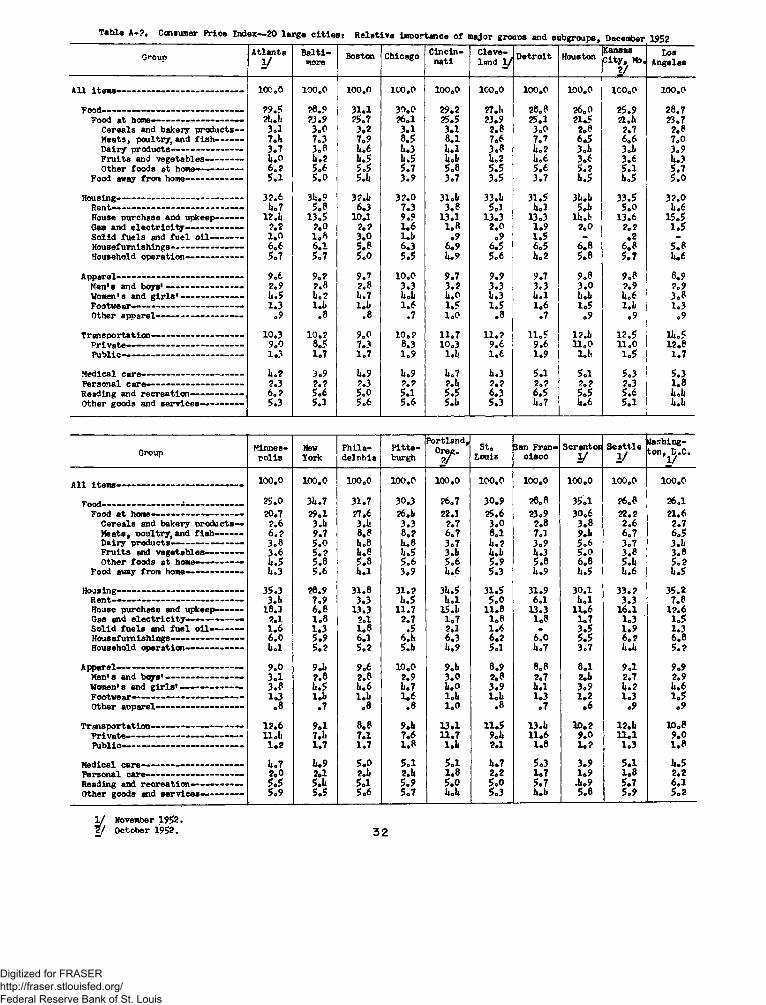
Table A-?, Consumer Price Index—20 large c it ie s : Relative Importance of major groups and subgroups, December 1952
Group Atlanta1 /
Baltimore Boston Chicago Cincin
natiCleveland 1 / Detroit Houston Kansas
City, Mo. 2 /
LosAngeles
All items—---- ------------------------ — 100 o0 100.0 100.0 1CO.O 100.0 ICO.O 100.0 100.0 ICO.O 100.0
Food— — —— — ------- ------ ?9.S 28.9 31.1 30.0 29.2 27.U 28.8 26.0 25.9 28.7Food at home----- ------- — ------— 2U.U 23.9 25.7 2 6 .1 25.5 23.9 25.1 21.5 21. U 23.7
Cereals and bakery products— 3.3 3.0 3.2 3.1 3.1 2.8 3.0 2.8 2.7 2.8Meats, poultry, and f is h - -— - 7 . h 7.3 7.9 8.5 8.1 7.6 7.7 6.5 6.6 7.0Dairy products— ------—------- - 3o7 3.8 U.6 U.3 U.l 3.8 U.2 3.U 3.U 3.9Fruits and vegetables—— —- 1».0 U.2 U.5 U.5 UoU U.2 U.6 3.6 3.6 U.3Other foods st home--------------- 6.2 5.6 5.5 5.7 5.8 5.5 5.6 5.2 5.1 5.7
Food away from home— ------- 5.1 5.0 5.U 3.9 3.7 3.5 3.7 U.5 U.5 5.0Housing—--------- ---------------- 3?.6 3l».? 3?.li 32.0 31 ©U 33.U 31.5 3U.U 33.5 32.0
Rent—--------------------------- U.7 5.8 6.3 7.3 3.8 5.3 U.3 5.U 5.0 U.6House purchase and upkeep—— 12.U 13.5 10.1 9.9 13.3 13.3 13.3 1U.U 13.6 15.5Gas and e le ctr ic ity —----------- - ?o2 2.0 2.2 1.6 1.8 2.0 1.9 2.0 2.2 1.5Solid fuels and fuel o i l—— — 1.0 1.8 3.0 1.U .9 .9 1.5 - .2 -Housefumishings— — --------------- 6.6 6.1 5.8 6.3 6.9 6.5 6.5 6.8 6.8 5.8Household operation-——------— 5.7 5.7 5.0 5.5 U.9 5.6 U.2 5.8 5.7 U.6
Apparel------------------- — ---- - 9.6 9.2 9.7 10.0 9.7 9.9 9.7 9.8 9.8 8.9Men's and boys' — ---------- — — - 2.9 2.8 2.8 3.3 3.2 3.3 3.3 3.0 2.9 2.9Women's and g ir ls ' -------—— — U.5 U.2 U.7 U.U U.0 U.3 U.l U.U U.6 3.8Footwear— —--------------------- — 1.3 1.U 1.U 1.6 1.5 1.5 1.6 1.5 1.U 1.3Other apparel——-------—-------— o9 .8 .8 .7 1.0 .8 .7 .9 .9 .9
Transportation—--------------------— 10*3 10.2 9.0 10.2 11.7 11.2 11.5 12.U 12.5 1U.5Private— —— —---------------- 9.0 8.5 7.3 8.3 10.3 9.6 9.6 11.0 11.0 12.8Public--------------------------------------- 1.3 1.7 1.7 1.9 l.U 1.6 1.9 1.U 1.5 1.7
Medical care------------------------------ - U.2 3.9 U.9 U.9 U.7 U.3 5.1 5.1 5.3 5.3Personal care— —— —------------ - 2.3 2.2 2.3 2.2 2.U 2.2 2.2 2.2 2.3 1.8Reading and recreation— -------—- 6*2 5.6 5.0 5.1 5.5 6.3 6.5 5.5 5.6 U.UOther goods and services—------- — 5.3 5.3 5.6 5.6 5.U 5.3 U.7 U.6 5.1 U.U
Group Minneap o l is
NewYork
P h ila d e lp h ia
P it t s burgh
P ortland ,Oreg.
2/S t .
LouisSan Fran
c i s c oScranton
2 /S e * t t le
1/
1 o
u
A ll item s------------------------------------------------- 100.0 100.0 100.0 100.0 100.0 100.0 100.0 100.0 100.0 100.0
Food-------------------------------i---------------------- 25.0 3U.7 31.7 30.3 26.7 30.9 2 8 .8 35.1 26.8 26.1Food a t home— — — — — — — 20.7 29.1 27.6 26.L 22.1 25.6 23.9 30.6 22.? 21.6
C ereals and bakery p rod u cts— 2.6 3.U 3.U 3.3 2.7 3.0 2.8 3.8 2.6 2.7M eats, p ou ltry , and f i s h — 6.? 9.7 8.8 8.2 6.7 8.1 7.3 9.U 6.7 6.5D airy p ro d u c ts --------------------------- 3.8 5.0 U.8 U.8 3.7 U.2 3.9 5.6 3.7 3.UF ru its and veg etab les— ---------- 3.6 5.2 u.8 U.5 3.U U.U U.3 5.0 3.8 3.8Other food s at home— — — U.5 5.8 5.8 5.6 5.6 5.9 5.8 6.8 5.U 5.2
Food away from home— — --------- U.3 5.6 U .l 3.9 U.6 5.3 U.9 U.5 U.6 U.5Housing— — ---------------- -------------------- 35.3 28.9 31.8 31.2 3U.5 31.5 31.9 30.1 33.2 35.2
R ent— — ------------------ — ----------- 3.U 7.9 3.3 U.5 U .l 5.0 6.1 U .l 3.3 7.8House purchase and upkeep— — — 18.3 6.8 13.3 11.7 15.U 11.8 13.3 11.6 16.1 12.6Gas and e l e c t r i c i t y — -----------— — 2.1 1.8 2.1 2.7 1.7 1.8 1.8 1.7 1.3 1.5S o lid fu e ls and fu e l o i l - -------— 1.6 1.3 1.8 .5 2.3 1.6 . 3.5 1.9 1.3Housefurn ish in g s— ------------— — 6.0 5.9 6.3 6.it 6.3 6.2 6.0 5.5 6.2 6.8Household op era tion — — — — — — U .l 5.2 5.2 5.U U.9 5.1 U.7 3.7 U.U 5.2
A p p a re l-— --------------------- ---------------- — 9.0 9.U 9.6 10.0 9.U 8.9 8.8 8.1 9.1 9.9Men's and b o y s '— — — — - — ------- 3.1 2.8 2.8 2.9 3.0 2.8 2.7 2.U 2.7 2.9Women's and g i r l s '— — — 3.8 U.5 U.6 U.7 U.o 3.9 U.1 3.9 U.2 U.6Footwear— — — — — — — 1.3 1.U l.U 1.6 1.U 1.U 1.3 1.2 1.3 1.5Other apparel— ---------— — .8 .7 .8 .8 1.0 .8 .7 .6 .9 .9
T ra n sp orta tion --------------— -----------— 12.6 9.1 8.8 9.U 13.1 11.5 13.U 10.2 12.U 10.8P riv a te— --------------------— — — 11 .U 7.U 7.1 7.6 11.7 9.U 11.6 9.0 11.1 9.0P u b lic ----------------------------------------------- 1.2 1.7 1.7 1.8 1.U 2.1 1.8 1.2 1.3 1.8
M edical ca re— — -----------------— — — U.7 U.9 5.0 5.1 5.1 U.7 5.3 3.9 5.1 U.5P ersonal care— — — ---------------— — 2.0 2.1 2.U 2.U 1.8 2.2 1.7 1.9 1.8 2.2Reading and r e c re a t io n — — — 5.5 5.U 5.1 5.9 5.0 5.0 5.7 .U.9 5.7 6.1Other goods and s e r v ic e s — — 5.9 5.5 5.6 5.7 U.U 5.3 U.U 5.8 5.9 5.2
1 / November 1952 7 / October 1952. 3 2
Digitized for FRASER http://fraser.stlouisfed.org/ Federal Reserve Bank of St. Louis
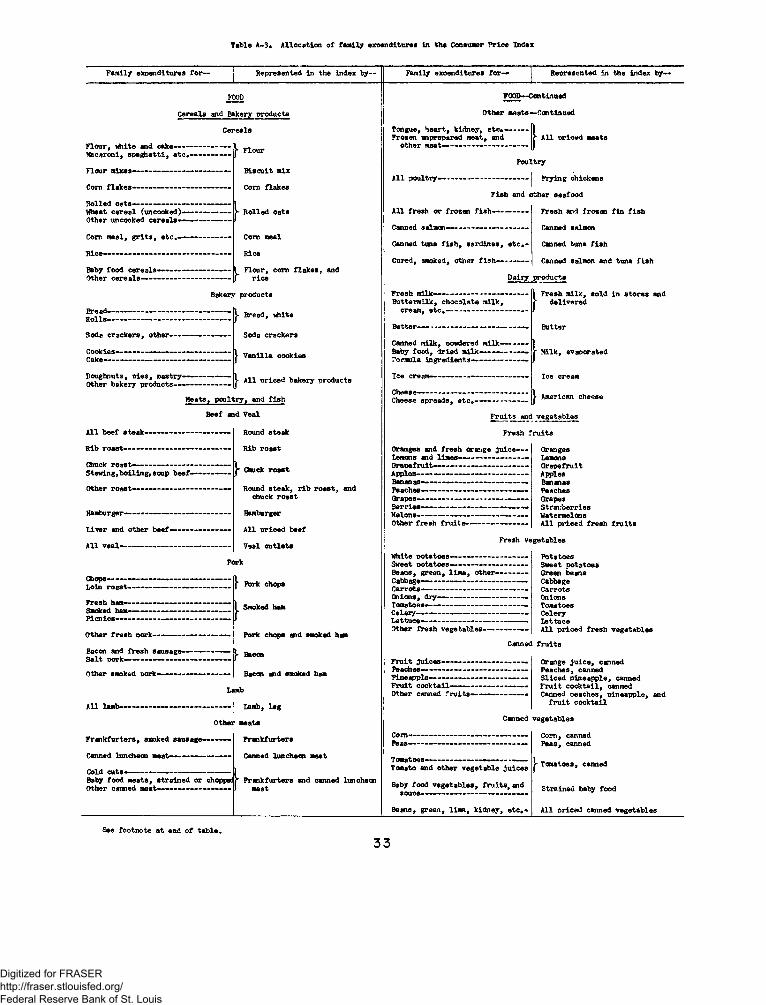
Table A-3* Allocation of family expenditures in the Consumer Price Index
Family expenditures for— Represented in the index by— Family expenditures for— Represented in the index by—
FOOD
Cereals aid Bakery products
Cereals
Flour, white aid cake— ------------Macaroni, spaghetti, etc .----------
Flour mixes-----
Corn flakes—
Rolled oats—----------- -—- —------- ------Wheat cereal (uncooked)—-----------------Other uncooked cereals—— - —---------
Corn meal, grits, etc.-
Rice— — -------------— —
Baby food cereals— --------Other cereals—------------------
Flour
Biscuit mix
Com flakes
Rolled oats
Com meal
Rice
i Flour, com flakes, and rice
Bread-Rolls-
Bakery products
- l. Bread, vhite
Soda crackers, other— — — -------- Soda crackers
“IIIIIIIIIIIIIIIIIII j- Vanilla cookiesCookies— Cake— —
*u *— x product.
Meats, poultry, and fish
Beef and Veal
All beef steak-
Rib roast------- -
Chuck roast—----------------------Stewing,boiling, soup beef—
Other roast— —------------------
Hamburger-—------------------
Liver and other beef—
All veal-------------------------
Chops-— — ------- —------------Loin roast— — —----------
Smoked ham- Picnics——
Other fresh pork—
Bacon and fresh sausage— Salt pork— -----------------------
Other smoked pork— ------------- -------------
Round 8teak
Rib roast
- Chuck roast
Round steak, rib roast, and chuck roast
Hamburger
All priced beef
Veal cutlets
Pork chops
Smoked ham
Pork chops and smoked ham
Bacon
All lamb-------
Bacon and smoked ham
Lamb
----- -| Lamb, leg
Other meats
Frankfurters, smoked sausage—------ -
Canned luncheon meat— — — —
Baby food meats, strained or choppedi Frankfurters and canned luncheonOther canned meat——------
Frankfurters
Canned luncheon meat
meat
FOOD—Continued
Other meats—Continued
Tongue, heart, kidney, etc® — — | Frozen unprepared meat, and L
other meat— — — — — - —---------All priced meats
All poultry-
Poultry
--------- — — | Frying chickens
Fish and other seafood
All fresh or frozen fish— -----------
Canned salmon— — —— —— — —-
Canned tuna fish , sardines, e tc ,-
Cured, smoked, other fish— ----------
Fresh and frozen fin fish
Canned salmon
Canned tuna fish
Canned salmon and tuna fish
Dairy products
Fresh milk— ----------- ---------- -----Buttermilk, chocolate milk,
cream, e tc ,------— --------------
B utter-
Canned milk, powdered i Baby food, dried milk* Formula ingredients-
Ice cream— -
Cheese------- ------------------------Cheese spreads, etcQ---------
Fresh milk, sold in stores and delivered
sred milk— —— jailk— —-------- — r Milk, evaporatedfcs----------------J
Ice cream
American cheese
Fruits and vegetables
Fresh fruits
Oranges and fresh orange J u i c e -Lemons and limes--------------------------- -Grapefruit— ---------------— —— -------Apples-------------------------------------------Bananas— — —— —— — — — —Peaches----------- -------——— — — —Grapes------------------------------------- --------Berries---------- —Melons---------— —— — ------- -------------Other fresh fruits------—------------ —
OrangesLemonsGrapefruitApplesBananasPeachesGrapesStrawberriesWatermelonsAll priced fresh fruits
Fresh vegetables
White potatoes— ------ -----------Sweet potatoes— —------------Beans, green, lima, other-Cabbage— - — --------------------Carrots--------------------------------Onions, dry— — -------- -------Tomatoes— — -----------------Celery-------— — -----------------Lettuce—— ----------- — ---------Otter fresh vegetables-------
PotatoesSweet potatoesGreen beansCabbageCarrotsOnionsTomatoesCeleryLettuceAll priced fresh vegetables
Canned fruits
Fruit juices— —— ------Peaches— ----------------------Pineapple---------------------Fruit cocktail— — -----Otter canned fruits-—
Orange juice, canned Peaches, canned Sliced pineepple, canned Fruit cocktail, canned Canned peaches, pineapple, and
fruit cocktail
Com-— — — Peas---------------
Canned vegetables
Com, canned Peas, canned
Tomatoes— ------------------—----— —Tomato and other vegetable juices
Baby food vegetables, fruits, and soups— — — -----------———
Beans, green, lima, kidney, etc0-
Tomatoes, canned
Strained baby food
All priced canned vegetables
See footnote at end of table.
33
Digitized for FRASER http://fraser.stlouisfed.org/ Federal Reserve Bank of St. Louis
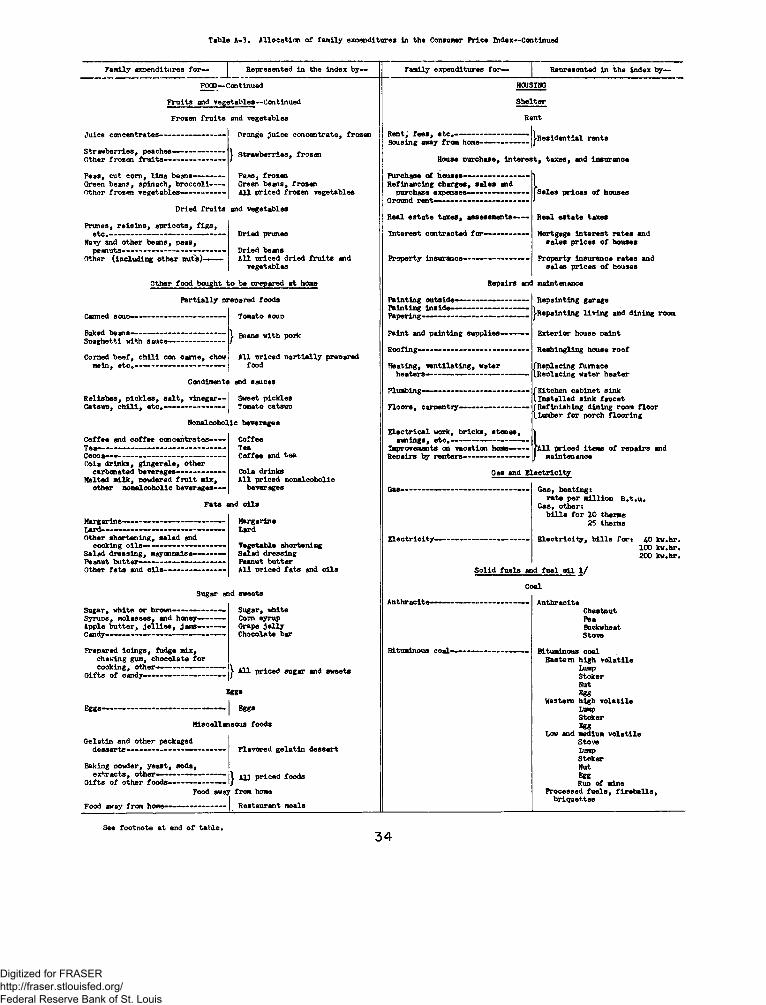
Table A-3. Allocation of family expenditures in the Consumer Price Index—Continued
Family expenditures for— Represented in the index by-
FOOD—Continued
Fruits and vegetables—Continued
Frozen fruits and vegetables
Juice concentrates—
Strawberries, peaches------Other frozen fru its— ---------
Peas, cut corn, lima beans— --------Green beans, spinach, broccoli— Other frozen vegetables— -------------
Orange Juice concentrate, frozen
| Strawberries, frozen
Peas, frozenGreen beans, frozenAll priced frozen vegetables
Dried fruits and vegetables
Prunes, raisins, apricots, fig s ,etc.— — --------------------------------------
Navy and other beans, peas,peanuts— -------------------------------- —
Other (including other nuts)—
Dried prunes
Dried beansAll priced dried fruits and
vegetables
Other food bought to be prepared at home
Partially prepared foods
Canned soup— -
Baked beans—-------------Spaghetti with sauce—
Corned beef, ch ili can came, chow mein, etc„— —--- —— ------------ —
Tomato soup
| Bean8 with pork
HI priced partially prepared food
Condiments and sauces
Relishes, pickles, sa lt , vinegar— Sweet pickles Catsup, c h ili , e tc .------ — - — --------- Tomato catsup
Nonalcoholic beverages
Coffee and coffee concentrates-—-Tea— —— -----------------------------------—Cocoa— --------------------------------------------Cola drinks, gingerale, other
carbonated beverages— -----------—Malted milk, powdered fruit mix,
other nonalcoholic beverages—
CoffeeTeaCoffee and tea
Cola drinksA ll priced nonalcoholic
beverages
Fats and oils
Margarine— — — — — —Lard— — — —— — —Other shortening, salad and
cooking o ils— — --------- -----———Salad dressing, mayonnaise---------—Peanut butter— ------------- —— — —Other fats and oils--------------------------
MargarineLard
Vegetable shortening Salad dressing Peanut butter A ll priced fats and oils
Sugar and sweets
Sugar, white or brown------- ---------—Syrups, molasses, and honey-----------Apple butter, Jellies, Jams----------C andy— — — —— ----------- --------
Prepared icings, fudge mix, chewing gum, chocolate forcooking, other— — ------—-----—
Gifts of candy— ----------------- —
Sugar, white Com syrup Grape Jelly Chocolate bar
| All priced sugar and sweets
Eggs------------
Egg«
----------------- 1 Eggs
Miscellaneous foods
Gelatin and other packaged desserts— — ----------— Flavored gelatin dessert
Baking powder, yeast, soda,extracts, other— ------------------------- jl m priced foods
Gifts of other foods— ----------- — —-1 /Food away from home
Restaurant mealsFood away from home-
Family expenditures for— Represented In the index by—
HOUSING
Shelter
Rent, fees, e tc .— ----------- ---------Housing away from home— --------—
Rent
[-Residential rents
House purchase, Interest, taxes, and insurance
Purchase of houses— — - —--------Refinancing charges, sales mad
purchase expenses---------------------Ground rent— — ------ ------------------
Real estate taxes, assessments—
Interest contracted for— ----------—
Property insurance-——
Sales prices of houses
Real estate taxes
Mortgage interest rates and sales prices of houses
Property Insurance rates and sales prices of houses
Repairs and maintenance
Painting outside— Painting I n s i d e - Papering——
Paint and painting supplies------------
Roofing—-------- -------------------—------------
Heating, ventilating, waterheaters— —------------------ -----------—
Plumbing— — —----------— — —— f Kitchen cabinet sinklInstalled sink faucet
Floors, carpentry— -----------------
Electrical work, bricks, stones,awnings, etc0------ —------------------—
Improvements on vacation home— —- Repairs by renters-—-------------—-----
Repainting garage j-Repainting living and dining room
Exterior house paint
Reshingling house roof
{Replacing furnace Replacing water heater
f Refinishing dining room floor \Lumber for porch flooring
'All priced items of repairs and maintenance
Gas and Electricity
E le c tr ic ity -
Gas, heating:rate per million B .t.u .
Gas, other: b ills for 10 theme
25 therms
Electricity, b ills for: 4-0 kw.hr. 100 kw.hr. 200 kv.hr.
Anthracite-
Solid fuels and fuel oil 1 /
Coal
Anthracite
Bituminous coal—
ChestnutPeaBuckwheatStove
Bituminous coalEastern high volatile
Lump Stoker Nut Egg
Western high volatile Lump Stoker Egg
Low and medium volatile Stove Lump Stoker Nut EggRun of mine
Processed fuels, fireballs, briquettes
See footnote at end of table. 34
Digitized for FRASER http://fraser.stlouisfed.org/ Federal Reserve Bank of St. Louis
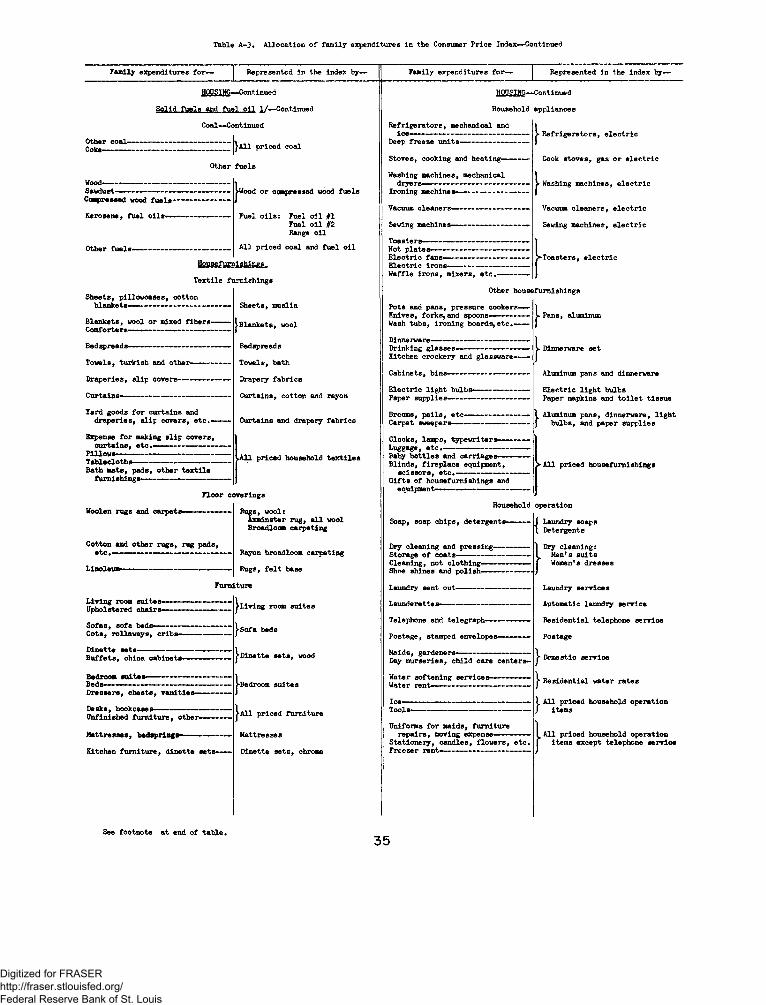
Table A-3. Allocation of family expenditures in the Consumer Price Index—-Continued
Family expenditures fo r - Represented in the index by— Family expenditures for— Represented in the index by—
HODSING—Continued
§9U<L£BSlg, fgd, fttgl.ojj, 1 /— Continued
Coal—Continued
Other coal— Coke—— - — = 1*|}A11 priced coal
Other fuels
Wood- Savdust-Ccmpressed wood fu els-----------------------
Kerosene, fuel o ils— ---------------------
jw<food or compressed wood fuels
Fuel o ils : Fuel o il #1Fuel o il #2 Range oil
All priced coal and fuel o il
Housefurnishings
Textile fumiehings
Sheets, pillowcases, cotton blankets— ------------------------
Blankets, wool or mixed fibers— Comforters— ---------- ——------
Bedspreads----------------------------
Towels, turkish and other—
Draperies, slip covers-------
Curtains------------------------------
lard goods for curtains and draperies, slip covers, e tc .—
Expense for making slip covers,curtains, e tc .--------- ------------ —
PillowsTablecloths-Bath mats, pads, other textile
furni shings— — ——----------- —
Sheets, muslin
|Blankets, wool
Bedspreads
Towels, bath
Drapery fabrics
Curtains, cotton and rayon
Curtains and drapery fabrics
-All priced household textiles
Floor coverings
Woolen rugs and carpets—
Cotton and other rugs, rug pads, e t c .-
Rugs, wool:Axminster rug, a ll wool Broadloam carpeting
Rayon broadloom carpeting
Rugs, fe lt base
Living room suites— Upholstered chairs—
Sofas, sofa beds— -----Cots, rollaways, cribs-
Dinette sets—Buffets, china cabinets—
Bedroom su itesBeds——— -----
Furniture
j-Living room suites
" | Sofa beds
fDinette sets, wood
Dressers, chests, vanities—
Desks, bookcases-Unfinished furniture, other-
Mattresses, bedsprings-------
Kitchen furniture, dinette
►Bedroom suites
►All priced furniture
Mattresses
Dinette sets, chrome
HOUSING— Continued
Household appliances
Refrigerators, mechanical and ic e -
Deep freeze units—
Stoves, cooking and heating—
Washing machines, mechanical dryers—
Ironing machines—
Vacuum cleaners—
Sewing machln
Toasters—Hot plates—Electric fans- Electric irons—
- Refrigerators, electric
Cook stoves, gas or electric
► Washing machines, electric
Vacuum cleaners, electric
Sewing machines, electric
>Toasters, electric
Waffle irons, mixers, e tc .— —
Other housefurnishings
Pots and pans, pressure cookers—Knives, forks, and spoons— ---------Wash tubs, ironing boards,etc.—
Dinnerware— -----------------------------------Drinking glasses-------------------------•—Kitchen crockery and glassware------
Cabinets, bins----------------------------------
Electric light bulbs------------------------Paper supplies-------- -------------------- -----
Brooms, pails, etc------------------------- -Carpet sweepers-
Clocks, lamps, typewriters- Luggage, etc.-Baby bottles and carriages— Blinds, fireplace equipment,
scissors, e tc .-----—----------------Gifts of housefurnishings and
equipment—— - —— ---------------
- Pans, aluminum
■ Dinnerware set
Aluminum pans and dinnerware
Electric light bulbsPaper napkins and toilet tissue
, Aluminum pans, dinnerware, light bulbs, and paper supplies
>All priced housefurnishings
Household operation
Soap, soap chips, detergents—
Dry cleaning and pressing- storage of coats—Cleaning, not clothing— —Shoe shines and polish— ----------------
Laundry sent out---------------------
Launderettes----------------------------
}Telephone and telegraph—
Postage, stamped envelopes—
Maids, gardeners—Day nurseries, child care centers-
Water softening services Water rent------------------------
Uniforms for maids, furniture repairs, moving expense-
stationery, candles, flowers, etc. Freezer rent------ ------------------------------
Laundry soaps Detergents
Dry cleaning: Men's suits Women's dresses
Laundry services
Automatic laundry service
Residential telephone service
Postage
- Domestic service
• Residential water rates
. All priced household operation items
All priced household operation items except telephone service
See footnote at end of table35
Digitized for FRASER http://fraser.stlouisfed.org/ Federal Reserve Bank of St. Louis

Table A-3» Allocation of family expenditures in the Consumer Price Index—Con tinued
Family expenditures for— Represented in the index by— Family expenditures for— Represented in the index by--
Overcosts, topcoats— —
Jackets, snow suits— — Raincoats— — —— ———
Hen’ s apparel
Topcoats
Sweaters-—
Suits, wool — ^Suits, heavySport coats— — — —— ------------- -------J
Suits, light wool----------—- —Suits, cotton— — — — — —Suits, rayon— —— —— -------
Slack suits---------------Slacks, rayon— —- —
Trousers and slacks, wool-— --------—
Trousers and slacks, cotton— ——Short pants, e t c ,-— —------------- —Trousers, work— — — ----- — — ---------Special work clothing——------— ------
Dungarees and other overalls—
Shirts, work, cotton— — — --------—
Gloves and mittens, work— — — —
Uniforms--------------------------------— ----------
Shorts, sun suit s— ----------Sport shirts, woven--------
Shirts, business and dress— — ------
Undershorts, woven— -------------------- —
Shirts, sport, knit— --------------------Union suits, undershirts— -----------Undershorts, knit, and a ll other
underwear— — — ----------------------
Pajamas and nightshirts----------Bathrobes, lounging robes——
Hosiery, cotton— — — ------------ —Hosiery, rayon, nylon and other—
Hats, fe lt----- --------------------------- ----------Straw hats, handkerchiefs, caps Dress gloves, t ie s , belts, etc .— —Other men* s aooarel— —----------------—Gifts of aooarel— -------- --------------------
'Jackets
Sweaters
} Suits, light wool Suits, rayon
| Slacks, raycn
Slacks, wool
j-Trousers, work
Dungarees
Shirts, work
Gloves, work
All priced work clothing
Sport shirts
Shirts, business
Shorts, broadcloth
Uhdershirts, knit
•Pajamas
Socks, cotton Socks, nylon
All priced men's apparel
Boys* apparel
Suits, wool, cotton and rayon— Coats-Slack suits, sport coats, slacks
and trousers, wool— —--------------- -
Slacks and trousers, cotton, rayon and other— — — — ---------------------
Jack ets, leather, wool, and other—
Other outer apparel——
Shirts, sport and business, woven— j
Pajamas and robes, nightshirts— — J
Dungarees, coveralls, uniforms—Work trousers, bib overalls----------Shirts, cotton, work— —— — — —Gloves, work— — - — ---------------------Shorts, sunsuits—--------------- ----------
Undershorts, undershirts—
Sweaters-----------— ----------------
Slacks, rayon
| Jackets
Suits, slacks, and jackets
.Suits, wool
•Shirts, sport, woven
•Dungarees
Uhdershorts
Sweaters, men's
Socks, cotton— ——
Socks, rayon and Other-
Caps, helmets, hats, gloves-— ——Jewelry and watches— ----------— — —Handkerchiefs, t ie s , belts,
other apparel—---------------— — —Gifts of apparel— ——— - —--------
APPAREL— Continued
Boys* apoarel— Continued
Socks, men's, cotton
Socks, men's, nylon
A ll priced boys' apparel
Women's apparel
Coats, heavy wool, plain and fur-trimmed—
Snovaults, leggings, ski pants—
Coats, lightweight wool— -------- ------
Coats, fur — —— — --------------------Felt hat 8—------------------------------------—
|Coats, wool, plain
Coats, lightweight wool
lCoats, muskrat
Suits, wool —-------------------
Suits, raycnj raincoats -
Suits, other------------—-----
Dresses, wool— ------------
Dresses, cotton— ------ -—
Dresses, rayon— — — ——
Dresses, house, cotton— Aprons, smocks— —— —
Skirts, jumpers (except wool)— — Slacks and slack suits— — —
Blouses and shirts——
Sweaters— -----------------
Shorts and wool skirts-----------------------
Slips and petticoats, nylon--------—Other s lips, petticoats— -----------------Panties, briefs— --------------------------------Girdles, corsets, garter belts— —
Nightgowns, rayon or nylon— — —Other nightgowns— --------- --------------- —Pajamas--------------------------------------------------
Housecoats, robes, negligees— — Brassieres— — — --------------------------— -
Stockings— — - — ------------------ -
Anklets— ----- ---------------------— - — —
Gloves— ---------------------------------------------- -Handbags, nurses— — — ---------------- —Hats, other than fe lt -----------------------Handkerchiefs, belts, ribbons,
etc*— — -------------------------------------------Head scarfs, nets, umbrellas, etc.Other apparel— ——-------------- ---------Gifts of apparel----------------------------------
Suits, wool
Suits, rayon
Wool and rayon suits
Dresses, wool
Dresses, cotton, street
Dresses, rayon
| Housedresse8
| S k irts , rayon
f Blouses, rayon \ Blouses, cotton
Coats, suits, and jackets
Dresses, skirts, and blouses
Slips, nylon tricot Slips, raycn Panties, rayon Girdles
•Nightgowns, rayon
| All priced underwear and nightwear
Stockings, nylon
Anklets, g ir ls '
A ll priced women's apparel
Girls' apparel
Coats, snowsuits— ------------- —Leggings, jackets, su its---------Raincoats— ---------------------------------Felt hats— — —--------------------------
Dresses, wool, cotton, street- Formal-Cotton, house— — --------------
Other, street— »----------- .-------Uniforms, special work clothing- Straw hats------------------------------------
luresses, cotton
See footnote at end of table
Digitized for FRASER http://fraser.stlouisfed.org/ Federal Reserve Bank of St. Louis

Table A-3 , Allocation of family expenditures in the Consumer Price Index— Continued
Family expenditures for— Represented in the index by— Family expenditures for— Represented in the index by—
Skirts, Jumpers--------
Sveaters— — ------—
Girls' apparel—Continued
Skirts, wool
Blouses, shirts— — —--------------------Shorts , play stilt s — —-------------- —Slacks, slack suits—------------------------
Nightgowns, s lip s, petticoats— ——®aj amas---— ---------- ---- —Girdles, garter belts, brassieres—Housecoats, robes— —------ --------------- -Panties, briefs, bloomers--------------- -
Stock ings— Anklets—
Head scarfs, gloves----------------------- -Handbags, handkerchiefs, umbrellas,
and other accessories------- ------- —Jewelry, watches— ----------------------- -Other apparel------------------------------------Gifts of apparel------- --------------------- -
Sweaters, cardigan, orlon
Lskirts and sweaters
j.Anklets, cotton
"All priced girls' apparel
Other apparel
Infants' apparel—--------------Infants' Jewelry— ------ ------Gifts of infants' apparel-
Yard goodst Cotton---------------Rayon— --------------Wool and other—
Gifts of other apparel —---------------Pins, needles, thread, zippers--------Yam, dyeing, e t c ----------- -------------- -Dressmaker, tailor, watch repairs,
etc*— — — -------------- -—Jewelry, adults'— ------------------ -— -
PercaleAcetate taffeta All priced yard goods
All priced apparel
Footwear
Oxfords, women'sOxfords and tie s , women's— -
Pumps, sandals and straps, women's- Pumps, women's
Play shoes, women'sLoafers, non-leather shoes— - — House slippers and other leather
shoes, women's------- -------------------
Shoes, men's street or business— House slippers, men's— ————
Workshoes, men's—Workshoes, sandals, sneakers, boys'
Oxfords, pumps, loafers, and otherleather shoes, girls' ------------------
Nonleather shoes, girls'(includlnghouse slippers)—----------------------
Street shoes, house slippers, boys' ---------------- --------------------- —
Rubbers, arctics, boots, women's-— Sandsls, sneakers, rubbers, men's< Rubbers, arctics, boots, girls'
and boys' — ------ --------------------------
Shoe upkeep-
street shoes, men's
Workshoes, men's
^■Children's shoes
.A ll priced shoes
Shoe repairs:Half soles and heels, men's Heel l i f t s , women's
TRANSPORTATION
Auto purchase---------------Motorcycles, bicycles—
Automobiles, New: ChevroletFordPlymouth
Automobiles, used:3 - , U-, and 5-year old Chevrolet, Ford,and Plymouth
TRANSPORTATION—Continued
Repairs, lubrication, battery——
Tires and recaps— Tubes— ----------------
Gasoline— ------ -----------------------------
Motor Oil-------------------------------------------
Insurance-—--------------------------------- —
Registration, licenses— -------------
Local public transportation— ——
Railroad fares, planes, buses, etc0 —--------------------------------------------
Taxi, carpool, rent of car,parking fees, other- -------- —
Gifts................................ - ................ ........
Automobile repairs:Brake relining Chassis lubrication Front-end suspension Motor tune-up
^Tires
rsoline:Regular
Premium
Motor o i l , regular or premium
(Automobile insurance:J Public lia b ility , bodily injury | and property damage
t Comprehensive
Registration fees
Streetcar and bus fares
Railroad coach fpres
All priced items of transportation
All priced items of transportation except auto ourchase
MEDICAL CAFiE
Physicians' and surgeons' fee?:
In hospital— ----------------------------
Dental care—
'General practitioner: Obstetrical case
Appendectomy .Tonsillectomy 'General practitioner:
Office visit House v isit
Dentist:Filling
I Extraction
Oculist, optometrist— —-----------
Nurse, chiropractor, other-—--------
Hospital care— ------ -— — ----- —
Group hospitalisation— Group medical c are----------
Prescriptions, drugs, appliances, and supplies-------------------------------
Optometrist:Eyeglasses, complete, Including
examination
Physicians', surgeons', dentists' and optometrists' fees
Hospital rates:Men's pay ward Semiprivate room Private room
^ Group hospitalisation
' Prescription:Capsule, non-narcotic Liquid, narcotic Penicillin
Multiple vitamin concentrates Aspirin
_ Milk of magnesia
All priced medical care items except group hospitalisation
PERSONAL CARE
Men's haircuts and shaves-----— —Permanent waves— ------ ------- ——Other waves and shampoos--------- ------Manicures and other personal care
services— - — - —- —— — ————
Toilet sospelean 8 in g tissues— ---------—Toothpaste, mouthwash, etc* Shaving soap, shampoo, etc.
Men's haircutsPermanent waveShampoo and wave setBarber and beauty shop services
Toilet soap Cleansing tissues ToothpasteShampoo and shaving cream
See footnote at end of table
Digitized for FRASER http://fraser.stlouisfed.org/ Federal Reserve Bank of St. Louis

Table A-3* Allocation of family expenditures in the Consumer Price Index—Continued
Family expenditures for— Represented in the index by— Family expenditures for— Represented in the index by—
PERSONAL CARE—Continued
Supplies for home permanents— ------
Cosmetics, deodorants, lotions—
Home permanent wave r e f i l l iFace powder [Face cream
Razor blades, f i le s , combs, brushes, e tc .—— - —----------
Sanitary supplies, other-
Razor blades
Sanitary napkins
READING AND RECREATION
Radios, Phonographs, andcombination sets— ---------------------- -
Other musical instruments, e tc .-—
Television sets— — — ——----------Radio-television combination sets-
Radio-television, etc. repairs— -
Gifts of musical and broadcasting equipment---------— —-------------- —
Movies----- — --------- --------------- — _— —Other admissions— ——— —— ——Children's allowances— — --------
Children's toys-Other recreational equipment
and supplies------- — --------------
►Radios, table model
^Television sets
Television repairs
Radios and television sets
Motion picture admissionst Adult Child
Toys
Sporting goods
All priced items of recreation
READING AND RECREATION— Continued
G ifts, other recreation and reading------- — -------------- -—
Education—
All priced items of reading mid recreation except radios and television sets
A ll priced items of reading and recreation
OTHER GOODS AND SERVICES
Cigars— — ----------------------- — . . . .
Pipe tobacco— - -----------------------—Other supplies——— — — —Gifts of tobacco—— — — — —
Jaii
Beer at home—
Liquor at hone-
Wine at home, other alcoholic beverages away from home—— —
Gifts of alcoholic beverages—
Normortgage interest, bank service charges, funerals, legal expenses, expenses for real estate not used for family, expenses for raising own fo o d -
priced tobacco products
Beer
Vhisky
[All priced alcoholic beverages
All priced items in the total index
Reading*
’Newspapers:Daily, street Sunday, street Daily,delivered Sunday,delivered
k Weekly
1 / Because of considerable variation between cities and regions in the type of fuel used, this diagram shows a ll items of fuel priced. However, in general, allocations were made as follows: (a) Unpriced heating fuels were allocated to priced heating fuels*cooking fuels were allocated to priced cooking fuels.
as being (b) unpriced
38
Digitized for FRASER http://fraser.stlouisfed.org/ Federal Reserve Bank of St. Louis

Table B-l. Consumer Price Index— United States city average: Indexes of all items and selected groups of goods and services, annual averages, 1913-1(6
(19l*7-l*9“100)
Year A l l item s Food Rent ApparelHouse*.
fu rn ish in g s
1913------------ 1*2.3 39.6 76.6 36.2 31.21912*----------- 1*2.9 10.5 76.6 36.5 32.01915----------- U3.JU ItO.O 77.2 37.3 33.51916----------- 1*6.6 i*5.o 78.1 1)0.9 37.it1917----------- 51*. 8 57.9 77.lt 1*9.2 1*3.6
1918----------- 62*.3 66.5 78.8 66.6 56.11919----------- 71*.0 7it.2 85.3 88.2 70.71920----------- 85.7 83.6 100.2 105.1 86.81921----------- 76.lt 63.5 115.1 80.9 73.01922------------ 71.6 59.it 118.5 65.7 61.9
1923------------ 72.9 6 l.lt ia .6 65.8 66.51921*----------- 73.1 60.8 125.9 65.3 65.lt192$----------- 75.0 65.8 126.lt 61t.O 61t.O1926------------ 75.6 68.0 125.2 63.0 62.61927----------- 7lt.2 65.5 123.2 61.8 61.1
1928----------- 73.3 6U.8 120.3 60.9 59.61929----------- 73.3 65.6 117.lt 60.3 58.91930------------ 71.lt 62.lt lllt .2 58.9 57.lt1931----------- 65.0 51.lt 108.2 53.6 51.71932----------- 58.lt 1(2.8 97.1 1*7.5 1*5.01933------------ 55.3 10..6 83.6 115.9 ltlt.lt1931*----------- 57.2 lt6.lt 78.1* 50.2 1*8.91935------------ 58.7 1:9.7 78.2 50.6 50.01936------------ 59.3 50.1 80.1 51.0 50.81937----------- 6 l.lt 52.1 83.8 53.7 55.0
1938— ——- — 60.3 lt8.lt 86.5 53.lt 51t.51939------------ 59.lt 1(7.1 86.6 52.5 53.lt192*0------------ 59.9 lt7.8 86.9 53.2 53.0192*1----------- 62.9 52.2 88.lt 55.6 56.6192*2----------- 69.7 61.3 90.lt 61t.9 6li.lt
192*3----------- 7lt.O 68.3 90.3 67.8 66.2192*1*----------- 75.2 67.lt 90.6 72.6 71.9191*5----------- 76.9 68.9 90.9 76.3 76.9192*6----------- 83.lt 79.0 91.lt 83.7 83.9
39
Digitized for FRASER http://fraser.stlouisfed.org/ Federal Reserve Bank of St. Louis
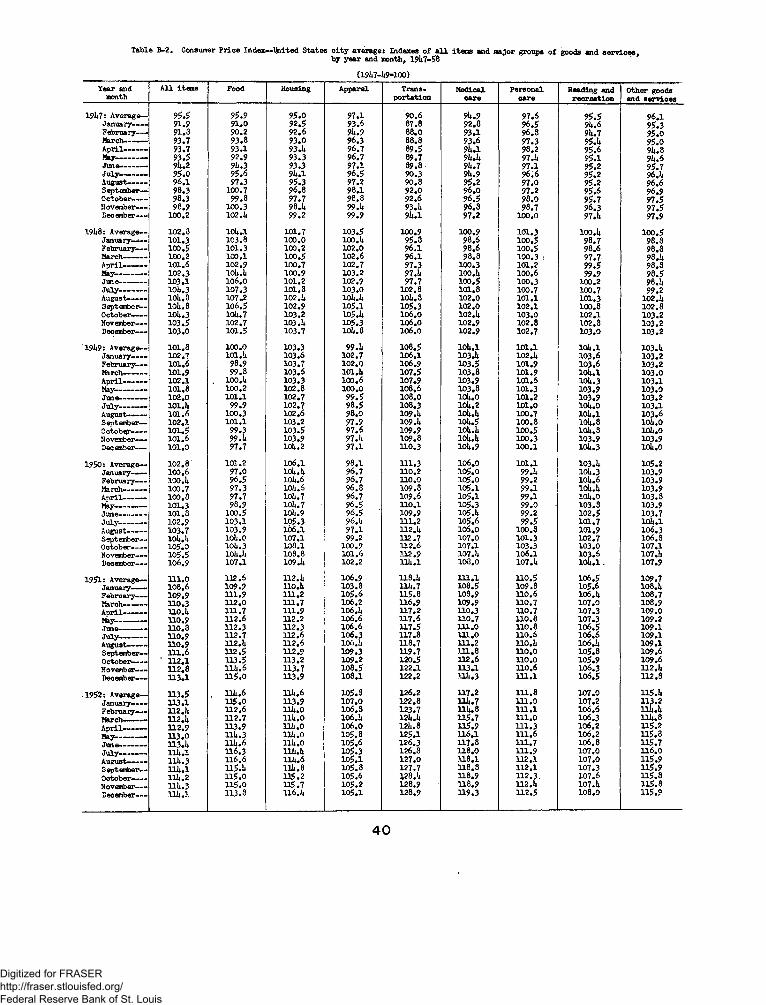
Table B-2. Consumer Price Index— United States c ity average* Indexes of a l l items and major groups of goods and services,by year and month, 191*7-58
(191*7-1*9-100)
Year and month
A ll items Food Housing Apparel Transportation
Medicalcare
Personalcare
Heading and recreation
Other goods and services
19l*7: Average— 95.5 95.9 95.0 97.1 90.6 9U.9 97.6 95.5 96.1January------ 91.9 91.0 92.5 93.6 37.8 92.8 96.5 9U.6 95.3February—- 91.3 90.2 92.6 9i*.9 88*0 93.1 96.8 9l*.7 95.0March---------- 93.7 93.3 93.0 96.3 88.8 93.6 97.3 95.1* 95.0April---------- 93.7 93.1 93.1* 96.7 89.5 9l*.l 98.2 95.6 9U.3May------------- 93.5 92.9 93.3 96.7 89.7 9l*.l* 97.1* 95.1 9i*.6June-— ----- 9l*.2 9U.3 93.3 97.1 89.8 9l*.7 97.1 95.2 95.7July----------- 95.0 95.6 91* .1 96.5 90.3 9i*.9 96.6 95.2 96.1*August------- 96.1 97.3 95.3 97.2 90.8 95.2 97.0 95.2 96.6September— 98.3 100.7 96.8 98.1 92.0 96.0 97.2 95.6 96.9October— - 98.3 99.8 97.7 98.8 92.6 96.5 98.0 95.7 97.5November— 98.9 100.3 98.1* 99.1* 93.1* 9 6 .8 98.7 96.3 97.5December— 100.2 102.1* 99.2 99.9 9l*.l 97.2 100.0 97.1* 97.9
191*8: Average— 102.8 10l*.l 101.7 103.5 100.9 100.9 101.3 100.1* 1 0 0 .5January-— 101.3 103.8 100.0 100.1* 95.3 98.6 100.5 98.7 98.8February—- 100.5 101.3 100.2 102.0 96.1 98.6 100.5 98.6 98.8March------- - 100.2 100.1 100.5 102.6 96.1 98.3 100.3 > 97.7 98.1*April---------- 101.6 102.9 100.7 102.7 97.3 100.3 101.2 99.5 98.3May------------- 102.3 10l*.l* 100.9 103.2 97.U 100.1* 100.6 99.9 98.5June----------- 103.1 10 6 .0 101.2 102.9 97.7 100.5 100.3 100.2 98.1*July----------- 10l*.3 107.3 101.8 103.0 102.8 101.8 100.7 100.7 99.2August-----— 101*. 8 107-2 102.1* iol*.l* 10l*.8 102.0 101.1 101.3 102.1*September— 10U.3 106.5 102.9 105.1 105.3 102.0 102.1 100.8 102.8October— 10i*.3 10i*.7 103.2 105.1* 10 6 .0 102.1* 103.0 102.1 103.2November— - 103.5 102.7 103.1* 105.3 10 6 .0 102.9 102.8 102.8 103.2December— 103.0 101.5 103.7 10l*.8 10 6 .0 102.9 102.7 103.0 103.2
19i*9: Average— 101.8 100.0 103.3 99.1* 108.5 10U.1 101.1 10i*.l 103.1*January— 102.7 101.1* 103.6 102.7 1 0 6 .1 103J* 102.1* 103.6 103.2February— 101.6 9 8 .9 103.7 102.0 106.9 103.5 101.9 103.6 103.2March---------- 101.9 99.3 103.6 101.1* 107.5 103.8 101.9 10l*.l 103.0April---------- 102.1 . 100.1* 103.3 100.6 107.9 103.9 101.6 10U.3 103.1May-----—— 101.8 100.2 102.8 100.0 108.6 103.8 101.3 103.9 103.0June——— 102.0 101.1 102.7 99.5 108.0 10l*.0 101.2 103.9 103.2July— ------ 101.1* 99.9 102.7 98.5 108.3 10l*.2 101.0 10l*.0 103.1August-------- 101.6 100.3 102.6 98.0 109.1* 10l*.l* 100.7 10l*.l 103.6S eptember—— 102.1 101.1 103.2 97.9 109.1* ioi*.5 100.8 10U.8 10 U.0October—— 101.5 99.3 103.5 97.6 109.9 10l*.l* 100.5 10l*.S 10l*.0November----- 101.6 99.1* 103.9 97.1* 109.8 iol*.l* 100.3 103.9 103.9December— 101.0 97.7 10l*.2 97.1 110.3 10l*.9 100.1 10l*.3 10l*.0
1950: Average— 102.8' 101.2 1 0 6 .1 98.1 111.3 10 6 .0 101.1 103.1* 105.2January— 100.6 97.0 iol*.i* 96.7 110.2 10 5 .0 99.1* 10l*.3 103.9February— 100.1* 96.5 loi*.6 96.7 110.0 10 5 .0 99.2 10U.6 103.9March--------- 100.7 97.3 101*. 6 96.8 109.3 1 0 5 .1 99.1 10l*.l* 103.9Anril---------- 100.8 97.7 10i*.7 96.7 109.6 1 0 5 .1 99.1 10 U.0 103.3May------------ 101.3 98.9 10l*.7 96.5 110.1 105.3 99.0 10 3 .3 103.9June------- 101.3 100.5 10l*.9 96.5 109.9 105.1* 99.2 1 0 2 .5 103.7July----------- 102.9 103.1 105.3 96.1* 111.2 105.6 99.5 1 0 1 .7 10 U. 1August-— — 103.7 103.9 1 0 6 .1 97.1 112.1* 10 6 .0 100.8 1 0 1 .9 106.3September— 10 U.U 10l*.0 107.1 99.2 112.7 10 7 .0 101.3 1 0 2 .7 10 6 .8October----- 10 5 .0 101*.3 1 0 8 .1 100.9 112.6 1 0 7 .1 103.3 103.0 107.1November----- 105.5 10l*.l* 108.8 101.6 112.9 1 0 7 .U 1 0 6 .1 103.6 107.UDecember— 10 6 .9 107.1 109.1* 102.2 m * .i 108.0 107.1* 10U.1 . 107.9
1951* Average— m . o 112.6 112.1* 106.9 118.1* 111.1 1 1 0 .5 1 0 6 .5 109.7January— — 108.6 109.9 1 1 0 . 1* 103.8 111*.7 108.5 109.8 10 5 .6 108.1*February— 1 0 9 .9 111.9 111.2 105.6 115.8 10 8 .9 110.6 10 6 J4 108.7March------ 1 1 0 .3 112.0 111.7 106.2 116.9 109.9 110.7 107.0 108.9April---------- 110.1* 111.7 111.9 106.1* 117.2 110.3 110.7 1 0 7 .3 109.0May------------- u.0.9 112.6 112.2 10 6 .6 117.6 110.7 110.8 107.3 109.2June----------- 110.8 112.3 112.3 10 6 .6 117.5 111.0 110.8 106.5 109.1July— —----- 110.9 112.7 112.6 106.3 117.3 m . o 110.6 1 0 6 .6 109.1August-------- 110.9 112.1* 112.6 106.1* 118.7 111.2 110.1* 10 6 . 1* 109.1September— 111.6 112.5 112.9 109.3 119.7 U 1 .8 110.0 105.8 109.6October------ ‘ 112.1 U 3 .5 113.2 109.2 120.5 112.6 110.0 10 5 .9 109.6November— 112.8 ill*. 6 113.7 108.5 122.1 113.1 110.6 10 6 .3 112.1*December— 113.1 115.0 113.9 108.1 122.2 Hi*.3 1 U .1 1 0 6 .5 112.8
.1952: Average— U.3.5 111* .6 1H*.6 105.8 126.2 117.2 111.8 107.0 115.1*January— U 3 .1 135.0 113.9 107.0 122.8 H1*.7 111.0 107.2 113.2February— - 112.1* 112.6 iu*.o 10 6 .8 123.7 111*. 8 m . i 10 6 .6 lll*.l*March— 112.1* 112.7 lli*.0 10 6 . 1* 12U.U 115.7 1 1 1 .0 106.3 ni*.8April------- - 112.9 113.9 nt*.o 10 6 .0 121*. 8 1 1 5 .9 1 1 1 . 3 10 6 .2 1 1 5 .2
May------------- 113.0 111*.3 lli*.0 105.8 125.1 116.1 1 1 1 .6 106.2 115.3June----------- 113.1* lll*.6 lll*.o 105.6 126.3 117.8 1 1 1 . 7 10 6 .8 1 1 5 .7July-——— 11U.1 116.3 HU.U 105.3 12 6 .8 118.0 1 1 1 .9 107.0 1 1 6 .0August—----- 111*. 3 116.6 llh .6 105.1 127.0 118.1 1 1 2 . 1 107.0 1 1 5 .9September— ll2*.l 115.1* 111*.8 105.3 127.7 118.3 1 1 2 . 1 107.3 1 1 5 .9October-— 111*.2 115.0 115.2 105.6 128.1* 118.9 1 1 2 . 3 . 107.6 1 1 5 .8November--- 11U.3 115.0 115.7 105.2 128.9 118.9 112.1* 107.1* 115.8December-— m.i 113.3 116.1* 1 0 5 .1 128.9 119.3 112.5 108.0 115.9
40
Digitized for FRASER http://fraser.stlouisfed.org/ Federal Reserve Bank of St. Louis

Table B-2. Consumer Price Index— United States city average: Indexes of a ll items and major groups of goods and services,by year and month, 19U7-58— Continued
(19U7-U9-100)Tear and month
A ll items Food Housing Apparel Transportation
Medical care \
Personalcare
Reading and recreation
Other goods and services
1953 s Average— liU.U 112.8 H 7.7 10U.8 129.7 121.3 H 2.8 108.0 H8.2January------ 113.9 H 3.1 116.U 10U.6 129.3 H9.U 112.U 107.8 115.9February— 113. U 1H . 5 H 6.6 10U.6 129.1 H 9.3 H 2.5 107.5 H 5.8March— — 113.6 H I .7 H 6.8 10U.7 129.3 H 9.5 H2.U 107.7 H 7.5April--------- 113.7 H 1.5 117.0 10U.6 129. U 120.2 112.5 107.9 H 7.9May------------ 11U.0 H 2.1 H 7.1 10U.7 129.U 120.7 H2.8 108.0 H 8.0June——— HU.5 H 3.7 H7.U 10U.6 129.U 121.1 H2.6 107.8 118.2July ------- 11U.7 113.8 H 7.8 10U.U 129.7 121.5 H2.6 107.U H 8.3August—— 115.0 llU .l H 8.0 10U.3 130.6 121.8 H2.7 107.6 H8.USeptember— 115.2 113 .8 118.U 105.3 130.7 122.6 112.9 107.8 H 8.5October— - U5.U H 3.6 118.7 105.5 130.7 122.8 113.2 108.6 119.7November— H 5.0 H 2.0 118.9 105.5 130.1 123.3 H3.U 108.9 120.2December— nls.9 H2.3 H 8.9 105.3 128.9 123.6 113.6 108.9 120.3
195U: Average— 11U.8 H 2.6 H 9.1 ioU.3 128.0 125.2 H3.U 107.0 120.1January-—- 115.2 H 3.1 118.8 10U.9 130.5 123.7 H3.7 108.7 120.3February---- 115.0 112.6 118.9 10U.7 129.U 12U.1 H 3.9 108.0 120.2March— iiU.8 112.1 119.0 10U.3 129.0 12U.U llU.l 108.2 120.1April--------- 11U.6 H2.U 118.5 IOU.1 129.1 12U.9 H 2.9 106.5 120.2May—— —- 115.0 H 3.3 118.9 10U.2 129.1 125.1 H 3.0 106.U 120.1June— — 115.1 113.8 118.9 10U.2 128.9 125.1 112.7 106.U 120.1July— — - 115.2 13U .6 H 9.0 ioU.o 126.7 125.2 113.3 107.0 120.3August—— 115.0 H 3.9 119.2 103.7 126.6 125.5 113.U 106.6 120.2September— m . 7 H2.U H 9.5 10U.3 126.U 125.7 H 3.5 106.5 120.1October— HU. 5 H I . 8 H 9.5 10U.6 125.0 125.9 H3.U 106.9 120.1November— HU. 6 H l . l H 9.5 10U.6 127.6 126.1 113.8 106.8 120.0December— HU .3 HO.U H 9.7 10U.3 127.3 126.3 H 3.6 106.6 119.9
1955: Average— UU.5 H0.9 120.0 103.7 126. U 128.0 H5.3 106.6 120.2January— 11U.3 HO.6 H 9.6 103.3 127.6 126.5 113.7 106.9 H 9.9February— 11U .3 H 0.8 119.6 103 .U 127.U 126.8 H 3.5 106.U 119.8March--------- HU.3 HO. 8 H 9.6 103.2 127.3 127.0 H 3.5 106.6 H 9.8April--------- HU .2 H I .2 119.5 103.1 125.3 127.3 H3.7 106.6 H 9.8May------------ 11U.2 1H .1 H9.U 103.3 125.5 127.5 113.9 106.5 119.9June---------- HU.U H I .3 119.7 103.2 125.8 127.6 11U.7 106.2 H 9.9July---------- HU. 7 ' 112.1 H 9.9 103.2 125.U 127.9 H 5.5 106.3 120.3August------- m .5 H I .2 120.0 103.U 125.U 128.0 115.3 106.3 120 .USeptember— 11U.9 H I . 6 120.U 10U.6 125.3 128.2 116.6 106.7 120.6October---- - 11U.9 HO. 8 120.8 10U.6 126.6 128.7 117.0 106.7 120.6November— H 5.0 109.8 120.9 10U.7 128.5 129.8 H 7.5 106.8 120.6December-— llU.7 109.5 120.8 10U.7 127.3 130.2 117.9 106.8 120.6
1956: Average— 116.2 H I .7 121.7 105.5 128.7 132.6 120.0 108.1 122.0January—— HU .6 109.2 120.6 10U.1 126.8 130.7 118.5 107.3 120.8February— HU.6 108.8 120.7 10U.6 126.9 130.9 H8.9 107.5 120.9March------.— HU. 7 109.0 120.7 IOU.8 126.7 131 .U 119.2 107.7 121.2April--------- Hli.9 109.6 120.8 10U.8 126. U 131.6 119.5 108.2 121.UMay------------ H5.U H 1.0 120.9 10U.8 127.1 131.9 119.6 108.2 121.5June----------- H6.2 H3.2 121.U 10U.8 126.8 132.0 H9.9 107.6 121.8July----------- H 7.0 HU.3 121.8 105.3 127.7 132.7 120.1 107.7 122.2August-------- H 6.8 113 .1 122.2 105.5 128.5 133.3 120.3 107.9 122.1September— 117.1 H 3.1 122.5 106.5 128.6 13U.0 120.5 108.U 122.7October—— H 7.7 H 3.1 122.8 106.3 132.6 13U.1 120.8 108.5 123.0November---- H 7.8 112.9 123.0 107.0 133.2 13U.5 121. U 109.0 123.2December---- H 8.0 112.9 123.5 107.0 133.1 13U.7 121.8 109.3 123.3
1957: Average— 120.2 H5.U 125.6 106.9 136.0 138.0 12U.U 112.2 125.5January— H8.2 H 2.8 123.8 106.U 133.6 135.3 122.1 109.9 123.8February— H 8.7 H 3.6 12U.5 106.1 13U.U 135.5 122.6 HO.O 12U.0March— 118.9 H 3.2 12U.9 106.9 135.1 136.U 122.9 H 0.5 12U.2April--------- H 9.3 H 3.8 125.2 106.5 135.5 136.9 123.3 111.8 12U.2May------------ H 9.6 HU.6 125.3 106.5 135.3 137.3 123. U lll.U 12U.3June-------- - 120.2 116.2 125.5 106.6 135.3 137.9 12U.2 1H .8 12U.6July---------- 120.8 H7.U 125.5 106.5 135.8 138.U 12U.7 H2.U 126.6August—---- 121.0 H 7.9 125.7 106.6 135.9 138.6 12U.9 112.6 126.7September— 121.1 117.0 126.3 107.3 135.9 139.0 125.1 113.3 126.7October—— 121.1 H6.U 126.6 107.7 135.8 139.7 126.2 H3.U 126.8November---- 121.6 116.0 126.8 107.9 1U0.0 11*0.3 126.7 llU.U 126.8December— 121.6 116.1 127.0 107.6 138.9 1U0.8 127.0 11U.6 126.8
1958: Average— 123.5 120.3 127.7 107.0 1U0.5 1UU.U 128.6 116.7 127.2January— 122.3 H 8.2 127.1 106.9 138.7 1U1.7 127.8 116.6 127.0February— 122.5 118.7 127.3 106.8 130.5 1U1.9 128.0 116.6 127.0March--------- 123.3 120.8 127.5 106.8 138.7 1U2.3 128.3 117.0 127.2April--------- 123.5 121.6 127.7 106.7 138.3 1U2.7 128.5 117.0 127.2May---------- - 123.6 121.6 127.8 306.7 138.7 1U3.7 128.5 116.6 127.2June— ---- 123.7 121.6 127.8 106.7 138.9 1U3.9 128.6 116.7 127.2July---------- 123.9 121.7 127.7 106.7 1U0.3 1UU.6 128.9 116.6 127.2August—---- 123.7 120.7 127.9 106.6 lU l.o 1U5.0 128.9 116.7 127.1September— 123.7 120.3 127.9 107.1 lUl.3 1U6.1 128.7 116.6 127.1October— 123.7 119.7 127.9 107.3 1U2.7 1U6.7 126.3 116.6 127.2November- 123.9 119.U 128.0 107.7 1UU.5 1U7.0 129.1 117.0 127.3Dee ember— 123.7 118.7 128.2 107.5 1UU.3 1U7.3 129.0 116.9 127.3
41
Digitized for FRASER http://fraser.stlouisfed.org/ Federal Reserve Bank of St. Louis

Table 5 -3 . Consumer Price Index--United S tates c ity average: Indexes o f food, housing, ap p a re l, tra n s p o rta tio n , and t h e i r subgrouos,by year and month, 191*7—58
(19U7-U9-100)
Tearand
month
Food Housing Apparel Transportation
3g
Food at home
Tota
l
Rent
Oas
and
elec
tric
ity
Solid
fue
ls
and
fuel
oil
Hous
e-fu
rnis
hing
s
Hous
ehol
dop
erat
ion
Tota
l
1
i\*•» W
omen
's an
d gi
rls'
Foot
wear
Othe
rap
pare
l 1/
Tota
l
Priv
ate
Publ
ic
Tota
l
Cere
als
and
bake
ry
prod
ucts
Mea
ts,
poul
try,
an
d fi
sh
Dair
ypr
oduc
ts
Frui
ts a
nd
vege
tabl
es
Othe
r fo
ods
at h
ome
1947: Average 95.9 9U.0 93.5 96.7 97.6 100.1 95.0 9U.U 97.6 88.8 97.2 97.2 97.1 97.3 98.0 9U.5 98.1 90.6 91.U 86.6January— 91.0 86.8 85.7 98.7 92.0 95.7 92.5 91.9 97.5 8U.2 9U.U 95.1 93.6 95.3 9U.0 S-.2 87.9 87.8 88.U 86.390.2 — 87.2 8U.7 95.1 93.9 9U.2 92.6 92.1 97.8 8U.3 95.3 95.2 9U.9 96.3 95.6 91.6 89.6 88.0 88.6 86.393.8 89.6 89.1: 97.U 97.7 97.6 93.0 92.3 97.8 8U.U 96.1 95.U 96.3 96.8 97.5 93.5 93.3 88.8 89.2 87.9April— - 93.1 ----- — 92.8 87.2 92.9 98.1 99.3 93 .U 92.U 98.1 85.0 96.2 97.1 96.7 97.0 97.7 9U.2 9U.7 89.5 90.2 87.9lfey------— 92.9 93.3 87.8 89.0 Id.I: 96.5 93.3 92.5 98.0 83.9 95.9 96.9 96.7 97.0 97.7 9U.5 95.6 89.7 90.2 88.69U.3 _____ 93.5 93.1: 89.0 100.U 95.1 93.3 92.6 97.2 8U.0 96.3 96.6 97.1 97.1 97.8 9U.8 100.0 89.8 90.2 88.995.6 — 93.8 9lu8 92.8 98.9 98.0 9U.1 93.U 97.2 86.6 97.2 96.7 96.5 96.7 97.1 9U.5 99.9 90.3 91.0 88.997.3 —— 9U.2 98.3 95.U 97.8 99 .U 95.3 9U.U 97.6 92.7 97.1 96.5- 97.2 96.9 98.2 9U.8 100.6 90.3 91.7 88.9
100.7 — 95.5 103.6 I d .3 97.1 10U.3 96.8 96.5 97.7 93.3 98.3 97.1 98.1 97.8 99.U 95.0 102.2 92.0 93.3 89.099.8 — 97.0 101.1: 98.7 96.3 105.7 97;7 97.7 97.8 9U.0 99.0 98.U 98.8 98.5 100.2 95.5 103.1 92.6 93.8 89.7
100.3 ------— 101.6 97.7 103.0 97.7 105.6 98fU 98.0 98.1 96.2 99.6 100.1 99 .U 99.1 100.6 96.6 10U.U 93.U 9U.9 90.0December- 102.1; — 103.1 97.8 106.U 100.5 109.5 99.2 98.3 98.2 97.U 100.9 101.8 99.9 99.3 100.8 98.3 10U.9 9U.1 95.6 90.319U8: Average 10U.1 _____ 103.U 10 6.1 106.3 100.5 102.5 I d .7 100.7 100.0 10U.U 103.2 102.6 103.5 102.7 103.8 103.2 108.6 100.9 101.2 100.2
103.8 ----- — 10U.5 102.2 106.8 102.0 105.8 100.0 98.8 98.7 99 .U 101.): 103.2 100. U 99.9 100.U 100.3 106.2 95.8 97.5 91.6101.3 ------— 103.9 96.8 10 6.1 10U.3 98.9 100.2 99.0 98.8 99.8 101.7 103.1 102.0 101.3 101.9 102.3 108.3 96.1 97.7 92.1100.1 — 103.1; 96.7 10U.U 101.3 97.9 100.5 99.3 99.5 99.9 102.7 102.9 102.6 101.7 102.6 103.3 109.6 96.1 97.7 92.3April------ 102.9 — 103.1: 100.6 106.9 106.5 97.U 100.7 99.U 99.6 100.2 102.6 103.3 102.7 101.3 102.6 103.2 109.8 97.3 98.U 9U.7May-------- 10U.U — 103.5 105.1 106.3 106.8 98.0 100.9 99.9 99.8 101.6 102.1 102.5 103.2 102.9 102.9 103.3 109.9 97.U 98.1 95.6June—---- 106.0 —----- 103.6 109.8 106.9 105.2 100.0 101.2 100.2 99.9 102.8 102.7 102.0 102.9 102.5 102.6 103.1 109.5 97.7 98.5 95.8July------- 107.3 — 103.1; 112.7 108.5 10U.5 102.0 101.8 100.6 100.1 105.3 103.3 102.6 103.0 102.? 102.6 103.3 109.3 102.8 101.9 10U.8August—- 107.2 — 103.3 11U.9 109.6 97.7 10U.8 102.U 101.1 100.2 108.2 103.5 102.); 10U.U 103.2 105.3 103.6 109.6 10U.8 10U.2 106.USeptember 106.5 — 103.3 nU.2 108.U 95.9 106.01 102.9 101.8 100.3 108.7 10U.U 102.0 10 5.1 10U.2 10 6.1 103.9 109.0 105.3 10U.7 106.710U.7 ----- — 102.8 110.2 105.U 9U.8 107.8 103.2 102.1 101.2 108.9 10)4.8 102.5 105. U 10U.5 106.6 10U.0 109.0 106.0 105.5 107.2102.7 —----- 102.8 106.2 103.6 92.8 108.5 103 .U 102.3 101.2 109.0 10U.7 102.6 105.3 10U.3 106.6 10U.0 107.7 106.0 105.3 107.6101.5 103.0 103.9 103.U 9U.2 103.0 103.7 103.0 101.1 108.9 10U.7 102.7 10U.8 103.8 105.9 103.9 105.9 106.0 105.3 107.8
19U9: Average 100.0 _____ 102.7 100.5 96.9 101.9 97.5 103.3 105.6 102.5 106.8 99.6 100.1 99.U 100.0 98.1 102 .U 93.2 108.5 107 .U m .2January— 101.1; 103.1 101.5 10 1.8 100.5 100.5 103.6 103.3 101.3 109.2 103.6 102.2 102.7 102.0 103.2 103.3 101.9 10 6 .1 105.U 107.8February- 98.9 —------ 102.8 95.3 99.9 iou.7 93.U 103.7 103.7 101.9 109.6 103.1 101.3 102.0 101.7 101.9 103.3 100.1 106.9 106.5 107.8March—— 99.e — 102.9 98.8 98.8 105.0 93.0 103.6 103.9 101.9 109.6 102.2 100.9 10 1 .U 101.1 101.2 103.1 97.1 107.5 106.8 109.1April----- 100.U — 103.0 100.9 96.0 10 7 .1 93.1 103.3 10U.2 102.7 106.9 101.2 100.7 100.6 100.5 100.2 102.9 95.0 107.9 107.5 109.1May--------- 100.2 - —— 102.9 100.0 9U.8 10 8.1 93.7 102. e 10h.5 102.8 10U.0 99.9 99.8 100.0 100.2 99.2 102.8 93.0 108.6 107.5 m .2June----— 101.1 —- —- 102.7 103.6 9U.5 106.7 9U.9 102.7 10U.8 102.8 10U.2 98.7 99.6 99.5 100.0 98.2 102.7 92.0 108.0 107.5 109.2July------- 99.9 — — 102.5 I d .6 9U.6 102.9 95.8 102.7 105.0 102.8 10U.2 98.5 99.U 98.5 99.3 96.? 102.5 91.3 108.3 107.7 109.5August—- 100.3 102.5 103.1 96.0 98.9 99.6 102.6 105.2 103.0 10U.2 97.U 99.1 98.0 98.9 96.1 102.0 90.2 109.U 107.9 n 2.8September 101.1 102.7 10U.9 96.2 97.8 102.3 103.2 105.7 103.0 105.8 97.8 99 .U 97.9 99.0 96.0 101.6 89.8 109.U 108.0 U2.8October— 99.3 102.3 101.2 96.9 95.2 101.3 103.5 106.1 102.9 107.2 97.6 99.5 97.6 98.9 95.5 101.3 89.5 109.9 107.9 llU.6November- 99.lt — — 102.li 98.6 96.8 98.9 102.U 103.9 106.6 102.9 108.1 97.7 99.5 97.U 98.9 9U.9 101.5 89.3 109.8 107.7 11U.7Dee ember- 97.7 — 102.1: 96.1 96.7 97.1 99.3 10U.2 107.0 103.1 109.0 97.7 100.0 97.1 98.9 9U.3 10 1.U 89.3 110.3 107.8 n6.u
1950: Average 101.2 10U.5 10U.9 95.9 97.6 ld .2 106.1 108.8 102.7 no.5 100.3 101.2 98.1 99.5 9U.8 10U.0 92.0 m .3 107.6 120.3January— 97.0 __ ___ 102.2 9U.1: 95.6 100.3 95.1 10U.U 107.5 102.5 109.9 97.U 99.U 96.7 98.6 93.6 101.U 89.0 110.2 107.5 n6 .6February- 96.5 __ — 102.3 95.6 95.3 97.6 93.5 10U.6 107.7 102.8 109.6 97.6 99.U 96.7 98.6 93.U id .6 89.U no.o 107.2 n6 .8March—— 97.3 _____ 102.3 98.7 9U.7 95.5 95.5 10U.6 107.8 102.8 109.9 97.7 99.5 96.8 98.U 93.7 10 1.5 89.5 109.8 106.9 116.8April------ 97.7 —- —- 102 .U 99.5 93.3 97 .U 95.1 1QU.7 108.1 102.9 109.7 97.7 99.1 96.7 98.U 93.3 10 2.1 89.6 109.6 106.6 n6.8May--------- 98.9 ___ __ 102.7 103.U 92.6 99.0 93.5 10U.7 108.5 102.8 106.8 97.5 99.7 96.5 98.2 93.3 10 2.1 88.8 110.1 106.9 n7.9June---— 100.5 -------- 102.7 106.1 92.3 ‘102.5 9U.1 10U.9 108.7 102.7 107.6 97.U 99.6 96.5 98.1 93.3 10 2 .1 88 ,U 109.9 106.6 11 7 .9July------- 103.1 — 103.8 110.1 93.8 103.6 97.7 105.3 109.1 102.8 108.1 98.1 99.9 96.U 98.0 93.1 102.2 88.7 m .2 107.0 1 2 1 .1August-— 103.9 __ — 106.2 312.2 95.7 9U.7 105.3 106.1 109.3 102.7 109.8 99.7 101.2 97.1 98.6 93.5 103.3 92.2 112.U 108.1 122.9September 10U.0 107.0 112.U 97.0 91.1 107.7 107.1 109.5 102.8 111.6 102 .U 102.3 99.2 100 .U 96.2 105.2 9U.U 112 .7 108.3 123.3October— 10U.3 107.2 109.0 99.6 92.9 110.U 108.1 109.6 102.7 n3.U 10U.7 103.6 100.9 101.6 97.8 107.3 96.8 112.6 108.1 123 . UNovember- 10U.U ----- — 107.1; 107.7 100.1 95.8 109.2 108.8 110.0 102.7 1 1 U.3 106.0 10U.U 101.6 102.2 9 8.2 108.6 97.9 112.9 108.5 123.6Dee ember- 107.1 — 107.5 109.1 100.7 99.9 117.0 109.U no.U 102.7 12U.8 107.1 105.6 102.2 102.8 98.5 110 .3 99.1 11U.1 109.1 126.2
1951: Average 112.6 _____ 111:. 0 117.2 107.0 106.7 llU.6 112 .U n 3 .i 103.1 n6.u 111.2 109.0 106.9 107.7 102.2 n7 .7 101.6 118.U n 2.u 132.8January— 109.9 _-___ 112.2 113.5 105.2 10U.8 111.2 110 .U no.6 103 A n 5 .i 109.3 107.2 103.8 10U.2 99.3 n3 .7 101.5 11U.7 109.5 127.1February- 111.9 _____ 113.2 116.3 10 6.1 109.8 110.3 111.2 m .3 103.1 n6.u no.5 108.1 105.6 105.7 Id.U n5 .8 103.2 115.8 109.9 130.0March------ 112.0 ______ 113 .U 117.2 106.2 106.3 112.7 U1.7 m .9 103.1 n6 .7 i n . i 108. U 106.2 105.9 102.1 n6 .8 103.8 116.9 no.8 131.6April------ 111.7 ___ __ 113.9 117.3 106.0 105.2 112 .U i n . 9 112.2 102.8 n6.7 1 1 1 .6 108.3 106.U 10 6.1 102.2 n7.3 10U.1 117.2 i n . i 132.0May-------- 112.6 _____ 113.9 117 .U 105.7 108.5 113.5 n 2.2 112 .5 103.2 115 .2 1 1 2 .1 108.7 106.6 106.8 102.1 n7 .6 10U.3 n 7 .6 1 1 1 .5 132 .UJune------ 112.3 _____ llU.O 136.9 105.9 107.7 113.8 112.3 112 .7 103.0 1 1 5 .U n 2.o 108.7 106.6 107.2 I d .7 n 7.8 103.7 U7.5 m .3 132.5July------- 112.7 _____ 1 1 U.3 117.6 106.5 107.0 11U.8 n 2.6 n 3 .i 103.1 115 .9 n 2.o 109.1 106.3 107.1 100.8 n8.U 103.2 117.8 m .6 132.8August— 112. U in*. 2 118.U 106.9 102.3 116.5 n 2.6 n3.6 103.2 n 6.2 1 1 1 .1 109.0 106. u 107.6 100.7 n8.9 102.0 118.7 112.3 13U.0September 112.5 iiu.6 118.6 107.2 100 .U 118.U n2.9 n u .2 103.2 n6.6 m . 3 108.8 109.3 n o .3 10U.7 n9 .6 100.U 119.7 n3.U 135.1October— 113.5 111:.6 119.1 107.9 103.2 118.9 n 3.2 iiu.8 103.3 n 7 .i 110 .9 109.6 109.2 n o .9 10U.2 n 9 .s 99.5 120.5 11U.3 135.5November- ill*. 6 _____ 115.1 117.7 109.2 109.5 118.5 n3.7 n5.u 103.3 1 1 7 .U 1 1 1 .1 110.1: 108.5 no.U 103.6 n8 .7 97.1 122.1 n6 .5 135.5Dee ember- 115.0 — 115.2 116.3 110.7 H5.8 11U.5 113 .9 U5.6 103.U 1 1 7 .6 110.8 111.1 108.1 no.U 103.0 n7.9 96.2 122.2 116.7 135.7
1952: Average 111* .6 —— 116.8 116.2 111.5 117.2 109.3 11U.6 117.9 10U.5 n8 .7 108.5 m .s 105.8 108.2 100.9 n5 .3 92.1 126.2 U9.9 lUl.5January— 115.0 ____ H5.3 117.1 112.0 118,2 109.1 n3 .9 116.0 103.5 n7.7 n o .2 n o .9 107.0 109.6 101.6 n 7 .i 9U.0 122.8 n7.2 136.3February- 112.6 11 5 .5 116.7 112.7 109.5 105.8 11U.0 n6.U 103.8 n7 .6 no.o n o . 8 106.8 10 9.1 101.8 n6.7 93.6 123.7 n7 .9 137.7Jferch------ 112.7 ______ 1 1 5 .7 115.2 112.0 113.7 10U.U 11U.0 n6.7 103.8 n7.7 109.U m .o 106.U 108.7 101 .U n6.u 92.8 12U.U U8.8 138.1April------ 113.9 11 5 .6 11U.8 110 .U 121.1 105.0 1 1U.0 H 6.9 103.9 n7.3 108.7 1 1 1 .0 106.0 108.5 100.8 n 6 .i 92.0 12U.8 119.0 138.9May--------- 111*.3 ______ 117 .2 11U.5 109.3 12U.3 10U.U nu.o 11 7 .U 10U.I 115 .6 108.3 m .2 105.8 108.3 100.6 n5.9 91.5 125.1 119.2 139.2June------- 111*. 6 __ ___ 116.9 116.5 108.9 122.U 105.2 1 1U.0 11 7 .6 10U.3 n5.8 10 7.7 m .2 105.6 108.3 100.5 n5.U 91.3 126.3 n9.U 1U3.0July------- 116.3 117.6 116.U 110.2 12U.0 111.5 11U.U n7.9 10U.2 n8.6 107.6 n i .8 105.3 108.1 100.1 nu.9 91.1 126.8 120.1 1U3.0August— 116.6 117.5 119.U 111.0 118.7 113.1 1 1U.6 118.2 105.0 119.0 107.6 m .9 105.1 108.0 99.9 nu.5 91.2 127.0 120.3 1U3.1September 115.1; __ __ 117.1: 119.2 112.5 111.5 113.7 1 1 U.8 n8.3 105.0 U9.6 10 8 .1 1 1 2 .1 105.8 107.8 101.6 nu .2 91.5 127.7 121.2 1U3.5October— 115.0 117.5 116.9 113.2 111.3 115.1 115 .2 118.8 105.0 121.1 107.9 U2.8 105.6 107.7 101.6 n3.9 91.7 128. U 121.9 1UU.UNovember- 115.0 _____ 117.5 11U.3 113.3 115.9 llU.3 n5.7 11 9 .5 105.U 121.6 108.0 n3.3 105.2 107.5 100.6 n u .i 92.3 128.9 122.0 1U5.5Dee ember- 113.8 117.7 113.0 112.7 115.8 110.6 n6.u 120.7 105.6 123.2 108.2 n3.U 105.1 107.U 100.U 1 1 U.U 92.5 128.9 121.9 1U5.8
See footnotes at end of table,42
Digitized for FRASER http://fraser.stlouisfed.org/ Federal Reserve Bank of St. Louis

Table B -3 . Consumer Price Index—United S ta te s c ity average: Indexes of food, housing, a oparel, tra n s p o rta tio n , and th e i r subgroups,by year and month, 19 b7-58 —Continued
(191:7-1*9-100)
Food Housing Aoparel T ransportation
Food a t homeTear
andmonth
To
tal
2/
To
tal
Ce
rea
ls
and
b
ak
ery
p
rod
uc
ts
i a3 V vw o e
Dai
ryp
rod
uc
ts
Fru
its
and
v
eg
eta
ble
s
Oth
er
foo
ds
at
hom
e
To
tal
3/
Ren
t
Qas
an
d
ele
ctr
icit
y
So
lid
fu
els
an
d
fue
l o
i!
Ho
use
- fu
rnis
hin
gs
Ho
use
ho
ldo
pe
rati
on
To
tal
Men
's
and
b
oy
s'
Wom
en's
an
d
gir
ls'
*
300C*. O
ther
ap
oa
rel
1/
To
tal
Pri
va
te
Pu
bli
c
1953s Average 112.8 112.5 H 9 .1 1 09.9 1 09 .6 1 33 .5 H 2 .2 H 7 .7 12b .1 106.6 1 23 .9 1 07 .9 H 5 . 3 10li. 8 1 0 7 .b 99.7 H 5 .2 9 2 .1 129 .7 122.2 1 50 .9January— 113.1 112.9 H 7 .7 H O .9 H I .6 H 6 .7 1 09 .7 H 6 .lt 121.1 105 .9 123.3 1 07 .7 H 3 .li 10lt.6 1 07 .1 99.7 l i b . 3 9 2 .0 129 .3 122.2 11*6.2February- U l . 5 111.1 H 7 .6 107 .7 H O .7 U 5 .9 107 .3 H 6.6 1 21 .5 106.1 1 23 .3 108.0 H 3 .5 10U.6 1 07 .3 99.3 l i b . 6 92.3 129 .1 122.0 lb 6 .9March----- 111 .7 111.3 H 7 .7 107.it H O .3 H 5 .5 1 09 .1 H 6.8 121 .7 1 0 6 .5 12lt.lt 108.0 llii.O 10ii.7 1 07 .3 99.6 H b .5 92.b 129 .3 122.2 31*6.9A pril------ 1 11 .5 111.1 H 8 .0 106.8 1 0 9 .0 H 5 .o H 0 .lt H 7 .0 122.1 106 .5 123.6 107.8 H lt.3 10k.6 107 .3 9 9 .b l i b . 8 92.1 1 2 9 .b 122.2 lb 7 .5May---------
June-——112.1113 .7
111 .7113 .7
U 8.ltH 8 .9
109.2 H I . 3
1 07 .81 07 .5
cm r-
H H n o . 3
n o . 9H 7 .1H 7.U
123.01 23.3
106.6106.U
121.8121.8
107 .6108.0
l l i t . 7H 5 .lt
10lt.7 10b .6
1 0 7 .b 107 .2
99.b99.2
1 15.1H 5 .3
9 2 .592 .3
129 .b 1 2 9 .b
122.1122.1
lb 8 .9lb 9 .0
Ju ly ------- 113.8 113.8 H 9 .1 112.0 108 .3 118.2 H 2 .3 H 7 .8 123.8 106.lt 1 23 .7 108.1 H 5 .7 10lt.lt 107.b 9 8.9 H 5 .0 92.2 129 .7 222.U lh9.0August— n b . i n l t . l H 9 .5 H lt.1 1 09 .1 1 12 .7 H lt.lt H 8 .0 1 25.1 1 06 .9 123 .9 107.U H 5 .8 10U.3 1 07 .3 9 8 .7 H 5.0 9 2 .0 130.6 1 22 .7 155.2September 113.8 1 13 .5 1 20 .3 1 1 3 .5 109.6 106.6 1 36 .7 H 8.lt 126.0 106 .9 12U.6 108.1 H 6.0 1 05 .3 1 07 .5 1 00 .5 H 5 .3 9 2 .5 130.7 122 .3 1 55 .3October— 1 13 .6 113.3 120.lt m . i 110.1 107 .7 H 7 .lt H 8 .7 126.8 1 07 .0 1 25 .7 108.1 H 6 .6 105 .5 1 07 .6 100.8 H 5 .8 9 2.3 130 .7 122.8 1 55 .3November- 112.0 111.It 120.6 1 07 .0 H 0 .5 107.lt H it. 8 H 8 .9 127.3 107 .3 125 .9 1 08 .3 136 .9 1 05 .5 107 .8 100 .7 116.2 9 1.3 1 30.1 122.2 155 .2December- 112.3 1 11.7 120 .9 1 07 .8 H 0 .3 109.2 H 3 .5 H 8 .9 127 .6 107.2 1 25.3 108.1 H 7 .0 105 .3 107.6 1 00 .5 H 6.1 9 0 .9 128.9 120.8 155.7
195U s Average 112.6 1 11.9 121 .9 108.0 106.1 1 11 .9 H it. 3 H 9 .1 1 28 .5 107.9 123 .5 106.1 H 7 .lt IOU.3 106.8 98.9 U 6 .b 9 0 .7 128.0 119.2 161.1January— 113.1 112.6 121.2 H 0 .2 109 .7 HO . 8 H 3 .5 H 8.8 127 .3 107.1 1 25 .7 107 .2 H 7 .2 lOlt.9 107 .b 9 9 .8 U 6.2 90.b 130 .5 122.2 158.6February- 112.6 132 .0 1 21 .3 109 .7 1 09 .0 108.0 H lt.0 H 8 .9 127 .9 1 0 7 .5 126.2 1 07.2 H 7 .3 10ii.7 107.b 9 9 .5 116.1 9 0 .b 129 .b 1 20 .9 1 59 .3March-— 112.1 m . ! t 121.2 1 09 .5 108.0 107.8 H 2 .3 H 9 .0 1 28 .0 1 07.6 1 25 .8 1 07.2 H 7 .5 10lt.3 107.2 9 9 .0 H 6 .1 9 0.0 129 .0 1 20 .5 159 .3A pril----- 112.U 111.8 121.1 H 0 .5 lOlt. 6 110.0 1 13 .6 H 8 .5 128.2 107.6 123 .9 106.1 H 6 .9 10U.1 107.1 98.b 116.1 9 0 .b 1 29.1 120 .7 159 .3May-------- 113.3 112.8 121.3 1H .0 1 0 3 .5 H it. 6 l l l t . 5 H 8 .9 128 .3 1 07 .7 1 20 .9 105 .9 H 7 .2 10ii.2 1 07 .3 98 .5 U 5 .9 90.9 1 29 .1 120.6 160.5June— — 113 .3 1 13.3 1 21 .3 1H .1 1 02 .9 H 7 .1 H 5 .2 H 3 .9 1 28 .3 107.6 1 20 .9 105 .8 217.2 10lt.2 107 .0 9 8 .5 116.3 9 1 .0 128.9 120.2 1 61 .5Ju ly ------- i i i t .6 i i u . 2 121.6 1 09.7 1 0b .3 120.1 H 7 .3 H 9 .0 1 28 .5 1 07 .8 121.1 105 .7 217.2 lOit.O 106.6 9 8.2 H 6 .5 90.8 126.7 117 .3 1 61.9August— 113 .9 1 13.3 122 .3 107 .6 1 05 .1 l i l t . 7 H 9 .6 H 9 .2 1 28 .6 1 07 .8 121 .9 1 0 5 J t 117.3 103.7 106. b 9 7 .7 1 16.9 90.7 126.6 117 .7 162 .3September 112. b 111.6 122.6 1 06.7 1 05 .3 H 0 .5 H 6 .0 H 9 .5 128.8 1 07 .9 122.lt 106.0 H 7.U lOli. 3 106. b 99 .0 H 6 .5 90.9 126.b 1 1 7 .b 1 62 .3October— 111 .3 1 10.9 122.7 103 .9 1 06 .7 111.1 215.7 1 19 .5 129.0 1 08 .5 123.8 105.6 H 7 .6 10k .6 106. b 99.6 1 16.7 91.1 1 25 .0 115.9 162.6November- 111.1 110.1 1 23 .1 1 03 .5 106.6 109.6 1 13 .7 H 9 .5 129.2 108.7 121*.2 105.U H 7 .8 lOli. 6 106.5 99.5 H 7 .0 91.2 1 27.6 H 8 .7 1 62 .6December- u o .b 109.2 123.3 102.2 106.8 108.lt 1 12 .0 H 9 .7 129.lt 109 .1 125 .5 105.lt 1 17 .7 lOli.3 1 06 .5 9 9 .0 H 6 .9 9 1.1 127 .3 U 8 .b 162 .8
1955s Average 110.9 109 .7 1 23 .9 1 01 .6 1 05 .9 U 3 .5 1 H .5 1 20 .0 130.3 HO . 7 125 .2 1 0 lt .l H 9 .1 103 .7 105.7 9 8 .0 H 7 .7 9 0 .6 126.b 1 17 .1 165 .7January— 1 10 .6 109.lt 123.it I02 .lt 106.it H 0 .6 H 1 .3 H 9 .6 1 29 .5 109.lt 126 .1 lOlt.6 H 7 .7 1 03 .3 1 05 .5 9 7 .6 1 16 .7
116.69 0 .5 127.6 1 18 .6 163.6
February- 110.8 1 09 .6 1 23 .8 1 02 .5 106.1 110 .7 1 12 .1 H 9 .6 1 29.7 109.9 126.2 lOli. 8 117 .7 103.lt 1 05 .6 9 7 .7 9 0 .6 127 .b H 8 .b 1 6 3 .bMarch------ 1 10 .8 109>7 1 23 .9 102 .3 1 05 . it 1 12 .0 H I . 9 H 9 .6 130 .0 H 0 .3 126 .2 lOlt.6 H 7 .9 103.2 1 0 5 .6 9 7 .b H 6 .7 9 0 .b 1 27 .3 H 8 .2 I6b .6A p ril------ 111 .2 110 ,1 123 .9 1 03 .0 lOit.6 1 17 .5 109.lt H 9 .5 129.9 HO . 3 125 .7 io b .5 H 8 .1 103 .1 1 0 5 .5 9 7 .1 H 6 .9 90.2 1 25.3 H 6 .0 I6b .8May--------- 1 11 .1 110 .0 123.8 1 02 .1 lOit.O 120.2 108.1* H 9 .lt 1 30 .3 H 0 .9 1 22 .5 103.7 H 9 .0 103.3 105 .7 9 7.3 U 7 .b 9 0.3 1 25 .5 116.2 l6 b ,9June------- 1 11 .3 1 10 .3 12lt.O 1 03 .8 lO lt.l 1 19 .5 1 07 .7 H 9 .7 130.it H O .7 122.7 103.8 119 .2 1 03.2 105 .6 9 7.2 117. b 9 0 .1 125 .8 1 16 .5 1 65 .1Ju ly ------ 112 .1 1 11.1 12it.2 1 03.7 10ii.7 121 .9 109 .2 219.9 130.lt 1 10 .8 123.2 103 .6 H 9 .lt 103 .2 105 .7 96.9 1 17 .5 9 0 .5 125.b 1 16 .0 165 .3August---- m . 2 1 10 .0 1 2 lt .l 102 .9 1 05 .7 1 H .3 1 1 2 .6 1 20 .0 1 30 .5 110 .3 123 .3 103.2 H 9 .5 103.lt 105 .5 9 7 .b H 7 .6 9 0 .5 125.b H 5 .9 166.9September 1 11 .6 110.lt 12U.0 1 03 .5 106.5 H O .2 l l i t . l 120.lt 130 .5 H I . 2 1 25.2 103.6 H 9 .8 10lt.5 105 .8 9 9 .5 118.1 91.0 ,125.3 H 5 .8 166 .9October— 1 10 .8 109.lt 1 23 .9 1 00.9 107 .5 108 .5 133 .9 120.8 1 30.8 H I . 2 1 26.3 id t . i t 1 20 .1 lOli.6 106.0 99.5 H 8 .b 9 1.0 1 2 6 .6 H 7 .1 167.1November- 109 .8 108.2 1 23 .9 9 7 .1 1 07 .8 1 09 .0 213.1 120 .9 130.9 H I .5 1 26.7 io lt.5 1 20 .5 lOli,7 106.0 99.3 119 .2 9 1 .0 1 2 8 .5 H 9 .1 1 67 .8Dee ember- 109 .5 1 07.9 123 .9 9lt.6 107 .7 HO. 7 213.7 120 .3 131.1 H 1 .5 128 .0 103 J t 1 20 .7 10b.7 106.1 9 9.1 1 19.3 9 1 .1 1 27.3 H 7 .8 1 67 .8
1956: Average 111 .7 1 10.2 1 25 .6 97 .1 108.7 119 .0 H 2 .8 1 2 1 .7 132 .7 H I . 3 130 .7 103.0 122 .9 1 05 .5 1 0 7 .U 98.7 1 23.9 91 .b 1 28 .7 H 3 .3 172 .2January— 109.2 1 07 .5 1 23 .9 9 3 .3 107 .3 1 12 .6 H 2 .8 1 20 .6 131.lt 111 .7 1 29 .5 102.0 121,2 lOlt.1 106.0 97.9 1 2 0 .b 9 0.7 1 26 .8 1 17 .0 1 70.3February- 108.8 107 .1 12U.3 9 3 .6 107.3 H 3 .3 1 09 .6 1 2 0 .7 131.5 H I . 7 1 30 .0 102.5 i a . i t lOl*. 6 1 0 6 .5 98 .3 i a .3 9 1 .0 1 2 6 .9 1 17 .0 1 70 .5March—— 109 .0 1 07.3 12lt.lt 92.8 1 06 .9 H /i.3 HO . 7 1 2 0 .7 331 .6 1 1 1 .7 1 3 0 .6 103.1 i a . 6 10lt.8 106.6 98.3 1 21.9 91 .1 1 2 6 .7 H 6 .8 1 70 .8A pril----- 1 09 .6 107.9 12U.5 9U.0 106.U U 6 .7 H O . 8 120 .8 131.7 1 H .8 129 .7 102.7 122.1 lOli. 8 1 0 6 .5 98 .1 123 .0 9 1 .1 126 .b H 6 .5 1 70 .3May-------- 111.0 1 09 .5 12U.7 9 5.5 1 07 .5 1 21 .5 H O .9 1 2 0 .9 132.2 1 H .8 1 27 .9 102.6 122.U lOli. 3 1 0 7 .0 9 7 .9 1 22 .8 91 .1 1 27 .1 1 17 .1 1 72 .5June------- 1 13 .2 112 .1 125 .2 9 8 .0 1 07 .7 131.it i n . i 121.lt 1 32 .5 H 1 .7 1 28. It 102.8 122.6 lOli. 3 1 07 .5 9 7 .5 123.1 9 1 .1 1 26 .8 H 6 .7 1 72 .6Ju ly ------- H b .8 1 13 .8 1 25 .8 99 .3 1 08 .7 135.2 H 2 .8 121 .3 133 .2 H I . 7 1 28 .7 102.8 123.0 105 .3 107 .7 9 8 .0 12b.2 9 1 .b 1 27 .7 H 7 .6 1 72 .7August---- 113 .1 111.8 1 26 .3 99 .9 109 .2 1 20 .7 1 13 .9 122.2 1 33.2 112 .1 1 29 .5 102.6 123.1* 105 .5 107 .7 9 8 .1 12b. 8 9 1 .5 1 28 .5 H 8 .6 1 72 .9September 1 13 .1 111.7 1 26 .6 101 .3 1 09 .8 H it .8 H 5.U 122.5 133.lt H 2 .2 1 30 .5 103.3 123.7 106.5 1 08 .3 9 9 .6 1 26 .0 9 2 .0 1 28 .6 1 18 .7 173 .0October— 113.1 1 11.7 1 26 .8 1 00 .8 H O . 7 113 .9 H 5 .3 122 .8 133.it 1 12 .0 132 .9 103.6 12I1.2 106.8 108 .2 100 .1 126.2 9 2 .1 132 .6 1 22 .9 1 73 .0November- 112 .9 1 H .3 1 27 .0 9 8 .8 1 11 .1 H 5 .8 135 .2 123 .0 133 .8 113.8 13k.3 103.8 12lt.5 1 07 .0 1 0 8 .b 1 00 . b 126.2 9 2 .1 133.2 123.5 173 .bDee anber- 112 .9 111.2 127.lt 98 .0 1 11 .3 H 7 .lt l i l t . 2 123 .5 13li.2 H 2 .0 1 36.1 idk.i 12k. 8 107.0 1 08 .6 100.3 126.b 9 2.2 133 .1 123 .3 1 7 b .l
1957$ Average 115.1* 113.8 1 3 0 .5 105 .2 1 H .8 H 8 .6 H 2 .9 125.6 135.2 H 3 .0 137.lt 10li. 6 1 27 .5 106.9 1 09 .0 99 .2 127.9 92 .1 1 36 .0 1 25 .8 1 78 .8January— 1 12 .8 111.1 1 28 .0 9 9 .0 H I . 2 H 6 .9 H 2 .7 123.8 13U.2 H 2 .3 1 38 .9 lOit.O 125.ll 106. b 1 08.b 98.9 126 .7 9 1 .9 1 33 .6 123 .8 17b.9February- 1 13.6 112 .0 1 29 .1 101.lt 121 .1 H 6 .5 H 3 .0 £2li.5 131i.2 H2.1* 1 39.3 105.0 1 25 .6 106.1 1 08 .6 98 .2 127 .2 9 1 .7 13b.b 12b .5 1 75 .8March------ 1 13.2 H l . l t 1 29 .8 1 00 .6 3 10 .7 H 6 .1 1 11 .6 12li.9 13U.U H 2 .lt 1 39 .2 lQlt.9 126.2 106.8 1 08 .8 9 9 .3 127.6 9 2 .2 135.1 1 2 5 .2 175 .3A pril----- 1 13 .8 112 .1 1 30 .1 1 02 .0 H 0 .5 H 8 .7 111.0 125.2 13U.5 112.it 1 38 .1 1 05 .1 126.lt 106 .5 10s . 8 98 .7 1 2 7 .3 9 2 .0 1 35 .5 1 25 .5 176 .8May-—— n u . 6 1 13 .0 130.lt 103 .7 HO.O 1 22 .5 1 09 .9 125.3 13li.7 H 2 .3 135.U lOlt.2 127.3 106.5 1 09 .0 98 .6 127 .8 9 2 .0 135.3 I2 5 .b 1 76 .8June------- 116.2 l i l t . 7 1 3 0 .6 106.9 1 10 .0 1 26 .8 1 09 .5 125.5 1 35 .0 1 12 .3 1 35.3 lOlt.6 1 27 .6 106.6 1 09 .1 9 8 .5 1 27 .8 91 .9 135.3 125.b 176 .8Ju ly ------- 1 1 7 .U 116 .1 1 30 .8 1 0 9 .5 H 0 .5 126 .9 H I . 7 125.5 135 .2 1 12.3 135 .9 lOlt.1 1 27 .9 1 0 6 .5 1 08 .8 9 8 .6 1 28.1 91 .9 135.8 125.6 1 80 .2August---- 117 .9 116.6 1 31 .0 111.9 U l . 5 121 .3 H 3 .8 125.7 135.lt H 3 .3 1 35 .7 1 03 .9 1 28 .0 106.6 1 08 .8 98 .6 128 .3 9 2 .0 135.9 1 25 .6 1 8 0 .6September 117 .0 H 5 .5 131.2 H 0 .3 H 3 .1 l i l t . 8 H 5 .0 126.3 135.7 H 3 .7 1 36 .8 lOlt.3 1 28 .3 107 .3 1 09 .3 99 .8 1 28 .1 9 2 .3 135.9 1 2 5 .5 1 81 .1October— 116.1: H it. 7 131.U 106.3 l i l t .2 l l l t .5 H 6 .2 126.6 136 .0 H 3 .8 1 37 .6 10l*.8 128 .7 107 .7 1 09.b 100 .6 128 .3 9 2 .5 135.8 125.b 1 81 .6November- 116.0 l l i t . l 1 31 .6 lQb.6 l l i t . 5 H lt.6 H 5 .6 126 .8 1 36.3 H it. 3 138 .0 I0lt.5 129.lt 107 .9 1 0 9 .b 100 .8 1 29 .0 9 2 .6 lbo .o 1 29 .7 182 .8Dec ember- 116.1 l i l t . 3 131 .8 1 06 .0 H lt.6 113 .9 l i l t . 9 127.0 136.7 11 It.3 1 38 .3 lOlt.9 1 29 .6 107 .6 1 09 .5 1 00 .1 129 .1 92 .3 138.9 1 28 .6 182 .b
1958 s Average 120.3 H 8 .8 133 .1 H 5 .1 H 3 .5 1 27 .1 H 2 .lt 1 27 .7 1 37.7 H 7 .0 13U.9 103 .9 131.lt 1 07 .0 1 08 .6 99 .1 129 .8 92.0 lb o .5 129 .7 188 .0January— 118.2 216.7 1 32 .5 210.2 l i l t . 6 121.9 113.1 1 27 .1 136 .8 H 5 .7 138.it 10l*« 2 129 .7 106.9 1 09 .0 98 .8 129 .3 91.9 138.7 1 2 8 .b 1 8 2 .bFebruary- 118.7 217.2 1 3 2 .6 112 .0 H lt.5 12lt.lt H 1 .3 127.3 1 37.0 115.9 137.2 io lt.9 1 29.9 106.8 1 09 .0 98.6 129 .5 92 .0 138 .5 1 27 .9 l8 5 .bMarch----- 1 20 .8 219.6 132 .7 H lt.lt H lt.1 130 .7 H 3 .8 1 27 .5 137 .1 H 5 .9 136 .7 1 03 .9 130 .7 106.8 1 08.9 98 .8 1 29 .5 91.9 138.7 128 .0 185 .9A pril------ 1 21 .6 120 .5 132 .7 H 5 .9 1 12 .5 1 36 .6 1 12 . lj 1 27 .7 137.3 1 16 .0 13li.2 lOit.O 130 .9 106.7 109 .1 98.2 1 29 .8 91.9 138.3 127 .6 1 86 .1
May-------- 1 21.6 120 .5 1 32 .8 116.6 H I . 8 137.it i n . 5 1 27 .8 1 37 .5 1 16.5 131 .6 lOit.O 130.9 1 06 .7 1 08 .9 9 8 .b 12f.7 92.1 138 .7 1 28 .0 1 86 .1
June------- 1 21 .6 120.lt 1 32 .9 H 8 .3 111 .7 13lt.3 H O .9 1 27 .8 1 37.7 116 .9 131 .7 1 0 li.l 131.3 106 .7 1 08 .8 9 8 .5 129 .8 91.9 138.9 1 28.0 1 87 .7Ju ly ------- 121 .7 1 20.5 1 32 .9 H 9 .2 1 1 2 .b 131.9 1 H . 8 127 .7 137. e 1 17 .0 132.3 lOit.O 131.2 106.7 1 08 .5 96 .6 129 .7 9 2 .0 lb 0 .3 129 .3 1 89 .5August---- 120.7 H 9 .2 1 32 .9 H 7 .7 H 3 .0 121*.9 H 2 .8 127 .9 138 .1 117 .5 133 .6 103.3 1 32 .1 106.6 108 .3 9 8 .5 130 .0 91 .9 l b l .o 1 30 .1 1 89 .5September 1 20.3 H 8 .7 1 33 .5 H 5 .8 l l i t . l 1 20 .7 1 15 .2 1 27 .9 138.2 118 .0 135.2 1 03.6 132.2 107 .1 108 .3 99.6 130.1 9 2 .0 l b l . 3 1 30 . b 1 89 .8
October— 119.7 U 8 .0 1 33 .9 H lt.6 l l l t .5 121 .0 H 3 .2 127 .9 138 .3 118 .1 1 35 .6 103.lt 132.lt 107 .3 107 .9 100.2 130.1 91.8 11*2.7 1 31 .8 190.b
November- 119.lt 117 .6 13U.0 1 13 .5 l l i t . 5 1 21 .1 H 2 .6 1 28 .0 1 3 8 .b 118 .1 1 35 .8 1 0 3 .5 132 .6 107.7 1 08 .5 100 .6 130.3 92 .3 lkk.5 1 35 .6 191 .1Dee ember- 118 .7 H 6 .8 131t.0 H 3 .0 l i l t . 3 120 .1 1 10 .7 1 28.2 1 38 .7 118.2 1 37 .0 1 03 .6 132.8 1 07 .5 1 08. b 100.2 1 30 . b 92 .3 lkh.3 133 .3 191 .8
1 / Includes in fa n ts ' wear, m ate ria ls fo r home sewing, and jew elry.2/ Includes re s ta u ra n t meals n ot shown se p ara te ly .3 / Includes house purchase, i n te r e s t , ta x e s , insurance, and upkeep, not shown s e p ara te ly .
43
Digitized for FRASER http://fraser.stlouisfed.org/ Federal Reserve Bank of St. Louis
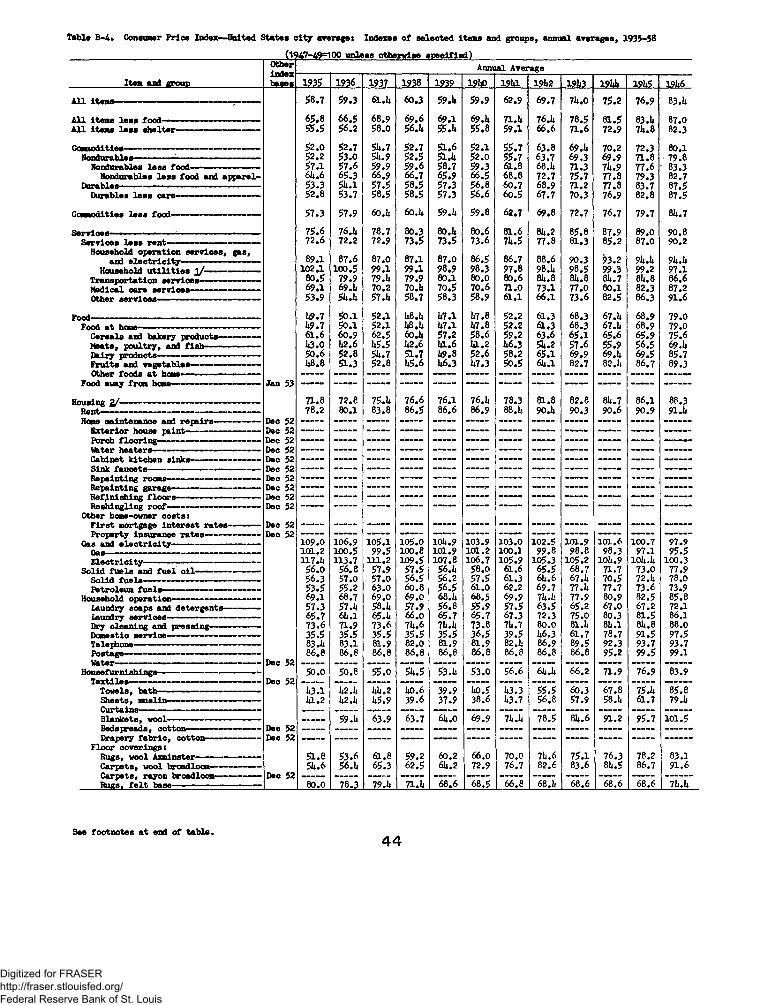
Table B -4 . Consumer P rice Index—-United S tates c i t y averages Indexes o f se le cted item s and groups, annual averages, 1935-58
(1947-49=100 un less otherwise s p e c ifie d )
Item and group
O ther Annual A verage
b a se s 1935 1 9 3 6 . 1937 1938 1939 191*0 191a 191(2 191(3 191J, 191(5 19W
A H item s— ----------------- — — --------------:----------- 5 8 .7 5 9 .3 61.1* 6 0 .3 59.U 5 9 .9 6 2 .9 6 9 .7 7l*.0 7 5 .2 7 6 .9 83.1*
A l l item s l e s s f o o d — ------------------- --— --------- 6 5 .8 6 6 .5 6 8 .9 6 9 .6 6 9 .1 69.1* 71.1* 76.1* 7 8 .5 8 1 .5 83.1* 87 .0A l l item s l e s s s h e l t e r ----------- — — — -------- 5 5 .5 5 6 .2 5 8 .0 56.1* 55.U 5 5 .8 5 9 .1 6 6 .6 7 1 .6 7 2 .9 7l*.8 82 .3
n*mmm.M it if t f l - . __ ____ _______ - - - ____ ___ 5 2 .0 5 2 .7 5U. 7 5 2 .7 5 1 .6 5 2 .1 5 5 .7 6 3 .8 69.1* 7 0 .2 7 2 .3 80 .1N ondurables-----------------—— -----------------— -------- 5 2 .2 5 3 .0 51*. 9 5 2 .5 51.1* 5 2 .0 5 5 .7 6 3 .7 6 9 .3 6 9 .9 7 1 .8 7 9 .8
N ondurables l e s s f o o d — — ----------- —•— - 5 7 .1 5 7 .6 5 9 .9 5 9 .6 5 8 .7 5 9 .3 6 1 .8 68.1* 7 1 .3 7l*.9 7 7 .6 ' 83 .3N ondurables l e s s f o o d and a p p a r e l- 614.6 6 5 .3 6 6 .9 6 6 .7 6 5 .9 6 6 .5 6 8 .8 7 2 .7 7 5 .7 7 7 .8 7 9 .3 8 2 .7
D urables--------- ----------- ----------------------- -------------- 5 3 .3 5 i* .l 5 7 .5 5 8 .5 5 7 .3 5 6 .8 6 0 .7 6 8 .9 7 1 .2 7 7 .8 8 3 .7 8 7 .5D urables l e s s c a rs — — — —— — — — S 2 .8 5 3 .7 5 8 .5 5 8 .5 5 7 .3 5 6 .6 6 0 .5 6 7 .7 7 0 .3 7 6 .9 8 2 .8 8 7 .5
Com m odities l e s s f o o d ------- ----------------------- — 5 7 .3 5 7 .9 60. 1* 60. 1* 59.1* 5 9 .8 6 2 .7 6 9 .8 7 2 .7 7 6 .7 7 9 .7 81*.7
S e r v ic e s — ------- — — ------------------------------- — 7 5 .6 76.1* 7 8 .7 8 0 .3 80. 1* 8 0 .6 8 1 .6 8U.2 8 5 .8 8 7 .9 8 9 .0 9 0 .8S e r v ic e s l e s s r e n t— — — — ------- 7 2 .6 7 2 .2 7 2 .9 7 3 .5 7 3 .5 7 3 .6 7l*.5 7 7 .8 8 1 .3 8 5 .2 8 7 .0 9 0 .2
H ousehold o p e r a t io n s e r v ic e s , g a s ,and e l e c t r i c i t y — — —— — — 8 9 .1 8 7 .6 8 7 .0 8 7 .1 8 7 .0 8 6 .5 8 6 .7 8 8 .6 9 0 .3 9 3 .2 9l*.l* 9U.1*
H ousehold u t i l i t i e s J[ / --------- ------- — 102*1 100.5 9 9 .1 9 9 .1 9 8 .9 9 8 .3 9 7 .8 98.1* 9 8 .5 9 9 .3 9 9 .2 9 7 .1T ra n sp o rta t io n s e r v ic e s --------------- ---------- 8 0 .5 7 9 .9 79.1* 7 9 .9 8 0 .1 80.0 80.6 81*. 8 81*. 8 81*.7 81*. 8 8 6 .6M ed ica l ca re s e r v ic e s — ----- — — ------- 6 9 .1 69.1* 7 0 .2 70.1* 7 0 .5 7 0 .6 7 1 .0 7 3 .1 7 7 .0 8 0 .1 82 .3 87 .2O ther s e r v io e s — ----- — - — — — ------- 5 3 .9 51*.l* 57.1* 5 8 .7 5 8 .3 5 8 .9 6 1 .1 6 6 .1 7 3 .6 8 2 .5 86.3 9 1 .6
Food----------------- --------- ------------------------------------------- 1(9.7 5 0 .1 5 2 .1 1*8.1* 1*7.1 1*7.8 5 2 .2 6 1 .3 6 8 .3 67.1* 6 8 .9 7 9 .0Food a t heme— — — — — ----- -------- U 9.7 5 0 .1 5 2 .1 1*8.1* 1*7.1 1*7.8 5 2 .2 6L .3 6 8 .3 67.1* 6 8 .9 7 9 .0
C e re a ls and bak ery p rod u cts— ----------- 6 1 .6 6 0 .9 6 2 .5 60. 1* 5 7 .2 5 8 .6 5 9 .2 6 3 .6 6 5 .1 6 5 .6 6 5 .9 7 5 .6M eats, p o u lt r y , and f i s h ------- --------------- k 3 .0 1*2.6 1*5.5 1*2.6 1*1.6 l a . 2 1*6.3 51*.2 5 7 .6 5 5 .9 5 6 .5 69.1*D airy p rod u cts— — — ------------- -— ---------- 5 0 .6 5 2 .8 51*.7 5 1 .7 1*9.8 5 2 .6 5 8 .2 6 5 .1 6 9 .9 69.1* 6 9 .5 8 5 .7F r u it s and v e g e ta b le s — — — — U 8.8 5 1 .3 5 2 .8 1*5.6 1*6.3 1*7.3 5 0 .5 61*.l 8 2 .7 82.1* 86.7 8 9 .3Other fo o d s a t h o m o - - ----------- — — — -------- — — — — — — — — -------- — — -------- - — - - — —
Food away from home— --------- --------------------- Jan 53 — — — ------- -- - — - — — — — --------- — — —
H ousing 2 / ----------------------------------------------------------- 7 1 .8 7 2 .8 75.1* 7 6 .6 76 .1 76.1* 78 .3 8 1 .8 8 2 .8 81*. 7 8 6 .1 88.3Rent------------------------------------------------------------------- 7 8 .2 80 .1 8 3 .8 8 6 .5 8 6 .6 8 6 .9 88.1* 90.1* 9 0 .3 9 0 .6 9 0 .9 91.1*Home m aintenance and r e p a ir s ------- — -------- Dec 52 — — — -------- — — — — — — - — — - — - — - — —
E x te r io r house p a in t— — — — -------------pAmmk — --------- ----------------- -■— —
Dec 52 Dec 52
- — - - — — — — -------- — — — “ — — — — —ruTOQ x i o o n i i g " "W ater h e a te r s — — —— — --------- --------- -- Dec 52 - ___ _ _____ _____ ______ ____- ______ _____ _____ _____ _____ ______ _______C a b in et k it ch e n s in k s ----------------------------- Dec 52
Dec 52------- - — — -------- — — — — — - — - — — — -
R ep a in tin g rooms--------------------------------------- Dec 52 — — — — — — — — — — — —R ep a in tin g garage----------- ------------------- — Dec 52 — ------- -- - — ** -------- — — - ------- -- — — — — — —— - — ----------R e f in is h in g f l o o r s ----------------------------------- Dec 52 - — - - — - — — — — — - — — — — - — —Re s h in g l in g r o o f ----------- ----------------------- — Dec 52 — — -------- --------- — — — - — - — — — — — — —
O ther home-owner c o s t s :F i r s t m ortgage in t e r e s t r a t e s ------------- Dec 52 — - — - - — — — — — - — — - — — — — - — - — — — —P rop erty in su ra n ce r a t e s ----------------------- Dec 52 - — — . . . . . ------- -- — - — --------- — — — -------- — — - - — . . . . . ----------
Gas and e l e c t r i c i t y -------------------------------— 1 0 9 .0 1 0 6 .9 i o 5 . i i o 5 . o 101*. 9 1 0 3 .9 1 0 3 .0 1 0 2 .5 1 0 1 .9 1 0 1 .6 1 0 0 .7 9 7 .9Gas— — — — — — — — ------------------------- 1 0 1 .2 1 0 0 .5 9 9 .5 1 0 0 .8 1 0 1 .9 1 0 1 .2 1 0 0 .1 9 9 .8 9 8 .8 9 8 .3 9 7 .1 9 5 .5E l e c t r i c i t y ----- — — ---------------— — 117.1* 1 1 3 .7 1 1 1 .2 1 0 9 .5 1 0 7 .8 1 0 6 .7 1 0 5 .9 1 0 5 .3 1 0 5 .2 10l*.9 10l*.li 100.3
S o l id f u e l s and f u e l o i l --------------------------- 5 6 .0 5 6 .8 5 7 .9 5 7 .5 56.1* 5 8 .0 61.6 6 5 .5 6 8 .7 71 .7 7 3 .0 7 7 .9S o l id f u e l s — — --------------- — ------------------- 5 6 .3 5 7 .0 5 7 .0 5 6 .5 5 6 .2 5 7 .5 6 1 .3 61*.6 67.1* 7 0 .5 72.1* 7 8 .0P etroleum f u e l s — ----------------------- ------------ 5 3 ,5 5 5 .2 6 3 .0 60.8 5 6 .5 6 1 .0 6 2 .2 6 9 .7 77.1* 7 7 .7 7 3 .6 7 3 .9
H ousehold o p e r a t io n ------- — — — -------------- 6 9 .1 6 8 .7 6 9 .0 6 9 .0 68.1* 68.5 6 9 .9 7l*.l* 7 7 .9 8 0 .9 8 2 .5 8 5 .8Laundry soaps and d e te r g e n ts --------------- 5 7 .3 57.1* 58.1* 5 7 .9 5 6 .8 5 5 .9 5 7 .5 6 3 .5 6 5 .2 6 7 .0 6 7 .2 72 .1Laundry s e r v ic e s — --------------------------- 6 5 .7 61* .1 65.1* 6 6 .0 6 5 .7 6 5 .7 6 7 .3 7 2 .3 7 5 .0 80 .3 8 1 .5 86 .1Dry c le a n in g and p r e s s in g — ----------------- 7 3 .6 7 1 .9 7 3 .6 7U .6 7l*.l* 7 3 .8 71*.7 8 0 .0 81.1* 81*.1 81*. 8 8 8 .0D om estic s e r v ic e --------------------------------------- 3 5 .5 3 5 .5 3 5 .5 3 5 .5 3 5 .5 3 6 .5 3 9 .5 1*6,3 6 1 .7 7 8 .7 9 1 .5 9 7 .5T eleph on e— ------- -— - — --------- --------- — 83.1* 8 3 .1 8 1 .9 8 2 .0 8 1 .9 8 1 .9 82.1* 8 6 .9 8 9 .5 9 2 .3 9 3 .7 9 3 .7P ostage ---------------------------------------------------------
r u - co8 6 .8 8 6 .8 8 6 .8 8 6 .8 8 6 .8 8 6 .8 8 6 .8 8 6 .8 8 6 .8 9 5 .2 9 9 .5 99 .1
W ater— — — — — — — —H ou sefu rn ish in gs------------------- --------- ----- --------
U6C5 6 .0 5 0 .8 5 5 .0 1 ^ 5 53.1* 5 3 .0 ~56*6 ~ 6 W i ~ ii~ 2 7 1 .9 7 6 .9 8 3 .9...... . .. Dec 52
T ow e ls, ba th -----------------------------------— 1*3.1 1*2.1* 1*1*.2 1*0.6 3 9 .9 1*0.5 1*3.3 55.5 6 0 .3 6 7 .8 75.1* 8 5 .8S h e e ts , m u slin ----------- ------------- -------------- 1*1.2 1*2.1* 1*5.9 3 9 .6 3 7 .9 3 8 .6 1*3.7 5 6 .8 5 7 .9 58.1* 6 1 .7 79.1*
B la n k ets , w oo l— ---------------------— ---------- ____ _ 59.1* 6 3 .9 6 3 .7 ~ U ~ 0 6 9 .9 7 l * i 7 8 .5 "5 * * 6 9 1 .2 9 5 .7 1 0 1 .5B ed spreads, c o t t o n — — --------------- ------ Dec 52 -------- . — - - - — - — — — — — — - — — — . — — — — -D rapery f a b r i c , c o t to n — — — — — Dec 52 — — — — — — -------- - — — -------- — — - — -------- — —
F lo o r c o v e r in g s :R ugs, w oo l A xm inster— — — 5 1 .8 5 3 .6 6 1 .8 5 9 .2 60.2 6 6 .0 7 0 .0 7i*.6 75 .1 7 6 .3 78 .2 83.1C a rp e ts , w o o l broad loam--------------------- 5U .6 56.1* 6 5 .3 6 2 .5 61*. 2 7 2 .9 7 6 .7 8 2 .6 8 3 .6 81*.5 8 6 .7 9 1 .6C a rp e ts , ra yon broadloom ------------------- Dec 52 — — - . . — . — — — -------- — . — . — — — — — — —R ugs, f e l t b a se — --------------------------------- 8 0 .0 7 8 .3 79.1* 71.1* 6 8 .6 6 8 .5 6 6 .8 68.1* 6 8 .6 6 8 .6 6 8 .6 7l*.l*
See foo tn otes a t end o f tab le,4 4
Digitized for FRASER http://fraser.stlouisfed.org/ Federal Reserve Bank of St. Louis

Table B -b. Consumer P rice Index—united States c i t y averages Indexes otf s e le c te d items and groups, annual averages, 1935-58 (C ont'd )(1947-49=100 unless otherwise s p e c ifie d )
Item and group
Other Annual Average
b a ses 19l»7 19h8 191|9 1950 1951 1952 1953 195U 1955 1956 1957 1958
A l l item s----------- — — — — — ------------------------- -- 9 5 .5 1 02 .8 1 01 .8 1 0 2 .8 1 1 1 .0 1 1 3 .5 n b . b n b . 8 l l b . $ 1 1 6 .2 1 2 0 .2 1 2 3 .5
A l l item s l e s s fo o d — ----------- ------------------------- 9 5 .1 1 0 1 .9 1 0 3 .0 10U.2 n o .8 3 1 3 .5 115 .7 1 1 6 . b 1 1 6 .7 3 1 8 .8 1 2 2 .8 1 2 5 .5A l l item s l e s s s h e l t e r — ----- — -------— - — — 9 5 .6 1 0 3 .1 1 0 1 .3 1 0 2 .0 n o . $ 1 1 2 .7 1 1 3 .1 1 1 3 .0 112J* l l b .O 117 .8 1 2 1 .2
Commodities— — ------------------------------------------------- 9 6 .3 1 0 3 .2 1 0 0 .6 1 0 1 .2 110 .3 1 1 1 .7 111 .3 1 1 0 .2 1 0 9 .0 1 1 0 .1 1 1 3 .6 1 16 .3N ondurable s----------- ------------------- ----------------- — 9 6 .3 303 .3 1 0 0 .3 1 0 0 .9 1 1 0 .3 1 1 1 .7 l l l . b 1 1 1 .3 1 1 0 .$ 1 1 2 .0 1 1 5 .5 1 1 8 .6
N ondurables l e s s f o o d — ------- ------- - 9 5 .7 3 0 3 .1 1 0 1 .1 1 0 0 .9 1 0 8 .$ 10 9 .1 1 1 0 .1 1 1 0 .6 1 1 0 .6 1 1 3 .0 1 1 6 .1 1 1 6 .9N ondurables l e s s fo o d and a p p a r e l- 9 lt .2 1 02 .8 1 0 3 .0 1 0 3 .7 1 1 0 .1 1 1 2 .3 1 1 5 .1 1 1 6 .3 1 1 6 .7 1 1 9 .6 1 2 b .2 1 2 5 .6
D urables----------------------- — ----------- — — — -------- 9U .9 1 0 1 .8 10 3 .3 3O b .b 112.1* 1 1 3 .8 3 1 2 .6 1 0 8 .3 1 0 $ .l 1 0 5 .1 1 0 8 .8 n o . 5D urables l e s s c a r s — — — ----------------------- 9 6 .8 1 0 3 .0 1 0 0 .2 l O l .b 1 1 1 .1 1 0 8 .3 1 0 7 .0 l O b . l 1 0 1 .3 1 0 0 .9 1 0 2 .7 1 0 3 . b
Com m odities l e s s f o o d ----------- — - — -------------- 9 5 .7 10 2 .9 1 0 1 .$ 3 01 .3 108 .9 1 0 9 .8 1 1 0 .0 3 0 8 .6 1 0 7 .5 1 0 8 .9 31 2 .3 113 .b
S e r v ic e s --------- ----------------------------------------- ------- — 9 b .5 3 0 0 . b 105.1 1 0 8 .$ l l l * . l 1 1 9 .3 1 2 b .2 1 2 7 .5 1 2 9 .8 1 3 2 .6 1 3 7 .7 l b 2 .bS e r v ic e s l e s s r e n t ------------- — - — ------------- 9ti.7 1 0 0 .1 1 0 $ . 2 108 .1 111*. 6 1 2 0 .1 1 2 b .6 1 2 7 .7 1 3 0 .1 1 3 3 .0 1 3 8 .6 l b 3 .8
H ousehold o p e r a t io n s e r v ic e s , g a s ,and e l e c t r i c i t y — ----------------------------- 9 6 .6 9 9 .9 3 0 3 .6 1 0 $ .9 109.1* 113.1* 1 1 7 .1 1 1 8 .1 1 2 0 .7 123 .9 1 2 7 .b 1 3 1 .b
H ousehold u t i l i t i e s ----------------------- 9 7 .3 9 9 .7 1 0 3 .0 1 0 $ .l 106.1* 109 .3 1 1 2 .0 1 12 .9 1 1 5 .1 1 1 6 .8 11 9 .1 1 2 3 .6T ra n sp o rta t io n s e r v ic e s ------- --------------- -- 8 9 .3 9 9 .7 1 1 1 .0 1 1 3 .2 1 2 9 .3 138.1* lb 7 .3 15 3 .7 1 5 3 .9 1 5 6 . b 1 6 3 .9 1 7 b . lM ed ica l ca re s e r v i c e s - — ----------— ------- 9 b .$ 1 0 0 .9 10b .6 1 0 7 .0 112.1* 1 1 9 .$ 12 3 .8 1 2 7 .5 1 3 1 .3 1 3 6 .b l b 2 .2 11*9.2O ther s e r v ic e s — ----------- — — ------------— 9 7 .1 1 0 0 .2 1 0 2 .7 103.1* 1 0 9 .1 1 1 1 .3 1 1 3 . b 1 1 6 .2 1 1 3 . b 1 2 0 .3 1 2 6 .0 1 2 9 .6
Food— - — -------------------------------------------------------- -- 9 5 .9 l O b . l 1 0 0 .0 1 0 1 .2 3 1 2 .6 l l b . 6 1 1 2 .8 1 1 2 .6 1 1 0 .9 1 1 1 .7 H $ .b 12 0 .3Food a t home— ------------------------------------------- 9 5 .9 lO lu l 1 0 0 .0 1 0 1 .2 1 1 2 .6 111*.6 1 1 2 .5 111 .9 1 0 9 .7 1 1 0 .2 113 .8 1 1 8 .8
C erea ls and bak ery p rod u cts— — -------- 9U.0 1 0 3 . b 1 0 2 .7 101*.5 l i b . o 116 .8 1 1 9 .1 1 21 .9 1 2 3 .9 125.6 130*5 1 3 3 .1M eats, p o u lt r y , and f i s h ----------------------- 9 3 .5 1 0 6 .1 1 0 0 .5 10i*.9 1 1 7 .2 1 1 6 .2 1 0 9 .9 1 0 8 .0 1 0 1 .6 9 7 .1 1 0 5 .2 1 1 5 .1D airy p rod u cts— --------------------------------- 9 6 .7 10 6 .3 9 6 .9 9 5 .9 1 0 7 .0 m . $ 1 0 9 .6 3 0 6 .1 1 0 5 .9 1 0 8 .7 111 .8 1 1 3 .5F r u its and v e g e ta b le s ----------------------------- 9 7 .6 1 0 0 .5 101 .9 9 7 .6 1 0 6 .7 1 1 7 .2 1 1 3 .5 1 1 1 .9 1 1 3 .5 1 1 9 .0 1 1 3 .6 1 2 7 .1Other f o o d s a t home— — — — — — 1 0 0 .1 1 0 2 .5 9 7 .$ 1 0 1 .2 l l b . 6 1 0 9 .3 1 1 2 .2 l l b . 8 1 1 1 .$ 1 12 .3 1 1 2 .9 112 .b
Food away from heme— — --------------------------- Jan 53 — — — — — 1 0 0 .6 1 02 .3 1 0 3 . b 1 0 5 .b 109 .3 1 1 2 .6
H ousing 2 / ---------------------------------------------------------- 9 5 .0 1 0 1 .7 1 0 3 .3 1 0 6 .1 112.1* 111*.6 1 1 7 .7 1 1 9 .1 1 2 0 .0 1 2 1 .7 1 2 5 .6 12 7 .7Rent---------------------------------------------------------------— 91*. U 1 0 0 .7 1 0 $ .0 1 0 8 .8 1 1 3 .1 1 1 7 .9 1 2 b . l 1 2 8 .$ 1 3 0 .3 1 3 2 .7 1 3 5 .2 1 3 7 .7Home m aintenance and r e p a ir s ----------- — — Dec 52 1 0 1 .8 1 0 3 .6 3 0 5 .9 1 1 0 .3 1 1 5 .0 1 1 6 .9
E x te r io r house p a in t ------------------- — — — Dec 52 — — — — — — -------- . . . . . 1 0 0 . b 1 0 3 .0 1 0 3 .6 1 0 8 .6 1 1 5 .3 1 1 7 .2P orch f l o o r i n g ------------------------------------------- Dec 52 --- ----- — - — — — — --------- 1 0 0 .7 101 .8 3 0 5 .0 1 0 7 .8 1 0 9 .6 108 .8Water h e a te r s — - — ----- ----------------------------- Dec 52 — ----- — — — — — 1 0 1 .2 1 0 0 .9 1 0 1 .9 1 0 b .$ 1 0 5 .b 1 0 b .9C a b in et k it ch e n s in k s----------------------------- Dec 52 ---- --- — — — ------- -- 100 .7 101 .3 102 .3 1 0 6 .2 1 0 8 .5 1 0 5 .6S ink fa u c e t s -------------------------------------------— Dec 52 — — — — 1 0 1 .8 1 0 2 .6 1 0 7 .0 1 1 6 .9 12 2 .8 1 2 6 .2R e p a in tin g room s— Dec 52 — — -------- - — - — — 10b .7 1 0 9 .6 1 1 3 .5 1 1 3 .7 1 2 6 .2 1 3 1 .3R ep a in tin g garage------------------------------------- Dec 52 ---- --- -------- — - — - — -------- 1 0 $ . l 1 1 0 .7 l l b . 7 1 2 0 .$ 1 3 2 .6 1 1 0 .2
1 0 2 .1 10b .9 1 0 8 .6 1 1 3 .3 1 1 6 .9 1 1 7 .8m i i n i sn in g i x o o r s — — — ——— —Re s h in g lin g r o o f — — — ----------------- — Dec 52 ---- -- — — — — —— - -------- — 1 0 3 .9 1 1 0 .2 1 1 3 .9 12 1 .7 1 2 7 .6 1 32 .7
Other home-owner c o s t s xF i r s t m ortgage in t e r e s t r a t e s ----- — Dec 52 --------- — — - — — - — — --------- — 10b .3 1 0 $ . l 1 0 5 .5 1 0 8 .5 11 5 .3 ( b / )P rop erty in su ra n ce r a t e s ----------------------- Dec 52 — — — ------- - - - - — -------- — - — 3 0 0 .0 9 6 .7 9 b .9 9b .8 9 7 .8 lO S .b
Gas and e l e c t r i c i t y ------------------------------------- 9 7 .6 1 0 0 .0 1 0 2 .$ 1 0 2 .7 1 0 3 .1 101*. 5 1 0 6 .6 1 0 7 .9 1 1 0 .7 1 1 1 .8 1 1 3 .0 1 1 7 .0Gas— — — — — — — — ----------------------------- 9 6 .3 9 9 .7 1 0 3 .9 10l*.3 303 .8 10$ .8 1 0 9 .1 1 1 1 .2 1 1 5 .6 1 1 7 .5 1 1 9 .5 1 2 6 .6
9 9 .1 3 0 0 .0 1 0 0 .9 1 0 1 .2 1 0 2 .0 1 0 3 .0 1 0b .3 1 0 b .7 1 0 6 .1 1 0 6 .5 1 0 6 .9 1 0 8 .2S o l id f u e l s and f u e l o i l 8 8 .8 3 0 b . b 106 .8 1 1 0 .$ 116.1* 1 18 .7 1 2 3 .9 1 2 3 .5 1 2 5 .2 1 3 0 .7 1 3 7 .b 1 3 b .9
S o l id f u e l s ------------------------------------------------- 8 9 .0 1 0 3 .5 3 0 7 .6 1 1 1 .6 1 1 7 .2 119 .3 1 2 b .b 1 2 3 .0 1 2 3 .2 1 2 8 .2 1 3 5 .1 1 3 6 .3P etroleum f u e l s ----------------------------------------- 86 .3 1 0 9 .0 1 0 b .6 1 0 $ .6 1 1 1 .6 l l b . l 1 1 9 .3 1 2 0 .7 1 2 b .5 1 3 0 .2 1 3 6 . b 1 2 8 .9
H ousehold o p e r a t io n -----------------------— ---------- 9 7 .2 1 0 2 .6 1 00 .1 1 0 1 .2 1 0 9 .0 111 .8 115 .3 1 17 . b 1 1 9 .1 1 2 2 .9 1 2 7 .5 1 3 1 .bLaundry soaps and d e te r g e n ts --------------- 103 .8 1 0 6 .6 8 9 .$ 81*.$ 96.1* 8 9 .9 8 9 .3 9 3 .6 9 5 .2 9 7 .6 1 0 2 .1 105 .8laundry s e r v ic e s ----------- --------------------------- 9 b .2 1 0 0 .0 1 05 .7 108.1* 116 .3 1 1 8 .9 12 3 .3 1 2 b .6 1 2 6 .7 1 3 3 .2 137 .b lb 2 .0Dry c le a n in g and p r e s s in g — — — 9 6 .2 3 0 1 .0 1 0 2 .8 101*.$ 311 .3 112 .8 115 .8 1 1 6 .$ 1 1 3 .2 122 .b 1 2 7 . b 1 2 8 .7D om estic s e r v ic e — -------------- ------------— ------------ 9 8 .9 100 .3 1 0 0 .8 1 0 0 .9 1 0 $ . l 1 1 2 .9 1 20 .0 12 1 .7 1 2 2 .5 1 2 5 .9 1 3 0 .6 1 3 b .$Telephon e -------------------------------------- — ------------ --------- 9 5 .3 1 0 0 .2 1 0 b .$ 1 1 2 .$ 111*.9 1 1 9 .0 1 2 3 .2 1 2 1 .b 1 2 0 .0 1 2 1 .5 12 3 .8 1 2 7 . bP ostage ---------------------------------------------------------- — — 9 7 .b 97.1* 1 0 $ . l 1 0 $ .9 1 0 8 .1 11 9 .1 1 2 0 .8 1 2 9 .9 1 2 9 .9 1 2 9 .9 1 3 0 . b 1 3 9 .9WfttOr~ --- -----■■ Dec 52 - — - — — - -------— -------— — — 1 01 .3 1 0 7 .1 1 1 6 .6 1 2 0 .5 1 3 0 .1 ( b / )
H ou se fu rn ish in gs ------------------------------------------------------ 9 7 .2 3 0 3 .2 9 9 .6 1 0 0 .3 1 1 1 .2 1 0 8 .$ 1 0 7 .9 1 0 6 .1 l O b . l 1 0 3 .0 1 0 b .6 10J .9T e x t i l e s -------------------------------------------------------------------- Dec 52 — — — — 1 0 6 .3 3 0 0 .2 9 8 .7 9 b . b 9 2 .9 9 b .5 9 5 . b 9 3 .9
T ow els , ba th ---------— -------------------------------------- 9 9 .2 1 0 0 .6 10 0 .3 101*. 8 1 20 .3 1 1 6 .8 l l b . 3 1 1 2 .1 11 0 .1 l l O .b 1 0 7 .9 1 0 8 .1S h e e ts , m u slin -------------- ---------------- — — — 1 0 0 .1 105 .7 9 b .2 9 7 .3 1 1 6 .7 1 0 2 .1 9 7 .9 8 7 .5 8b .8 8 9 .2 9 2 .0 8 8 .7C u rta in s ----------------------- -— — - — ----------------- 1 0 3 . b 10 5 .2 9 1 .3 9 2 .9 1 0 9 .6 101* .8 1 0 $ .8 1 0 2 .1 1 0 0 .8 30b.O 1 0 3 .2 9 8 .3B la n k ets , w oo l— — ----------------— - — — 1 0 0 . b 9 9 .1 1 0 0 .6 1 0 6 .6 132 .3 1 2 $ .6 12b .7 1 2 3 .9 1 2 3 .2 1 2 5 .5 1 2 6 .3 125 .3B edspreads, c o t to n — — — — — --------- Dec 52 — — — — — — 1 0 0 .$ 9 9 .3 9 9 .8 9 9 .8 1 0 0 .3 1 0 0 .9D rapery f a b r i c , c o t to n — ------------------------ Dec 52 - — - - — - — — — ----------- 98 .3 9 5 .9 9 b .3 93 .8 9 b .2 9 b .9
F lo o r c o v e r in g s :Rugs, w oo l A xm inster— — ------------— 9 b .9 1 0 1 .0 lOb.O 121.1* 151*.$ 11*0.6 11*2.0 11*2.0 l b 3 .7 l b 7 .2 1 5 5 .1 1 5 3 .2C arpet 8 , w oo l broad loom — — ----------------- 101 .3 97 .8 1 0 1 .0 1 1 2 .8 1 3 5 .1 1 1 6 .$ 1 1 7 .b 1 1 2 .6 l i b . 2 1 1 8 .8 1 2 b . 9 12 6 .1C a rp ets , ra y on broadloom — — — ------- Dee 52 — . . . . . --------- -- — — 1 0 3 .6 100.1* 9 7 .6 9 5 .5 9 5 .3 9 6 .5 9 5 .6 9 2 .1Rugs, f e l t b a se -------— — — — — — 9 7 .1 1 0 2 .1 1 0 0 .8 9 7 .9 1 0 1 .$ 1 0 $ .$ 1 0 8 .7 1 1 5 .2 1 1 3 .b 1 2 1 .2 1 2 5 .9 1 2 7 .9
See foo tn otes a t end o f tab le4 5
Digitized for FRASER http://fraser.stlouisfed.org/ Federal Reserve Bank of St. Louis
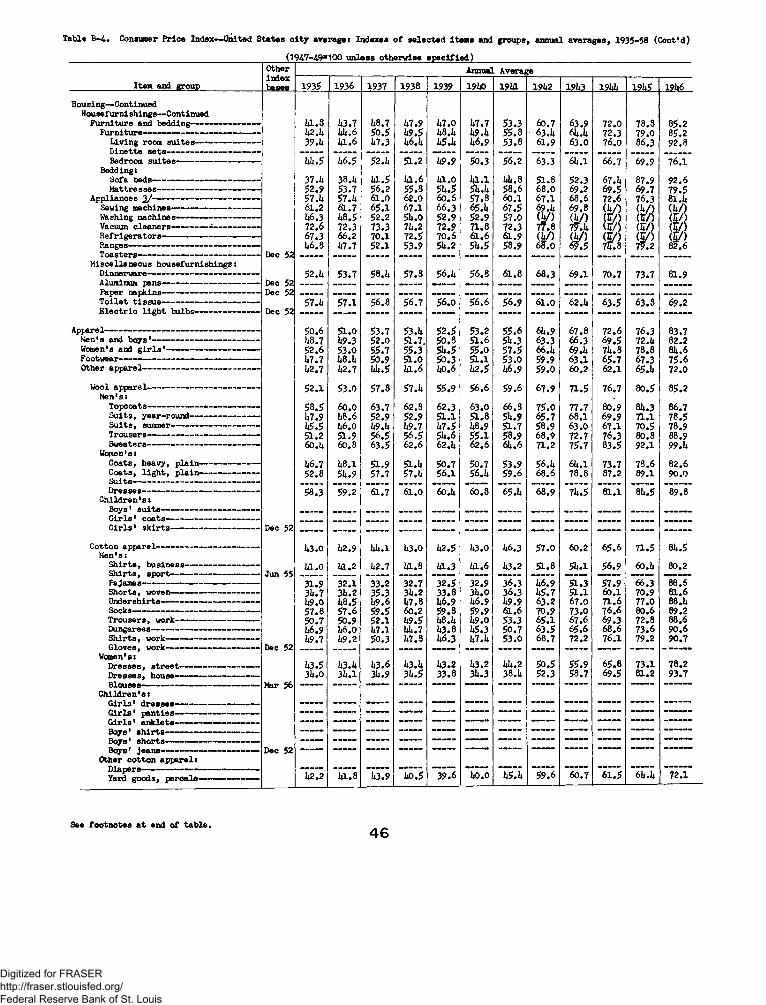
T a ble B -4 . Consumer P r ic e Index— U nited S ta te s c i t y a v e ra g e : In dexes o f s e le c t e d item s and g ro u p s , annual a v e ra g e s , 1935-58 (C o n t 'd )
(1947-49=100 u n le s s o th e rw ise s p e c i f i e d )
Item and group
H ousing— ContinuedH ousefur n i sh in g s— Continued
F u rn itu re and bedd in g---------F u rn itu re ----- ----- --------------- --
L iv in g room s u it e s -----------------D in e tte s e t s ----------- -----------------Bedroom s u it e s -------------------------
B edding:S ofa beds-----------------------------------M attresses ---------------------------------
A p p lia n ces 2 / -----------------------------------Sewing m achines---------------------------Washing m ach in es-Vacuum c le a n e r s ---------R e f r ig e r a to r s -------------R anges-T o a ste rs -----------------------------------------
M isce lla n e o u s h o u s e fu r n is h in g s :Dinnerw are-------------------------------------Aluminum p an s-Paper napkins---------------------------------T o i l e t t i s s u e ---------------------------------E l e c t r i c l i g h t b u lb s -------------------
A pparel------------------ — —M en's and b o y s '-------Women's and g i r l s ' -F ootw ear-------------O ther a p p a re l—
Wool a p p a re l-------------------------------------M en 's :
T op co a ts ----------------------- ------------S u it s , y ea r-rou n d -------------------S u it s , summer---------------------------T rou sers -------------------------------------Sw eaters--------------------------------- —
W omen's:C oa ts , h eavy , p la in ---------------C oa ts , l i g h t , p la in ---------------Suits-------------------------------------------D resses ---------------------------------------
C h ild r e n ’ s :B oy s ' s u i t s -------------------------------G i r l s ' c o a t s -----------------------------G i r l s ' s k i r t3 ---------------------------
C otton a p p a re l--------------Men' s :
S h ir t s , b u s in e s s - S h ir t s , s p o r t -
S h o r ts , woven— -----------------------U n d ersh irts— ---------------------------
T ro u se rs , w ork -Dungarees---------------S h ir t s , work---------------G love8 , work-------------------
Women's:D re sse s , s t r e e t -------------D re sse s , house--------- ------B lo u s e s -
C h ild r e n 's :G ir l s ' d r e s s e s -G i r l s ' p a n t ie s ------G i r l s ' a n k le ts ------B oy s ' s h i r t s — — —B oy s' s h o r t s ----------B oy s ' j e a n s -
Other c o t t o n a p p a r e l : D ia p e rs - Yard g o o d s , p e r c a le -
O therin d e xbssep
Dec 52
Dec 52 Dec 52
Dec 52
Dec 52
Jun 55
Dec 52
Mar 56
Dec 52
Annual A verage
1935 1936 1937 1938 1939 191*0 191a 191*2 191(3 191*1* 191*5 191*6
l a . s 1*3.7 1*8.7 1*7.9 1*7.0 1*7.7 53.3 60.7 63.9 72.0 78.8 85.2Ii2.lt 1*1*.6 50.5 1*9.5 1*8.1* 1*9.1* 55.8 63.1* 61*.1* 72.3 79.0 85.239 .U 1*1.6 1*7.3 1*6.1* 1*5.1* 1*6.9 53.8 61.9 63.0 76.0 8 6 .3 92.8lth.5 ~ 6 . 5 ~52.h 51.2 1*9.9 50.3 ’ 56~2 63.3 ~6k~l ~66.7 69.9 76.137.U 38.1* i a .5 la.6 ia.o la. 1 1*1*.8 51.3 52.3 67.1* 87.9 92.652.9 53.7 56.2 55.8 5U.5 51*.1* 58.6 68.0 6 9 .2 69.5 69.7 79.557.U 57.1* 61.0 62.0 6 0 .6 57.3 60.1 67.1 68.6 72.6 76.3 81.1*61.2 61.7 65.1 67.1 66.3 65.1* 67.5 69.1* 69.8 (V) 88
(1*/)1*6.3 1*8.5 52.2 51*.0 52.9 52.9 57.0 W ) (1*/) (IT/)72.6 72.3 73.3 71*.2 72.9 71.8 72.3 77.8 7?.l* w ) (IT/) (CO67.3 66.2 70.1 72.5 70.6 61.6 61.9 (U/) (1*/) or/) (IT/) (£/)1*6.8 1*7.7 52.1 53.9 51*.2 51*.5 58.9 6F.0 6 J .5 7H.8 7?.2 82.6
52.U 53.7 58.1* 57.3 56.1* 56.8 6 1 .8 68.3 6 9 .1 70.7 73.7 81.9
57.1* 57.1 56.6 56.7 56.0 *56*6 "56 9 61.0 6 2 .U ~63’5 ~6~f. 8 69.2
50.6 51.0 53.7 53.1* 52.5 53.2 55.6 61*.9 67.8 72.6 76.3 83.71*8.7 1*9.3 52.0 51.7. 50.8 51.6 51*.3 63.3 66.3 69.5 72.1* 82.252.6 53.0 55.7 55.3 5U.5 55.0 57.5 66.1* 69.1* 71*. 8 78.8 81*.61*7.7 1*8.1* 50 .9 51.0 56.3 5l.l 53.0 59.9 63.1 65.7 67.3 75.61*2.7 1*2.7 1*1*.5 ia.6 1*0.6 1*2.5 1*6.9 59.0 6 0 .2 62.1 65.1* 72.052 .1 53.0 57.8 57.1* 55.9 56.6 59.6 67.9 71.5 76.7 80.5 85.258.5 6 0 .0 63.7 62.8 62.3 63.0 66.3 75.0 77.7 80.9 81*.3 86.71*7.9 1*8.6 52.9 52.9 51.1 51.8 5U.9 65.7 68.1 69.9 71.1 78.51*5.5 1*6.0 1*9.1* 1*9.7 1*7.5 1*8.9 51.7 58.9 63.0 67.1 70.5 78.951.2 51.9 56.5 56.5 5i*.6 55.1 58.9 68.9 72.7 76.3 80.3 88.96 0 .U 6 0 .8 63.5 6 2 .6 62.1* 62.6 61*.6 71.2 75.7 83.5 92.1 99.1*1*6.7 1*8.1 51.9 51.1* 50.7 50.7 53.9 56.1* 61*.l 73.7 78.6 82.652.8 51*.9 57.7 57.1* 56.1 56.1* 59.6 68.6 78.8 87.2 89.1 90.058.3 59.2 61.7 61.0 6oI *6ol8 ”68*9 7 k .5 81.1 ~8h .5
1*3.0 1*2.9 l*l*.l 1*3.0 1*2.5 1*3.0 1*6.3 57.0 6 0 .2 65.6 71.5 81*.51*1.0 1*1.2 1*2.7 la.8 l a . 3 ia.6 1*3.2 51.8 5U.1 56.9 6 0 .1* 8 0 .2
31.9 32.1 33.2 32.7 32.5 32.9 36.3 ~h6.9 51.3 *57.9 66.3 1ST31*. 7 31*. 2 35.3 3l*.2 33.8 3l*.0 36.3 1*5.7 51.1 6 0 .1 70.9 81.61*9.0 1*8.5 1*9.6 1*7.8 1*6.9 1*6.9 1*9.9 63.2 67.0 71.6 77.0 88.1*57 .8 57.6 59.5 6 0 .2 59.8 59.9 61.6 70.9 73.0 76.6 80.6 89.250 .7 50.9 52.1 1*9.5 1*8.1* 1*9.0 53.3 65.1 67.6 69.3 72.8 88.61*6.9 1*6.0 1*7.1 1*1*.7 1*3.8 1*5.3 50.7 63.5 65.6 68.6 73.6 90.61*9.7 1*9.2 50.3 1*7.3 1*6.3 1*7.1* 53.0 68.7 72.2 76.1 79.2 90.7
1*3.5 1*3.1* 1*3.6 1*3.1* 1*3.2 1*3.2 itl*.2 50.5 55.9 65.8 73.1 78.23l*.0 3l*.l 3U.9 3l*.5 33.8 3l*.3 38.1* 52.3 58.7 69.5 81.2 93.7
— — — — — — — — — — — —
U2.2 "Hi's
1 | Os
i ! <3
1 1 -3
1 1
"Ho’ 5
1 1 sO
! i o\
I \
n i i
iSi
1 !
•oi
ll
~h5~.h "5 9 .6 6 o .7 ~6l~5 61*.1* "*72.1
See f o o tn o te s a t end o f ta b le ,4 6
Digitized for FRASER http://fraser.stlouisfed.org/ Federal Reserve Bank of St. Louis

T a b le B-U . Consumer P r ic e In d e x — U nited S ta te s c i t y a v e r a g e : In d ex es o f s e le c t e d item s and g r o u o s , annual a v e ra g e s , 1935-58 (C o n t 'd )
(19^7-4.9=100 u n le s s o th erw ise s p e c i f i e d ) Other Annual Average
Item and group
H ousing— ContinuedH ousef u r n i sh in ge— Continued
F u rn itu re and bedd ing-------------------F u rn itu re ---------------------------------------
L iv in g room s u it e s -D in e tte s e t s -----------------------------Bedroom s u it e s -------------------------
B edding:S ofa beds--------------------------— —M a ttresses ---------------------------------
A p p lia n ces 2 / -----------------------------------Sewing m achines---------------------------Washing m achines— --------------------Vacuum c le a n e r s ---------------------------R e f r ig e r a to r s ---------------Ranges-----------------------------T o a s te r s -
M isce lla n e o u s h o u s e fu rn is h in g s : D innerw are-Aluminum pans-------Paper napkins-------T o i l e t t i s s u e -E l e c t r i c l i g h t b u lb s -------------------
A p parel-------------------------M en's and b o y s '------Women's and g i r l s 'Footw ear-------------------Other a p p a re l----------
Wool a p p a re l-----------------------------------------------M en 's :
T o p coa ts ----------------------------------------------S u it s , y ea r-rou n d --------------------- -------S u it s , summer-------------------------------------T rou sers -----------------------------------------------S w eaters----------------------------------------------
Women's:C oa ts , heavy , p la in -------------------------C oa ts , l i g h t , p la in -------------------------
D resses-------------------------------------------------C h ild r e n 's :
B oy s' s u i t s -----------------------------------------G ir l s ' c o a t s ---------------------------------------G ir ls* s k i r t s -------------------------------------
C otton a p p a re l------------M en 's :
S h ir t s , b u sin ess-S h ir t s , s p o r t ------Pajamas------------------S h o r ts , woven------U n dersh irts----------
T ro u se rs , work----------------------D ungarees----------------------- --------S h ir t s , work----- --------------------G lov es , work--------------------------
Women's:D re sse s , s t r e e t --------------------D resses , house----------------------B lou ses------------------------------—
C h i ld r e n 's :G ir l s ' d r e s s e s ----------------------G ir l s ' p a n t ie s - --------------------G i r l s ' a n k le ts --------------- ------B oy s ' s h i r t s ------- ------------- —B oys1 s h o r t s --------------------------Boys* je a n s ---------------------------
Other c o t to n a p p a r e l :D iap ers-----------------------------------Yard g o o d s , p e r c a le ------------
indexbases X9U7 19l£ 191*9 1950 19*1 1952 1 9 5 3 1951* 1955 1956 1 9 5 7 1953
9U.7 103.9 101.3 102.1 112.6 110.7 109.7 108.8 107.0 107.6 110.3 109.79U.3 iolt.5 101.2 101.6 111.1* 103.8 108.Ii 1 0 7 . a 105.1 1 0 5 . a 1 0 7 . a 106.798.2 102.6 99.2 100.0 109.6 108.1 108.0 109.9 1 0 9 . a 1 1 0 .3 112.2 113.09lt.O 105.3 100.6 99.3 106.0 103.7 103.9 101.6 9 9 . 8 1 0 1 . 8 107.7 108.589.8 106.2 lQli.O 10*.l 116.* 112.5 111.2 1 0 8 . a 1 0 3 .8 102.2 101.8 98.5
97.9 101.7 1 0 0 . a 101.1* 110.8 109.6 110.2 109.2 1 0 9 . 3 112.7 116.9 115.799.3 100.9 99.7 103.9 120.0 118.6 112.U 111.* 112.1 112.9 113.8 119.298.ii 103.0 98.5 96.7 102.3 93.7 97.0 92.8 38.3 s a . i 8a.3 82.991.2 102.6 106.2 107.2 111.8 112.3 115.8 118.8 115.8 112.1 111.5 n a .695.6 102.9 101.* 100.3 107.1 107.5 105.9 1 0 3 . a 1 0 0 . 5 98.2 99.a 98.3
102.0 98.7 99.3 93.7 10*.3 107.7 H I .* 112.0 108.0 96.7 90.3 85.29l».S loa .a 101.2 99.0 10i*.2 100.3 96.5 89.9 8a.5 72.9 67.1 6a.397.lt 1 0 3 . 2 99.1* 96.1* 107.3 106.2 106.6 105.0 1 0 2 . 5 101.9 103.8 103.0
Dec 52 — — — — 10*.9 101.0 101.0 97.6 86.a 78.6 31.7 69.6
9U.2 1 0 0 . 3 10*.l* 10* .9 112.8 116.6 118.6 1 2 2 .a i2a.3 132.3 133.8 iaa.3Dec 52 93.* 100.1 101.9 io a . 2 IO8 . 5 125.7 13a.6 la o .aDec 52 ——- . . —- — — ——- . . . . . 99.3 99.1 99.7 100.2 101.6 1 0 2 . 6
91.3 106.li 99.1' 95.6 106.2 lOil.O 103.ii 103.0 101.5 101.0 105.2 ic7 .aDec 52 — — — — — — 107.2 110.9 119.6 121.5 130.9 1 3 a.8
97.1 103.5 99.li 98.1 106.9 10*.8 IOI1.8 ioa.3 103.7 105.5 1C6.9 1 0 7 . 0
97.3 102.7 100.0 99.5 107.7 1C8.2 1 0 7 . a 1C6.8 105.7 107.a 109.0 108.698.0 103.8 96.1 9i*.8 102.2 100.9 99.7 98.9 98.0 98.7 99.2 99.191t.5 103.2 102.1. 10lu0 117.7 115.3 115.2 l l6 .a 117.7 123.9 127.9 129.396.1 108.6 93.2 92.0 101.6 92.3 92.1 90.7 90.6 91.4 92.1 92.0
9U.0 102.3 103.7 102.7 115.5 117.2 115.3 H 5.il n a .7 116.3 117.6 117.9
97.1 101. b 1 0 1 .* 102.3 113.1, 111.9 112.6 1 1 3 . a 112.1 113.9 115.1 113.991.0 lo ll.6 XOil.i. 1C3.5 136.1 l l* .i i n a . i 1 1 5 . 6 116.2 117.7 120.9 122.892.1 103.1 101l.8 1C 5 . 0 113.7 113.2 n a .o 1 1 5 . 2 n a .a 1 1 5 . 2 117.9 (a /)96.5 100.9 102.6 1 0 0 . 2 106.7 10*.0 102.7 103.7 1 0 5 . 0 106.3 108 .a 107.8
1 0 1 . 0 1C1.1 97.9 100,1? 122.* 126.8 123.7 121.6 1 2 1 . 2 122.5 126.0 126.0
90.6 1 0 3 .3 106.1 10*.2 123.1 126.1 122.9 121.6 118.2 121.2 121.6 121.198.6 lOluO 97.1* 97.7 111.3 107.3 107.9 106.1 105.7 107.8 108.7 (V )
100.8 102.6 102.1 111.0 110,2 106.7 1 0 6 .2 100.9' 101.7 101.3 iflx .i95.0 103.5 101.6 1C 2.0 1C7.0 105.3 102.3 io a .3 1 0 6 . a 107.8 106.6 105.2
__ 101.il 101.9 102.8 113.ii H 6 .i* 119.0 1 2 1 .3 1 2 2 . 3 12a.3 127.2 126.9101.li 100.* 100.1 108.5 110.1 1 0 9 . a 108.7 1 0 9 .7 112.1 113.2 116.1
Dec 52 ------- — — — — — 1 0 0 .* 101.6 1 0 2 . 0 l o i .a 102.0 102.0
101.1? 103.7 9 *.0 9i*.3 102.1 99.8 99.6 98.9 99.1 1 0 1 . 7 103.1 103.1
1C3.1 103.5 93.1* 92.0 99.0 96.7 97.1 96.8 95.9 95.a 96.6 96.9Jun 55 ioa .5 loa .a 107.^
110.2 103. h 86.li 89.5 99.1 92.0 91.8 90.7 90.7 9 1 .3 9 1 . 7 9 l l l102.6 105.2 92.2 91.7 102.9 99.1 97.8 96.3 95.3 96.1 9 7 . 5 97.6102.0 102.8 95.2 98.2 111.6 102.1 lOO.a 99.7 99.6 101.it 1 0 3 . 3 1 0 2 . 5103.3 100.5 96.* 97.7 106.ii 105.7 10U.1 106.0 106.0 109.0 109.7 108.899.9 101.7 98.3 99.2 108.it 1 0 6 .* 10*.2 103.1 101.5 105.2 107.0 106.2105.9 100.3 93.7 96.0 112.2 112.1 111.1 108.1 106.2 109.3 l l l . i l 111.2101.9 102.1* 95.7 96.li 103.6 99.it 96.a 9a.a 93.3 99.2 1 0 2 . 5 102.9
Dec 52 ------ — — — — — 97.7 93.6 91.1 . 95.0 95.1 90.1
93.8 105.9 100.3 95.1 96.3 96.8 103.3 105.9 111.1 116.6 117.9 ( a / )10li. 2 102.1 93.7 93.1 96.8 9i*.3 9U.9 9a.7 9a.a 95.5 97.3 9T.7
Mar 56 ------ — — — — — — — 100.9 100.7 101.0
101.* 101*.3 91*.2 91*.0 101.7 103.9 105.3 107.7 ioa .o 105.8 107.6 109.597.3 103.3 99.1» 96.* 102.3 103.0 io a .o 103.5 iea .6 108.9 109.8 109.897.1 100.8 102.2 101.1* 109.6 107.9 106.5 107.* 1 0 5 . 6 105.8 107.9 107.5
100.7 103.7 95.7 92.6 9$ .3 9li.6 99.1 97.3 9k.9 97.0 97.0 99.2103.6 101.8 9i*.7 93.0 102.3 101.5 102.1* 102.* 98.7 100.9 103.0 102.8
Dec 52 —— — — — 99.8 1 0 0 . 0 99.5 95.8 93.2 96.3 99.2 98.6
106.1 100.2 93.3 91.9 100.9 95.1* 95.2 89.9 91.3 9 i.a 91.6 90.6102.0 uo.i* 87.6 90.* 101.7 91.6 92.1 91.2 91.5 91.7 91.8 92.1
See f o o tn o te s a t end o f ta b le .47
Digitized for FRASER http://fraser.stlouisfed.org/ Federal Reserve Bank of St. Louis

T a b le B -4 . Consumer P r ic e Index— U nited S ta te s c i t y a v era g e : In dexes o f s e le c t e d item s and g rou p s , annual a v e r a g e s , 1935*53 (C a n t 'd )
_________________Item and group
Apparel—ContinuedManmade f ib e r s apparel — -------------
M en's:S u it8, rayon---------- ------------- —S lack s, rayon--------------------------J a ck ets ----------------------------------------Sport s h ir ts , rayon---------------Socks, nylon, stretch ---------- -
Women's:D resses, rayon— — ------— ------S lip s , rayon and nylon---------Panties, rayon- — -------- --------Nightgowns, rayon------------- 1—Hose, nylon— -----------------------S u its , rayon----------------------------S k irts , rayon------------------- ------Blouse s— — — — — — — —
C h ild ren 's :Boys' s la ck s-------------------------—Boys' Jackets---------- ---------------G ir ls ' sweaters, orIon— —
Other manmade f ib e r s apparel:Yard goods, rayon---------- --------
M iscellaneous apparel------------------Women's co a ts , fu r ---------— — —Women's g ir d le s — -— — — —
Shoes------------------------------------------- —Men's:
Shoes, s tr e e t— — — — — —Shoes, work-----------------------------
Women's:Shoes, s t r e e t - - — - ■■» —Shoes, p lay-----------------------------
C h ild ren 's :Shoes, oxford-------- -----------------
Shoe rep a irs— ---------------------------
Transportation-----------------------------------
Automobiles, new*— — — — — —Autom obiles, used— — -----------
Gasoline--------------------------------------Motor o i l — — — — — — —Auto rep a irs ---------- --------------------Auto re g is tra tio n ----- ----------------Auto insurance— -------------- :--------
P ublic-------- 7-----------------------------------T ransit fa re s -------------- -----— ------Railroad fa r e s , coach------------—
M ed ica l ca r e --------- ---------------------- -----------------M ed ica l ca re l e s s h o s p i t a l r a te s
and group h o s p i t a l iz a t io n ------------P h y s ic ia n s ' f e e s ----------- ------- — ----------
G enera l p r a c t i t i o n e r s ' f e e s — —O ff ic e v i s i t ----------------------------------House v i s i t * ---------— — ---------------O b s te t r ic a l ca r e --------------------------
S u rg eon s ' f e e s - — ------------------- --------Appendectomy----------------- ----- — — —T o n s ille c to m y ----------------------- — —
D e n t is t s ' f e e s -------------— ---------------------F i l l i n g s ----------------------------------------------E x tr a c t io n s ------------- —
O ptom etric exam in ation ande y e g la s s e s — — * — --------------
H o s p ita l r a t e s — — — ----- ----------M en's pay ward— — — —S em ip riva te room------------------------------P r iv a te room— — - — ------------------
(1947-49=100 u n le s s o th e rw ise s p e c i f i e d )Otherin d e xb a ses
Annual A verage
1935 1936 1937 1938 1939 19ii0 191*1 191*2 191*3 191*1* 191*5 191*6
5 8 .9 5 9 .0 6 0 .7 60. 1* 60.3 61.0 6 3 .3 7 $ . l 76 .2 80 . 1* 8 3 .2 8 8 .7
Jun 53 Dec 52 Dec 52 Dec 52 Jun 56
—— - —
— — — —
$ 6 .3 $6.JU 5 8 .2 $ 7 .1 5 7 .2 $ 7 .3 $ 9 .1 7 1 .0 7 l* .l 81.1 8$ .$ 87.1$6 .2 $6.1* 5 8 .3 $ 8 .7 5 8 .9 6 1 .3 6$.6 7 6 .7 7 9 .2 8 1 .8 83.6 7 $ .961.8 a . 3 62.1 62 . 1* 60.8 60.$ 6 2 .7 7lt.3 76 .1 8 0 .3 8 1 .9 8 3 .7
D e o '52 Dec 52
_____ _____ _____8 4 .1 8 8 .6
— n : : : — — — — —
I S
S 1
i i
Dec 52
Dec 52 Dec 52 Dec 52
Dec 52l*$.l* 1*6 ,0 1*7.1* 1*$.2 i*l*.o 1*8 . 3 $1 . 1* 60.6 62.0 6$.$ 69.8 7l*.8
5 7 .2 1 m ~ 6 6 .k l $ a ~$8 .6 5 8 .6 H I 7 6 .$ 8 0 .3 9 0 .0 9l*.0 99 .$5 7 .8 $ 7 .$ $7 .$ $ 7 .6 $ 7 .6 5 7 .5 $ 9 .3 6 9 .3 7 8 .7 9 $ .0 101.8 9 9 .0
1j7 .3 1*8.1 $0 .6 $ 6 .9 $0 .2 5 1 .0 $ 2 .9 6 0 .1 62 . 1* 6l*.3 6$ .7 7 3 .$
1*2 .1 1*3.1* 1*$.9 1*6.3 1*$.$ 1*7.1 1*9.6 $ 7 .6 $ 9 .$ 60 . 1* 61.2 7 0 .$1*2.7 1*3.7 1*6 .1 1*6 .$ lt$ .9 1*7.3 $0 .1 $ 9 .7 6 3 .3 68.0 6 9 .$ 7 7 .2
Deo 52$2 . 1* $ 2 .9 $$.8 $ $ .7 $1*.8 SU.9 $6 .0 62 .0 61*.2 66.1 67.1* 7l*.8
1*6 .2 1*6 .$ 1*9.1 1*9.7 1*9.3 $6 . 1* $2 .$ 6 0 .1 6 2 .3 6$ . l 67.2 7 3 .91*9 .3 1*9.7 $1 .8 $ 2 .3 $L .7 $1 .8 $2 .8 $ 9 .6 66.5 73.1* 7 6 .$ 8 $ .7
69 .6 7 0 .2 7 1 .3 7 1 .9 7 0 .2 6 9 .8 7 2 .2 7 8 .$ 78.2 78.2 7 8 .1 8 2 .161*.3 6$.$ 6 7 .$ 68 .0 6$ .$ 61*. 8 68.2 7 7 .6 7 6 .3 7 6 .2 76.1 8 0 .5
Jan 53$ l* .l $1*.6 $$.6 $ 8 .3 $ 7 .0 $ 7 .1 61. 1* (U /) (U /) ( l*/> (U /) ( U /) .
8 2 .0 H I 9 0 .3 9 1 .9 H I 81.8 l i * l TJ) " ( i* 7 ) Th7) "(1*7) ’ ( U /k7 2 .8 7$ .6 78.8 7 6 .$ 7 1 .7 70.1* 7 3 .9 7^ .2 7 9 .0 7 9 .3 7F .8 8 0 .38 2 .9 8 $ .8 8 9 .6 87.0 80. 1* 80. 1* 8 1 .1 8 2 .1 83.8 8 3 .9 8 3 .7 8 $ . l7 3 .2 73 .2 7 3 .2 7 3 .2 7 3 .1 7 2 .8 76.1 8 2 .7 83.8 81*. 8 8$.l* 88.1
100.8 100 . 8. 100.8 100.8 100.8 1 0 1 .3 10U. 1* 11*8.1 1 5 2 .0 1 5 1 .8 i $ l . o 128 . 1*6i*.3 6l*.3 61*.3 61*.3 61*.6 6 3 .7 65.1 72.1* 6 5 .0 6 3 .1 6 3 .1 7$.l*8 1 .7 8 0 .9 8 0 .1 81.0 8 1 .3 8 1 .3 81. 1* 82.0 8 2 .2 8 2 .3 8 2 .3 81*.88 1 .3 81 .3 8 1 .3 81 .7 8 1 .9 8 2 .2 8 2 .3 8 2 .8 8 2 .8 82.8 8 2 .7 8$.2
100.6 80.1 6 5 .8 7 1 .7 7 6 .$ 6 9 .1 66.1* 7 6 .0 81 .2 8 3 .8 8 $ . l 8 $ . l
71.1* 7 1 .6 7 2 .3 7 2 .$ 7 2 .6 7 2 .7 7 3 .1 7 $ . l 7 8 .7 8 1 .2 8 3 .1 8 7 .7
7 $ . l 7$.l* 76 .0 ' 7 6 .1 7 6 .1 7 6 .1 7 6 .$ 7 8 .3 8 1 .7 8i*.2 86 .3 9 0 .17 3 .8 71*.3 7U.6 71*.$ 71*.6 71* .6 7U.9 7 6 .$ 81.1* 81*.7 8 6 .7 9 1 .07 3 .9 7i*.3 7l*.6 7l*.6 7l*.6 71*. 7 7l*.9 76.6 8 1 .3 81*.8 86 .8 9 1 .17 3 .3 7 3 .$ 7 3 .8 7 3 .6 7 3 .8 7 3 .9 7l*.0 7$.i* 7 9 .8 83.8 8 6 .3 9 0 .97 7 .2 7 8 .0 7 8 .3 78.0 7 8 .0 7 8 .0 7 8 .0 7 9 .6 83.8 8 6 .8 8 8 .2 9 1 .96 $ .$ 6$ .8« 6 6 .2 6 6 .8 6 7 .1 6 7 .1 68.1* 71.1* 7 8 .6 8 2 .0 8 3 .6 8 8 .67 3 .8 71* .1 7l*.3 7l*.6 7i*.8 7l*.0 7l*.7 7 6 .8 8 1 .3 81*.$ 8 6 .9 9 0 .97$.l* 7 $ .7 7 6 .1 76.1 7 6 .1 7 6 .1 7 7 .0 7 9 .2 8 3 .9 8 6 .9 8 9 .7 9 2 .97 2 .3 72.1* 7 2 .8 7 3 .3 7 3 .6 7 1 .7 7 2 .2 7U.2 7 8 .5 8 2 .1 81*.2 8 9 .06 8 .2 6 8 .3 6 9 .9 7 0 .0 7 0 .1 7 0 .1 7 0 .3 7 2 .1 75.1* 7 9 .6 8 3 .0 8 7 .96 7 .6 6 7 .6 7 0 .0 7 0 .2 7 0 .3 70.1* 7 0 .8 7 3 .1 7 5 .5 7 8 .7 8 2 .2 8 8 .06 7 . k 6 7 .7 6 8 .8 6 8 .9 6 9 .2 6 8 .9 69.2 7 0 .$ 7 3 .7 7 8 .7 8 3 .0 8 7 .8
8 0 .$ 80 .7 8 1 .2 81 .3 8 1 .9 8 2 .6 8 2 .8 8 3 .9 8 7 .5 8 9 .6 9 0 .8 9 2 .$1*7.1 1*7.$ 1*8.8 1*9.9 $ 0 .1 $0.1* $1.1* $$.l* 5 9 .8 6 2 .$ 61* .1* 7 3 .31:2.7 1*3.1* 14* .1 1*$.3 i*$.3 1*6.0 1*7.3 $1 .6 56 .0 $ 8 .8 6 0 .0 6 9 .91*8.3 1*8.6 $6 .1 $1 .2 $1.1* $1 .8 $ 2 .9 $ 7 .0 a . o 6 3 .7 6 6 .6 7l*.U$ 0 .7 $1.1 $ 2 .6 $ 3 .7 $ i* .l $1**2 $ $ .0 $ 8 .6 6 3 .0 6 $ .6 6 7 .6 7 6 .2
See f o o t n o t e s a t end o f ta b le . 4 8
Digitized for FRASER http://fraser.stlouisfed.org/ Federal Reserve Bank of St. Louis
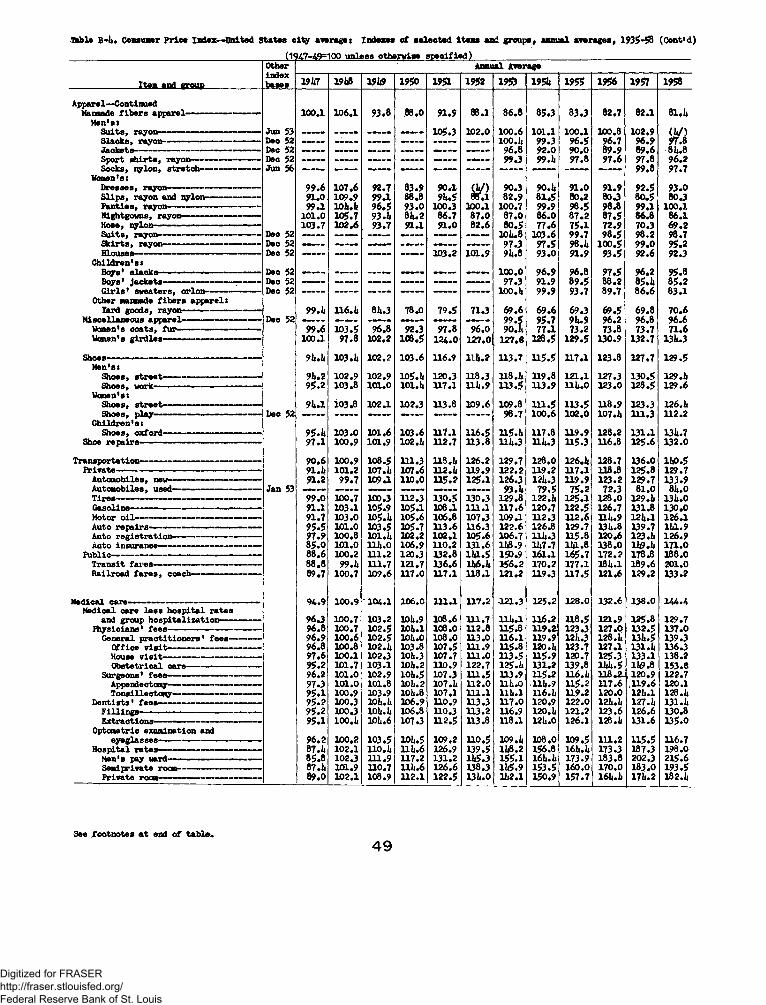
Table B-i*. Consumer P rice Index—United States c i t y averages Indexes o f se le c te d ite n s and groups, annual averages, 1935-58 (Cont*d)
(1947-49=100 u n le s s o th erw ise s p e c i f i e d )
-Item and ggoup
Other Annual Averagein d e xba ses 191*7 i m 191*9 1950 1951 1952 1953 195U 1955 1956 1957 1958
100*1 1 0 6 .1 9 3 .8 .88 .0 9 1 .9 88 .1 8 6 .8 8 5 .3 8 3 .3 8 2 .7 8 2 .1 81.1*
Jun 53 _^T r .... , 1 0 5 .3 1 0 2 .0 1 0 0 .6 1 0 1 .1 1 0 0 .1 100 .8 1 0 2 .9 (V)Dec 52 - ____ ______ . . . . . . . . . . . . . . . . — — - 100.1* 9 9 .3 9 6 .5 9 6 .7 9 6 .9 97 .8Deo 52 . . . . . . — — . . . . . — — — — -------- 9 6 .8 9 2 .0 9 0 .0 8 9 .9 8 9 .6 81*.8DecJun
5256 : : : : :
i i
S i
i i
i i n : : :
------ 9 9 .3 99.1* 9 7 .8 9 7 .6 9 7 .89 9 .8
9 6 .29 7 .7
9 9 .6 1 0 7 .6 9 2 .7 8 3 .9 9 0 .1 (V) 9 0 .3 90.1* 9 1 .0 9 1 .9 9 2 .5 9 3 .09 1 .0 1 0 9 .9 9 9 A 8 8 .8 91*. 5 8 8 .1 8 2 .9 8 1 .5 8 0 .2 8 0 .3 8 0 .5 8 0 .39 9 .1 lO ll.li 9 6 .5 9 3 .0 1 0 0 .3 1 0 0 .1 1 0 0 .7 9 9 .9 9 8 .5 9 8 .8 9 9 .1 1 0 0 .1
1 0 1 .0 1 0 5 .7 9 3 .ii 81i.2 8 6 .7 8 7 .0 8 7 .0 8 6 .0 8 7 .2 8 7 .5 8 6 .8 8 6 .11 0 3 .7 1 0 2 .6 9 3 .7 9 1 .1 9 1 .0 8 2 .6 8 0 .5 7 7 .6 7 5 .1 7 2 .9 7 0 .3 6 9 .2
Dec 52 . . . . . . . . . . ' — . . . . . — — 10l*.8 1 0 3 .6 9 9 .7 9 8 .5 9 8 .2 9 8 .7Dec 52 — — — — . . . . . . . . . . — ~ 9 7 .3 9 7 .5 98.1* 1 0 0 .5 99*0 9 5 .2Dec 52 — — - —- —— 1 0 3 .2 1 0 1 .9 9l*.8 9 3 .0 9 1 .9 9 3 .5 9 2 .6 9 2 .3
Dec 52 — ___ ____ _ ___ . . . . . — . . . 1 0 0 .0 9 6 .9 9 6 .8 9 7 .5 9 6 .2 9 5 .8Dec 52 — . . . . . . . . . . — — - 9 7 .3 9 1 .9 8 9 .5 8 8 .2 85.1* 8 5 .2Dec 52 •----- * — — - — - 100.1* 9 9 .9 9 3 .7 8 9 .7 8 6 .6 8 3 .1
99.1* 116.1* 8I4.3 7 8 .0 7 9 .5 7 1 .3 6 9 .6 6 9 .6 6 9 .3 6 9 .5 6 9 .8 7 0 .6Dec 52 . . . --- — — . . . . . . . . . . — • 9 9 .5 9 5 .7 9lw 9 9 6 .2 9 6 .8 9 6 .6
9 9 .6 1 0 3 .5 9 6 .8 92 .3 9 7 .8 9 6 .0 90.1* 7 7 .1 7 3 .2 7 3 .8 7 3 .7 7 1 .61 0 0 .1 9 7 .8 1 0 2 .2 1 0 8 .5 124.0 1 2 7 .0 1 2 7 .8 1 2 8 .5 1 2 9 .5 1 3 0 .9 1 3 2 .7 13U.3
9l*.l* 1 0 3 .l i 1 0 2 .2 1 0 3 .6 1 16 .9 111*.* 1 1 3 .7 1 1 5 .5 1 1 7 .1 1 2 3 .8 1 2 7 .7 1 2 9 .5
9 iu 2 1 0 2 .9 1 0 2 .9 1 0 5 .li 1 2 0 .3 1 1 8 .3 118.1* 1 1 9 .8 1 2 1 .1 1 2 7 .3 1 3 0 .5 129 .li9 5 .2 1 0 3 .8 1 0 1 .0 101.1* 11 7 .1 111*.9 1 1 3 .5 1 1 3 .9 n i i . o 1 2 3 .0 1 2 8 .5 1 2 9 .6
9 l* .l 1 0 3 .8 1 0 2 .1 1 0 2 .3 1 13 .8 1 0 9 .6 1 09 .8 1 1 1 .5 1 1 3 .5 1 1 8 .9 1 2 3 .3 126.1*Deo 52 — — — ----- — — — — 9 8 .7 1 0 0 .6 1 0 2 .0 107.1* 11 1 .3 1 1 2 .2
9 5 .l i 1 0 3 .0 1 0 1 .6 1 0 3 .6 11 7 .1 1 1 6 .5 115.1* 1 1 7 .8 1 1 9 .9 1 2 8 .2 1 3 1 .1 13lt.79 7 .1 1 0 0 .9 1 0 1 .9 102.1* 112 .7 1 1 3 .8 l l l* .3 n i* .3 115 .3 116 .8 1 2 5 .6 1 3 2 .0
9 0 .6 1 0 0 .9 1 0 8 .5 1 11 .3 118.1* 1 2 6 .2 1 2 9 .7 1 2 8 .0 126.1* 12 8 .7 1 3 6 .0 11*0.591.1* 1 0 1 .2 107.i* 1 0 7 .6 112.1* U 9 .9 1 2 2 .2 1 1 9 .2 1 1 7 .1 1 18 .8 1 2 5 .8 1 2 9 .79 1 .2 9 9 .7 109a 1 1 0 .0 1 1 5 .2 1 2 5 .1 126 .3 12!*.3 1 1 9 .9 1 2 3 .2 1 2 9 .7 1 3 3 .9
Jan 53 . . . . . . . . . . . . — . — — 93.1* 7 9 .5 7 5 .2 7 2 .3 8 1 .0 814.09 9 .0 1 0 0 .7 1 0 0 .3 1 1 2 .3 1 3 0 .5 1 3 0 .3 1 2 9 .8 122.1* 1 2 5 .1 1 2 8 .0 129.1* 131*.09 1 .1 1 0 3 .1 105 .9 105a 1 0 8 .1 1 1 1 .1 1 1 7 .6 1 2 0 .7 1 2 2 .5 1 2 6 .7 1 3 1 .8 1 3 0 .09 1 .7 1 0 3 .0 105.1* 1 0 5 .6 1 0 6 .8 10 7 .3 1 0 9 .1 11 2 .3 1 1 2 .6 l l i * .9 1 2 l* .l 1 2 6 .19 5 .5 1 0 1 .0 1 0 3 .5 105 .7 1 1 3 .6 1 1 6 .3 1 2 2 .6 126 .8 12 9 .7 131*.8 1 3 9 .7 11*1.99 7 .9 1 0 0 .8 101.1* 10 2 .2 1 0 2 .1 1 0 5 .6 1 0 6 .7 l l l * .3 115 .8 1 2 0 .6 123.1* 1 2 6 .98 5 .0 1 0 1 .0 l l i i . o 1 0 6 .9 1 1 0 .2 1 3 1 .6 11*8.9 11*7.7 11*1.8 1 3 8 .0 11*9.1* 1 7 1 .08 8 .6 1 0 0 .2 1 1 1 .2 12 0 .3 1 3 2 .8 11*1.5 15> .9 1 6 1 .1 1 6 5 .7 1 7 2 .2 17 8 .8 1 8 8 .08 8 .8 99.1* 1 1 1 .7 1 2 1 .7 1 3 6 .6 11*6.1* 1 5 6 .2 1 7 0 .2 1 7 7 .1 1 8 !* .l 1 8 9 .6 2 0 1 .08 9 .7 1 0 0 .7 1 0 9 .6 1 1 7 .0 1 1 7 .1 1 1 8 .1 1 2 1 .2 1 1 9 .3 1 1 7 .5 1 2 1 .6 1 2 9 .2 1 3 3 .2
9 4 .9 1 0 0 .9 1 0 4 .1 106 .C 1 1 1 .1 1 1 7 .2 -121.3 1 2 5 .2 1 2 8 .0 1 3 2 .6 1 3 8 .0 1 4 4 .4
9 6 .3 1 0 0 .7 1 0 3 .2 10iu9 1 0 8 .6 1 1 1 .7 l l i i . l 1 1 6 .2 1 1 8 .5 1 2 1 .9 1 2 5 .8 1 2 9 .79 6 .8 1 0 0 .7 1 0 2 .5 lO l i . l 1 0 8 .0 1 1 2 .8 115 .8 1 1 9 .2 1 2 3 .3 127 .0 1 3 2 .5 1 3 7 .09 6 .9 1 0 0 .6 1 0 2 .5 10lt.0 1 0 8 .0 113 .0 1 1 6 .1 1 1 9 .9 12i*.3 126.1* 13l*.5 1 3 9 .39 6 .8 1 0 0 .8 102.1* 1 03 .8 1 0 7 .5 1 1 1 .9 11 5 .8 120.1* 123 .7 1 2 7 .1 131.1* 13 6 .39 7 .6 1 0 0 .1 1 0 2 .3 101*,3 10 7 .7 1 1 1 .0 1 1 3 .5 1 1 5 .9 1 2 0 .7 1 25 .3 1 3 3 .1 1 3 8 .29 5 .2 1 0 1 .7 1 0 3 .1 101*. 2 1 1 0 .9 1 2 2 .7 125.1* 13 1 .2 13 9 .8 11*1*. 5 11*9.8 1 5 3 .89 6 .2 1 0 1 .0 1 0 2 .9 10l*.5 1 0 7 .3 1 1 1 .5 1 13 .9 1 1 5 .2 116.1* 118.2^ , 1 2 0 .9 1 2 2 .79 7 .3 1 0 1 .0 1 0 1 .8 101*. 2 107.1* 1 1 2 .0 n i * .o • llli.9 1 1 5 .2 1 1 7 .6 .1 1 9 .6 1 2 0 .19 5 .1 100 .9 103 .9 10l*.8 1 0 7 .1 1 1 1 .1 n i * . i 116.1* 1 1 9 .2 1 2 0 .0 121* .1 128.1*9 5 .2 100 .3 10l*.ii 1 0 6 .9 11 0 .9 113 .3 1 1 7 .0 1 2 0 .9 1 2 2 .0 1214.1* 127.1* 131.1*9 5 .2 10 0 .3 10l*.l* 106 .8 110 .3 1 1 3 .2 116 .9 120.1* 1 2 1 .2 1 2 3 .6 1 2 6 .6 1 3 0 .89 5 .1 1 0 0 .ii lO li, 6 10 7 .3 1 1 2 .5 1 13 .8 1 1 8 .1 121*.0 1 2 6 .1 128.1* 1 3 1 .6 1 3 5 .0
9 6 .2 1 0 0 .2 1 0 3 .5 10i*.5 1 0 9 .2 1 1 0 .5 109.1* 1 0 8 .0 1 0 9 .5 1 1 1 .2 1 1 5 .5 1 16 .787.1i 1 0 2 .1 110.1* n i * .6 126 .9 1 3 9 .5 11*8.2 1 56 .8 161*. 1* 1 73 .3 187 .3 1 9 8 .08 5 .8 1 0 2 .3 1 1 1 .9 1 1 7 .2 1 3 1 .2 11*5.3 1 5 5 .1 161*. 1* 1 7 3 .9 1 8 3 .8 2 02 .3 2 1 5 .68 7 .li 101 .9 1 1 0 .7 111* .6 1 2 6 .6 13 8 .3 11*5.9 1 5 3 .5 1 6 0 .0 1 7 0 .0 1 8 3 .0 1 9 3 .58 9 .0 1 0 2 .1 1 0 8 .9 1 1 2 .1 1 2 2 .5 13l*.0 11*2.1 15 0 .9 1 5 7 .7 161*. 1* 17!*.2 182.1*
A p parel— ContinuedManmade f i b e r s a p p a r e l-
Men’ s :S u i t s , ra yon — S la c k s , rayon — J a ck e ts --------------S p ort s h i r t s ,S ock s , n y lo n , s t r e t c h ---------
Women’ s :D resse s , rayon ----------S l i p s , ra yon and n y lon — P a n t ie s , rayon ------------------N ightgow ns, rayon—H ose, n y lo n--------------S u it s , r a y o n -S k ir t s , r a y o n - B lou se8 -
C h ild r e n 's :B oy s ' s la c k s —B oy s ' j a c k e t s - G i r l s ' sw ea ters , o r Io n — —
O ther manmade f i b e r s a p p a r e l: Yard g o o d s , rayon ---------------------
M isce lla n e o u s a p p a r e l- Wamen's c o a t s , Women's g i r d l e s -
ShoesM en 's :
S h oes, s t r e e t - S h oes , work
w om en 's:S h oes, s t r e e tS h oes, p la y ------
C h ild r e n 's : S h oes, o x f o r d -
Shoe r e p a ir s ------- —
T ra n sp o rta tio n ^ P r iv a t e -
A u tom ob iles , A u tom ob ile s , u s e d - T ir e s -------------------------G a so lin e—M otor o i l -------A uto r e p a i r s - Auto r e g i s t r a t i o n A uto in su ra n ce—
P u b lic -------------------------T r a n s it f a r e s - R a ilro a d f a r e s , coa ch ------
M ed ica l c a re — — — ---------------------------------M ed ica l ca re l e s s h o s p i t a l r a te s
and group h o s p i t a l iz a t io n ---------P h y s ic ia n s ' f e e s — --------- ------- -------
G eneral p r a c t i t i o n e r s ' f e e s —O ff ic e v i s i t --------------House v i s i t ----------O b s te t r ic a l care-
S u rgeon s ' f e e s — — Appendectomy- T o n s il le c to m y —
D e n t is t s ' f e e s ------------------------F i l l i n g s --------------------------------E x tr a c t io n s — — — ------------
O ptom etric exam in ation ande y e g la s s e s — ------------------
H o s p ita l rates*M en's pay ward—Semi p r iv a te room- P r iv a te room---------
See f o o tn o te s a t end o f ta b le *
4 9
Digitized for FRASER http://fraser.stlouisfed.org/ Federal Reserve Bank of St. Louis
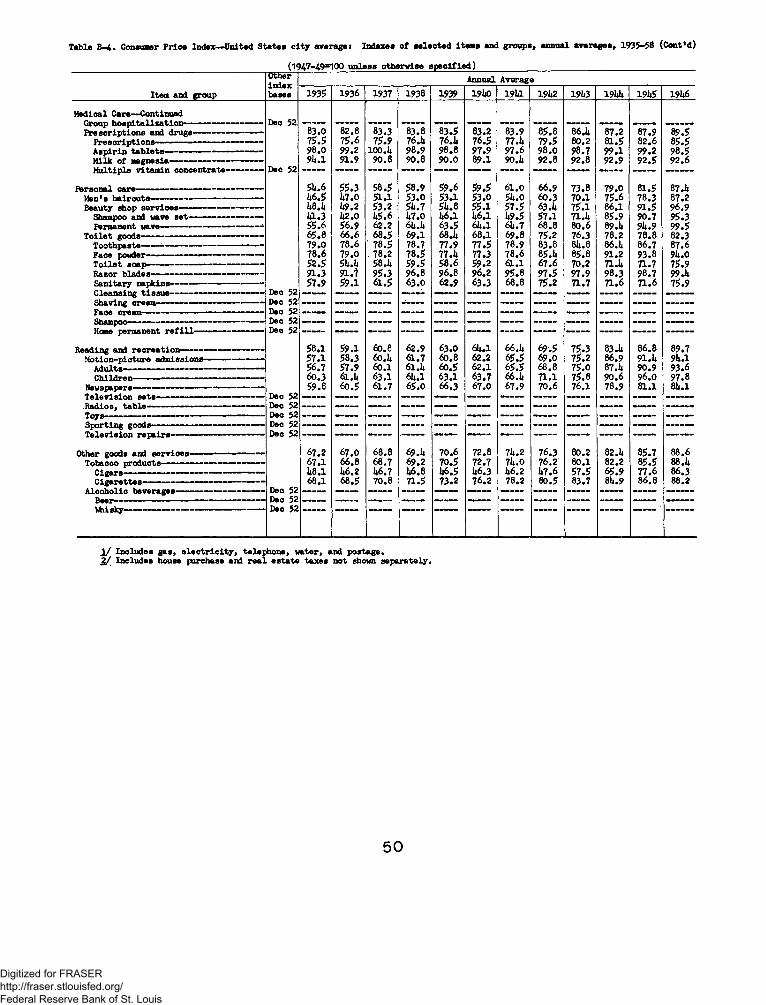
T a b le B -4 . Consumer P r ic e Index— U nited S ta te s c i t y a v e ra g e : In d exes o f s e le c t e d item s and g ro u p s , annua l a v e ra g e s , 1935-58 (C o n t 'd )
___________________________________________________________ (1947-49=100 u n le s s o th erw ise s p e c i f i e d ) ___________________________________________________________Annual A verage
Item and group1UUSXbases 1935 1936 1937 1938 1939 191*0 191*1 191*2 191*3 191*1* 191*5 191*6
M ed ica l Care— ContinuedGroup h o s p i t a l is a t i o n ------------- — --------- ------ Dec 52 — -------- — -------- — — — — ------- -- — - — ~ - — - . . . . . .P r e s c r ip t io n s and d ru gs----------------------------- 8 3 .0 8 2 .8 8 3 .3 8 3 .8 8 3 .5 8 3 .2 8 3 .9 8 5 .8 86.1* 8 7 .2 8 7 .9 89.5
P r e s c r ip t io n s — --------- ---------------------- — 7 5 .5 7 5 .6 7 5 .9 76.1* 76.1* 7 6 .5 77.1* 7 9 .5 8 0 ,2 8 1 .5 8 2 .6 8 5 .5A s p ir in t a b l e t s ----- — ------------------------------- 9 8 .0 9 9 .2 100.1* 9 8 .9 9 8 .8 9 7 .9 9 7 .6 9 8 .0 9 8 .7 9 9 .1 9 9 .2 9 8 .5M ilk o f m agnesia--------------------------------------- 9 l i . l 9 1 .9 9 0 .8 9 0 .8 9 0 .0 8 9 .1 90.1* 9 2 .8 9 2 .8 9 2 .9 9 2 .5 9 2 .6M u ltip le v ita m in co n ce n tra te ------------- -- Dec 52 ------- -- — — - — - — — - — - — — — —
P erson a l c a re — — --------- — ------------------------- 5U.6 5 5 .3 5 8 .5 5 8 .9 5 9 .6 5 9 .5 6 1 .0 6 6 .9 7 3 .8 7 9 .0 8 1 .5 87.1*M en's h a ir c u t s ----------- ------------------- ------- — — 1*6.5 1*7.0 5 1 .1 5 3 .0 5 3 .1 5 3 .0 51*.o 6 0 .3 7 0 .1 7 5 .6 7 8 .3 8 7 .2Beauty shop s e r v ic e s --------------- --------------- — 1*8.1* 1*9.2 5 3 .2 51*.7 51*. 8 5 5 .1 5 7 .5 63.1* 7 5 .1 8 6 .1 9 1 .5 9 6 .9
Shampoo and wave s e t --------------------------- — 1*1.3 1*2.0 1*5.6 1*7.0 1*6.1 1*6.1 1*9.5 57 .1 71.1* 8 5 .9 9 0 .7 9 5 .3Permanent wave------- — ---------------------------- 1 5 5 .6 5 6 .9 6 2 .2 61*.1* 6 3 .5 61*.l 61*.7 6 8 .8 8 0 .6 89.1* 9U.9 9 9 .5
T o i l e t good s--------------------------------------------------- 6 5 .8 6 6 .6 6 8 .5 6 9 .1 68.1* 6 8 .1 6 9 .8 75 .2 7 6 .3 7 8 .2 7 8 .8 8 2 .3T ooth p a ste ------- ------------------------------------------- 7 9 .0 7 8 .6 ‘ 7 8 .5 78 .7 7 7 .9 7 7 .5 7 8 .9 8 3 .8 81*. 8 86.1* 8 6 .7 8 7 .6Face p on d er- - - —— 7 8 .6 7 9 .0 . 7 8 .2 7 8 .5 77.1* 7 7 .3 7 8 .6 85.1* 8 5 .8 9 1 .2 9 3 .8 9U .0T o i l e t s o a p — --------------------------------------------- 5 2 .5 51*.l* 58.1* 5 9 .5 5 8 .6 5 9 .2 6 1 .1 6 7 .6 70 .2 71.1* 71 .7 7 5 .9R azor b la d e s ----------------------------------------------- 9 1 .3 9 1 . 1 9 5 .3 9 6 .8 9 6 .8 96.2 9 5 .8 9 7 .5 9 7 .9 9 8 .3 9 8 .7 99.1*S a n ita ry n apkin s--------------------------------------- 5 7 .9 5 9 .1 6 1 .5 6 3 .0 6 2 .9 6 3 .3 6 8 .8 7 5 .2 7 1 .7 7 1 .6 7 1 .6 7 5 .9C lea n s in g t i s s u e --------------- — ----------------- -- Deo 52
Dec 52— — — — — — ------- -- -------- --------- — — — —
Face cream— — --------- ----- ----- ------------- Dec 52 Dec 52
— — — — — — — — — — — —
Home permanent r e f i l l — ------------ --------- Dec 52 — — — — — — — — — — — —
R eadin g and r e c r e a t io n — — — ------- — ---------- 5 8 .1 5 9 .1 60.8 6 2 .9 6 3 .0 61*.l 66.1* 6 9 .5 7 5 .3 83.1* 8 6 .8 8 9 .7M o t io n -p ic tu re a d m iss ion s----------- ----- -------- 5 7 .1 5 8 .3 60. 1* 6 1 .7 60.8 62 .2 6 5 .5 6 9 .0 7 5 .2 86.9 91.1* 9 l* .l
A d u lts --------- — — ----------------------------- ------------ 5 6 .7 5 7 .9 60.1 61 . 1* 6 0 .5 62.1 6 5 .5 68.8 7 5 .0 87.1* 9 0 .9 9 3 .6C h ild ren ------- — ------------------------------------------- 6 0 .3 61.1* 6 3 .1 61*.1 6 3 .1 6 3 .7 66. 1* 7 1 .1 7 5 .8 9 0 .6 9 6 .0 9 7 .8
Newspapers------------------------------------------------------- 5 9 .8 6 0 .5 6 1 .7 6 5 .0 6 6 .3 6 7 .0 6 7 .9 7 0 .6 76.1 7 8 .9 81.1 8I1. IT e le v is io n s e t s ---------------------------------- ----- — Dec 52 — — — — — --------- — — --------- — — — — — —R a d io s , t a b le ------------------------------------------------- Dec 52
Dec 52— ~ - — - — — ------- -- — • — — --------- — - — - — — -------- --
Dec 52S p o r t in g good s—— —— — — — — — —T e le v is io n r e p a ir s ------------------------------- ------- Dec 52 — — — — — — — — — — — —
Other goods and s e r v ic e s — — --------------- 67.2 6 7 .0 68.8 69.1* 70.6 72.8 7l*.2 7 6 .3 80.2 82.1* 8 5 .7 88.6T ob a cco p ro d u cts --------------- — ----------- — ------- 6 7 .1 66.8 6 8 .7 69.2 7 0 .5 7 2 .7 7l*.0 76.2 8 0 .1 82.2 8 5 .5 88.1*
1*8.1 1*6.2 1*6.7 1*6.8 1*6.5 U6.3 1*6.2 1*7.6 57.5 6 5 .9 7 7 .6 86.368.1 68.5 7 0 .8 7 1 .5 7 3 .2 76.2 7 8 .2 8 0 .5 8 3 .7 81*.9 8 6 .8 8 8 .2
A lc o h o l ic b ev era g es ------------------------------- ------ Dec 52Dec 52Dec 52 -------- “ — ” . . . . . . . . . . .
j / In c lu d e s g a s , e l e c t r i c i t y , te le p h o n e , w a ter, and p o s ta g e .2 J In c lu d e s house purchase and r e a l e s t a t e ta x e s n o t shown s e p a r a te ly .
5 0
Digitized for FRASER http://fraser.stlouisfed.org/ Federal Reserve Bank of St. Louis

Table B-U. Consumer P rice Index—United States c i t y average} Indexes o f s e le c te d items and groups, annual averages, 1935-58 (Cont‘ d )
(1947-49=100 u n le s s o th erw ise s p e c i f i e d )
Item and group
"O tterin d exbases
Annual Average
19U7 191* 191i9 1950 1951 1952 1953 1951* 1955 1956 1957 1958
M ed ica l Care— ContinuedGroup h o s p i t a l is a t io n — ----------------- — ------ Dec 52 — ----- . . . . . . . . . . — 8 5 .6 9 7 .0 10li .6 1 1 2 .5 1 1 5 .5 1 2 2 .7 1 2 9 .9 l i i2 .2P r e s c r ip t io n s and d ru gs— --------- ---------------- 9 6 .1 1 0 1 .2 1 0 2 .7 1 0 3 .9 1 0 6 .9 1 0 7 .9 1 0 8 .9 1 1 0 .1 1 1 1 .2 1 1 3 .7 1 1 6 .7 1 2 0 .7
P r e s c r ip t io n s - ----------- --— — ---------------------- 9ii.O 101 .7 1 0 ii.2 1 0 6 .9 1 1 2 .2 1 1 3 .6 1 1 3 .6 1 1 5 .8 11 7 .3 1 2 1 .0 1 2 5 .0 1 3 0 .7A s p ir in t a b le t s --------------- --------------- --------- 9 9 .5 100 .3 100 .3 9 9 .9 9 9 .li 9 9 .5 9 9 .8 9 8 .6 1 0 0 .0 1 0 0 .7 102 .3 108 .0M ilk o f m agnesia— --------------------------------- 9 9 .7 1 0 0 .0 1 0 0 .2 100.5 1 0 0 .7 1 0 1 .ii 1 0 8 .2 112 .3 l l i i . l 1 2 3 .0 1 3 2 .8 1 3 6 .3M u ltip le v ita m in co n ce n tra te --------------- Dec 52 — — ------- -• — -------- -------- — — - 1 0 0 .1 1 0 0 .8 1 0 1 .1 10 1 .it 1 0 1 .6 1 0 1 .2
P erson a l c a re — — ------- — — ---------------------- 9 7 .6 1 0 1 .3 1 0 1 .1 1 0 1 .1 1 1 0 .5 11 1 .8 1 1 2 .8 1 1 3 .Ii 1 1 5 .3 1 2 0 .0 12ii.i| 1 2 8 .6M en's h a ir c u t s --------- — ------- — ------------- — — 9U.3 1 0 0 .9 lO li. 9 1 0 8 .2 1 1 8 .7 1 2 7 .5 1 3 1 .6 1 3 3 .1 i i a . i i 1 5 0 .8 1 5 9 .3 162 .7Beauty shop s e r v ic e s --------- ------------------------- 1 0 0 . it 1 0 0 .3 99.>i 9 6 .3 1 0 1 .6 lO i i . l 1 0 6 .3 1 0 9 .1 1 1 1 .3 n i i . 5 U 9 .3 1 2 i i . l
Shampoo and wave s e t ------- — ------------------- 9 9 .8 1 0 0 .0 1 0 0 .2 9 9 .8 10U .3 1 0 8 .2 1 1 2 .2 1 1 6 .5 1 1 9 .5 12li.9 1 3 2 .6 l i i0 .6Permanent wave------- — ----------- ----------------- 1 0 1 .1 i o o . 5 9 8 .i i 9 6 .3 9 8 .0 9 8 .i i 9 8 .0 9 8 .5 9 9 .8 9 9 .i i 1 0 0 .1 1 0 0 .ii
T o i l e t goods— — — — — — ------- -- 9 9 .1 1 0 2 .2 9 8 .7 9 6 .1 106 .8 1 0 !i.5 10lt.0 1 0 3 .5 1 0 3 .ii 1 0 5 .8 1 0 9 .2 U 3 .3T o o t h p a s t e - - - - ------------------------------------------ 9 5 .5 1 0 0 .1 10ii.3 102 .3 1 0 9 .7 1 0 6 .8 1 06 .7 1 0 7 .0 1 0 6 .8 n o .3 1 1 2 .9 1 2 0 .0Face powder-----------— — — — — —— 9 6 .5 1 0 0 .2 10 3 .3 1 1 0 .7 1 3 2 .1 1 3 2 .7 1 3 3 .ii 1 2 7 .1 1 2 0 .8 1 21 .8 1 2 5 .3 1 2 5 .5T o i l e t s o a p ---------- ------------------------------------- 1 0 5 .1 lOiuO 9 0 .9 8 3 .2 9 2 .2 8 5 .0 8 2 ,5 8 5 .1 8 7 .l i 9 0 .ii 9 5 .5 1 0 1 .1R azor b la d e s --------------------- — --------- ----------- 9 9 .8 9 9 .9 100.1, 1 0 0 .li 1 0 0 .8 1 0 0 .9 1 0 0 .9 1 0 1 .0 1 0 1 .0 1 0 3 .1 1 0 3 .2 1 0 3 .0S a n ita ry n a p k in s-------------------------------------- 9 0 .1 1 0 3 .2 1 0 6 .8 1 0 7 .9 1 2 1 .6 12 ii.8 1 2 5 .2 1 2 6 .0 1 2 6 .2 1 2 6 .1 n a . i 1U5.9C lea n s in g t is s u e --------------- — --------- ---------- Dec 52 — . . . . . — — — — — — — 9 3 .9 9 6 .7 9 1 .0 8 5 .9 8 6 .2 8 6 .9Shaving cream— — ------- — ------------------- Dec 52 — — — — . . . . . . . . . . — --------- 1 0 0 .1 1 00 .3 10 li. 2 1 0 8 .ii 1 0 8 .8 U 0 .1Face cream------------------- — — - — ------------- Dec 52 — — — — . . . . . . . . . . - - - - - . . . — 1 0 0 .2 9 5 .3 9 2 .7 9 7 .5 1 0 5 .0 U 9 .3Shampoo— _____________________ ___ _______ Dec 52 . . . . . . . — . . . . . . . . . . . . . . . 9 9 .9 1 0 0 .6 10 0 .9 1 0 0 .9 1 0 2 .0 10 1 .1Home permanent r e f i l l --------------- ------------- Dec 52 — ------- -- -------- -------- 8U .2 9 5 .5 1 0 5 .2 1 0 6 .1 1 1 8 .2 1 3 8 .1 liiO .1 1U2.3
R eadin g and r e c r e a t io n — — --------------- ---------- 9 5 .5 1 0 0 .il 1 0 l i . l 1 0 3 . ii 1 0 6 .5 1 0 7 .0 1 0 8 .0 1 0 7 .0 1 0 6 .6 1 0 8 .1 1 1 2 .2 U 6 .7M o tio n -p ic tu re a d m iss ion s— — — — — 9 8 .ii 9 9 .5 1 0 2 .0 1 0 1 .6 1 0 3 .1 10 ii.0 1 0 9 .0 1 1 6 .0 1 2 1 .9 12U.7 1 3 0 .5 1 3 5 .7
A d u lts --------------------------------------- :------------------- 9 8 .0 9 9 .6 1 0 2 .5 1 0 2 .1 1 0 ii.6 1 0 5 .6 1 1 0 .2 1 1 7 .9 12it«2 1 2 7 .2 1 3 2 .3 136 .8C h ild ren ------- ----------------------- ----------------------- 1 0 0 .2 9 9 .6 1 0 0 .2 9 9 .1 9lt.3 9 3 .9 1 0 0 .7 1 0 i}.6 109 .lt U l . l U 9 .0 1 2 6 .5
Newspapers— ------- — - — 9 2 .0 1 0 1 .0 1 0 6 .9 108.0 1 0 9 .8 1 1 6 .5 1 2 1 .0 1 2 1 .0 123 .it 1 2 it .l 135 .9 litit .8T e le v is io n s e t s — -----------------— — - — — Dec 52 — — — . . . . . . . . . . U 5 . i i 1 0 1 .8 9 7 .9 9 1 .li 8 6 .2 8 6 .6 9 0 .3 9 2 .0R a d io s , t a b le — ------- — — — — — ----- — Dec 52 — — — — 9 0 .ii 9 9 .3 1 0 0 .2 9 9 .2 9 5 .3 9 1 .6 8 8 .7 90«ii 8 8 .3Toy 8--------------------- --------------------------------------------- Dec 52 — — — — - — — — 9 6 .7 9 1 .9 9 0 .6 9li.U 9 5 .1 9 6 .5S p o r t in g goods------- ------- ------------------------------- Dec 52 . . . . . - - - - - — — . . . . . — — - - — - 9 7 .6 9 3 .9 9 0 .ii 9 0 .3 9 1 .8 9 6 .8T e le v is io n r e p a ir s ---------------------— ------------- Dec 52 . . . — . . . . . — — — — 1 0 5 .ii 1 1 2 .6 U 7 .i l 1 2 2 .8 1 2 8 .7 1 3 5 .9
Other goods and s e r v ic e s --------- — — — 9 6 .1 100.5 1 0 3 . li 1 0 5 .2 1 0 9 .7 1 1 5 .It 1 1 8 .2 1 2 0 .1 1 2 0 .2 1 2 2 .0 1 2 5 .5 1 2 7 .2T ob a cco p rod u cts ------------------------------------------- 9 6 .1 100.5 1 0 3 .5 1 05 .3 1 0 8 .8 n i t . o 1 1 9 .2 1 2 0 .8 12 1 .3 1 2 3 .9 1 2 7 .3 1 3 1 .3
9 7 .1 9 9 .6 10 3 .3 103 .7 1 0 6 .5 1 0 6 .5 1 0 7 .6 1 0 8 .1 1 0 9 .2 1 0 9 .8 1 0 9 .5 1 0 9 .7C ig a r e t t e s — ----- ----------------- ------------- -------- 9 5 .7 10 0 .8 1 0 3 .5 I0 5 .it 1 0 9 .3 U 5 .1 1 2 0 .9 1 2 2 .6 1 2 3 .1 1 2 5 .9 1 2 9 .6 13li.O
A lc o h o l ic b ev era g es------------------- ------- — ----- Dec 52 ------- -- . . . . . — — . — — — — - - - - - - 1 0 0 .7 1 0 3 .1 1 0 2 .8 l O i i . l 1 0 6 .9 1 06 .8Dec 52 1 0 1 .0 10 ii.8 1 0 3 .9 1 0 5 .5 1 0 7 .6 1 0 7 .ii
W hisky----------------------------------- !---------------------- Dec 52 _ _
—
1 0 0 .1 1 0 0 .5 1 0 1 .2 1 0 2 .1 1 0 5 .8 1 0 6 .0
Z J A lso in cludes ra d ios and t e le v is io n s e t s , shown separately under reading and re cre a tio n . U Not a v a ila b le .
51
Digitized for FRASER http://fraser.stlouisfed.org/ Federal Reserve Bank of St. Louis

Table B -5 . Consumer P rice Index—United States c i t y averages Indexes o f s e le c te d items and groups, q u a rterly , 191*7-58
(1947-49=100 u n le s s o th erw ia e s p e c i f i e d ) _____________________
Item and grou p
OtherIn d exb a ses
_ i2 k Z . 1.21*8Mar. June * S ept. Dec. Mar. June Sept. Dec. Mar. June Sent. ■ P s p ._
9 3 .7 9U.2 9 8 .3 1 0 0 .2 10 0 .2 1 0 3 .1 10l*.8 1 0 3 .0 1 0 1 .9 1 0 2 .0 1 0 2 .1 1 0 1 .0
9 3 .6 91) .1 9 6 .5 9 8 .6 1 0 0 .1 1 0 1 .1 1 0 3 .6 10U .0 103.1* 1 0 2 .7 1 0 2 .8 1 0 3 .19 3 .9 9l*.i* 9 8 .5 1 0 0 .5 10 0 .3 1 0 3 .5 1 0 5 .2 1 0 3 .0 1 0 1 .6 1 0 1 .6 1 0 1 .6 1 0 0 .0
9 3 .8 91* .1* 9 9 .0 1 0 1 .1 1 0 0 .6 10l*.2 1 0 5 .7 1 0 2 .8 1 0 1 .0 1 0 1 .0 1 0 0 .5 9 8 .59 3 .8 9i*.l* 99 .2 1 0 1 .3 1 0 0 .6 10i*.6 1 0 5 .8 1 0 2 .5 1 0 0 .5 1 0 0 .7 100.1* 98 .29U.1* 9 5 .1 96 .7 9 9 .8 1 0 2 .0 1 0 2 .5 10l*.9 10l*.8 1 0 2 .5 1 0 0 .6 9 9 .8 9 9 .69 2 .2 92.8 95.1* 9 9 .7 1 0 1 .3 1 0 2 .2 id * .7 101*.9 101*.0 1 0 2 .2 102 .2 1 0 2 .793 .2 9 3 .3 9 6 .7 98.1* 9 9 .7 9 9 .8 10U.8 10 5 .2 10l*.8 1 02 .7 102.1* 1 0 2 .59 5 .6 9 5 .6 9 8 .1 1 0 0 .5 1 0 2 .2 10 2 .2 101*.3 10i*.9 1 0 2 .6 99.1* 9 8 .3 98.1*
9lw3, 9l).8 9 7 .0 9 9 .6 1 0 1 .6 1 0 2 .0 10i*.8 10l*.9 1 0 3 .0 1 0 1 .1 1 0 0 .1 9 9 .9
9 3 .1 93.1) 9 5 .8 9 7 .3 9 8 .5 9 9 .7 1 0 2 .0 103 .2 10U.2 10l*.8 10 5 .7 106.891t.O 9l*.l* ‘ 95 .2 9 6 .5 9 7 .8 9 9 .2 1 0 2 .3 1 0 3 .6 10l*.5 10l*.8 1 0 5 .8 1 0 6 .7
9 5 .9 9 6 .2 97 .2 9 8 .0 99 .2 9 9 .5 100 .2 1 0 1 .8 1 0 2 .7 103.1* 10i*.2 1 0 5 .19 7 .0 9 6 .7 97 .7 9 8 .0 9 9 .3 9 9 .6 1 0 0 .2 1 0 0 .8 1 0 1 .7 1 0 2 .8 1 0 3 .9 10l*.988.1* 8 9 .3 8 9 .6 . 91.1* 92.1* 9 7 .0 107.1* 1 0 7 .7 1 0 9 .5 1 0 9 .7 1 1 2 .1 115.1*9 3 .3 9l).3 9 5 .8 9 6 .7 9 8 .9 1 0 1 .0 102.1* 103.1* 10l*.2 ioi* .5 1 0 5 .0 1 0 5 .59 6 .9 9 6 .5 9 7 .0 9 8 .7 9 9 .7 9 9 .2 1 0 0 .5 102.1* 1 0 2 .8 102.1* 1 0 3 .1 1 0 2 .3
' 9 3 .8 9U.3 1 0 0 .7 102.1* 1 0 0 .1 106.0 1 0 6 .5 1 0 1 .5 9 9 .8 1 0 1 .1 1 0 1 .1 9 7 .7..... ..... ..... ..... —— ---------—----- ....———aa»
8 9 .6 9 3 .5 9 5 .5 1 0 3 .1 103.1* 1 0 3 .6 1 0 3 .3 1 0 3 .0 1 0 2 .9 1 0 2 .7 1 0 2 .7 102.1*89.1* 93.U 1 0 3 .6 9 7 .8 9 6 .7 1 0 9 .8 111*.2 1 0 3 .9 9 8 .8 1 0 3 .6 101*.9 9 6 .197.1) 8 9 .0 1 0 1 .3 106. 1* 10l*.l* 1 0 6 .9 108. 1* 103.1* 9 8 .8 91* .5 9 6 .2 96 .79 7 .7 1 0 0 .4 9 7 .1 1 0 0 .5 1 0 1 .3 105 .2 9 5 .9 9l*.2 1 0 5 .0 1 0 6 .7 9 7 .8 9 7 .19 7 .6 9 5 .1 10l*.3 1 0 9 .5 9 7 .9 1 0 0 .0 1 0 6 .0 1 0 3 .0 9 3 .0 9l*.9 1 0 2 .3 99 .3
—— -------- .—- — —
9 3 . C 9 3 .3 9 6 .8 99 .2 1 0 0 .5 1 0 1 .2 1 0 2 .9 1 0 3 .7 1 0 3 .6 1 0 2 .7 1 0 3 .2 10l*.29 2 .3 9 2 .6 9 6 .5 9 8 .3 9 9 .3 1 0 0 .2 1 0 1 .8 1 0 3 .0 1 0 3 .9 10l*.8 1 0 5 .7 1 0 7 .0
—— — — —— — — - —*•“ ** — —- a— —
_____ ________ — ________,______- — --_____ ________ —
.—— — — — —— ---------- —— - — — .—. — — -— - - — - — — - — —— ------------ — — ------------ —-------- 1—— ------------ ------------- —-------- -----------— — ------------— ------------ ------------ - —— — — — ——— — — — —— —«— — ——«. —— — —-------- ------------— — - .—. — — — — — -— — ----------- ------------— — — — — — — — — — —
— — — — — — — — — — —
9 7 .8 97 .2 9 7 .7 9 8 .2 9 9 .5 9 9 .9 1 0 0 .3 1 0 1 .1 1 0 1 .9 1 0 2 .8 1 0 3 .0 1 0 3 .19 6 .5 9 5 .8 96.1* 9 7 .1 9 9 .3 9 9 .9 9 9 .9 1 0 1 .0 1 0 3 .3 10l*.0 101*.7 10i*.89 9 .1 9 8 .9 9 9 .1 99.1* 9 9 .7 9 9 .3 100.1* 1 0 0 .8 1 0 0 .0 1 0 1 .2 1 0 1 .1 1 0 1 .181*.l* 81*.0 9 3 .3 97.1* 9 9 .9 1 0 2 .8 108 .7 1 0 8 .9 1 0 9 .6 10l*.2 1 0 5 .8 1 0 9 .08 5 .3 8U.1 9 l* .l 9 7 .3 9 8 .7 1 0 1 .9 108.6 1 0 8 .8 109 .7 101*. 8 1 0 6 .3 1 0 9 .67 9 .5 8JU.8 8 8 .0 9 9 .7 1 0 9 .9 109 .2 1 1 0 .6 110 .2 1 0 8 .5 100.1* 1 0 2 .5 1 0 5 .199.1* 9 6 .6 9 7 .1 1 0 1 .8 1 0 2 .9 1 0 2 .0 1 0 2 .0 1 0 2 .7 1 0 0 .9 9 9 .6 99.1* 1 0 0 .0
10U.3 1 0 2 . 1* 9 7 .5 H i* .5 1 1 1 .2 10i*.7 1 0 3 .6 103.1* 93.1* 8 8 .5 85.U 81*.29 2 .3 9 3 .8 95 .2 9 7 .5 98 .7 9 9 .0 9 9 .9 105.0 10 5 .3 1 0 5 .6 1 0 5 .6 106.19l*.6 9 5 .6 9 7 .3 99 .2 1 0 0 .1 1 0 1 .0 1 0 1 .1 1 0 2 .9 1 0 2 .9 1 0 3 .1 102.1* 1 0 2 .99 6 .7 9 9 .6 9 9 .9 1 0 0 .1 1 0 0 .1 100.1* 100.1* 100.1* 1 0 0 .8 1 0 0 .8 1 0 0 .8 1 0 0 .89i*.0 9U .1 ’ 9 7 .1 9 7 .1 99.1* 9 9 .7 10 1 .2 1 0 1 .9 1 0 1 .9 1 0 2 .1 1 0 5 .9 1 1 0 .997.1* 97.1* 97.1* 97.1* 97.1* 97.1* 97.1* 97.1* 1 0 5 .9 1 0 5 .9 1 0 5 .9 1 0 5 .9
MOTWMM ■M ttm Mfl.
9 6 .1 9 6 .3 9 8 .8 1 0 0 .9 1 0 2 .7 102 .7 10l*.i* 10l*.7 1 0 2 .2 9 8 .7 9 7 .8 9 7 .7..... ..... ..... ..... ———. ......... — ------------ .......... ..... ———aaaaa
1 0 3 .9 9 8 .0 9 5 .3 98.1* 9 8 .9 100 .7 1 0 2 .5 1 0 1 .1 1 0 0 .3 99.1) 1 0 0 .7 1 0 0 .71 0 0 .0 99 .2 9 9 .2 1 0 3 .2 1 0 5 .8 106 .2 1 0 6 .0 1 0 6 .0 102 .2 9 1 .0 88.1* 8 9 .8_______ ..... 1 0 3 .3 1 0 3 .5 1 0 6 .1 106.1 106.8 1 0 0 .9 9U .5 9 0 .0 8 8 .3 8 7 .8(V) (V) 99 .3 9 8 .8 ( i / ) (V) 9 8 .8 100 .2 (V) (V) 100 .7 1 0 1 .1
..... ..... ..... —— — —— — — — — — ■— — — — - - - - - aaaaa
— — — — — — — — — —
9 5 .2 9 3 .9 9 5 .9 9 6 .0 99.1* L00.1 1 0 3 .1 io l* .o 1 0 5 .1 10l*.2 1 0 2 .5 101* .1*1 0 5 .9 1 0 6 .5 9 8 .9 9 1 .2 9 6 .0 9 7 .8 1 0 0 .2 100 .2 101.1) 9 9 .6 101.1* 102 .3..... ..... -----... ..... ————— .—-a.a. —————-------—_ a———..... —a—a a aaaaa
9 3 .3 9 8 .1 9 9 .5 101.1* 102.1* L01.9 102.1* 102.1* 102.1* 0-01.9 9 9 .1 9 8 .2
12h 9.
A l l i te m s -
A l l i t e n s l e s s f o o d - A l l i t e n s l e s s s h e l t
C on m od itie s -N ondurables-
N ondurables l e s s f o o d - N ondurables l e s s fo o d and a p p a r e l-
D urables--------- — --------- ------- ------------------------- -D urables l e s s c a r s -
C on m odities l e s s f o o d -
S e r v i c e s -S e r v ic e s l e s s r e n t -
H ousehold o p e r a t io n s e r v ic e s , and e l e c t r i c i t y — - — - — —
H ousehold u t i l i t i e s l / - T ra n sp o rta t io n s e r v ic e s — M ed ica l ca re s e r v ic e i O ther s e r v ic e s — -
F ood -Food a t h cn e -
C e re a ls and bak ery ;M eats, p o u lt r y , and f i s h -D a iry p ro d u cts --------- ------------F r u it s and v e g e ta b le s —Other f o o d s a t hone
Food away f r o n hone Jan 53
H ousing 2 / ~ R e n t-Hone m aintenance and r e p a ir s —
E x te r io r house p a in t— ---------Porch f l o o r i n g - W ater h e a te r s —C a bin et k it ch e n s in k s - S ink fa u c e t s --------------------R e p a in tin g :
R e p a in tin g garage— R e f in is h in g f l o o r s - R e sh in g lin g r o o f -
O ther hone-ow ner c o s t s :F i r s t m ortgage i n t e r e s t r a t e s -P rop erty in su ra n ce r a t e s -----------
Gas and e l e c t r i c i t y -------------------------Ga8-----------------------------------------------------
DecDecDecDecDeoDecDecDecDecDec
DecDec
E l e c t r i c i t y - S o l id f u e l s and f u e l o i l —
S o l id f u e l s -Petroleum fu e l s -
H ousehold o p e r a t io n ---------lau n dry soap s and d e te r g e n ts Laundry s e r v i c e s -Dry c le a n in g and p r e s s in g -D o n e s tic s e r v ic e --------- ----------Telepho:P o s ta g e - Water—
H o u se fu rn ish in g s - T e x t i l s s -
T ow els , ba th ------S h e e ts , m u s l in - C u rta in e -
Dec 52
Dec 52
B la n k ets , w o o l-B ed spreads, c o t to n —D rapery f a b r i c , c o t t o n -
F lo o r c o v e r in g s :R ugs, w oo l A xm inster— -C a rp e ts , w oo l b ro a d lo a a — C a rp e ts , ra y on b roa d loom -
f e l t b a s e " — — — —
DecDeo
Dec 52
See f o o t n o t e s a t end o f t a b le52
Digitized for FRASER http://fraser.stlouisfed.org/ Federal Reserve Bank of St. Louis

Table B -5 . Consumer P rice Index—United States c i t y average: indexes o f se le c te d items and groups, q u a rterly , 19U7-58 . (Cont*d)
Item and group
A ll items--------------------------------------------- 7- -------
A ll item s le s s food— ---------------------—-------A ll item s le s s shelter — ---------- ------------
Commodities— ---------------------------------------------
Nondurables le s s food — — — - — - Nondurables le s s food and a p p are l-
Durables-------------------------------------------------—Durables le s s cars--------------------------------
Commodities le s s food ------— —- — -------------
S ervices—— —---------------------------------------------S ervices le s s ren t------------------------------ --
Household operation se rv ice s , gas,and e l e c t r i c i t y - — ------------------
Household u t i l i t i e s l / ------------------Transportation se rv ices --------------------M edical care serv ice s -----------------------Other se rv ices ------------------------------------
Food— — ...—Food a t hcme-
Cereals and bakery ;Meats, p ou ltry , and f i s h - Dairy products—F ru its and veg etab les- Other food s a t home
Food away from hcme-
Housing 2 / “ '
R ent-Home maintenance and rep a irs— -----
E xterior house paint— --------------Porch f lo o r in g ------------------------------Water heaters— — — — - —-----Cabinet k itchen s ln k s- Sink fa u ce ts ------------------Repainting : Repainting garage— R efin ish in g f l o o r s - Re8h ln g lin g r o o f -
Other home-owner c o s t s :F ir s t mortgage in te re s t ra te s - Property insurance r a te s -
Gas and e le c t r i c i t y --------------Gas-E le c t r ic i t y -
S o lid fu e ls and fu e l o i l - S o lid fu e ls —------—Petroleum f u e l s —
Household op era tion—-------- — —Laundry soaps and detergen ts- Iaundry s e rv io e s -Dry clean ing and p ress in g -Domestic s e rv ice ------------------Telephone— ---------------------Fostage-W ater-
Housefurnishinge T e x t i le s -
Towels, bath-----Sheets, m uslin- Curtains-------------B lankets, w oo l- Bedspreads, o o t t Drapery fa b r ic , c o t t o n -
F loor coverin gs:Rugs, wool Axminster-----Carpets, wool broadloom— Carpets, rayon broadloom - Rugs, f e l t base— — —
(1947-49=100 un less otherwise s p e c ifie d )Other e o 1?51 1952bases Mar. June . Sept. Dec. Mar. June Sept. Dec. Mar. June Sept. Dec.
100.7 101.8 10it.lt 106.9 110.3 110.8 H I .6 113.1 112.it H3.it l l l t . l l l i t . l
103.1 103.0 105.2 107.it 110.1 110.5 H I . 7 112.7 112.9 113.3 llit.O llit.899.7 100.7 103.5 106.2 109.9 H 0.3 H 1 .0 H 2.5 111.6 H 2 .6 H3.it 113.0
97.9 100.3 102.8 106.0 109.9 110.3 110.9 112.it 1H .0 111.7 112.3 H I .697.6 100.2 102.5 105.8 109.9 110.3 H 1 .0 112.it 110.8 1H .7 112.5 H 1.599.3 99.0 102.0 10it.9 108.1 108.3 109.6 109.8 109.1 108.5 109.3 109.1
102.lt 101.6 10it.8 107.8 110.1 H 0.2 109.9 111.5 111.7 H I . 7 H 2.9 113.3102.1* 102.it 106.1 108.8 112.it 112.5 112.5 113.9 llit.it H 3.3 113.5 113.8
98.3 98.3 lOlt.O 108.1 112.1 112.0 110.5 110.5 109.3 107.7 107.6 107.7
99.5 99.it 102.6 105.5 108.5 108.8 109.8 110.it 110.0 109.3 109.7 109.8
107.lt 107.9 109.2 110.8 H 3.1 H 3.7 115.0 116.5 H 7 .6 H 9.3 120.3 121.9107.0 107.0 108.9 111.0 113.8 Hit .2 115.5 117.0 118.1 120.3 121.5 122.5
105.1 105.2 106.2 107.8 108.6 108.9 109.7 111.8 112.it 113.2 llit.O 115.310l*.8 10it.9 105.5 105.6 105.8 105.8 106.9 107.8 108.7 109.2 109.8 i io .5U 5.5 115.7 120.8 123.1 127.9 128.3 131.8 132.6 13it.3 138.2 litl.5 1U3.2106.2 106.5 107.it 109.0 111.3 H 2.2 112.9 H5.it 117.3 120.0 121.2 121.7102.7 102. i* 103.3 106.3 109.2 109.2 109.3 109.9 110.it H I .9 1H .6 112.0
97.3 100.5 lOit.O 107.1 112.0 112.3 H 2.5 115.0 H 2.7 llit.6 H5.it 113.8
102.3 102.7 107.0 107.5 H3.it llit.O llit.6 H 5.2 H 5.7 116.9 H7.it 117.798.7 106.1 112.it 109.1 117.2 116.9 118.6 116.3 115.2 116.5 119.2 113.09lt.7 92.3 97.0 100.7 106.2 105.9 107.2 110.7 112.0 108.9 H 2.5 112.795.5 102.5 91.1 99.9 106.3 107.7 100.it 115.8 H 3.7 122.it 111.5 H 5.8
Jan 5395.5 9i*.l 107.7 117.0 112.7 H 3.8 Il8.it llit.5 10it.it 105.2 113.7 110.6
10l*.6 10ii.9 107.1 109.it H I .7 H 2.3 112.9 113.9 llit.O llit.O llit.8 H6.it
Dec 52 Dec 52 Dec 52 Dec 52 Deo 52ru . co
107.8 108.7 109.5 H0.it H I .9 H 2.7 llit.2 115.6 116.7 117.6 H 8.3 120.7 100.0 100.0 100.0 i r\r\ n
— — — — — — — — — — —
i i
i i
i i
: :
i
— — — — — — — — — —J-UUeU100.0100.0Dec
Dec 52 Dec 52 Dec 52 Dec 52
Dec 52 Dec 52
—— — —
i i
i i
i i
i i
i i
i i
i i
i— —
i i
i i
i i
i i
i i
i i
i i
i
—100.0100.0100.0
— — — — — — — — —
100 .0
100.0100.0105.6102.8102.7 102.8 102.7 103.1 103.0 103.2 103.it 103.8 lOit.3 io5 .o
10lt.7 ioit.5 lOit.l 103.6 103.9 103.it 103.8 10it.it 105.1 106.2 106.2 106.8101.1 101.2 101.2 101.2 101.7 102.0 102.i- 102.2 102.5 102.5 103.6 ioit.3109.9 107.6 111.6 liit .8 116.7 H5.it 116.6 117.6 117.7 115.8 119.6 123.2111.8 108.6 112.6 H 5.2 118.0 115.7 117.6 118.9 119.0 116.0 119.0 125.1103.6 102.9 107.1 110.9 l l l . i t 111.6 H I .7 112.1 112.2 112.1 116.7 116.899.5 99.6 102.3 105.6 108.lt 108.7 108.8 1 1 1 . 1 1 1 1 . 0 111.2 112.1 113.it81.5 80.9 85.7 92.3 99.7 98.6 9it.it 93.7 91.8 88.5 88.8 88.8
106.3 106.it. 108.8 115.2 116.6 116.5 116.2 116.7 116.9 118.5 120.3 121.6102.7 102.it 106.5 108.2 HO.3 112.2 H 2.2 112.1 112.1 113.0 112.9 113.8100.8 100.8 101.1 101.1 102.9 10it.3 105.1 111.5 H I .6 H2.it 112.7 116.21 1 1 . 1 111.8 113.6 Hit. 9 llit.6 H it.8 Hit. 8 H 6.1 H fi.9 H 8.9 119.5 120.6
Dec 52105.9 105.9 105.9 105.9 105.9 105.9 105.9 H 9.1 H 9.1 119.1 119.1 119.1
100.0108.297.7 97.it 102.it 107.1 1 1 1 . 1 112.0 111.3 110.8 109.it 107.7 108.1
Dec 52 ---------- ' ________ ________ 101.it 105.9 108.0 107.7 lCit.8 100.8 99.2 99.1 100.0100.3 100.3 107.5 116.5 121.3 122.0 120.6 117.9 117.2 115.8 117.2 116.5
90.2 88.8 102.8 116.1 120.9 120.3 112.8 lH .it 10it.7 99.1 99.6 101.788.7 88.5 95.7 lOit.O 108.8 112.6 110.3 108.3 10it.it 103.7 10it.it 105.it
Dec 52 Dec 52
(V) (V) 108.1 113.1 w (h / ) lit5.6 131.2 (h / ) (Jj/) 122.7 123.1100.0100.0
litl.2109.it 11U.8 131.1 11*2.9 1S7.9 162.0 151.9 lit8.3 11*2.8 137.5 138.3103.8 106.2 119.2 131.8 Ut2.5 li*6.0 126.7 122.0 120.it 113.8 llit.it 115.1
Deo 52 --------- ---------- ________ 96.5 103.it 105.1 106.0 101.7 102.6 100.0 98.3 100.098.2 97.6 97.6 98.2 102.1 101.1 101.it 103.it 105.it 105.it 106.0 106.0
See fo o tn otes a t end o f tab le,53
Digitized for FRASER http://fraser.stlouisfed.org/ Federal Reserve Bank of St. Louis
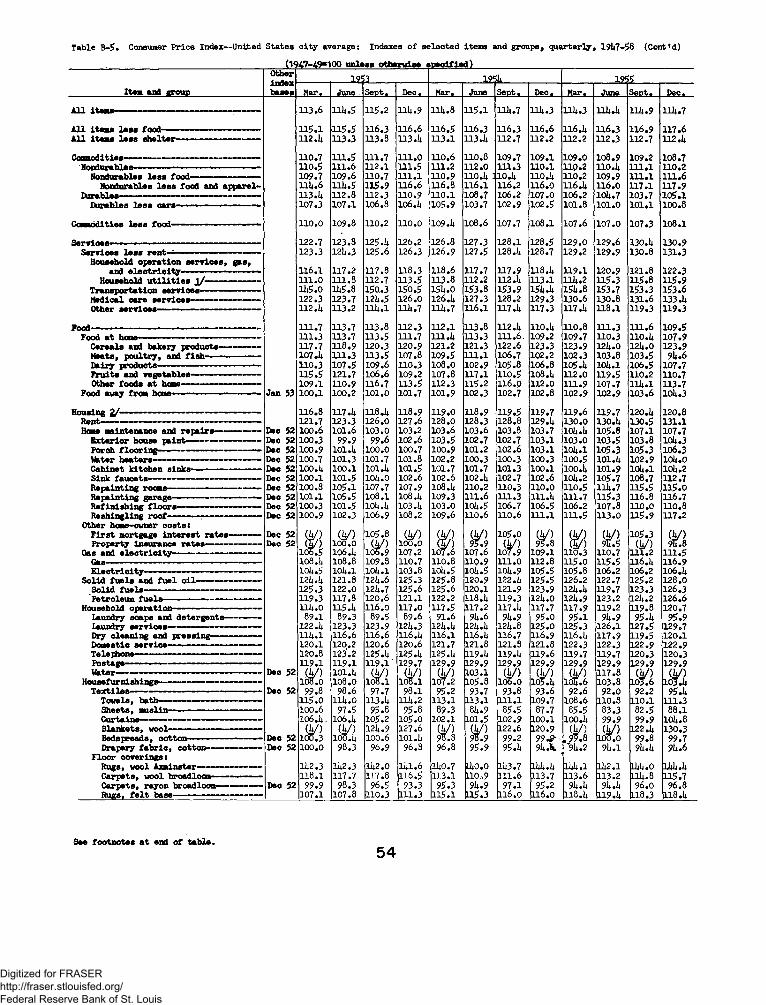
Table B-5 . Consumer Price Index—United Sta tes c ity averages Indexes o f se lected items and groups, quarterly , 19U7-58 (Cont*d)
(1947-49=100 unless otherw ise s p e c i f ie d )
Item and group
Other __________ 1253___________ ______ ____195:u______ _______ 12 Kbases Mar. June . Sept. Dec. Mar. June Sept • Dec. Mar. June S ept. Dec.
113 .6 1114.5 115.2 1124.9 1124.8 115.1 1124.7 Hl4.3 1124.3 1124.24 1124.9 1114.7
115.1 115.5 116.3 116 .6 1 1 6 . 5 116.3 116.3 116 .6 H6.I4 116.3 116.9 n ? .6112 .U 113.3 113 .8 113.24 113.1 113.24 112.7 112 .2 112 .2 112.3 112.7 112 . I4
110.7 111.5 111.7 111.0 110 .6 110.8 109.7 109.1 109.0 108.9 109.2 108.7110.5 1 1 1 .6 1 1 2 . 1 111.5 1 1 1 .2 112 .0 111.3 1 10 .1 11Q.2 110.24 111.1 n o .2109.7 109.6 110.7 111.1 110.9 1 1 0 .I 4 : 1 0 . h 110.24 110.2 109.9 111.1 m .6111* .6 U U .S 115.9 116.6 1 1 6 .8 1 1 6 . 1 116.2 116.0 116.U 116.0 117.1 117.9113.ii 112.8 112.3 110.9 110.1 10 8 .7 10 6 .2 107.0 10 6 .2 10ii.7 103.7 105.1107.3 107.1 10 6 .8 106.24 105.9 103.7 102.9 1 0 2 .5 101.8 101.0 101.1 100.8
110.0 109.8 110.2 110.0 109.24 10 8 .6 107.7 108.1 107.6 107.0 107.3 1 0 8 .1
122.7 123.8 125.U 126.2 126.8 127.3 128.1 128.5 129.0 129.6 130.24 130.9123.3 12U.3 125.6 126.3 126.9 127.5 128. 14 128.7 129.2 129.9 130.8 131.3
116.1 117.2 117.8 118.3 118.6 117.7 117.9 118.24 119.1 120.9 121.8 122.3111.0 111.8 112.7 113.5 113.8 112.2 112.24 113.1 1124.2 115.3 115.8 115.9iii5.o Ui5.8 150.3 150.5 1524.0 153.8 153.9 1524.24 1524.8 153.7 153.3 153.6122.3 123.7 1214.5 126.0 126.24 127.3 128.2 129.3 130.6 130.8 131.6 133.14112 .U 113.2 llU .l 1124.7 11U.7 116.1 117.24 117.3 117.24 118.1 H 9.3 n 9.3
111.7 113.7 113.8 112.3 112.1 113.8 112.24 110.U 110.8 111.3 111.6 109.5111.3 113.7 113.5 111.7 111.24 113.3 111.6 . 109.2 109.7 110.3 n o .24 107.9117.7 118.9 120.3 120.9 121.2 121.3 122.6 123.3 123.9 1224.0 1224.0 123.9107 .U 111.3 113.5 107.8 109.5 111.1 106.7 102.2 102.3 103.8 103.5 9li.6110.3 107.5 109.6 110.3 10 8 .0 102.9 105.8 10 6 .8 105.24 1024.1 106.5 107.7115.5 121.7 10 6 .6 109.2 107.8 117.1 110.5 108.24 112.0 119.5 110.2 n o .7109.1 110.9 1 1 6 .7 113.5 112.3 115.2 116.0 112.0 111.9 107.7 1U 4 .1 n 3.7
Jan 53 100,1 100.2 101.0 101.7 101.9 102.3 102.7 102.8 102.9 102.9 103.6 1024.3
1 1 6 .8 117.14 118 .14 118.9 119.0 118.9 119.5 119.7 119.6 119.7 120.24 120.8121.7 123.3 126.0 127.6 128.0 128.3 128.8 129.U 130.0 130.U 130.5 131.1
Dec 52 100.6 101.6 103.0 103.2 103.6 103.6 103.8 103.7 10i4. i4 105.8 107.1 107.7Dec 52 100.3 99.9 99.6 102.6 103.5 102.7 102.7 103.1 103.0 103.5 103.8 10U.3Dec 52 100.9 101.U 100.0 100.7 100.9 101.2 102.6 103.1 1024.1 105.3 105.3 106.3Dec 52 100.7 101.3 101.7 101.8 102.2 100.3 100.3 100.3 100.5 101.24 102.9 1024.0Deo 52 100.h 100.1 10 1 .14 101.5 101.7 101.7 101.3 100.1 100.24 101.9 10i4.1 1024.2Dec 52 100.1 101.5 IOI4.O 102.6 102.6 102.U 102.7 102.6 10U.2 105.7 108.7 112.7Dec 52 100.8 105.1 107.7 107.9 108.24 110.2 110.3 110.0 110.5 1124.7 n 5.5 n 5.oDec 52 101.1 105.5 1 0 8 . 1 108.24 109.3 111.6 111.3 111.24 111.7 115.3 n 6.8 1 1 6 .7Dec 52 100.3 101.5 loU.U 103.24 103.0 1024.5 106.7 106.5 10 6 .2 107.8 1 1 0 .0 110.8Dec 52 100.9 102.3 10 6 .9 10 8 .2 109.6 110.6 110.6 111.1 111.5 113.0 1 1 5 . 9 n 7.2
Dec 52 Dec 52
106.5(b /)
10 0 .0105.8(V)
106.9(V)
100.0 (V)( |0 (V)95.9105.0(h/)
(V)95.8 s #(V)9S .5
10 5 .3(V)
(V)9t. 8
106 .U 107.2 107.6 107.6 107.9 109.1 110.3 110.7 i n . 2 111.5108 .ii 10 8 .8 109.3 110.7 110.8 110.9 111.0 112.8 115.0 115.5 116.24 1 1 6 .9ioli.5 1014.1 10 U .1 103.8 1024.5 1024.5 1024.9 105.5 105.8 10 6 .2 10 6 .2 106.2412k.k 121.8 1224.6 125.3 125.8 120.9 122.24 125.5 126.2 122.7 1 2 5 .2 128.0125.3 122.0 12U.7 125.6 125.6 120.1 121.9 123.9 12U.24 119.7 1 2 3 . 3 126.3119.3 117.8 120.6 121.1 122.2 118.24 119.3 1224.0 1224.9 123.2 1224.2 126.6nl+.o 115 .U 1 1 6 .0 117.0 117.5 117.2 117.24 117.7 117.9 119.2 1 1 9 .8 120.789.1 89.3 89.5 89.6 91.6 924.6 924.9 95.0 95.1 924.9 95.U 95.9
122. h 123.3 123.9 1224.3 1224.24 1224.24 1224.8 125.0 125.3 126.1 127.5 129.7III4 .I 116.6 1 1 6 .6 116.24 116.1 116.U 116.7 116.9 116 .U 117.9 119.5 120.1120.1 120.2 120.6 120.6 121.7 121.8 121.3 121.8 122.3 122.3 122.9 122.9120.8 123.2 125.U 125.24 125.U 119.24 119.24 119.6 H 9.7 119.7 120.3 120.3119.1 119.1 119.1 ' 129.7 129.9 129.9 129.9 129.9 129.9 129.9 129.9 129.9
Dec 52 (V)108.0
1 0 1 . 14 10 8 .0
<y>1 0 8 . 1
(V)108.1(V)
107.2103.1L05.8
(V)106.0
(V)105.24
(V)IOI4.6
117.8103.8
(V)103.6
(V)103.U
Dec 52 99.8 98.6 9 7 .7 98.1 95.2 93.7 93.8 93.6 92.6 92.0 92.2 95.24115.0 llU.O 113.U 1124.2 113.1 113.1 111.1 109.7 10 8 .6 110.8 110.1 m .3100.6 97.5 95.8 95.8 89.3 824.9 85.5 87.7 85.5 83.3 82.5 8 8 .110 6 .li, 106. U 105.2 105.0 102.1 101.5 102.9 100.1 100.24 99.9 99.9 1024.8
Dec 52(V)
100.3(V)
100.141224.9100.6
12 7 .6101.24 (V)96.3
Q/ )98.9
122.699.2
120.9 99.0* •
(h/). 99.8> . 2
(]*/)100.0122.2499.8
130.399.7
Deo 52 100.0 98.3 96.9 96.3 96.8 95.9 95.24 9hX , 924.1 924.24 924.6
ll|2.3 1142.3 1242.0 1* 1.6 lh0.7 L240.0 1243.7 lhb*h 3M .1 1242.1 12424.0 12424.14118.1 117.7 117.8 116.5 113.1 L10,9 111.6 113.7 113.6 113.2 1124.8 n 5.7
Deo 52 99.9 98.3 96.5 93.3 95.3 924.9 97.1 95.2 924.24 924.24 96.0 96.8107.1 107.8 110.3 111.3 115.1 U S .3 1 1 6 .0 116.0 118.24 119.U 118.3 118.24
A ll item s-
A ll items le s s fo o d -A ll items le s s s h e lte r -
Conm odities-Nondurables-
Nondurables le s s fo o d -Nondurables le s s food and apparel-
Durables-Durables le s s ca r s -
Coumodities le s s fo o d -
S e rv ice s -S ervices le s s r e n t -
Household opera tion s e rv ice s ,and e l e c t r i c i t y — -------------
Household u t i l i t i e s j J --------Transportation s e rv io e s - M edical care s e r v ic e s - Other serv io e s— — —
gss ,
Food-Food a t hone-
Cereals and bakery Meats, p ou ltry , and f i s h - Dairy products—F ru its and veg etab les- Other food s a t hone-
Food away from hone-
Housing 2 / - Rent-Hone maintenance and rep a irs
E xterior house paint-----------Porch f lo o r in g ---------------------Water h ea ters - Cabinet k itchen sin ks Sink fa u ce ts - Repainting :Repainting garage— R efin ish in g f l o o r s - R eshingling r o o f -
Other hone-ovner c o s t s :F ir s t mortgage in te re s t r a te s -Property Insurance ra tes—------
Gas and e l e c t r i c i t y - Gas-E le c t r ic i t y -
S o lid fu e ls and fu e l o i l - S o lid f u e l s -Petroleum f u e l s -
Household op e ra tio n -laundry soaps and detergents-------laundry s e rv ic e s -Dry clean ing and pressing Domestic serv ice ' Telephone— —Postage----------------Water-
Housefurnishing s - T e x t ile s ------------
Towels, bath - Sheets, muslin— C urtains-B lankets, w o o l-Bedspreads, cotton — Drapery fa b r ic ,
F loor cov erin g s:Rugs, wool Axm inster- C arpets, wool b road loon -Carpets, rayon broadloom-------Rugs, f e l t base-----------------------
See foo tn otes a t end o f tab le5 4
Digitized for FRASER http://fraser.stlouisfed.org/ Federal Reserve Bank of St. Louis

Table B-5. Consumer Price Index—United States c ity average: Indexes of se lected items and groups, quarterly , 19ii7-58 (Cont'd)
(1947-49=100 un less otherw ise s p e c ifie d )
Item and group
Other ... ... 1956 _____________ 12SZ______________ _____________125S______________indexbases Mar. June . Sent. Dec. Mar. June SeDt. Dec. Mar. June,...Sspt.*-- D ec.
llli.7 116.2 117.1 118.0 118.9 120.2 121.1 121.6 123.3 123.7 123.7 123.7
117.7 118.1 119.1i 120.8 122.0 122.5 123.il 12ii.5 125.0 125.2 125.8 126.5112.5 l l i i . l l l i i .8 115.7 116.5 n 7 .8 118.7 119.2 121.0 121.it 121.5 121.5
108.5 110.3 111.0 111.8 n 2 .ii 113.7 lll|.5 n i i .7 ll6 .ii 116.6 n 6 .ii 116.3110.2 112.6 113.2 113.ii llii.O 115.8 116.7 116. ii 118.8 119.2 118.7 117.8112.1 112.3 113.9 n i i .7 115.6 115.8 n 6 .7 n 7 .3 116.9 116.7 117.2 117.0118.8 119.0 120.6 121.6 123.3 123.9 125.0 125.8 125.7 125.ii 126.0 125.iiloll .3 103.8 10li .8 108.0 108.6 108.ii 108.6 110.3 109.6 109.6 110.3 112.9100.9 100.ii 101.2 101.9 102.8 102.5 103.0 103.2 103.5 103 .ii 103.1 103.2
108.1 108.0 109 .ii 111.1 111.9 111.9 112.6 n 3 .6 113.1 n 2 .9 113.5 llii.ii
131.2 132.3 133.6 13ii.U 136.3 137.5 138.8 liiO.O liil.7 1U2.3 lii3.0 lii3.5131.6 132.7 13ii.l 13ii.9 137.1 138.ii 139.8 U il .l lii3.1 1U3.8 liiii.il 1U5.0
123.0 123.8 12li.5 125.2 126.!| 127.3 128.3 129.2 130.5 131.2 132.U 133.0116.1 116.8 117 .ii 117 .li 118.1 119.1 120.0 120.il 122.ii 123.2 125.1 125.3155.5 156.U 157.0 157.9 161.3 162.8 166.1 167.7 173.3 17ii.2 175.ii 176.213I1.9 135.6 137.8 138.7 lii0.6 li|2.0 1U3.3 iii5.o lii6.7 1U8.5 151.2 I52.ii118.7 120.0 121.5 122.2 12ii.6 125.7 127.1 128.2 129.6 129.9 129.ii 129.8
109.0 113.2 n 3 .1 112.9 113.2 116.2 117.0 116.1 120.8 121.6 120.3 118.7107.3 112.1 111.7 i n . 2 n i . i i n i i .7 115.5 llii.3 119.6 120.ii 118.7 116.8121ul* 125.2 126.6 127.il 129.8 130.6 131.2 131.8 132.7 132.9 133.5 13ii.O
92.8 98.0 101.3 98.0 100.6 106.9 110.3 106.0 llii.ii 118.3 115.8 113.0106.9 107.7 109,8 n i .3 110.7 110.0 113.1 n i i .6 l l i i . l 111.7 l l i i . l n i i .3H i; .8 131.U li i i . 8 117 Ji 116.1 126.8 n i i .8 113.9 130.7 13ii.3 120.7 120.1110.7 111.1 115.l1 n i i .2 111.6 109.5 115.0 n ii . 9 113.8 110.9 115.2 110.7
Jan 53 10ii.ii 10ii.9 106.0 107.0 108.1 109.3 110.5 111.0 n i . 8 112.7 113 .ii 113.6
120.7 121.ii 122.5 123.5 12ii.9 125.5 126.3 127.0 127.5 127.8 127.9 128.2131.6 132.5 133.ii 1314.2 13ii.ii 135.0 135.7 136.7 137.1 137.7 138.2 138.7
Dee 52 108.6 110.1 l l l .i i 112.8 113.7 115.2 116.2 116.1 116.7 116.9 117.1 117 .iiDee 52 107.6 108.3 108.9 112.1 n 3 .li 115.2 117.0 117.2 117.5 117.0 117.2 117.1Dec 52 107.8 108.0 108.2 107.9 109.8 109.8 109.8 109.8 109 .ii 108.8 108 .ii 108.3Dec 52 lOii.O* 10ii.il 10U.7 105.3 105.8 105.6 105.5 ioii.5 105.7 105.7 lOii.8 103.0Deo 52 105.9 106.0 105.7 108.5 107.8 108.8 109.0 108.6 107.3 106.3 103.9 103.3Dec 52 llli .5 116.3 n 9 .o 120.1 121 .U 123.1 123.8 121l.5 125.ii 125.7 126.8 128.1Dec 52 ll5 .li 118.7 120.7 122 .ii 123.2 126.1 128.8 128.9 129.7 131.0 132.7 133.2Dec 52 117.0 120.ii 122.3 12l|.8 126.1 133.3 137.7 137.7 137.3 liiO.O li|2.2 li|3.2Dee 52 110.8 113.6 n i i . 9 115.3 115.8 117.1 n 7 .9 117.3 116.8 117.ii 118.8 118.9Dec 52 118.1 122.0 12ii.5 12li.8 125.2 127.9 129.0 129.9 131.7 132.2 133.5 135.1
Dec 52 Dec 52 w
i i i .7
(V)9a.8
111.7
107.5 (kn
i i? .2
(V)9H.7
n 2 .o
113.7(V)
liZJi
cy>97.1
112.3
116.5(V)
113.7
(V ) 101.2 n ii . 3
117.3(V)115.9
cy)105.8116.9
l l i i . l(V)
118.0
cy)107.6118.2
117.1. 117.1 n 8 . i 117.9 118.ii 118.0 121.0 121.9 125.1 126.ii 128.1 128.6106.5 106.7 106.6 106.5 106.9 106.9 106.9 107.3 107.6 108.2 108.7 108.7130.6 128.ii 130.5 136.1 139.2 135.3 136.8 138.3 136.7 131.7 135.2 137.0128.3 12ii.7 128.3 135.7 136.2 131.5 135.7 138.3 139.0 133.1 136.2 137.5129.9 129.9 129.6 132.5 139.2 136.6 I3ii.l 13U.1 129.5 125.9 129.7 131.9121.6 122.6 123.7 12U.8 126.2 127.6 128.3 129.6 130.7 131.1 132.2 132.8
95.9 96.3 99.ii 100.2 101.0 101.6 102.ii 10i|.9 105.6 106.1 105.8 106.2131.9 133.1 13ii.5 135.2 136.1 137.ii 138.5 139.0 liil.7 liil .8 li|2.7 lii3.1120.7 122.0 123.2 125.U 126.5 127.7 128.0 128.2 128.8 128.6 128.7 128.7125.5 125.6 126.1 128.1 128.7 130.ii 130.9 131.5 131.1 131.7 133.6 136.0120.7 120.7 122 .i* 123.2 123.2 123.2 123.6 126.1 126.9 127.5 127.8 127.8129.9 129.9 129.9 129.9 129.9 129.9 131.0 131.0 131.0 131.0 l52.ii I52.ii
Dee 52 (V)103.1
118.9102.8
(V)103.3
(V)104.1
127.510ii.9
(V)104.6
(V)lOh.8
(V)101.9
136.ii103.9
(1 /)101.1
(U/)103.6 M
Dec 52 9ii. 1 93.7 9ii.8 95.ii 95.ii 95.2 95.7 95.2 9ii.5 91l.o 93.1 93.5113.0 109.5 108.7 109.9 109.2 108.3 105.8 107.6 108.7 107.6 108.1 108.1
87.9 88.2 90.1 91.7 91.9 91.7 92.2 92 .ii 89.8 88.1 86.6 89.1103 .li 103.1 lOii.ii 10ii.6 10ii.7 L03.0 102.9 100.8 99.5 98.8 97.5 95.6
Dec 52 (V)100.0
(h/) 122.9 123.8 (V)9?.9
(V ) 127.8 126.7 (1/) cy) 121.5 125.299.9 99.9 99.5 LOO.3 100.6 101.0 100.5 100.6 101.0 101.5
Dec 52 9il.2 93.5 93.5 93.6 93.6 9iu6 9U.8 9ii.0 9ii.5 95.2 95.1 95.0
lii7.2 lii7.1 lii7.7 lii8.1 l5ii.ii L55.0 157.0 156.9 151.7 153.1 L51.7 151 .ii119.5 119.2 n 8 .o 119.6 123.3 L2ii.3 126.8 127.8 127.8 126.7 L23.6 125.5
Dec 52 97.6 96.9 95.1 96.0 96.ii 95.5 95.5 9ii.7 93.0 91.9 91.3 90.9121.2 121.1* 121.7 121.7 125.5 126.0 0.26,8 0.27.1 CL27.9 CL28.5 127.8 0-27.7
A ll item s-
A ll item s le s s fo o d -A ll item s le s s sh e lter— — -
Commodities-Nondurables-
Nondur&bles le s s fo o d -Nondurablea le s s food and apparel-
Durables ----------------------------------------------------Durables le s s cars—
C om od ities le s s fo o d -
S erv ie e s -S ervices le s s r e n t -
Household operation s e rv ice s , gas,and e le c t r i c i t y --------— — - — -
Household u t i l i t i e s j / - T ransportation serv ioes—M edical care se rv ice s -------Other serv ioes— --------------
Food-------------------------------------------------Food a t hone— — — — —
Cereals and bakery products*Meats, p ou ltry , and f i s h -----Dairy products— --------------F ru its and vegetables*Other food s a t hone------------
Food away from hone— ------- —
Housing 2 / ------------------------------------Rent-------------------------------------------Hone maintenance and repairs*
E xterior house paint-------—Porch f lo o r in g — — -------------Water heaters— — — ---------Cabinet k itchen sin kSink fa u cets -----------------------------Repainting rocns----------------------Repainting garage— --------------R efin ish in g f l o o r s — --------------R eshingling r o o f— — -------—
Other hone-owner cos tss F ir s t mortgage in te re s t ratei Property insurance rates*
Gas and e le c tr ic ity *Gas-----------------------------------E le c tr ic ity ---------- ---------
S o lid fu e ls and fu e l oil*S o lid fu e ls --------------------Petroleum fu e li
HouseholdLaundry soaps and detergents—laundry serv ices— - — ------ ------Dry cleaning and pressing—Donestio se rv ice ------------------------Telephone------ ——— -— ---------------Postage----------------------------------------Mater--------------------------------------------
House furn ish ings— :-----------------------T e x t ile s --------------------------------------
Towels, bath------------— — ---- —Sheets, m uslin------ ----------------Curtains----------------------- — -----Blankets, wool — — — *Bedspreads, c o t to n----------------Drapery fa b r ic , cotton ---------
F loor coverin gs:Rugs, wool Axminstsr------------Carpets, wool broad loom-------Carpets, rayon broadl<
_______Ruga, f e l t bass*
See foo tn otes a t end o f tab le
55
Digitized for FRASER http://fraser.stlouisfed.org/ Federal Reserve Bank of St. Louis
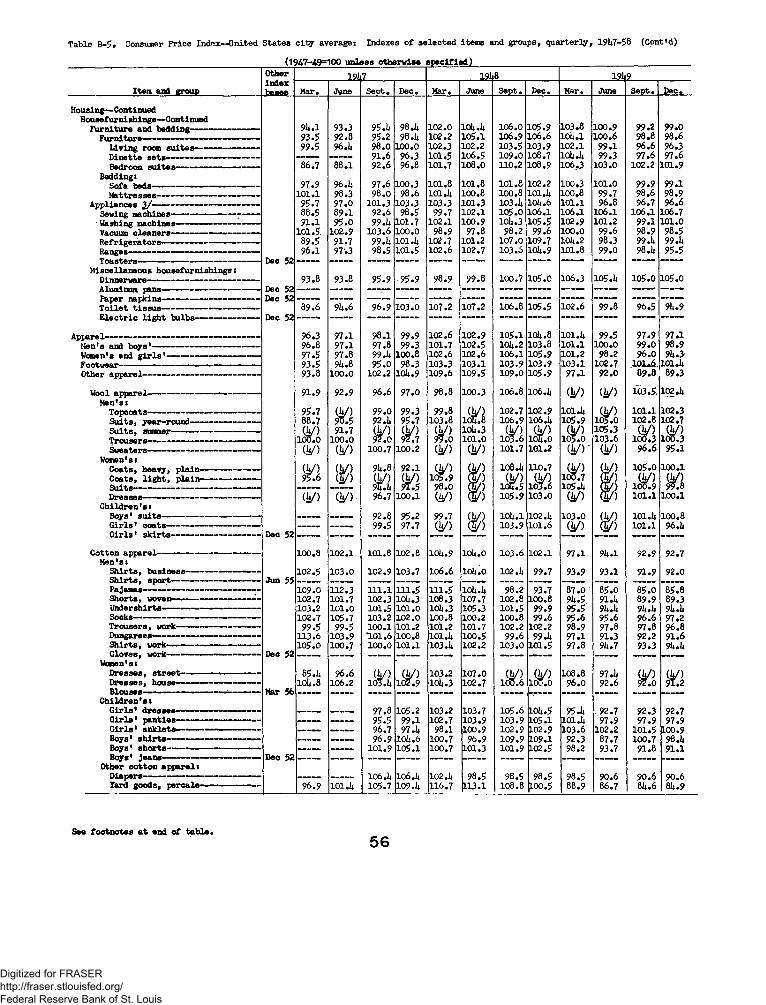
Table B-5. Consumer Price Index—United Sta tes c ity average: Indexes of se lected items and groups, quarterly , 191*7-58 (Cont'd)
(1947-49=100 un less otherwise s p e c ifie d )
Item and group
Housing— ContinuedHousefurni shings— Continued
Furniture and bedding---------Furniture--------------
L iving room su ites Dinette se ts -------—Bedroom su ite s -
Bedding:Sofa beds-----------M attresses------------------
Appliances 2 / ----------------—Sewing machines------------
• Washing machines-----------Vacuum cleaners— ---------R efr igera tors ----------------Ranges-
M iscellaneous housefurn ish ings: Dinnervare-Aluminum pans- Paper napkins- T o i le t t is s u e -E le c tr ic l ig h t bulbs-------------------------
Men's and b oys ' -Women'8 and g i r l s ' Footwear-Other apparel-----------------------------------------
Wool apparel----------------------------------------M en's:
S u its , year-round-— — --------------S u its , summer---------- --------------------Trousers— ------------------------------------Sweaters-------------------------
Women's:Coats, heavy, p la in -----Coats, l ig h t , p la in -----
Dresses— - — — — — C h ild ren 's :
Boys' s u i t s -G ir ls ' coa ts -------------------------------G ir ls ' s k ir ts -----------------------------
Cotton apparel----------------------------------M en's:
S h irts , business------------ — -------S h irts , sport-—-----------------——Pajamas-Shorts, woven Undershirts— Socks--------------Trousers, work-Dungarees— -----S h irts , work-----Gloves, work
women's:D resses, s t r e e t - D resses, house—Blouses-----
C h ild re n 's :G ir ls ' d re sse s - G ir ls ' p a n ties - G ir ls ' anklets— Boys' s h ir t s -Boys' shorts—Boys' je a n s-
Other co tton a p p are l:Diapers-------Yard goods, p e rca le -
Other _____________19k7____ 19li.8 _______ _____12k9_________indexbases Mar. June Sept. Dgc • Mar. June Sept. Dec. Mar. June Sept. Dec.
9lt.l 93.3 95.1* 98.1* 102.0 10l*.l* 106.0 105.9 103.8 100.9 99.2 99.093.5 92.8 95.2 98 .1* 102.2 105.1 106.9 106.6 10l*.l 100.6 98.8 98.699.5 96.1* 98.0 100.0 102.3 102.2 103.5 103.9 102.1 99.1 96.6 96.3
91.6 96.3 101.5 106.5 109.0 108.7 10l*.l* 99.3 97.6 97.686.7 88.1 92.6 96.8 101.7 108.0 110.2 108.9 106,3 103.0 102.2 101.9
97.9 96.1; 97.6 100.3 101.8 101.8 101.8 102.2 100.3 101.0 99.9 99.1101.1 98.3 98.0 98.6 101.1* 100.8 100.8 101.1* 100.8 99.7 98.6 98.9
95.7 97.0 101.3 103.3 103.3 101.3 103.1* 10l*.6 101.1 96.8 96.7 96.688.5 89.1 92.6 98.5 99.7 102.1 105.0 106.1 106.1 106.1 106.1 106.791.1 95.0 99.1* 101.7 102.1 100.9 10l*.3 105.5 102.9 101.2 99.1 101.0
101.5- 102.9 103.6 100.0 98.9 97.8 98.2 99.6 100.0 99.6 98.9 98.589.5 91.7 99.1* 101.1* 102.7 101.2 107.0 109.7 10U.2 98.3 99.1* 99.1*
Dec 5296.1 97.3 98.5 101.5 102.6 102.7 103.6 10l*.9 101.8 99.0 98.1* 95.5
Dec 52 Dec 52
Dec 52
93.8 93.8 95.9 95.9 98.9 99.8 100.*7 105.0 106.3 105.1* 105.0 105.0
89.6 ~ .6 96.9 103.0 107.2 107.2 106.8 105.5 102.6 99.8 96.5 9i*.9
96.3 97.1 98.1 99.9 102.6 102.9 105.1 10l*.8 101.1* 99.5 97.9 97.196.8 97.1 97.8 99.3 101.7 102.5 10l*.2 103.8 101.1 100.0 99.0 98.997.5 97.8 99.1* 100.8 102.6 102.6 106.1 105.9 101.2 98.2 96.0 91*.393.5 9U.8 95.0 98.3 103.3 103.1 103.9 103.9 103.1 102.7 101*6, 101.1*93.8 100.0 102.2 10l*.9 109.6 109.5 109.0 105.9 97.1 92.0 89.8 89.3
91.9 92.9 96.6 97.0 98.8 100.3 106.8 106.1* (y ) (y> 103.5; 102,1*
95.7 m 99.0 99.3 99.8 cy)id * . 8
102.7 102.9 101.1* cy>105.0
101.1 102.388.7 92.1* 95.7 103.8 106.9 106.1* 105.9 102.8 102.7( V )
100.091.7
100.0(V)92.0
(V)92.7 (y>99.0
10U.3101.0
cy)103.6
(y )10U.0
(y>105.0
105.3 I 103.6
(y )100.3
(V)100.3
(V) (V) 100.7 100.2 (y> (y> 101.7 101.2 c y r cy) 96.6 95.1
(V)95.6
(V) 9l*.8 92.1 (y )105.9
98.0
(£/) 108.1* 110.7 cy) (y> 105.0 100.1(S/) (V)
94.1* as (y>ld*.5
100.7105.1* m (y )
100.9(y>99.8Tk/) 96.7 100.1 cy) w) 105.9 103.0 cy> ($/) 101.1 100.1
_____ 92.8 95.2 99.7 w 10l*.l 102.1* 103.0 cy)cy)
101.1* 100.8
Dec 52— 99.5 97.7 cy) 103.9 101.6 cy> 101.1 96.1*
100.8 102.1 101.8 102.8 10L.9 iol*.o 103.6 102.1 97.1 91* .1 92.9 92.7
Jun 55102.5 103.0 102.9 103.7 106.6 10U.0 102.1* 99.7 93.9 93.1 91.9 92.0
109.0 112.3 111.1 111.5 111.5 iol*.l* 98.2 93.7 87.0 85.0 85.0 85^8102.7 101.7 102.3 10l*.3 108.3 107.7 102.8 100.8 91* .5 91.1* 89.9 89.3103.2 101.0 101.5 101.0 10l*.3 105.3 101.5 99.9 95.5 91* .1* 91*.1* 9l*.l*102.7 105.7 103.2 102.0 100.8 100.2 100.8 99.6 95.6 95.6 96.6 97.2
99.5 99.5 100.1 101.2 101.2 101.7 102.2 102.2 98.9 97.8 97.8 96.8113.6 103.9 *101.6 100.8 101.1* 100.5 99.6 99.1* 97.1 91.3 92.2 91.6105.0 100.7 100.0 101.1 103.1* 102.2 103.0 101.5 97.8 91*.7 93.3 91* .1*
Dec 52 — -------- — — — — -------- — — — —
Mar 56
85.h 10Ji.8
96.6106.2
cy)103.1*
cy)102.9
103.210i*.3
107.0102.7
cy>100.6
cy)100.0
108.896.0
97.1*92.6
cy)92.0
(y )91.2
97.8 105.2 103.2 103.7 105.6 ioi*.5 95.1* 92.7 92.3 92.7— — ----- 95.5 99.1 102.7 103.9 103.9 105.1 101.1* 97.9 97.9 97.9— — - — — 96.7 97.1* 98.1 100.9 102.9 102.9 103.6 102.2 101.5 100.9— ----- — 96.9 10l*.6 100.7 96.9 109.9 109.1 92.3 87.7 100.7 98.1*
Dec 52101.9 105.1 100.7 101.3 101.9 102.5 98.2 93.7 91.8 91.1
,____iwm ___ 106.1* 106.1* 102.1* 98.5 98.5 98.5 98.5 90.6 90.6 90.696.9 101.1* 105.7 109.1* 116.7 113.1 108.8 100.5 88.9 86.7 81*.6 81* .9
See foo tn otes a t end o f tab le,
Digitized for FRASER http://fraser.stlouisfed.org/ Federal Reserve Bank of St. Louis
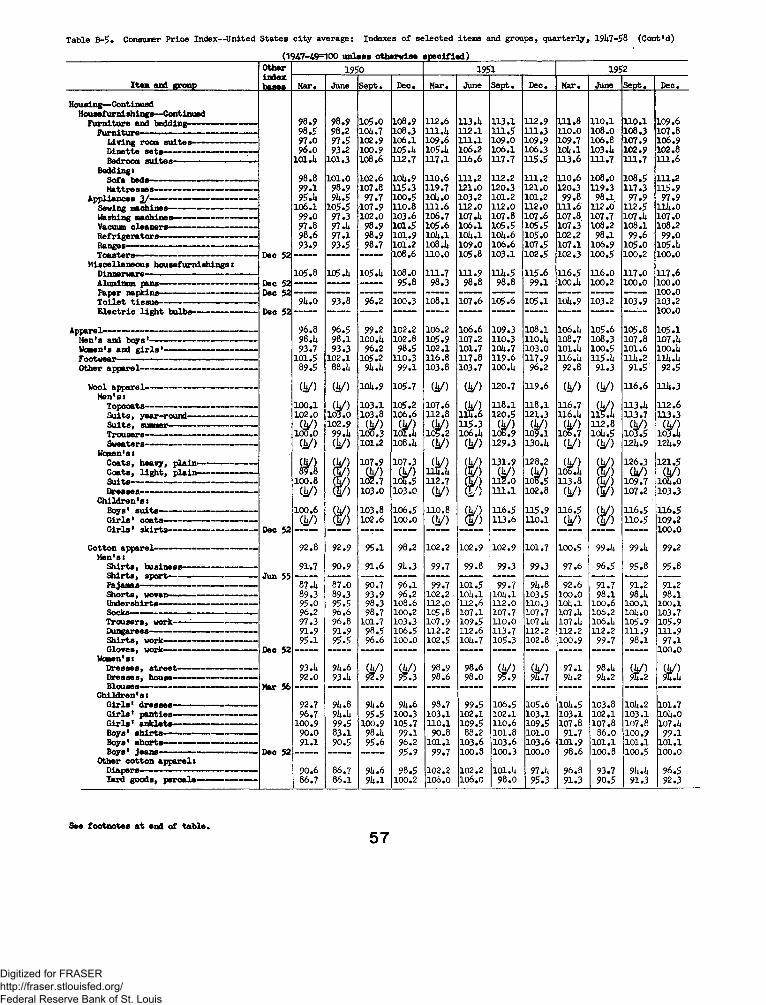
Table B-5. Consumer Price Index-United Sta tes c ity average: Indexes of se lected items and groups, quarterly , 19U7-58 (Cont'd)
Item and group
Otherindex
1950 19 5 1 1952
Mar, June Sept. Dec. Mar. June Sept. Dec. Mar. June Sept. Dec.bases
98.9 98.9 105.0 108.9 112.6 113.14 113.1 112.9 111.8 110.1 110.1 109.698.5 98.2 1014.7 108.3 IH.I4 112.1 111.5 111.3 110.0 108.0 108.3 107.897.0 97.5 102.9 106.1 109.6 111.1 109.0 109.9 109.7 106.8 107.9 106.996.0 93.2 100.9 105.14 105.14 106.2 106.1 106.3 IOI4.I 103.14 102.9 102.8
101 .U 101.3 108.6 112.7 117.1 116.6 117.7 115.5 113.6 111.7 111.7 111.6
98.8 101.0 102.6 10ii.9 110.6 111.2 112.2 111.2 110.6 108.0 108.5 111.299.1 98.9 107.8 115.3 119.7 121.0 120.3 121.0 120.3 119.3 117.3 115.995 .U 94-5 97.7 100.5 IOI4.O 103.2 101.2 101.2 99.8 98.1 97.9 97.9
106.1 105.5 107.9 110.8 111.6 112.0 112.0 112.0 111.6 112.0 112.5 IH4.099.0 97.3 102.0 103.6 106.7 107 .14 107.8 107.6 107.8 107.7 107.14 107.097.8 97.lt 98.9 101.5 105.6 106.1 105.5 105.5 107.3 108.2 108.1 108.298.6 97.1 98.9 101.9 10*4.1 1014.1 IOI4.6 105.0 102.2 98.1 99.6 99.093.9 93.5 98.7 101.2 108.14 109.0 106.6 107.5 107.1 106.9 105.0 105.14
Dec 52 — — — 108.6 110.0 105.8 103.1 102.5 102.3 100.5 100.2 100.0
105.8 105.lt 105.14 108.0 111.7 111.9 1114.5 115.6 116.5 116.0 117.0 117.6Dec 52 ___ 95.8
100.3
98.3
108.1
98.8
107.6
98.8
105.6
99.1
105.1
100 .I4
10k.9
100.2
103.2
100.0
103.9
100.0100.0103.2100.0
Dec 52
Dec 529*4.0 93.8 96.2
96.8 96.5 99.2 102.2 106.2 106.6 109.3 108.1 106 .I4 105.6 105.8 105.198.1i 98.1 100.14 102.8 105.9 107.2 110.3 110.14 108.7 108.3 107.8 107.1493.7 93.3 96.2 98.5 102.1 101.7 1QU.7 103.0 101.14 100.5 101.6 IOO.I4
101.5 102.1 105.2 110.3 116.8 117.8 119.6 117.9 116.14 115 .*4 IH4.2 lll4.I189.5 88. h 914.14 99.1 103.8 103.7 100.14 96.2 92.8 91.3 91.5 92.5
(h /) (h /) 1014.9 105.7 (k /) (h /) 120.7 119.6 (J±/) (k /) 116.6 1114.3
100.1 (V)103.0
103.1 105.2 107.6 118.1 118.1 116.7 (V)115.14
113.14 112.6102.0 103.8 106.6 112.8 120.5 121.3 116.14 113.7 113.3
(h /)100.0
102.999.k
(k /)100.3
(V)YOl.li
(V)105.2
115.3106.lt
(h /)108.9
(h /)109.1
(V)106.7
112.81014.5
(V)103.5
( i / )103.14
(V) (h /) 101.2 108.1; (V) (V> 129.3 130.14 (h /) (h /) 1214.9 I2I4.9
m89.8
100.8 f l107.9(V)
102.7
107.3(h /)
id f .5M112.7
($/)131.9(V)
112.0
128.20/)
108.5
(V)IO6.I4113.8
jj j126.3(V)109.7
121.5(V)
10J4.0(b/) (S/) 103.0 103.0 (J±/) (F> 111.1 102.8 (h/) w ) 107.2 103.3
100.6 (V) 103.8 106.5 110.8 116.5 115.9 116.5 116.5 116.5
Dec 52(V) (5/) 102.6 100.0 (h /) 113.6 110.1 (h /) 110.5 109.2
100.0
92.8 92.9 95.1 98.2 102.2 102.9 102.9 101.7 100.5 99.14 99 .U 99.2
Jun 5591.7 90.9 91.6 9U.3 99.7 99.8 99.3 99.3 97.6 96.5 95.8 95.8
~ 8 7 ^ 87.0 90.7 96.1 99.7 101.5 99.7 92.6 91.7 91.2 91.289.3 89.3 93.9 96.2 102.2 lOii.l 10L.1 103.5 100.0 98.1 98 .h 98.195.0 95.5 98.3 108.6 112.0 112.6 112.0 110.3 10U.1 100.6 100.1 100.196.2 96.6 98.7 100.2 105.8 107.1 107.7 107.7 107 .14 106.2 101;. 0 103.797.3 96.8 101.7 1C3.3 107.9 109.5 110.0 107.14 107 .14 106. k 105.9 105.991.9 91.9 98.5 106.5 112.2 112.6 113.7 112.2 112.2 112.2 111.9 111.9
Dec 5295.1 95.5 96.6 100.0 102.5 10L.7 105.3 102.8 100.9 99.7 98.1 97.1
100.0
Mar 56
93 .U 92.0
91 .693.14
(V)92.9
(V)95.3
98.998.6
98.698.0
(V)95.9
(V)9L.7
97.1914.2
98 .U914.2
(U/)9t.2
(V)95.14
92.7 914.8 914.6 914.6 98.7 99.5 106.5 105.6 10U.5 103.8 IOI4.2 101.796.7 914.14 95.5 100.3 103.1 102.1 102.1 103.1 103.1 102.1 103.1 1014.0
100.9 99.5 100.9 105.7 110.1 109.5 110.6 109.5 107.8 107.8 107.8 107 .1490.0 83.1 98.14 99.1 90.8 88.2 101.8 101.0 91.7 86.0 100.9 99.191.1 90.5 95.6 96.2 101.1 103.6 103.6 103.6 101.9 101.1 101.1 101.1
Dec 52 — — 95.9 99.7 100.8 100.3 100.0 98.6 100.8 100.5 100.0
90.6 86.7 914.6 98.5 102.2 102.2 101. h 97 .h 96.8 93.7 9U.U 96.586.7 86.1 914.1 100.2 106.0 106.0 98.0 95.3 91.3 90.5 91.3 92.3
Housing—ContinuedHousefurni shings—Continued
Furniture and beddingFurniture------ —
Living room su ite s- Dinette se ts---------Bedroom su ite s-
Bedding:Sofa beds--------M attresses-
Appliancee £ /“Sewing machines———---Washing machines----------Vacuum cleaners— — - — R efrigerators— —— Ranges-Toasters-
Miscellaneous housef urn ish ings: Dinnerware— ——-----------------Aluminum pans— Paper napkins-T o ile t t is su e — E lec tric lig h t bulbs-
Apparel-Men's and boys'Women's and g i r l s ' ----------Footwear------------------------Other apparel----- —---------
Wool apparel----------------Men's:
Topcoats-— -----S u its , year-round-----Su it 8, summer------- —Trousers------ ----------Sweaters-----------------
Women's:Coats, heavy, p lain— Coats, lig h t , p la in -Su its--------------------Dresses-----------------
C hildren 's:Boys' s u it s ------------G ir ls ' coats-------G ir ls ' sk ir t s -----
Cotton apparel----- ----Men's:
S h ir ts , business—S h irts , sport-----Pajamas——-—----Shorts, woven-----Undershirts--------Socks----------------Trousers, work----Dungarees--- -------S h ir ts , work----Gloves, work----
Women's:D resses, street* Dresses, house—Blouses— -------
C hildren 's:G ir ls ' dresses*G ir ls ' panties*G ir ls ' ankle1 Boys' sh irts*Boys' shorts*Boys' jeans
Other cotton apparel:Diapers— - ——-----Yard goods, percale*
See footnotes a t end of table,5 7
Digitized for FRASER http://fraser.stlouisfed.org/ Federal Reserve Bank of St. Louis

Table B-5. Consumer Price Index—United Sta tes c ity average: Indexes of se lected items and groups, quarterly , 191*7-58 (Cont'd)
Item and group
Housing—Continued .Housefurnishlngs—Continued
Furniture and bedding Furniture-
Living room su ite sDinette se ts --------Bedroom su ite s-----
Bedding:Sofa beds-M attresses---------- -
Appliances 2 /-Sewing machines---------Washing machines—— Vacuum cleaners— ——R efrigerators---------—Ranges-T oasters-
Miscellaneous housefurnishings:Dinnervare------------- *------------Aluminum pans---- — - — --------Paper napkins— — ----------—T o ile t t is su e ------E le c tr ic lig h t bulbs-
Apparel-Men's and boys1----Women's and g i r l s ' Footwear-Other apparel---------------
Wool apparel--------------Men's:
Topcoats—------- —S u its , year-round—S u its , sunmer-------Trousers--------------Sweaters------ —-------
Women's:Coat8, heavy, p la in - Coats, l ig h t , p la in -S u its--------------------Dreasea-
C hildren 's:Boys' s u it s -----------G ir ls ' coats----------G ir ls ' sk ir t s ---------
Cotton apparel--------Men's:
S h ir ts , business-S h ir ts , sport----Pajamas------------Shorts, woven— Undershirts— — Socks— — -------Trousers, work—Dungarees---------S h ir ts , work-----Gloves, work-----
Women's:D resses, stre e t— D resses, house—Blouses------------
C hildren 's:G ir ls ' d re sses—G ir ls ' panties— G ir ls ' anklets—Boys' sh ir ts ---------Boys' shorts---- ——Boys' jean s-----------
Other cotton apparel:Diapers----------------Yard goods, percale*
(1947-49=100 unless otherwise specified )Otherindexbases
___________ 1253____________ ______ 1951i____________ __________ IS>55_______Mar. June Sent. Dec. Mar. June Sept. Dec. Mar. June Sept* Dec*
109.6 110.1 109.7 109.3 108.8 108.6 108.8 108.7 107.6 ,106.3 106.6 106.7108.1 108.9 108.7 108.1 107.1* 107.3 107.6 107.3 105.9 'lOlt.3 10lt»8 10l*.7107.7 108.0 108.1* 108.6 108.2 109.3 111.2 111.8 109.6 108.$ 109.7 109.1103.9 XOli.9 10l*.l* 102.6 102.7 101.1* 101.1* 100.5 99.0 99.7 99.9 100.9110.7 112.0 111.2 110.7 109.1 108.7 107.5 106.8 106.1* 102.5 102.1* 102.3
111.5 110.1 109.1 109.6 109.8 108.5 109.1* 109.1 109.9 108.7 109.1* 109.1*113.0 112.7 111./* 111.1 111.0 111.5 111.6 112.1 111.7 112.1* 111.7 112.6
97.5 97.0 96.8 96.1 95.1 92.9 91.3 90.1 89.1* 88.6 87.8 85.9l l l t . l 115.5 116.1* 119.0 119.7 119.2 118.5 117.7 115.7 116.1 115.1* 115.3105,8 106.0 106.0 105.3 10l*.2 103.1 102.9 102.5 101.0 100.6 100.7 98.0109.3 - 112 .*8 112.1* 113.1 113.6 109.9 112.8 110.8 110.1 106.2 107.8 106.1*98.0 96.0 96.1 9U.6 93.1 88.8 88.6 86.7 87.7 86.9 82.3 78.0
105.2 107.1 107.0 108.1 108.3 10l*.5 103.5 101.1* 102.1* 101.9 10Z*.2 101.2Deo 52 100.5 100.8 101.7 101.5 100.1* 96.3 96.3 95.7 86.3 86.1 85.5 81* .3
118.0 118.0 118.8 121.0 122.1 122.3 122.9 122.8 12l*.3 125.0 123.6 12i*.7Deo 52 101.5 102.1 101.9 103.1* 103.8 10i*.2 10i*.6 10i*.6 105.1 106.5 107.7 120.1Dec 52 99.0 99.1* 99.1* 99.2 99.2 99.1* 98.5 99.1 99.6 99.5 100.0 100.0
103.5 103.1* 103.1* 103.5 103.0 103.6 103.0 101.8 102.1 101.0 101.8 101.0Dec 52 99.7 110.1 111.5 111.1 111.0 109.1* 109.3 115.2 118.2 121.1* 120.0 120.5
10U.7 10U.6 105.3 105.3 10i*.3 101*.2 10U.3 10i*.3 103.2 103.2 lQlt.6 1QU.7107.3 107.2 107.5 107.6 107.2 107.0 106.1* 106.5 105.6 105.6 105.8 106.1
99.6 99.2 100.5 100.5 99.0 98.5 99.0 99.0 97.1* 97.2 99,5 99.1n li .5 115.3 115.3 116.1 116.1 116.3 116.5 116.9 116.7 117.1* 118.1 119.8
92.1* 92.3 92.5 90.9 90.0 91.0 90.9 91.1 90.1* 90.1 91.0 91.1
(V) (V) 116.0 115.1 (h/) (h/) 116.0 lll* .0 (.h/) ( y ) 115.2 lH t.5
111.2 (V) 112.8 115.0 111*. 3 (V> 112.6 112.$ 111.1 (V) 112.6 112.8113.6 113.7 lll* .8 111*.8 115.3 115.7 115.8 115.7 116.1 116.0 116.1* 116.1*(U ) 113.9 (V) (V) 116.5 115.0 (V) (V) llit.O lllt .7 (V) ( i / )
101.7 101.5 103.6 ioIT.i 103.1* 10i*.l 103.6 103.6 10l*.5 105.0 105.5 105.5( y ) (V) 123.3 123.1 (V) (V) 120.7 121.3 (V) (V) 121.2 121.1*
(V ) (V ) 123.9 122.6 (V> (V ) 122.6 n 6 .y (V ) (V ) 119.1 117.7108.6107.7 (V )
(V)107.9
( i / )103.1
106.5109.0
(V )W )
(V )105.0
(V)102.2
105.0100.6
(V ) (V)10I.li
(V)100.0
(V) ($ /) 100.7 105.1 (V) (£ /) 10/*.0 103.3 (V) w ) 107.7 108.6
117.7 (h/) 120.1 120.5 121.2 (V) 121.2 122.1 121.8 (V ) 122./* 122.8
Deo 52 88 110.2100.3
106.9101.9 83 110.7
101.5106.1101.5 m 112.1*
102.0108.7103.0
99.6 99.6 99.8 99.5 99.3 99.1 98.5 98.1* 98.3 99.1 99.7 100.0
Jun 5596.6 97.3 97.5 97.9 96.8 96.8 96.5 96.1* 96.2 95.9 95.6 95.7_—. . . . . . ——- -—- —— -—— —— — 100.0 101.6 102.191.8 91.8 92.1* 91.6 90.7 90.6 90.5 90.6 90.8 90.6 90.6 90.798.2 97.9 97 .li 97.5 96.1* 96.2 96.5 95.8 9U.9 95.1 95.1* 96.0
100.lt 100.0 100.7 100.6 99.1* 99.7 99.6 99.5 99.6 99.5 99.6 99.9103.9 103.8 iol*.5 10/*.6 106.7 106.2 105.9 105.8 105.8 105.1* 106.5 106.5105.5 106.1 lol*. 5 10i*.0 103.1* 103.1 102.9 102.6 101.3 101.2 101.1* 101.8112.0 110.6 110.7 110.6 109.3 108.8 106.1* 106.1* 106.2 106.1 106.3 106.3
Dee 5296.1 96.1* 96.1* 96.6 96.1 95.1 92.6 92.5 92.1 92.9 9lt.2 95.0
100.5 96.6 96.1* .95 .9 95.0 9l*.8 91.7 91.7 91.5 90.7 91.0 91.2
102.5 103.1 (V) (k/ ) 105.7 105.2 (k/ ) (V) 108.1* 111.3 (V) (V)56
9l*.9 95.2 95.0 9l.k 9l*.9 95.2 9U.2 9a .2 9!*t1 9l*.2 9h.9 sfi.8Mar — — ——
10lt.2 10i*.2 107.3 107.5 108.7 108.1 106.9 106.8 103.8 101.6 10l*.8 105.3103.6 10l*.0 103.9 10i*.5 103.1 103.0 103.6 10Z*.7 10U.3 102.8 105.3 106.1*105.lt 105.3 107.3 107.9 107.9 107.5 107.3 107.3 106.7 10/* .8 105.1 105.1
98.9 98.8 99.5 99.3 99.1* 97.1* 95.9 95.1 95.3 9lt.7 9l*.3 95.2
Deo 52102.it 102.3 102.8 102.9 103.1 102.9 102.8 101.0 98.3 98.3 98.5 99.1100.6 100.2 98.9 97.8 96.3 95.9 9U.9 95.2 93.9 93.5 92.1 92.1*
96.9 96.7 96.0 88.6 87.2 91.2 90.9 91.1* 91.1 91.0 91.5 91.592.1 92.1 92.2 91.7 1 91.0 91.1 91.2 91.5 92.2 91.0 1 91.5 91.1*
See footnotes a t end of tab le58
Digitized for FRASER http://fraser.stlouisfed.org/ Federal Reserve Bank of St. Louis
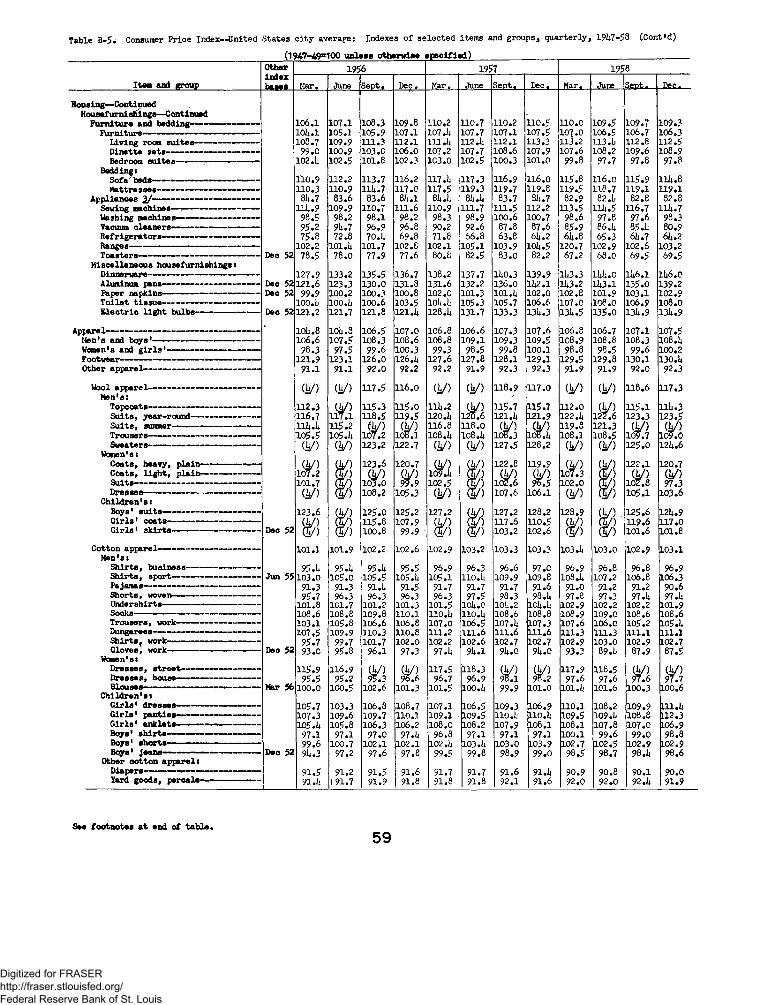
Table B-5. Consumer Price Index—United States c ity average: Indexes of selected items and groups, quarterly , 1917-58 (.Cont'd)
Item and group
Housing— ContinuedHousefurni f l in g s — Cdntinued
Furniture and bedding---------Furniture-
Living room su ite sDinette se ts -----------Bedroom su ites -------
Bedding:S o fa b e d s -------M attresses--------------------------------
Appliances 2 / ----------------------------------Sewing machines— ;----------------------Washing machines------------- -----------Vacuum cleaners— ---------------------R efrigera tors------------------------------
M iscellaneous housefurnish ings:Dinnerware-----------------------------------Aluminum pans-----------------------------Paper napkins------------------------------T o ile t t is su e ------------ — --------------E le c tr ic l ig h t bulbs-----------------
Appare 1----------------------------------- ------------------Men's and b o y s '------------------------------------Women's and g i r l s ' -------------------------------Footwear-------------------------------- ----------------Other apparel----------------------------------------
Wool apparel-------------------------------------------M en's:
S u its , year-round-------- ------------------S u its , summer----------------------------------
Women's:Coats, heavy, p la in -----------------------Coats, l ig h t , p la in -----------------------
Dresses-----— ---------- ------------------------C h ild ren 's :
Boys' s u its — — --------------------——G ir ls ' coa ts------------------------------------G ir ls ' s k ir ts ----------------------------------
Cotton apparel---------------------------------------M en's:
S h irts , business-----------------------------S h irts , sport-----------------------------—
Shorts, woven--------------------------------Undershirts-------------------------------------
Trousers, work---------Dungarees------------------S h irts , work-------------Glove8 , work—-----------
Women's:D resses, s tre e t-------Dresses, house---------Blouses----------------------
C h ild re n 's :G ir ls ' d resses-----—G ir ls ' panties— -----G ir ls ' anklets— -—Boys' s h ir ts -------------Boys' shorts— --------Boys' Jeans— —
Other cotton apparel:Diapers-------------- -------Yard goods, percale '
(1947-49=100 un less otherwise s p e c ifie d )Otherindexbases
1956 1957 1958
Mar, June Sept. Dec. Mar. June Sept. Dec. Mar. June Sept.
1 0 6 .1 107.1 108.3 10 9 .8 1 1 0 .2 110.7 1 1 0 .2 110.5 1 1 0 .0 109.5 109.7 109.31 0 1 . 1 105.1 105.9 107.1 107.1 107.7 107.1 107.5 1 0 ? .0 106.5 106.7 106.31 0 8 .7 109.9 111.3 1 1 2 . 1 1 1 1 . 1 1 1 2 . 1 1 1 2 . 1 113.3 1 1 3 .2 113.i. 1 1 2 .8 112.5
99.0 100.9 103.0 10 6 .0 107.2 107.7 10 8 .6 107.9 1 C7 .6 10 8 .2 10 9 .6 10 8 .9102 . 1; 102.5 1 0 1 .8 102.3 1C3.0 102.5 100.3 1 0 1 .0 99.8 97.7 97.8 97.8
110.9 1 1 2 .2 113.7 1 1 6 .2 117.1 117.3 116.9 1 1 6 .0 1 1 5 .8 1 1 6 .0 115.9 1 1 1 . 81 1 0 .3 110.9 1 1 1 . 7 117.0 117.5 119.3 119.7 1 1 9 .8 119.5 118.7 119.1 119.1
8U.7 8 3 .6 8 3 .6 81.1 81.1 81.1 83.7 31.7 32.9 8 2 .1 82.8 32.81 1 1 . ? 109.9 110.7 1 1 1 . 6 110.9 111.7 111.5 1 1 2 .2 113.5 111.5 116.7 1 1 1 . 7
98.5 98.2 98.1 98 .2 98.3 98.9 10 0 .6 100.7 9 8 .6 97.8 97.6 98.395.2 9k.7 96.9 96.8 90.2 9 2 .6 8 7.8 8 7 .6 85.9 8 6 .1 85.1 80.975.8 7 2 .8 70.1 69 .8 7 1 .8 66 .8 6 3.8 61.2 61.8 65.3 61.7 61.2
1 0 2 .2 1 0 1 .1 101.7 10 2 .8 1 0 2 .1 105.1 103.9 101.5 120.7 102.9 1 0 2 .6 103.2Dec 52 78.5 78.0 77.9 77.6 80.8 82.5 83.0 82.2 67.2 68 .0 69.5 69.5
127.9 133.2 135.5 136.7 13 8 .2 137.7 110.3 139.9 113.3 l l l . C H 6 . 1 116.0Dec 52 1 2 1 .6 123.3 13 0 .0 1 3 1 .8 1 3 1 . 6 13 2 .2 136.0 1 1 2 . 1 113.2 H 3 .1 135.0 139.2Dec 52 99.9 10 0 .2 100.3 10 0 .8 1 0 2 . 0 101.3 1 0 1 . 1 10 2 .0 1 0 2 .8 101.9 103.1 102.9
10 0 .ii 10 0 . l 10 0 .6 103.5 i o l . l 105.3 105.7 10 6 .6 107.0 10 8 .0 106.9 108.0Dec 52 1 2 1 .2 121.7 1 2 1 .8 1 2 1 . 1 128.1 131.7 133.3 131.3 131.5 135.0 131.9 131.9
1 0 1 .8 1 0 1 .8 106.5 107.0 10 6 .8 1 0 6 .6 107.3 1 0 7 .6 10 6 .8 106.7 107.1 107.51 0 6 .6 107.5 108.3 10 8 .6 10 8 .8 109.1 109.3 109.5 108.9 10 8 .8 108.3 1 0 8 .1
98.3 97.5 99.6 100.3 99.3 98.5 99.8 1 0 0 .1 98.8 98.5 99.6 10 0 .2121.9 123.1 126.0 126.1 1 2 7 .6 127.8 1 2 8 .1 129.1 129.5 1 2 9 .8 130.1 130.1
91.1 91.1 92 .0 9 2.2 9 2.2 91.9 92.3 92.3 91.9 91.9 92.0 92.3
(V) (U /) 117.5 1 1 6 .0 (y) cy) 118.9 117.0 cy) cy) 1 1 8 .6 117.3
112.3 (l/) 115.3 1 1 5 .0 1 1 1 . 2 (l/) 115.7 115.7 1 1 2 .0 cy) 115.1 111.3116.7 117.1 118.5 119.5 1 2 0 .1 1275.6 1 2 1 . 1 121.9 1 2 2 .1 127.6 123.3 123.51 1 1 . 1105.5
115.2105.1
th / )107.2
( 1 / )108.1
1 1 6 .81 0 8 .1
1 1 8 .01 0 8 .1
cy)108.3
cy)108.1
1 1 9 .81 0 8 .1
121.3108.5
(1 /)109.0
(V) ih / ) 123.2 122.7 cy) ( 1 / ) 127.5 128.2 cy) cy) 125.0 1 2 1 .6
(l/) (1/) 1 2 3 .6 120.7 cy) ( l / ) 1 2 2 .8 119.9 cy) 1 2 2 .1 120.7107.2101.7 ¥
( 1 / )103.0
(V)99.9
iof.1102.5
(go1 0 2 .6
( 1 / )96.5
1 0 7 .3 . 10 2 .0
( 1 / )10 2 .8
cy)97.3
(V) <&/) 1 0 8 .2 105.3 cy> w > 1 0 7 .6 1 0 6 .1 cy) & 0 105.1 103.6
1 2 3 .6 ih / ) 1 2 5 .0 125.2 1 2 7 .2 cy) 1 2 7 .2 128.2 123.9 cy) 1 2 5 .6 121.9(l/) (y) 1 1 5 .8 107.9 cy) (go 117.6 110.5 cy> (go 1 1 9 .6 117.0
Dec 52 (y) (go 10 0 .8 99.9 (go (go 10 3 .2 1 0 2 .6 (go (go 1 0 1 .6 1 0 1 .8
1 0 1 . 1 101.9 10 2 .2 10 2 .6 102.9 103.2 103.3 103.3 103.1 1 0 3 .0 102.9 103.1
95.1 95.1 95.1 95.5 96.9 96.3 96 .6 97.0 96.9 96.8 96 .8 ?6 .9Jun 55 103.0 1C5.0 105.5 105.1 105.1 1 1 0 . 1 109.9 10 9 .8 1 0 8 .1 1 0 7 .2 106.8 106.3
91.3 91.3 91.1 91.5 91.7 91.7 91.7 9 1 .6 91.0 9 1 .2 91.2 90 .695.7 96.3 96.3 96.3 96.3 97.5 98.3 98.1 97.8 97.3 97.1 97.1
1 0 1 .8 101.7 1 0 1 .2 101.3 101.5 101.0 1 0 1 .2 i c l . 1 102.9 10 2 .2 10 2 .2 101.910 8 .6 10 8 .8 10 9 .8 1 1 0 . 1 1 1 0 . 1 1 1 0 . 1 10 8 .6 10 8 .8 108.9 109.0 10 8 .6 10 8 .6103.1 10 5 .8 1 0 6 .6 106.8 107.0 106.5 107.1 107.3 107.6 10 6 .0 1 0 5 .2 105.1107,5 109.9 110.3 1 1 0 .8 1 1 1 . 2 1 1 1 . 6 1 1 1 . 6 1 1 1 . 6 111.3 111.3 111.1 1 1 1 . 1
95.7 99.7 101.7 1 0 2 .0 1 0 2 .2 1 0 2 .6 102.7 102.7 102.9 103.0 102.9 L02.7Dec 52 93.0 95.8 9 6 .1 97.3 97.1 91.1 91.0 91.0 93.3 89.1 87.9 87.5
56
115.995.5
116.995.2
cy)9 6 .6
117.596.7
118.396.9
(y )98.1 (y>
98.2117.9
97.6116.5
97.6cy)97.6
cy)97.7
Mar 10 0 .0 100.5 1 0 2 .6 101.3 101.5 1 0 0 .1 99.9 1 0 1 .0 1 0 1 .ii 1 0 1 .6 100.3 10 0 .6
105.7 103.3 106.8 108.7 107.1 106.5 109.3 106.9 1 1 0 . 1 10 8 .2 109.9 m . i107.3 10 9 .6 109.7 1 1 0 .1 109.1 , 109.5 1 1 0 .1 u o . l 109.5 109 .1j 10 8 .8 L12.3105.1 10 5 .8 106.3 10 6 .2 10 8 .0 10 8 .2 107.9 10 8 .1 1 0 8 .1 1 0 7 .8 1 0 7 .0 L06.9
97.1 97.1 97.0 97.1 96.8 97.1 97.1 97.1 1 0 0 .1 99.6 99.0 98.899.6 100.7 1 0 2 .1 1 0 2 .1 1 0 2 .1 103.1 103.0 103.9 102.7 102.5 102.9 L02.9
Dec 52 91.3 97.2 97.6 97.8 99.5 99.8 98.9 99.0 98.5 98.7 98.1 98 .6
91.5 91.2 91.5 9 1 .6 91.7 91.7 9 1 .6 91.1 90.9 90.8 90.1 90.091.1 (91.7 91.9 9 1.8 9 1 .8 9 1 .8 92.1 9 1 .6 92.0 92.0 92.1 91.9
See foo tn otes a t end o f tab le ,59
Digitized for FRASER http://fraser.stlouisfed.org/ Federal Reserve Bank of St. Louis

Table B-5. Consumer Price Index-U nited States c ity average: Indexes of selected items and groups, quarterly , 191*7-58 (Cont'd)
(1947-49=100 unless otherw ise s p e c ifie d )__________________
_ Iten and group
Other index ha see
_1 2 kZ _1MMar* June Sept. Dec.. Mar. June Sept. Dec. Mar. June Sept. Dec.
101.5 99.8 99.6 102.5 1 0 6 .1 1 0 6 .1 106.9 107.0 99.1* 93.9 88 .2 86.7
— — — ——
— —— — —
98.3 10 0 .2 10 0 . 1* 103.9 107.2 107.1* 10 8 . 1* 10 9 .6 1 0 1 .2 9 2 .2 8 5 .6 82.788.2 89,6 92.1 1 0 1 .2 110.7 110.7 110.3 110.5 105.9 103.2 9 1 .2 88.799A 99.0 io o .5 100.5 103.1* 10 l*.l* 1 0 6 . 1* 105.1* 10 2 .0 97.5 90.7 90.7(V)
1 1 0 .8(h/)
10 2 .8103.110 0 . 1*
10l*.3100.7
(V)10 2 .2
(V)102.0
106.3103.7
106.9103.1*
(V)96.5
(V)93.9
8 7 .290.0
8U.689.5
93.0 100.3 105.3 108.7 117.5 119.1 117.0 '114.1 93.2 7 8 .2 76.5 76.5
lh /)1 0 1 .2
Th/~)1 0 2 . 1*
98.599.7
98 .29 6 .6
’ (V)93.8
~ y )9u.8
107.110 2 . 1*
103.1*101.7
’ (V)101.7 •
7 y )1 0 2 . 1*
91*.!*1 0 2 . 1*
90.7102.7
93.6 95.1 9l*.2 9 8 .6 103.9 103.1* 10 l*.0 10 i*.0 10 3 .2 102.7 1 0 1 .0 100.9
93.3 96.2 9i*.2 99.2 1 0 2 .6 1 0 2 .6 103.9 10 l* .l 103.3 103.1* 1 0 1 .8 10 2 . 1*9l*.l* 93.0 96.8 99.2 10 l*.6 10 i*.0 10l*.3 103.8 102.7 1 0 1 . 1 99.7 98.7
93.7 96.5 92.7 97.1* 10l*.9 103.8 10i*.5 iol*.l* 103.7 1 0 2 .8 10 0 .2 10 0 .2
93 .i* 9l*.6 97.3 10 0 .1* 103.1* 103.1* 103.0 102.9 1 0 2 .1 101.7 1 0 1 . 1 100.596.5 97.0 97.2 98 .2 10 0 . 1* 1 0 1 . 1 101.5 101.9 101.9 1 0 2 .1 1 0 2 .1 101.5
88.8 89.8 92.0 91*.1 96.1 97.7 105.3 10 6 .0 107.5 10 8 .0 109.1* 110.389.2 90.2 93.3 95.6 97.7 98.5 10l*.7 105.3 10 6 .8 107.5 10 8 .0 107.888.8 89.1 91*.1 9l*.8 95.3 95.1* 105.9 105.8 10 8 .8 109.1 1 1 0 .0 109.9
10 i*.6 96.3 9U.7 97.9 99.0 99.0 103.2 103.5 103.5 99.7 " 95I 8 1 0 1 . 18 7 .2 90.2 93.5 98.2 103.1* 103.3 103.5 10 l* .l 105.1 106.3 10 6 .8 105.990.i* 91.1* 92.5 93.6 101.7 103.8 10i*.9 105.1* 105.1* 1 0 5 .2 105.7 105.79U.8 95.2 95.8 97.5 98.5 100.7 103.2 103.7 103.1* 103.1* 103.7 103.797.9 97.9 97.9 97.9 10 0 . 1* 1 0 1 . 1* 1 0 1 . 1* 1 0 1 . 1* 1 0 1 . 1* 1 0 1 . 1* 1 0 1 . 1* 1 0 1 . 1*81*.0 8 5 .0 86.0 86 .0 86 .0 101.5 1 1 2 . 1* 1 1 2 .8 1 1 2 .8 111*. 6 111* .6 111* .687.9 88.9 89.0 90.3 92.3 95.8 106.7 107.8 109.1 109.2 1 1 2 .8 1 1 6 . 1*88.2 88.9 89.1 91.3 92.3 95.8 107.3 107.7 109.9 109.9 113.1 117.185.1 92 .0 9 2.0 9 2.0 96 .0 96.0 1 0 8 .1 1 0 8 .1 1 0 8 .1 1 0 8 .1 1 0 8 .1 117.0
93.6 91*.7 96.0 97.2 98.8 100.5 1 0 2 .0 102.9 103.8 10 l*.0 10l*.5 10l*.9
95.2 96 .0 97.1* 98.1 99.1 100.7 101.9 102.5 10 2 .8 103.2 103.3 103.79 6 .1 9 6 .6 97.6 • 98.1 99.0 101.3 1 0 1 .8 10 2 .2 1 0 2 . 1* 102.5 102.5 103.09 6 . 1* 96.7 97.7 98 .0 98.8 101.3 1 0 1 .6 10 2 .2 1 0 2 .3 1 0 2 . 1* 102.5 10 2 .896.5 97.0 97.2 97.1* 98.2 101.9 1 0 2 .1 102.7 102.3 1 0 1 .8 1 0 2 . 1* 10 2 .897.2 97.2 98.5 9 8 .6 99.5 1 0 0 .1 10 0 .6 1 0 1 . 1 102.3 102.7 1 0 2 .2 102.593.6 9i*.5 96.7 98.1 99.2 1 0 2 .8 103.0 103.3 10 2 .8 103.0 103.3 103.39U.7 96.0 97.5 98.5 99.3 1 0 1 .0 102.5 102.5 102.5 10 2 .8 103.0 103.895.5 97.6 98.1* 99.2 99.5 10 0 .8 102.3 102.3 1 0 1 . 1 1 0 1 . 1 101.9 103.593.9 9U.3 96.7 97.8 99.0 1 0 1 . 1* 102.5 102.5 103.7 10l*.5 10 l* .l 10 l* .l93.9 9l*.9 96.7 97.1* 98.2 99.5 10 2 .2 103.3 103.6 10l*.5 i d * .7 105.593.8 95.2 96 .8 97.0 98.0 99.6 10 2 . 1* 103.8 10 l* .l 10i*.3 10l*.3 105.393.3 9l*.l 96.8 9 8 .6 98.8 99.7 1 0 2 .1 1 0 2 . 1* 10 2 . 1* 105.3 105.9 1 0 6 .1
95.3 95.6 97.0 98.1 99.U 99.9 1 0 1 .0 1 0 1 .8 103.1* 103.1* 10 i*.0 lOlt.O81*.5 8 7 .6 89.9 92.1 99.1 1 0 2 .6 10 l*.8 10 6 .8 10 9 .8 1 1 0 .2 111.3 1 1 2 . 183.1* 86.8 88 .2 90.0 99.1* 103.0 105.2 107.2 111.5 111.5 113.0 nl*.o83.7 87.7 90.3 92.7 98.7 10 2 .0 105.0 107.0 1 1 0 .0 110.7 111.7 1 1 2 .085.9 88.5 91.5 9i*.l 99.2 102.5 101*. 5 106.3 10 8 .2 10 8 .8 1 0 9 .6 1 1 0 . 1*
.1 9h9
Apparel— ContinuedManmade f ib e r s a p p are l-
M en's:S u its , rayon-S lack s, rayon-Jackets------------Sport s h ir ts , rayon-------Socks, nylon , stretch —
Women's:D resses, rayon S lip s , rayon and n yIon - Panties, rayon -Nightgowns, rayon - Hose, nylon— - — S u its , rayon-S k irts , ra yon - Blouses
C h ild ren 's :Boys' s la ck s - Boys' ja c k e ts - G ir ls ' sweaters,
Other manmade f ib e r s apparel: Yard goods, rayon----------— —
JunDecDecDecJun
DecDecDec
DecDecDec
M iscellaneous a p p a re l-Wbmen's co a ts , fu r -------Women*8 g ir d le s -
Shoes-
Dec 52
M en's:Shoes, s t r e e t - Shoes, work
women's:Shoes, s tr e e t Shoes, p lay—
C h ild re n 's : Shoes, oxford*
Shoe rep a irs— ------
Deo 52
T ransportation - P riv a te -
Automobiles, new— Automobiles, used- T ires-----------------------
Jan 53
G asoline- Motor o i l - Auto r e p a ir s -Auto r e g is tra tio n Auto insurance-
P ublic-------------T ransit fa r e s -R ailroad fcures, coach-----
M edical care------------ — --------------------------Medioal care le s s h o sp ita l ra tes
and group h o sp ita liza t io n ---------P hysicians' fe e s -----------------------------
General p r a c t it io n e r s ' fe e s -----O ffice v i s i t ---------House v i s i t —O b ste tr ica l ca re -
Surgoons' fe e s ---------Appendectomy— T on sillectom y-
D e n tis ts ' f e e s - F i l l in g s - E xtra ction s-
Optometric examination and e y e g l a s s e s - — - — — —
H ospital r a te s -Men's pay ward— Semiprivate room- Private room— —
See fo o tn otes a t end o f tab le ,60
Digitized for FRASER http://fraser.stlouisfed.org/ Federal Reserve Bank of St. Louis

Table B-5. Consumer Price Index-U nited States c ity average: Indexes of selected items and groups, quarterly , 19U7-58 (Cont»d)
Item and group
Otherindexbases
1950 1951 _____________ m ;2Mar. June Sept. Dec. Mar. June Sept. D6C • Mar. June Sept. Dec.
87.1 87.3 87.9 91.2 9 3 .7 92.9 9 1 . 1 98.5 88.6 87.9 87.5 87.7
— 100.8 ( V ) (h/) (V) 106.7 (V) (V) (V) 101.7 (V) (V)100.0100.0100.0
90.7
— — — — — — — -------- — — —
c y )87.5
8U.3 82.8 86.U 90.9 86.6 9 2 .6 89.5 ( V ) (h/) 89.687.1 89.3 92.ii 95.8 96.U 93.5 92.1; 89.7 89.5 85.7 8i;.7
90.7 90.7 95.1 98.0 100.1; 100.1i 100.7 100.7 100.3 99.7 99.7 100.3(h/)90.6
(V)90.0
83.1;90.8
85.99U.5 m (V)
95.1;87.286.1
86.8 . Sii.7
(h/)65.li
(V)81.5
86.881.1
88.081.1
100.0100.0100.0
100.0100.0100.0
70.5 100.0
93.6
— —
10
1
11
. 1
1
t cvj 1
1
10
1
1
1 H
II
103.0 102.7 103.6 lOii.3 103.ii 102.0 101.1
77.3 77.8 78.6 79.0 81.8 81.8 78.2 75.2 71.6 71.1 70.5
105.0l y j107.2
93.5 91.9 ’ ( V ) Th/~) 101.h 98.8 " ( £ / ) Tk/) 95.1109.8 116.5 127.6 123.3 126.1 126.7 126.7 125.9 127.8 128.0
100.8 101.2 105.2 110.3 116.1; 117.1; 118.9 117.2 115.5 l l i i .2 112.6 113.2
102.5 102.6 107.2 112.5 119.0 120.li 123.0 122.0 119.2 118.2 1 1 6 .8 117.398.7 98.1 103.8 10 8 . 1; 115.7 117.2 119.8 119.8 117.8 113.9 112.8 112.8
99.5 100.2 103.7 108.5 llil.O 111;.6 115.8 112.5 110.6 109.3 1 0 8 .1 109.3100.0
100.9 101 .U 105.1 110.3 1 1 6 .8 117.9 118.3 118.3 H 8 .0 H 7 .ii l l i i . 8 l l i i .6101.5 101.5 102.ii 105.3 112.i; 113.ii 113.9 113.8 113.8 113.8 113.8 113.8
109.3 109.9 112.7 l l l i . l 116.9 117.5 119.7 122.2 12i;.ii 126.3 127.7 128.9106.9 106.6 108.3 109.1 110.8 111.3 113.i; 116.7 1 1 8 .8 119.1; 121.2 121.9109.9 110.0 110.0 110.2 113.1 H 3 .i ; 1 1 6 .6 121.1 125.0 125.0 125.7 126.5
99.5130.0102 .U 105.6 120.9 129.6 130.6 130.ii 130.6 130.9 130.9 130.8 129.3
103.5 103.9 10 6 .0 107.ii 108 .ii 107.9 107.1 109.8 110.7 111.6 H I . 9 110.5105.1; 105.1; 105.7 106.0 106.9 106.5 106.9 107.6 107.1 107.6 107.6 106.9103. h 102.7 109.il 108.9 113.i; 113.8 l l i i .7 H i; .6 lH i.9 H 6 .9 116.9 117.5102.3. 102.3 102.3 102.0 102.1 102.1 102.1 102.1 105.9 105.9 105.9 1 0 6 .ii111;.6 lO ii.l 102. U 102.U 102.1; lQii.8 118. ii 121.6 121.6 121.6 liii».7 ll|6.9116.8 117.9 123.3 126.2 131.6 132.5 135.1 135.7 138.1 li;3 .0 lii3 .5 lii5 .8117.2 119.1 125.5 128.7 135.9 136.0 138.8 139.1; l l il .S II18. I li;8 .7 150.9117.0 117.0 117.0 117.0 117.0 H 7 .0 H 7 .0 1 1 8 . 1 118.1 118.1 118.1 118.1
105.1 105. ii 107.0 108.0 109.9 111.0 111.8 l l i i . 3 115.7 117.8 118.8 119.3
lQli.2 10ii .6 105.5 106.3 10 8 .0 108.3 109.2 110.2 111.0 111 .5 H 2 .ii 113.0103.7 103.8 10I1.6 105.1 107.2 107.6 10 8 .6 110.3 111.7 112.6 llil .O l l i i .3103.7 103.7 io ii.5 lO l;.9 107.1; 107.7 10 8 .6 110.ii 111.9 112.9 l l l i . l l l i i .5103.2 103.2 10ii.il 10li. 9 10 6 .8 107.1 108.ii 109.2 110.8 112.0 113.0 113.110li.2 10ii.2 101; .7 10li.7 107.9 107.8 107.7 10 8 .8 109.5 H O .6 112.2 113.0103.9 103.9 10U.2 105.8 107.6 109.5 H I . 7 H 9 .2 122.3 122.7 123.5 123.7lOii.O 10ii.2 105.0 105.6 106.3 1 0 6 .6 108.3 109.1 110.6 H O .7 112.9 113.3103.5 103.5 105.1 105.8 105.8 106.1 109.3 109.6 110.8 111.2 113.5 113.810U.5 10U.9 lOii.9 105.3 106.8 107.1 107.ii 108.5 110.3 110.3 112.3 112.9105.5 106.7 107.8 108.7 llO .ii 110.5 111.6 H 2 .ii 112.6 112.8 113.7 ll l i .S105.5 106.7 107.7 108.7 109.6 109.8 111.2 111.8 112.3 112.6 113.8 115.11 0 6 .1 106.9 1 0 8 .1 109.2 112.5 112 .ii 112.8 l l i i .2 H 3 .7 113.7 113.7 llii.O
lOiwO 10U.2 lOiwO 106.ii 108.9 109.1; 109.7 109.9 H 0 .ii 110.7 110.5 110.9113 .U 113.5 n l i .5 119.1 125.3 127.3 127.9 131.2 137.3 liiO.O l i i l .6 lli3.Ii115.5 116.7 117.5 121.6 129.7 131.7 132.5 135.7 li;3 .1 1U6.0 U|7*2 Hi9.5113.3 113.3 H i; .7 119.7 121;.7 126.8 127.6 131.1; 136.7 138.8 139.7 li;1 .3111.6 110.5 111.6 116.5 120.9 122.9 123.2 126.5 131.5 13ii.O 136.5 137.9
Apparel— ContinuedManmade f ib e r s a p p are l-
M en's:S u it8, rayon—S lacks, rayon - Jackets-Sport s h ir ts , rayon -Socks, nylon, stretch —
Women's:D resses, rayon--------------S lip s , rayon and nyIon -P anties, rayon— Nightgowns, rayon - Hose, n y lon -S u its , rayon— S k irts , rayon— Blouses— —
C hildren 'stBoys' slacks-------------- --------------Boys' Jackets— - — —------------G ir ls ' sweaters, orlon ----------
Other manmade f ib e r s apparelt la rd goods, rayon-------— ---------
M iscellaneous a p p are l- Women's coa ts , Women's g ir d le s -
Shoes<
Jun 53 Dec 52 Dec 52 Dec 52 Jun 56
Deo : Dec : Dec
DecDecDec
Deo 52
Men'stShoes, s t r e e t - Shoes, work
women's!u m n 'B i Shoes, s t r e e t - Shoes, p la y -
C h ild ren 's !Deo 52
’lu u u re x i'B *Shoes, o x fo rd -
Shoe rep a irs— :------
T ransportation - P rivate -
Autoraobiles, new— Automobiles, used- T ire s -
Jan 53
G asoline-Motor o i l --------------Auto rep a irs ---------Auto re g is tra t io nAuto insurance-----
P u b l i c -Transit fa re s ----------------Railroad fa re s , coa ch -
Medioal oa re -Medical care le s s h o sp ita l rates
and group h o s p ita liza t io n -------P hysicians ' f e e s -
General p ra c t it io n e r s ' O ffice v i s i t --------------
fe e s -----
House v i s i t -O bstetrioa l ca re -
Surgeons' fe e s — —Appendectomy— ' T on sillectom y-
D e n tis ts ' fe e s — — F i l l in g s -E xtra ction s-
Optometric examination andeyeg lasses — — — — —
H ospital r a te s - Men's pay ward- SemiprivatePrivate room -
See foo tn otes a t end o f tab le ,61
Digitized for FRASER http://fraser.stlouisfed.org/ Federal Reserve Bank of St. Louis

Table B-5. Consumer Price Index—United States c ity average: Indexes of selected items and groups, quarterly , 191*7-58 (Cont*d)
Other_______ f &53 ___________ 12SJt____________ ___________ 12SS____________index
bases Mar. June Sept. Dec. Mar. June Sept. Dec. Mar. June S6p1s • Dec.
87.0 86.7 86.7 86.7 85.7 85.2 85.0 8i*.7 81* .1 82.3 83.2 83.0
Jun 53 Dec 52 (V )
100.6100.0101.0
(V ) 100 .1*
(V)99.5
99.999.1
101.999.5
(V )99. 1*
(V )98.8
101.096. 8 .
99.195.1*
(V)96.3
U/)96.6
Dec 52 Dec 52 Jun 56
(go99.7
(V )98.9
95.599.3
9l*.l98.8
(h /)99.7
(V)99.7
90.899.2
91.599.1
(V)97.5
89.097.9
89.997.7
89.5 89.7 90.8 91.5 90.1 89.5 91.1 90.9 90.5 88.8 92.9 92.503.3 82.7 82.5 82.2 81.9 80.7 81.7 81.2 81.5 80. 1* 79.1 78.9
100.1 100.6 * 101.0 101.7 100.1* 100.3 99.3 98.8 98.8 98.6 98.1 98.386.5 87.1 87.1 87.2 86.1 86.1 81* .7 86.7 86.8 87.0 87.8 87.280.5 80.6 80.3 80.1 78.6 77.9 76.5 76.2 75.7 75.1* 7l*.6 7i*.l
Dec 52 103.3 m96.5
106.6 106.9 10l*.9 103.1 99.9 99.9 (V)96.0
99.0 100.6v4/ ) 98.0Dec 52 96.2 97.8 97.9 98.2 96.9 .96.3 96.3 101.9 100.9
Dec 52 97.2 9l».0 93.0 92.1* 92.8 91.7 9l*.l 93.9 90.1 90.7 92.9 9l*.0
Dec 52 100.0 ioo.5 99.8 99.1* 99.1* 9l*.8 95.1* 97.2 97.0 96.9 97.2 95.6Dec 52 (V) (V ) 95.7 96.7 (h /) w 90.1 87.9
88 8890.7 88.9
Dec 52 (5/) (go 100.6 100.1* (go 99.8 99.1* 91.1 90.2
69.5 69.1 69.9 69.7 69.2 69.5 69.9 69.8 69.7 68.9 69.1 69.1Dec 52 100.1 99.7 99.3 98.6 97.9 9l*.6 9l*.5 9l*.l* 9l*.3 93.8 95.9 96.0
a*/)128.0
(h /)1 2 l.h
89.7127.9
85.9127.9
W )128.1*
(V)128.0
73.1129.1
71.6129.1
(V)129.3 <y >128.8
7U.3129.6
73.2130.8
113.1 113.7 113.9 111*.7 115.0 115.6 115.8 116.0 115.9 116.6 117.6 119.1*
117.5 119.3 118.5 119.0 119.9 119.9 119.8 120.0 120.0 120.8 121.5 123.2113.1 113.5 113.9 lll* .l l l l*.0 113.7 113.9 lllw l 113.1 113.6 113.9 116.2
109.0 110.2 110.0 110.5 110.3 111.6 112.3 112.2 112.1* 113.3 113.7 115.7Deo 52 98.1* 97.5 98.0 101.3 101.1 101.3 99.7 100.1 99.5 100.5 10U.5 105.1*
115.0 111;.8 116.1 116.1 116.9 117.6 118.6 119.3 119.2 119.1* 120.2 121.9l l l*.2 l l l;.3 111*. 6 111*. 3 111*.3 n i* .l* 1U*.2 n i*.i* 115.2 115.5 115.3 115.5
129.3 129.1* 130.7 128.9 129.0 128.9 126. 1* 127.3 127.3 125.8 125.3 127.3122.2 122.1 122.8 120.8 120.5 120.2 117. 1* 118.1* 118.2 116.5 115.8 117.8126.5 126.3 126.5 12i*.2 127.2 127.5 117.2 126.0 122.3 119.2 112.7 123.0
Jan 53 97.3 93.7 90.8 86.3 79.1* 79.7 79.9 76.7 76.7 75.7 75.6 71.6130.0 128.7 129. 1* 132.0 132.1* 119.1 111.8 118.9 123.1 123.1 127.7 130.511U.7 116.1 121.9 121.5 121.5 121.0 119.8 120.0 120.8 122.1* 123.9 12l*.l*106.9 107.8 111.2 112.2 112.1* 112.1* 112.1 112.1 112.6 112.6 112.1* 112.9121.0 122.9 123.9 125.1 126.5 125.5 127.8 128.7 128.5 128.9 130.7 131.8106.7 106.7 ,106.7 106.7 115.0 115.0 , 115.0 115.0 115.1* 116.0 116.0 116.011*8.8 11*9.5 11*9.3 11*8.7 11*8.3 11*8.0 11*6.9 11*6.9 11*5.5 11*2.0 138.3 138.1*11*6.9 11*9.0 155.3 155.7 159.3 161.5 162.3 162.8 161* .6 165.1 166.9 167.8151.9 153.1 161.1* 161.9 166.7 171.6 172.7 173.3 175.8 176.3 178.6 179.9118.1 122.8 122.8 122.8 122.8 117.5 117.5 117.5 117.5 117.5 117.5 117.5
119.5 121.1 122.6 123.6 12l*.l* 125.1 125.7 126.3 127.0 127.6 128.2 130.2
113.0 in * .o . 111*.6 115.5 115.5 116.2 116.6 117.2 117.7 118.2 118.8 120.3111*. 7 115.U 116.2 117.8 118.1 119.0 119.6 121.3 122. 1* 123.0 123.9 125.0115.0 115.7 116.5 118.1* 118.6 119.6 120.2 122.2 123.1* 121*.0 125.0 126.311U.3 i l l *. 8 116.6 119.3 119.3 120.1 120.8 122.2 123.3 123.3 123.9 125.1*112.6 113.6 113.6 111* .7 115.2 115.6 116.2 117.7 119.2 120.5 121.9 123.1121*. 8 125.3 125.5 127.0 127.3 131.1 131.8 138.1* 139.2 139.9 11*0.2 11*0.9113.1* 113.8 lll* .l Hi*.9 115.1 115.3 115.2 115.3 116.0 116.1 117.0 116.8113.8 113.8 l l l*.0 115.1 115.1 115.3 111*.5 111* .6 111* .6 111* .7 116.2 115.7113.2 111*.2 111.8 115.1 115.8 116.0 117.1 117.5 119.1* 119.3 119.3 119.6l l l*.8 116.7 117.9 120.1* 120.5 120.9 121.1 121.6 122.5 121.6 121.8 122.6115.0 116.5 117.7 119.8 120.0 120.1* 120.6 121.0 121.6 120.8 121.1 121.8111* .6 118.1 119. 1* 123.5 123 J* 123.7 121* .2 125. 1* 127.1 125.3 125.9 126.7
110.5 109.2 108.8 108.2 108.5 107.5 108.0 108.2 109.1 109.3 110.1 110.3Hi5.6 11*6.8 151.0 152.6 155.6 156.9 157.6 159.5 161.6 165.0 166.1* 166.9152 .U 152.9 158.1* 160.1* 163.5 161*.7 165.1 166.2 170.1* 175.1 176.5 176.911*3.0 11*1*. 7 11*8.6 150.3 152.5 153.1* 15U.2 155.9 157.3 160.6 161.9 162.2139.9 11*1.3 ll*l*.l* 11*5.5 11*9.0 151.0 152.0 155.0 155.6 157.6 159.3 160.2
Item and croup
Apparel—ContinuedManmade f ib e r s apparel-
Men's:S u its , rayon—Slacks, rayon-----Jackets-Sport sh ir ts , rayon------------Socks, nylon, stretch ---------
Women's:D resses, rayon—S lip s , rayon and nyIon-Pant ie s , rayon-----------Nightgowns, rayon———Hose, nylon— —— ------S u itb, rayon—S k ir ts , rayon- Blouses-
C hildren 's:Bqys' s la c k s- Boys* Jack ets-G ir ls ' sweaters, orIon-
Other manmade f ib e r s apparel: Yard goods,
Miscellaneous apparel- Women's co ats, fur—Women's g ird le s------
Shoes-Men's:
Shoes, s tr e e t-Shoes, work----
Women's:Shoes, s tr e e t- Shoes, p lay-
C hildren 's: Shoes, oxford-
Shoe rep a irs—-----
Transportation-----P riv a te -
Automobiles, new— Autom obiles, used- T ire s - G asoline-Motor o i l— Auto re p a irs-Auto re g is tra t io n - Auto insurance——
Public------------------T ransit fa re s ----------------R ailroad fa r e s , coa ch -
Medical care-Medical care le s s h osp ita l ra te s
and group h o sp ita lizatio n ------Physicians' fe e s------- -------------
General p rac titio n ers' fe e s—Office v i s i t ---------------------House v i s i t — —----- ------O bstetrical care-
Surgeons' fee s——Appendectomy------Tonsillectomy—
D en tists ' fe e s--------F il l in g s - Extraction s-
Optometric examination andeyeglasses—- —----------
H ospital r a te s-Men's pay ward- Semiprivate roa Private room---
See footnotes a t end o f tab le,62
Digitized for FRASER http://fraser.stlouisfed.org/ Federal Reserve Bank of St. Louis
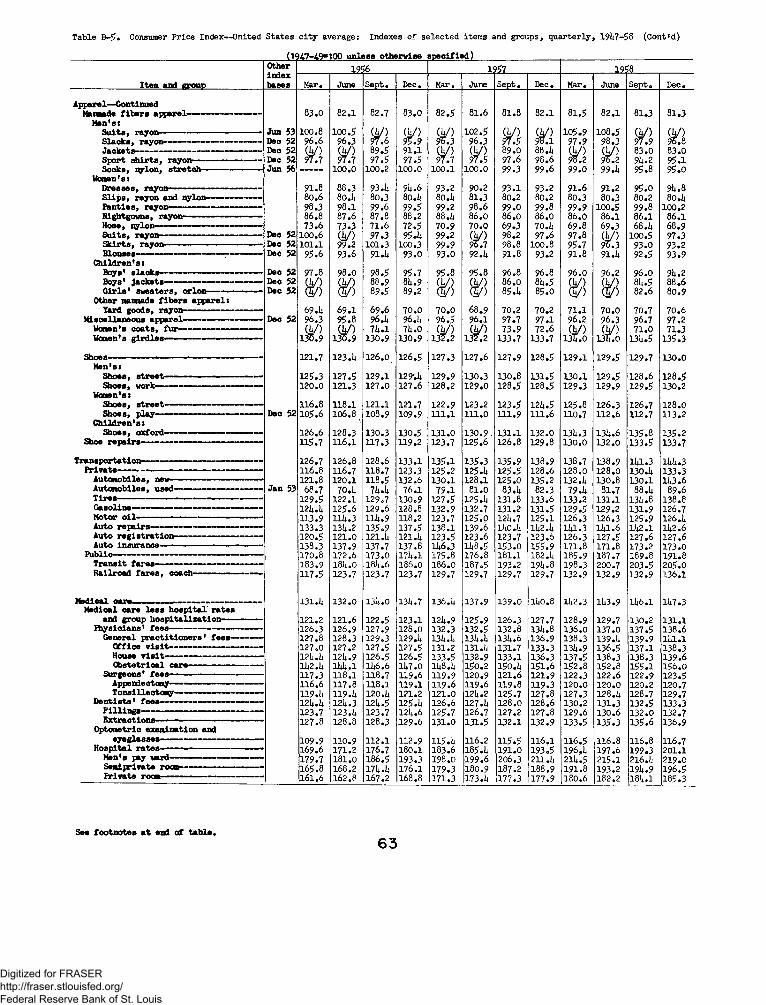
Table B-5. Consumer Price Index— United S tates c it y average: Indexes o f se lected items and groups, q u arterly , 191*7-58 (Cont'd)
(19^7-^9=100 unices otherwise specified)
______________ Item and group
Apparel—ContinuedManmade f ib e r s apparel------
Men's:S u its , rayon-------------Slacks, rayon------- ----Jackets--------------------Sport sh ir ts , rayon------------Socks, nylon, stretch---------
Women's:D resses, rayon S lip s , rayon and nyIon- Panties, rayon-Nightgowns, rayon— Hose, nylon S u its , rayon— S k ir ts , rayon- Blouses-
C hildren 's: Boys' s lack s-Boys' ja ck e ts- G ir ls ' sweaters, orIon-
Other manmade f ib e r s apparel: lard goods, rayon--------------
Miscellaneous apparel- Women's coats, fu r- Women's g ird le s-----
Shoes----------------Men's:
Shoes, street* Shoes, work—
Women's:Shoes, street* Shoes, play—
C hildren 's:Shoe 8, oxford*
Shoe rep a irs-------
Transportation----------- —Private---------------------
Automobiles, new-------Automobiles, used-----T ires---------------------Gasoline-------- ———Motor o i l----------------Auto rep a irs—-———Auto reg istra tio n ------Auto insurance—-------
Public—--------------------T ransit faze s-----------Railroad fa re s , coach-
Medical care le s s h osp ita l ra te sand group h osp italizatio n-----
Physicians' fe e s------- ------- ----General p rac titio n e rs ' fe e s—
Office v i s i t --------------------House v i s i t ---------------------O bstetrical care— - — -----
Surgeons' fe e s---------------- -—Appendectomy------ —--------—Tonsillectomy------------------
D en tists ' fe e s---------- ------------F ill in g s----------------------------Extractions-----— ---------------
Optometric examination andeyeglasses-----------------------
H ospital r a te s-— —----— —Men's pay ward---------------- —Semiprivate room-----------------Private room- —— —— ---------
Other 1956 _______ 1257___________ ___________ lass___________indexbases Mar. June Sept. Dec. Mar. June Sept • Dec. Mar. June Sept. Dec.
83.0 82.1 82.7 83.0 82.5 81.6 81.8 82.1 81.5 82.1 81.3 81.3
Jun 53 Dec 52
100.896.6
100.596.3
(V )97.6 8 3
(V)96.3
102.596.3
(h /)97.5
(V)98.1
105.997.9
108.598.3
(h /)97.9
( y )96.8
Dec 52 Dec 52
( V )97.7
(U/)97.7
89.597.5
91.197.5
(k /)97.7
(U/)97.5
89.097.6
88.1*98.6
(4 /)98.2 (£/)96.2
83.091*.2
83.095.1
Jun 56 — 100.0 100.2 100.0 100.1 100.0 99.3 99.6 99.0 99.1* 95.8 95.0
91.8 88.3 93.U 9l*.6 93.2 90.2 93.1 93.2 91.6 91.2 95.0 91*.880.6 80.1* 80.3 80.1* 80.1* 81.3 80.2 80.2 80.3 80.3 80.2 80.1*98.3 98.1 99.6 99.5 99.2 98.6 99.0 99.8 99.9 100.5 99.8 100.286.8 87.6 87.8 88.2 88.1* 86.0 86.0 86.0 86.0 86.1 86.1 86.173.6 73.3 71.6 72.5 70.9 70.0 69.3 70.1* 69.8 69.3 68.1* 68.9
Dec 52 100.6 (h /) 97.3 95.1; 99.2 (V )96.7
98.2 97.6 97.8 Q|/>96.3
100.5 97.3Dec 52 101.1 99.2 101.3 100.3 99.9 98.8 100.8 95.7 93.0 93.2Dec 52 95.6 93.6 91.1* 93.0 93.0 92.1* 91.8 93.2 91.8 91.1* 92.5 93.9
Dec 52 97.8 98.0 98.5 95.7 95.8 95.8 96.8 96.8 96.0 96.2 96.0 9l*.2Dec 52 (JV )
8 888.9 81*.9 ( | / ) ( | / ) 86.0 8i*.5 (V) ( j / ) 8i*.5 88.6
Dec 52 89.5 89.2 ( | / ) W ) 85. 1* 85.0 ® /) (V ) 82.6 80.9
69. 1i 69.1 69.6 70.0 70.0 68.9 70.2 70.2 71.1 70.0 70.7 70.6Dec 52 96.3 95.8 96.1* 96.1* 96.5 96.1 97.7 97.1 96.2 96.3 96.7 97.2
(u /)1375.9
(V)130.9
7l*.l130.9
7l*.0130.9
(V)132.2
(V )132.2
73.9133.7
72.6133.7
(V )13h.O
(V )13U.0
71.0 131*.5
71.3135.3
121.7 123.It 126.0 126.5 127.3 127.6 127.9 128.5 129.1 129.5 129.7 130.0
125.3 127.5 129.1 129.1* 129.9 130.3 130.8 131.5 130.1 129.5 128.6 128.5120.0 121.3 127.0 127.6 128.2 129.0 128.5 128.5 129.3 129.9 129.5 130.2
116.8 118.1 121.1 121.7 122.9 123.2 123.5 121*.5 125.8 126.3 126.7 128.0Deo 52 105.6 106.8
\ 108.9 109.9 111.1 111.0 111.9 111.6 110.7 112.6 112.7 113.2
126.6 128.3 130.3 130.5 131.0 130. 9 . 131.1 132.0 131*.3 13U.6 135.8 135.2115.7 116.1 117.3 119.2 123.7 125.6 126.8 129.8 130.0 132.0 133.5 133.7
126.7 126.8 128.6 133.1 135.1 135.3 135.9 138.9 138.7 138.9 11*1.3 H*l*.3116.8 116.7 118.7 123.3 125.2 125.1* 125.5 128.6 128.0 128.0 130.1* 133.3121.8 120.1 118.5 132.6 130.1 128.1 125.0 135.2 132.1* 130.8 130.1 11*3.6
Jan 53 68.7 70.1* 7l*.l* 76.1 79.1 81.0 83. 1* 82.3 79.1* 81.7 88. 1* 89.6129.5 122.1 129.7 130.9 127.5 125. 1* 131.8 133.6 133.2 131.1 131*. 8 138.812l* .l* 125.6 129.6 128.8 132.9 132.7 131.2 131.5 129.5 129.2 131.9 126.7113.9 l l i*.3 111*. 9 118.2 123.7 125.P 121*. 7 125.1 126.3 126.3 125.9 126.1*133.3 131*. 2 135.9 137.5 138.1 139.6 11*0 .1* 11*2.1* 11*1.3 11*1.6 11*2.1 11*2.6120.5 121.0 121.1* 121.1* 123.5 123.6 123.7 123.6 126.3 127.5 127.6 127.6138.3 137.9 137.7 137.8 11*6.3 11*8.5 153.0 155.9 171.8 171.8 173.2 173.0170.8 172.6 173.0 171* .1 175.8 176.8 181.1 182.1* 185.9 187.7 189.8 191.8183.9 181*. 0 I8J4.6 186.0 186.0 187.5 193.2 191*. 8 198.3 200.7 203.5 205.0117.5 123.7 123.7 123.7 129.7 129.7 129.7 129.7 132.9 132.9 132.9 136.1
131.1* 132.0 13l*.0 131*. 7 136.1* 137.9 139.0 11*0.8 11*2.3 11*3.9 11*6.1 11*7.3
121.2 121.6 122.5 123.1 121*. 9 125.9 126.3 127.7 128.9 129.7 130.2 131.1126.3 126.9 127.9 128.0 132.3 132.5 132.8 13U.8 136.0 137.0 137.5 138.6127.8 128.3 129.3 129.1* 131*.1* 131* .1* 131*.6 136.9 138.3 139.1* 139.9 11*1.1127.0 127.2 127.5 127.5 131.2 131.1* 131.7 133.3 131* .9 136.5 137.1 138.312l*.l* 121*.9 126.5 126.5 133.5 132.9 133.1 136.3 137.5 138.3 138.3 139.611*2 .U H*l*.l 11*6.6 11*7.0 11*8.1* 150.2 150. 1* 151.6 152.8 152.8 155.1 156.0117.3 118.1 118.7 119.6 119.9 120.9 121.6 121.9 122.3 122.6 122.9 123.5116.6 117.8 118.1 119.1 119.6 119.6 119.8 119.3 120.0 120.0 120.2 120.7119. li 119.1* 120.1* 121.2 121.0 121* .2 125.7 127.8 127.3 128.1* 128.7 129.712i*.l* 121*.3 12l*.5 125.1* 126.6 127.1* 128.0 128.6 130.2 131.3 132.5 133.3123.7 123.1* 123.7 121*.6 125.7 126.7 127.2 127.8 129.6 130.6 132.0 132.7127.8 128.8 128.3 129.6 131.0 131.5 132.1 132.9 133.5 135.3 135.6 136.9
109.9 110.9 112.1 112.9 115. 1* 116.2 115.5 116.1 116.5 116.8 116.8 116.7169.6 171.2 176.7 180.1 183.6 185.1* 191.0 193.5 196, 1* 197.6 199.3 201.1179.7 181.0 186.5 193.3 198.0 199.6 206.3 211.1* 211*.5 215.1 216.1* 219.0165.8 168.2 171* .1* 176.1 179.3 180.9 187.2 188.9 191.8 193.2 19U.9 196.5161.6 162.8 167.2 168.8 171.3 173.1* 177.3 177.9 180.6 182.2 18)*. 1 185.3
See footnotes a t end of table,6 3
Digitized for FRASER http://fraser.stlouisfed.org/ Federal Reserve Bank of St. Louis

T a b le B -5 . Consumer P r ic e In dex— U nited S ta te s c i t y a v era g e : In d exes o f s e le c t e d item s and g ro u p s , q u a r t e r ly , 191*7-58 (C on t»d )
(1947-49=100 u n le s s o th erw ise s p e c i f i e d ) ____________________
Item and group
M ed ica l Care— C ontinued Group h o s p i t a l iz a t io n - -P r e s c r ip t io n s and d ru gs—
P r e s c r ip t io n s -A s p ir in t a b l e t s - M ilk o f m agneaia-M u ltip le v ita m in co n c e n tr a t
P erson a l c a r e -M en's h a i r c u t s - Beauty shop s e r v ic e a -
Shampoo and wave s e t - Permanent v a v e -
T o i l e t g o o d s - T o o th p a s te -Face p ow der- T o i l e t soap— R azor b la d e s -S a n ita ry napkinsC lea n s in g t is s u e ------Shaving crea m------ — —Face cream------------ — —Shampoo— -----------------------Home permanent r e f i l l -
R eadin g and r e c r e a t io n —M o t io n -p ic tu r e a d m is s io n s -
A d u lts -----------------------------------C h ild re n------ — — --------------
Newspapers— ---------------------------T e le v is io n s e t a - — — — —R a d io s , t a b l e -------------------------T o y s -S p o r t in g good s----------T e le v is io n r e p a i r s -
Other goods and s e r v i c e s - T ob acoo p ro d u cts— —
C ig a r a -C ig a r e t t e s -
A lc o h o l ic b e v e ra g e s - B e e r -W hisky-
TJEKerin d e xbasea
Dec 5 2
Dec 5 2
Dec 5 2
Dec 5 2
Dec 5 2
Dec 5 2
Dec 5 2
Dec 5 2
Dec 5 2
Deo 5 2
Dec 5 2
Dec 5 2
Dec 5 2
Dec 5 2
Dec 5 2
191*7 191*8Mar. June S e p t . D ec. Mar. June S e p t . D ec. Mar. June S e p t . D ec.
-----------r
9U.6 9 5 .8 9 7 .5 9 8 .9 1 0 0 .6 101 .2 1 0 1 .7 10 2 .2 102 .3 1 0 2 .6 1 0 2 .8 1 0 3 .19 1 .6 9 3 .1 9 6 .2 98.1* 1 0 1 .0 101 .7 1 0 2 .5 1 0 3 .6 103 .6 10l*.0 10l*.6 1 0 5 .19 8 .5 99.1* 1 0 0 .3 1 0 0 .3 1 0 0 .3 10 0 .3 10 0 .3 1 0 0 .3 100 .3 1 0 0 .3 1 0 0 .3 1 0 0 .3
1 0 0 .1 1 0 0 .1 1 0 0 .1 9 9 .8 1 0 0 .1 1 0 0 .1 1 0 0 .1 9 9 .8 100 .1 1 0 0 .1 1 0 0 .5 1 0 0 .5— ----- — - — — — — — — — — ----- — — —
9 7 .3 9 7 .1 9 7 .2 1 0 0 .0 10 0 .3 100 .3 1 0 2 .1 1 02 .7 1 01 .9 1 0 1 .2 1 0 0 .8 1 0 0 .193.1* 93.U 9l*.5 9 7 .0 9 9 .1 9 9 .1 1 0 2 .9 1 0 5 .5 105 .1 10l*.7 10l*.7 10l*.7
1 0 0 .3 1 0 0 .3 1 0 0 .9 1 0 0 .7 1 0 1 .3 9 9 .9 9 9 .8 9 9 .7 9 9 .6 9 9 .6 9 9 .5 9 8 .79 9 .5 9 9 .6 100 .7 99 .2 9 9 .8 100 .2 10 0 .2 1 0 0 .3 100 .3 1 0 0 .3 100.1* 9 9 .5
1 0 1 .3 1 0 1 .1 1 0 1 .1 1 0 2 .5 103 .2 9 9 .5 9 9 .3 9 8 .8 9 8 .6 9 8 .6 98 .2 9 7 .69 9 .3 9 8 .6 9 7 .2 1 0 3 .6 1 0 2 .5 101 .3 1 0 2 .2 1 0 2 .2 1 0 0 .0 9 8 .8 9 7 .8 9 6 .29 5 .5 9 5 .7 4 9 6 .6 9 7 .3 9 7 .5 9 7 .3 1 0 3 .9 10l*.0 10l*.3 10l*.l* 1 0 5 .1 1 0 3 .29 3 .8 95.1* < 9 8 .7 1 0 0 .0 1 0 0 .0 100 .2 100 .2 1 0 0 .2 1 0 0 .0 1 0 3 .5 1 0 5 .5 1 0 6 .3
1 11 .2 1 0 2 .1 96.1* 1 1 0 .5 1 0 7 .5 1 0 3 .9 1 0 0 .9 1 0 0 .5 9 5 .2 9 0 .9 8 7 .3 81*.69 9 .8 99 .3 9 9 .8 9 9 .8 9 9 .8 9 9 .8 9 9 .8 100.1* 100.1* 100.1* 100.1* 100.1*8 2 .5 9 1 .6 9l*.5 9 6 .8 9 8 .6 103 .8 10 6 .8 106.8 106.8 106.8 1 0 6 .8 1 0 6 .8
------- -- - — — — — - — — - — — - — — — — ----- — — — - — — - - —— — — — - --------- — — — — — - — — — —
— — — — — — — — — — - — — - — — —— - — - — — — - — - — - — — - — —— — — — — — — — — — —
95.1* 95 .2 95.6 97.1* 97 .7 100 .2 1 0 0 .8 1 0 3 .0 10l*.l 1 0 3 .9 10l*.8 10l*.398 .7 9 7 .6 ( V )
97.1*9 9 .6 9 9 .5 9 8 .7 9 8 .9 101.1* 10 2 .5 1 0 1 .3 1 0 2 .6 1 0 2 .0
9 8 .3 97.1* 99.1* 9 9 .5 9 8 .8 9 9 .2 101.5 102 .5 1 0 2 .0 103.1* 102 .2101.1* 9 8 .9 aa100.1* 9 9 .8 99.1* 9 8 .1 101.6 1 03 .9 97.1* 9 7 .9 1 0 2 .1
91.1* 92.1* 9 3 .9 95 .7 102 .7 1 0 3 .7 106.1 107 .0 1 0 7 .0 1 0 7 .0 1 0 7 .0— — — - — - ------- -- — — — — ------- -- ------- -- — - — — — ----- —— - — - - — - - — — — - — — — — ------- -- - — — 9 0 .7 8 9 .7— — — — — — — - — - — ------- -- — — —
— — — — — — — — — — — —
9 5 .0 9 5 .7 96.9 9 7 .9 98.1* 98.1* 10 2 .8 103 .2 103 .0 103 .2 lOluO 10i*.09l*.8 95.1* 97.2 9 7 .9 9 8 .6 9 8 .6 103.1* 103.1* 103 .0 103.1* 1 0 3 .8 103 .897.1* 9 7 .0 97.0 97.1* 9 7 .1 9 7 .0 1 0 3 .0 1 0 3 .6 102 .9 1 03 .1 1 0 3 .6 103 .69 3 .9 9l*.9 97.3 9 7 .8 9 8 .7 9 8 .8 1 0 3 .8 103 .7 103 .3 1 03 .5 1 03 .7 103 .6
___ — — — ___— __— ______ __— _____ ____ _ ____ _
19U9
See f o o tn o te s a t end o f t a b l e .
6 4
Digitized for FRASER http://fraser.stlouisfed.org/ Federal Reserve Bank of St. Louis
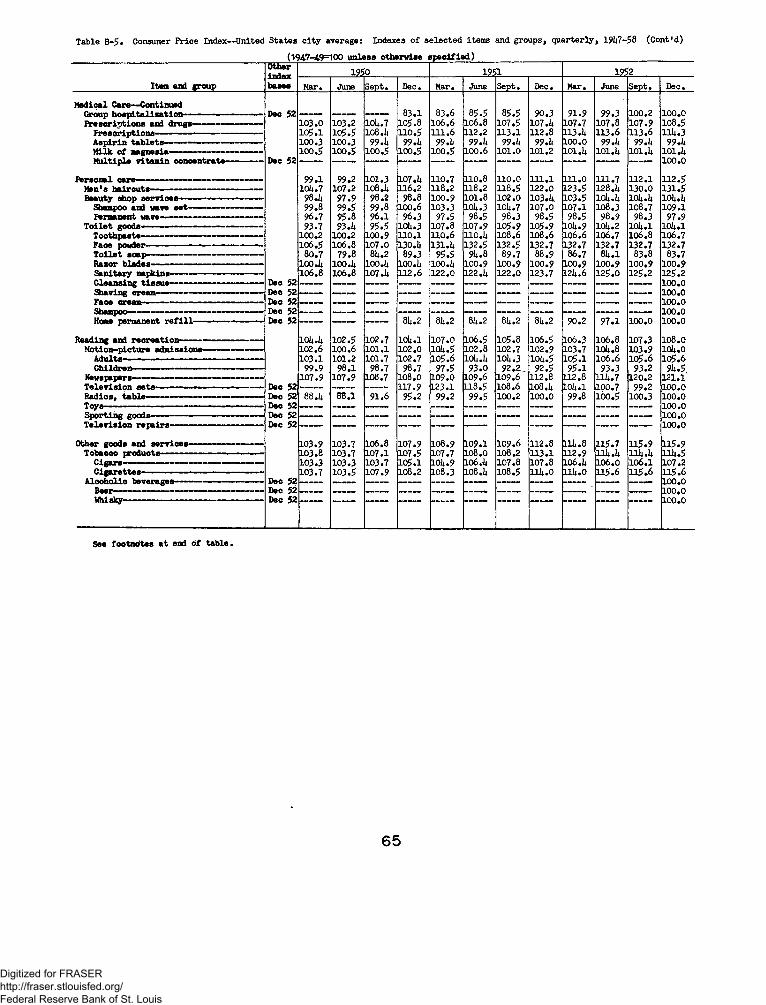
Table B-5. Consumer Price Index—United Sta tes c ity average: Indexes o f se lected items and groups, quarterly , 1 9 U7 -5 6 (Cont'd)
(1947-49=100 unless otherwise specified)
Item and group
"OlBerin d exbases
19 50 1 9 5 1 19 52
Mar. June S e p t . D ec. Mar. June S e p t . D ec. Mar. June S e p t . D ec.
M ed ica l Care— ContinuedGroup h o s p i t a l iz a t io n — ------------- ------------- Dec 52 — — . . . . . 8 3 .1 8 3 .6 8 5 .5 8 5 .5 9 0 .3 9 1 .9 99.3 10 0 .2 10 0 .0P r e s c r ip t io n s and dru gs— --------- --------------- 10 3 .0 10 3 .2 10U.7 10 5 .8 10 6 .6 10 6 .8 10 7 .5 10 7.U 10 7 .7 10 7 .8 10 7 .9 10 8 .5
P r e s c r ip t io n s -----------------------— ------------------ 1 0 5 . 1 10 5 .5 108.ii 1 1 0 .5 1 1 1 . 6 1 1 2 . 2 1 1 3 . 1 1 1 2 .8 1 1 3 .U 1 1 3 . 6 1 1 3 . 6 11U .3A s p ir in t a b l e t s — — — — — — 10 0 .3 10 0 .3 99. U 99.U 99.ii 99 .U 99.U 99 .U 10 0 .0 99.ii 99 .U 99 .UM ilk o f m agnesia— --------------------------------- 10 0 .5 10 0 .5 10 0 .5 10 0 .5 10 0 .5 10 0 .6 1 0 1 .0 1 0 1 .2 10 1.U 10 1 .ii 10 1.U 1 0 1 . UM u ltip le v ita m in co n ce n tra te ----------- — Dec 52 — — — — — — — — — — — 10 0 .0
P erson a l ca r e — — — — — --------------- — 9 9 .1 99.2 1 0 1 .3 107.U 1 1 0 .7 1 1 0 .8 1 1 0 .0 1 1 1 . 1 1 1 1 .0 1 1 1 . 7 1 1 2 . 1 1 1 2 . 5M en's h a ir c u t s --------------------- — - — — — 10U .7 10 7 .2 108.U 1 1 6 .2 1 1 8 . 2 1 1 8 . 2 1 1 8 . 5 12 2 .0 1 2 3 .5 1 2 8 .U 13 0 .0 1 3 1 . 5Beauty shop s e r v ic e s ----------------------------------- 98.14 9 7.9 9 8 .2 98.8 10 0 .9 1 0 1 .8 10 2 .0 10 3 .Uv 1 0 3 .5 lOii.U 10U.U 10U.U
Shampoo and wave s e t — — — — — — 99.8 9 9 .5 99.8 10 0 .6 1 0 3 .3 10U .3 10U.7 10 7 .0 1 0 7 . 1 10 8 .3 10 8 .7 1 0 9 .1Permanent wave— — — — ------------- ------- — 96.7 9 5 .8 9 6 .1 9 6 .3 9 7.5 9 8 .5 9 8 .3 9 8 .5 9 8 .5 9 8.9 9 8 .3 9 7.9
T o i l e t goods— — — — — --------------------- 9 3 .7 93.14 9 5 .5 10U .3 10 7 .8 10 7 .9 10 5 .9 10 5 .9 lOii.9 10U.2 10 U .1 10 U .1T ooth p a ste— — ----------------------------------------- 10 0 .2 10 0 .2 10 0 .9 1 1 0 . 1 1 1 0 .6 110 .ii 10 8 .6 10 8 .6 10 6 .6 10 6 .7 10 6 .8 10 6 .7F ace powder— — — — — — - - — 10 6 .5 10 6 .8 10 7 .0 130.U 13 1 .U 1 3 2 .5 1 3 2 .5 1 3 2 . 7 1 3 2 .7 1 3 2 .7 1 3 2 .7 1 3 2 .7T o i l e t s o a p ---------- ------------------------------------- 80 .7 79 .8 8U.2 8 9 .3 9 5 .5 9U.8 8 9 .7 88.9 8 6 .7 8U .1 8 3 .8 8 3 .7R azor b la d e s — — — — --------- — ------- 100 .U 100 .U 100.U 100 .U 100.U 10 0 .9 10 0 .9 10 0 .9 10 0 .9 10 0 .9 10 0 .9 10 0 .9S a n ita ry napkin s--------------------------------------- 10 6 .8 10 6 .8 10 7 .U 1 1 2 . 6 12 2 .0 12 2 .U 12 2 .0 1 2 3 .7 12U .6 1 2 5 .0 1 2 5 .2 1 2 5 .2C lea n s in g t is s u e --------------- — ------------------- Dec 52 . . . . . — — . . . . . . — — 10 0 .0
Dec 52 10 0 .0Dec 52 10 0 .0
Shampoo— ------------------------ — --------------- -- Dec 52 — . . . . . . . . ------- -- . . . . . ----- - - — — . . . . . ------- -- . — . . . . . . . . . . . . 10 0 .0Home permanent r e f i l l - — Dec 52 — — — 8U.2 8U.2 8U.2 8U.2 8U.2 90.2 9 7 . 1 10 0 .0 10 0 .0
R eading and r e c r e a t io n — — — — — 10U.U 10 2 .5 10 2 .7 10 U .1 10 7 .0 10 6 .5 10 5 .8 10 6 .5 10 6 .3 10 6 .8 1 0 7 .3 10 8 .010 2 .6 10 0 .6 1 0 1 . 1 10 2 .0 10 4 .5 10 2 .8 10 2 .7 10 2 .9 10 3 .7 10U.8 IO 3.9 i o U .o1 0 3 . 1 1 0 1 .2 1 0 1 .7 10 2 .7 10 5 .6 10U.U 10 ii.3 10U .5 1 0 5 . 1 10 6 .6 10 5 .6 10 5 .6
C h ild ren --------- -------------- — ----------------------- 9 9.9 9 8 .1 98 .7 98 .7 9 7 .5 9 3.0 92*2^ 9 2 .5 9 5 .1 9 3 .3 9 3.2 9U.5Newspapers— — — - — — —— — — ■— — 1 0 7 .9 10 7 .9 10 8 .7 10 8 .0 10 9 .0 10 9 .6 10 9 .6 1 1 2 . 8 1 1 2 .8 l l i i . 7 12 0 .2 1 2 1 . 1T e le v is io n s e t s — — — — — — --------- Dec 52 . . . . . . . — . - — . 1 1 7 . 9 123.1 1 1 8 . 5 10 8 .6 108.ii lO ii.l 10 0 .7 9 9 .2 10 0 .0R a d io s , t a b le ----------------------- — ------------- ------- Dec 52
Deo 5288.ii 8 8 .1 9 1 .6 9 5 .2 99.2 9 9 .5 10 0 .2 10 0 .0 99.8 10 0 .5 10 0 .3 10 0 .0
10 0 .0S p o r t in g goods— ------- ------------------------- — Dec 52 ____ — — ___ __. . . _____ — — . . . . . __. . . . 10 0 .0T e le v is io n r e p a ir s ------- ------- ------- ---------------- Dec 52 — — — — — — — — — — — 10 0 .0
Other goods and s e r v ic e s — — — 10 3 .9 10 3 .7 10 6 .8 10 7 .9 10 8 .9 1 0 9 .1 10 9 .6 1 1 2 . 8 ll i i .8 1 1 5 . 7 1 1 5 . 9 1 1 5 . 9T ob a cco p ro d u c ts ------------------------------------------- 10 3 .8 10 3 .7 1 0 7 . 1 10 7 .5 10 7 .7 10 8 .0 10 8 .2 1 1 3 . 1 1 1 2 .9 11U .U 11U .U 11U .5
C ig a rs— ------- --------- — ------- — ----------------- 10 3 .3 1 0 3 .3 10 3 .7 1 0 5 . 1 10ii.9 106 .u 10 7 .8 10 7 .8 106.ii 10 6 .0 1 0 6 .1 10 7 .2C ig a r e t t e s - -------------— — --------- — ------------ 10 3 .7 1 0 3 .5 10 7 .9 10 8 .2 10 8 .3 108.ii 10 8 .5 llii.O llii.O 1 1 5 . 6 1 1 5 . 6 1 1 5 . 6
A lc o h o l ic b ev era g es-------------------------------— Dec 52 — . — __ — — — . . . — — — . . . . . . . . . . ------- -- . . . . . — — 10 0 .0Dec 52 Dec 52
inn nXUUmU10 0 .0
See footncftes at end of table.
6 5
Digitized for FRASER http://fraser.stlouisfed.org/ Federal Reserve Bank of St. Louis

Table B-5« Consumer Price Index—United Sta tes c ity average: Indexes o f se lected items and groups, quarterly , 191*7-58 (Cont*d)
(19^7~49=10Q unless otherwise speciflad)
Item and group
TO5r 'indexbases
1953 . 1951l 1955
Mar. Junef Sept. Dec. Mar. June Sept. Dec. Mar. June Sept* Dec.
Medical Care—ContinuedGroup hospitalisation--------------------------------- Dec 52 101. 1* 10lt.2 1 0 7 .9 108 .7 111.8 112.lt 1 1 3 .7 113 .7 LHu7 115.0 1 1 5 .3 1 1 8 .7Prescriptions and drugs———---- ---- — 108.0 109.2 10 9 .2 109 .7 10 9 .0 110 .3 1 1 0 .5 110 .7 L10.1 111.0 i n . i t H 3 .3
Prescriptions—------------- ------- ------------------ 113 .lt 1X 3.5 1 1 3 .1 l l l t . l 115.2 116.0 116.2 116.6 L15.2 117.2 117.8 120.ltAspirin tablets------------------- ----------- --------- 9 9 .3 9 9 .9 100.2 100.2 9 5 .7 99.lt 99.it 9 9 .6 9 9 .6 9 9 .8 100.lt 1 0 0 .5Milk of magnesia— --------- ------------------------ 101.lt 111.2 111.6 112.2 112.2 112.1 1 1 2 .5 11 2 .5 L12.5 1 1 2 .5 H 2 .6 1 2 1 .9Multiple vitamin concentrate--------------- Dec 52 99.lt 100.1 1 0 0 .3 100 .9 100.6 100 .7 101.0 101.0 L01.0 101.0 101.1 101.2
Personal care— - — ------- ——--------------------- 112.lt 112.6 1 1 2 .9 113.6 l l l t . l 112 .7 1 1 3 .5 1 1 3 .6 L13.5 l i l t . 7 116.6 1 1 7 .9Men18 haircuts— ------------------------- 1 3 1 .5 1 3 1 .5 1 3 1 .5 132 .2 132 .7 132 .7 1 3 3 .6 13lt.3 1-31* .7 1 3 9 .7 11*6.9 11*9.3Beauty shop services— — — ——— 10li.7 106.6 1 0 7 .1 108.2 108.2 108 .5 110.0 110.lt 110.7 U l . l t 1 H .7 112.2
Shampoo and wave set-----—------------- 1 0 9 .5 112.6 1 1 3 .5 1 15 .3 11 5 .3 115 .9 1 1 7 .5 118.0 I l 8 .lt 119.1* 120.1 1 2 0 .9Permanent wave— ---------------------- - 9 7 .9 9 8 .1 9 8 .1 9 8 .0 9 7 .9 9 8 .0 9 9 .3 9 9 .5 9 9 .8 9 9 .9 9 9 .6 9 9 .6
Toilet goods— ------------------------------ 103 .9 1 0 3 .9 lO lt .l lO lt .l 10lt.9 102.lt 1 0 3 .2 1 0 3 .1 103.0 1 0 3 .0 1 0 3 .7 id * .2Toothpaste— ------ ------------------- ------ 106.6 1 0 6 .7 106.8 106.8 1 0 6 .9 106 .9 1 0 7 .1 1 0 7 .1 L07.1 106.6 1 06 .7 106.5Face .... • ■ - - - - - - ■ ... 132 .7 133 .lt • 13U .1 1 3 it .l 1 3 lt .l 122.8 12U.6 12 3 .5 122.1 1 1 9 .9 120.0 120.0Toilet soap-------------------------------------- 83.lt 82, it 8 1 .9 8 1 .9 8 5 .3 8 3 .8 86*5 86.6 8 6 .9 8 7 .0 87.1* 88.8Razor blades---------------- —---------- — - 1 0 0 .9 1 0 0 .9 101.0 101.0 101. 0 . 101.0 101.0 101.0 101.0 101.0 101.1 101.1Sanitary napkins— ------------- — —- 125.2 125.2 1 2 5 .3 1 2 5 .3 126.1 126.1 1 2 6 .1 126.1 126.1 126.1 126.2 126.2Cleansing tissue------------------------------ Deo 52 9 9 .3 9 8 .5 9 9 .0 98.2 97 .7 96.lt 9 6 .3 95 .7 91* .6 9 1 .6 88.2 8 6 .5Shaving cream— —---------—--------------- Dec 52 100.0 100.0 100.2 100.2 100 .3 100 .3 100.it 100.lt L00.lt 105.0 106.0 1 0 7 .9Face cream— Dec 52 100.0 100.1 100.lt 100.lt 101.1 9 2 .5 92.6 9 2 .1 9 2 .1 9 1 .8 92.1* 9 5 .6
Dec 52 100.0 99.8 99.8 100.0 100.6 100.6 100.8 100.8 100.8 100.8 101.0 101.0Home permanent r e f i l l ----- ---------------- Dec 52 1 0 0 .3 1 0 3 .6 1 0 9 .8 n o . 5 1 1 0 .9 103 .7 1 0 3 .7 1 03 .7 103 .7 1 1 3 .7 1 3 1 .7 1 3 3 .6
Reading and recreation—------------------- ---- 107 .7 1 0 7 .8 1 0 7 .8 108.9 108.2 106.lt 1 0 6 .5 106.6 106.6 106.2 1 0 6 .7 106.8106.7 108.1 n o .o 1 1 5 .0 113.lt l i l t .6 I I 9.3 1 1 7 .5 120.9 123 .lt 122.7 122.1108.0 1 0 9 .1 i n . 5 1 1 5 .9 115.0 116 .9 121.lt 1 1 9 .9 ' 123.lt 1 2 5 .0 1 2 5 .5 12lt.2
Children— — — -------—------------------ 9 8 .1 1 0 0 .5 1 0 0 .9 107.6 103.it 101 .9 107 .lt 10lt.6 107.6 113.2 1 0 8 .5 110.0Newspapers-------- - 121.1 1 2 0 .9 1 2 0 .9 1 2 0 .9 12 0 .7 120 .9 1 2 0 .9 1 2 1 .5 123.2 12 3 .7 1 2 3 .7 1 2 3 .7Television sets----—- —-------— —------- Dec 52 9 9 .6 98.0 9 6 .9 9 5 .5 9 l t .l 93.lt 88.2 8 7 .1 8 7 .1 86.0 85.8 85.1*Radios, table— ——--------— — —------ Dec 52 9 9 .8 9 9 .3 9 9 .0 98.lt 9 7 .0 9 5 .1 9U.U 93.lt 9 2 .3 9 1 .7 91.0 9 0 .1Toys--------------------------------- —--------------- Deo 52 100.0 9 5 .8 9 lu 5 9 5 .0 9 2 .9 9 2 .9 8 9 .1 9 1 .7 9 1 .7 8 9 .7 8 9 .7 91.1*Sporting goods— ----- --------------------— Dec 52 98.0 98.0 9 7 .1 9 6 .0 9 6 .5 9 2 .5 92.8 92.8 90.8 89.1* 9 0 .3 9 0 .3Television repairs— — — - — Dec 52 103.lt 105 .lt 106.lt 1 0 9 .9 111.2 1 12 .9 113.8 113.8 116.0 1 1 7 .9 118.0 H 9 .9
Other goods and services--------------------- — 117 .5 118.2 1 1 8 .5 1 2 0 .3 120.1 120.1 120.1 119.9- 119 .8 1 1 9 .9 120.6 1 2 0 .6Tobacco products— — 118 .8 1 1 9 .6 1 1 9 .8 1 2 0 .8 102 .8 120 .8 1 2 0 .8 1 2 1 .0 120 .9 1 2 1 .1 1 2 1 .6 1 21 .9
Cigars------- —------- —------------------------ 107.lt 1 0 7 .6 1 0 7 .9 108.0 1 07 .9 108.1 1 0 8 .3 108 .3 108.8 108.8 1 0 9 .8 109 .8Cigarettes-------------------—— ------------ 120 .5 1 2 1 .3 1 2 1 .6 1 2 2 .6 122 .6 122 .6 1 2 2 .6 1 2 2 .8 122 .7 1 2 2 .8 1 2 3 .3 1 23 .7
Alcoholic beverages—- — ---------------- — Dec 52 9 9 .9 1 0 0 .2 1 0 0 .3 1 0 3 .5 103 .2 103 .2 1 0 3 .0 1 0 2 .6 102.5 102 .5 1 0 3 .2 1 0 3 .0Dee 52 9 9 .9 1 0 0 .3 100 .lt io 5 .l t 1 0 5 .0 10it.9 10it.7 lO lt .l 1 03 .9 103 .7 1 0 3 .8 lOlt.O
Whisky---------------------------------------------- Dec 52 9 9 .9 1 0 0 .0 1 0 0 .2 100.5 100.5 100.5 100.5 100.it 100.lt 100 .7 102.lt 101 .7
1/ Includes gas, electricity , telephone, water, and postage*%/ Includes house purchase and real estate taxes not shown separately.
66
Digitized for FRASER http://fraser.stlouisfed.org/ Federal Reserve Bank of St. Louis
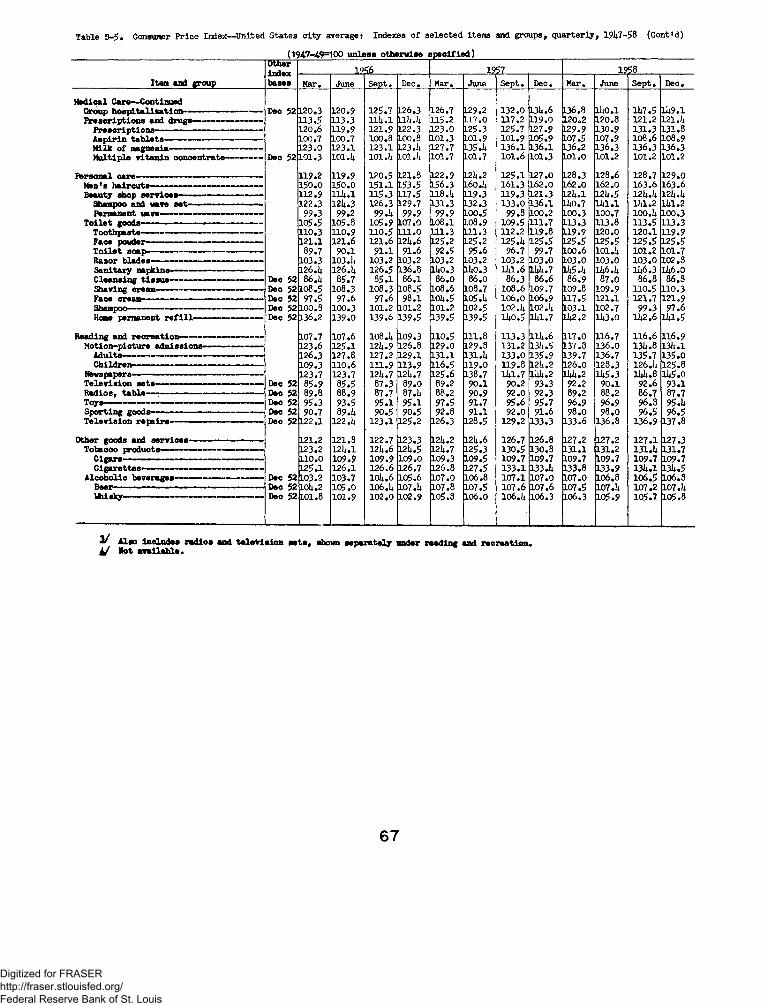
Table B -5 . Consumer P rice In d ex -U n ited States c i t y average: Indexes o f se le c te d items and groups, q u a rterly , 19it7-58 (C ont'd )
(1947-49=100 unless otherwise specified)
Item and group
Otherin d exbases
________19 56_________ 19 57 . . 12 58
Mar. June S e p t . D ec. Mar. June S e p t . D ec. M ar. June S e p t . D ec.
M ed ica l Care— ContinuedCroup h o s p i t a l is a t i o n --------------------------------- Dec 52 1 2 0 .3 12 0 .9 1 2 5 .7 12 6 .3 12 6 .7 12 9 .2 1 3 2 .0 13U .6 L36.8 litO .l lit? .5 1U 9 .1P r e s c r ip t io n s and d ru gs------- --------------------- 1 1 3 . 5 1 1 3 . 3 l l i t . l llit.it 1 1 5 . 2 1 1 7 .0 1 1 7 . 2 1 1 9 .0 12 0 0 2 12 0 .8 1 2 1 . 2 12 1 .it
P r e s c r ip t io n s — — — ------- --------------------- 12 0 .6 1 1 9 .9 1 2 1 . 9 12 2 .3 1 2 3 .0 1 2 5 .3 1 2 5 .7 12 7 .9 L29.9 13 0 .9 1 3 1 . 3 1 3 1 . 8A s p ir in t a b l e t s ----------------------------------------- 10 0 .7 10 0 .7 10 0 .8 LOO.8 1 0 1 .3 10 1 .9 1 0 1 .9 10 5 .9 L07.5 10 7 .9 10 8 .6 10 8 .9M ilk o f m agnesia--------------------------------------- 1 2 3 .0 1 2 3 . 1 1 2 3 . 1 123.it 1 2 7 .7 135.it 1 3 6 . 1 1 3 6 . 1 L36.2 1 3 6 .3 1 3 6 .3 1 3 6 .3M u ltip le v ita m in co n ce n tra te --------------- Dec 52 1 0 1 . 3 1 0 1 . k 10 1 J t 10 1.it 1 0 1 .7 10 1 .7 1 0 1 .6 1 0 1 .3 L01.0 1 0 1 .2 1 0 1 .2 1 0 1 .2
P erson a l ca re — --------- — ------— ---------------- 1 1 9 .2 1 1 9 .9 12 0 .5 1 2 1 .8 12 2 .9 L2it.2 1 2 5 . 1 12 7 .0 12 8 .3 12 8 .6 1 2 8 .7 12 9 .0M en's h a ir c u t s -------- -------------------------------- 15 0 .0 15 0 .0 1 5 1 . 1 1 5 3 .5 tl56.3 l60.it 1 6 1 . 3 16 2 .0 16 2 .0 16 2 .0 16 3 .6 1 6 3 .6Beauty shop s e r v ic e s --------- ----------------------- -- 1 1 2 . 9 l l i t . l 1 1 5 . 3 1 1 7 . 5 U 8 . >4 1 1 9 .3 1 1 9 . 3 1 2 1 . 3 12 it .l 12 U .5 12it.it 12it.it
Shampoo and wave s e t — ----------- — — 1 2 2 .3 12U .3 1 2 6 .3 12 9 .7 1 3 1 . 3 13 2 .3 1 3 3 .0 1 3 6 . 1 lit0.7 l i t l . l i i a . 2 l l t l .2Permanent wave------------------------------------------- 9 9 .3 99.2 99.it 99.9 99.9 10 0 .5 99.8 10 0 .2 10 0 .3 10 0 .7 100.it 10 0 .3
T o i l e t goods-----— ----------- — ----------------- 1 0 5 .5 10 5 .8 10 5 .9 10 7.0 1 0 8 .1 10 8.9 10 9 .5 1 1 1 . 7 1 1 3 . 3 1 1 3 . 8 1 1 3 . 5 1 1 3 . 3T o o t h p a s t e - - -------- ------ — —— — 1 1 0 .3 1 1 0 .9 1 1 0 .5 1 1 1 . 0 1 1 1 . 3 1 1 1 . 3 1 1 2 . 2 1 1 9 .8 1 1 9 .9 12 0 .0 1 2 0 . 1 1 1 9 .9Face powder------------------------------------------- 1 2 1 . 1 1 2 1 .6 1 2 1 . 6 12U .6 1 2 5 .2 12 5 .2 12 5 .lt 1 2 5 .5 1 2 5 .5 1 2 5 . 5 1 2 5 .5 1 2 5 . 5T o i l e t soap— --------------------------------------------- 89 .7 9 0 .1 9 1 . 1 9 1 .6 9 2 .5 9 5 .6 9 6.7 9 9 .7 10 0 .6 I0 1.it 1 0 1 .2 1 0 1 .7R azor b la d e s ----------------------------------------------- 1 0 3 .3 10 3.it 1 0 3 .2 10 3 .2 1 0 3 .2 10 3 .2 10 3 .2 10 3 .0 10 3.0 10 3 .0 10 3 .0 1 0 2 .3S a n ita ry napkins--------------------------------------- 126.1* 1 2 6 . U 12 6 .5 13 6 .8 lit0 .3 lit0.3 l it l .6 litlt.7 lit5.it lit6.it 11*6.3 l!t6.0
Deo 52 86.lt 8 5 .7 8 5 .1 8 6 .1 8 6.0 86.0 8 6 .3 8 6.6 86.9 8 7 .0 86.8 8 6 .3Shaving cream---------— — ------— — Dec 52 10 8 .5 10 8 .3 10 8 .3 10 8 .5 10 8 .6 10 8 .7 10 8 .6 10 9 .7 10 9.8 10 9 .9 1 1 0 .5 1 1 0 . 3Face cream------------------- ------------------- — -------- Deo 52 9 7 .5 9 7 .6 9 7.6 9 8 .1 lQit.5 105.it 10 6 .0 10 6 .9 1 1 7 . 5 1 2 1 . 1 1 2 1 . 7 1 2 1 . 9Shampoo— ----------------------- — --------------------- -- Dec 52 10 0 .3 10 0 .3 1 0 1 .2 1 0 1 .2 1 0 1 .2 10 2 .5 10 2.it 102 J t 1 0 3 .1 10 2 .7 9 9 .3 9 7.6Home permanent r e f i l l ------- — --------------- Dec 52 13 6 .2 13 9 .0 13 9 .6 1 3 9 .5 13 9 .5 13 9 .5 U t0.5 n a .7 U t2.2 lit3 .0 llt2 .6 na.5
R eadin g and r e c r e a t io n — ----------- ------------- ------ 10 7 .7 10 7 .6 108.it 10 9 .3 1 1 0 .5 1 1 1 . 8 1 1 3 . 3 H it.6 1 1 7 .0 1 1 6 .7 1 1 6 .6 1 1 6 .9M o tio n -p ic tu re ad m iss ion s— — - - — — — 1 2 3 .6 1 2 5 . 1 12U .9 12 6 .8 12 9 .0 12 9 .8 1 3 1 . 2 13U .5 1 3 7 .3 13 6 .0 13U .8 1 3 it .l
A d u lts ----------------------------------------------------------- 12 6 .3 12 7 .8 1 2 7 .2 1 2 9 .1 1 3 1 . 1 13 l .it 1 3 3 .0 1 3 5 .9 13 9 .7 13 6 .7 1 3 5 .7 1 3 5 .0C h ild ren ------- — ------------- — ----------------------- 10 9 .3 1 1 0 .6 1 1 1 . 9 1 1 3 . 9 1 1 6 . 5 1 1 9 .0 1 1 9 .8 12 ii.2 12 6 .0 1 2 8 .3 12 6 .it 1 2 5 .8
Newspapers— — — ---------------— — — — — 1 2 3 .7 1 2 3 .7 12 it.7 12U .7 1 2 5 .6 13 8 .7 l i t l .7 litit.2 litii.2 1U 5 .3 litit.8 lit5.oT e le v is io n s a te ——— — — —— — — — — Dec 52 8 5.9 8 5 .5 8 7 .3 89.0 8 9.2 9 0 .1 90.2 9 3 .3 9 2 .2 9 0 .1 9 2.6 9 3 . 1R a d io s , t a b le — -------------------------------------------- Dec 52 89.8 8 8.9 8 7 .7 8 7. it 88.2 90.9 9 2.0 9 2 .3 8 9.2 8 8.2 8 6 .7 8 7 .7Toys----------------------------------- ------------------------------- Deo 52 9 5 .3 9 3 .5 9 5 .1 9 5 .1 9 7 .5 9 1 .7 9 5 .6 9 5 .7 96.9 96.9 96.8 95.itS p o r t in g goods----------- ----------------------------------- Dec 52 90.7 89.it 9 0 .5 90 .5 92.8 9 1 . 1 9 2.0 9 1 .6 98.0 98.0 9 6 .5 9 6 .5T e le v is io n r e p a ir s -----------— ------- --------------- Dec 52 1 2 2 . 1 12 2 .it 1 2 3 . 1 1 2 5 .2 12 6 .3 12 8 .5 12 9 .2 1 3 3 . 3 13 3 .6 13 6 .8 13 6 .9 1 3 7 .8
Other goods and s e r v ic e s — — — --------------- 1 2 1 .2 1 2 1 . 8 1 2 2 .7 1 2 3 .3 12it.2 12U .6 12 6 .7 12 6 .8 1 2 7 .2 1 2 7 .2 1 2 7 . 1 1 2 7 .3T ob a cco p ro d u cts ---------------— — -------------------- 1 2 3 .2 1 2 lt .l 1 2 it .6 12 it.5 12 it.7 1 2 5 .3 13 0 .5 13 0 .8 1 3 1 . 1 1 3 1 . 2 1 3 1 . l t 1 3 1 . 7
1 1 0 .0 109*9 10 9 .9 10 9 .0 10 9 .3 10 9 .5 10 9 .7 10 9 .7 IO9.7 10 9 .7 IO 9.7 10 9 .7C ig a r e t t e s ------- --- ----------------- — --------— — 1 2 5 . 1 1 2 6 . 1 12 6 .6 12 6 .7 12 6 .8 1 2 7 .5 1 3 3 . 1 13 3 .lt 1 3 3 .8 1 3 3 .9 13 U .1 13 it .5
A l c o h o l ic b ev era g es— — — — --------------- Dec 52 10 3 .2 10 3 .7 10it.6 10 5 .6 10 7 .0 10 6 .8 1 0 7 . 1 10 7 .0 10 7 .0 10 6 .8 10 6 .5 10 6 .8Beer--------- ---------- ----------------------------------------- Dec 52 10U.2 10 5 .0 106.lt 10 7.it 10 7 .8 10 7 .5 10 7 .6 10 7 .6 10 7 .5 10 7.it 10 7 .2 1 0 7 . 1Whisky----------------------------------------------------------- Dec 52 10 1 .8 1 0 1 .9 10 2 .0 10 2 .9 10 5 .8 10 6 .0 106.it 10 6 .3 10 6 .3 10 5 .9 10 5 .7 10 5 .8
2 / A ls o in c lu d e s r a d io s sad t e l e v i s i o n s o t s , shown s e p a r a te ly under r e a d in g and r e c r e a t io n . U Hot a v a i la b le .
6 7
Digitized for FRASER http://fraser.stlouisfed.org/ Federal Reserve Bank of St. Louis

Table C-1. Consumer Price Index— 20 large citiest Indexes of all items and selected groupsof goods and services, annual averages, 1915-46
(194.7- 1.9=100)
YearAllitems Food Rent Apparel
House- fumish-
inss__Tear
Allitems Food Rent Apparel
. House- furnish- __ings__
Atlantai. Georgia re- MftT"
1918— 71.3 75.9 89.8 67.3 56.2 1925— 69.7 59.7 1 1 2 . 0 6 4 .3 63.81919— 82.9 84.7 99.9 84*3 66.7 1926— 70.6 62.3 1 1 1 . 4 63.4 61.21920— 94.0 94.5 123.9 99.2 79.1 1927— 68.9 59.2 1 1 0 .3 62.4 59.21921— 81 66.8 147.7 74.4 66.9 1928— 68.4 58.0 106.4 61.5 58.11922— 75.1 64.1 140.0 59.6 57.5 1929— 68.4 58.4 107.1 61.2 57.31923— 75.4 64.7 135.4 61 *6 60.7 1930— 67.4 56.1 105.6 59.9 55.41924— 74.4 63.9 133.1 61.5 59.9 1931— 62.1 4 6 .8 103.4 54.9 49.61925— 76.8 72.3 128.6 60.7 59.2 1932— 56.3 39.0 96.6 48.5 44.61926— 77.6 76.3 120.9 60.3 58.0 1933— 53.8 38.3 84.5 47.1 43.61927— 75.3 72.1 117.8 59.1 57.0 1934— 56.1 42.9 79.5 51.7 47.51928— 74.4 70.2 115.9 58.3 57.0 1935— 57.4 46.9 78.6 51.5 48.31929— 73.9 70.2 114.6 58.2 56.7 1936— 58.0 47.5 80.1 51.7 49.91930— 70.9 66.4 110.9 56.2 54.9 1937— 59.3 49.1 82.5 53.4 52.81931— 63.7 52.8 105.5 52.0 49.9 1938— 58.3 46.2 84.3 53.2 53.41932— 57.0 42.6 93.1 45.7 43.5 1939— 57.9 45.5 84.7 52.9 52.0
1933— 54.2 41.9 78.4 44.9 43.4 1940- 58.1 45.4 85.5 53.3 52.21934— 56.7 47.1 73.8 49.6 50.0 1941— 61.8 50.3 89.5 55.7 56.51935— 58.1 50.6 74.5 49.5 51.3 1942— 68.9 60.1 91.1 65.4 65.11936— 58.8 50.6 76.6 50.3 51.8 1943— 73.3 68.3 88.9 68.2 66.51937— 60.7 52.3 80.3 53.3 54.3 1944- 74.4 66.7 89.3 75.3 72*91938— 58.9 47.3 82.6 52.8 52.0 1945— 76.8 69.3 90.1 79.4 76.61939— 58.3 46.7 82.5 51.4 51.6 1946”~ 82.7 78.1 _9Q.6. 86.0 83.21940— 58.4 46.6 82.7 52.7 51.31941— 61.7 51.4 83.3 56.2 55.4 Boston* MaBsachusi*tts _1942— 68.3 60.8 84.7 64.1 62.2
1915— 45.1 43.9 76.4 35.0 30.21943— 73.1 68.7 85.1 66.2 63.0 1916— 48.7 48.5 76.5 38.9 34.21944— 74.3 67.6 85.6 69.5 67.7 1917— 57.6 62.0 76.5 46.0 41.51945— 76.9 69.3 86.0 73.0 74.9 1918— 67.8 71.4 77.6 62.7 58.21946— 82.7 78.7 86.8 80.7 83.4 1919— 77.7 78.6 81.6 84.4 76.2
Baltimon a Maryland 1920— 89.1 90.3 90.4 102.1 93.81921— J 79.1 70.6 99.7 81.5 76.8
1915— 38.3 34.8 65.0 37.0 29.5 1922— 73.4 65.3 103.0 6 6 .4 65.81916— 41.7 38.9 65.3 41.7 33.4 1923— 75.2 67.9 106.1 65.3 71.2191*7— 51.2 52.3 66.4 50.9 41.5 1924— 75.2 66.6 115.1 64.5 69.51918— 61.8 63.3 70.8 66.6 55.51919— 70.1 68.2 77.3 87.2 69.1 1925— 77.3 71.4 117.1 63.8 68.6
1926— 78.6 73.9 117.3 63.0 67.31920— 78.7 75.3 91.5 102.0 81.2 1927— 77.1 71.3 117.1 61.8 65.41921— 70.0 57.0 104.9 79.3 69.7 1928— 76.5 70.6 116.3 61.0 64.21922— 66.3 53.0 107.7 65.9 61.6 1929— 76.6 71.2 115.1 60.6 63.11923— 67.8 55.6 110.3 66.4 64.91924— 67.9 55.1 112.0 65.2 65.4 1930— 74.8 68.3 112.3 59.8 61.5
1931— 68.3 56.5 108.2 56.0 57.11932— 61.4 46.4 102.3 50.3 49.91933— 58.9 44.8 93.1 49.0 4 8 .61934— 60.9 49.3 88.1 53.7 53.4
68
Digitized for FRASER http://fraser.stlouisfed.org/ Federal Reserve Bank of St. Louis

Ta b le C -1. Consumer Price Index— 20 la rg e c it ie s : Indexes o f a l l items and selected groupso f goods and se rvic e s, annual averages, 1915-46— Continued
(1947-49=100)
YearA l l
items Food Rent ApparelHouse-
fu r n is h - in ss
YearA l l
items Food Rent ApparelHouse-
fu rn is h -in ss
_ Bosjion. Mac!8&ChUS€ Continued____ Cl Is— C ontii
1935— 61.9 52.4 86.6 53.8 53.5 m o — 59.1 46.8 81.8 51.7 57.31936— 62.0 52.5 86.5 54.3 53.5 m i - 62.1 51.4 83.3 53.9 60.41937— 63.7 54.4 86.6 56.2 57.8 1942— 68.3 59.5 86.0 62.3 67.11938— 61.9 50.8 87.0 55.9 57.1 1943— 72.1 65.8 86.3 64.9 67.91939— 61.0 49.5 86.9 54.8 55.5 1944— 73.3 65.3 86.5 68.9 76.0
1940— 61.7 49.9 87.2 55.5 54.5 1945— 74.8 66.7 86.7 72.7 78.01941— 64.3 53.6 88.0 57.8 58.2 1946— LSl^A. j 77.5 87 -A 80.2 84.11942— 71.1 63.0 91.0 66*6 65.41943— 75.0 69.1 91.2 69.1 66.8 . _ .C iilcinnatil . Chio1944— 75.8 68.0 91.2 75.0 72.7
1918— 62.2 65.2 78.0 73.1 55.81945— 77.3 69.4 91.4 78.7 79.5 1919— 72.0 73.3 81.2 96.2 66.41946— 83-7 79-5 91.9 86-0 8Z..5 1920— 82.6 83.9 91.0 115.7 82.2
1921— 70.7 63.5 99.4 86.2 67.1Chi<» S O . II -lin o is 1922— 66.4 58.2 102.9 65.7 57.2
1915— 43.1 37.5 69.0 43.0 35.0 1923— 67.9 59.0 109.9 67.1 60.61916— 46.6 41.8 69.2 48.1 38.4 1924— 68.5 58.4 116.3 65.1 60.91917— 55.1 54.3 69.7 57.2 45.6 1925— 71.9 65.1 117.9 62.1 60.11918— 63.9 60.9 70.4 81.9 61.2 1926— 73.1 68.4 120.5 60.9 57.91919— 73.9 67.8 74.9 112.6 80.4 1927— 71.8 65.2 122.4 60.1 57.0
1920— 85.0 77.6 92.9 122.0 103.1 1928— 71.3 64.7 122.6 59.1 56.61921— 76.9 58.9 120.6 86.6 87.2 1929— 72.0 66.7 122.3 58.1 55.71922— 72.9 55.2 128.7 68.7 72.4 1930— 71.3 65.5 120.5 57.2 54.41923— 74.6 58.0 132.2 71.5 78.1 1931— 64.4 53.2 115.7 51.2 49.01924— 75.9 58.6 139.1 71.1 76.3 1932— 56.8 41.3 104.1 46.5 43.4
1925— 77.9 63.2 141.6 68.5 74.1 1933— 54.6 41.0 90.1 45.2 43.81926— 78.3 65.7 137.7 67.3 72.0 1934— 56.8 45.3 84.9 48.2 48.41927— 76.7 63.7 133.4 65.2 69.7 1935— 58.6 50.4. 83.5 49.9 50.11928— 75.6 63.4 128.7 63.2 67.1 1936— 59.3 50.9 84.2 50.7 51.51929— 75.5 64.4 124.2 62.3 66.8 1937— 61.2 51.9 87.0 55.0 57.2
1930— 73.6 61.9 120.3 59.8 64.5 1938— 59.6 47.3 89.0 55.1 56.61931— 66.8 51.4 112.8 53.1 56.8 1939— 58.4. 45.4 88.5 54.2 55.51932— 58.5 42.3 95.5 46.1 47.6 1940— 58.8 46.4 88.3 54.9 54.51933— 53.8 39.9 76.0 45.2 47.2 1941— 62.2 51.6 89.1 57.2 59.91934— 54.7 43.3 69.1 49.4 51.5 1942— 69.2 61.0 90.8 67.2 67.9
1935— 57.1 48.4 68.7 50.6 52.7 1943— 73.1 66.9 91.3 70.7 69.81936— 57.8 49.1 70.5 51.2 53.9 1944— 74.6 66.6 91.5 73.4 76.31937— 60.5 51.3 75.0 53.5 58.6 1945— 76.3 67.7 91.8 78.1 78.01938— 59.6 47.3 80.6 52.4 58.1 1946— 82.4 76.7 92.5 83.7 84.81939— 58.6 45.9 81.7 51.3 57.7
69
Digitized for FRASER http://fraser.stlouisfed.org/ Federal Reserve Bank of St. Louis
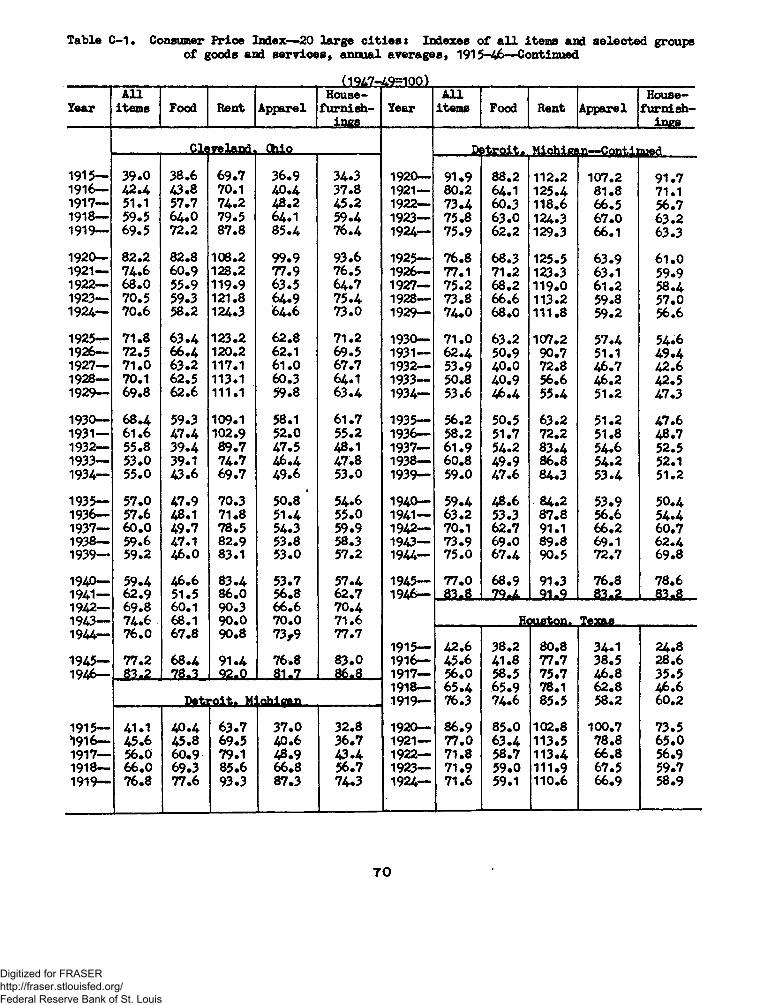
Table C-1 • Consumer P rice Index— 20 la rge c it ie s : Indexes o f a l l items and selected groupso f goods and s e rvic e s, annual averages, 1915-46— Continued
(1947-49=100)
YearA l l
item s Food Rent ApparelHouse-
fu rn is h ings
YearA l l
items Food Rent ApparelHouse-
fu r n is h - ingg
__________ Sis yeland. Ohio___________ Dcjt r o it . Miehiffs C ontiiaied
1915— 39.0 38.6 69.7 36.9 34.3 1920— 91.9 88.2 112.2 107.2 91.71916— 42.4 43.8 70.1 40.4 37.8 1921— 80.2 64.1 125.4 81.8 71.11917— 51.1 57.7 74.2 48.2 45.2 1922— 73.4 60.3 118.6 66.5 56.71918— 59.5 64.0 79.5 64.1 59.4 1923— 75.8 63.0 124.3 67.0 63.21919— 69.5 72.2 87.8 85.4 76.4 1924— 75.9 62.2 129.3 66.1 63.31920— 82.2 82.8 108.2 99.9 93.6 1925— 76.8 68.3 125.5 63.9 61.01921— 74.6 60.9 128.2 77.9 76.5 1926— 77.1 71.2 123.3 63.1 59.91922— 68.0 55.9 119.9 63.5 64.7 1927— 75.2 68.2 119.0 61.2 58.41923— 70.5 59.3 121.8 ,64.9 75.4 1928— 73.8 66.6 113.2 59.8 57.01924— 70.6 58.2 124.3 64*6 73.0 1929— 74.0 68.0 111.8 59.2 56.6
1925— 71.8 63.4 123.2 62.8 71.2 1930— 71.0 63.2 107.2 57.4 54.61926— 72.5 66.4 120.2 62.1 69.5 1931— 62.4 50.9 90.7 51.1 49.41927— 71.0 63.2 117.1 61.0 67.7 1932— 53.9 40.0 72.8 46.7 42.61928— 70.1 62.5 113.1 60.3 64.1 1933— 50.8 40.9 56.6 46.2 42.51929— 69.8 62.6 111.1 59.8 63.4 1934— 53.6 46.4 55.4 51.2 47.3
1930— 68.4 59.3 109.1 58.1 61.7 1935— 56.2 50.5 63.2 51.2 47.61931— 61.6 47.4 102.9 52.0 55.2 1936— 58.2 51.7 72.2 51.8 48.71932— 55.8 39.4 89.7 47.5 48.1 1937— 61.9 54.2 83.4 54.6 52.51933— 53.0 39.1 74.7 46.4 47.8 1938— 60.8 49.9 86.8 54.2 52.11934— 55.0 43.6 69.7 49.6 53.0 1 9 3 9 - 59.0 47.6 84.3 53.4 51.2
1935— 57.0 47.9 70.3 50.8 ’ 54.6 m o— 59.4 48.6 ' 84.2 53.9 50.41936— 57.6 48.1 71.8 51.4 55.0 m i - 63.2 53.3 87.8 56.6 54.41937— 60.0 49.7 78.5 54.3 59.9 1942— 70.1 62.7 91.1 66.2 60.71938— 59.6 47.1 82.9 53.8 58.3 1943— 73.9 69.0 89.8 69.1 62.41939— 59.2 46.0 83.1 53.0 57.2 1944— 75.0 67.4 90.5 72.7 69.8
1940— 59.4 46.6 83.4 53.7 57.4 1945— 77.0 68.9 91.3 76.8 78.6m i - 62.9 51.5 86.0 56.8 62.7 1946— _ 83.8_ 79.4 91.9__ 83.2 83.81942— 69.8 60.1 90.3 66.6 70.41943— 74.6 68.1 90.0 70.0 71.6 He Texas1944— 76.0 67.8 90.8 13,9 77.7
1915— 42.6 38.2 80.8 34.1 24.81945— 77.2 68.4 91.4 76.8 83.0 1916— 45.6 41.8 77.7 38.5 28.61946— 83.2 . 78.3 92.0 . 81.7 86.8__ 1917— 56.0 58.5 75.7 46.8 35.5
1918— 65.4 65.9 78.1 62.8 46.6D e tro it. Mi 1919— 76.3 74.6 85.5 58.2 60.2
1915— 41.1 40.4 63.7 37.0 32.8 1920— 86.9 85.0 102.8 100.7 73.5191 fe 45.6 45.8 69.5 40.6 36.7 1921— 77.0 63.4 113.5 78.8 65.0r n ? — 56.0 60.9 79.1 48.9 43.4 1922— 71.8 58.7 113.4 66.8 56.91918— 66.0 69.3 85.6 66.8 56.7 1923— 71.9 59.0 111.9 67.5 59.71919— 76.8 77.6 93.3 87.3 74.3 1924— 71.6 59.1 110.6 66.9 58.9
7 0
Digitized for FRASER http://fraser.stlouisfed.org/ Federal Reserve Bank of St. Louis

Table C -1. Consumer P rice Index— 20 large c itie s s Indexes o f a l l item s and selected groups o f goods and se rvic e s, annual averages, 1915-46— Continued
(194.7-49=100)
YearA l l
item s Food Rent ApparelHouse-
fu r n is h - ings
YearA l l
items Food Rent ApparelHouse-
fu rn is h ings
Houston. TexsLS—»Contirrued Kansas C it v. Miss(c u ri— Continued
1925— 73.1 64.9 109.6 65.4 58.5 1933— 57.9 43.5 82.6 49.5 50.21926— 72.4 64.3 108.7 64.1 57.6 1934— 59.6 48.6 77.5 53.3 53.51927— 71.1 61.5 108.1 62.8 56.8 1935— 61.1 53.0 76.9 53.3 53.81928— 70.4 60.3 106.8 62.5 55.9 1936— 61.6 52.9 77.9 53.6 54.41929— 70.7 61.7 104.7 62.1 55.3 1937— 63.7 55.2 79.9 56.4 57.9
1930— 69.0 58.9 102.6 59.8 53.8 1938— 62.5 51.0 81.8 56.8 57.71931— 62.7 46.7 97.0 54.0 49.9 1939— 61.7 49.3 81.7 55.9 56.41932— 55.8 38.1 81.2 47.3 44.7 1940— 61.1 48.0 81.8 56.8 55.01933— 53.2 38.2 68.7 43.3 1941— 63.9 52.9 83.2 58.6 58.71934— 55.8 43.4 67.7 8 47.0 1942— 70.9 62.4 86.3 67.3 65.5
1935— 57.4 47.2 70.9 48*3 47.4 1943— 75.3 69.5 87.2 70.1 67.01936— 58.0 74.5 48#6 49.0 1944— 76.7 68.3 87.9 75.1 70.61937— 60.3 49.3 78.7 51.1 55.0 1945— 78.7 69.5 88.1 80.6 76.01938— 60.0 46.8 81.9 51.0 55.8 1946— 8^*2 78.3 88*7 84.1 85.4.1939— 59.5 46.4 82.8 50.4 55.4
1940— 59.8 47.1 83.0 51.4 55.1m i - 62.4 51.6 83.5 53.7 58.2 1915— 43.2 41.6 78.6 35.8 29.61942— 68.9 60.5 84.8 62.9 64.1 1916— 45.3 44.6 77.7 38.4 33.01943— 72.5 65.9 85.5 65.4 64.5 1917— 52.4 54.7 78.6 46.2 40.41944— 73.2 64.6 86.0 68.1 66.6 1918— 62.5 64.9 81.5 63.4 54.3
1919— 73.4 73.2 90.2 82.3 69.41945— 74.8 65.8 86.3 70.0 75.51946— 80.7 75.1 87.8 76.3 82.7 1920— 86.1 84.7 117.8 97.3 84.8
1921— 80.8 65.5 146.8 77.6 74.2Kanesfs C itv . M issouri 1922— 78.5 62.6 155.4 64.1 66.5
1923— 79.3 64.3 158.1 64.4 71.61918— 70.1 71.1 90.9 75.8 71.5 1924— 79.7 65.0 158.7 64.1 68.61919— 80.6 78.0 99.0 97.6 87.81920— 94.5 89.8 122.6 120.1 103.6 1925— 79.9 63.8 145.8 63.1 67.01921— 83.5 66.6 146.6 89.8 88.2 1926— 77.7 68.1 133.3 62.1 65.01922— 76.2 60.7 142.7 72.3 69.4 1927— 76.3 66.3 127.3 61.2 63.1
1928— 75.1 65.2 122.5 60.4 60.51923— 76.1 62.3 138.5 71.3 74.3 1929— 74.9 66.2 116.2 59.8 59.11924— 75.3 62.4 133.0 70.3 72.3'1925— 76.6 68.8 124.9 68.9 70.5 1930— 72.4 62.2 111.5 58.6 57.41926— 76.5 70.8 120.2 67.2 68.8 1931— 65.2 49.6 104.3 52.8 51.21927— 74.0 66.6 114.6 65.3 66.5 1932— 58.9 42.1 91.5 46.5 44.8
1933— 55.6 42.6 75.9 45.8 43.91928— 72.9 66.0 110.7 64.0 65.2 1934— 56.0 45.2 69.3 51.2 48.81929— 73.1 67.9 107.2 63.6 64.11930— 71.9 65.1 105.7 63.0 62.1 1935— 57.7 48.8 68.6 51.9 51.31931— 67.4 53.5 103.9 60.0 57.1 1936— 58.4 48.6 71.9 51.9 52.81932— 60.7 44.0 95.7 51.6 50.4 1937— 61.7 51.6 80.1 54.5 56.7
1938— 60.9 47.5 83.6 55.2 56.61939— 60.4 46.8 83.6 54.9 55.2
71
Digitized for FRASER http://fraser.stlouisfed.org/ Federal Reserve Bank of St. Louis
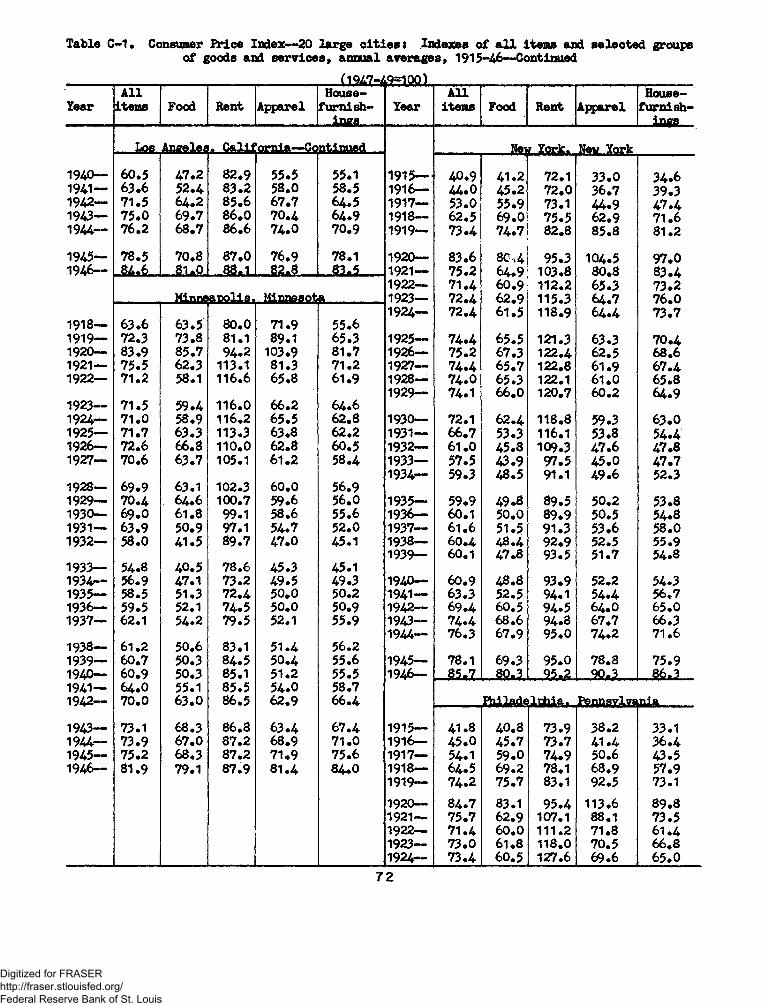
Table C -1. Consumer Price Index— 20 la rge c itie s } Indexes o f a l l items and selected groups o f goods and s e rvic e s , annual averages, 1915-46— Continued
(1947- 49=100)Year
A l litems Food Rent Apparel
House- fu rn is h
inesYear
A l litem s Food Rent Apparel
House*fu rn is h
ings
1*08 Aneeleei - C a U fn yn le — Cnntinued . _ Nei<r York. Rev York
1940— 60.5 47.2 82.9 55.5 55.1 1915— ; 40.9 41.2 72.1 33.0 34.61941— 63.6 52.4 83.2 58.0 58.5 1916— 44.0 45.2 72.0 36.7 39.31942— 71.5 64.2 85.6 67.7 64.5 1917— 53.0 55.9 73.1 44.9 47.41943— 75.0 69.7 86.0 70.4 64.9 1918— 62.5 69.0 75.5 62.9 71.61944— 76.2 68.7 86.6 74.0 70.9 1919— 73.4 74.7 82.8 85.8 81.2
1945— 78.5 70.8 87.0 76.9 78.1 1920— 83.6 8C,4 95.3 104.5 97.01946— l_84.6 _ 81^0 88.1 82.8 . 83.5 1921— 75.2 64.9 103.8 80.8 83.4
1922— 71.4 60.9 112.2 65.3 73.2Minnfi Minnesota 1923— 72.4 62.9 115.3 64.7 76.0
1924— 72.4 61.5 118.9 64.4 73.71918— 63.6 63.5 80.0 71.9 55.61919— 72.3 73.8 81.1 89.1 65.3 1925— 74.4 65.5 121.3 63.3 70.41920— 83.9 85.7 94.2 103.9 81.7 1926— 75.2 67.3 122.4 62.5 68.61921— 75.5 62.3 113.1 81.3 71.2 1927— 74.4 65.7 122.8 61.9 67.41922— 71.2 58.1 116.6 65.8 61.9 1928— 74.0 65.3 122.1 61.0 65.8
1929— 74.1 66.0 120.7 60.2 64.91923— 71.5 59.4 116.0 66.2 64#61924— 71.0 58.9 116.2 65.5 62.8 1930— 72.1 62.4 118.8 59.3 63.01925— 71.7 63.3 113.3 63.8 62.2 1931— 66.7 53.3 116.1 53.8 54.41926— 72.6 66.8 110.0 62.8 60.5 1932— 61.0 45.8 109.3 47.6 47.81927— 70.6 63.7 105.1 61.2 58.4 1933— 57.5 43.9 97.5 45.0 47.7
1934— 59.3 48.5 91.1 49.6 52.31928— 69.9 63.1 102.3 60.0 56.91929— 70.4 64.6 100.7 59.6 56.0 1935— 59.9 49.8 89.5 50.2 53.81930— 69.0 61.8 99.1 58.6 55.6 1936— 60.1 50.0 89.9 50.5 54.81931— 63.9 50.9 97.1 54.7 52.0 1937— 61.6 51.5 91.3 53.6 58.01932— 58.0 41.5 89.7 47.0 45.1 1938— 60.4 48.4 92.9 52.5 55.9
1939— 60.1 47.8 93.5 51.7 54.81933— 54.8 40.5 78.6 45.3 45.11934— 56.9 47.1 73.2 49.5 49.3 1940— 60.9 48.8 93.9 52.2 54.31935— 58.5 51.3 72.4 50.0 50.2 m i - 63.3 52.5 94.1 54.4 56.71936— 59.5 52.1 74.5 50.0 50.9 1942— 69.4 60.5 94.5 64.0 65.01937— 62.1 54.2 79.5 52.1 55.9 1943— 74.4 68.6 94.8 67.7 66.3
1944— 76.3 67.9 95.0 74.2 71.61938— 61.2 50.6 83.1 51.4 56.21939— 60.7 50.3 84.5 50.4 55.6 1945— 78.1 69.3 95.0 78.8 75.91940— 60.9 50.3 85.1 51.2 55.5 1946— 85.7 80.3 95.2 90.3 86.31941— 64.0 55.1 85.5 54.0 58.71942— 70.0 63.0 86.5 62.9 66.4 P h ila d e lch ia . L n ia
1943— 73.1 68.3 86.8 63.4 67.4 1915— 41.8 40.8 73.9 38.2 33.11944— 73.9 67.0 87.2 68.9 71.0 1916— 45.0 45.7 73.7 41.4 36.41945— 75.2 68.3 87.2 71.9 75.6 1917— 54.1 59.0 74.9 50.6 43.51946— 81.9 79.1 87.9 81 e<4 84«0 1918— 64.5 69.2 78.1 68.9 57.9
1919— 74.2 75.7 83.1 92.5 73.11920— 84.7 83.1 95.4 113.6 89.81921— 75.7 62.9 107.1 88.1 73.51922— 71.4 60.0 111.2 71.8 61.41923— 73.0 61.8 118.0 70.5 66.81 9 2 4 - 73.4 60.5 127.6 69.6 65.0
7 2
Digitized for FRASER http://fraser.stlouisfed.org/ Federal Reserve Bank of St. Louis

Table C-1* Consumer P rice Index— 20 large c itie s t Indexes o f a l l items and selected groups o f goods and se rvic e s, annual averages, 1915-46— Continued
(19A7-A9=100)
YearA l l
item s Food Rent ApparelHouse-
fu rn is h ings
YearA l l
items Food Rent ApparelHouse-
fu rn ish ings
Phi lad P ittsb u rg h . Bennsvl.vania~ Continued
1925— 76.2 66.6 130.4 68.9 63.6 1933— 53.9 39.7 88.6 40.2 43.1I926— 77.6 69.6 131.2 68.2 62.0 1934— 55.9 44.8 81.0 43.3 47.81927— 75.9 66.8 129.4 67.1 60.4 1935— 57.6 48.7 80.1 43.6 49.31928— 74.7 66.3 123.8 66.0 59.2 1936— 58.4 49.3 82.4 44.1 49.41929— 73.9 66.0 118.3 64.7 58.8 1937— 60.6 51.7 86.6 46.5 53.61930— 71.9 62.6 113.8 63.2 57.9 1938— 59.4 47.9 89.2 46.6 53.51931— 66.0 53.4 107.6 58.0 52.1 1939— 58.1 45*4 89.9 46.2 52.71932— 58.8 43.8 98.3 49.9 45.5 1940— 58.9 46.7 90.3 46.6 52.71933— 55.8 42.3 87.3 48.0 42.6 1941— 62.1 51.6 91.2 48.6 56.31934— 59.0 48.9 82.3 51.9 48.0 1942— 68.4 60.0 92.1 57.2 62.9
1935— 59.4 50.7 81.7 51 ©4 49.0 1943— 72.8 67.0 92.0 61.3 64.11936— 60.2 52.0 82.3 52.1 50.0 1944— 74.3 65.9 92.1 70.5 68.81937— 61.6 53.6 84*2 54.4 54.2 1945— 76.1 67.3 92.1 76.1 74.51938— 60.2 49.3 86.0 55.5 54.8 1946— 82.7 78.1 .9 2 .2 82.3 80.51939— 59.2 47.8 86.4 53.4 52.7
Pcrtla n d . Oregon1940— 59.3 47.7 86.8 54.1 53.31941— 62.3 51.9 88.1 56.5 55.9 1915— 43.8 38.3 88.0 42.4 34.71942— 69.3 61.5 89.8 66.2 63.1 1916— 45.0 40.8 79.0 45.9 38.01943— 73.7 68.8 90.2 68.8 64.5 1917— 52.6 51.8 73.9 54.8 47.11944— 74.8 67.9 90.3 74.1 70.2 1918— 64.5 61.7 90.3 72.1 63.0
1919— 75.7 69.8 113.0 91.5 77.41945— 76.6 69.5 90.5 78.3 75.41946“ * 83.2 79.5 90.9J 84.1 1920— 85.7 79.7 124.6 102.1 94.0
1921— 74.2 58.6 133.0 77.6 83.1P itts t 1922— 70.3 55.9 134.2 64.8 69.8
1923— 71.0 56.5 133.7 67.1 71.51918— 64.1 67.4 81.2 60.4 57.8 1924— 70.8 57.3 133.9 67.0 69.71919— 73.5 74.4 88.0 78.1 71.31920— 84.4 82.6 102.1 93.6 88.3 1925— 71.0 60.1 132.1 65.8 68.41921— 75.5 62.6 118.6 72.7 76.2 1926— 70.5 59.7 128.3 65.1 66.71922— 70.4 57.2 121.8 59.1 62.4 1927— 69.6 58.9 121.7 63.7 64.3
1928— 68.4 58.5 113.1 62.8 62.21923— 71.9 60.8 124.3 58.0 64.9 1929— 67.8 59.5 104.2 61.9 61.71924— 72.7 60.3 131.2 57.3 65.41925— 75.1 65.1 136.1 56.1 64.8 1930— 66.3 56.4 98.4 59.9 60.41926— 75.7 67.5 136.6 54.5 63.5 1931— 60.0 45.0 91.8 54»8 56.11927— 74.4 65.2 136.2 53.0 62.1 1932— 54.7 39.4 81.0 48.3 49.2
1933— 51.8 37.4 71.3 47.5 48.31928— 73.8 64.5 134.8 52.6 59.3 1934— 53.6 40.6 67.7 51.6 52.51929— 73.8 65.8 131.5 52.0 58.31930— 71.4 61.5 128.7 50.6 56.5 1935— 55.5 44.9 68.8 51.6 53.71931— 64.7 50.0 122.4 45.8 50.4 1936— 56.6 46.4 73.2 52.0 53.21932— 57.5 40.8 107.2 41.8 43.7 1937— 59.5 49.1 80.1 54.1 56.5
1938— 58.9 46.3 83.2 54.0 56.31939— 58.3 45.7 82.8 53.6 55.6
7 3
Digitized for FRASER http://fraser.stlouisfed.org/ Federal Reserve Bank of St. Louis
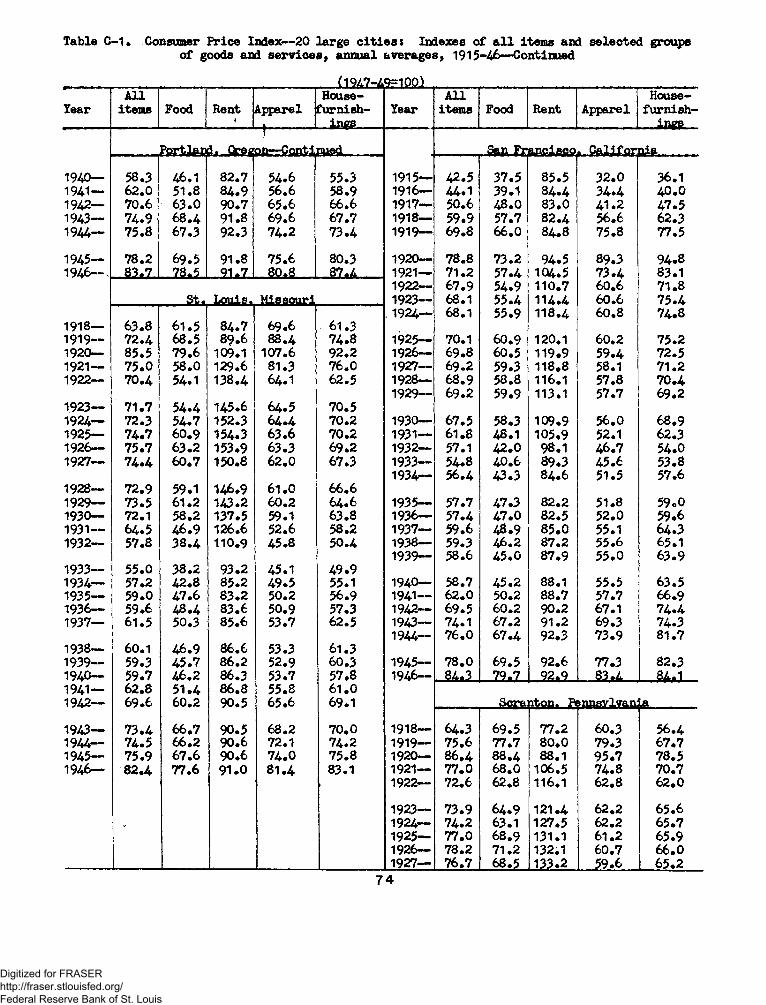
Table C-1. Consumer Price Index— 20 large cities» Indexes of all items and selected groups of goods and services, annual averages, 1915-46— Continued
(1947-4.9=100)Year
Allitems Food Rent» Apparel
House- fur nish-ins©
YearAllitems Food Rent Apparel
House- fur nish-
inesPort Iani. Orecon— Continued San Ft ancisco. California
1940— 58.3 46.1 82.7 54«6 5 5 .3 1915— 42.5 37.5 85.5 3 2 .0 36.11941— 62.0 51.8 84.9 5 6 .6 58.9 1916— 44.1 39.1 84.4 3 4 .4 40.01942— 70.6 63.0 90.7 65.6 66*6 1917— 50.6 48.0 83.0 4 1 . 2 47.51943— 74.9 6 8 .4 91.8 69.6 67.7 1918— 59.9 57.7 82.4 56.6 62.31944— 75.8 67.3 92.3 74.2 73.4 1919— 69.8 66.0 8 4 .8 75.8 77.51945— 78.2 69.5 91.8 75.6 80.3 1920— 78.8 73.2 94.5 89.3 94.81946“ 83.7 78.5 91.7 80.8. _ _ 87.A 1921— 71.2 57.4 104.5 73.4 83.1
1922— 67.9 54.9 110.7 60.6 71.8St. Louis. Missouri 1923— 68.1 55.4 114.4 60.6 75.4
. 1924— 68.1 55.9 118.4 60.8 74.81918— 63.8 61.5 84.7 69*6 61.31919— 72.4 68.5 89.6 88*4 74.8 1925— 70.1 60.9 120.1 60.2 75.21920— 85.5 79.6 109.1 107.6 92.2 1926— 69.8 60.5 119.9 59.4 72.51921— 75.0 58.0 129.6 81.3 76.0 1927— 69.2 59.3 118.8 58.1 71.21922— 70.4 54.1 138.4 64.1 62.5 1928— 68.9 58.8 116.1 57.8 70.4
1929— 69.2 59.9 113.1 57.7 69.21923— 71.7 54.4 145.6 64.5 70.51924— 72.3 54.7 152.3 64.4 70.2 1930— 67.5 58.3 109.9 56.0 68.91925— 74.7 60.9 154.3 63.6 70.2 1931— 61.8 48.1 105.9 52.1 62.31926— 75.7 63.2 153.9 63.3 69.2 1932— 57.1 42.0 98.1 46.7 54.01927— 74.4 60.7 150.8 62.0 67.3 1933— 54*8 40.6 89.3 45.6 53.8
1934— 56.4 43.3 8 4 .6 51.5 57.61928— 72.9 59.1 146.9 6 1 .0 66.61929— 73.5 61.2 143.2 60.2 64.6 1935— 57.7 47.3 82.2 51.8 59.01930— 72.1 58.2 137.5 59.1 63.8 1936— 57.4 47.0 82.5 52.0 59.61931— 64.5 46.9 126.6 52.6 58.2 1937— 59.6 48.9 85.0 55.1 64.31932— 57.8 38.4 110.9 45.8 50.4 1938— 59.3 46.2 87.2 55.6 65.1
1939— 58.6 45.0 87.9 55.0 63.91933— 55.0 38.2 93.2 45.1 49.91934— 57.2 42.8 85.2 49.5 55.1 1940— 58.7 45.2 88.1 55.5 63.51935— 59.0 47.6 83.2 50.2 56.9 1941— 62.0 50.2 88.7 57.7 66.91936— 59.6 48.4 83.6 50.9 57.3 1942— 69.5 60.2 90.2 67.1 74.41937— 61.5 50.3 85.6 53.7 62.5 1943— 74.1 67.2 91.2 69.3 74.3
1944— 76.0 67.4 92.3 73.9 81.71938— 60.1 46.9 86.6 53.3 61.31939— 59.3 45.7 86.2 52.9 60.3 1945— 78.0 69.5 92.6 77.3 82.31940— 59.7 46.2 86.3 53.7 57.8 1946— 84.3J_ 79.7 92.9_- 83.41941— 62.8 51.4 86.8 55.8 61.01942— 69.6 60.2 90.5 65.6 69.1 SeraEiton. Pe»nnsylvan:La ...
1943— 73.4 66.7 90.5 68.2 70.0 1918— 64.3 69.5 7 7 .2 60.3 56.41944— 74.5 66.2 90.6 72.1 74.2 1919— 75.6 77.7 80.0 79.3 67.71945— 75.9 67.6 90.6 74.0 75.8 1920— 86.4 88.4 88.1 95.7 78.51946— 82.4 77.6 91.0 8 1 .4 83.1 1921— 77.0 68.0 106.5 74.8 70.7
1922— 72.6 62.8 116.1 62.8 62.0
1923— 73.9 64.9 121.4 62.2 65.61924— 74.2 63.1 127.5 62.2 65.71925— 77.0 68.9 131.1 61.2 65.91926— 78.2 71.2 132.1 60.7 66.01927— 76.7 68.5 133.2 59.6 65.2
7 4
Digitized for FRASER http://fraser.stlouisfed.org/ Federal Reserve Bank of St. Louis

Table C-1 • Consumer Price Index-— 20 large cities* Indexes of all items and selected groups of goods and services, annual averages, 1 9 1 — Continued
(1947-49=1 0 0)Year
AllItems Food Rent Apparel
House - furnish
ingsYear
Allitems Food Rent Apparel
House- fur nish- __ ings__
Seattle. 11928— 76.5 68.7 1 3 2 .4 59 .0 6 4 .1 1937— 60.1 50 .6 76.2 5 5 .3 5 5 .31929— 76.4 69.6 12 9 .0 58.4 62.5 1938— 59.4 4 7 .0 80.2 5 5 .2 5 4 .71930—— 73.6 65.3 1 2 3 .8 57.3 61.5 1939- 59.2 4 6 .6 80.3 5 4 .9 5 3 .31931— 66.5 53.2 118.6 52.0 57.0 1940— 59.5 4 7 .7 80.2 5 5 .6 5 2 .51932— 59.6 43.9 111.2 45.6 51.0 1941- 63.1 5 2 .9 83.8 58.2 5 5 .6
1933— 57.3 43.2 101 .0 44.9 49.8 1942— 71.0 63.7 87.2 68.0 63.21934— 59.4 47.4 9 5 .4 49.6 54.5 1943- 75.0 69.1 86.3 70.5 64.71935— 60.4 49.6 9 3 .9 49.2 55.1 1944- 76.1 67.9 8 8 .4 74.1 69.11936— 60.8 50.7 9 3 .5 49.5 55.3 1945- 77.9 69.3 88.7 78.0 76.61937— 6 1 .7 52.2 9 3 .3 51.6 59.8 1946— 83.9 78.8 .89*3 _ 83.6 _ 83.7 __1938— 59.5 48.1 9 2 .5 51.8 56.9 Washimrtnn D. 0.1939— 58.5 46.9 9 1 .4 51.5 55.31940— 59.3 48.2 91.2 51.6 55.8 19 15— 4 3 .9 40.0 78.5 33.0 27.51941— 62.2 51.9 91.4 54.8 6 1 . 2 1916— 4 7 .1 43.7 76.9 36.9 31.71942— 68.7 60.9 91.2 69.3 1917— 5 7 .2 58.9 76.2 46.3 40.7
1918— 67.4 70.7 77.2 60.9 53.71943— 73.0 68.8 90.5 65.9 70.0 1919— 73.8 77.1 79.5 73.2 62.71944— 74.1 67.4 90.3 71.2 77.21945— 76.2 69.0 91.0 75.2 80.6 1920— 82.8 85.5 91.8 87.4 76.61946— 83.2 ._79.2 94.8 81.8 87.6 . 1921— 73.1 66.2 101.6 67.6 65.7
1922— 69.0 61.4 104.1 57.5 56.1Seattle* Washington 1923— 70.2 63.0 105.6 57.8 60.2
1924— 69.9 61.9 107.3 57.6 60.01915— 40.6 3 9 .6 68.1 35.2 26.51916— 42.2 4 2 .0 66.2 37.3 30.1 1925— 71.6 66.1 109.3 56.5 58.41917— 49.5 5 4 .0 67.0 43.7 35.7 1926— 72.5 69.6 109.6 55.8 56.21913— 61.6 6 4 .8 85.3 57.5 50.8 1927— 70.5 66.0 107.4 54.5 54.41919— 74.4 7 3 .0 107.4 76.5 67.2 1928— 70.0 66.3 104.7 53.8 53.6
1929— 69.7 67.0 103.1 52.9 53.11920— 84.7 81.8 120.4 93.1 79.91921— 75.1 60.1 119.4 76.0 68.8 1930— 68.5 63.7 102.3 51.5 52.71922— 70.3 58.6 113.8 62.2 60.5 1931— 64.3 53.9 101.4 47.8 49.41923— 69.6 59.2 112.2 6 1 .8 61.4 1932— 59.3 44.4 99.5 41.4 43.61924— 69.9 59.6 112.8 6 1 .6 61.4 1933— 57.4 43.8 92.8 39.9 42.7
1934— 59.4 48.1 90.1 44.6 46.31925— 71.4 63.9 113.2 61.1 6 1 . 21926— 71*3 63.4 111.8 61.0 60.6 1935— 60.4 51.1 90.5 44.4 47.11927— 69.9 6 1 .8 109.4 60.0 59.8 1936— 60.7 50.5 91.7 45.9 48.91928— 69.2 60.7 107.1 59.1 59.1 1937— 62.3 52.3 93.0 48.3 52.41929— 69.6 62.2 105.3 58.4 58.8 1938— 60.9 47.9 93.0 48.5 52.9
1939— 60.4 47.3 92.3 48.0 52.21930— 68.2 59.5 103.3 57.3 58.51931— 62.3 48.4 98.6 53.8 54.2 1940— 60.7 48.0 92.3 48.5 53.01932— 56.6 41.9 86.2 47.4 47.1 1941— 63.6 52.5 93.0 51.4 57.81933— 54.0 40.8 74.5 46.5 47.1 1942— 70.5 61.7 93.5 61.4 65.21934— 55.3 44.0 69.3 50.5 50.4 1943— 74.9 68.8 93.9 64.6 66.7
1944— 76.0 67.2 94.5 69.2 68.31935— 56.6 47.5 68.6 51.1 50.71936— 57.3 43*2 70.4 51.8 52.0 1945— 78.3 69.7 94.8 73.5 71.9
1946— - S i d - _ZSbfi. - 21»3 — g 2 a 8 - 7,9eS.75
Digitized for FRASER http://fraser.stlouisfed.org/ Federal Reserve Bank of St. Louis

Table C-2. Consumer Price Index—20 large c it ie s : Indexes of a l l items and major groups of goods and serv ices, by year and month, 191:7-58
(19l:7-lt9-100)
Year All Food Housing Apparel Trans- Medical PersonalReading
andOthergoods Year All Food Housing Apparel Trans Medical Personal
Readingand
Othergoodsand items porta- care care recre- and and items porta care care recre andmonth tion ation services month tion ation services
Atlanta , Georgia Atlanta, Georgia —Continued
1?U7: Average 95.8 98.3 93.7 9a.i 91 . a 97.0 98.6 911.7 96.1 1956: Average 118.1 n o . 2 127.0 m .3 126.6 129.3 125.3 109.7 126.5March— - 95.1 98.8 (V ) 92.1 89.7 96.6 98.6 93.5 96.3 March—— 116.8 107.9 126.2 110.7 i2a.5 128.8 i2a.7 110.0 125.8June------ 9h.O 95.5 97.6 92.8 90.5 96.6 98.8 93.5 96.3 June-—-• 118.0 111.3 126.6 110.7 i2a.3 130.0 125.0 109. a 126.2August*— 95.9 98.a (V ) 9a.8 91.6 97.5 98.3 95.1 96.3 Sente tube: ■ 118.9 111.9 127.0 n 2.a 123.9 129.2 125.5 109.7 126.3November- 99.1 102. a 97.0 98.0 9U.1 97.8 98 . a 96.6 95.5 December- 119.5 111.1 128.5 n i .9 130.7 129.7 127.0 109.8 128.9
191:8: Average 102.2 103.1 101.3 ioa.3 100.5 100. a 101. a 99.7 96.3 1957: Average 121. a 113.3 129.6 n 3 .o 13a.5 132.3 128.1 112.8 130.aFebruary- 100.2 101.7 98.8 102.2 96.2 98.7 101. a 98.2 96.0 March—— 120.6 111.8 129.3 n 2 .8 135.6 132.1 • 127.7 no .8 129.1
101.3 102.9 99.8 103.1 98.5 99.7 100.9 98.2 97.2 121 2 113.7 129.5 112.3 133.8 132.3 126.2 n o i 129.6H i* 1August— 10lt.6 106.7 102.8 106. a 103.5 100.8 101.9 98.2 100.0 Septembe: • 122.2 n 5*a 130.2 n 3 .8 132.3 132.9 128.2 113.8 132.0November- 103.2 101.9 103.9 106.5 103.7 102.3 102.1 ioa.i 100.0 December-• 122. a 113.6 130.0 113.8 139.0 133.2 129.1 n 6 .7 132.1
19 U9: Average 102.0 98.6 105.0 101.6 108.2 102.5 100.0 105.7 105.6 1953: Average i2a.5 H 8.0 130.7 n a .o iao.a 136.5 330.9 U 9.9 132.6February- 101.3 96.3 10U.9 ioa.o 105.7 102.5 100.5 105.7 101.0 March— i2a.9 119.3 130.2 n a .5 139.8 135.9 129.9 122.6 132.5
101.7 97.5 ioa.6 102.8 108.2 102.5 100.2 105.7 101.0 12U.9 139.2 131.0 U 3.7 139. a 136.8 131.7 U 9.a 132.7August— 102.9 100.9 10U.U 100.5 109.5 102.6 99.6 105.7 110.2 Septembe: ■ 12U.6 118 .a 130.7 u a .o 339.9 336.8 131.6 U 9.6 132.7November* 102.0 97.8 . 106.0 98.9 109.5 102.6 99.6 105.7 110.2 December- 115.7 331.5 n 3 .8 iaa.5 138.0 131.0 U 8.7 332.7
1950: Average 103.5 99.7 108.7 100.9 110.5 103.1 101.7 ioa.5 112.1February* 100.7 9U.1 106.8 98.8 109.5 102.6 98.9 105.7 110.2May-........ 101.3 95.9 106.9 98.5 109.6 102.9 99.7 105. a 110.2 dXl wl!Q0f6 | MarylandAugust— 10U.9 10U.0 108.7 100.7 111.2 102.9 99.8 102.3 113 . aNovember* 106.5 103.1 112.3 105.1 111.9 103.9 108.8 ioa.6 n a .6 a?: Average' 95. a 95.8 9a.7 97.5 89.6 97 . a 97.9 9h.6 95.6
January— 91.2 90.0 91.5 96.1 87.2 95.0 97.1 9a.3 93.81951: Average H3.3 113.1 117.5 111.3 118.3 108.1 113.5 105.7 H 6.9 February* 91.1 89.2
%96.7 87.1 95.1 96.9 9a.5 93.3
February* 110.6 110.8 n a .8 108.7 111.8 106.2 111.5 105.1 H 5.a March----- 93.3 93.7 97.6 87.0 95.3 *97.0 9a.59a.5
93.393.3113.6 1 1 1 o 1 1 7 0 i n 0 n o 7 108.7 113.5 106.0 121.1 93. a 0*1 n \ (V ) 97.3 AA n 95.7 97.6*& JLLI md X ll.J x x y • f A p ril*--* i on .U
August— 113.9 llii.5 117.3 112.3 119. a 108.3 u a .8 105. a n a .6 May 93.2 93. a ' CV ) 96.0 88.0 96.2 95.a 9a.5 93.3November- 115.6 n a .8 120.9 113.7 122.2 109.0 n a .3 106. a 116.6 June------ 93.9 95.1 9a.9 88.1 96.7 9a.o 9U.5 93.3
Septembei 98.2 100.1 97.1 98.3 92.2 99.2 99.3 9a.5 99.01952: Average 116.0 113.6 121. a 111.0 126.2 115.5 n 6 .a 109.6 115.8 December. 100.3 102. a 99.0 101.1 92.5 100.1 102.6 95.3 93.5
February* 115.1 112.5 121.2 111.8 i2a.2 111.8 n 6 .a 106.0 117.019a8: Average 102. aMay-------* n a .6 UO.l: 120.8 110.9 m . a 116.6 116.6 m .o 315.6 ioa.o io i.a ioa.3 97.5 100.9 102.8 101.9 100.5
August— 117.0 117.8 120.8 110.2 125.7 116.2 116.6 m . i 115.2 March----- 100.1 99.9 100.1 ioa.i 95.2 100.2 101.8 102.0 98.5November- 117.1 1U .3 122.7 110.9 130.8 117.9 116.3 110.1 115.2 June------ 103.1 106.0 101.0 ioa.3 95.3 101.1 103.1 102.0 93.5
Septembei■ 105.0 107.6 102.7 105.5 100.9 101.3 103.3 102.8 102.61953: Average 117.1 113.2 123. a 110.8 129.6 118.2 n 5 .a 111.1 117.3 : December. 102.0 100.9 103.0 10a. 2 101.3 101.3 103.3 103.5 ioa.5
March— 116.7 112.3 123.3 111.1 130.5 117.9 n 5 .a n o .a 116.819a9: AverageJune----- 117.1 11U.5 122.7 110.3 129.2 118.9 115.2 111.1 117.6 102.2 100.1 ioa.o 98.3 112.9 101.8 99.2 103.5 103.9
Septembei • 117.6 11U.7 m .o 111.1 129.1 117.2 115.0 111.2 117.6 March----- 102.2 100.1 103.2 100.9 n 3 .7 101.6 101.6 103.5 105.1December. 117.1 112.7 123.8 110.5 129.0 119.5 115.9 112.5 118.2 June— — 102.5 101.7 103.5 97.9 n a. 2 101.6 99.8 103.5 103.1
Septembei 102.6 101.8 ioa.a 96.1 n a .i 101.8 97.3 103.5 103.619 5U: Average> 116.8 112.9 m . i 110.8 i25.a 120.9 115.7 109.7 118.2 December. 101.0 97.9 105.6 95.0 113.9 102 . a 95.5 103.5 103.5
March—- 117.0 112.2 i2 a .i 111.2 127.3 120.8 116.6 112.0 118.21950: Average 106.1 95.8June—— 117.6 11U.7 i2 a .i 111.5 i27.a 120.6 U 5.0 110.0 118 *a 102.9 101.3 117.3 103.3 96.6 103.5 105.8
Septembe: * 116.3 113.3 i2 a .i 110.3 120.0 121.1 115.5 108.6 118.1 March- - - - 100.6 97.a io5.a 9a.3 113.9 103.0 9U.U 103.5 103.5December. 115.7 110.0 i2a.o 110.3 125.7 121.6 115.5 106.3 118.0 June- - - - - 101.6 io i.a ioa .9 9a .i 113.2 103.1 9a.3 101.6 103.3
Septembei 105.1 ioa.3 107.1 97.2 122.5 103. a 97.6 103.8 108.71955: Average 116.3 110.2 125.1 109.6 123.6 12a.9 n s . a 108.1 121.2 December. 106.5 106.5 107.7 99.1 122.7 ioa.a 102.2 105.7 109.8
March— June-----
115.3116.0
110.0111.0
123.9i2a .a
108. a109. a
123.6i2 a .i
122.8122.9
n a .7115.2
107.2107.0
118 ‘.0 119.2125.0125.0
19511 Average lio .a 112.1 110.1 ioa.i 125.0 112.2 ioa.o n o .3 108.6Septembe: * 117.2 m . i 125.9 110.5 122.0 127.6 122.5 109.U
109.8March— - 109.7 i n . a 109.7 103.8 123.6 108.0 ioa .2 110.8 107.2
December. 117.1 108.3 127.1 110.2 12a. a 128.6 w a . o June------ n o .a m . a 110.0 ioa.6 123.7 112.9 103.7 n o .a 107.5Septembei 110.8 U 2.1 110.5 105.1 126.7 113.0 103.3 n o .2 107.5December. i i 2.a n a . i 111.3 ioa .7 127.9 120 . a 106.1 112.2 n 3 .2
1/ Not available.
Digitized for FRASER http://fraser.stlouisfed.org/ Federal Reserve Bank of St. Louis
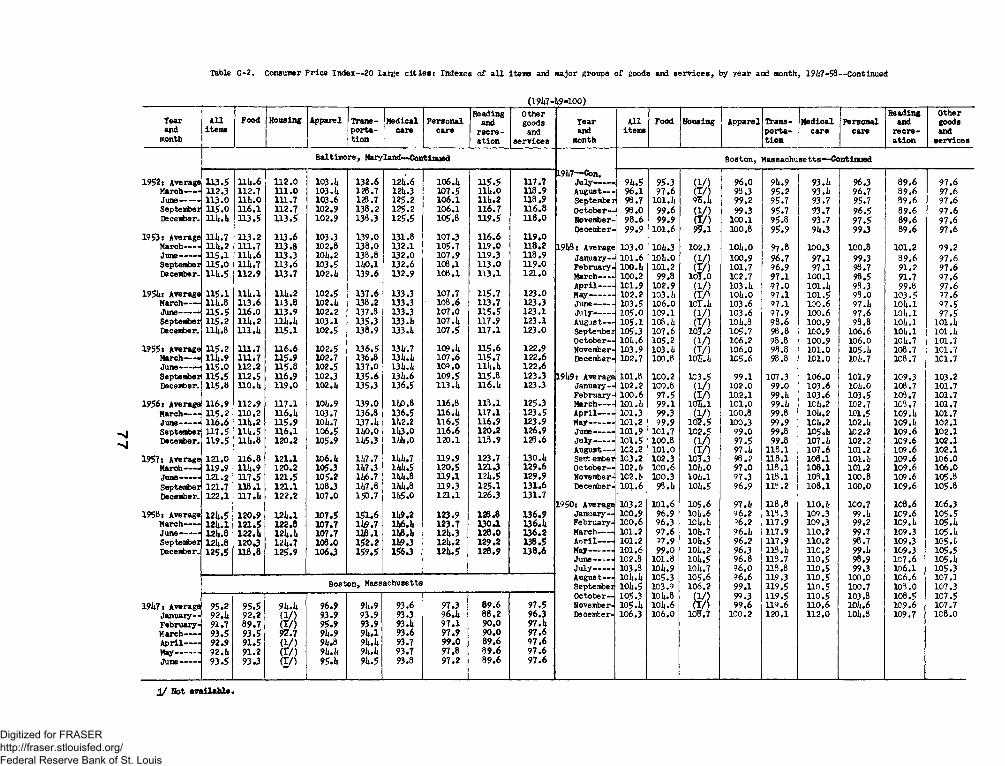
Table C-2. Consumer Price Index—20 large c i t ie s : Indexes of a l l items and major groups of goods and serv ices, by year and month, l?a7-58—Continued
(191:7-1*9-100)
Tearand
month
Allitems
Food Housing Apparel Transportation
Medicalcare
Personalcare
Readingand
recreation
Othergoods
andservices
Yearand
month
Allitems
Food Housing Apparel Transportation
Medicalcare
Personalcare
Readingand
recreation
Othergoodsand
services
Baltimore, Maryland—Continued Boston, Mas sachuse t t s —ContinuedL9i*7—Con.
1952: Average 113.5 l l l *.6 1 1 2 .0 103U 1 3 2 .6 121*.6 106 . 1* 115.5 117.7 July------ 9lt.5 95.3 (1/ ) 96.0 9l*.9 93.ii 96.3 89.6 97.6March---- 112.3 112.7 m . o 103.1* 128.7 12il.3 107.5 n it.o 118.9 August— 96.1 97.6 (T/) 98.3 95.2 93.ii 96.7 89.6 97.6June-— - 113.0 m . o 1 1 1 .7 103.6 128.7 1 25.2 106.1 ll it .2 118.9 September 98.7 1 0 1 . li 95.1* 99.2 95.7 93.7 95.7 89.6 97.6September 1 1 5 .0 11 6 .1 112.7 102.9 138.2 125.2 106.1 116.7 11 6.8 October— 98.0 99.6 (V ) 99.3 95.7 93.7 96.5 89.6 97.6December- lU .i i U 3 .5 113.5 102.9 138.3 125.5 105.8 119.5 1 1 8 .0 November- 9 8.6 99.9 a n 10 0 .1 95.8 93.7 97.5 89.6 97.6
December- 99.9 101.6 99.1 100.8 95.9 9U.3 99.3 89.6 97.61953: Average llii.7 113.2 1 1 3 .6 103.3 139.0 131.8 107.3 116.6 119.0
March— - 111*.2 111.7 113.8 102.8 138.0 132.1 105.7 119.0 118.2 191*8: Average 1 0 3 .0 10it.3 102.1 lOit.O 97.8 100.3 100.8 101 .2 99.2June------ 115.1 l l l *.6 113.3 101*. 2 133.8 132.0 107.9 119.3 118.9 January— 1 0 1 .6 lOit.O (1/) 100.9 96.7 97.1 99.3 89.6 97.6September 1 1 5.0 lll*.7 1 1 3 .6 103.5 11*0 .1 132.6 108 .1 113.0 119.0 February- 1 0 0 . 1* 1 0 1 .2 a n 101.7 96.9 97.1 98.7 91.2 97.6December- lil*.5 112.9 113.7 1 0 2 . 1* 139.6 132.9 108.1 113.1 1 2 1 .0 March— - 10 0 .2 99.8 10T .0 1C2.7 97.1 1 0 0 .1 98.5 91.7 97.6
A pril---- 101.9 102.9 ( i / ) 103.1* 97.0 lOl.ii 98.3 99.8 97.6195U: Average 115.1 1 1U.1 111*. 2 102.5 137.6 133.3 107.7 115.7 123.0 May------- 1 0 2 .2 103.1* a n lOit.O 97.1 101.5 98.0 103.5 97.6
March---- 111*.8 113.6 1 1 3.8 1 0 2 . 1* 138.2 133.3 108.6 113.7 123.3 June----- 103.5 106.0 10T.lt 103.6 97.1 10 0 .6 97.ii io a .i 97.5June——- 115.5 116.0 113.9 1 0 2 .2 137.8 133.3 107.0 115.5 123.1 July------ 10 5.0 109.1 a n 103.6 97.9 100.6 97.6 10a. 1 97.5September 115.2 111*. 2 i u . i l 103.1 135.3 133.it 107.1* 117.9 123.1 August— 105.1 108.1* a n 1 0 it.8 98.6 100.9 98.8 10a. 1 10 1 . aDecember. 111* .8 i n . i t 115.1 102.5 138.9 133.1* 107.5 117.1 123.0 September 105.3 1 07 .6 10J .2 105.7 98.8 100.9 106.6 lOij.l 1 0 1 . a
October— 10 i*.6 10 5 .2 (1/ ) 106.2 93.8 100.9 106.0 ioa.7 1 0 1 .71955: Average 115.2 111.7 U 6 .6 102.5 136.5 131*. 7 109.1* 115.6 122.9 November- 103.9 103.1* a n 106.0 98.8 101.0 105.ii 108.7 101 .7
March— - lll* .9 111.7 115.9 102.7 136.8 13!*.lt 107.6 115.7 122.6 Dee ember - 102.7 100.8 10li.li 105.6 98.8 101.0 IOI1.7 108.7 ic i .7June-—— 115.0 112.2 U 5.8 102.5 137.0 131*.1* 100.0 llli.l* 122.6September 115.5 112.5 116.9 102.3 135.6 13U.6 109.5 115.8 123.3 191*9: Average 101.8 ICO, 2 103.5 99.1 107.3 106.0 101.9 109.3 1 03 .2December. 115.8 n o .a 119.0 102.1* 135.3 136.5 113.1* 116.1* 123.3 January— 102.2 ICO.8 (1/) 102.0 99.0 103.6 101*.0 108.7 101 .7
February- 100.6 97.5 (V ) 10.2.1 99.1* 103.6 1 0 3 .5 108.7 1 0 1 .71956: Average 116.9 112.9 117.1 101*. 9 139.0 11*0.8 116.8 118.1 125.3 March---- 101. L 99.1 10T.1 101.0 99.ii lCit.2 102.7 103.7 1 0 1 .7
March---- 1 1 5 .2 110.2 116.1* 103.7 136.8 136.5 116.1* 117.1 123.5 April---- 101.3 99.3 ( l / ) 100.8 99.8 101*. 2 101.5 10 9 . a 101 .7June------ 116.6 111*. 2 115.9 101*.7 137.1* 11*2.2 116.5 116.9 123.9 May------- 101.2 99.9 10*2.5 100.3 99.9 lClt.2 102.a ic9 . a 1 0 2 .1September 117.5 111*. 5 116.1 106.5 11*0.0 11*3.0 116.6 120.2 126.9 June-— - 101.9 101.7 102.5 99.0 99.8 105.1* 102.2 109.6 1 0 2 .1December. 119.5 lllt.8 120.2 105.9 11*5.3 11*1*.0 120.1 113.9 128.6 Ju ly---- - 101.5 100.8 (1/) 97.5 99.8 107.1* 102.2 1C 9.6 1 0 2 .1
August— 1C2.2 101.0 a n 97.1* 118.1 107.6 101.2 109.6 1 0 2 .11957: Average 121.0 116.8 121.1 106 . 1* 11*7.7 lltlt.7 119.9 123.7 130.1* Sent ember 1C3.2 102.3 107.3 98.2 118,1 108.1 101.ii 109.6 1 0 6 .0
March—— 119.9 11U.9 120.2 105.3 11*7.3 lltit.5 120.5 121.3 129.6 October— 102.ii 100.6 lOit.O 97.0 118.1 108.1 101.2 109.6 106 .0June---- - 121.2 117.5 121.5 105.2 11*6.7 11*1* .8 119.1 12lt.5 129.9 November- 1C2.1* 100.3 io it .1 97.3 118.1 103.1 100.8 109.6 105.8September 121.7 118.1 121.1 108.3 11*7.8 11*1* .8 119.3 125.1 131.6 December- 101.6 98.1i io it.5 96.9 118.2 108.1 100.0 109.6 105.8December. 122.1 117.1* 122.2 107.0 153.7 11*5.0 121.1 126.3 131.7
1950: Average 103.2 101.6 105.6 97.1* 118.8 110.ii 100.7 1C8.6 106.31958: Average 12U.5 120.9 12l*.l 107.5 151.6 11*9*2 123.9 128.8 136.9 January— 100.9 96.9 101*.6 96.2 118.3 109.3 99. a 109.6 1 0 5 .5
March---- 121*.1 121.5 122.8 107.7 11*9.7 11*6.1* 123.7 130A 136.1* February- 100.6 96.3 lClt.i* 16.2 117.9 109.3 99.2 109. a 10 5 . aJune-— - 12i*.8 122.1* 12l*.l* 107.7 l t f . l 11*8.1* 12U.3 128.0 136.2 March---- 101.2 97.6 1014.7 96.1* 117.9 110.2 99.7 109.3 105 . aSeptember 12U.8 120.3 12l*.7 108.0 152.2 11*9.3 121*. 2 129.2 138.5 Anril---- 101.2 97.9 lol*. 5 96.2 117.9 110.2 98.7 109.3 105.i.December. 125.5 119.8 125.9 106.3 159.5 156.3 121*.5 128.9 138.6 May------- 101.6 99.0 10 l*o 2 96.3 118.li 11C. 2 99.a 109.3 1 0 5 .5
June-— - 102.8 101.8 ioa .5 96.8 113.7 110.5 98.9 107.6 io5.aJu ly----- 103.8 101*.9 101*. 7 96.0 118.8 110.5 99.3 106.1 1 0 5 .3August— 10l*.ii 1C 5.3 105.6 96.6 119.3 1 1 0 .5 100.0 1C6.6 107.1Boston, Massacnuseuus September io l*.5 103.9 106.2 99.1 119.5 1 1 0 .5 100.7 103.0 107.3October— 105.3 10it.8 a n 99.3 119.5 1 1 0 .5 103.8 108.5 1C7.5
191*7: Average 95.2 95.5 91*.1* 96.9 91*.9 93.6 97.3 89.6 97.5 November- 105.1* 10lt.6 (V ) 99.6 119.6 11 0.6 ioa.6 109.6 107.7January-- 92.1* 92.2 a n 93.9 93.9 93.3 96.1* 88.2 96.3 Decemfcer- 106.3 106.0 10S.7 ICO. 2 120.1 1 1 2 .0 ioa.8 109.7 1C8.0February- 91.7 89.7 (T/) 95.9 93.9 93. it 97.1 90.0 97.1*March---- 93.5 93.5 97.7 91*.9 9l*.l 93.6 97.9 90.0 97.6April---- 92.9 91.5 ( V ) 91*.8 9lt.i* 93.7 99.0 89.6 97.6May-........ 92.1* 91.2 (r/) 9lt.lt 91U 93.7 97.8 89.6 97.6June----- 93.5 93.3 a n 95.1* 9i*.5 93.8 97.2 89.6 97.6
Not available,
Digitized for FRASER http://fraser.stlouisfed.org/ Federal Reserve Bank of St. Louis

Table C-2. Consumer Price Index—20 large c it ie s : Indexes of a l l items and major groups of goods and serv ices, by year and month, 191:7-58—Continued
(191:7-1:9-100)
Tearand
month
Allitems
Food Housing Apparel Transportation
Medicalcare
Personalcare
Readingand
recreation
Othergoodsand
services
Yearand
month
Allitems
Food Housing Apparel Transportation
Medicalcare
Personalcare
Readingand
recreation
Othergoodsand
services
Boston, Massachusetts—Continued Boston, Massachusetts—Continued
1951: Average 110.0 111.6 111.0 101:. 1 122.6 llb.O 108.1 110.3' 109.8 1957: Average 121.2 1 1 5 .0 129.6 10b.b lbb.6 lb5.6 126.6 110.6 12b.1January— 107.8 108.6 (1 /) 101.li 120.1 112.9 107.7 109. b 108.2 January— n 9 .o n 2 . i 128.6 1C 2.5 lb2.9 138.3 125.0 107.8 122.5February- 109 o0 111.0 (T/) 102.9 120.1 112.9 109.8 109.7 108.3 April---- 120.2 113.b 129.2 10b. 5 lb3.7 l b l . l 126.0 131.8 123.3March-— 109.2 110.7 110.3 102.9 120.1: 113.8 108.5 111.1 108.6 July----- 122.1 118.2 129.6 103.8 lbb.6 1L8.6 126.3 110.7 125.0A pril-— 109.0 110.5 (1 /) 102.5 120.it 113.8 108.5 109.5 108 .b October- 122.0 116.6 129.9 105.9 lb5.7 lb9.0 127.6 no.2 12b.8May---- 109.2: 111.3 a/) 103.0 120. b 113.8 108.5 111.1 103.5June--- 109.6 111.6 110.7 103.3 120.3 113.9 108.0 llO .b 108.9 1958: Average 12b.8 119.7 132.9 105.9 lb9.0 156.1 129.6 113.b 125.7July--- 109.9 112.5 (1/) 102.7 120.1 113.9 108.2 n o .6 108.9 January. - 123. b 117.1 132.3 10 5 .0 lb7.0 I5b.b 129.0 113.3 125.0August— 110.1 111.9 a/) 103.0 121:.7 l ib . 2 108.0 n o .6 108.9 April-- 12b.5 120.b 131.9 105.3 lb9.5 I5b.8 129 .b n 2 .3 125.0September 110.1: 111.1 11T.7 106.8 12h.8 113.8 107.3 n o .o n o .7 Ju ly----- 125. b 121.9 132.7 106.0 lb9.0 156.6 129.3 U 3.b 1 2 5 .1October-- i l l . l i 113.1 a/) 106.9 126.2 l ib .3 107.3 n o .o n o .7 October— 125. b U9.9 133.7 107.7 lb8.b 157.1 129.8 113.9 127.0November- 111.8 U3.1i (T/) 106.9 126.9 llb .b 107.6 n o .b n 3 .2December- 112.li 113.9 117.3 106.6 126.9 117.2 107.6 n o .3 n 3 .7
1952: Average 112.U 113.8 113.6 103.1: 130.9 120.2 109.7 105.8 n 5 .o Chicago, I l l in o isJanuary— 111.8 113.3 (V) 105.3 127.0 117.9 107. b 107.1 113.7February- 111.1: 111.1: (I/) 106.0 128.8 117.9 107.2 106.3 113.7 19b7: Average 9b.5 95.5 93.3 95.8 37.9 9b. b 95.8 9b.b ' 98.2March---- 111.2 111.1: 117.5 10b.3 128.9 118.1 106.8 105.5 115.3 January— 90.0 89.3 (1/) 90.9 3b.5 91.2 9b.9 91.b 99.3April----- 111.1 111.7 ( l / ) 102.9 128.9 118.5 110.8 105.5 n 5 .3 February- 89.9 88.6 (I/) 92.3 8b.b 91.3 95.6 91.b 99.0May---- 111.7 113.6 (V) 102.5 128.9 118.5 110.8 10b.9 115.3 March-- 91.8 92.3 (T/) 9b.5 8b.6 92.1 96.1 92.2 99.0June--- 112.0 llU . 2 117.9 102.1: 128.7 119.8 n o .5 1 0 5 .1 n 5 .3 April-- 91.5 91.2 (I/) 93.8 86.0 93.0 97.0 9b.0 97.9July--- 113.7 117.3 (V) 102.3 133.2 120.2 110.5 10b.7 n 5 .3 May-.... 92.2 92.2 915.7 9b.8 87.6 93.7 96.0 9b.b 97.9August-— 113.7 117.1 (V) 101.8 133.3 120.2 110.5 105.8 H5.3 June--- 93.1 93.8 (1/) 95.8 87.7 9b.5 95.7 9b.9 97.9September 113.2 n b .9 1U .9 103.1 133.U 122.5 110.5 1 0 6 .0 n 5 .3 July--- 9b.1 96.0 (I/) 95.3 87.7 9b.5 9b .2 9b.9 97.9October— 113.1: 115.2 (V) 103.3 133.b 122.5 110.5 106. b n 5 .b August— 95.7 93.3 (V) 96.5 83.2 ?6.b 9b.8 9b. 9 97.9Noveniber- 112.7 113.8 SO 103.0 133.li 122.5 110.3 106.b 115.2 September 98.9 102.1 97.b 98.0 89.3 96.b 9b.6 9b.9 97.9December- 112.1: 112.0 (I/) 103.1 133.1: 123.2 110.3 106.0 115.2 October— 93.b 100.2 (1 /) 98.1 91.1 96.b 95.5 95.9 97.9
November- 93.9 100.5 (V) 99.0 *91.9 96.6 96.8 97.1 97.91953: Average 112.7 110.5 U 6.li 103.2 135.9 123.7 111.8 107. b 116.6 December- 100.0 101.8 99.6 ICO. 2 92.0 96.9 98.0 97.1 98.0
January— 112.1 111.3 llb .8 102.8 13b. 2 123.3 n o .b 106. b 115.1April-- 111.7 108.1: 115.6 103.8 135.6 123.b 111.8 106.2 116.2 19b8: Average 102.8 lO b.l 101.8 103.6 101.5 100.5 99.6 1C0.1 99.8July------ 113.1 111.7 116.1i 103.1: 136.7 123.6 111.9 106.5 116.5 January— 100.8 103.1 (1/) 100.3 93.8 98.b 96.8 99.0 98.0October- 113.8 111.6 117.7 103.6 136.7 12b.3 112.3 110.1 117.7 February- 99.2 99.1 a/) 102.6 93.8 98.9 97.6 98.2 98.0
March-— 99.b 98.8 100. b 103.3 93.8 98.9 97.0 98.2 98.01951:: Average 113.2 110.1 118.3 102.0 136.5 12b.b 112.2 105.2 n s .b April-— 101.2 102.7 (1/) 103.2 93.7 99.6 97.2 99.2 98.0
January— 112.7 109.9 117.6 100.6 135.5 12b.5 112.6 107.3 n 8 .o May------- 102.8 105.7 (T/) 103.2 97.2 100.0 96.6 1C1.3 98.0April---- 112.9 109.3 117.5 101.1 11:0.9 12b.b 112.3 10b .7 118.5 June-— - 103.6 107.1 10T.2 1C3.2 97.1 100.0 98.0 100.7 98.0July------ 113.8 112.9 117.9 101.8 137.2 12b. 2 112.0 103. b n 8 .5 Ju ly—— 10^.0 108.7 (1/) 102.5 1C6.6 100.7 96.3 100.7 98.0O ctober- 113.5 110.2 119.6 10li.2 132.8 12b.3 111.8 1 0 5 .2 n 8 .5 August— 105.2 108.2 (I/) 103.9 108.0 101.0 96.7 100.7 101.9
Sentembei• 105.5 107.1 107.3 105.5 108.b 101.0 10b. 9 101.2 103.21955: Average 113.8 109.5 120.9 100.1 13 b.2 125.b 113.b 107.2 118.5 October—■ 10b.8 105.5 (1/) 105.7 108 .b 101.0 105.0 101.2 101.9
January— 113.0 108.2 120.0 101.7 133.8 12b.5 112.3 107.b n s .b November-> 103.5 102.5 (T/) 105.3 108. U 103.5 105.0 100.3 102.2April----- 1 1 3 . a 109.0 120.1: 102.6 13b.O 12b.5 111.6 107.1 118.b December* 103.2 100.7 1C7.5 10b.9 103.b 103.5 lCb.7 100.3 102.2July------ 113.8 110.8 120.1: 101.5 132.5 125.0 112.3 107.7 118.5October- m . 5 109.9 121.8 102.8 135.9 126.3 llb .b 106.6 118.6 19b9: Average 102.7 100.3 1 0 5 .0 100.6 11C.6 105.1 10b.6 1C5.5 1C2.1
January- 102.9 100.3 ( i / ) 103.b 108.5 10b. b 10b. 6 1C2.9 102.21956: Average i i 7 a 111.0 125.6 103.1 138.9 133.5 123. b 108.5 120.0 February. 101.7 98.1 (I/) 102.6 109.2 10b.b 10b. b 101.9 1C2.2
January— nu.6 108.1: 123. b 101.2 135.9 128.b 121.1 107.1 118.9 March--- 102.6 99.6 107.3 102.9 109.2 105.6 1C5.5 105. b 102.2A pril-— 115.2 107.9 121:.7 102.5 136.3 128.5 123.0 108.5 118.9 April— 103.0 100.9 (1 /) 101.9 109. b 1 0 5 .6 105.3 105. b 102.2July------ 117.8 n b .2 125.5 102.8 135.6 136.5 12b.O 107.9 n 9 .6 May......... 102.5 100.1 (I/) 101.5 109.3 105.6 10 b.8 105.b 1C2.2October— 119.3 113.2 127.2 105.3 1U5.3 137.2 12b.3 n o . i 121.6 June---- 103.5 102. b lcb .b 101.1 109.2 105.5 105.6 105. L 102.3
1 / Hot available,
Digitized for FRASER http://fraser.stlouisfed.org/ Federal Reserve Bank of St. Louis

Table C-2. Consumer P rice Index—20 large c i t ie s : Indexes o f a l l items and major groups o f goods and serv ices ) by year and month, 191:7-58—Continued
(191x7 -1x9-100)
Tearand
month
A llitems
Food Housing Apparel Transportation
Medicalcare
Personalcare
Readingand
recre ation
Othergoods
andservices
Tearand
month
A llitems
Food Housing Apparel Transportat io n
Medicalcare
Personalcare
Readingand
recre ation
Othergoodsand
services
Chicago, I l l in o is —Continued Chicagoj, I l l i n o is —Continued191x9—Con. 1953— Con.
J u ly ------- 102.3 100.3 (1 /) 99.9 109.2 105.5 103.9 105 .I1 101.9 A pril— n a .2 n o .2 n 9 .a 106.5 133.8 n 9 .6 n a .5 . 109.1 112.1August— 102.6 101.2 0 / ) 99.8 109.2 105.5 103.3 i o 5 .a 101.9 May-------- n a .6 110.8 1 2 0 .0 106 . a 133.5 119.8 n a .3 109.8 112.3September 103.5 102.6 10H.7 99.1 109.1 ioa .7 1011.5 108.3 101.9 June-— n 5 .3 n 2 .a 120.3 106.8 133.3 120.0 n a .2 109.9 112.9October— 102.6 99.9 1 0 5 .0 98.5 115.2 10li.7 io a .2 109.3 101.9 July------ n 5 .7 112 .7 121 .0 106.7 13a.3 121.2 u a .o 110.3 112.9November- 103.2 100.8 105.9 98 .lx 115.2 io a .6 io a .5 ■ 105.9 101.9 August— 116.3 n 2 .3 123 .1 107.2 13a.3 121.2 n a .2 m . a 112.9December- 102.0 97.8 106.!x 98.2 111.8 ioa .6 1011.3 105.9 101.9 September 116.6 1 12 .5 123 .6 id s . a 133.8 121.2 n a .3 110.9 n 3 .o
October- 117.1 112.8 123 .9 108 . a 1 33 . a 122 .a n 3 .7 110.9 116.91950: Average 103.8 101.3 107.8 99.7 113.8 106.9 ioa .8 ioa .8 102.9 November. n 6 .a n o .a 12a. 2 108 . a 132.8 122.7 u a .o 109.3 U 9 .2
January— 101.5 96.7 106.5 9 8 .lx UU.7 ioa .6 103.7 1 05 .9 101.9 December. 1 16 . a 1 10 .5 12a . 2 108.1 132.8 122.7 n a . i 108.7 H 9.3February- 101.2 96.1 106.8 98.1 lllx.3 ioa .6 103 .5 106.8 101.9March-— 101.6 97.3 106.8 98.0 113.8 105.3 103.3 1 05 .5 101.7 195UI Average 117 .2 110.8 126.5 107.5 132.9 123.6 n a .a 109.3 n a .6A pril------ 101.5 97.3 107.0 97.7 112.6 105.3 103.3 io 5 .a 101.5 January - 116.7 m . a 12a.3 107.8 -133.7 122.8 n a .2 108.6 U 9 .0May---------- 102.5 99.7 106.8 98.1 112.6 105.3 303.1 1 05 .6 101.6 February n 6 .7 n i . 2 i2 a .9 108.1 132.8 122.8 n a .2 108.0 n s .9June------- 102.8 100.8 106.6 98.3 112.8 105.2 103.1 io a .1 lO l.a March— n 6 .7 110.7 125 .1 108.2 132.7 122.8 n a .7 107.9 H 3 .9July-------- 10U.1 103.9 107.1 98.5 113.1 I05.li 102.9 102 .9 101.2 A p ril----- n 6 .5 n o . a m . 9 108.1 132.a 122.8 113 .2 107.5 113.8August— 105.1 105.0 107.7 99.lx lia .ix 105.5 103.5 1 03 .1 i o a .3 May-------- 117.3 11.1 .7 126.1 108.1 133.7 122.8 113.2 107.5 119.0September 105 .U 103.9 109.0 101.2 113.9 110.1 103.8 i o a . i io a .3 June-— U 7 .3 1 11 .6 126.2 108.1 13a.2 122.8 n 3 .a 107.5 U 3 .7October— 105.9 lOix.O (1 / ) 102.3 113.8 110.3 107.2 io a .a ioa .8 July------ 118.0 112 .6 126.9 107.9 133.7 122.6 115.0 110.8 118.8November- 106.0 103.9 ( I / ) 103.1 11 lx. 2 n o .5 109.1 io a .9 io a .8 August— 117.7 m . 9 127.1 106.9 133.U 122.6 n a .6 n o .7 n 3 .6December- 107.7 107.2 ncr.ix 103.1 115.0 m . i 111.2 1 0 5 .1 105 .2 September 1 17 . a 110.2 127.9 106.9 133.1 122.7 H 5 .1 110.6 H 8 .2
October- 117.1 1 1 0 .0 128.2 106.6 127.8 126.1 115 .0 110.5 113.21951: Average 111.9 112.9 113.3 107.3 120.3 113.0 113 . a 108.8 106.8 November. 117.6 1 0 9 .6 128.3 106.6 1 3a .l 126.1 n 5 .a m . o 113.2
January— 106.9 108.9 ( 1 / ) 10ix.8 115.1 l l l . l 112.5 105 .6 105 .5 December. 117.0 1 08 .2 128.5 106.2 133.1 126.1 1 15 .2 110.7 113.2February- 110.7 112.7 ( V ) 106.0 115.5 111.1 113.3 106.3 105 .6March-— 111.0 112.0 112.7 106.3 117.5 112.1 113 . a 1 0 9 .2 106.2 1955: Average n 7 .9 109.1 129.9 105.8 131.5 129.1 117 .6 113 .5 117.8A p ril------ 111.1 111.8 (1 /) 106.7 117.5 112.5 113.7 109 .1 106.2 January- 117.0 108.7 128.1 i o a . i 133.8 1 27 . a 1 15 .5 111.8 118.1May-----— 111.5 112.7 (T /) 106.6 117.5 112.5 113.7 109.3 106.2 February 117.1 108.7 128.3 ioa.7 132.8 127 . a 115.3 n 3 .2 117.7June-— — 111.6 112.9 llT .lx 106.5 117.5 112.6 n a .5 108.7 106.2 March---- 1 117.0 108.3 128.3 ioa .8 133.0 127.5 115.3 113.1 113.1July-------- 112.1 113.8 (1 /) 106.3 119.8 112.6 u a .3 109.0 106.2 A p ril----- 116.9 109.0 128.2 io a .o 129.6 128.0 n 5 .3 113.1 118.1August— 112.1 112.9 (T /) 106.3 123.7 112.6 113.7 109.3 106 .a May-------- 117.2 109.2 129.0 10a. 2 130.2 128.0 n a .9 113.1 113.1September 112.6 Il2.1x 117.7 110.3 12lx.8 n a .3 113.1 107.8 107.0 June------ 117 . a 109.2 129.5 io a .o 130.a 129.5 115.2 112.6 117.3October— 113.6 lllx .3 (1 /) 109 .lx 125.3 l i a .2 112.9 110.3 107.0 July------ 118.2 110 .5 130.2 105 .0 130.0 128.5 n 5 .9 113.5 U 8 .2Novenfeer- u n . i 115.0 (T /) 109.1 126.3 115.1 112.9 110.2 109.a August— 118.5 110.5 130.9 105 .6 130.5 128.5 H 6 .3 113.8 118.1December- lllx.O 115.2 117.6 108.5 122.9 115.1 113.1 110 .5 io 9 .a September 118.9 110 .5 131.0 107 .9 130.7 128.5 121.7 n a .a 116.8
October— 119.0 109.1 132.1 108.0 1 32 . a 128.7 121.7 n a .5 117.31952: Average lllx.U lllx .7 116.3 105.9 130.9 116.0 113.2 109 .2 109.5 November. 119.1 107.8 132.3 108.8 133.3 133.9 121.9 n a .6 117.6
January— lllx.O lllx .9 ( / ) 106.2 126.6 115.3 113.1 n o . i io 9 .a December- 118.5 107.6 131.2 108.0 131.3 133.9 121 .9 n a .6 117.5February- 112.7 111.9 TV) 105.5 127 .lx 115.3 112.6 109 .3 108.8March— — 113.2 112.9 117.7 106.0 127.ix 115.5 112.1 109.3 108.8 1956: Average 119.5 109.3 131.2 108.9 13a.0 136.6 123 .5 U 5 .5 118.0A p ril-— 113.lx 113.6 (1 /) 105.3 127 . a 116.0 112.3 109 . a 108.8 January- 118.1 106.5 131.0 108.0 130.8 135.0 122.3 115 .0 117.5May--------- lllx.3 115.8 (T /) 105.5 127.5 116.2 111.7 109 . a 108.8 February n 8 .3 106.8 131.2 107.9 131.1 135.1 122 . a 115.3 117.5June------- lllx .9 115.7 117.2 105.lx 133.2 116.2 111.7 108.7 108.8 March----- 117.7 106.3 129.7 108.5 130.6 135 . a 122.5 115.3 117.5July-------- 115.0 116.1 (1 /) 105.2 133 . a 116.2 111.6 108.7 n o . o A p ril---- 118.1 107.1 129.8 108.5 131.1 136.a 123.8 115.7 117.5August— 115.5 117.0 ( I / ) 105. lx 133.6 116.2 lllx .7 108.7 n o . o May-------- 118.6 108.8 129.9 108.2 131.6 136. a 122 .8 1L5.6 117.6September 115.0 115. lx 117. lx 106.3 133.6 116.2 l ia .7 108.7 n o . o June-— n 9 .5 n o . 6 130.9 108.0 131.9 136.3 123 .2 115.1 117.7October— 115.0 115 .lx ( 1 / ) 106.2 133.6 116.2 n a .7 109.0 n o . o July------ 120.5 n 2.8 131.2 108.5 133.6 136.6 123.9 1L5.5 117 . aNovember- 115.1 115.2 (V) 106.7 133.6 116.2 n a .7 109.6 n o . i August— 120.0 110.9 131.2 109.2 133.9 136.6 123.8 115.3 117 . aDeceniber- Ulx.6 112.3 117.2 106.7 133.6 117.0 n a .7 109.6 110 .6 September 120.3 110.8 131.9 109.9 133.8 136.8 n a .o U 5 .6 117.7
October- 121.1 110.7 132.2 110.3 139.9 138.0 12a . 1 115.5 119.01953: Average 115.lx 111.3 121.5 107.1 133.8 120.2 n a .2 109.8 n 3 .6 November. 121.0 n o .a 132.2 109.9 139.8 138.5 12a . 2 115.5 119.7
January— lllx .2 111.2 119.1 106.0 13a.5 117.1 n a .3 108.8 n o .5 December. 121.0 109.8 132.7 110.0 139.3 138.6 i2a .6 117.0 119.7February- 113.9 109.6 119.6 106.1 ua.a 117.1 n a .7 109.2 n o .aMarch------ 113.8 109.7 119.3 106.3 ua.o 116.8 11a. 5 109.2 111 .2
1/ Mot available.
Digitized for FRASER http://fraser.stlouisfed.org/ Federal Reserve Bank of St. Louis

Table C-2. Consumer P rice Index—20 large c it ie s* Indexes o f a l l items and major groups o f goods and se rv ice s , by year and month, 191*7-58— Continued
(191*7-1*9-100)
Tearand
month
A llitems
Food Housing Apparel Transportation
Medicalcare
Personalcare
Readingand
recre ation
Othergoods
andservices
Tearand
month
A llitems
Food Housing j Apparel Transportat io n
Medicalcare
Personalcare
Readingand
recre ation
Othergoodsand
services
Chicago, I l l in o is —Continued Cincinnati, Ohio* —Continued19a8— Con.
1957: Average 123.3 112.9 13U.7 109.9 11*2.9 U 2 .3 126.5 119.0 120.6 August— io a .7 107.3 ( 1 / ) io a .6 105.3 103.1 99.1 98.8 101.6January— i a .0 109.5 132.1* 108 .7 110.7 139.5 12a .8 117.2 119.7 Seotenibei 105.1 107.2 103.0 ioa .9 105.8 103.2 99.0 101.6 101.6February- 121.5 110.9 132.9 109 . a 139.3 139.5 125.2 116.3 119.8 October- io a .6 105.5 (1 /) 105.0 105.3 103.6 99.0 101.6 101.6March------ 121.6 110.2 133.1* 109.6 ia o .o 139.6 126.0 116.9 119.9 November. 103.6 103.0 an ioa .8 105.9 103.6 99.0 101.6 101.6A p r il-— 122.0 111.6 133.8 109.5 1 3 9 .6 i a i . i 126.2 117.0 120.0 December. 102.7 100.9 10H.7 103.8 105.9 103.6 99.0 101.6 101.6May---------- 122.2 112.0 13l».l 109.5 1 3 9 .2 1IA.3 126.2 116.1 119.9June— — 122.9 113.6 13li.8 109.3 139.2 11*1.3 126.2 116.1 119.9 19 U9: Average 101.2 99.1 102 .9 99.6 109.2 105.0 97.9 102.1 102.2July-------- 12i*.l 115.6 135.1 109.2 ia a .6 11*1.5 126.3 115.9 121.2 January- 102.6 101.1 a / ) 1 02 . a 105.9 103.8 98.3 101.6 102.1August-— 12l*.l 115.0 135.2 109.2 11*5 .3 11*1.5 126.5 116.6 121.1 February 101.2 98.2 an 101 .7 106.8 103.8 98.0 101.6 102.1September 121*.3 n l* .o 136.1 111.5 11*3.7 UiL.7 126.8 119.5 121.2 March— 101.8 99.3 10H.0 101.3 109.6 ioa .9 98.0 101.6 101.6October— 12U.7 lli* .0 136.1 111.3 Ili3.lt U 6 .7 127.6 122.2 121.2 A p ril— 101.8 100.0 ( i / ) 99 .8 110.0 105.2 98.2 102.3 101.6November- 125.6 1 U .1 136.1* 110.9 l'i9 .1 11*6.8 127.9 127.3 121.5 May-------- 100.8 98.5 an 9 9 .2 109.9 105.2 97.7 102.3 102.1December- 125 .6 113.9 136.1* 110.6 150 .7 U 7 .0 123.2 127.0 121.5 June-— 101.7 io o .a 107.6 9 9 . a 109.8 105.3 98.0 102.3 102.1
July------ 100.7 98.6 ( 1 / ) 93.3 109.6 105.3 98.0 102.3 102.11958: Average 127.0 117 0 137.7 109 .8 150.5 150.8 129.1* 12a.7 121.5 August— 100.7 99.2 an 91.9 109.7 105.3 97.5 102.3 102.1
January— 126.1 115.5 136.2 1 09 .5 151 .1 150 .3 128.9 125.7 121.3 September 101.9 101.0 107 . a 93.8 109.8 105.3 99.6 102.3 102.1February- 126.2 116.2 136.9 109.3 11*9.1* 150.3 128.9 1 25 .0 121.3 October- 100.7 93.2 1 02 .5 9 9 .2 109.8 105.3 9 7 . a 102.3 102.1March------ 126.8 117.9 137.0 109.3 ia s .a 150.3 128.9 125 .1 122.0 November- io o .a 97.7 102.5 9 9 .0 109.8 105.3 97.0 102.3 102.9A pril------ 127.0 118.li 137 .1 108.9 11*8.2 150.5 129.2 126.1 122.0 December- 100.1 97.0 102.8 98.6 109 . a 105.3 97.0 101.6 102.9May---------- 127.0 U 8 .5 137.2 109.0 11*8.5 150.6 129.3 125.8 121.9June-------- 127.5 118.8 137.9 109.6 11*9.3 150.6 129.6 125.8 121.5 1950* Average 102.2 101 . a 103.9 93.6 i n . a 105.5 98.2 100.9 io a .2July-------- 127.6 119.5 137.7 110.2 11*8.8 150.6 129.7 12 lull m . a January- 100.1 97.1 102.9 93.0 109.1 105.3 96.a 101.6 102.9August— 126.9 117.0 138.1 109.a 150.0 150.6 129.9 121*.3 i a . 3 February 99.8 96.9 102.8 97.0 109.0 105.3 96.a 101.5 102.9September 127.1* 117.7 138.1* 110.8 150.1 150.7 129.5 123.8 121.2 March— - 100.1 97.5 103.2 97.2 109.0 105.3 96.3 101 . a 102.8October— 127.3 116.7 138.5 110.5 152.8 151.5 129.7 123.1* 121.3 A p ril----- 99.8 97.2 102.7 96.8 106.5 105.3. 96.3 i o i .a 102.7November- 127.1* 116.3 138.8 110.9 153.8 151.5 129.6 123.7 i a . a May-------- 100.8 ?9 .a 1 0 2 .5 96.5 111.3 105.3 95.a 101 .5 103.2December- 127.0 115.1 138.7 109.9 155.2 151.5 129.6 123.7 i a . 3 June-— 101.2 100.9 102.5 96.a U i .5 105.3 9$. a 99.9 103.1
July------ 102.1 io 3 .a 102.6 96.3 111.9 105.3 9 5 . a 93.6 103.1August— 103.3 io a .9 103.8 96.9 113.1 105.3 96.3 99.0 105.1
Cincinnati. Ohio September io a .2 io 5 .a io a .6 100.9 113.1 105.5 96.5 100.3 105.3October- io a .6 io a .6 (1 /) 101.9 113.1 105.5 102.6 100.7 106.2November. io a .6 1 0 3 .6 an 102.3 113 . a 105.6 io a .5 102.0 106.5
191*7* Average 95.7 96.2 9a.8 97.5 89.6 92.8 101.1 93.2 98.3 December. 105 .9 106.2 105.9 103.3 113.5 106.6 106 .6 102.8 106.7January— 90.7 89.7 ( ! / ) 90.9 85.9 88.5 99.7 9h.h 98.0February- 91.1 89.9 S O 92.5 85.9 88.5 99.5 9a. a 93.0 1951: Average 110 .1 112.1 109.6 108.0 1 19 . a 108 . a 1 07 .0 103.9 108.3March------ 93.1* 9 M J */ ) 93.5 87.8 88.5 100 .5 98.8 93.0 January- 108.3 110 .0 ( 1 / ) 1 0 6 . a 116.1 107.0 1 0 7 .0 102.8 107.7A pril------ 93.5 92.9 an 96.2 87.8 89.6 101.7 99.0 93.7 February 109.2 m . 6 an 107.8 116.2 107.0 107 .2 102.8 107.8May—------ 93.3 92.1i O f ) 96.3 87.8 90.7 101 .0 99.0 98.7 March— 109.5 111 .1 107 .5 108 .a 1 17 . a 107.1 1 07 .2 i o a . i 108.0June— — - 9U.3 9U.0 9J.6 98.2 87.8 91.9 101 .1 99.0 98.7 A p ril— 109.6 111.2 a / ) 108.3 117 . a 107 . a 106.7 105.0 108.0July-------- 95.5 95.6 Q /> 100.6 89.0 9a.9 100.3 99.0 98.a May-------- 109.7 111.7 an 108. a 117 . a 107 . a 107.7 105.2 108.1August— 96.6 97.5 <£/ 99.1 89.a 95 . a 100.2 99.0 9 8 . a June------ 109.9 111.6 107.8 108.1 1 17 . a 107.8 107.9 105.2 108.1Septentoer 99.0 101.7 9F.U 100.6 91.3 95.9 100.1 99.0 97.1 July------ 110.2 112.7 ( 1 / ) 107.7 117 . a 107.8 107.5 105.2 108.1October— 99.5 101.8 C l/) 101.0 9 1 . a 96.3 102J* 98.8 9 8 . a August-- 110.0 112.3 ( V ) 107.5 119.1 107.8 107.1 105.3 108.1November- 99.5 100.ii an 101.2 95.1 96.3 103.1 98.8 98 . a September 110.9 112.6 11TJ.1 109.1 122 .5 108.9 106.5 103.0 107.7December- 101.li 10i*.l 10U.1 100.1 96.1 96.8 103.5 93.8 9 8 . a O ctober-- 111 .0 113.0 ( 1 / ) 109.1 123 .1 108.9 106 .a 103.1 106.9
November. 111.5 n a . i an 107.7 12a. a 109.2 106.5 102.3 110.3191*8* Average 103.1 10U.7 102.2 102.8 101.2 102.2 101,0 99.7 99.6 December. 111.6 113.3 110.8 1 07 . a i2a .3 n a .3 106.3 i o 2 .a 110.3
January- 102.0 ioa .8 U / ) 100.0 96.7 100.0 103.7 98.8 98 . aFebruary- 101.3 102.8 ( T / ) 101.2 96.7 99.8 103.2 98.3 98.1 1952: Average 112.5 115.3 110 .7 105.7 127.0 116.8 107.6 101.9 111.8March------ 100.9 i o i .a 101.3 101 . a 96.7 99.8 103.0 93.8 93.1 January- 111.8 l ia .7 a / ) 106.3 i2a.3 u a .3 106.2 102.3 110.6A p r i l-— 101.8 103.3 ( 1 / ) 101.7 96.7 102.2 103.6 93.8 98.1 February 111.1 112.2 an 106 .a 126.0 115.3 106.0 101.9 . 110.6May---------- 102.7 105.0 a/) 102.2 96.8 102.2 103.2 98.8 98.1 March-— 111.3 112 .a 1 10 .7 106.2 125.6 116.5 106.3 102.5 111.7June—----- 303.1* 106 . a 10T .7 102.0 98.7 102.8 lOO.a 98.8 98.1 A pril— 111.9 n a . i ( 1/ ) 106.2 i2 5 .a 116.5 106.6 102.5 111.7July— — 10i*.8 108 . a ( 1 / ) 102.3 103.5 103.1 io o .a 98.8 98.1 May-------- 112 .5 115.2 an 106.1 127.7 116.5 106.6 1 02 . a 112.0
1 / Not available,
Digitized for FRASER http://fraser.stlouisfed.org/ Federal Reserve Bank of St. Louis

Table C-2. Consumer Price Index—20 large c i t ie s : Indexes o f a l l items and major groups o f goods and se rv ices , by year and month, 19b7-58—Continued
(191*7-1*9-100)
HousingReading Other Reading Other
Tear A ll Food Apparel Trans- Medical Personal and goods Tear A ll Food Housing j Apparel Trans MCdical Personal and goodsand items porta- care care recre - and and items porta care care recre and
month tion ation services month tion ation services
1952— Con.Cincinnati, Ohio— Continued Cleveland, Ohio— Continued
106.1191*7— Con.
June— — 112*9 116.5 110.2 127.7 117.1 106.1* 102.1 112.0 May---------- 93.7 92.8 ( 1 / ) 96.6 87.6 9b.3 100.7 98.9 96.5July-------- 113.lt 117.6 ( ! / ) 105.3 127.7 117.5 108.9 102.2 112.0 June------ - 91*.5 9l*.7 ( T / ) 96.6 87.6 9 b .l 100.8 98.9 96.5August— - U 3.U 117.9 ( T / ) 105.5 127.7 U 7 .5 108.9 101.5 112.0 August— 96.1 97.6
8 296.7 39.0 9b.b 100.1 98.9 97. b
September 113.2 116.8 111.0 106.0 127.7 117.6 108.7 101.5 112.0 November- 98.5 93.5 100.3 91.8 98.0 100.9 99.2 98.3October— 113.3 116.9 ( ! / ) 106.0 127.8 117.7 108.9 101.3 112.0
lo o .5November* 112.5 115.2 ( T / ) 10l*.2 128.0 117.7 108.9 101.1 112.3 19118: Average 103.2 10b.5 102.2 103.3 102. b 100.5 101.0 100.3December* 112.5 u li .u 11?.6 103.9 127.9 117.7 108.9 101.1 112.3 February - 101.2 101.5 101.5 102 «b 97.lt 98.1 102.3 99.7 1C1.9
10l*.6May--------- 102.5 10b.2 101.8 103.1 97.6 99.9 101. b 100.3 98.0
1953: Average l l !* . l 115.0 U b .9 130.5 122.0 109.1 99.6 115.5 August— 10 5.8 109.1* 102. b 103. b 107.3 lOO.b 100.3 100.3 lOO.bMarch— — 112.6 112.7 112.9 10l*,7 130.7 121.2 108.3 99.1* 113.6 November- 10U.0 103.7 103.2 10b .7 107.7 103.5 100.1 100.8 102.1June------ - n u .5 116.9 115.0 101*.8 130.0 121.5 108.8 99.1 116.0September 115.3 116.9 U 6 .5 10l*.9 131.6 123.0 109.7 99.7 116.2 19119: Average 101.5 99.9 102.5 99.6 108.7 10b. 5 9 8 .b 100.8 102.3December- ll lt .6 1 U .8 116.1* 103.8 130.5 121*.6 109.3 99.7 118.1 February-
i f c i t r ____101.9 99.0 103.b 102.2 108.7 lO b.l 100.1 100.8 101.6101.1*101.5
9 9 .b 100.5
101.9101.8
100.198.5
109.0108.7
103.810b.7
98.5 9 7 .b
100.8 101.91951*: Average l l i * . l m . u 116.9 103.3 127.0 125.0 109.3 99.2 117.7
rray—*"*-August— 100.8 101.9
March------ 111*. 2 l l b . l 116.7 103.1 123.2 12l*,6 110.2 99.8 118.1 November- 100.9 9 8 .b 102.7 97.5 108.8 105.5 <>7.8 100.8 103.0June-— — U lt.2 n ii .9 116.7 102.6 126.6 12l*.8 108.5 99.it 117.8
10b. 9September U ll.3 lllt .3 117.0 10l*.l 127.2 12l*.8 109.3 98.3 117.9 1950: Average 102.5 101.0 10b.7 98.7 108.8 105.5 101.7 100.2December- 113.3 112.0 117.6 103.2 123.5 126.3 109.0 99.3 116.3 February* 99.9 96. b 103.2 96.6 107.b 1 0 5 .1 97.2 101. b 103.0
May--------- lOO.b 98.3 103.3 96.1 106.8 1 0 5 .1 97.0 101.0 102.91955* Average 113.7 112.0 118.0 103.5 122.6 129.0 113.3 99.9 116.3 August— 103.6 10b.3 10b. b 98.1 110.1 10U.9 103. b 98.6 106.6
March------- 113.1* 111.7 117.3 103.1* 123.8 127.1* 109.0 101.0 116.1 November- 1 05 .b lO b .l 107.8 103.b 110.6 106.7 109.0 99.6 106.9June-— - 113.7 112.9 117.b 103.0 123.2 127.6 113.9 100.1 116.6
115.6 113.1 y 103.6 1 1 1 . 0September 113.7 112.1* 118.1* 103.9 120.5 127.5 115.9 99.5 116.2 1951: Average 110.7 112.3 110.6 107.6 110.0December- l l b .2 llO .b 119.8 103.9 122.5 137.1 116.8 93.8 116.3 Februaiy- 109.3 111.2 110.2 107.0 111.7 109.2 110.9 101.5 108.3
May-------- llO .b 112.6 110.6 107.9 112.8 112.7 11C.9 10b.6 106.61956* Average 116.0 113.2 121.1 105.0 123.5 137.1* 119.7 100.1 120.0 August— 1 1 1 . 0 112.6 llO .b 10 8 .0 117.? 112.8 109.b lO b.l 110.0
March------ Ul*.3 109.6 120.1 105.3 121.1 137.2 118.1 100.7 113.1* November- 112.7 l i b . 2 l l l . b 108.0 120.7 118.0 109.1 lO b .l 117.5June-------- 116.3 U 5 .3 120.7 10i*.2 122.2 137.3 119.1* 99.7 120.9
1C6.7 116.5September 117.1 115.5 121.8 105.7 12b. 2 137.5 119.3 100.2 121.3 1952: Average 113.3 U b .9 112.b 106.0 122.3 119.0 1 1 1 . 0
December- 117.5 113.9 122.6 105.5 128.6 137.6 12i*.8 100.3 121.1 February- 112.6 113.3 111.2 106.7 122.b 113.b 109.0 106.6 117.3May-------- 113.1 l i b .8 111.6 106.3 122.2 119.7 108.7 107.0 117.1
1957: Average 119.6 117.3 123.6 105.8 130.9 11*1.3 127.3 10b.8 122.5 August— llb .O 117.3 112. b 105.5 122.3 119.6 111.5 lO b .l 117.1March— — 118.1 1 U .7 123.1 105.3 129.2 139.7 126.5 101.0 121.9 NCvembeiv 113.6 l l b . l l l b . l 105.6 122.6 119 .b l i b . 9 108.8 l i b . 7June-— - 119.7 118.8 123.3 105.0 129.9 11*0.1 127.1 106.3 121.7
105.0 123.8 123. b llb .O 115.2 116.9n b .5September 120.9 119.7 12l*.2 107.3 132.1* 11*0. !* 127.8 107.0 123.5 1953: Average l i b . 2 110.2 117.7
December- 120.8 117.6 12lt.l* 105.7 133.6 11*8.8 129.5 107.1 123.7 February- 112.5 107.9 115.8 10b.7 123.0 119.5 113.7 l lb .5May-------- - 113.7 109.2 117.7 I05.b 123.3 119.8 113.8 llb .O 116.7
1958: Average 122.3 122.1 12l*.3 106.1 133.9 11*9.5 130.5 109.5 123.8 August— 115.1 112.2 118.2 10b. 9 125.1 126.7 113.8 113.7119.5
116.5120.0March-— - 122.3 122.6 12l*.l* 106.0 132.1* 11*8.9 129.8 109.6 12)* .2 November- 115.5 110.5 119.b 105.0 12b.0 127.6 l i b . 5
June— — 122.7 12i*.l 121*. 3 101*. 9 132.1* 110.9 130.9 109.9 123.9115.3 lOb.b 121 .b 129.7 l i b . 7 116.5 119.8
119.8119.9
September 122.5 122.8 121*.2 106.9 133.1 11*8.9 130.8 109.6 123.5 1951*: Average 110.9 119.7December- 122.1* 119 J* 12l*.l* 107.1 139.8 152.3 130.7 109.7 123.6 February- 115.2
115.3115.3
110.5 l l l . b 111 .8
119.1 119.b120.1
i o b . 7 1 0 b . 6
1 0 b . 3
123.1122.7117.8
129.2129.5129.5
115.0 l i b . 6
117.3llb .On a y —
August— l i b . 71 1 1, *7
116.8113.0
120.1 119.b115.3 109.7 120.3 icb .1 i i n f t
Cleveland, Ohio November- 122.0 U U m O JU-Zj. f
115.6 103.9 122.3 120.3 135.6 113.0 115.3 119.21955: Average 1U J . 0
191*7* Average January— February - March - - - - - - - - -
95.391.991.893.8
95.690.389.3 93.2
95.1* (J 0
( i^ )
97.293.695.1*96.0
88.986.386.3 87.h
95.093.793.893.9
100.699.799.9
100.5
99.098.998.998.9
97.1*97.396.996.9
February-May- - - - - - - - - - - - -August— - November-
11U.9115.3116.0116.2
108.8 109.6 109.6 107.b
121.2122.0122.9123.3
103.6 103.8 103.b lOb.b
119.5 117.9119.5 12b. b
131.0136.6136.8138.1
l lb .5 l lb .6 121.3 121.6
1 16 .b l i b . 3 115. b l i b . 8
119.1118.1 119.6 119.9
A p ril - - - - - - - - -
1
93.8 93.2 9U.X 96.3 87.7 9l*.0 101.7 93.9 96.5
4 / Not available*
Digitized for FRASER http://fraser.stlouisfed.org/ Federal Reserve Bank of St. Louis

Table C-2. Consumer Price Index—20 large c i t i e s : Indexes o f a l l items and major groups o f goods and se rv ice s , by year and month, 19^7-58—Continued
(19l*7-li9«100)
Yearand
month
A llitems
Food Housing Apparel Transportation
Medicalcare
Personalcare
Readingand
re cre a tion
Othergoods
andservices
Yearand
month
A llitems
Food Housing Apparel Transportat io n
Medicalcare
Personalcare
Readingand
recre ation
Othergoodsand
services
Cleveland, Ohio- -Continued D etroit, Michigan — Continued
1956: Average 119.0 109.9 121>.I) 106.3 125 .5 lM t.l 123.1) 116.9 122.9 19a9: Average 101.7 99.8 1 03 . a 98.6 107.5 103.0 100.5 100.2 io a .6February- 115 .7 106.6 122.5 105.0 122.3 139.3 122.8 11S.U 120.0 January— 102.2 100.2 103.9 102.2 106.3 101.2 101.6 100.2 io a .5May---------- 117.3 109.2 123.6 1 05 .7 122.8 ia 5 .5 123.7 n a .9 123.1 February- 101.7 93.8 ( 1 / ) 101.2 107.6 102.1 100.7 100.2 io a .5August-— 119.1 111.6 125.1 106.8 125.7 ia 6 .2 123.3 117.7 12a . ! March— — I d .8 99.1 ( V ) 101.0 107.5 102.7 101.1 100.2 io a .8November- 120.0 110.9 126.2 107.7 330.8 11)6.2 123.9 119.6 i2a .3 A p r il-— 102.0 100.1 103’.9 99.1 107.9 102.7 100.9 100.2 io a .5
May--------- 102.3 101.6 (1 / ) 98.6 107.9 102.7 io o .a 100.2 io a .51957: Average 122.1 H 3.i» 127.9 108.0 13U.2 11)9.5 126.2 120.6 126.0 June— — 102.5 102.3 (X /) 98.6 107.5 102.7 100 . a 100.2 io a .5
February- 120.ii 111.7 125.9 107 .5 332.1 11)7.2 125.1 120.6 i2 a .8 July--------- 101.6 100.5 107.9 97.3 107.5 102.7 100.2 100.2 io a .5May---------- 121.7 112.7 128 .5 107.7 332.1 11)9.3 126.0 120.2 1 2 5 .0 August— 101.3 100.2 ( 1 / ) 97.0 107.5 102.8 io o .a 100.2 io a .7August— 122.8 1 15 .9 127.7 107.9 131t.6 150.7 126.1 1 2 0 .5 127.0 September 101.6 100.3 107.3 97.a 107.5 103.9 100.2 100.2 io a .7November- 123.3 113.7 129.l| 109.0 138.3 150.8 127.6 120.9 127.2 October— 100.6 97.7 103.2 97.1 107.5 103.9 100.0 100.2 io a .7
November- 101.3 99.3 103.5 97.0 107.5 io a .2 99.9 100.2 io a .71958: Average 1211.8 117.2 130.6 108.9 136.6 153.1 127.6 12a .0 127 .a December- 100.9 93.2 103.7 96.a 107.6 io a .2 99.9 100.2 io a .7
February- 121).5 116.0 130.7 108.9 135.2 152.1) 129.1 126.5 127.3May---------- 1 25 .0 118.6 130.7 109.1 135.8 152.7 126.8 122.3 127.lt 1950: Average 103.a 103 . a 106.0 97.3 108.8 ioa .8 103.8 99 . a 106.3August— 1 25 .1 118.2 131.2 108.8 136.1i 152.8 126.7 122.8 127.5 January— 100.5 9 7 . a 103.9 96.1 107.6 io a .2 99.3 100.2 ioa .7November- 12l).5 116.1 130.0 108.9 138.5 153.5 127.8 125.0 127.a February- 1 00 . a 96.9 io a .2 95.9 107.7 io a .6 99.2 100.1 io a .7
March— — 100.8 97 .9 ioa .3 96.0 107.6 ioa .6 98.5 100.0 io a .7A o r il -— 101.1 99.0 io a .5 96.0 107.6 io a .6 98.5 100.0 io a .7II m v.. _ 102 0 100*9 xo a .i 96.2 1'39.5 xoa.6 98.3 100.1 1 0 5 .0D etro it , Michigan ri*Jr •June— — 102 A 103.0 i o a . i 96^1 109.9 ioa .8 loa ia 98.7 105 .2J u ly ------- 103.7 105.6 10ii.9 95.9 109.9 ioa .8 ioa .8 97 . a 1 0 5 .1
191*7: Average 9 5 .U 96.1 9U.3 99.6 90.7 96.6 97.5 99.9 93.1 August— io a .2 106.0 106.3 96.2 109.1 ioa .8 105 .3 97.5 io 7 .aJanuary— 90.9 89.6 ( V ) 93.0 83.1 93.9 95.0 99.9 86.9 September 1 05 .2 106.5 (1 / ) 98.3 109.3 io a .8 1 05 .6 93.9 1 0 8 .0February- 91.0 88.9 ( V ) 9U.U 88.5 95.0 95.5 99.9 86.9 October— 106.1 107.9 107.8 99.5 109.1 105 .2 108.9 99.2 108 .3March-— 93.1 92.9 (X /) 96.1* 89.1 95.5 96.5 99.9 86.9 November* 106.5 108 . a ( 1 / ) 100 . a 109.3 1 05 .5 110.8 9 9 . a 108.5A p ril------ 93.2 92.8 (T /) 96.6 89.5 96.0 96.9 99.9 86.9 December- 107 . a 110.3 (X /) 100.7 109.5 105 .7 111.3 101.8 108.8May— ------ 93.2 92.8 ( r / ) 96.U 89.5 96.a 96.1 99.9 86.9June-------- 9l*.l* 95.7 97.8 96.6 89.a 96.9 96.0 99.9 86.9 1951: Average 111.6 116.5 112.2 io a .5 113.6 109.3 113 .1 io a .2 110.0July------ -- 95.3 97.2 a / ) 96.9 89.6 96.9 96.9 9a.2 97.9 January— 109.1 113.6 110.6 102.1 109.5 105.7 112.8 102.9 109.2August— 96.8 99.3 £ / 97.8 90.9 96.9 97.2 99.9 93.7 February- 110.3 115.9 ( 1 / ) 103.7 109.5 105.7 113 .5 103.8 109 .aSeptember 97.7 100.3 <y> 99.0 92.a 97.9 97.0 99.9 99.7 March— — 110.8 116.2 an io a .o 110.9 106.7 1 33 .5 io a .9 109 . aOctober— 99.2 101.1 98.3 100 .5 92.a 97.9 101.0 99.9 99.7 A pril------ 110.6 n 5 .a 11T .8 1 03 .9 111.0 106.7 113.1 io a .9 1 09 . aNovember- 99.1 99.9 a / ) 101.2 93 . a 97.9 101.9 99.9 99.7 May---------- 111.0 u6.a (1/ ) 103.9 111.0 113 . a io a .9 109.9 109.9December- 100 .5 102.6 a/) 101.6 95.1 93.2 102.9 99.9 99.7 June------- 111 .6 116.5 ( r / ) ioa .3 113.1 110.7 113 . a io a .2 108.9
Ju ly-— - 111.7 1 16 . a 117.8 io a .o n a .o 111.1 U 3 .2 i o a . i 1 09 . a191*8: Average 103.0 10U.1 102.3 103.9 101.8 100 . a 102.0 99.9 102.3 August— 111.7 116.3 (1 /) ioa .3 n a .o 111.2 112.8 io a .5 109 . a
January— 101.5 10U.2 1 00 .6 101.li 95.2 9 9 .2 103.1 99.9 99.7 September 112.0 116.0 ( I / ) io 6 .a 1 15 .5 111.2 112.8 ioa.2 109 . aFebruary- 100.5 101.3 &/) 1 02 . a 95.3 9 9 .2 102.6 99.9 100.9 October— 111.7 117.1 117.9 io 6 .a 117 .0 111.5 112.8 i o a . i 1 0 9 . aMarch------- 100.li io o .a ( V ) 102.7 95.3 99.7 102.3 99.9 100.9 November- 113 . a 118.6 (1 /) 105 .7 118.8 111.5 112.7 io a .o 113.2A p ril— - 102.3 103.6 10T.1 103.8 300.1 100 .2 102 .a 99.9 100.9 December- 113.7 119.1 (X /) 105 .6 118.8 112.8 132.9 io a .o 113.2May---------- 103.1 105.6 (1 /) 103.a 100.2 100 .2 101.9 99.9 100.9June-------- 1 03 .9 107.3 a/) 103.5 101.2 100 .2 101 .5 99.9 100.9 1952: Average n a .3 118.1 n a .2 1 0 3 .6 121 .5 115.3 116.9 106 .2 119.7J u ly ------- ioa.7 108.3 107.8 103.0 103.7 100.2 101.2 99.9 100.7 January— 113.7 119.3 113.7 ioa .8 118.8 112.3 112.8 102.8 113.2August— lOli.8 106.7 (V) io a .9 105.7 100.8 101.7 99.9 io a .5 February- 113.0 u 6 .a ( ! / ) ica .5 118.9 112.3 112.8 103 .0 113.9September 10l*.i* 105.1: ( I / ) 105.2 106.3 101.2 101.8 99.9 io a .5 March— 113.0 116.2 (X/) i o a . i 119.8 n a .5 112.6 102 .9 117.6October— lOii.0 103.8 103.8 105.5 106.3 101.2 101.8 99.9 io a .5 A p ril------ 113.6 117 . a 117.8 io a .o 13 9.8 I ia .5 113.0 102 .7 120.8November- 103.1 101.5 ( 1 / ) 105 .2 106.3 101.2 I d .9 99.9 io a .5 May---------- 113.6 1 1 7 .6 ( V ) 1 03 .5 119.7 n a .6 119.5 102.8 120.8Deceiaber- 102.9 100.9 ( I /) 105.1 106.3 101.2 101.7 100.2 ioa .8 June—— - 113.9 113.9 (X/) ic3.a 119.8 115 .5 117.7 102.8 120.8
J / Not ava ilab le ,
Digitized for FRASER http://fraser.stlouisfed.org/ Federal Reserve Bank of St. Louis
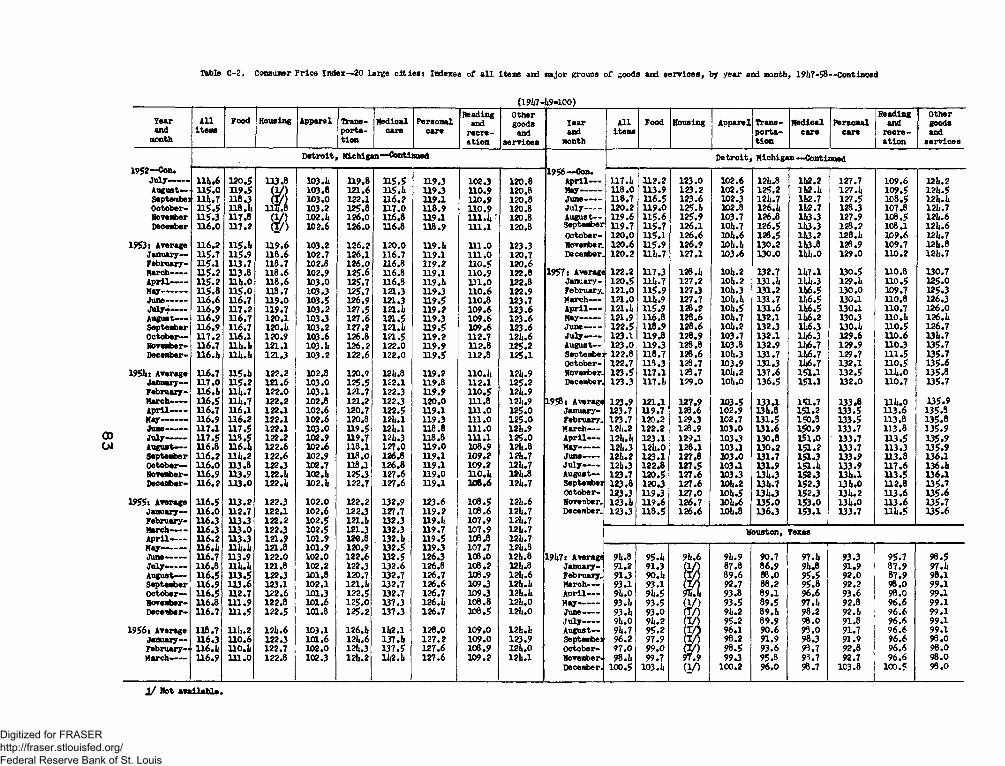
Table C-2. Consumer Price Index—20 large c i t ie s : Indexes of a l l items and major groups of goods and serv ice s , by year and month, 191*7-58—Continued
(191*7-1*9-100)
Tearand
month
A llitems
Food Housing Apparel Transportation
Medicalcare
Personalcare
Readingand
recre ation
Othergoods
andservices
Yearand
month
A llitems
Food Housing Apparel Transportat io n
Medicalcare
Personalcare
Readingand
recre ation
Othergoodsand
services
1952— Con*
D etroit Michigan— Continued D etroit,, Michigan— Continued1956— Con.
July— — lllt .6 120.5 113.8 M 3. Ii 1 1 9 .8 115.5 U 9 .3 102.3 120.8 A p ril— 117.1* 112.2 123.0 102.6 12i*.8 112.2 127.7 109.6 12U.2August— U 5 .0 119.5 (1 /) 103.8 121,6 U 5.I, 119.3 110.9 120.8 May-------- U 8 .0 113.9 123.2 102.5 125.2 112.1 127.1* 109.5 12U.5Septembei m . 7 n e .3 (T /) 103.0 122.1 116.2 119.1 110.9 120.8 June— 118.7 116.5 123.6 102.3 121*.7 112.7 127.5 108.5 121l.liOctober- n s . 5 U8.1( U f .8 103.2 125.8 117.0 118.9 110.9 120.8 July— , - 120.2 119.0 125.1* 102.8 126.1* 112.7 128.3 107.8 12li.7November 115.3 U 7 .8 ( V ) 102.1* 12 6 .0 116.8 119.1 111.1*' 120.8 August— 119.6 115.6 125.9 103.7 126.8 113.3 127.9 108.5 121i.6December 116*0 117.2 ( V ) 102.6 126.0 116.8 118.9 111.1 120.8 September 119.7 U 5 .7 126.1 10U.7 126.5 113.3 128.2 108.1 121,.6
October- 120.0 115.1 126.6 lOl,. 6 128.5 113.2 128.1* 109.6 m . r1953: Average 116*2 n s .I i 119.6 103.2 126.2 120.0 119.1* 111.0 123.3 November. 120.6 115.9 126.9 10l*.l* 130.2 113.8 128.9 109.7 12li.8
January— U 5 .7 115.9 118.6 102.7 126.1 116.7 119.1 111.0 120.7 December. 120.2 lll* .7 127.1 103.6 130.0 111.0 129.0 H O .2 121i.7February- 115.1 113.7 118.7 102.8 126.0 116.8 119.2 110.5 120.6March-— n s .2 113.8 118.6 102.9 125.6 116.8 119.1 110.9 122.8 1957: Average 122.2 117.3 128.1, 10l*.2 132.7 117.1 130.5 HO .8 130.7A p ril— — 115.2 n i i .o 118.6 103.0 125.7 116.8 119.li 111.0 122.8 January- 120.5 HI*.7 127.2 10lt.2 131.1* 111.3 129.1* H 0 .5 125.0May---------- n s . 8 1 1 5 .0 118.7 103.3 125.7 121.3 119.3 110.6 122.9 February. 121.0 115.9 127.3 10l*.3 131.2 116.5 130.0 109.7 125.3June--------- 116.6 116.7 119.0 103.5 126.9 121.3 119.5 110.8 123.7 March— 121.0 Hit.9 127.7 lOh.h 131.7 116.5 130.1 H 0 .8 126.3July*------- 116*9 117.2 119.7 103.2 127.5 121.1* 119.2 109.6 123.6 A p ril— 121.1, 115.9 128.2 iol*.5 131.6 116.5 130.1 110.7 126.0August— 116.9 116.7 120.1 103.3 127.6 1 2 1 .5 119.3 109.6 123.6 May--------- 121.9 116.8 128.6 10l*.7 132.1 116.2 130.3 H0.1* 126.liSeptember 116.9 116.7 120.1* 103.2 127.2 121.1* U 9 .5 109.6 123.6 June-— 122.5 118.9 1 2 8 .6 10l*.2 132.3 116.3 130.1* H 0 .5 176.7October— 117.2 116.1 120.9 103.6 126.8 121.5 119.2 112.7 12i*.6 July------ 123.1 H 9 .8 128.9 103.7 132.1 116.3 129.6 HO .6 13li.7November- 116.7 111*. 2* 121.1 103.1* 126.2 122.0 119.9 112.8 125.2 August— 123.0 119.3 128.8 103.8 132.9 116.7 129.9 HO .3 135.7December- 116.1* lll*.l* 121.3 103.2 122.6 122.0 119.5 112.8 125.1 Septembei ‘ 122.8 H 8 .7 128.6 10l*.3 131.7 116.7 129.7 111.5 135.7
October- 122.7 118.3 128.7 103.9 131.3 116.7 132.1 110.5 135.61951*: Average 116.7 115.1* 122.2 102.8 120.9 121* .8 119.2 110.li 12i*.9 November. 123.5 117.1 128.7 10li.2 137.6 151.1 132.5 l l l i .0 135.8
January— 117.0 115.2 121.6 103.0 125.5 122.1 119.8 112.1 125.2 December. 123.3 117.1i 129.0 10l*.0 136.5 151.1 132.0 110.7 135.7February- 116.1* n i* .7 122.0 103.1 121.7 122.3 119.9 110.5 12i*.9March------ 116.5 Ul*.7 122.2 102.8 121.2 122.3 120.0 111.8 12ii,9 195B: Average 123.9 121.1 127.9 103.5 133 A 151.7 133.8 U1».0 135.9A pril------ 116.7 116.1 122.1 102.6 120.7 122.5 119.1 111.0 125.0 January- 123.7 H 9 .7 128.6 102.9 13li.8 151.2 133.5 113.6 135.3May---------- 116.9 116.2 122.1 102.6 120.8 12l*.l 119.3 111.0 125.0 February. 123.7 120.2 129.3 102.7 131.5 150.8 133.5 113.8 135.8June-— - 117.1 117.5 122.1 103.0 119.5 12l*.l 118.8 111.0 12i*.9 March— 121*. 2 122.2 128.9 103.0 131.6 150.9 133.7 113.8 13S.9July—— 117.5 118.5 122.2 102.9 119.7 12i*.3 118.8 111.1 125.0 A p ril— 12U.1* 123.1 129.1 103.3 130.8 151.0 133.7 H 3 .5 135.9August— - 116.8 116.1* 122.6 102.6 118.1 127.0 119.0 108.9 12l*.8 May-------- 121*.3 12U.0 128.1 103.1 130.2 151.2 133.7 H 3 .3 135.9September 116.2 U l*.2 122.6 102.9 118.0 126.8 119.1 109.2 12l*.7 June------ 121*. 2 123.1 127,8 103.0 131.7 151.3 133.9 H 3 .8 136.1October— 116.0 113.8 122.3 102.7 118.1 126.8 119.1 109.2 12U.7 July------ 121*.3 122.8 127.5 103.1 131.9 151.1 133.9 H 7 .6 136.liNovenber- 116.9 113.9 122.1* 102.1* 125.3 127.6 119.0 llO.i* 121.8 August— 123.7 120.5 127.6 103.3 13lu3 152.3 13U.1 H 3 .5 136.1Deceober- 116.2 113.0 122.1* 102.1* 122.7 127.6 119.1 106.6 12i*.7 Septembei 123.8 120.3 127*6 10i*.2 1314.7 152.3 13i*.0 112.8 135.7
October- 123.3 H 9 .3 127.0 10U.5 Ul*.3 152.3 131*. 2 H 3 .6 135.61955* Average 116.5 113.2 122.3 102.0 122.2 132.9 123.6 108.5 12i*.6 Novenber. 123.1* 119.6 126.7 10l*.6 135.0 153.0 13i*.0 U 3 .6 135.7
January— 116.0 112.7 122.1 102.6 122.3 127.7 119.2 108.6 121*.7 December. 123.3 118.5 126.6 101*.8 136.3 153.1 133.7 11U.5 135.6February- 116.3 113.3 122.2 102.5 121.1* 132.3 119.1* 107.9 121*. 7March-— 116.3 113.0 122.3 102.5 121.3 132.3 119.7 107.9 12i*.7 Houston. TexasA pril------ 116.2 113.3 121.9 101.9 120.8 132.1* 119.5 103.8 121*.7May---------- 116.1* 111*.!* 121.8 101.9 120.9 132.5 119.3 107.7 12l*.8June— — 116.7 113.9 122.0 102.0 122.6 132.5 126.3 108 .0 12i*.8 191*7: Average 9!*.8 95.1* 9l*.6 9ll.9 90.7 97.1* 93.3 95.7 98.5July------- 116.8 n ii .i i 121.8 102.2 122.3 132.6 126.8 108.2 121* .8 January- 91.2 91.3 (1/) 87.8 86.9 9i*.8 91.9 87.9 97.1*August— 116.5 113.5 122.3 101.8 120.7 132.7 126.7 108.9 12l*.6 February. 91.3 90.1* (T / 89.6 88.0 95.5 92.0 87.9 98.1September 116.9 113.6 123.1 102.1 121.1* 132.7 126.6 109.3 12i*.i* March— 93.1 93.1 (I/) 92.7 88.2 95.8 92.2 98.0 99.1October— 116.5 112.7 122.6 101.3 122.5 132.7 126.7 109.3 121*. 1* A p ril— 9i*.0 91*.5 5TS.I: 93.8 89.1 96.6 93.6 98.0 99.1November- 116.8 111.9 122.8 101.6 12 5 .0 137.3 126.1* 108.8 12U.0 May-------- 93.1* 93.5 ( 1 / ) 93.5 89.5 97.1, 92.8 96.6 99.1Deeember- 116.7 111.5 122.5 101.8 125.2 137.3 126.7 108.5 12i*.0 June— - 93.1* 93.0 07) 9l*.2 89.14 98.2 92.1* 96.6 99.1
July------ 9l*.0 91*. 2 (I/) 95.2 89.9 98.0 91.8 96.6 99.119561 Arerage 118.7 11U.2 12l*.6 103.1 126.1* 11*2.1 128.0 109.0 12l*.l* August— 9i*.7 95.2 (T/j 96.1 90.6 98.0 91.7 96.6 99.1
January— 116.3 110.6 122.3 101.6 121*.6 137.1* 127.2 109.0 123.9 Septembei 96.2 97.9 ( I / ) 98.2 91.9 98.3 91.9 96.6 98.0February—• 116.1* 110.1* 122.7 102.0 12i*.3 137.5 127.6 106.9 12i*.0 October- 97.0 99.0 a n 98.5 93.6 98.7 92.8 96.6 98.0March-— 116.9 111.0 122.8 102.3 121*. 2 11*2.1* 127.6 109.2 12l*.l November- 98.1* 99.7 97.9 99.3 95.8 98.7 92.7 96.6 98.0
December. 100.5 103.1* (1 /) 100.2 96.0 98.7 103.8 100.5 98.0
1 / Not available,
Digitized for FRASER http://fraser.stlouisfed.org/ Federal Reserve Bank of St. Louis

Table C -2 . Consumer P r ice In d ex— 20 la rg e c i t i e s : Indexes of a l l item s and m ajor groups of goods and s e r v ic e s , by yea r and month, 191x7-58— Continued
(19l*7-l*9«100)
Tearand
month
A l litems
Food Housing A pparel Transp o r ta t io n
M edicalcare
Personalcare
Readingand
r e c r e a t io n
Othergoods
ands e r v ic e s
Yearand
month
A llitem s
Food Housing A pparel Transp o r ta t io n
M edica lca re
P ersonalcare
Readingand
r e c r e a t io n
O thergoodsand
s e r v ic e s
H ouston, Texas— Continued H ouston, Texas— Continued
19i|8: Average 102 .8 10li .3 101 .3 lO li.l 101.2* 100 .1 103.7 101.2* 99.1* 1952 : Average 115.1* 113.2* 119 .9 103 .9 122*.6 113 .0 119 .1 107 .8 11 7 .2January— 101.2* 105.0
S 39 9 .7 98.6 98 .9 10)4.5 100.5 9 8 .0 Jan uary-- 115.2* 112*.5 ( 1 / ) 110 .2 122.3 112 .1 119 .6 108 .3 l l i i . 6
F ebruary- 101 .2 103 .li IO I.I4 98 .9 99.3 103 .9 100 .5 9 8 .0 F ebruary- 112*.8 301 .9 119 .3 1 0 9 .6 123.8 112 .1 119 .3 1 08 .2 11 7 .2March------- 101 .0 1 0 2 .ti
( 1 $1 0 2 .9 93.9 100.3 103.ll 101.8 97.2* March— 111*.8 1 11 .9 ( 1 / ) 109 .7 123 .8 112 .1 118 .3 1 03 .2 117 .2
A p r i l -— 101 .9 io2*.o 103 .1 9 9 .0 99.7 103.7 101 .8 97.2* A p r i l ------- 1 15 .0 112.8 ( T / ) 1 0 9 .6 123 .8 112 .7 113 .9 107.7 117.8May----------- 101 .9 103.1* 105 .7 10U.1* 98 .9 100 .0 303 .0 101 .8 97.1* May----------- l ll* .8 111 .9 1 19 .1 109.2* 123 .8 112 .7 113 .8 107 .7 117.8June-— — 10 2 .6 10li.3 <J/> io u .3 9 9 .5 100 .1 102 .8 301.8 97.1* June— — 112*.9 11 2 .5 ( 1 / ) 109.3 1 2 3 .9 112 .7 118 .7 107 .9 1 1 7 .6Ju ly --------- 1 0 3 .li 105 .3 < £ /)
10Z .910!*.0 101 .5 100 .1 103 .2 101 .8 97.1* J u ly -— - 115 .2 113 .7 ( I / ) 108 .7 123 .9 112 .7 118 .7 108 .0 11 7 .6
A u gust-— 10lt.3 106 .1 105.ll 103.7 100 .3 103 .1 101 .1 1 00 .6 August— 115.8 115 .1 119 .8 108 .3 12 2*.0 112 .7 119 .2 107.2* 1 17 .6September 10li.li 1 0 6 .1 ( 1 / ) 10 6 .5 103 .8 100,3 102*.0 101 .1 102 .8 September -3 1 5 .5 l l l* .2 ( 1 / ) 108 .5 122*.2 112 .7 119.3 103 .2 1 17 .6O ctober— 102*.l 10li, 7 a/)
10 3 .51 06 .5 io i i .5 100.3 lO it .l 101 .1 1 0 2 .1 O ctober— 116 .1 113 .9 ( r / ) 108 .3 127 .3 112.8 119 .2 107 .5 11 7 .0
November- 103 .6 103 .2 106 .1 10I1.7 100 .7 102*. 2 101.8 102 .1 November- 116 .0 113 .7 12T .6 107 .7 127 .3 112.3 • 119 .2 1 07 .5 117 .2December- 103 .6 103.U ( I / ) 105.U lOlx.8 100.7 102*.1 101 .8 102 .1 December- 116 .7 l ilu l* ( 1 / ) 107 .5 127 .3 117 .5 119 .3 1 07 .5 117 .2
19lj9: Average 102 .5 100 .3 101|.l 1 00 .9 107 .8 102 .5 1 03 .0 102 .9 102 .1 1953: Average 116 .8 112 .3 1 2 2 .9 1 07 .2 12 6 .9 113 .3 119 .6 113 .5 118 .8January— 10 3 .0 102 .3
i s a103.5 10ii.9 101 .5 103 .8 101 .8 1 0 2 .1 February- 116 .1 1 1 1 .6 1 2 2 .0 107.2* 126 .7 117 .2 119.2* 112 .0 116 .9
F ebruary- 101 .6 9 8 .6 1 02 .1 106 .3 101 .5 103.5 10 1 .8 1 0 1 .1 May---------- 116 .8 111 .9 1 2 3 .2 107 .0 126 .7 118.2* 119 .5 112*.5 119.1*March— — 101 .7 99 .U ( V ) 102 .0 106 .2 101 .5 103 .0 101.8 100.2* August— 116 .8 112.8 1 2 2 .5 1 0 6 .6 127 .2 11 8 .5 119.2 113 .8 119 .3A p r i l -------May----------
102 .1101 .9
1 0 0 .81 0 0 .2 S i 10 2 .1
102 .1106.1*106.1*
102 .0102.3
1 02 .9103 .0
101.8101 .8
100.2*10 2 .2
November- 117.3 111 .9 122*.l 10 8 .1 126 .9 119 .2 120 .1 l l !* .9 119.2*
June--------- 10 1 .9 100.1* ( 1 / ) 101.1* 106 .1 103 .0 103 .3 101.8* 1 0 2 .2 1952*: Average 116 .7 112 .0 122*.0 106 .8 122*.9 119 .7 119 .7 U 0 .8 119 .3J u ly — — 101 .9 1 0 0 .0 (J/) 99.9 109.3 102 .9 103 .1 10l*.0 10 2 .2 February- 116 .9 1 1 2 .9 1 2 3 .6 1 0 6 .5 1 25 .5 119 .2 120 .3 1 1 2 .0 1 1 9 .6August----- 1 0 2 .0 100 .3 107 .8 9 8 .8 109.3 102 .8 102.7 102*.0 102 .9 May---------- 116 .7 112 .2 123 .8 106 .7 125 .2 119 .6 119.3 111 .0 1 1 9 ,5September 102.7 1 0 0 .6 103 .9 100 .2 109.1* 102.8 102.7 10i*.0 1 02 .9 August— 1 1 6 .5 112 .3 12 i* .l 107 .0 123 .1 1 19 .9 1 19 .5 103 .5 119.1O ctober—N oveaber-
1 0 3 .0103 .8
100 .7100 .9
105.1*108 .0
99 .99 9 .6
109 .5110 .1
102.8102 .6
102.8102 .9
302*.0 10 2*.0
102 .9102 .9
November- 136 .7 110 .3 122* .8 106 .9 125 .8 119 .9 119.7 133 .6 119 .1
December- 103 .8 99.8 1 0 9 .5 9 8 .9 110 .2 102*.l* 102 .9 102*.0 102 .9 1955: Average February-
1 15 .9115 .7
1 0 9 .9110 .2
123 .11 2 3 .0
1 06 .5106 .3
123.1*123 .7
12i*.31 2 0 .0
121 .811 9 .6
109 .3109 .7
119 .8118 .8
1950: Average 105.6 101 .7 1 12 .1 1 0 0 .0 112 .0 10l*.8 103.2* 102 .7 1 0 7 .2 May-------- -- 1 15 .5 110.7 1 2 2 .0 107 .1 121 .9 i?2*;5 119 .6 108 .2 1 1 9 .2January— 103.7 9 8 .5 110 .8 98.3 110 .5 10l*.2* 302 .0 102*.0 102 .9 August—1 1 1 5 .5 110 .1 122 .8 105 .7 12 1 .5 125.1 119 .3 108.7 1 1 3 .9February- M arch-—
103. k
103 .997 .799 .2
1 10 .71 10 .6
9 8 .19 8 .0
1 1 0 .6110 .6
102*.l* 102*. i*
301.2*101 .5
103 .9 103.1*
1 0 2 .9105 .9
November- 116 .7 108 .1 122*.5 106 .7 126 .2 127.1* 123 .2 110.3 122 .3
A p r i l ------- 103.1* 9 8 .0 110.1* 9 7 .9 110 .6 10l*.i* 101 .5 103.2* 105 .9 1956: Average 117.8 108 .8 1 2 6 .j 1 07 .8 1 2 6 .5 127 .7 129 .3 113 .6 1 2 3 .0May----------- 103 .5 97 .8 1 1 1 .0 9 7 .6 111.3 10t*.l* 101 .6 1 0 3 .5 1 0 6 .0 February- 1 1 6 .6 106 .7 1 2 5 .2 1 06 .9 125.1* 127 .7 1 28 .5 112.3 122.3June— — 103.8 98 .7 1 U .5 97.1* 111 .5 10t*.t* 3 p l.7 1 02 .0 105 .9 May---------- 116 .8 1C7.5 125 .8 106 .2 122*.2* 12 6 .5 12 8 .9 113 .2 1 2 2 .5J u ly --------- 102*.8 100 .9 1 1 2 .1 9 7 .6 111 .9 10U.7 101.8 100 .8 108 .9 August— 1 13 .2 110 .2 126 .3 108.1 1 26 .2 1 27 .9 13 0 .0 112 .3 123 .1August— September
106 .71 07 .6
105 .21 05 .9
112 .8< l/>
98 .9102 .7
112 .1112 .1
105 .1105 .2
102 .9103 .6
101 .0102 .2
109 .1109 .2
November- 119 .7 1 1 0 .6 127 .7 110 .1 129 .9 128 .6 129 .8 117 .1 1 2 3 .9
O ctober— 107 .7 105.1* 103 .3 112 .1 105 .2 103.7 302.1* 109 .3 1957: Average 123 .5 113 .1 129 .3 1 0 9 .9 1 3 5 .0 129.1* 132 .2 113 .8 1 2 6 .6November- 108 .1 105 .3 101*.2 112 .3 105.3 108.8 102 .8 109 .5 February- 12 0 .5 112 .1 1 2 8 .5 108 .8 1 32 .2 129 .8 131 .5 112*.7 121*.2December- 1 09 .9 1 0 7 .9 ( i / ) 105.1* 118 .9 1 0 5 .i* 109 .7 1D3.2 110 .3 May----------
August—121 .1122 .1
1 12 .2H 5 .3
129 .31 29 .0
109 .9109 .5
13li.li135 .6
129.2*1 29 .0
131 .01 33 .0
112 .9113 .9
125 .9128 .3
1951* Average January—
lll i .OU 2 .3
1 1 2 .6111 .9
1 1 8 .0(V)
110.1*108 .3
122 .1119 .2
10 7 .6105.!*
116 .5115.2*
106 .8 101* .9
111 .81 1 0 .6
November- 122.1* 1 1 2 .6 130 .3 i n .3 13 9 .0 129 .2 133.2* 133.2* 1 28 .1
F ebru ary- 112 .8 1 11 .7 11 3 .9 109 .2 120 .1 105 . t* 115 .9 1 05 .2 112.2* 1958: Average 123 .6 117 .0 1 3 0 .0 111.2* 137.1* 132.1* 132*.9 116 .2 123.2*March-------A p r i l -------
1 13 .6113 .7
1 13 .1 1 1 3 .0 JT 109 .8
1 10 .2121 .3121 .2
106.1*106.t*
116.2*116 .0
1 05 .21 0 5 .5
111 .1111 ,2
February-May— —
122.3123 .7
116 .31 17 .2
130.1*1 3 0 .1
1 1 1 .2* 111.2*
126 .9137 .6
132 .2131 .8
13 2*.7 13 5 .1
115 .811 5 .6
128.21 28 ,2
May----------- 113 .7 112.1* 110 .8 121 .2 106.2* 116 .2 3 05 .5 1 11 .2 August— 1211.0 117 .1 1 29 .8 1 11 .0 12*1.3 13 2 .2 132*.6 116.7 128.2*June---------J u ly — — August— September O ctober— November- Decembe r -
11 3 .6 113 .8 l l l i .O U l* .6 U l* .8 1 1 5 .2
| 115.8
111 .51 1 1 .511 2 .51 1 3 .51 12 .71 12 .8 lll* .l*
nil88117 .1S A .
111 .1110 .7110.51 1 1 .5 111 .3 1 10 .91 10 .6
121 .8121 .8121 .81 23 .2123 .3125 .2125 .2
106. 2*106.1*106.2*106.2*111.7111 .7 112.2*
116 .2 1 16 .0 115 .9 115 .6 117 .3 117.2* 119.2*
107.I*107.2*107 .7107 .5108.2*10 6 .2108 .2
110 .9 110 .71 10 .9 111 .1 1 11 .5 l ll* .8 111*.9
November- 12U.2 116 .5 129 .3 111 .6 11*2.3 133 .5 135.2* 116.7 1 28 .9
1 / Not a v a i la b le .
Digitized for FRASER http://fraser.stlouisfed.org/ Federal Reserve Bank of St. Louis

Table C -2 . Consumer P r ice Index— 20 la rg e c it ie s * Indexes o f a l l item s and major groups o f goods and s e r v ic e s , by y ea r and month, 191*7-58— Continued
(191*7-1*9*100)
Yearand
month
A l litem s
Food Housing Apparel Transp o rta t io n
M edicalcare
Personalca re
Readingand
r e c r e a t io n
O thergoods
ands e r v ic e s
Yearand
month
A llitem s
Food Housing A pparel Transp o r ta t io n
M edica lca re
Personalcare
Readingand
r e c r e a t io n
O thergoodsand
s e r v ic e s
Kansas C ity , M issou ri Kansas C ity , M issouri— Continued
191*7: Average 9 5 .2 96 .8 9li.7 95.7 91.3 9*i.3 92.8 9 6 .0 9 9 .0 1955: Average 315 .7 106 .8 1 2 1 .5 103 .0 125.1* 136 .3 119 .3 115 .1 117 .1January— 9 1 .9 91 .7 9 3 .1 9 0 .9 88 .7 9 2 .1 9 2 .0 95 .5 100 .3 January— 115.3 10 6 .9 120 .7 102 .7 125 .8 13 6 .0 116 .5 115 .2 117 .1F ebruary- 9 2 ,5 92 .3 0 7 ) 93.3 88.8 93 .0 92 .7 95 .li 100.3 A p r i l - — 115 .2 1 07 .0 121 .3 102 .3 123 .5 136 .2 116 .2 11U.6 1 1 7 .0 ,M arch-— 93 .9 95 .3 < 5 0 9lt.3 88.8 93 .7 92 .7 95 .li 100 .3 J u ly — '— 115 .9 1C7.7 121.8 1 0 2 .0 1 2 5 .5 136 . *i 121 .U U 5 .6 1 16 .5A p r i l ------- 9 lu 0 9 5 .5 ( J O 9 3 .9 90 .0 93 .8 93.1* 95 .il 96 .8 O ctober— 1 16 .2 107 .1 1 2 2 .0 10U.7 127.1 13 6 .5 121 .3 115 .0 116 .6May— ------- 93.7 9JU.5 ( J O 93 .9 90 .0 93 .8 92 .7 95.1* 96 .8June--------- 93 .1 9 t i .l ( T / ) 93 .3 90 .2 91*.1 9 2 .6 95.1* 99.1* 1956: Average 1 1 7 .5 108 .1 122 .6 10U.0 1 2 7 .U llt l .8 123 .5 11 6 .9 121 .9J u ly --------- 9 3 .7 9U.8 9 3 .6 9 3 .0 90 .5 93 .8 92 .1 95.1* 99.1i January— U 5 .5 10l*.9 121 .8 103 .6 12U.9 13 6 .5 122 .5 115 .2 121 .1O ctober— 98 J 101 .2 9 7 .0 100.1 9 3 .5 95 .2 92.1: 95 .5 9 9 .1 A p r i l - — 116.1* 105 .9 12 2 .6 103 .3 127 .6 138 .1 1 23 .5 11U.6 1 2 1 .6
J u ly - ------ 1 17 .6 111 .0 122 .7 103 .7 122 .6 138 .3 123 .7 11 8 .0 1 22 .0191*8* Average 1 0 2 .9 10i*.J* M l . 5 103.8 101 .2 101 .6 103 .7 101 .9 9 8 .9 O c t o b e r - 1 18 .9 10 9 .9 1 22 .6 1C 5 .1 130 .9 lli9 .8 12U.0 118 .8 1 2 2 .2
January— 101 .2 10ii.2 9 9 .li 102.3 9 7 .6 93.3 95 .il 101 .6 9 8 .5A p r i l ------- 101 .7 1 0 3 .5 100 .1 103 .7 98.1 101.li 1 0 5 .5 103 .1 9 7 .2 1957: Average 121 .1 11 1 .5 121*. 2 10U.U 138 .0 15 1 .0 12 5 .6 123 .9 1 2 5 .0J u ly --------- 103 .7 106.8 101 .8 102 .9 100.1* 101.8 10 5 .1 1 0 1 .6 9 7 .9 January— 119.8 1 0 9 .0 123 .9 10 5 .1 1 36 .1 11(9.8 123 .8 118 .2 1 2 2 .9O ctober— io i i .5 105 .1 103 .1 106 .0 1C5.9 103.3 1 0 5 .5 101 .6 1 0 1 .0 A p r i l - — 120.1* 109 .7 12l*.3 103 .9 1 3 7 .U 150 .2 125 .1 12U.3 12 3 .5
J u ly --------- 12 1 .7 l l l u l 1211.2 103 .5 138 .1 ISO .5 125.U 123.8 1 26 .1191*9: Average 101.9 98 .7 103 .9 100 .5 107 .5 lOli.O 10 3 .6 102 .1 1 0 2 .0 O c t o b e r - 121 .8 1 1 2 .2 12U.1* 105 .7 138 .8 lS 2 .ll 126 .5 125 .2 126.U
January— 103 .1 101 .7 103 .9 1 0 3 .? 105 .9 103.3 10li.9 101.5 101.8A p r i l ------- 102 .2 99 .2 103 .5 102 .0 107 .9 103 .5 10li.3 102 .2 1 0 2 .1 1958: Average 12U.1 11U.U 125.3 10U.6 1U6.0 162 .7 128 .9 1 2 9 .0 12 5 .5July--------- 1 0 1 .6 98 .5 103 .7 99.8 106 .9 10l*.3 1 03 .5 10 2 .2 102 .1 January— 122.1* 113.8 123 .9 1 0 3 .6 1U0.3 152.8 12 8 .2 131 .1 12 6 .5O ctober— 101.1 97 .2 10U.0 98.3 108.3 10l*.6 1 0 2 .6 102 .2 1 02 .1 A p r i l ------ 123 .7 115 .5 125 .7 10U.7 1U2.0 153 .0 1 28 .2 131 .1 125 .9
J u ly -------- 12l*.8 11U.9 125 .6 10U.0 11*8.5 169 .7 12 9 .1 127.U 125.U1950* Average 103.1* 99 .9 10 7 .0 100 .6 110 .0 106.2 103 .9 1 01 .6 1 03 .2 O ctober— 12U.9 1 1 3 .6 1 2 5 .6 106 .0 150 .7 169 .8 128.8 1 2 7 .0 12U.8
January— 100 .9 9 6 .0 10l*.9 98.1* 108 .6 lo l* .5 101 .8 102 .2 302.1A p r i l ------- 101.1* 96 .5 105 .8 98 .5 108 .6 105.1 101 .3 102 .0 102 .1J u ly - ------- 103 .7 1 01 .9 10 6 .9 98 .8 111 .6 105.3 1 0 2 .0 9 9 .5 1 0 2 .6O ctober— 1 09 .0 1 02 .6 108.1* 103 .7 109.7 108.1* 1 0 5 .6 100 .8 10l*.6 LOo Ail(6Xco| u a i u o n u i
1951: Average 111 .2 111 .3 112 .8 109 .3 115 .9 111 .0 116 .8 108 .7 107.1* 191-7: Average 9 5 .5 96 .6 9U.7 96 .5 91 .5 95 .1 99.8 9U.8 96 .5January— 109.1 1 0 9 .0 110 .7 107 .1 112 .5 109 .2 1 1 6 .6 107 .9 1 0 6 .6 January— 93 .1 9i*.5 92.9 9 2 .6 8 8 .U 9U.1 9 9 .7 92.3 95.3A p r i l ------- 110 .9 111 .0 112 .3 109.8 lll* .7 110.1 1 1 7 .0 108. 1* 107 .3 February- 9 3 .5 91*. 1* ( 1 / ) 93 .9 89 .2 9U.U 100 .0 9 2 .3 96 .3J u ly -— - 11 1 .6 111 .7 11 3 .3 109.7 115 .7 110 .8 1 1 7 .0 109 .6 107 .7 March------ 9 i* .l 95 .1 ( T / ) 95.8 89 .ii 9U.7 99 .9 92 .3 96.3O ctober— 11 2 .0 111 .8 1 1 3 .6 110 .3 118 .2 112.3 116 .7 107.3 106 .8 A p r i l ------ 91*.5 95 .2 (V) 9 6 .3 9 0 .U 9U.8 100 .8 92 .3 96.3
May---------- 9l».6 95 .7 an 96.3 8 9 .9 9U.5 99 .7 9 6 .1 96 .31952: Average l l i i . 5 1 13 .2 115 .2 107 .5 127.2 116.7 115 .7 309.1* 113.1* June— — 9 3 .9 9i*.3 ( V ) 9 5 .1 8 9 .9 9U.6 99.7 9 6 .1 98 .7
January— 113 .2 1 1 3 .9 l l l u l 108.3 119 .6 113 .5 116 .3 112 .8 1 1 0 .5 J u ly -------- 9li.li 9i*.3 5H.8 95.3 9 2 .0 9U.7 9 9 .0 96 .1 96 .3A p r i l ------- 1 13 .9 112.1 1 15 .0 108.li 127 .0 lll* .3 116 .3 107 .9 113.1* August— 9i*.8 9 5 .0 ( V ) 95 .8 9 2 .6 9U.7 98 .9 9 6 .1 96 .3J u ly --------- 115 .3 115 .1 1 1 5 .5 107 .6 128.1* 118 .5 1 15 .5 108 .5 l l i* .0 September 9 7 .1 99 .3 ( V ) 98 .2 9 3 .6 95 .2 99 .7 96 .1 96 .3O c t o b e r - U 5 .2 lli* .l* 1 1 5 .5 106.3 130 .2 118 .6 115 .3 109 .7 l l l i .O O ctober— 96 .9 98 .2 ( V ) 9 8 .9 9U.0 9 6 .5 9 9 .5 9 6 .1 96 .3
Novenfcer- 98 .7 100 .5 9ff.2 98 .9 9U.3 9 6 .5 100 .0 96 .1 96 .31953: Average 115 .0 n o . 5 1 1 7 .6 105.1* 130 .0 119.1* U 5 . 5 112 .1 11 7 .9 December- 99 .8 102 .7 ( 1 / ) 1C0.U 9U.3 96 .5 100.U 96.1 9 6 .9
January— lll* .3 110 .2 116.1* 106 .1 130 .6 119.1 111*. 9 109.1* 115 .5A p r i l ------- 11U.3 109.3 1 17 .0 105 .1 130 .0 119.3 l l l* .7 n o . o 119 .3 191*8: Average 102.1* 103.1* 101 .3 10U.5 101 .3 1 0 0 .6 1 00 .5 99 .3 100 .0Ju ly— — 115.3 111 .9 117 .7 105 .6 130 .5 U9.1* 116 .0 1 09 .5 118 .0 January— 100 .8 103 .2 ( 1 / ) 1 01 .9 9 8 .0 97 .0 100 .5 97.3 9 6 .9O c t o b e r - 115 .7 111 .1 1 18 .5 1C5.3 1 30 .6 119 .6 U 5 .9 116 .9 1 18 .2 February- 101 .1 1 0 2 .6 100 .1 10U.5 98 .1 9 7 .1 1 00 .8 9 7 .1 96 .9
March------ 100.8 1C1.6 ( 1 / ) 10U.2 98.3 97.3 1 00 .6 97 .7 9 6 .91951*: Average U 5 . 5 108 .9 119.1* 10l*.0 126.3 133 .2 11 6 .2 l l l* .9 117.li A p r i l - — 101 .9 10i*.0 ( T /) 10U.0 9 8 .6 99 .6 100 .9 97 .7 96 .9
January— 1 15 .0 10 9 .9 119 .0 10i*.7 125.9 120 .1 116 .3 116.8 1 1 7 .6 M ay-.......... 101 .9 103.1* 103 .9 105.1 98 .1 99 .5 100.8 97 .7 9 6 .9A p r i l— — 115 .5 109 .0 118 .3 1C3.8 129 .8 135.1* 1 15 .6 113.1* 1 17 .5 Jun e-— • 101 .7 103 .2 (V) 1C5.3 98 .1 99.7 100. U 97 .7 9 6 .9J u ly -— - U 5 .6 109 .9 119 .1 103 .6 125.1* 136 .0 116 .2 lll* .8 117 .3 J u ly —— — 10 2 .6 1 0 3 .6 an 105 .0 102 .6 102.3 1 00 .2 97 .7 97 .3O ctober— 1115.7 108 .5 12 0 .6 10l*.6 12U.0 136 .0 1 16 .6 1 15 .2 117 .3 August— 103.1 10 3 .5 102 .3 10U.6 10U.3 102.3 100.5 97 .7 10U.1
September 103.1 1 03 .2 an 10U.U 10U.6 1C3.0 10 0 .5 9 7 .7 10U.1O ctober— 1 0 3 .6 103 .6 an 10U.8 lO h .6 103 .2 100 .5 10U.6 1DU.1November- 103.0 103 .9 lO j.U 10U.9 10U.6 103 .2 100 .3 10U.6 10U.UDec ember- 10U.2 loU .5 a/) 10U.6 1 0 5 .5 103 .3 10 0 .5 10U.6 10U.1
1 / Not a v a ila b le .
Digitized for FRASER http://fraser.stlouisfed.org/ Federal Reserve Bank of St. Louis

Table C -2 . Consumer P r ice In d ex— 20 la rg e c i t i e s j Indexes o f a l l item s and m ajor groups o f goods and s e r v ic e s , by yea r and month, 19li7-58— Continued
(I9l*7-it9-100)
Tearand
month
A l litem s
Food Housing A pparel Transp o r ta t io n
M edicalcare
Personalcare
Readingand
r e c r e a t io n
Othergoods
andse r v ic e s
Tearand
month
A llitem s
Food Housing A pparel Transp o r ta t io n
M edica lca re
P ersonalcare
Readingand
r e c r e a t io n
Othergoodsand
s e r v ic e s
Los A n ge les , C a li fo rn ia —•Continued Los A n geles , C a li fo r n ia — Continued
191*9 s Average 102 .1 1 0 0 .1 lOii.O 99 .1 107 .2 10lt.3 99.7 105.8. 103 .6 1953: Average 115 .7 113 .1 123 .5 1 0 3 .9 126.8 H 9 .9 H 7 .8 103 .6 H 3 .8January— 101*. 2 10U.8 (V ) 103 .1 105 .5 XOli.3 100 .0 lO li.6 lO li.l January— H 5 .i i H i i . l 1 2 2 .2 10lt.6 125 .8 H 8 .5 117-9 10h.9 111 .7February- 1 0 3 .5 102 .5 101 .5 101 .9 107 .3 10lt.3 99 .6 lo l l . 6 lO l j. l February- l l i i . 9 112 .lt 12 2 .2 10li.il 125 .7 1 1 8 .5 117 .8 10U.5 H 1 .6M arch-— 103.lt 102 .7 ( 1 / ) 100 .9 107 .1 lO lt .l 99.3 10ii.6 lO ii.l M arch -— H 5 .i i H 3 .2 1 22 .5 io lt .0 127.it 118 .3 1 1 8 .0 lOlt.5 113 .6A p r i l ------- 10 3 .5 103 .2 a n 300 .2 107.li lo i l . l 99 .6 105.8 lO li.l A p r i l----- H 5 .6 112 .8 1 2 3 .5 1 03 .5 127 .2 H 9 .7 H 7 .9 10li.5 U l t . lMay----------- 102 .6 101 .5 10T.lt 9 9 .6 107.li lO il.l 9 9 . h 105 .8 lO li.l May-------- H 5 .3 H 2 .2 123 .3 103 .6 126 .8 199 .8 117 .8 io ii.0 H 3 .9June— — 102 .1 100.5 ( 1 / ) 9 8 .9 107 .2 l o i l . l 9 9 . 6 106 J i lO li.l June— — 115.U H 2 .3 123 .5 103 .2 126 .8 119 .9 117 .5 103 .7 H 3 .9J u ly -------- 101.3 98 .ii
i S S98 .l4 107 .3 lOli. 3 99.lt 106.lt 1 02 .6 J u ly — — H 5 .8 112 .8 12lt.O 1 03 .6 128 .1 120 .1 H 7 .7 1 02 .5 H 3 .7
August— 101 .1 98 .1 9 7 . 7 107.3 101t.3 98 .9 106.it 1 0 3 .ii August— H 5 .8 H 3 .3 123 .7 102 .9 12 8 .2 120 .2 1 17 .6 102 .1 U 3 .7September 101.3 9 8 .6 lOii.O 9 7 . 3 107 .5 iolt.5 9 5 . 0 106.lt 1 0 3 .6 September H 6 .2 U 3 .8 12li.O 10it.2 127 .6 120. 1i U 7 .8 103 .3 H li .i iO ctober— 101.0 9 7 .6 iolt.5 9 7 .1 107 .5 io it .5 100 .5 106 .ii 103 .6 O ctob er— 116 .3 1 13 .8 1 2 l i .l lO l i . l 127 .7 l a . o H 7 .9 103 .8 H ii .6November- 101.1 9 7 .5 10U.9 9 7 .2 107 .6 iolt.5 100 .5 106.lt 103.6 November- 116 .1 H 2 .7 12ii.7 lOii.O 127 .5 121.1 H 7 .9 103.0 l l i i .8December- 100.ii 9 5 . 9 105 .1 9 7 .0 107 .5 lo ll .6 100.3 106 .lt 1 0 2 .2 December- 115 .8 1 1 3 . It 12ii.7 10U.2 123 .ii 121.2 H 7 .9 102 .8 115 .8
1950: Average 102 .8 100.0 108 .3 96 .7 106 .0 106.ii 101 .9 10 5 .7 103 .0 I9$iii Average H 5 .6 H 2 .7 12ii.3 10ii.2 125 .5 122. >4 H 7 .i l 99 .9 U $ .0January— 101.ii 9 8 .0 1 0 5 .5 9 7 .0 107.6 10it.6 99 .0 106 . Ii 102.2 January— 116 .8 l l i i . 2 12li.6 103.8 129 .1 121.1 118.1 103 .5 H 6 .5February- 101.0 9 6 .7 106 .1 9 7 .9 106 .9 10lt.7 98.8 106 .2 102.0 February- H 6 .6 l i l t .3 12U.3 10U.2 128.ii 121.1 H 7 .9 101.6 115 . »4March— 101.2 9 7 .0 106 .ii 9 8 .5 106.0 10lt.7 9 8 .7 106.1 101.8 Ilarch------ 116.2 113 .ii 12U.3 10ii.3 127 .7 121.3 117 .9 102.0 U 5.2A p r i l— — May— —
101.11101.11
96 .19 7 .9
. 107 .0 107 .5
98 .397 .8
1011.91011.9
lO lu7 lO ii.9
98 .798.6
1 0 6 .d106.0
101.6100 .3
A p r i l— -May----------
115 .7 H 5 .9
1 13 .1 1 1 3 .it
123 .3123 .9
103.8103 .7
127.3127 .ii
1 2 2 .5122.6
116 .6117 .3
100 .599 .2
115.2115.2
June-------- 101.3 98 .1 107.3 97.7 10li.9 10li.9 98 .6 lO li.? 100.il June------- H 5 .7 U 3 .1 1 2 lt.l lO ii.2 125.8 122.6 U 6 .9 99 .8 115.2J u ly -------- 101.8 99.1i 1 07 .6 97.7 105.0 10li.9 98.li 103.0 100.6 J u ly - ------ U li .9 H 2 .3 12ii.it 103 .9 121.0 122.9 H 7 .1 9 9 .5 H ii .8August— 1 03 .0 1 0 1 .5 108 .6 97 .8 105.7 lOli .8 101.0 l o u . 5 io li.6 August— H 5 .1 112 .3 12it .7 103.6 122.3 122 .9 H 7 .2 99 .6 l l i t .8September 103 .7 301 .1
(V )u r .6
98.8 106 .1 108.$ 103.8 105 .7 105 .1 Septembex U 5 .i i 112.3 12li.7 10U.8 123 .1 122 .9 U ? .5 9 9 .1 U li .5O ctober— 10U.6 102.6 9 9 . 7 106 .5 109 .0 105 .9 106 .3 io 5 .l i O ctob er— H ii .8 H 2 .0 12U.3 10ii.8 120.8 122 .9 117 .5 99.3 l l i i .ONovember- 105.il 103.2 100.8 106 .9 109.3 110.1 106 .9 105.8 Nbvember- H 5 .0 H O .9 12li.O 10ii.7 126.3 122 .9 H 7 .1 97 .3 l l i i .3December- 106.8 106.0 ( i / ) 101 .7 107.2 111.6 110 .9 1 07 .5 106.0 December- 115 .3 HO .7 125 .1 10U.7 126.it 122 .9 H 7 .1 96 .9 l l i i .3
1951: Average 111 .5 112.8 1 1 7 .6 107 .1 110.7 H 2 .9 H 2 .lt 107.0 107 .5 1955: Average H 5 .6 H I . 8 125 .7 103 .9 12it.7 123.3 117.8 96.8 115 .3January— 106.$ 110.1 (1/ ) 102 .7 107 .5 111.7 H 2 .5 10 9 .5 106.3 January— H 5 .i i H 1 .2 125 .il 103 .7 126 .3 122.8 2 1 7 . 6 96.8 l l i i .3February- 110.2 H O .ii U 5 .6 305 .7 109 .9 111.7 H 2 .5 109 .3 106.8 February- H it .7 111 .1 122 .7 103 .9 126.3 122.8 1 1 3 .! 9 7 .6 H i i . lMarch------ 111.1 111.8 ( ! / ) 1 0 7 .9 109 .9 U 3 .0 H 2 .5 109 .3 10 7 .0 M arch-— 1 15 .1 H 2 .0 122.8 103 .ii 1 2 7 .6 . 122.8 H 7.1 i 9 7 .2 l l i i . 5A p r i l ------May— ------
111.1111 .5
H I . 3 H 2 .3 A V I
1 07 .9 1 0 8 .Ii
109 .9HO.O
H 3 .0113 .0
H 2 .5H 2 .5
H O.O106 .7
107 .1106 .9
A p r i l— - May-..........
l i l t . 5 115 . It
H 3 .0112.1
122 .3125 .5
103.lt103 .7
122 .312it.O
121.11121.11
H 7 .3117 .2
97 .396 .9
H li .3l l i i . 6
June— — l l l . l i H 2 .3 (V ) 108.2 110.0 H 3 .0 H 2 .6 105.0 106 .7 June— — 115 .3 i n . l i 126 .5 103 .>4 122 .7 1 21 .5 H 7 .i i 98.3 l l i i .8J u ly -------- 111 .7 H 3 .2 a n 108 .1 HO .3 H 3 .1 H 2 .5 10ii.7 107 .1 J u ly -------- H 5 .9 H 2 .2 12 7 .0 103 .7 122.8 12li.3 U 7 .8 96.2 H 6 .0August— 111.7 113.0 115 .7 107.8 110 .3 113.1 U 2 .5 103*1 107 .1 August— 11 5 .5 H 0 .7 127 .2 1 03 .6 122 .7 12U.3 U 7.6 9 6 .li H 6 .1Septembex 112.0 1 1 3 .5
w
108.2 n i . i i 113.U H 2 .1 1 0 2 .5 106.6 Septembex H 6 .1 112.1 127.1i 10U.6 123 .2 12iu3 1 18 .0 9 5 .9 H 6 .2O ctober— 112.ii H l i . l 1 0 7 .6 H 2 .it U 3 .lt H 2 .0 305 .3 107 .3 O ctob er— 116.3 U 2 .l t 127 .3 1014.6 12U.5 12it.5 H 8 .5 96.2 116.2November- 113 .5 H 5 .3 11^.3 106.6 H 3 .9 H 3 .it H 2 .2 109 .6 H 0 .5 November* U 6 .3 U I . I 4 126 .9 101i .2 127 .2 12ii.5 H 8 .2 96 .3 1 16 .2December- 113 .9 117 .1 (1/ ) 106 .0 H 3 .9 H 3 .2 2 1 2 . 2 109 .ii HO .3 December- H 6 .3 H 2 .1 126 .7 10ii.ii 126 .3 125 .2 H 8 .1 96 .2 H 6 .2
1952 : Average nii.7 l l i i . 5 120 .2 105.8 121 .8 H 6 .7 H i i . l 1 08 .7 1 H .8 1956: Average H 7 .i i 1 1 3 .5 1 2 7 .It 105 .9 126 .8 127 .1 11 9 .6 96.8 1 1 8 .0January— 113 .7 H 6 .i i ( 1 / ) 105.ii 113.8 lllt .O 112 .2 H 0 .9 H 0 .3 January— H 6 .0 H i . 5 126 .3 10it.2 125 .ii 126 .li H 8 .8 9 6 .li H 6 .2February- U li .1 113 .9 2 1 7 . 7 10 6 .5 120 .2 U it.O H 2 .1 1 10 .2 H O .9 February. H 5 .8 l l l . l i 1 26 .2 10ii.7 12it.6 126.!t U9.1* 9 5 .0 116 .1M arch— — l l l i . 2 l l i i . l 1 0 7 .2 120 .2 H lt .5 112 .1 U 0.1 H 2 .0 March— H 6 .1 1 1 1 .5 126 .5 105.0 125.1l 126 .ii 119 .6 9 5 .8 H 6 .1A p r i l ------ n i i . 6 H 5 .3 1 06 .9 120 .2 H it .5 H 3 .2 109 .7 112 .3 A p r i l - — H 6 .3 1 1 2 .7 126 .7 10it.8 123 .8 126 .6 U 9 .6 9 6 .6 116 .2M ay--------- n i i . 5 H ii .6 2 1 7 . 7 106 .5 121 .1 l l i i .5 113.2 109 . it H 2 .3 May---------- H 6 .9 H 3 .0 12 6 .9 106 .1 1 25 .6 126 .8 119 .6 9 6 .6 H 6 .3June— — l l i i .8 l l i i .5 ( 1 / ) 1 0 6 .0 121.1 118 .3 1 13 .2 113 .3 H 2 .3 June— — 117 .il H U .2 127 .2 105 .8 125 .5 126 .8 H 9 .it 9 7 .0 H 8 .2J u ly -------- 11 5 .0 l l i i .6
i g i(1/ )
105 .7 1 2 3 .6 H 8 .i i H 3 .2 1 0 9 .0 H 2 .3 J u ly -------- H 8 .1 H lt .8 1 27 .5 106 .3 1 28 .1 127 .2 1 1 9 .0 9 7 .6 H 8 .2August— l l i i .9 H ii .l i 10li .8 123.6 H 8 .i i H 3 .2 1 0 9 .0 H 2 .0 August— H 7 .i i H 3 .it 127 .7 105 .ii 126 .2 127 .3 H 9 .3 9 7 .5 H 3 .i iSeptembex 115 .0 H i i . l 305 .1 123.8 H 8 .5 1 13 .2 1 0 9 .6 H 1 .7 September H 7 .8 1 13 .7 1 27 .9 107 .2 126 .3 1 27 .7 119 .3 9 7 .1 11 9 .8O ctober— l l i i .8 113 .7 (I / ) 10U.7 123 .9 H 8 .5 H 8 .X 107 .7 H I . 7 O ctober— H 8 .5 H ii .6 1 2 8 .1 1 07 .1 129 .3 1 28 .0 120 .1 9 7 .2 1 2 0 .0November- 11 5 .1 l l i i .3 1 2 . 6 10$ .2 125 .0 118 .5 118 .0 102 .1 H I . 7 November- H 9 .1 H 5 .6 1 28 .5 107 .0 1 3 0 .5 128 .0 120 .2 97 .2 1 2 0 .1Decerioer* 115 .3 U li .5 ( V ? - 105 .2 125 .0 118 .5 H 8 .0 1 0 3 .6 1 H .7 December. H 9 .it 11 6 .0 128 .7 107 .2 130 .7 1 27 .8 120 .ii 9 7 .6 120 .6
J / Not a va ila b le .
Digitized for FRASER http://fraser.stlouisfed.org/ Federal Reserve Bank of St. Louis

Table C -2 . Consumer P r ice In dex—20 la rg e c it i e s * Indexes o f a l l item s and major groups o f goods and s e r v ic e s , by yea r and month, 19U7-58— Continued
(191*7-U9«100)
?arand
month
A l litem s
Food Housing Apparel Transp o r ta t io n
M edicalcare
P ersonalcare
Readingand
r e c r e a t io n
Othergoods
ands e r v ic e s
Yearand
month
A llitem s
Food Housing j A pparel Transp o r ta t io n
M edica lca re
Personalcare
Readingand
r e c r e a t io n
O thergoodsand
s e r v ic e s
Los A n geles, C a lifo rn ia — Continued M in n eap o lis , M innesota— Continued
1957: Average 121 .2 1 17 .9 130.5 107 .7 132 .0 130.5 128 .8 101 .2 122 .3 1950* Average 1 03 .2 1 00 .9 1 06 .2 9 8 .0 109 .2 1 0 9 .0 101 .6 105 .9 1U . 3January— 1 1 9 .6 116.1* 128 .7 106 .7 130.14 129.5 12l*.0 99.6 1 2 0 .5 M arch------ 101 .1 96 .8 10l*.7 9 6 .7 1 08 .5 107 .3 99.3 105 .5 1 09 .9F ebru ary- 120 .3 U 6 .9 128 .9 106 .9 132 .5 129 .5 127.5 99J> 121 .0 Ju n e------- 1 02 .1 100.1* 105 .2 9 6 .6 1 07 .6 1 0 7 .5 9 9 .0 101*.l 1 0 9 .8March------- 120.1* 11 6 .7 129 .5 107.ii 132.it 129 .5 128 .it 99 .8 121 .1 Septenber 10!* .3 1 0 2 .9 106 .8 9 3 .0 110.1 110.5 99 .6 108 .7 112 .9A p r i l ------- 12 0 .6 ‘ 116 .9 129 .5 107 .il 13 2 .6 130 .0 1 28 .9 100 .7 121 .2 December- 107 .3 1 0 6 .9 109 .8 1 02 .9 n o . ! * 112 .1 112.3 105 .3 11 3 .5May— — - 120 .8 11 6 .9 1 29 .7 107 .6 133.1* 130 .0 1 29 .0 100 .il 121.!*June— — 1 2 1 .0 117 .7 129 .9 107.1* 132 .7 130.3 129 .1 100 .il 121 .2 1951: Average 110 .8 112 .9 111 .7 107 .5 110.9 113 .1 115 .0 107 .8 115 .3J u ly --------- 1 21 .1 1 17 .7 3 3 0 .0 107 .6 332.3 1 30 .9 129 .3 1 0 0 .9 123 .3 March------- 1 10 .6 1 1 2 .6 1 1 1 .6 1 0 5 .6 111.9 118 .0 l l l* .0 10 8 .1 H lu 8August— 121.2 1 1 8 .9 130 .1 107 .2 130 .0 331 .0 129 .2 1 01 .1 123 .3 June— — - 1 1 0 .9 113.1* 111 .0 106 .1 111.9 1 17 .9 115 .9 1 0 8 .1 111*. 2September 122 .0 119.)* 1 3 1 .0 108 .6 131.5 131 .0 128 .9 102 .1 123 .5 September 1 1 0 .6 1 11 .5 112.1* 1 10 .8 106.6 U 9 .2 115 .3 107 .8 11U.2O ctober— 1 2 2 .2 1 1 9 .0 132 .3 108 .5 131 .5 131 .0 129 .8 101 .0 1 23 .5 December- 113 .3 1 1 5 .8 1 1 3 .0 10 9 .9 1U .7 120 .1 1 16 .2 108.5 120 .5November- 122 .9 1 18 .8 133.il 108 .6 333 .0 131 .2 130 .2 ioU .5 1 23 .6December- 12 2 .9 1 1 9 .5 133 .ii 108 .7 131.5 131.9 131 .ii 10li.ii 123 .7 1952: Average 111*.!* 1 15 .5 115 .2 1 07 .1 1 1 8 .5 125 .0 116 .7 110 .3 1 2 1 . »4
March— — 1 1 3 .5 113 .9 115 .2 1 07 .6 116 .5 125 .5 115 .6 10 7 .1 122.1*1958: Average 125 .2 123 .3 1311.9 108 .1 135.il 136.8 332.8 103 .7 123 .9 June— — - 11U.9 1 17 .2 115 .2 10 7 .1 118 .6 1 2 5 .5 117 .1 n o .3 1 2 1 .2
January— 123 .7 1 21 .0 1311.0 1 08 .1 131 .1 13U.0 132 .1 IO6./4 12 3 .8 Septenber l l l t .8 1 15 .7 115.1* 106 .3 120 .5 125 .9 117 .1 11 1 .9 121 .2Febru ary- 12 l*.l 121.1* 133 .9 108.8 332 .9 13li.O 132 .5 106.1* 123 .9 December- l l l * .6 l l l* .6 ( 1 / ) 106 .2 120 .5 12 5 .0 117 .2 113 . *4 1 2 1 .2March------- 125 .0 123 .3 13U.7 108.3 133 .0 13i*.0 1 3 2 .6 109 .7 123 .8A p r i l— — 1 2 5 .6 125 .2 13U.8 108 .1 1 33 .9 136.7 1 33 .1 10 3 .6 121*.0 1953* Average 1 15 .6 112 .7 1 17 .8 105 .5 121 .5 135 .3 117 .0 116 .0 123.1*May----------- 125 .2 121*.0 13 It.8 108 .2 13l4.li 137 .0 133 .2 302.1* 12l*.0 January— 111*.!* 113 .9 115 .9 105 .3 120 .7 125 .1 117 .3 113 .7 121 .2June— — 125 .1 12 3 .8 1 3 5 .0 307.i* 13li.O 136.8 1 33 .3 103 .3 12U.0 A p r i l------ 11 5 .1 1 1 2 .0 116 .8 105.1* 121 .8 136.1: 117 .0 116 .7 122 .9J u l y - 125 .il 123 .8 13U.7 1 07 .9 1 36 .5 137.1* 1 32 .6 101 .6 121*.0 J u ly -— - 1 15 .6 112 .7 1 1 8 .0 101*.!* 121 .9 137.1* 1 17 .0 116 .2 123.1*August— 1 2 5 .2 122 .7 1 3 5 .1 107 .2 137 .0 137 .6 132 .8 101 .7 123 .9 O ctober— 1 1 6 .6 113.1* 119 .3 1 0 6 .6 121 .3 137 .9 117.1 1 16 .8 12U.7September 125 .6 123 .3 135 .3 1 08 .5 137 .3 137 .6 1 32 .5 301 .9 123 .9O ctober— 125 .6 123 .0 1 3 5 .5 306.1* 137 .1 138.9 133 .0 101 .8 123 .9 195!*: Average 116 .8 112 .3 1 20 .9 105 .7 12 0 .6 l!*1 .8 11 6 .0 11 5 .2 125 .5November- 126 .1 121* .3 135 .2 108 .5 138 .5 138.9 1 33 .1 1 02 .6 12l*.0 January— 116 .6 1 12 .9 119 .7 10 6 .1 121 .9 138 .8 116.7 11 5 .7 125 .3December- 126 .2 1 23 .9 135 .8 308.3 138.8 138.9 133 .1 102.5 12l*.0 A p r i l ------ 116 .3 112 .1 119 .8 105 .5 120 .9 11*1.9 U 5 .7 l l l i . l 1 2 5 .1
J u ly -------- 117 .3 1 1 3 .5 121.1* 105.7 121.1: 11*3.0 115.9 111:. 3 125 .9O ctober— 1 1 6 .9 1 1 1 .8 122 .1 1 0 6 .0 118.1* 11*2.0 115 .9 11 6 .6 125 .6
M inneapolis,* Minnesota 1955 : Average 116 .8 11 1 .6 122 .1 10U.2 116 .8 11*7.0 119 .7 1 1 7 .0 1 25 .9January— 1 1 6 .5 110 .2 121 .3 10l*.7 1 21 .6 11*3.3 115 .9 115 .7 1 2 5 .5
191*71 Average 9U .6 9 5 .9 93 .2 96 .9 89.!* 92.1* 9 6 .7 91.3 9 1 .1 A p r i l ------ 1 1 7 .0 U 1 .5 122.8 1 03 .5 117 .5 11*6.7 115.7 117 .5 125 .6January— 8 9 .6 9 0 .0 ( 1 / ) 92 .1 86 .3 88 .5 9 5 .0 91 .3 85 .2 J u ly - ------ 117 .5 1 1 2 .1 123 .2 1 03 .1 11 8 .6 11*8.0 122 .5 116 .8 126 .3February - 90 .0 90 .3 ( I / ) 9l*.2 86.1* 88.5 95 .2 91.3 8 5 .9 O c t o b e r - 116.1* 112.3 121 .3 105.1* 111 .9 11*8.2 122 .3 1 1 7 .1 1 26 .2M arch-— 91.7 93 .7 8 7 .9 91*.8 8 7 .0 88 .6 92i.7 91.3 8 5 .9A p r i l— 9 1 .5 9 2 .9 ( 1 / ) 9 5 .0 87 .2 89.7 95 .2 91 .3 85.!* 1956* Average 117 .0 1 1 2 .6 120 .6 106 .7 115 .3 11*9.1* 121*. 2 117 .6 126 .7May— ------- 9 1 .6 9 2 .6 (T /) 95 .0 87.8 90.8 9l*.8 91 .3 85.1* January— 1 16 .1 111 .2 1 2 0 .5 105.1* 113 .8 11*8.9 123 .1 1 18 .1 1 26 .1June— — 9 2 .5 9l*.l* ( V ) 9 5 .5 87 .8 91 .9 924.5 91 .3 85.!* A p r i l ------ 115 .6 1 12 .0 11 9 .0 105 .6 111 .7 11*9.0 123.7 1 17 .9 1 2 6 .0September 9 8 .1 1 02 .0 9 ? 'h 98 .9 90 .2 9l*.7 97.1* 91.3 98 .9 J u ly -------- 117 .7 115 .3 121 .0 106 .7 115.1* 11*9.1* 12i*.7 1 1 7 .5 126.1*D ecen ber- 1 00 .5 1 03 .1 9 9 .5 102 .0 9 6 .0 97.3 102.1* 91.3 9 3 .9 O ctober-* 117.1* 113 .2 120 .2 108 .2 H 7 .9 11*9.8 121*.6 1 17 .0 127.1*
191*8: Average 103 .2 10l*.8 1 0 2 .6 10U.2 101.7 101 .6 1 02 .1 103 .2 10 1 .2 1957* Average 121 .1 l l l* .2 126 .3 1 07 .6 120 .8 162 .1 129.2 120.1* 1 3 0 .2March------- 101.1* 102.1* 1 0 0 .8 1 05 .2 97 .8 99.1* 1 02 .1 9 8 .8 9 8 .9 January— 119.1* 1 12 .6 125 .1 1 0 ? . 6 120 .8 150.3 125.1* 118 .2 128 .3June-------- 103 .7 1 06 .6 102 .5 103 .9 98 .0 102 .2 101 .8 1 0 5 .5 99.!* A p r i l ------ 119 .8 1 1 2 .6 125.1* 10 7 .6 121 .2 152 .0 126.1: 120.9 129.1:September 105 .2 1 0 6 .5 103 .7 10I*.6 307 .6 103 .5 102 .3 10 7 .7 10i*.3 J u ly — - i a . 6 115.1* 126 .5 106 .8 121.1: 168.9 126 .7 119 .9 131 .3December- 103.1* 101 ,1 105 .2 103 .7 306 .9 10i*.8 102.)* 1 0 5 .5 1 03 .9 O c to b e r - 1 2 2 .2 115 .5 1 27 .5 108 .2 118 .6 170.1 13i*.8 12 1 .0 131 .6
19 1*9* Average 1 02 .2 99 .3 10l*.2 98.9 1 08 .9 106 .0 101 .1 105 .5 107 .7 1958 : Average 121*.3 1 1 8 .6 127 .2 10 7 .9 12lu9 183 .2 136.3 12U.5 1 3 1 .2March— - ,102.5 9 9 .5 105 .0 100 .8 108.3 105.3 101 .9 1 0 5 .5 10U.1 January— 123 .2 116 .9 126 .7 108 .3 12U.0 17 1 .6 135 .8 1 23 .0 1 3 1 .5June— — - 102.1* 10 0 .5 103 .7 98 .9 10 8 .6 105.9 101 .2 1 0 5 .5 109 .0 A p r i l ------ 12U.1 12 0 .0 127 .2 1 08 .1 12 2 .2 m .i * 136.1: 121:.7 1 3 1 .2Septenber 102 .0 9 9 .7 1 0 3 .5 96 .9 10 9 .6 106 .6 1 0 0 .5 1 0 5 .5 109 .7 J u ly — — 1214.9 1 1 9 .6 1 2 7 .6 107 .8 12U.9 189 .6 1 36 .6 12U.7 1 3 1 .2December- 101.1* 9 7 .6 10i*.3 96 .6 110 .5 107.1 1 0 0 .2 1 0 5 .5 110 .3 O ctober— 12l*.5 117 .8 1 2 7 .0 10 8 .0 12 6 .1 190.1* 136.1: 121:. 9 1 31 .1
1 / Not a v a ila b le ,
Digitized for FRASER http://fraser.stlouisfed.org/ Federal Reserve Bank of St. Louis

Table C -2 . Consumer P r ice In d ex — 20 la rg e c i t i e s : Indexes o f a l l item s and major groups o f goods and s e r v ic e s , by yea r and month, 192*7-58— Continued
(191*7-1*9-100)
Yearand
month
A l litem s
Food Housing A pparel Transp o r ta t io n
M edicalcare
Personalcare
Reading and
r e c r e - a t io n
Othergoods
ands e r v ic e s
Yearand
month
AHitem s
Food Housing A pparel Transp o r ta t io n
M edica lca re
P ersonalcare
Readingand
r e c re a t io n
O thergoodsand
s e r v ic e s
New Y ork , New York New Y ork , New York— Continued
1 9 1 *7 : Average 9 6 . 0 9 5 . 5 9 6 . 5 1 0 0 . 1* 8 5 . 5 9 3 . 2 9 8 . 1* 9 6 . 5 92* . 2 1 9 5 1 : Average 1 0 9 . 6 1 1 2 . 0 1 0 9 . 2* 1 0 5 . 9 1 2 5 . 2 1 1 0 . 7 1 0 6 . 2 1 0 3 . 1 1 0 8 . ?January— 9 3 * 5 9 0 . 8 9 5 . 1* 1 0 0 . 1 8 i* .3 9 1 . 2 9 7 . 2 9 7 . 2 9 6 . 9 January— 1 0 7 . l i 1 0 9 . i t 1 0 8 . 2 1 0 1 . 1 1 2 3 . 7 1 0 7 . 9 1 0 5 . 1 1 0 3 . 6 1 0 8 . 5F ebru ary- 9 3 . 3 9 0 . 1 Q / ) 1 0 0 . 9 8 i* .3 9 1 . 6 9 7 . 5 9 7 . 3 9 l* . 6 February- 1 0 9 . 2 1 1 2 . 2* ( 1 / ) 1 0 3 . 7 1 2 i* . 2 1 0 8 . 2* 1 0 6 . 2 1 0 5 . 6 1 0 8 . 0M arch-— 9 S . 2 9 3 . 8 ( V ) 1 0 2 . 1* 8 l u 3 9 2 . 1 9 7 . 8 9 7 . 9 9 l* . 6 March— — 1 0 9 . 0 1 1 1 . 2 a n 1 0 2 * . 1 1 2 2 * .5 1 1 0 . 2 1 0 6 . 3 1 0 5 . 6 1 0 8 . 1A p r i l— - 9 k . 9 9 2 . 7 a n 1 0 3 . 2 8 1 * .8 9 2 . 3 9 8 . 7 9 7 . 9 9 3 . 8 A p r i l ------ 1 0 9 . 1 1 1 1 . 3 1 0 9 . 1 1 0 i* .3 1 2 2 * .5 1 1 0 . 6 1 0 6 . 2 1 0 5 . 6 1 0 8 . 1May--------------- 9 k . l 9 1 . 5 1 0 3 . 6 8 5 . 0 9 2 . 6 9 8 . 0 9 1 * .5 9 3 . 0 May---------- 1 0 9 . 6 1 1 2 . 1 a n 1 0 5 . 1 1 2 2 * .9 1 1 0 . 7 1 0 6 . 5 1 0 5 . 2 1 0 8 . 2*June— — - 9 k . 9 9 3 . 0 ( 3 / ) lO l u O 8 5 . 3 9 2 . 9 9 7 . 9 9 k . 9 9 3 . 0 June— — 1 0 9 . 1 1 1 1 . 1 a n 1 0 5 . 0 1 2 i* . 7 1 1 0 . 6 1 0 7 . 0 1 0 2 . 7 1 0 8 . 2*J u ly --------- 9 5 . 3 9 U . 9 9 5 . 1 9 9 . 0 8 5 . 1* 9 3 . 3 9 8 . 2 9 k . 9 9 3 . 0 J u ly -— - 1 0 9 . 5 1 1 2 . 1 1 0 7 . 8 1 0 i* . 3 1 2 5 . 3 1 1 0 . 7 1 0 6 . 7 1 0 2 . 7 1 0 8 . 2*August— - 9 6 . 0 9 6 .2 ( V ) 9 8 . 6 8 5 . 8 9 3 . 5 9 8 J 9 k . 9 9 3 . 8 August— 1 0 9 . 3 1 1 1 . 6 ( i / ) 1 0 2 * .9 1 2 5 . 3 1 1 0 . 6 1 0 6 . 5 1 0 2 . 1 1 0 8 . 2*September 9 8 . 0 1 0 0 . 5 a / )
9 5 J9 7 . 6 8 6 . 1* 9 l* . 0 9 8 . 0 9 5 . 2 9 3 . 7 September 1 1 0 . 3 1 1 1 . 9
i S S1 1 0 . 5 1 2 5 . 8 1 1 2 . 1 1 0 5 . 2* 1 0 1 . 6 1 0 8 . 2*
O ctober— 9 7 . 9 9 9 . 3 9 7 . 9 8 6 . 1* 9 k . 8 9 9 . 1 9 5 . 2 9 3 . 9 O ctober— 1 1 0 . 6 1 1 2 . 8 1 1 0 . 2 1 2 6 . 1 1 1 1 . 8 1 0 5 . 1 I C O . 7 1 0 8 . 2*November- 9 8 . 9 1 0 0 . 9 (V ) 9 8 . 0 8 6 . 8 9 1 * .8 99.9 9 7 . 2 9 3 . 9 November- 1 1 1 . 2 l l i * .3
§ 81 0 9 . 1 1 2 6 . 7 1 1 1 . 8 1 0 6 . 8 1 0 0 . 7 1 1 2 . 0
December- 9 9 . 8 1 0 2 . 0 ( T / ) 9 9 . 1 8 7 . 5 9 i* . 8 1 0 0 . 6 1 0 1 . 2 9 6 . 0 December- 1 1 1 . 2 1 1 2 * .2 1 0 8 . 7 1 2 6 . 7 1 1 3 . 3 1 0 6 . 8 1 0 1 . 1 1 1 1 . 1*
I 9 l£ : Average 1 0 2 . 6 1 0 i* . 2 1 0 1 . 0 1 0 2 . 3 1 0 0 . 2 1 0 2 . 2 1 0 1 . 3 1 0 0 . 1* 1 0 2 . 0 1 9 5 2 : Average 1 1 1 . 5 1 1 3 . 7 1 1 1 . 1 1 0 6 . 3 1 2 7 . 2* U 8 . 3 1 0 6 . 1 1 0 i* . i* U 5 . 3January— 1 0 1 . 1 1 0 3 . 8 1 0 0 . 1 9 9 . 3 8 7 . 5 96 .7 1 0 1 . 1 1 0 l* . 0 9 9 . 3 January— 1 1 1 . 3 l l i * . 0 1 1 0 . 2 1 0 7 . 6 1 2 6 . 8 1 1 2 * .7 1 0 6 . 5 1 0 2 * . i* 1 1 1 . 2,F ebru ary- 1 0 0 . 8 1 0 2 . 3 ( 1 / ) 1 0 0 . 6 8 7 . 6 97 .2 1 0 1 . 3 1 0 i i . 2 9 9 . 3 February- 1 1 0 . 6 1 1 2 . 0 (V ) 1 0 7 . 3 1 2 7 . 3 l l i i . 8 1 0 6 . 5 1 0 2 . 9 1 1 3 . 7March------- 9 9 . 5 9 9 .6
. a( 1 / )
1 0 1 . 1* 8 7 . 6 9 7 . 7 1 0 1 . 0 9 9 .9 9 9 . 3 March------- 1 1 0 . 2 U 1 . 5 a n 1 0 6 . 7 1 2 7 . 3 1 1 2 * .8 1 0 6 . 2 1 0 2 . 0 1 1 3 . 7A p r i l -------May--------- --
1 0 1 . 1
101.51 0 3 . 31 0 i* . 0
1 0 1 . 01 0 1 . 2
8 7 . 78 7 . 7
1 0 1 . 71 0 2 . 0
1 0 0 . 69 9 . 8
9 7 . 1 '9 7 . 1
9 9 . 39 9 . 7
A p r i l— - May— —
1 1 0 . 91 1 0 . 7
1 1 3 . 51 1 2 . 6
1 1 0 . 3
a n
1 0 5 . 71 0 5 . 9
1 2 7 . 31 2 7 . 2*
l l i u 8 1 1 2 * .8
1 0 6 . 11 0 6 . 1
1 0 2 . 31 0 2 . 3
1 1 3 . 71 1 6 . 1
June— — 1 0 2 . 5 1 0 5 . 9 ( I / ) 1 0 1 . 2 8 7 . 8 1 0 2 . 0 9 9 . 8 9 8 . 2 9 9 . 7 June-------- 1 1 0 . 9 1 1 2 . 3 a n 1 0 5 . 9 1 2 7 . 2* 1 1 9 . 6 1 0 6 . 1 1 0 i * . l 1 1 6 . 0J u ly --------- i o l * . 6 1 0 7 . 9 1 0 0 . 9 1 0 1 . 7 1 1 0 . 9 1 0 i t . 7 1 0 0 . 6 9 8 . 2 i b i . 5 J u ly — — 1 1 2 . 3 1 1 5 . 2* l l T . l 1 0 5 . 2* 1 2 7 . 2* 1 1 9 . 7 1 0 6 . 2 1 0 6 . 2* 1 1 6 . 6August— 1 0 5 . 0 1 0 7 . 2* ( 1 / ) 1 0 3 . 5 1 1 2 . 5 1 0 i* .7 1 0 2 . 1* 1 0 1 . 0 1 0 5 . 3 August— 1 1 2 . 2 1 1 5 . 1 1 0 5 . 2* 1 2 7 . 3 1 2 0 . 1 1 0 6 . 0 1 0 2 * .8 1 1 6 . 6September 1 0 5 . 0 1 0 7 . 0 a n 1 0 l* . 9 1 1 2 . 7 1 0 l* . 9 1 0 2 . 1 9 8 . 2 1 0 5 . 3 September 1 1 2 . 2* 1 1 2 * .7 1 0 6 . 6 1 2 7 . 8 1 2 1 . 5 1 0 5 . 8 i o 5 . i t 1 1 6 . 6O ctob er— lD l t .O 1 0 i* . 7 1 0 T . 9 1 0 l* . l* 1 1 3 . 2 1 0 l* . 9 1 0 2 . 1 1 0 0 . 6 1 0 5 . 3 O ctober— 1 1 2 . 2* 1 3 .2* . 5 1 1 7 . 2 1 0 6 . 6 1 2 7 . 8 1 2 1 . 5 1 0 5 . 2* 1 C5 . 2* 1 1 6 . 3Novenfcer- 1 0 3 . 7 1 0 3 . 3 ( 1 / ) l o 1 * .5 U 3 . 3 1 0 5 . 0 1 0 2 . 3 1 0 2 . 9 1 0 5 . 3 November- 1 1 2 . 9 1 1 5 . 8 (V ) 1 0 6 . 0 1 2 7 . 8 1 2 1 . 7 1 6 5 . 9 1 0 5 . 6 216 .6December- 1 0 2 . 6 1 0 1 . 1 a n 1 0 3 . 7 1 1 3 . 3 1 0 5 . 0 1 0 2 . 1 1 0 2 . 9 1 0 5 . 3 December- 1 1 2 . 0 1 1 3 . 2 <s/> 1 0 5 . 8 1 2 7 . 7 1 2 1 . 3 1 0 6 . 0 1 0 7 . 1 1 1 6 . 6
191*9: Average 1 0 1 . i l 1 0 0 . 3 1 0 2 . 6 9 7 . 1* l l l * .3 1 0 l* . 6 1 0 0 . 2 1 0 3 . 1 1 0 3 . 8 1 9 5 3 : Average 1 1 2 . 1 1 1 1 . 2* l l l j . 3 1 0 5 . 2 1 3 0 . 2 1 2 1 . 2* 1 0 6 . 7 1 0 7 . 0 1 1 8 . 9Jan uary-* 1 0 2 . 6 1 0 1 . 6 1 0 2 . 6 1 0 1 . 5 1 1 3 . 6 1 0 5 . 5 1 0 1 . 7 1 0 3 . 1* 1 0 5 . 3 January— 1 1 1 . 7 1 1 2 . 2* 1 1 2 . 6 1 0 5 . 7 1 2 7 . 8 1 2 1 . 3 1 0 5 . 9 1 0 7 . 1* 1 1 6 . 6February- 1 0 1 . 2 9 9 . 0 ( V ) 1 0 0 . 2 1 1 1 * .2 1 0 5 . 1* 1 0 1 . 1 1 0 3 . 1* 1 0 5 . 3 February - 1 1 1 . 1 1 1 0 . 9 1 1 2 . 6 1 0 5 . 2* 1 2 7 . 3 1 2 0 . 7 1 0 6 . 0 1 0 6 . 9 1 1 6 . 5March------- 1 0 1 . 6 1 0 0 . 2 a n 9 9 . 1* l l i i . l 1 0 l* .3 1 0 1 . 1 1 0 U . 2 1 0 l* . 2 March------- 1 1 1 . 2 1 1 0 . 5 1 1 3 . 0 1 0 5 . 5 1 2 7 . 2* 1 2 0 . 7 1 0 5 . 9 1 0 6 . 9 1 1 8 . 0A p r i l - — 1 0 2 . 1 1 0 0 . 8 1 0 J . 0 9 9 . 3 l l l * . l* 1 0 U . 3 1 0 1 . 2 1 0 l* . 2 1 0 l* . l* A p r i l ------- 1 1 1 . 1 1 0 9 . 8 1 1 3 . 6 1 0 iw 8 1 2 7 . 3 1 2 0 . 7 1 0 6 . 1 1 0 7 . 1 H 8 . i tMay----------- 1 0 1 . 3 1 0 0 . 1 & / ) 9 8 . 1* l l l * . l* 1 0 l* .3 1 0 0 . 7 1 0 2 . 2 1 0 3 . 5 May----------- 1 1 1 . 2* 1 1 0 . 3 1 1 1 '. 3 1 0 i i . 9 1 2 7 . 3 1 2 0 . 5 1 0 6 . 7 1 0 6 . 2* 1 1 8 . 2June— — 1 0 1 . 1* 1 0 0 . 7 M 9 7 . 6 l l l * .3 i o U . l t 1 0 0 . 1* 1 0 2 . 2 1 0 3 . 1 Jun e-— - 1 1 2 . 0 1 1 2 . 0 H lj .i i 1 0 2 * . 8 1 2 7 . 5 1 2 0 . 5 1 0 6 . 7 1 0 6 . 1 1 1 8 . 3J u ly --------- 1 0 1 . 5 1 0 1 . 0 9 6 . 7 l l l * .3 1 0 l* . l* 1 C 0 . 1* 1 0 2 . 2 1 0 3 . 1 J u ly — — 1 1 2 . 1 1 1 1 . 9 n i i . 7 1 0 i* . i* 1 2 8 . 5 1 2 0 . 5 1 0 6 . 7 1 0 5 . 6 1 1 8 . 9August— 1 0 1 . 3 1 0 1 . 0 a / ) 9 5 . 7 l l l l . l t 1 0 l* . 2 1 0 0 . 1 1 0 2 . 2 1 0 3 . 1 August— 1 1 2 . 7 1 1 2 . 1 l l l t . 9 1 0 2 * 2 3 3 2* . 2 1 2 1 . 6 1 0 6 . 8 1 0 6 . 2 1 1 9 . 0September 1 0 1 . 8 1 0 1 . 9 i d ? . 5 9 5 . 2 l l l * . l* 1 0 1 * .2 1 0 0 . 0 1 0 1 * . 2 1 0 3 . 2* September 1 1 3 . 2 1 1 2 . 6 1 1 5 .1 1 0 5 . 9 1 3 i* . 0 1 2 1 . 6 1 0 6 . 9 1 0 6 . 2* 1 1 9 . 1O ctober— 1 0 0 . 8 9 9 . 5 1 0 3 . 0 9 5 . 0 1 1 1 * .6 1 0 l * . l* 9 9 . 8 1 0 1 * .2 1 0 3 . 1* O ctober— 1 1 3 . 3 1 1 2 . 2 U 5 . i l 1 0 5 . 9 1 3 i u 2 1 2 1 . 6 1 0 7 . 2* 1 0 7 . 1 1 2 1 . 1November- 1 0 0 . 8 9 9 . 8 1 0 3 . 2 9 i* . 8 l l l * . 5 1 0 l* . l* 9 8 . 7 1 0 1 . 5 1 0 3 . 1* November- 1 1 2 . 9 1 1 0 . 7 1 1 5 . 5 1 0 5 . 9 1 3 3 . 5 1 2 3 . 2* 1 0 7 . 7 1 0 9 . 2 1 2 1 . 0December- 1 0 0 . 3 9 8 . 1* 1 0 3 . 3 9 1 * .6 n i * . 8 1 0 5 . 7 9 7 . 8 1 0 3 . 5 1 0 3 . 2* Deceraber- 1 1 3 . 0 1 1 0 . 9 1 1 5 . 5 1 0 5 . 5 1 3 3 . 7 1 2 3 . 2* 1 0 8 . 1 1 0 8 . 9 1 2 1 . 2
1 9 5 0 : Average 1 0 2 . 1 1 0 1 . 3 1 0 l i . l i 9 6 . 1 1 1 9 . 2 1 0 6 . 5 9 8 . 0 1 0 1 . 8 1 0 5 . 0 1 9 5 2 ** Average 1 1 2 . 8 1 1 1 . 2* 1 1 5 . 5 1 0 i * . l 1 3 2 . 2* 1 2 3 . 9 1 0 7 . 9 1 0 5 . 5 1 2 1 . 3January— 9 9 . 6 9 7 . 0 1 0 3 . 2 9 l* . 3 n i * . 9 1 0 6 . 0 9 6 . 9 1 0 3 . 5 1 0 3 . 1* January— 1 1 3 . 0 1 1 0 . 9 1 1 5 . 3 1 0 2 * . 8 1 3 5 . 6 1 2 3 . 6 1 0 8 . 3 1 0 8 . 5 1 2 1 . 2Febru ary- 9 9 . 8 9 7 . 0 1 0 3 . k 9 l* . 3 n i* .9 1 0 6 . 0 9 6 . 8 1 0 5 . 0 1 0 3 , 6 February- 1 1 2 . 8 1 1 0 . 6 1 1 5 . 3 1 0 i* . 9 1 3 5 . 1 1 2 3 . 2 1 0 8 . 6 1 0 7 . 6 1 2 1 . 2K arch ---------- 1 0 0 . 0 9 7 . 6 1 0 3 . l i . 9 l* . l* 1 1 1 * . 9 1 0 6 . 0 9 6 . 7 i o l t . 8 1 0 3 . 6 M arch-— - 1 1 2 . 2* 1 0 9 . 9 1 1 5 . 3 i o i * . 5 1 3 i* . 6 1 2 3 . 2 1 0 8 . 6 1 0 5 . 8 1 2 1 . 1A p r i l ------- 1 0 0 . 2 9 8 . 1* 1 0 3 . 5 91* . 9 1 1 5 . 2 1 0 6 . 0 9 6 . 8 1 0 2 . 9 1 0 3 . 5 A p r i l --------- 1 1 2 . 5 1 1 1 . 0 1 1 5 . 0 lO l i .O 1 3 i * . l 1 2 3 . 9 1 0 7 . 5 i o l t . 1 1 2 1 . 3May------------- 1 0 0 . 1* 9 9 . 2 1 0 3 . 3 9 l* . 6 1 1 5 . 2 1 0 6 . 2 9 6 . 7 101.1* 1 0 3 . 3 May--------------- 1 1 2 . 9 1 1 1 . 8 1 1 5 . 2 1 0 3 . 9 1 3 i* . 5 1 2 3 . 9 1 0 7 . 2* l o l l . 8 1 2 1 . 5June-— - 1 0 0 . 9 1 0 0 . 8 1 0 3 . 1) 91* . 1* 1 1 5 . 2 1 0 6 . 9 9 6 . 5 1 0 0 . 3 1 0 3 . 2 June— — - 1 1 2 . 9 1 1 1 . 6 U 5 . l i 1 0 3 . 9 1 3 i* . 6 1 2 3 . 9 1 0 7 . 0 1 0 5 . 3 1 2 1 . 5J u ly — — 1 0 2 . 6 1 0 3 . 6 1 0 3 . 8 9 U . 6 1 2 3 . 1 1 0 6 . 9 9 6 . 9 9 9 . 8 1 0 2 * .0 J u ly -------- 1 1 3 . 3 1 1 3 . 6 H 5 . 5 1 0 3 . 5 1 2 9 . 3 1 2 3 . 9 1 0 7 . 6 1 0 7 . 0 1 2 1 . 5August— 1 0 2 . 5 1 0 2 . 6 1 0 U . 2 9 5 . 0 1 2 3 . 1* 1 0 6 . 9 9 7 . 1* 1 0 0 . 0 1 0 6 . 7 August— 1 1 3 . 0 1 1 3 . 1 H 5 . 5 1 0 3 . 3 1 2 9 . 0 1 2 2 * . 0 1 0 7 . 6 1 0 5 . 3 1 2 1 . 5September 1 0 3 . 7 1 0 l i . 3 <y )
1 0 5 . 99 7 . 9 1 2 3 . 3 1 0 6 . 5 9 7 . 5 1 0 0 ; 6 1 0 6 . 5 September 1 1 2 . 7 1 1 1 . 8 H 5 . 8 1 0 2 * . 2* 1 2 9 . 7 1 2 2 * .0 1 0 7 . 7 1 0 2 * . 5 1 2 1 . 3
O ctober— 1 0 1 * .2 1 0 l * . l 9 9 . 1* 1 2 3 . 3 1 0 6 . 7 9 8 . 5 1 0 0 . 7 1 0 6 . 8 O ctober— 1 1 2 . 6 1 1 1 . 3 1 1 5 . 9 1 0 2 * . l 1 2 9 . 8 1 2 i * . l 1 0 7 . 6 1 0 2 * . 9 1 2 1 . 3November- 1 0 1 * .7 1 0 l* . 6 ( V ) 9 9 . 1* 1 2 3 . 8 1 0 6 . 9 1 0 2 . 1* 1 0 1 . 0 1 0 7 . 1 November- 1 1 2 . 7 1 1 1 .0 H 6 . 0 l O i i . l* 1 3 1 . 2* 1 2 i* . 6 1 0 8 . 2* 1 0 1 * . 5 1 2 1 . 3December- 1 0 6 . 0 1 0 7 . 0 & 1 0 0 . 3 1 2 3 . 8 1 0 7 . 2 1 0 2 . 6 1 0 1 . 3 1 0 8 . 1 December- 1 1 2 . 2 1 1 0 . 1 U 6 . 1 1 0 3 . 7 1 3 0 . 8 1 2 2 * . 6 1 0 8 . 3 1 0 2 i . 2 1 2 1 . 0
1 / Not a v a i la b le .
Digitized for FRASER http://fraser.stlouisfed.org/ Federal Reserve Bank of St. Louis

Table C -2 . Consumer P r ice Index— 20 la rg e c i t i e s : Indexes of a l l item s and m ajor groups of goods and s e r v ic e s * by year and month* 19U7-5 8 — Continued
(191*7-1*9-100)------- M-------------
Food Housing Apparel
-------- 4--------Reading Other 1------------ Reading Other
Year A l l Trans- M edical P ersonal and goods Year A l l Food Housing Trans M edica l Personal and goodsand item s p o r ta - care care r e c r e - and and item s
j A pparelp o r ta ca re care r e c r e and
month t io n a t io n s e r v ic e s month t io n a t io n s e r v ic e s
New Y ork , New York— Continued P h ila d e lp h ia * Pennsylvania
19 55 : Average 1 1 2 „2 1 10 .8 U 5 .7 102.J* 126 .9 12 5 .9 109.1* 101*.!* 12 1 .0 191*7: Average 95.3 95.9 9l*.6 9 7 .1 92.0 96.2 96.5 89.3 96.3January— 1 1 2 .3 1 10 .6 1 1 6 . It 102 .2 1 3 0 . 1 12 It.7 108.1* 10 W 1 2 1 . 1 January— 9 1.6 9 1 . 1 (1/) 9l*.l 85.!* 93.2 96.5 9 1.3 9 1.2F ebruary- 1 1 2 .5 1 1 1 . 1 1 16 .3 10 1.9 1 3 0 .1 12 5 .0 108 .3 10U .1 1 2 1 .0 Febru ary- 9 1.2 89.8 97.8 9l*.5 85.3 93.9 96.6 89.9 9 1.2March— — U 2 .lt 1 1 1 . 0 116 .!* 10 2 .1 1 3 0 . 1 12 5 .0 10 8 .3 101*.6 12 1 .0 M arch— — 93.9 9U.2 (1/) 96.5 9 1.8 9l*.6 96.9 89.9 9 1.7A p r i l ------- 1 1 2 .3 1 1 1 . 6 1 1 5 .3 10 1.1* 120.1* 12 S .ll 108.1* 10!*.9 12 1 .0 A p r i l ------- 93 .2 92.2 (I/ ) 96.6 92.1* 96 .1 97.6 89.9 9 1.7May-------- 1 1 1 . 8 U .o .5 U lt.9 10 1.!* 128.8 12 6 .1 10 8 .5 10l*.7 12 1 .0 M ay------ -- 93.3 93.0 (X/) 96.2 92.6 96.3 96.2 89.9 9 1.7June— — 1 1 1 . 8 1 10 .8 ll lt .9 10 1 .2 128 .6 12 6 .1 108 .9 10 5 .1 1 2 1 .0 June--------- 91*.5 9i*.8 (X/) 97.3 92.7 96.5 95.8 89.9 99.9J u ly --------- 1 1 1 . 9 1 1 1 . 6 l l lt .9 100.9 127 .lt 126 .2 10 9 .2 101*.2 1 2 1 .0 J u ly ------ 95.3 95.7 95.3 97.0 92.9 96.5 9 5 .1 88.5 99.9August— 1 1 1 . 9 1 1 1 . 1 * U 5 .0 10 1 .2 126.8 126 .2 10 9 .1 10 3 .7 12 1 .0 August— 96.0 97.2
M97.0 93.!* 96.3 96.0 88.5 99.6
Septenber 1 1 2 .6 1 1 1 . 9 1 1 5 .3 10i*.2 126 .8 126 .2 1 10 .7 10 5 .0 1 2 1 . 1 September 98.2 10 1 .3 97.9 9l*.3 97.0 95.7 88.5 99.6O ctober— U 2 .lt u o .5 U 6 .3 10 l*.l 127 .8 12 6 .5 1 10 .6 101*.2 1 2 1 . 1 • O ctober— 97.6 99.1* (V) 98.6 9i*.3 97.6 96.1* 88.5 99.6N ovenber- 1 1 2 . 5 109.9 U 6 .5 10l*.2 1 3 1 . 1 126 .5 1 1 1 . 0 iol*.l* 1 2 1 . 1 November- 98.8 10 0 .1 9S.8 99 .1 •9l*.5 97.6 97.2 88.5 99.9December- 1 1 2 .0 10 8 .7 116 .6 101t.3 12 9 .5 12 6 .5 1 1 1 . 2 10lt.0 12 1 .0 Deceraber- 10 0 .1 10 2 .3 ( 1/ ) 99.7 9i*.6 98.2 97.7 88.5 99.9
1956: Average 1 1 3 .9 1 1 1 . 5 1 1 7 .9 1014.6 1 3 3 .1 12 7 .2 1 1 2 . 1 105 .9 12 2 .0 L9i*8: Average 10 2 .9 10 l* .l 10 2 .3 10 3 . 1 100.9 100.!* 99.2 10 1 .9 99.9January— 1 1 2 . 1 10 9 .1 1 16 .6 102 .9 130 .lt 126 .7 i u . l t 10U.7 12 1 .0 January— 10 1 .3 1014.2 ( 1/ ) 100 .6 95.U 99.2 97.9 88.5 100 .0February 1 1 2 . 1 108 .6 1 16 .7 103.8 13 1 .3 126 .6 1 1 1 . 1 * iolt.7 1 2 1 .0 Febru ary- 100 .2 10 1 .0 100 .7 10 2 .2 95.6 100.0 97.9 88.5 100 .0March— — 1 1 2 .2 108.8 1 16 .9 10 3 .7 13 1 .0 126.6 1 1 1 . 2 l o w 1 2 1 . 1 March------- 99.6 99.5 ( 1/ ) 10 2 .2 95.7 99 .1 96.9 88.5 97.2A p r i l— - 1 1 2 .3 108.9 1 16 .9 10 3 .7 1 3 1 . >* 126*5 1 1 1 . 3 10 5 .3 i a . i A p r i l— - 10 1 .9 102 .8 (I/) 10 2 .1 99.6 99.6 97.5 105 .0 97.5May----------- 1 1 3 .0 110 .6 1 1 7 .0 10 3 .5 13 1 .8 126 .7 1 1 1 . ! * 10 5 .2 . 1 2 1 .2 May---------- 10 2 .6 10 3 .9 10 1 .6 103.1* 99.7 99.6 97.2 105 .0 97.5Jun e-------- 1 1 3 .8 1 1 2 .7 1 1 7 .2 103.8 1 3 1 .5 126 .7 1 1 1 . 5 10 5 .6 12 1.1* June— — - 10 3 .6 10 6 ,1 ( 1/ ) 1 0 3 . 1 130 .8 99.9 97.2 10 5 .0 97.5Ju ly— — ll l* .6 u n .o 1 1 3 . 1 10l*.2 1 3 2 .1 126 .7 1 1 1 . 6 105 .6 1 2 1 .5 J u ly -------- lO ii.l 106 .9 (X/) 1 0 3 . 1 10 2 .3 10 0 .5 96.1* 105.1* 97.6August— 111*.!* 1 12 .6 1 18 .3 10 l*.l 133 .6 127.9 111 .6 106.1* 121.!* August— 10 5 .2 107 .7 10 J .7 10 3 .6 10l*.O 100 .6 96.7 105 .6 10 2 .0Septenber 1 1 5 . 1 1 1 3 . !* 1 18 .6 106.1* 13 3 .0 127 .9 1 1 2 .6 106 .7 12 3 .6 Septenber 10 5 .3 10 7 .5 ( 1 / ) 10 l* .l 10i*.3 100 .9 9 7 .1 105 .6 10 2 .0O ctober— 1 1 5 .7 1 1 3 .6 1 1 9 . 1 106 .3 13 7 .7 127 .9 1 1 2 .6 10 7 .2 12 3 .7 O ctob er— 101*. 9 10 5 .6
i S S10U.5 iou .3 100 .9 1 05 .2 108.3 10 2 .6
Novenber- 1 1 5 .6 1 1 3 .3 119 .k 106.2 136.8 128 .0 n it .3 10 7 .3 12 3 .6 November- 103.1* 102.1* 10U.6 101*.2 10 2 .2 10 5 .2 108.8 10 2 .6December- 1 1 5 .5 1 1 2 .6 1 19 .6 10 6 .1 136 .8 12 3 .0 111*.!* 10 7 .5 12 3 .5 Deceraber- 102.8 10 1 .0 ( i/ ) 10l*.3 101*.5 102 .3 105 .6 108.8 102 .7
1957: Average 1 1 7 .6 1 1 5 .0 12 1 .8 10 6 .1 138 .0 12 9 .1 116 .2 llh.h 12 5 .5 L9l*9: Average 10 1 .7 1 0 0 .1 1 0 3 . 1 99.8 10 7 . 1 103.1* 10lt.3 106.8 10 3 .7January— 115 .6 1 1 2 .3 120 .1 10 5 .6 136.9 12 8 .1 111* .3 10 8 J . 12lt.9 January— 10 2 .6 1 01 .6 ( 1/ ) 10 1 .8 10l*.9 10 2 .3 105.!* 108 .8 10 2 .3February - U 5 .9 1 12 .9 120 .8 101*. 7 13 7 .7 128 .2 l l l i . 8 108.3 121*. 8 Februazy- 10 1 .5 98.8 10 3 .7 101 .8 105 .8 10 2 .7 10 5 . 1 108.8 10 2 .3March------- 1 16 .0 1 1 2 .3 121 .1 106 .2 137 .8 128 .2 11U .9 109 .2 12!*.9 March------- 101 .8 99.7
10 7 .6
101.1* 10 5 .7 10 3 .2 10i*.9 108 .8 10 2 .3A p r i l----- 1 16 .9 112 .8 1 2 2 .2 105.1* 138 .3 128.1* 115 .2 1 16 .3 121*.7 A p r i l ------ 101 .8 10 0 .3 100 .9 10 5 .9 103 .2 10 5 .1 108.8 10 2 .3May— ------- 1 1 7 .2 1 1 3 .8 12 2 .1 105.8 138.2 129 .3 11 5 .2 1 1 5 .6 121*. 7 May-------- 10 2 .3 100.!* 100.!* 1 15 .8 10 3 .3 10l*.8 108 .8 10 2 .3June------- 1 17 .9 1 1 5 .6 12 2 . 1 105.9 138.!* 129 .5 1 1 5 .5 1 1 5 .3 12 5 . h June-— - 10 1 .9 100 .7 (V) 10 0 .2 136 .3 10 3 .5 101*. 7 108.8 105.1*J u ly --------- 118 .!* 1 1 7 .3 12 1 .8 105 .6 137.!* 129.6 U 5 .7 1 16 .2 12 6 . 1 J u ly -— - 10 1 .0 98.9 (X/) 9 8 .1 106 .8 10 3 .5 IOI4.3 108.8 101*. 7August— 1 18 .7 1 1 7 .7 1 2 2 . 1 105 .9 13 7 .6 129.1* 1 16 .3 1 15 .9 12 6 .2 August— 10 1 .7 10 0 .5 10*2.7 98.0 106.8 10 3 .5 10 3 .9 108.8 10 5 .2
10l*.7101**7Septenber
O ctober—1 18 .3U 3.U
116 .61 16 .5
12 2 .01 2 2 . 1
106 .7107 .0
13 7 .1136 .9
12 9 . U 129.!*
116 .1*3 17 .6
1 16 .2116.!*
12 6 . 112 6 .1
SeptenberO ctober—
10 2 .210 1 .8
10 1 .3 100*3
13 3 .0 103 i2
99.0 98; 7
106.8136 .8
10 3 .9103*9
10 3 .7103*5
108.8 108*8
November- 1 18 .6 1 16 .0 122.!* 107 .2 11*0.3 129 .7 118 .8 1 1 6 .5 12 6 .1 November- 10 1 .6 99.7 103 ;5 98.6 106 .9 10 3 .9 10 3 .3 108.8 10l*.2December- 1 18 .7 1 1 5 .8 12 3 .0 107.0 139 .6 129.7 1 19 .2 1 18 .2 12 6 . 1 December- 100.8 9 8 .1 10 3 .$ 98.!* 106 .9 10l*.2 10 2 .8 108.8 1014.2
1958: Average 1 2 1 . 1 120.9 12l*.3 10 6 .2 lij0 .3 13 2 .0 i a . 9 118 .8 12 6 .5 1950: Average I02 i3 10 2 .0 101*.!* 98 ;o 107 ; i 10 5 .0 10i*.3 10 7 .7 10l*.8January— 120 .0 1 18 .6 12 3 .7 106.7 139 .6 129 .9 120 .6 1 19 .6 126,!* January— 10 0 .0 97.0 10 3 .0 97.3 10 7 .0 10 li.3 10 3 ,2 108 .7 10 !i.2February- 120 .3 1 1 9 . 1 12!*.3 106.7 139 .0 130 .0 120 .9 12 6 .2 February- 99.7 96.1* 102.9 96.7 106 .9 10l*,3 102.8 108 .6 10l*.2M arch-— - i a . 2 12 2 .0 12l*.0 106.8 13 3 .8 13 0 .1 1 2 1 .3 1 1 8 .5 12 6 .5 March— 10 0 .2 98.0 10 2 .8 96.5 136 .9 10!*.3 10 2 .5 108 .5 10 l* .lA p r i l - — 1 2 1 .2 1 2 2 . 1 12i*.2 105.8 13 9 .3 1 3 0 .1 1 2 1 . 5 1 1 8 . 1 12 6 .3 A p r i l— 100 .2 9 8 .1 10 3 .0 96.3 106 .0 10l*.3 10 2 .5 108.1* 10U.0May---------- 1 2 1 . 1 12 1 .9 12U.3 10 5 .5 13 9 .1 130 .8 1 2 1 .5 1 1 7 .2 12 6 .5 May---------- 100 .6 99 .1 102 .8 96.5 106.1* 10 5 .0 102 .3 108.1* 10 l* .lJune--------- 1 2 1 .0 1 2 1 .6 12U.3 10 5 .5 139 .0 130.8 1 2 1 .5 1 1 7 .6 12 6 .5 June— — - 10 1 .6 10 2 . 1 10 2 .9 96.5 10 6 .5 105 .0 102.3 106 .9 lo ll.oJ u ly --------- 1 2 1 . 1 1 2 1 .7 12l*«2 105*6 139.1* 130.8 1 2 3 . 1 1 18 .7 126.1* J u ly -------- 102.1* 101*.!* 10 3 .2 96.3 10 6 .5 10 5 .0 10 2 .3 105 .6 10 3 .9August— 1 2 1 . 1 1 2 1 .0 12U.1* 105.9 11*0.1 1 3 1 .0 12 2 .9 118 .9 126.1* August— 10 3 .2 10 5 .5 lOii.l* 96.5 106 .9 105 .0 10 3 .5 105 .8 10ii.8September 1 2 1 . 1 : 1 2 1 .3 121*.!* 106.7 11*0.1 13 5 .0 122.1* 1 19 .2 12 6 .5 September 10l*.0 10 5 .8 (V) 99.1* 106 .0 10 5 .7 10l*.3 107 .0 10 5 .3O ctober— 1 2 1 .5 i a . i 1 2 1 .6 106.3 1U5.9 13 5 .0 12 2 .3 1 19 .3 126 .8 O ctober— 10l*.l* 105.1* ( r / ) 100 .3 10 5 .2 10 5 .7 10 7 .1 10 7 .7 10 5 .5November- 1 2 1 .7 i a . o 12U.7 106.7 11*3.7 13 5 .3 12 2 .2 1 19 .3 12 6 .7 November- 10l*.6 IOI4.8 107.7 10 1 .5 105.1* 10 5 .7 109.1* 107 .7 105 .7December- 1 2 1 .3 1 1 9 . 1 12 £ .0 106 .6 11*1*.7 13 5 .3 1 2 2 . 1 1 19 .5 12 7 .0 December- 107 .0 107 .9 (i/5 10 2 .3 1 1 5 .0 106 .2 109.!* 108.9 10 7 .6
2/ Not a v a ila b le ,
Digitized for FRASER http://fraser.stlouisfed.org/ Federal Reserve Bank of St. Louis
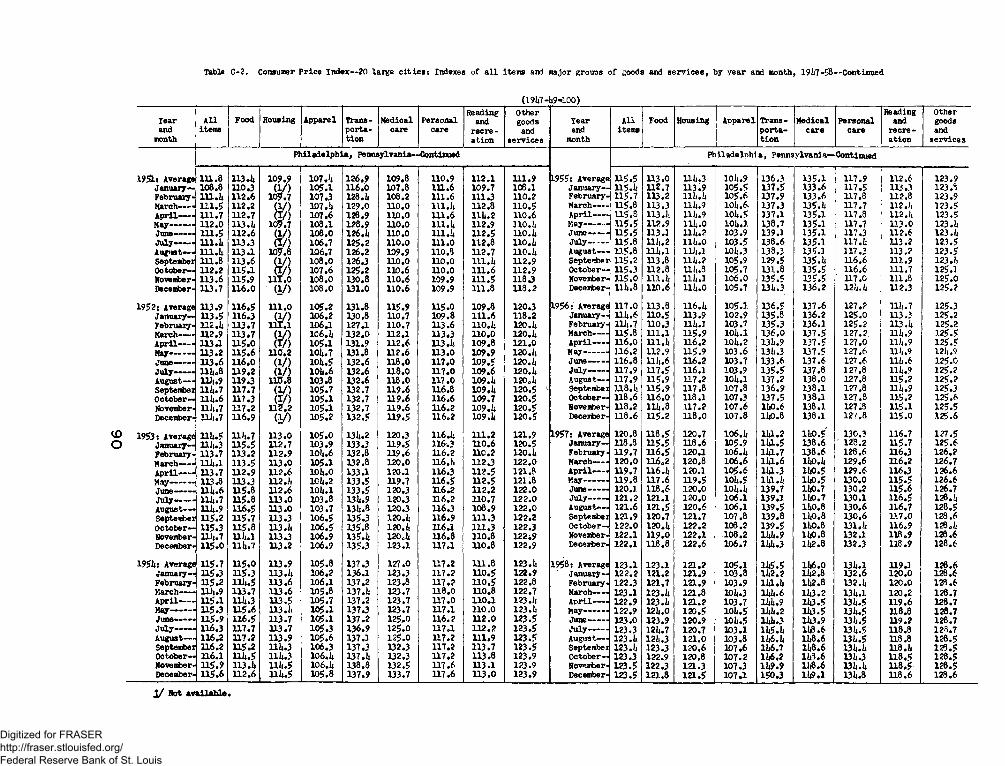
Table C -2 . Consumer P r ice In d ex— 20 la rg e c i t i e s : Indexes o f a l l item s and major g r o w s o f goods and s e r v ic e s , by yea r and month, 19la7-5 8 --C on tin u ed
(1917-1:9-100)
Yearand
month
A l litem s
Food Housing A pparel Transp o r ta t io n
M edicalcare
Personalcare
Readingand
r e c r e a t io n
Othergoods
ands e r v ic e s
Yearand
month
A llitem s
Food Housing A pparel Transp o r ta t io n
M edica lca re
P ersonalcare
Readingand
r e c r e a t io n
Othergoodsand
s e r v ic e s
P h ila d e lp h ia , Pennsylvania—•Continued P h ila d e lp h ia , Pennsylvania—■Continued
1951* Average 111*8 113 .ii 10 9 .9 1 0 7 .U 126 .9 109 .8 110 .9 1 1 2 .1 U 1 .9 1955: Average U 5 .5 U 3 .0 H l* .3 10l*.9 136 .3 135 .1 1 17 .9 112 .6 123 .9January— 108.8 110 .3 .S3 105.1 116 .0 107 .8 111 .6 109 .7 106 .1 January— 115.1* 112 .7 U 3 .9 105 .5 137 .5 13 3 .6 117 .5 113.3 123 .3February- 111.1* 1 1 2 .6 107 .3 128.1* 108 .2 111 .6 111 .3 110 .2 February- 115 .7 113 .2 111*.)* 105 .6 137 .9 1 3 3 .6 U 7 .8 112 .8 123 .9March— - 1 11 .5 112 .2 ( 1 / ) 107.!) 129 .0 110 .0 1U .1* 112 .8 1 10 .5 M arch-— U 5 .8 113 .3 11)*.9 10)*.6. 137 .3 135.1* U 7 .7 112.)* 1 23 .5A p r i l ------ 111 .7 112 .7 (X /) 107 .6 128 .9 110 .0 11 1 .6 l l i * .2 110 .6 A p r i l - — 115 .8 113.1* lll*c9 io l* .5 337.1 135 .1 117.8 112.)* 123 .5May— ------ 11 2 .0 113.1* 109 .7 108 .1 128 .9 UO.O 111.1* 112 .9 3.10.1* May---------- U 5 .5 112 .9 l l i* .0 10U.1 138 .7 135 .3 117.7 11 3 .0 123.1*June— — 111 .5 1 1 2 .6 ( 1 / ) 1 08 .0 1 2 6 .It n o . o 111.1* 11 2 .5 n o . i* June--------- U 5 .5 113.3 H i* . 2 103.9 139.3 1 35 .1 117 .3 112 .6 123.1*J u ly -------- 111.1* 113 .3 an 1 06 .7 125 .2 1 10 .0 m . o 112 .8 110.1* Ju ly -------- U 5 .8 111,.2 11)4.0 1 03 .5 1 38 .6 135.1 117.1; U 3 .2 123 .5August— 111.1* 11 3 .1 1 0 ? .8 106.7 126 .2 109 .9 110 .8 112 .7 110.1* August— 115 .8 l l i t . l 11), .3 101*.3 133 .3 135.1 117 .3 1 1 3 .? 123 .5September 111 .8 11 3 .6 ( 1 / ) 1 0 8 .0 126.3 UO.O 110 .0 l l l . l * U 2 .9 September 115 .2 U 3 .8 111*.? 105 .9 129 .5 135.1* 116 .6 m . 9 123.1,O ctober— 1 12 .2 115 .1 an 1 07 .6 125 .2 110 .6 UO.O 1 U .6 1 1 2 .9 O ctober— U 5 .3 U 2 .8 111*.8 105 .7 131 .8 1 3 5 .5 116 .6 111.7 125.1November- 1 1 3 .6 115 .9 111 .0 108.0 130 .8 U 0 .6 109 .9 1 1 1 .5 118 3 November- U 5 .0 l U . i i l l l * . l 1 0 6 .0 135 .5 135 .5 117.0 111.8 125 .0December- 113 .7 1 1 6 .0 ( 1 / ) 1 0 8 .0 131 .0 n o . 6 109 .9 111 .8 1 1 8 .2 December- U l* .8 110 .6 l l l* .0 1 05 .7 131*.3 136 .2 121*. 1* 112.3 125 .2
1952* Average 113 .9 11 6 .5 1 1 1 .0 105 .2 131 .8 115 .9 115.0 109 .8 120 .3 1956: Average 117 .0 113 .8 116.1* 1 0 5 .1 336 .5 13 7 .6 127 .2 n i i . 7 125.3January— 113 .5 116 .3 i&2 106 .2 130.8 110.7 109 .8 1 U .6 118 .2 January— U l* .6 u o . 5 U 3 .9 102 .9 135 .8 136 .2 125 .0 113.3 125 .2February- 112 ,li 1 13 .7 106 .1 127 .1 110 .7 U 3 .6 X io .u 120.1* February- U li .7 n o . 3 Ul*.3 103 .7 135 .3 136.3 125 .2 113.1* 125 .2March— - H 2 .9 11 3 .7 ( i / ) 1C6.1* 1 3 2 .0 U 2 .1 U 3 .3 U 0 .0 120.1* M arch-— U 5 .8 u i . i 11 5 .9 10 l* .l 1 3 6 .0 137 .5 1 2 7 .2 n i* .9 125 .5A p r i l ------- 113 .1 115.0 ( I / ) 105 .1 131 .9 1 12 .6 U 3 .l i 1 0 9 .8 1 2 1 .0 A p r i l ------ 116 .0 U l . l , 316 .2 lO h .2 1314.9 13 7 .5 127 .0 n )* .9 125.5May---------- 113 .2 1 1 5 .6 1 10 .2 10i*.7 131.8 U 2 .6 U 3 .0 1 0 9 .9 120.1* M ay-.......... 3.16.2 112 .9 115 .9 103 .6 13i».3 137 .5 127 .6 m . 9 12), .9June— — 113 .6 1 1 6 .0 ( 1 / ) io l* .5 132 .6 118 .0 117 .0 10 9 .5 120.1* June-------- 1 16 .8 111».6 116 .2 103 .7 13 3 .6 137 .6 127 .6 l l h . 6 125 .0J u ly — — lli* .8 119 .2 sa 10i*.6 132 .6 U 8 .0 U 7 .0 10 9 .6 120.1* J u ly -------- U 7 .9 1 17 .5 116.3 103 .9 1 3 5 .5 137 .8 127 .8 111*.9 125 .2August— 111* .9 119 .3 103 .8 13 2 .6 1 18 .0 1 1 7 .0 109.1* 120.1; August— 1 1 7 .9 115 .9 U 7 .2 10i*.l 137 .2 138 .0 127.8 U 5 .2 125 .2September l l l t .7 117 .7 an 1 05 .7 132.7 119 .6 U 6 .8 109.1* 1 2 0 .5 L September 118.1* 11 5 .9 117 .8 1 07 .8 1 3 6 .9 138 .1 127 .8 m .9 125.3O ctober— ll l* .6 117 .3 an 105 .1 132 .7 U 9 .6 116 .6 109 .7 120 .5 O ctober— 118 .6 U 6 .0 118 .1 107 .3 1 37 .5 338.1 127 .8 115 .2 125 .6November- 111*.7 117 .2 1 17 .2 105.1 132 .7 U 9 .6 U 6 .2 109.1* 1 20 .5 November- U 8 .2 111*.8 117 .2 30 7 .6 11*0.6 138 .1 127.3 115 .1 1 25 .5December- 111**7 1 1 6 .9 an 105 .2 1 32 .5 U 9 .5 U 6 .2 109.1* 1 2 0 .5 December- 118 .6 115 .2 U 8 .0 1 07 .8 11*0.8 138 .1 127 .8 1 15 .0 125 .6
1953* Average 111*.5 11)*.7 113 .0 105.0 131*.2 120.3 U6.1* 1 11 .2 121 .9 1957: Average 120 .8 1 1 8 .5 120 .7 106.1* 11*1.2 11*0.5 130 .3 116 .7 1 27 .5January— l i l t . 3 1 1 5 .5 112 .7 103 .9 133.3 U 9 .5 116.3 U 0 .6 120 .5 January— 118.8 U 5 .5 U 8 .6 105 .9 11*1.5 13 8 .6 128 .2 U 5 .7 125 .6February- 113 .7 1 1 3 .2 1 1 2 .9 10)*.6 132.8 119 .6 U 6 .2 U C .2 120.1* February- U 9 .7 1 1 6 .5 120 .1 106. 1* 11*1.7 1 3 8 .6 128 .6 316.3 126 .2March— — l l l * . l 113 .5 1 1 3 .0 105 .1 132 .8 120 .0 116 oh 112 .3 122 .0 March------ 120 .0 116 .2 120 .8 1 0 6 .6 11*1.6 11*0.1* 129 .6 U 6 .2 126 .7A p r i l— 113.7 11 2 .9 112 .6 10)*.0 133 .1 120 .1 116.3 1 1 2 .5 121 .8 A p r i l ------ U 9 .7 116.1* 120 .1 105.6 11*1.3 11*0.5 129 .6 116.3 126.6May— — 113.8 113 .3 112.)* lCi*.2 133 .5 U 9 .7 U 6 .5 U 2 .5 121 .8 May— — - 119 .8 11 7 .6 U 9 .5 10l*.5 lLl. L' 11*0.5 130 .0 1 15 .5 126 .6June-------- 111*.6 115 .8 112.6 10l*.l 1 33 .5 120 .3 U 6 .2 112.2 122.0 Jun e------- 120.3 1 1 8 .6 120.0 10l*.i 139 .7 11*0.7 330 .2 115 .6 126.7Ju ly— — 11U.7 H 5 .8 113.0 103.8 131*.9 120 .3 U 6 .2 U 0 .7 122.0 J u ly— — 121.2 121.1 120.0 106.1 139.3 11*0.7 130.1 116 .5 128.iiAugust— H l*.9 116 .5 113.0 1 03 .7 13U.8 120 .3 116.3 10 8 .9 122.0 August— 121.6 121 .5 120.6 106.1 139 .5 11*0.8 13 0 .6 316 .7 128 .5September 115 .2 115 .7 113 .3 106 .5 135 .3 120. 1* 116 .9 111 .3 122.2 September 121 .9 120 .7 121 .7 107.8 139 .8 11*0.8 1 30 .6 1 17 .0 12 8 .6O ctober— 115.3 115.8 113 .i* 10 6 .5 135.8 120. 1* U 6 .1 1 U .3 122 .3 O ctober— 122.0 120. 1* 122.2 108.2 139 .5 11*0.8 131.1* 1 16 .9 128. 1-November- m * .7 U l* .l 113 .3 1 06 .9 135.1* 120. 1* 116.8 110.8 122*9 November- 122.1 119.0 122.1 108.2 11*1*. 9 11*0 .8 132 .1 118 .9 128 .6December- 115.0 l l i* .7 113.2 106 .9 135.3 123 .1 117 .1 U 0 .8 122 .9 Deceirber- 122.1 U8.8 122.6 106 .7 ll*l*.3 11*2.8 132 .3 118 .9 128.6
1951** Average 115 .7 115.0 113 .9 105.8 137 .3 127 .0 U 7 .2 U 1 .8 123.it 1958: Average 123 .1 123 .1 121.2 105 .1 11*5.5 11*6 .0 13i*.l U 9 .3 128.6January— U 5 .3 115 .3 113 . 1* 106.2 136.1 123.3 117 .2 u o . 5 122 .9 January— 122.2 121.2 121 .9 103.8 11*2 .2 11*2.8 132 .6 120.0 128.6February- 315.2 l l i* .5 113.6 106.1 137 .2 123.8 117 .2 u o . 5 122.8 February- 122 .3 121 .7 121 .9 103 .9 U l . i* 11*2.8 132. 1* 12C.0 128 .6March— HI* .9 11 3 .7 1 1 3 .6 105.8 137.1; 123.7 118.0 U 0 .8 122 .7 March------ 123 .1 123.1* 121.8 10l*.3 11*1*. 6 11*3 .2 13l*.l 120.2 128 .7A p r i l ------May— — -
115 .1U 5 .3
l l i t .3U5 .6113 .5U 3 .i i
105 .710 5 .1
137 .2137.3
123 .7123 .7
U7 .0117 .1
110.1110.0
123.1*123.1*
A p r i l ------May— — —
1 22 .91 22 .9
123.1*121i.O 121.2
120.5103 .7 101*. 5
U*l*.9 11*1*.2
11*3.511*3.5
131*.5 13l*.5
1 1 9 .6U8.8128 .7128 .7
June-— — 115 .9 116 .5 113 .7 1Q5.1 137 .2 125.0 116.2 U 2 .0 123 .5 June-------- 123.0 123 .9 120 .9 10l*.5 U*l*.3 11*3.9 13i*.5 U9.2 128 .7J u ly -------- 116 .3 117 .7 113.7 105 .3 136 .9 125.0 U 7 .1 112.2 1 2 3 .5 J u ly -------- 123 .3 121*.7 120 .7 303 .1 11*5.1* 11*8 .6 131*.5 118.8 123 .7August— 116 .2 117 .2 1 1 3 .9 105.6 137 .1 125.0 U 7 .2 111 .9 123 .5 August— 123 .li 121,.3 121.0 103.8 11*6 . 1* 11*8 .6 13l*.5 U8.8 128 .5September 116 .2 115.2 U l*.3 1 06 .3 137.3 132.3 117 .2 11 3 .7 123 .5 September 123.1* 123 .3 120.6 107 .6 11*6.7 11*8.6 131*.!* U8 . 1* 128 .5O ctober— 116.1 n i* .5 111*. 3 106. 1* 137.1* 132.3 U 7 .2 113.8 123 .9 O ctober— 123.3 122 .9 120.8 10 7 .2 11*6.2 11*3.6 131* .3 1 1 8 .5 128 .5Novenber- U 5 .9 113.1* l l i i . 5 106.1* 138.8 132 .5 117 .6 U 3 .1 123.9 November- 1 23 .5 122 .3 121 .3 107 .3 11*9.9 11*8 .6 131*. 1* U 8 .5 1 28 .5December- 115.6 112.6 u i* .5 105.8 137 .9 133.7 U 7 .6 U 3 .0 1 23 .9 December- 123 .5 121.8 1 2 1 .5 107 .1 150 .3 11*9.1 131*.8 U8 .6 1 28 .6
1 / Not a v a ila b le *
Digitized for FRASER http://fraser.stlouisfed.org/ Federal Reserve Bank of St. Louis

Table C -2 . Consumer P r ice In dex— 20 la rge c i t i e s : Indexes o f a l l item s and major groups o f goods and s e r v ic e s , by y ea r and month, 191:7-58— Continued
(19U7-U9-100)
Yearand
month
A l litems
Food Housing Apparel Transp o rta t io n
M edicalcare
P ersonalcare
Reading and
r e c r e - a t io n
Othergoods
ands e r v ic e s
Yearand
month
A l litem s
Food Housing A pparel Transp o r ta t io n
M edica lca re
Personalcare
Readingand
r e c r e a t io n
Othergoodsand
s e r v ic e s
P ittsbu rgh , Pennsylvania P ittsb u rg h , Pennsylvania— Continued
191:7: Average 95 .8 96 .2 9 5 .5 96 .3 91 .6 95.6 9 9 .1 9 6 .5 96.3 1951: Average 110 .8 1 12 .0 130..*4 106 .8 12 8 .6 110 .7 108 .3 1 0 5 .0 1 10 .9January— 91.8 90 .0 ( 1 / ) 93.1 89 .7 9iu2 98 .7 9 6 .5 93 .0 January— 1 0 7 .9 108 .1 108 .5 10 3 .1 1 25 .0 107 .3 109 .0 101-.6 109 .iiFebru ary- 92.1 9 0 .2 V 9U.U 89 .6 91:. 5 9 9 .6 9 6 .5 9 3 .0 February- 1 09 .2 110.5 ( l / ) 1 05 .6 12):.8 107 .3 109 .2 101:.8 3 09 .5March— 9 3 .6 93 .3 ' ( I / )
9 5 .0d / )
95.9 90.2 9U.9 99 .7 96 .5 9 2 .6 March— 1 0 9 .>4 110.1: (T /) 106.?: 1 2 6 .0 108.1: 109 .2 IOI4.8 109 .7A p r i l -------May----------
9 3 .59 3 .9
92.39 3 .5
95.695 .7
90 .990 .9
95.U95.U
10 1 .09 9 a
96.596.593.893.8
A p r i l ------Hay— — —
109.81 10 .5
1 10 .7112 .0
1 0 ? . 7 ( 1 / )
1 0 6 .5106 .7
126 .0126.1
109 .0 109 u0
108 .9109 .2
105 .9105 .7
309-81 ]0 .0
June— — - 9Ju8 95 .7W
95 .0 91 .1 95.3 9 7 a 96.5 9 9 .5 Jun e-— - 110.5 111 .9 ( r / ) 10 6 .0 126.1 112 .1 109 .6 105 .5 110 .2J u ly --------- 95 .7 97 .1 9k.k 91 .2 95.6 97.3 96.5 98.3 J u ly -------- l i i . / i 1 13 .2 111 .5 107 .0 126 .1 112 .1 108 .2 105 .5 n o . 5August— 97.1 98 .2 96.7 96.1: 92 .0 9S.U 97 .9 9 6 .5 9 8 .0 A u gu st-- 111 .1 112 .7 ( 1/ ) 106.7 126 .1 112 .0 108.2 105.3 110.1:September 9 9 .0 1 01 .9
f t !
98.1 9 3 .U 95.5 9 7 .6 96.5 9 8 .0 September 311 .8 112 .2 a / ) 108 .8 132 .0 112 .8 107 .2 105 .0 111 .3O ctober— 98 .8 100 .1 98 .6 9 3 .U 96.2 9 8 .6 9 6 .5 9 8 .5 O ctober— 112 .5 113 .5 11T.8 106 .7 133 . h 112 .8 106 .8 10ii.6 111 .5November- 9 8 .9 99 .7 a / ) 99.1 93.5 97.3 100 .7 96 .0 98 .5 November- 112 .9 11U.3 ( 1 / ) 108 .1 136 .0 112 .8 106 .9 10i:.2 i m . 5December- 100 .2 1 0 1 .8 q / ) 9 9 .6 93.1: 97.3 101 .9 96.5 9 8 .5 December- 112.3 IH4.O ( T / ) 107 .): 13 6 .0 112 .8 107 .6 10)4 a l l l i .5
191:8: Average 102 .8 1 0 3 .8 102 .2 102 .7 lttt.U 101.2 1 0 1 .9 101 .1 100 .2 1952: Average 3.12.8 l l l i .O 111 .9 IOJ4J 4 138.1 111:.5 106. >• 105. l1 116 .7January— i o i .U 1 0 3 .U I X . 9 98 .3 98.3 99.8 10 2 .2 101 .1 98 .5 January— 313 .1 l l i i . 5 11 1 .9 106 .0 137 .3 113 .3 107 .6 105.1: 11 !:.8F ebru ary- 100 .1 9 9 .8 ( V ) 99 .9 99.3 1 X .1 101 .3 101 .1 98 .5 February- 112.3 111 .7 (V )
( T / )106 .7 138 .0 113 .3 107.2 105.»: 116 .7
March------- 100 .1 9 9 .5 ( r / ) 1 X .5 99.3 99.9 1 0 1 .0 101 .1 9 8 .5 M arch-— 111 .9 1 3 1 J : 10U.8 1 3 8 .0 l l l i .O 107.3 105.3 116 .7A p r i l - -----May-------- --
101 .2 102 .1
101 .9103 .8
10U.8(V)
100.8101 .0
99.399.1:
99.9101.1:
101a99 .5
101 .1101 .1
9 8 .598 .5
A p r i l ------May----------
112 .3H 2 .h
1 1 2 . J4 113 .2
11T .7( 1 / )
10ii.810I4.1
1 38 .1138 .1
1111.01111.0
106 .9106 .2
1 05 .11 05 .1
117 .0117 .0
June— — J u ly - -------
103.1:10U.6
106 .71 0 8 .0 , S3 101 .7
101 .899.8
101 .8101.1:101.U
98 .899 .1
10 1 .1101 .1
98 .596 .5
June-— - 1 1 2 .2113 .0
113 .2115 .3
( I / )11T .8
10 3 .9103 .0
13 8 .0138.1
1111.01111.0
105 .9105 .9
10 !i.9 10U.8
117 .0117 .0
August----- 101:. 9 107 .3 a / ) lOii.O 103 .6 !! 101.3 99.8 101 .1 I X . 6 August- - 1 1 3 .5 117 .1 ( 1 / ) 102 .9 138 .0 l ll i .O 105 .9 10ii.7 117 .0September lO ii.9 106 .7 ( V ) 105.7 103.8 101.3 99 .7 101 .1 102 ,7 September 113 .2 1 1 5 .? (T/> 10lu5 138 .2 115.1: 105 .9 10 !:.5 116.9O ctober— 10U.2 10U.5 10J .6 105.9 lOii.O 101.3 106 .5 101 .1 102 .7 October- 113 . 115 .2 117 .5 lO h.2 138 .2 115 . h 105 .9 106 . >4 1 16 .9November- 1 0 3 .5 1 0 2 .5 ( 1 / ) 10 6 .5 103 .9 102 .9 1 06 .8 101 .1 1 02 .7 November- 113 .5 115 .); ( 1 / ) lO ) :. ! 1 3 8 .2 1 1 5 . h 105 .9 106 fl): 116 .9December- 102 .9 101 .1 ( T / ) 106.3 lO lu l 103 .1 107 .1 101 .1 102 .7 Decenber- 113.U ID 4.2 (T / ) 103 .7 139 .3 116 .8 105.7 106 . *4 116 .9
191:9: Average 101.1: I X .0 102.1: I X . 9 107 .0 103.3 9 9 .0 10 2 .5 103 .5 1953: Average 113 .6 3 1 3 .6 115 .0 103 .9 l/iO.O 120 . h 108.3 9 ? . l 118 .9January— 102 .8 10 1 .1 103 .8 10U.8 101:. 7 103.1 10 6 .2 10 2 .5 102 .7 January— 13 2 ,6 1 13 .0 113 .7 103 . 14 139 .!: 116 .8 105.5 98.1: 117 .0Febru ary- 101 .3 98.3 ( V ) I 0 h . 3 105 .6 103.1 10 3 .0 1 0 2 .5 102 .7 A p r i l - — 112 .3 113 .8 1 U .3 IOI4. I 1 3 9 .0 121 ,1 106.1 97 .2 118.8March------- 1 0 1 .6 99.1: ja
8$103 .5 105.5 103.2 1 02 .0 1C2.5 102 .7 J u ly — — 113 .8 11):.8 1 1 5 .0 103 .1 m o , 7 121.3 106,1 95 .0 1L8.9
A p r i l -------May-----------
101 .8101 .8
100 .11D1.1
103.3101.2
105.9106.3
103.2103.2
98 .99 8 .5
102 .51 0 2 .5
103 .5103 .5
O ctob er- 111:.7 1 15 .0 116 .2 io h .5 1)40.3 120.8 112 .7 97 .1 11 9 .6
June-------- 101 .9 101 .5 101 .0 106.9 103.2 9 7 .9 10 2 .5 1 03 .5 195 ta Average III4.6 113 .5 116 .8 103 .6 337.3 126.2 115 .9 9 8 .1 120 .5Ju ly --------- 1 0 1 .2 99 .8 10 7 .3 1 X .0 106 .9 103 ,2 97 .9 102.5 103.9 January— lli..»4 113 . )4 3.16 a 101:. h 1 3 9 J : 121 .2 113 .3 99 .7 120 .5August— 101 .5 1 0 1 .0 ( 1 / ) 99 .7 106 .9 103 .2 97 .0 102.5 103 .9 A p r i l ------ l l l u 5 113.3 1 16 .5 103 . h 138 .6 127 .8 116 .5 96 .8 1 20 .5September 101.1: 101 .1 1 01 .8 99 .0 106 .9 103.2 96 .»: 1 02 .5 103 .9 J u ly -------- 115.1: 115 .6 117 .1 103 .7 1 3 7 .5 128 .0 116 .1 97 .7 120 .6O ctober—November-
100 .7100 .8
9 9 .599.8
1 01 .91 0 1 .9
9 8 .69 8 a
106 .91 07 .0
103.2103.1:
96 .796.7
10 2 .51 0 2 .5
101:,0 lOl-.O
O cto b e r - U li .3 1 13 .0 117 .0 103.7 13l:.2 126.1 116 ,6 93 .3 120 .5
D ecenber- 100 .2 97 .6 102 .0 97 .6 1114.5 I 0I4. I 9 6 .7 102 .5 10U.0 1955: Average January—
113.8113 .8
111 .2111 .0
116 . 14 116 .8
1 02 .11 02 .1
1 36 .91 3 8 .0
129 .7126 .5
116. »• 116 .9
98.1:99.1
120 .9120.»4
1950: Average 102 .2 1 0 1 .1 103 .2 98 .1 118 .9 105.6 9 7 .1 101tf4 1 05 .7 A p r i l ------ 113 .8 n i . 5 116 .2 102 .7 137 .7 127 . »4 116 .5 9 8 .6 120 . hJanuary— I X .0 9 7 .0 102 .1 97 .5 l l l i .7 101i.l 95 .2 10 2 .5 10U.0 July-------- U l : .0 112 .3 116 .1 101 .2 137 .7 131 .6 116 .5 97.7 120.UF ebruary-March—
99 .69 9 .7
96.U9 6 .5
101 .9101 .9
97.397 .2
lU i .6U U .5
iou.1105.1;
9h .59U.3
102a102 .3
103.9103.6
O cto b e r - 113 .8 111 .1 116 . h 102 .2 1 35 .5 131 .8 115 .8 9 8 .0 121 .9
A p r i l ------- 99 .9 97 .7 1 01 .9 9 6 .5 113 .9 105.1: 9t*.2 102 .3 103 .5 1956; Average 1 16 .5 1 13 .0 1 1 9 .5 103 .8 138 .3 137 .5 118 .9 101i .1i 122.ltMay----------- 100 .6 99 .7 101 .6 9 6 .7 l l l i . 6 105.1: 9lu2 102 .3 1 03 .6 January— 133 .6 109 . >4 117.3 103 .0 133 .5 131 .6 116 .8 100.3 121 .9June— 101 .1 100 .8 101 .8 97 .0 115.0 105.6 9 3 .9 1 X .7 10 3 .5 A p r i l— 115 .2 110 .5 11 8 .8 1 0 3 .6 136 .0 13 5 .0 119 .1 lO ii . l 122 .2Ju ly --------- 101.7 1 0 2 .6 102 .3 96.7 115.3 105.9 93 .9 99.1: 103 .5 J u ly -------- 117 .3 115.8 120 .3 1 03 .5 136 .3 135 .5 119.2 101: .8 122 .5August— September O ctober— N oveaber- De cam ber-
103 .510U.1:105.2105.110 6 .0
103 .6 10ii.3 10li. 9103 .9105 .9
103 .3
>828!
97.3 99 .6
I X .1 1 00 .6 I X .6
12)4.6121u8121:.9 12J:.9 125 .0
106.0106,2106.1106,1:107 .0
95.39 5 .9
10 2 .510U.9106 .2
9 9 .5i x . 5i x . 7101.9101.8
106 .1108 .2108 .6108 .8109 .0
O ctober— 1 18 .2 111: .8 120 .2 10)i.5 113 .5 I B .8 119.3 106 .3 122 .8
1/ Not available.
Digitized for FRASER http://fraser.stlouisfed.org/ Federal Reserve Bank of St. Louis
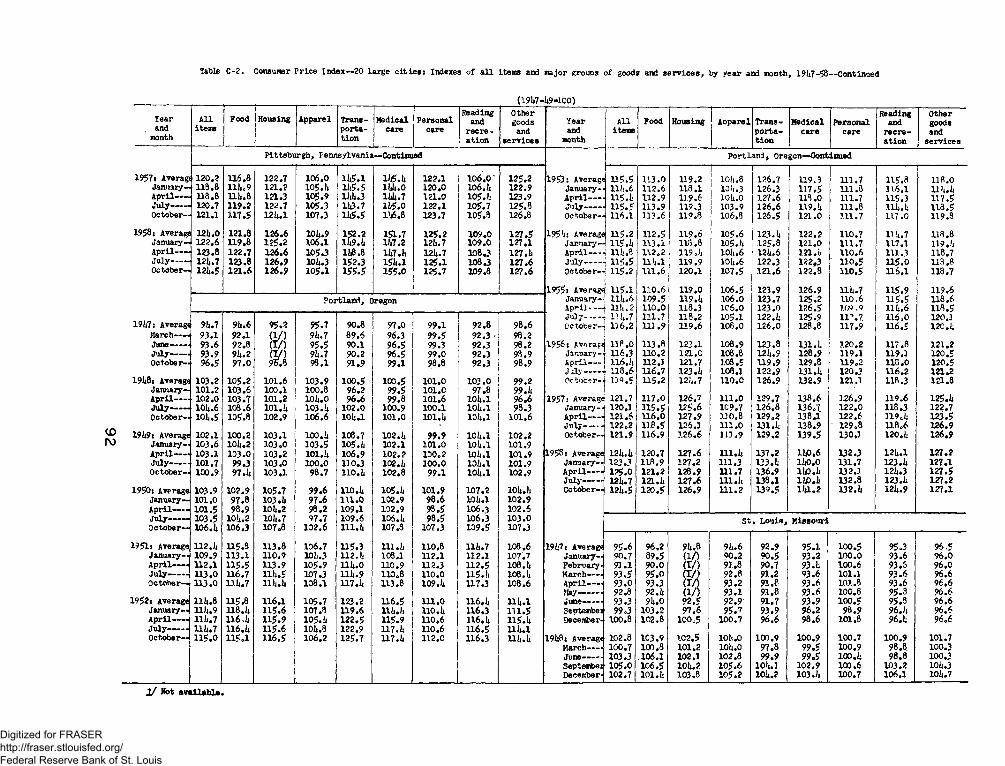
Table C -2 . Consumer P rice Index—20 large c i t i e s : Indexes o f a l l items and major groups o f goods and s e rv ice s , by year and month, 191:7-58-—Continued
(l9 U 7 - ifl« 1 0 0 )
Tear , and
month
A llitems
Food Housing A pparel Transp o r ta t io n
M edicalcare
P ersonalcare
Reading * and
r e c r e - a t io n
O thergoods
ands e r v ic e s
Yearand
month
A llitem s
Food Housing A op arel Transp o r ta t io n
M edica lca re
P ersonalcare
Readingand
r e c r e a t io n
O thergoodsand
s e r v ic e sP ittsb u rg h , Pennsylvania— Continued P ortla n d , Oregon— Continued
1957: Average 120 ,2 116 .8 122 .7 106 .0 I l i 5 . l 1 1 5 4 122 .1 106.0 * 125 .2 1953: Average 115 .5 11 3 .0 139 .2 10 li.8 126 .7 119 <3 111 . 7 115 .8 13 8 .0January— 113 ,8 111:.9 1 21 .2 1 0 5 .!: U i5 .5 lU l.O 120 .0 1 0 6 4 122 .9 January— 111.. 6 1 1 2 .6 118 .1 10li .3 126 .3 117 .5 111 .8 U .6 .1 11 k .kA p r i l ------ 11.8,8 l l t i .8 121 .3 105 .9 lU i .3 i u . 7 121 .0 105.1) 123 .9 A p r i l ------ 1 1 5 4 1 1 2 .9 119 .6 lOli.O 12 7 .6 113 .0 111.7 115 .3 117 .5Ju ly -------- 120.7 11 9 .2 122 .7 105 .3 11)3.7 U 5 .0 122 .1 1 05 .7 125 .8 Ju ly-------- 1 1 5 .5 113 .9 119.3 103 .9 1 2 6 .6 1 1 9 4 111 .8 111 :4 11 8 .5O ctober— 121.1 117 .5 12U.1 107 .3 1U5.5 11:6,8 123.7 1 05 .3 126.8 O ctober— 116.1 113 .6 119 .8 106.8 126 .5 1 21 .0 311 .7 H ? .0 119 .8
1958: Average 121u0 121 .8 1 2 6 .6 10U.9 152 .2 151.7 125 .2 1 0 9 .0 1 2 7 .5 195 ':: Average 115 .2 112 .5 1 1 9 .6 105.6 123. )4 1 2 2 .2 110 .7 1 U .7 118 .8January— 122 .6 119 .8 12 5 .2 10 6 .1 U 9 .l t 11:7.2 1 2 k . 7 1 0 9 .0 12 7 .1 January— 1 1 5 4 113 .1 113 ,8 10 5 4 1 25 .8 121 .0 1 11 .7 H 7 .1 119 . ‘4A p r i l ------ 123 .8 12 2 .7 126 .6 005 .3 110.8 U 7 .I ) 12U.7 108.3 1 2 7 4 A p r i l— * 111-08 112 .2 1 1 9 4 io h .6 \ 2 k . 6 1 2 1 4 1 10 .6 111 .3 118 .7J u ly -------- 12U.7 123 .8 12 6 .9 10lt.3 152.3 151).l 125 .1 108 .3 1 2 7 .6 J u ly -------- - 1 15 .5 l l l j . l 1 19 .9 10h .6 122 .3 122 ,3 ' 11 0 .5 115 .0 119 .8O ctober— 1 2 i .5 1 2 1 .6 1 2 6 .9 1 0 5 .1 1 55 .5 155 .0 125.7 109 .8 1 27 .6 O c t o b e r -| 115 .2 1 11 .6 120 .1 107 .5 1 2 1 .6 1 22 ,8 110 .5 116 .1 118 .7
1955: Average U 5 .1 11 0 .6 1 19 .0 10 6 .5 123 .9 126 .9 1 U .7 115 .9 119 .6P ortla n d . Oregon January--! 1 4 . 6 109 .5 1 1 9 4 106 .0 123 .7 125 .2 110 .6 115 .5 1 18 .6
A p r i l - — 4 111$. 2 1 10 .0 118 .3 106 .0 12 3 .0 1 2 6 .5 ,<? 1 U . 6 1 18 .5J u ly - — i iu .? 111 ,7 118 .2 105.1 1 2 2 4 125 .9 117.7. 116 ,0 120.3
191:7: Average 9lt.7 9ii.6 9 5 .2 95.7 90 .8 97.0 9 9 .1 92 .8 9 8 .6 O ctober—1 116 .2 11 1 .9 11 9 .6 1 08 ,0 1 2 6 ,0 128 ,8 117 .9 116 .5 12C 4March-— - 9 3 .1 92 .1 (V) 9 k . 7 8 9 .6 96.3 99 .5 92 .3 ' 98 .2 IJune-------- 93 .6 92.8 <T/) 9 5 .5 90 .1 9 6 .5 99.3 92 .3 98 .2 1956: Average 11 8 ,0 113 .8 123 .1 108 .9 123 .8 1 3 1 4 1 2 0 .2 117 .8 121 .2J u ly -------- 93 .9 91:.2 an 9 k .7 90.2 96 .5 99 .0 92 .3 93 .9 January-* 116.3 110 .2 la . c 108 .8 1 2 U .9 128 .9 119 .1 119.1 120 .5O ctober— 96 .5 9 7 .0 96 .3 98 .1 9 1 .9 99.1 98,8 92 .3 i 98 .9 A p r i l - - - 116.1: 112.1 121.7 10 8 .5 119 .9 129 .8 119 .2 1 1 0 .0 120.5jaly-------*!• U 3 .6 116 ,7 1234 108.1 1 22 .9 1 3 1 4 120 .3 1 16 .2 121 .2
191:8: Average 103 .2 10 5 .2 10 1 .6 103 .9 100.5 100 .5 101 .0 1 0 3 .0 9 9 ,2 O ctober—f 13^.5 115 .2 12u. 7 1 1 0 .0 1 26 .9 132 .9 121.1 118 .3 121 .8January— 101 .2 1 0 3 .6 100 .1 100 .8 96 .2 99 .5 1 0 1 .C 97 .8 9 9 4 iA p r i l ------ 102 .0 10 3 .7 1 01 .2 lO k.O 9 6 ,6 99 .8 101 .6 10U.1 96 .6 1957: Average1 121 .7 1 1 7 ,0 126 .7 1 1 1 .0 129 .7 138 .6 3.26.9 119 .6 1 2 5 4J u ly ------ 101: .6 1 03 .6 101.1: 1 0 3 4 1 0 2 .0 100 .9 1 00 .1 10U.1 98 .3 January— 120.1 1 15 .5 1 2 5 .6 1C9.7 126 .8 136 ,7 1 2 2 .0 118 .3 122 .7O ctober— 1 (4 .5 105 .8 102 .9 10 6 .6 10U.1 1 01 .0 1 0 1 4 10U.1 1 0 1 ,6 A p r i l---- 12 1 .6 116 .0 1 2 7 .9 130 .8 12 9 .2 138.1 1 22 .6 1 1 9 4 1 23 .5
J u l y - — * 122 ,2 113 .5 126.1 111 .0 1 3 1 4 1 38 .9 1 29 .8 118 .6 126 .9191:9: Average 102 .1 100 .2 103 .1 1 0 0 4 108 .7 1 0 2 4 99 .9 10U.1 1 02 .2 O c to b e r - 121 .9 116 .9 1 2 6 ,6 111 .9 129 ,2 1 3 9 .5 130.3 1 2 0 4 126 .9
January~ 103 .6 10 lj.2 10 3 .0 1 0 3 .5 1 0 5 4 102 .1 101 .0 lO it .l 101 .9A p r i l— • 103 .1 103 .0 1 03 .2 1 0 1 4 1 06 .9 10 2 .2 IDO. 2 10U.1 101 .9 1958: Average 1 2 1 :4 120 .7 1 2 7 .6 l l l . i i 137 .2 1 1 0 .6 132 .3 1 2 l i .l 127 .2Ju ly -------- 101 .7 99.3 103 .0 100 .0 110 .3 1 0 2 4 100 .0 l O k . l 101 .9 January— 123.3 1 1 8 .9 1 27 .2 111 .3 1 3 3 4 litO.O 131 .7 1 2 3 4 127 .1O ctober— 100 .9 97.1: 10 3 .1 98.7 1 1 0 4 102 .8 99 .1 10U.1 102 .9 A p r i l— - l ? 5 .o 121 .2 12 8 .9 111 .7 136 .9 1 1 0 4 132.3 12U.3 1 2 7 .5
J u ly -------- 121:. 7 i a 4 127 .6 l l l . i i 138 .1 110.1* 132 .8 1 2 3 4 1 27 .21950: Average 103 .9 102 .9 10 5 .7 9 9 .6 1 1 0 4 1 0 5 4 1 01 .9 107 .2 1 0 U 4 O ctober— 12li.5 120.5 126 .9 1 1 1 .2 139 .5 D 4I . 2 1 3 2 4 121».9 127 .1
January— 101 .0 9 7 .8 1 0 3 4 9 7 .6 1 1 1 .0 102 .9 98 .6 loa.i 102.9A p r i l----- 10 1 .5 9 8 .9 10U.2 9 8 .2 109 .1 102 .9 9 3 .5 106.3 102.6J u ly - ------ 103 .5 IOJ4.2 10lu7 97 .7 10 9 .6 1 0 6 4 9 8 .5 106.3 103.0 S t - L ou ie- M issou riO c t o b e r - 106.1: 106 .3 107 .8 1 0 2 .6 1 1 1 4 107.8 107.3 109 .5 107.3
1951: Average 112.1: 115.3 113 .8 1 06 .7 115 .3 1 1 1 4 110.8 11U.7 10 8 .6 191:7: Average 9 5 .6 96 .2 9U.8 9U.6 92 .9 95 .1 1 00 .5 95.3 96 ,5January— 109 .9 113 .1 1 10 ,9 10iu3 112 4 108 .1 112 .1 112 .1 107 .7 January— 90.7 89 .5 (I/O 90 .2 90 .5 93 .2 1 0 0 .0 93 .6 9 6 .0A p r i l— - 112 .1 115 .5 113 .9 105 .9 1 U .0 110 .9 112.3 112 .5 1 0 8 4 February* 91 .1 9 0 .0 07) 91 .8 90 .7 9 3 4 100 .6 93 .6 9 6 ,0Ju ly------ 1 13 .0 116 .7 1 U .5 107.3 111:.9 110 ,8 110 .0 H 5 4 1 0 8 4 M arch-— 9 3 ,5 95 .0 an 92 .8 91 .2 9 3 .6 101.1 9 3 .6 96 .6O c t o b e r - 1 1 3 .0 11U.7 1 1 1 :4 1 0 8 .1 1 1 7 4 113 .8 1 0 9 4 117 .3 108 .6 A p r i l— 93 .0 93 .3 an 93 .2 91 .8 9 3 .6 101 .8 93 .6 9 6 .6
May---------- 92.8 9 2 . k an 93 .1 91 .8 93 .6 100 .8 95 .3 96 .61952: Average 1 U .8 115 .8 1 16 .1 10 5 .7 123 .2 116 .5 111 .0 1 1 6 4 l l l i . l June— — * 93.3 9k.O 92.5 92 .9 91 .7 93 .9 10 0 .5 95 .8 96 .6
January— 11):.9 118.1: 115 .6 107 .8 119 .6 11U.I1 1 1 0 4 116 .3 1 U .5 Septembei 99.3 103 .2 97.6 95 .7 9 3 .9 96 .2 98.9 9 6 4 96 .6A p r i l ------ l lix .7 1 1 6 4 1 1 5 .9 1 0 5 4 1 2 2 .5 115 .9 110 .6 1 1 6 4 1154 December- 100 .8 10 2 .8 100,5 1 0 0 .7 9 6 .6 9 8 .6 101 .9 9 6 4 96 .6J u ly -------- 1 U .7 116.1: 11 5 .6 10l:.8 122 .9 1174 110 .6 1 16 .5 l l k . lO ctober— 1 1 5 .6 1 15 .1 116 .5 1 06 .2 125 .7 1174 112 .C 116 .3 1 1 U 4 191:8: Average 102.8 1C3.9 102.5 10li.0 1 00 .9 100 .9 100 .7 100 ,9 101 .7
March------ 100 .7 100 .8 101.2 10)4.0 97 .8 9 9 .5 100 .9 98.8. 100 .3June— — 103.3 .106 .1 102.1 102 .8 9 9 . 9 9 9 .5 1 0 0 4 98 .8 100.3Septembei 1 05 .0 10 6 .5 10 i:.2 10 5 .6 10):. 1 102 .9 10 0 .6 103.2 10U.3December- 102 .7 1 0 1 4 103 .8 1 05 .2 10iu? 103.1: 100 .7 106 .1 101: .7
1/ Not available.
Digitized for FRASER http://fraser.stlouisfed.org/ Federal Reserve Bank of St. Louis
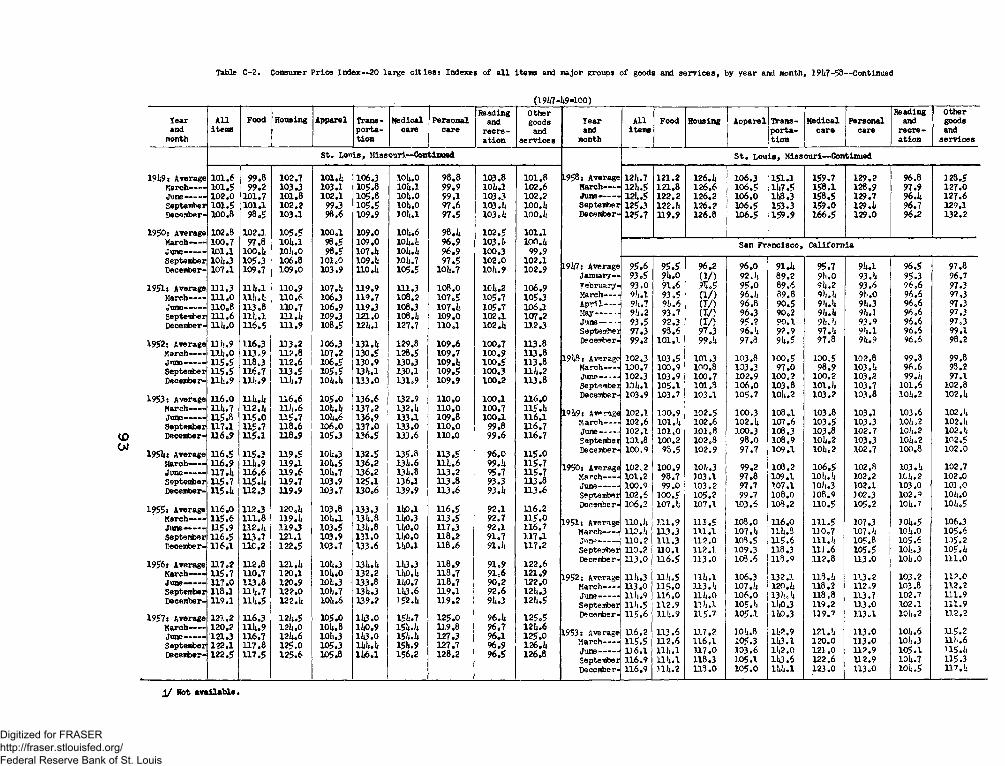
Table C -2 . Consumer P r ice In dex— 20 la rg e c i t i e s : Indexes o f a l l item s and m ajor groups o f goods and s e r v ic e s , by yea r and month, 19 )i7 -58— Continued
(19U7-U9-100)
HousingReading Other Reading Other
Tear A l l Food Apparel Trans- M edical P ersonal and goods Year A l l Food Housing A pparel Trans M edica l Personal and goodsand item s p o r ta - care care r e c r e - and and item s p o r ta ca re care r e c r e and
month t io n a t io n s e r v ic e s month t io n a t io n s e r v ic e s
S t . L ou is , M issouri—Continued S t . L o u is , M issou ri— Continued
19l;9: Average 1 01 .6 99 .8 102 .7 101.1; 106 .3 lOL.O 9 8 .8 103 .8 1 0 1 .8 L958: Average 12/i.7 121 .2 126.1i 106 .3 151.2 159 .7 129 .2 96 .8 128 .5Kerch— — 1 0 1 .5 99 .2 103 .3 103.1 105.8 lO ii.l 9 9 .9 IOI4. I 102 .6 M arch-— 121i.5 1 21 .8 126 .6 1 0 6 .5 1U7.5 1 58 .1 128 .9 97 .9 1 27 .0June--------- 1 0 2 .0 1 01 .7 1 0 1 .8 102 .1 105 .8 lOii.O 99 .1 103 .3 1 02 .2 June--------- 121 .5 1 2 2 .2 12 6 .2 106 .0 11*8.3 158 .5 129 .7 96.U 12 7 .6September 101 .5 101 .1 1 0 2 .2 99.3 105 .5 1014.0 97 .6 103 .ii 100. k September 125 .3 122.lt 12 6 .2 106 .5 153 .3 15 9 .0 129.1i 96.7 129.1December- 100 .8 98 .5 103 .1 98 .6 109 .9 10)4.1 9 7 .5 1 0 3 . t 100.1; D ecenber- 125 .7 119 .9 126 .8 106 .5 1 5 9 .9 1 6 6 .5 129 .0 96 .2 132 .2
1950: Average 102 .8 102 .1 10 5 .5 100 .1 109 .0 1014.6 98.1* 1 0 2 .5 101.1March— — 100 .7 97 .8 10L .1 98 .5 109 .0 101t.il 9 6 .9 103.1' 100.1* San F ra n cis co . C a lifo rn iaJune— — 101 .1 100.lt lOJuO 9 8 .5 107.1; 10ij.il 9 6 .9 100 .3 99 .9SeptemberDecember-
101j.3107 .1
105 .3109 .7
106 .81 0 9 .0
101 .0103 .9
109 .u no .a
10U.71 0 5 .5
97 .510U.7
102 .01014.9
102 .1102 .9 191*7: Average 95 .6 9 5 . 5 96 .2 96 ,0 91.1: 95 .7 914.1 96 .5 97 .8
January— 93 .5 9U.0 ( 1 / ) 92 .). 8 9 .2 9)i .0 93 . >4 95.3 96.71951: Average i n . 3 l l i j . l 1 10 .9 107.1: 119 .9 111.3 10 8 .0 lC it.2 1 06 .9 February-1 93 .0 9 1 .6 ?Tu $ 9 5 .0 8 9 .6 9)4.2 93.6 9 6 ,6 97.3
March— — 1 11 .0 l l h . h 1 1 0 .6 106.3 119 .7 108 .2 10 7 .5 105 .7 105 .3 March— - 1 9)4.1 9 3 ,5 ( 1 / ) 9 6 . 14 39 .8 9*4.1* 9)i.O 96 .6 97.3Juno— — 110 .8 1 13 .8 110 .7 106 .9 119 .3 108.3 107.lt 105 .7 106 .1 A p r i l ------- 9lt.7 91.. 6 (V) 96 ,8 90 .5 9*4.U 914.3 9 6 .6 97.3S e p te ^ e r 111 .6 l l t . l 2U-.lt 109.3 121 .0 IO8.I4 10 9 .0 102 .1 107 .2 May---------- 9U.2 93 .7 (V) 96 ,3 90 .2 9i*.l* 9*:.l 96 .6 97.3December- 11L .0 1 1 6 .5 1 11 .9 108.5 12)4.1 127.7 110 .1 102.14 U -2,3 June --------
September9 3 .597.3
92.393 .6
( I / )97 .3
9^ ,2 9 6 . >4
90 ,1 92 ,9
9h<h
97 .);93 .99)4.1
96 .696 .6
97.399 .1
1952: Average 13/«. 9 116 .3 11 3 .2 306.3 131.1; 129.8 1 0 9 .6 10 0 .7 113 .8 December- 99.2 101 ,1 99 ,u 97.8 9lu5 97 .8 9*4.9 96 .6 98 .2March—June- - - - - - - - - - - -
SeptemberDecember-
l l l i .O11 5 .511 5 .5 11L .9
11 3 .9 118 .3 116 .71111.9
112 .811 2 .61 1 3 .51 U .7
107 .2106 .5105 .5IOI4.I4
130 .5130 .913*i.l13 3 .0
128 .5 130.3 130.1 131 c9
1 09 .7109.1;109 .5109 .9
1 00 .9100.5100 .31 0 0 .2
11 3 .811 3 .811)4.2113.8
19)48: AverageMarch - - - - - - - - - -
June -- - - - - - - - - -
September
202.3 100 .7102 .3 10*4.1
10 3 .51 00 .910 3 .9 105 .1
101 .3100 .8100 .7101 .8
103 .8 103 .31 02 .9 106 .0
100.59 7 .0
1 00 .2103 .8
100.59 8 .9
100 .2 101 . h
102 .8103.*:103 .2103 .7
99 .39 6 .69 9 . l i
101 .6
99.893 .297.1
3.02.8
1953: Average 31 6 ,0 11 lult 1 1 6 .6 105 .0 136 .6 132.9 110 .0 100 ,1 116 .0 December- 103 ,9 103 .7 103 .1 105 .7 10L.2 1 03 .2 103 .8 10L.2 102.1*March— June— — September December-
11U.7U 5 .8117 .1116 .9
112 . i: 1 1 5 .0 115 .7 115 .1
1111.6 11 5 .71 1 8 .6 118 .9
1014.1:10L.6106 .0105.3
137 ,2136 ,9137 .0136 .5
132.1*133.1133 .0133.6
1 1 0 .010 9 .81 1 0 .0110 .0
100 .7100 .1
99 .89 9 .6
l l5 . l t1 16 .1116 .7116 .7
19>*9t Average March— —June - - - - - - - - - - - -
September
102 ,1i0 2 .6102 .1101 .8
1 0 0 .9101.**101 .0100 .2
1 0 2 .51 02 .6 1 01 ,8 102 ,8
100 .3 1 0 2 . It100 .3
9 8 .0
108 .1107 .6108 .3108 ,9
103 .8103 .5103 .810)4.2
103 .1103 .3 102 .7103 .3
103 .6 10i:,2 10)4.2 lOii .2
102 . »i 102 . )iIO2.J4102 .5
1951:: Average 116 .5 115 .3 1 1 9 .5 10L.3 132 .5 135.8 113.5 9 6 .0 1 1 5 .0 December- 100 c 9 9 3 .5 102 .9 97 .7 109 .1 10L .2 102 .7 100 .8 1 02 .0
March— - June— — - September December-
1 16 .9117.1:115 .7115.1:
11U.9116 .6115.1:112 .3
119 .11 1 9 .6U 9 .71 19 .9
10L.510U.7103.9103 .7
136 ,2136 .2125.1130 .6
13)t.613li.8136.1139 .9
1 U .6H 3 .2113 .8113 .6
99.1:95 .793.393.1:
115 .7 n 5 . 7113 .8 113 .6
1950: AverageMarch - - - - - - - - - -
June - - - - - - - - - - - - -
September
102 v 2 101 ,2 100 .9 102 .6
10 0 .998 .79 9 .0
100.5
10/4.3103 .11 0 3 .2 105 .2
99.297 .897 .799 .7
108 .2109 .1107 .1 108.0
106 ,5 10)4.'410)4.3308 .9
102.8102.2102.13.02.3
103 . >4 10)4.2 103 .0 102 .9
102,7 102 .0 103 .0 10)4.0
1955: Average 1 1 6 .0 112 .3 1 2 0 .U 103.8 133 .3 110.1 116 .5 92 .1 116 .2 December- 106.2 1 0 7 . h 107 .1 103 .6 108 .2 110.5 105 .2 10L.7 10*4.5March— — June— — September December-
1 15 .6115 .911 6 .5116 .1
1 1 1 .8 1 1 2 ./: 113 .7 11C .2
119.1:•U 9J121 .11 2 2 .5
10L.1103 .5103 .9103 .7
131:. 8 13l;«8 1 31 .0 133 .6
11:0.31140 .0110.0 1U0.1
113 .5 117 .3 118 .21 18 .6
92 .7 92.19 1 .7 91.lt
1 1 5 .0 116 .711 7 .1117 .2
1951 : Average M arch-—
September
110 J* 110.il 110 .2 110.2
111 .9113 .3111.3 110.1
112.5111 .111 2 .0112 .1
10 8 .0107J*103 .5109 .3
116 .0U U .8U 5 .6118.3
i u . 5 130 .7 l l l . l t 113 .6
107.3107 .);105.8105 .5
30L.510)4.0105.6lOli.3
106.3105 .6105.2105 .):
1956: Average 117 .2 112 .8 121 .L 10L.3 131:. U 110.3 118 .9 91 ,9 1 2 2 .6 December- 113 .0 116 .5 1 13 .0 1 03 .6 113 ,9 112 .8 113 .0 lOli.O 111 .0
March - - - - - - - - - - -
June— — September December-
1 15 .7117 .0118.1119 .1
110 .711 3 .8 11 >4.7 11 >4.5
120 .112 0 .91 2 2 .0122 .L
10L.010ii.310)4.710lt.6
132 .2133.8m . 3139 .2
U 0 .it11:0.7110 .6152.1*
118 .7118 .7119 .11 1 9 .2
91 ,690 ,292 .69U.3
1 21 .91 22 ,012li.312)4.5
1952: Average March— J u n e --— - September
n it .3113 .0l l ) i .9m . 5
1 U .51 1 5 .0116 ,0112 .9
m . i 113 J* 11)4.0 I D l . l
106.3 107.)* 1 0 6 .0 105 . >4
132.3- 120.). 13*!. *4 1)40.3
118 . U 118 .2 113 ,8 119 .2
113 .2112 .9113.713.3.0
103 .2103.8102 .7102.1
112 .0112 .2111 .9111 .9
1957: Average 121 .2 116 .3 12li.5 105.0 110.0 15U.7 125 .0 9 6 ,L 12 5 ,5 December- 115.6 11*4.9 115 .7 105 .1 110 .3 119 .7 113 ,1 10)4.2 13.2,2
M arch-— June-— - September D ecenber-
120 .2121 .3122 .112 2 .5
11U.9116 .71 17 .8 11 7 .5
12U.012i:.6125 .012 5 .6
10U.810U.3105.3105.8
11:0.9110 .0II4/4.I,*1 1 6 . 1
151:J;I5n.l»15);.9156.2
119 .8127.3127.7128 ,2
96 .796 .196 .996 .5
1214.612 5 ,0126 .il126 .8
1953: AverageMarch - - - - - - - - - -
June - - - - - - - - - - - - -
September
13.6.2 115 .5 13 6 ,1 116 .9
1 13 .6112 .6 l lJ i . l i D l . l
117 .2116 .13 17 .0118 .3
10U.8105.32 03 .6305 .1
11:2,9U 3 .1D42.Olit3 .6
121 . »4 1 2 0 .0 123 .0 122 .6
113 .0133 .0112 .9132 .9
10U.6101 .31 0 5 .110*;.7
115 .211)..6315.*:115.3
D ecenber- 116 .9 31)4.2 1 1 3 .0 105.0 l l i l i . l 123 .0 113 .0 10)4.5 117.);
JJ Not a v a ila b le
Digitized for FRASER http://fraser.stlouisfed.org/ Federal Reserve Bank of St. Louis

Table C -2 . Consumer P r ice In d ex — 20 la rge c i t i e s : Indexes o f a l l item s and m ajor groups o f goods and s e r v ic e s , by yea r and month, 191*7-58— Continued
(191*7-1:9-100)
Yearand
month
A l litems
Food Housing A pparel Transp o rta t io n
M edicalcare
Personalcare
Readingand
r e c r e a t io n
Othergoods
ands e r v ic e s
Yearand
month
AHitem s
Food Housing A op arel Transp o r ta t io n
M edica lca re
P ersonalcare
Readingand
r e c r e a t io n
O thergoodsand
s e r v ic e s
San F r a n cie co , C a lif o m ia — Gontixnaed S cran ton , P en nsylvania— Continued
3.950— Con.1951*: Average 116.1* 1 1 3 .9 117 .7 103 .2 11*2.2 123.3 112 .1 1 0 6 .0 116 .1 August— 1 03 .0 103 .9 1 05 .0 98 .7 110.3 10 8 .6 1 0 0 .5 1 °9 .7 106 .2
March— — 1 16 .5 113 .2 118 .0 103 .5 lk 3 .k 123.2 113 .0 105.7 • 116 .3 Noveirber- 10li. 2 102 .5 107, U 102.1* 110 .6 lO li.l nii.o m.o 1 07 .1June-— - 116 .8 115 .3 11 7 .5 103 .2 11|2.9 123.3 111 .6 105.6 116 .3September 116 .2 l l i * . l 117 .5 103 .1 11*0.2 123.1* 111 .8 1 06 .1 115 .8 1951: Average 109 .8 m . i * 111 .0 107.1 115 .2 106 .8 115.8 13 2.3 109 .2December- 115 .7 111 .8 117 .8 10 1 .9 11*1.3 123 .7 111 .7 10 7 .6 115 .5 February- 108 .8 110.7 110.1 106 .8 : i o . 9 105 .1 116 .0 1 1 2 .C 1 08 .0
May---------- 109 .7 111.5 110 .9 106 .7 116 .5 105.1* 117 .7 13 2 .6 108 .81955* Average 115 .6 112 .9 116 .5 103 .5 139 .5 12k. k 110.9 106 .8 116 .1 A u g u st--- 109 .8 111.8 M l .5 106 .8 111*. 2 105 .8 315 .9 112.1* 108 .8
March------ U 5 .6 11 3 .1 115 .9 1 03 .1 11*0.8 123 .5 110 .9 108 .7 115 .2 November- 11 1 .6 113.8 111.8 103 .7 319 .1 111.3 313 .7 112.1* 113 .3June--------- 115 .3 U 3 .l i 116 .3 103 .2 137 .9 123.8 110.9 106 .2 1 1 5 .0September 11 5 .6 1 1 3 .0 116,1* 10k.3 1 3 8 .k 125 .k 110 ,6 106.1* 117 .3 1952; Average 112 .5 H U * 112.7 107 .2 125 .1 1 11 .7 112 .5 117-1 111*.?December- U 5 .9 1 12 .5 117 .3 10k.k 11*0.7 125 .7 110.7 1 05 .2 117.1* February- 110 .8 111.7 112.1* 10 7 .6 120 .2 111 .0 133 .7 112,1* 111.3
May---------- 112.1 l ib .U l l l o 7 107 . h 120.1* 111 .7 112 .1 1 18 .6 117 .21956: Average U 8 .! i l l k . l 1 2 0 .8 10 5 .7 11*1.6 131 .1 116 .2 1 0 7 .6 118 ,3 August— lllt .O 117 .7 112.1* 107 .2 129 .8 111 .9 112 .1 118 .6 U l* . l
March— — 116 .8 1 12 .1 119 .3 105 .3 139 .3 128 .2 116 .k 1 0 7 .6 117 .5 Noveir.be r - 113 .1 11*4,3 1 U .1 106.1* 130 .2 111 .9 111 .9 118 .7 l l l t .1Jun e-— — 117 .9 uii.5 120 .6 1 0 5 .k 11*0.0 128.3 116 .5 1 0 5 .k 118 .2September 11 9 .0 115 .3 1 2 1 .k 105 .9 H i i . i 135 .5 116 .5 1 0 7 .5 118.1* 1953 ; Average 112 .7 112.3 115 .2 1 06 .6 129 .9 3 3 5 .6 1 1 2 .2 119 .6 115.1December- 121 .6 116 .3 12l*.l 10 6 .9 lk 8 .7 135 .9 117 .9 112 .3 119 .9 February - 112 .2 11 1 .0 13 5 .3 106.1* 1 29 .9 l l l i . l 112,3 118 .2 111;.?
May---------- 1 12 .0 111 .5 111*.2 106 .5 129 .3 in.i 112 ,1 1 18 .2 115 .31957: Average 123 .1 117 .8 125.1* 10 7 .5 150 .7 137 .7 119 .9 1 1 3 .8 . 122 .2 August— 113.2 313 .6 115 .3 106 .7 130 .2 115.0 111 .9 117 .6 115.1;
March— — 122.3 1 1 6 .2 125 .1 1 0 7 .6 151 .0 136 .3 119 .2 113 .1 121 .2 November- 113.1* 11. .6 116 .3 106 .8 130.1; 119.5 112 .7 125.1* 315 .5June— — 122.8 118 .2 12l*.9 107 .3 lk 9 .8 137 .2 119 .5 l l l t . l 121 .2September 123 .5 119.1* 125 .3 10 7 .5 150 .7 137 .8 120 ,0 113 .1 12l*.l 1951*; Average 112.5 111.5 1 15 .5 106 .0 127.1* 119.6 112.1* 116 .9 J 16 .1December- 12i*.8 U 9 .5 127.1* 108 .2 152 .k 11*1.0 122 .2 115 .9 123 .7 February- 113 .2 312 .5 116.1* 106.1; 128.1* 1 1 9 .6 11 3 .0 117 .7 116.3
Kay— ------ 112 .3 112 .8 M l* .7 1 0 6 .1 12l*.0 119 .7 112 .5 115.1; 116.11958 : Average 127 .5 1 23 .1 129.1 108 .2 15 7 .6 11*8.3 123 .6 11 6 .9 12l*.3 August—112.1* 112 .1 115 .2 1C5.7 125.1; 119 .5 112 .1 116 .5 116.1
March------- 126.7 122 .9 l » . l * 108 .3 155 .7 11*2.9 123 .8 117 .3 12l*.lt November- 112 .3 109.8 1 15 .7 105 .7 1 3 2 .0 119 .6 11? ,0 1 1 / .3 116 .1June--------- 128 .0 12l*.5 1 2 9 .2 10 8 .1 15 7 .8 150 .8 121».0 1 16 .7 121*. 6September 128.1* 1 2 3 .9 1 29 .6 1 0 8 .1 160 .7 151.3 123.1* 117.1* 121*.3 1955* Average 111 ,1 108.3 U 5.1 - 1 0 6 .0 126 .5 120 .0 ' 119.3 11 9 .5 115 .7December- 127.9 1 22 .8 130 .1 1 08 .1 15 8 .2 151 .9 123.'5 116 .6 12li.2 February- 111 .7 106 .7 M 5 .9 105.1* 128 .2 119.6 i l l .5 118 .5 116.1
May-------- - 131.1; 10 8 ,6 1 H .6 106 .3 137.1: 119 .7 121 .5 138 .5 115 .1Avgust— l l i .5 109.1 115 .2 106,1; 123 .8 119 .8 121 ,9 120 .5 1 1 5 J
S cran ton , Pennsylvania November- 1 10 ,9 106 .0 116 .0 1 05 .7 126 .0 120 ,7 12 1 .6 120 .7 13 6.U
1956; Average 11 2 .9 109 .1 1H ,5 107,2 129 .9 322 .6 123.1* 120 ,8 1 16 .9191*7* Average 96,7 9 6 .5 97 .1 96 .2 91 .1 98 .1 98 .8 91* .9 9 6 .8 February- 111.1 105,1* 116.1* 106,2 1 2 8 .6 120 ,8 1 2 1 .9 120.5 116 .6
March— - 9U.6 9 3 .5 9 6 .1 95 .7 8 9 .0 98 .1 99 .5 9l*.9 9 1 .6 May---------- 112 .1 108.3 116 .3 106 .3 127.1 121 .3 123 .7 121 .7 116 .8June— - 96.2 9 6 .5 ( l / > 9 6 .6 90 .9 97.8 98.1* 9l*.9 99.1* August— 1 13 .5 uo.5 117 .9 106 .7 128 .3 1 22 .9 123 .7 119.1; 117 .2August— 98 .0 96 .8 9 7 .5 9 7 .0 92 .1 9 8 .5 97.7 91*. 9 99.1* November^ l ll* .9 110.3 119 .3 1 09 .6 135 .7 125 .3 12li.3 121.1 1 17 .2November- 99.1* 100.lt 9 9 .5 9 7 .6 93 .1 99.1 9 9 .5 9it.9 99.1*
1957: Average 1 16 ,9 112.7 121.1 1 0 8 .5 135 .7 125.1* 125 .9 132.1* 118,3191*8; Average 102.3 1 0 3 .9 101 .3 10 2 .8 100 ,2 100.1* 100 .1 95.1* 100 .2 February 115 .5 110.6 120 .7 10 7 .9 135 .7 125.1* 12U.9 125 .7 117.3
F ebru ary- 100 .2 1 0 0 .6 1 00 .2 1 0 0 .1 9l*.7 99 .6 99 .6 9!*.9 99.1* May--------- 116.1* 312 .2 120.3 108 .5 135 .1 125 .3 125 .5 131;. 1* 117 .7May----------- 102.1* 105.0 99 .8 1 0 2 .5 9!*.7 9 9 .6 99 .6 9>*.9 97 .1 August— 117 .8 116 .1 121 .5 108 .2 130 .8 125.1* 125 .9 13 it.6 11 9 .0August— 105.2 107.6 1 0 2 .6 l O k d 1 05 .5 101 .0 99.1* 9!*.9 101 .8 November- 117.8 112 .2 122 .0 109 .5 11*1.8 1 25 .5 127 .2 135 .1 119,3Noveraber- 1 02 .0 100.1* 102.8 1 0 5 .0 105 .8 101.1* 101 .8 9l*.9 102.1*
1958: Average 120 .2 118.1* 122.1; 109 .3 m. 1 126 .8 129 .1 14-0.2 1 19 .6191*9* Average 101 .0 9 9 .7 1 01 .6 1 0 1 .0 108 .7 1 01 .5 101 .1 10 9 .8 1 0 3 .0 February- 119 a 1 1 6 .6 123.3 1 08 .9 131*.9 1 25 .9 128 .3 1 3 6 .6 119.1*
F ebru ary- 100.1* 9 7 .0 1 0 2 .6 1 0 3 .0 107 .7 101.1* 101 .6 109 .8 102.1* May---------- 120 .7 12 0 ,5 i a , 9 1 0 9 .6 11*0,5 126 ,2 128 .9 137 .1 119 .7May----------- 101.1* 100 .3 101 .1 101 .7 108.1* 101.1* 101 .1 110.1* 102.1* August— 120.1* 118 .6 1 22 .1 1 09 .2 11*1.2 127 .5 1 28 .6 11*3.0 11 9 .6August— 102 .0 1 0 2 .0 101 .0 100 .3 109.1* 101 .6 101.1 110.1* 103 .6 November- 120 .7 H 7 .1 12 2 .5 109 .5 1H7J* 1 2 7 .6 330 .5 lhU .3 119 .6November- 100 .1 9 8 .1 101 .8 9 8 .6 109.1* 101 .6 100 .9 110.1* 103 .6
1950* Average 101.7 100 .3 101*. 1* 9 9 .5 1 10 .0 103.1* 103 .1 110.1* 105 .0February - 96 .7 91*.8 102 .3 9 8 .6 109 .6 102 .7 99 .2 110.1* 103 .3May----------- 100 .2 9 8 .8 1 0 2 .6 9 8 ,0 1 0 9 .6 103 .1 98.1* 110.1* 103 .31 / Not available.
Digitized for FRASER http://fraser.stlouisfed.org/ Federal Reserve Bank of St. Louis
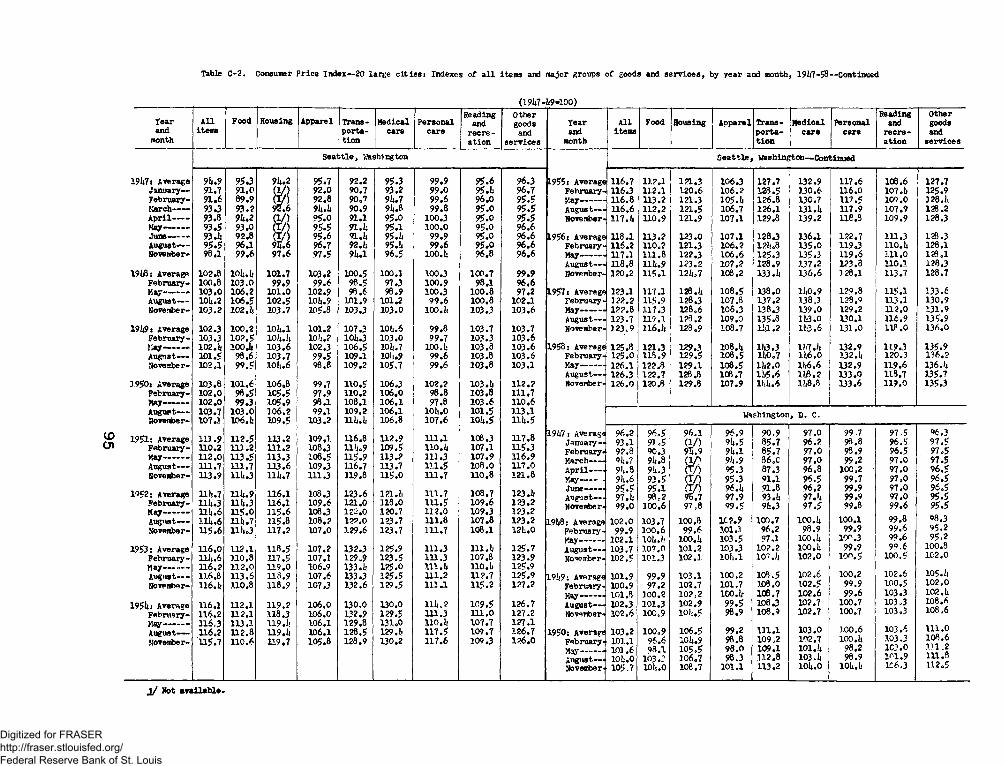
Table C -2 . Consumer P r ice Index— 20 la rge c i t i e s : Indexes o f a l l item s and m ajor groups o f goods and s e r v ic e s , by year and month, 1917-58--C ontin ued
(1917 -19 -100 )
A l l Food Housing ApparelReading O ther Reading Other
Tear Trans- M edical P ersonal and goods Year A ll Food Housing A pparel Trans M edica l Personal and goodsand item s p o r ta - care care r e c r e - and and item s p o r ta ca re care r e c r e and
month t io n a t io n s e r v ic e s month t io n a t io n s e r v ic e s
S e a t t le , Washington S e a t t le ,* W ash ington -C ontinued
1917: Average 91*9 95 .3 91t.2 95 .7 92 .2 95.3 9 9 .9 9 5 .6 96.3 1955: Average 116 .7 112.1 121 .3 106 .3 127 .7 1 32 .9 11 7 .6 108 .6 127 .7January— 91*7 9 1 .0 ( V ) 9 2 .0 90 .7 93 .2 9 9 .0 95.it 96 .7 February- 116 .3 H 2 .1 1 20 .6 10 6 .2 128 .5 130 .6 116 .0 107.U 125.9F ebruary- 9 1 .6 89.9 ( V ) 9 2 .8 90 .7 911.7 99 .6 9 6 .0 9 5 .5 May---------- 116 .8 113 .2 121 .3 105Jt 126 .8 130 .7 117 .5 1 09 .0 128 . UMarch------- 93.3 9 3 .2 9 7 .6 9U.U 90 .9 9lt.8 99 .8 9 5 .0 9 5 .5 August— H 6 .6 112 .2 121 .5 106 ,7 126 .1 131.it H 7 .9 1 07 .9 128 .2A p r i l ------- 93 .8 9 U .2 ( 1 / ) 9 5 .0 91.1 95.0 100 .3 95 .0 9 5 .5 November- H 7 .it H O .9 121 .9 107 .1 129 .8 139 .2 118.8 10 9 .9 128.3May---------- 9 3 .5 93 .0 ( I / ) 95 .5 91.U 95.1 10 0 .0 95 .0 9 6 .6June-------- 93.Ji 92 .8 ( I / ) 9 5 .6 91.lt 95.lt 99 .9 95 .0 9 6 .6 1956: Average 118 .1 113 .2 123 .0 107 .1 128 .3 136 .1 122 .7 1 H .3 128 .3August— 9 5 .5 96.1 9 5 .6 96.7 92.it 95.lt 9 9 .6 9 5 .0 9 6 .6 February- 1 16 .2 110 .2 121 .3 106 .2 12it.8 135 .0 119 .3 no. U 128.1November- 98 .1 9 9 .6 9 7 .6 97 .5 911.1 96 .5 lOOoit 96 .8 9 6 .6 May----------- 117.1 1 11 .8 122.3 106 .6 125 .3 135 .3 1 19 .6 111.0 128,1
August— 118.8 l l i t .9 1 2 3 .2 1 07 .2 1 28 .9 137 .2 123 .8 110,1 128 ,31918: Average 102 .8 10ll.ll 1 01 .7 103 .2 100.5 100 .1 100.3 10 0 .7 9 9 .9 November- 120 ,2 115 .1 12ij,7 108 .2 133.it 136 .6 3 28.1 113.7 128 .7
F ebru ary- 100.8 1 0 3 .0 99 .9 9 9 .6 98 ,5 97.3 100 .9 98.1 9 6 .612Q.8May----------- 1 03 .0 106 ,2 10 1 .0 102 .9 98 .6 96.9 100 .3 10 0 ,8 97.2 1957: Average 123.1 117.1 128.it 1 0 8 .5 138 .0 lit0 .9 115 ,1 13 3 .6
August— - 101 .2 1 0 6 .5 1 0 2 .5 10li.9 101 .9 101 .2 9 9 .6 100 .8 102 .1 February-' 122 .2 115.9 128 .3 107 .8 137 .2 1 3 8 J 128 .9 113 .1 1 30 .9November- 10 3 .2 1 0 2 .1 203 .7 105.8 103.3 103 .0 lOO.li 103 .3 1 0 3 .6 May— — - 122 .8 117 .3 128 .6 108 .3 138 .3 139 .0 129.2 112 .0 131 .9
August— 123.7 119 .1 123 .2 109 .0 135 .8 lit3 .0 130 .1 116 .9 135-91919: Average 102.3 1 00 .2 10U.1 101 .2 107.3 lOit.6 99 .8 103 .7 103 .7 November- 12 3 .9 H 6 .it 128 .9 108 .7 120. .2 IB.6 131 .0 1 18 .0 136 .0
Febru ary- 103.3 1 0 2 .5 lO h .h 10U.2 10it.3 103 .0 9 9 .7 103 .3 1 0 3 .6May----------- 10 2 .1 100 A 1 0 3 .6 102.3 106 .5 10 It.7 100.it 103 .8 1 0 3 .6 1958: Average 125 .8 121 .3 129.3 108.lt l !i3 .3 If.7 . It 132 .9 119 .3 135 .9A u g u s t - 101 .5 99 .6 103 .7 9 9 .5 109.1 10Jt.9 99 .6 103 .8 1 0 3 .6 February- 125 .0 1 13 .9 129 .5 10 8 .5 lit0 .7 1U6.0 132.ii 120 .3 136 .2No vesiber- 102 .1 9 9 .5 10U.6 98 .8 109 .2 105 .7 99 .6 103 .8 103 .1 May---------- 126 .1 122 .8 129 .1 108 .5 1U2.0 1U6.6 132 .9 119 .6 136 . U
August— 126.3 122 .7 128,8 108 .7 1U5.6 1U3.2 133 .0 U 8 .7 135 .71950: Average 103 .8 10 1 .6 1 06 .8 99.7 110 .5 106.3 10 2 ,2 103.it 1 1 2 .2 November- 1 26 .0 120.8 129.8 107 .9 1UU.6 1L8.8 133 .6 119 .0 135 .3
Febru ary- 102 .0 9 8 .5 1C5.5 97 .9 110.2 106 .0 98 .8 103 .8 111 .7May----------- 10 2 .0 99 .3 1 0 5 .9 98.1 108 .1 106 ,1 97.8 1 0 3 .6 1 1 0 .6August— 103 .7 1 0 3 .0 1 0 6 .2 99 .1 109.2 106 .1 lOli.O 101 .5 1 13 .1 U a s tv ? ncrt-.on , B. C.Noventoer- 107 .1 106.1 109 .5 103 .2 l U . l i 106.8 107 .6 10lt.5 n i t . 5
1951: Average F ebru ary- May-----------
111 .9110 .21 1 2 .0
11 2 .5 111 .21 1 3 .5
113 .21 11 .2 113 .3
109.1108 .31 08 .5
116.8l l l t .9115 .9
112 .9109 .5113 .2
111 .1110.it111 .3
108 .3107 .11 0 7 .9
117.8 H 5 .3116 .9
19it7: Average January— February* March—
9 6 .2 93 .1
■ 92.8 9i},?
96 .5 91 c5 90.3 9it.8
9 6 .1( 1 / )9H.9( 1 A
96 .99it.59 it .l9it.9
9 0 .985 .78 5 .7 36 ,C
97 .0 9 6 .29 7 .097 .0
99.798 .8 98 .9 99 j2
97 .596 .596 .5 9 7 .0
06.39 7 .59 7 .59 7 .5
August— - 111 .7 111 .7 113 .6 109 .3 116 .7 113 .7 111 .5 108.0 n?.o A p r i l— 9U.8 9U.3 (T /j 95.3 87 .3 9 6 ,8 100 ,2 97 .0 9 6 .5November- 113 .9 111 .3 111 .7 111 .3 219.8 115 .0 111 .7 11 0 .8 121.8 May---------- 9i».6 9 3 .5 (X/) 95 .3 91 .1 9 6 .5 99 ,7 97 oO 96 .5
1952; Average 111 .7 1 1 1 .9 116 .1 108 .3 1 23 .6 121.ii 111 .7 1 08 .7 123.itJune— — - August—
9 5 .597.it
95 .198-2
(X/)96.7
96.it9 7 .9
91.893.it
9 6 .2 9 7 . h
99.999 .9
9 7 .097 .0
96 .595 .5
Februaxy- 111 .3 111 .3 116 .1 109 .6 121 .0 118 .0 1 11 .5 1 0 9 .6 12 3 .2 November* 9 9 .0 1 00 .6 97 ,8 9 9 .5 9lt.3 9 7 ,5 99.8 9 9 .6 95 .5May----------- 111 .6 1 1 5 .0 11 5 .6 108.3 122 .0 120 .7 112 .0 109 .3 123 .2August— 111 .6 H i .7 115.8 108 .2 122 .0 123 .7 111 .8 107 .8 1 23 .2 19U8: Average 102 .0 103 .7 100 .8 1C 2 .9 100 .7 100 .it 100 .1 99 .8 08 ,3November- 115 .6 ni.3 117 .2 107 .0 129 .6 123 .7 111 .7 108 .1 12U.0 February - 99 .9 10 0 .6 9 9 .6 101.1 96 .2 98 .9 99 .9 99 .6 95*2
X ay-.......... 102 .1 lOit.i; 100.it 103 .5 97.1 100.it IOC-.3 99 .6 95*21953: Average 11 6 .0 112 .1 11 8 .5 107 .2 132 .3 125 .9 111 .3 111.it 1 25 .7 August— 103.7 1 07 .0 101 .2 103 .3 102 .2 1 0 0 .it 99 ,9 99 .6 100 .8
February- 111 .6 110 .8 117 .5 107 .1 129 .9 123 .5 111 .3 107 .8 123 .9 November- 102 .5 101.3 1 02 .1 lO it .i 107.it 102 .0 100 .5 1 00 .5 102 .0May----------- 1 16 .2 1 1 2 .0 1 1 9 .0 106.9 133.it 125 .0 l l l . i t no.b 125.9
102 .6 105.ltAvgust— 116.8 1 1 3 .6 11 8 .9 107 .6 133.3 125 .5 111 .2 112 .7 125 .9 19l»9: Average 101 .9 99 .9 103 .1 100 .2 1 08 ,5 100.2 102 .6November- U 6 .1 110 .8 118 .9 107 .3 132 .6 129 .5 111 .1 115 .2 127 .2 February-
Mew100.9 97 .2 102.7 101 .7 108 .0 102 .5 99 .9 100 .5 10 2 .0101.8102 .3
100 .2101 .3
102-2 100.it9 9 .5
106 .7108 .3
1 0 2 .6 9 9 .6 103 .3 102 . U
1951: Average 116.1 112 .1 119 .2 106 ,0 130 .0 130.0 nit. 2 1 0 9 .5 1 26 .7n 9gr *** *A u g u s t - 102^9 102.7 100 .7 103 ,3 108 .6
1 08 ,6F ebruary- 116 ,2116*3116 ,2
112 .1113 .1112 .8
118 .3119.11119.11
106 .0106 .1106.1
132 .9129 .8128 ,5
129 .5131 .0129.1*
111 .3110.it1 1 7 .5
m.o107.7109 .7
127 .21 27 .1126 .7
No vewber- 102 .6 100 ,9 io ) i .5 98 .9 1 08 .9 102 .7 100,7 103 o3
August-- 1950: Average 103 .2 100 ,9 106 .5 99.2 m.i 103 .0 3.00,6 1 03 .6 111.010 8 .6November- 115 .7 11 0 .6 119 .7 105.8 128 .9 130 .2 117 .6 109 .3 1 2 6 .0 February* 101.1 96 .6 10it.9 98.8 109 ,2 102 .7 100.li 3.03.3
101 ,6 9 8 .1103 .3
105 .5206 ,7
9 3 .098 .3
109.111 2 .8
101 . it 103.lt
98,2 1C3.0 HI .2MSjr - — --*August— loh'.o 98 .9 i n . 9 111 .8November* ' 105.7 lOit.O 108 .7 101 .1 113 .2 lOit.O 10U.it 1C6.3 112 .5
j / Not available.
Digitized for FRASER http://fraser.stlouisfed.org/ Federal Reserve Bank of St. Louis

Table C -2 . Consumer P r ice In d ex — 20 la rg e c i t i e s i Indexes of a l l item s and m ajor groups of goods and s e r v ic e s , by yea r and month, 1947-58— Continued
(191*7-49-100)
Tearand
month
A l litem s
Food Housing A pparel Transp o r ta t io n
M edicalcare
Personalcare
Readingand
r e c r e a t io n
Othergoods
ands e r v ic e s
Yearand
month
A llitem s
Food Housing A pparel Transp o r ta t i o n
M edica lca re
P ersonalcare
Readingand
r e c r e a t io n
Othergoodsand
s e r v ic e s
W ashington, D. C. — Continued W ashington, D. C. — Continued
1951 i Average 110 .2 111 .7 1 1 2 .0 1 0 5 .5 315 .1 110 .0 108 .1 107 .0 1 1 4 .2 1955 : Average 113 .6 11 1 .2 11 6 .6 101.5 12 9 .5 31 9 .4 11 2 ,6 1 0 5 .4 3-30.0F eb ru a ry - 109 .1 111 .2 110 .3 101*. 6 113.1* 107 .4 106 .9 106 .7 113 .2 February- 133 .2 110 .9 316 .4 1 0 1 ,2 1 2 9 .0 118 ,2 111.3 104 .3 129 .8May----------- 10 9 .6 1 1 1 .7 110 .3 105 .6 Hi*.!* 108 .9 1 07 .0 1 06 .2 113 .7 May---------- 1 1 3 .5 111 .3 1 1 6 .9 101 .1 128.6 1 18 .4 1 1 0 .9 105.3 1 29 .9August— - 110 .1 1 1 0 .9 112 .8 105.3 11 4 .5 111 .2 106 .5 1 06 .6 112 .8 August— 113 .8 111 .7 116 .8 1 0 1 .6 129 .1 1 1 8 ,4 111 .4 106 .0 130 .1Novenfcer- 112 .5 113 .6 114 .8 106-1* 1 1 7 .8 113 .0 112 .5 1 0 8 .4 116 .5 November- 113 .7 109 .9 1 1 6 .4 102 .1 1 3 1 .4 122 .6 116 .6 105 .8 130 .1
1952* Average 113 .2 1 1 3 .6 115.1* 103 .8 122 .8 115 .8 112 .0 109 .3 12 2 .1 1956* Average H 4 .9 1 1 2 .6 3.16.9 1 0 3 .4 1 3 1 .2 1 2 5 .5 1 1 7 .6 1 0 7 .0 1 3 1 .0F ebru ary- 1 1 2 .0 111 .1 114 .9 101*.7 120 .4 133 .7 1 12 .4 1 0 8 .4 1 2 2 .0 February- 113J* 109 .9 115 .5 102 .6 1 30 .4 122 .8 117 .5 106 .8 129 .9May— ------- 112 *6 1 1 2 .9 1 1 5 .2 10l*.0 120 .2 H 6 .3 111 .9 1 0 8 .1 1 2 2 .0 May---------- 1 1 4 .4 11 2 .0 1 16 .6 103.6 1 29 .0 1 2 3 .4 117 .3 306 .0 130 .8August------ l l ! * . l 116 .1 11 5 .5 1 0 3 .5 1 23 .5 116 .8 112.1 1 0 9 .6 1 2 2 .0 August— H 5 .7 113 .7 11 7 .9 103 .8 330 ,3 1 27 .8 1 17 .4 107 .1 131 .1November- 113 .8 1 1 3 .4 1 1 6 .0 102 .5 1 2 7 .4 116 .4 111 ,8 111 .2 1 23 .0 November- 115 .9 112 .8 117 .4 103 .7 135 .2 128 .1 113 .2 108.3 132 .2
1953 : Average 113 .8 111.4 1 16 .8 103 .7 1 2 7 .9 11 7 .4 1 U .5 111.0 125 .1 1957* Average 118 .3 1 16 .9 11 8 .9 1 0 3 .9 137 .7 131 .5 120.5 110 .5 135 .0F ebru ary- 1 1 3 .0 11 0 .1 116 .3 103 .3 127 .1 116 .6 111 .6 1 1 0 .6 1 22 .1 F ebru ary- 1 1 7 .5 115 .9 1 19 .2 104 .2 135 .3 1 29 .4 118 .7 107 .9 133 .2May----------- U 3 .5 1 10 .8 116 .2 103 .8 127 .3 117 .5 1 11 .4 1 1 2 .9 1 25 .1 May---------- 117 .2 115 .9 117 .7 103 .8 136 .2 131 .7 120 .1 1 0 8 .1 134 .1August— 111*.2 113 .3 1 1 6 .i* 104 .0 128 .8 117 .7 1 11 .4 109 .2 12 5 .8 August— 119 .1 1 20 .0 118 .3 10 4 .2 137 .9 13 1 .6 1 2 0 .6 113.1 136 .4November- 1114.3 1 1 0 .6 118.3 103.8 1 29 .4 117 .9 111 .6 1 11 .4 127 .2 November- 119 .4 116 .8 120.5 1 03 .6 1 4 1 .6 133 .1 1 2 2 .4 112 .2 1 36 .5
1951*: Average 113 .8 1 1 1 .8 117 .2 1 02 .5 1 2 7 .4 117 .8 111 .5 106 .3 1 2 8 .6 1958; Average 121.X 1 2 1 .6 1 2 0 .2 1 0 3 .4 1 40 .3 1 4 0 .2 124*0 118 .3 1 3 6 .4Febru ary- l l l * . l 110 .9 117 .7 103. 1* 128 .1 117 .1 112 .4 1 1 0 .5 1 2 7 .2 F ebru ary- 120*3 1 2 0 .0 1 1 9 .5 1 0 3 .4 137 .9 1 36 .9 123 .8 1 2 1 .4 136 .5May— — 113 .7 112 .9 116 .8 102.5 127 .1 117 .2 i l l . ! * 105 .3 127 .0 May— ------- ia*3 1 2 3 .4 1 2 0 .6 10 3 .2 138 a 136 .8 1 23 .7 1 1 7 .5 136*7A u gu st-— 11 4 .1 114 .5 117 .0 101 .7 12 5 .2 118.3 111.1 1 04 .9 1 30 .5 August— 1 21 .2 1 2 2 .4 1 2 0 .1 1 0 3 .5 139*7 1 4 0 .2 123 .7 1 1 7 .6 136*0November- 113 .5 110.1 1 17 .2 302 .3 1 2 9 .4 118 .6 111.0 1 0 4 .6 12 9 .9 November- ia.5 119 .8 1 2 0 .4 1 0 3 .6 1 4 5 .5 14 7 .3 1
1 2 5 .0 1 1 7 .6 13 6 .3
(Dcr>
Digitized for FRASER http://fraser.stlouisfed.org/ Federal Reserve Bank of St. Louis

Table C-3. Consumer P rice Index—20 larg e c it ie s : Indexes o f food, housing, a p p a re l, t ra n s p o rta tio n , and th e i r subgroups,by y ear and month, 19U7-58
(19U7-U9-100)
T earand
month
Food Housing Apparel T ra nsportation
To
tal
1/
______________ Food a t tome__________ ____
To
tal
2/
Ren
t
Qas
an
d
ele
ctr
icit
y
So
lid
fu
els
an
d
fue
l o
il
Ho
use
- fu
rnis
hin
gs
Ho
use
ho
ldo
pe
rati
on
To
tal
Men
's
and
b
oy
s'
Wom
en's
an
d
gir
ls'
Fo
otw
ear
Oth
era
pp
are
l 3
/
To
tal
Pri
va
te
Pu
bli
c
To
tal
Ce
rea
ls
and
b
ak
ery
p
rod
uc
ts
Mea
ts,
po
ult
ry,
and
fi
sh
Dai
ryp
rod
uc
ts
Fru
its
an
d
ve
ge
tab
les
Oth
er
foo
ds
at
hom
e
A tlan ta , Georgia
19U7: Average 98.3 97.2 95.9 99.3 98.2 103.5 93.7 90.6 98.2 89.9 97.0 98.1 9U.1 95.3 93.7 91.0 99.3 91.U 91.3 91.8March----- 98.6 — 91.9 93.7 101.0 106 .U 105.0 (U) (U) 98.2 85.0 96.8 98.6 92.1 9U.0 91.8 87.5 95.5 89.7 89.2 91.8June-—— 95.5 9it.8 9U.6 9U.2 98.1 96.0 92.6 88.1 98.2 85.1 96.8 98.5 92.8 9U.1 92.9 87.5 101.1 9C.5 90.1 91.8August— 96.ii — 97.2 98.7 98.1 97.6 99.6 (U) (U) 98.2 95.2 97.2 97.9 9U.8 95.9 93.9 92 .U 99.9 91.6 91.6 91.8November- 102 .U — 105.2 100.0 100.9 99.9 108.7 97.0 9U.9 98.2 99.0 99.0 97 .U 98.0 97.6 97.7 98.5 102.8 9U.1 9U.7 91.8
19U8: Average 103.1 102.lt 10lt.lt lQti.lt 100.1 102.9 101.3 100.0 97.2 105.6 102.6 100.7 10U.3 103.2 10U.U 105.2 108.9 100.5 100.8 99.5February- 101.7 — 10U.9 97.0 109.5 I0lt.lt 99.8 98.8 96.5 96.6 100.2 101.0 100.2 102.2 101.6 100.0 105.3 H2.2 96.2 97.5 91.8May——— 102.9 -------- 103.3 103.5 105.9 101.7 99.8 99.8 98.3 96.5 10U.9 99.9 99.9 103.1 102.3 101.5 105.5 H3.5 98.5 97.5 102.1August-— 106.7 — 101.3 121.8 105.8 103.8 10U.U 102.8 101. U 96.5 109.7 10U.7 101.3 106.U 10U.9 108.2 105.1 107.5 103.5 103.9 102.1November- 101.9 — 99 . i 10U.5 98.7 95.6 107. L; 103.9 103.7 96.6 109.6 105.3 101.8 106.5 10U.8 108.6 105.8 10U.U 103.7 10U.2 102.1
1 9h9i Average 98.6 _____ 100.lt 99.8 96.3 101.7 93.5 105.0 109.5 10U.6 10U.6 100.U 101.3 101.6 101 .U 101.9 103.8 91.8 108.2 108.0 108. eFebruary- 96.3 — —- 100.9 9lt.9' 97.2 100.5 90.8 10U.9 106.3 10Ut5 109.7 103.6 101.2 10U.0 103.0 105.5 10U.0 97.7 105.7 106.7 102.1May-------- 97.5 — 101.5 97.5 9h.3 163.9 90.3 10U.6 108.9 loU.5 100.6 102.0 101.5 102.8 102.1 10U.3 103.8 92.7 108.2 107.U m .oAugust---- 100.9 —- —_ 99.9 103.9 96.3 105.0 95.0 10U.U HO.5 10U.? 100.it 97.5 101.6 100.5 100.9 100.0 103.6 88.7 109.5 109.0 m .oNovember- 97.8 — 99.2 98.6 97.1 95.3 96.2 106.0 112.lt 10U.6 109.5 98.0 100.8 98.9 99.5 97 .U 103.8 87.0 109.5 109.0 m .o
1950: Average 99.7 _____ 102.9 103.7 96.8 97.9 96.8 108.7 113.6 ioU.5 HO.8 100.9 103.8 100.9 101.7 98.U 107.0 92.1 H0.5 HO.U m .oFebruary- 9U.1 — 99.C 93.6 97.0 96.7 88.7 106.8 113.2 10U.6 lilt.6 97.3 100.7 98.8 99.2 97.1 103.6 89.6 109.5 109.1 111.0May-------- 95.9 -------- 100.3 101.6 93.8 93.3 8 9.9 106.9 113.9 10U.6 105.9 97.7 100.7 98.5 98.8 96.8 103.6 88.5 109.6 109.2 1H.0August---- 10U.0 - ___ _ 3.07.1 H3.U 9lt.2 98.2 101 .U 108.7 llit.O iou.5 109.0 101.6 103.2 100.7 102.U 97.6 106.U 90.9 H1.2 H1.2 m .oNovember- 103.1 — 106.2 107.1 100.3 96.5 105.0 112.3 Hit.8 ioU.5 H I.9 106.5 109.9 105.1 106.1 101.7 H3.5 99.0 H I .9 H2.1 m .o
1951: Average 113.1 — « 113.7 H7.0 H I .8 110.8 Hl.U H7.5 H7.2 106.6 113.0 113.3 H7.9 111.3 H3.1 105.8 123.7 10U.3 118.3 H6.1 126.8February- 110.8 . — — m .o 133.8 109.3 113.7 106.0 Hit.8 126.1 10U.5 111.9 109.6 llU .l 108.7 109.1 10U.3 121.5 103 .U H I .8 H2.0 m .oMay-------- 113.2 — H5.2 H7.8 H2.8 108.0 H I .7 117.2 H6.7 107.8 Hl.U H5.3 116.0 1H.3 HI .5 106.9 123.7 109.0 119.7 H6.5 132.0August---- nil .< — Hit.2 120.8 112.3 H0.1 H2.3 H7.3 H7.6 107.7 Hl.U 11U.2 115.9 H 2.3 H5.0 105.3 125.9 106.0 H9.U H6.1 132.0November- llU.O — lilt. 6 H6.5 112.9 115.2 115.1 120.9 H8.6 107.8 117.0 HU. 5 126.0 H3.7 117.2 107 .U 12U.9 100.0 122.2 H9.7 132.0
1952: Average 113.6 _____ H5.6 115.9 H3.5 121 .U 103.1 121.U ia .u 108.0 111. .8 H2.6 125.3 m .o H5.1 105.2 120.3 91.7 126.2 123.3 137.1February- 112.5 —- __ H5.6 H7.3 Hli.9 Hit.l 101.8 121.2 119.7 107.7 117.0 l l i t . l i 125.9 iH .8 115.9 105.7 121.9 93.7 12U.2 121.5 13U.1May--------- 110.1: — — 115.8 HO .9 H2.5 H9.e 97.8 120.8 120.1 107.7 111.7 H2.7 11 125.7 110.9 H5.U 10U.5 121.2 89.9 12U.U 121.9 13U.1August---- 117.8 H5.7 120.5 H2.3 132.7 105.6 120.e 121.3 107.8 m .o m .o 1 125.7 n o .2 11U.U 10U.5 H9.5 88.6 125.7 123.U 13U.1November- HU.3 — H5.0 lilt.8 H5.7 120.3 108.1 122.7 12U.5 109.U H9.U 112.6 125.8 110.9 HU.7 105.7 118.U 93.8 130.8 126.7 1U6.3
1953: Average 113.2 113.0 115.7 135.5 111.9 U6.6 105.7 123.U 128.5 109.6 H6.8 112.8 127.0 h o .8 HU.5 105.3 H9.5 93.5 129.6 125.3 1U6.3March— 112.3 112.0 H5.3 H2.8 Hlt.9 117.5 103.1 123.3 128.0 109.2 H9.5 112.0 125.9 m . i HU.7 106.0 118.6 93.8 130.5 126.U 1U6.3June------- llU.5 Hlt.lt 116.1 H6.7 111.3 125.5 10U.5 122.7 (U) 108.6 112.2 112.7 127.1 H 0.3 l l i t . 2 10U.U H9.6 93.7 129.2 12U.9 1U6.3September Hit. 7 nit .7 116.8 H8.9 110.1 115.8 109.2 12U.0 129.1 108.8 115.9 113.8 127.7 H l . l HU.8 105.6 H9.9 93.9 129.1 12U.8 1U6.3Dec ember- 112.7 112.2 H5.1 H5.3 HO.2 HO.9 107.5 123.8 (U) H I .8 H9.5 112.9 128.2 h o .5 llit.O 105.1 120.6 92.1 129.0 12U.6 1U6.3
1951:: Average 312.9 132.0 H6.3 H3.9 108.6 112.7 107.6 12U.1 131.0 H I .6 H7.0 110.5 128.9 HO.8 H3.U 105.6 122.5 92.0 125.U 120.7 1U5.6March----- 1 12 .2 111.2 116.0 116.5 109.5 105.5 105.7 12U.1 130.5 H2.0 H9.5 H2.0 128.2 m . 2 11U.6 105.8 122.6 91.3 127.3 122.8 1U6.3June------- llU. 7 113.9 H5.lt H7.9 108.1 117.9 106.1 12U.1 (U) Hl.U 112.3 110.0 129.U H I. 5 llit.O 106 .u 122.6 92.7 127.U 123.0 1U5.3September 113.3 H2.lt 116.9 1H.8 108.1 H 8.9 •107.8 12U.1 131.3 1H.3 H7.7 109.6 129.U 110.3 H2.1 105.3 122.5 92.0 120.0 HU. 8 1U5.3December- 110.0 108.3 H7.0 10lt.9 108.3 n o .i 105.1 12it.O (U) H3.3 H9.5 109.3 128.6 HO.3 H2.1 105.1 123.2 92.0 125.7 121.1 1U5.3
1955: Average 110.2 108.5 H7.lt 105.0 108.3 H3.1 10U.0 125.1 133.5 H8.0 H8.U 107.5 130.1 109.6 H I. 2 10U.1 12U.5 91.5 123.6 H8.1 150.8March— 110.0 108.2 117.9 105.3 I08 .lt no.o 103.9 123.9 132.3 113.3 H9.5 107 .U 128.5 108.U H0.9 102.2 123.2 91.0 123.6 H8.8 1U5.3June----- - 111.0 109.6 H8.lt 107.6 108.1 118.7 101.3 12U.U (U) 121.0 112.3 107.0 130.2 109.U 111.1 103.9 12U.0 91.U 12U.1 H8.3 153.6September H l.l 109.7 H7.2 107.1 108.3 H2.8 106.3 125.9 13U.5 H9.6 123.3 106.9 131.1 110.5 lll.U 105.5 12U.9 91.9 122.0 H6.0 153.6December- 108.3 106.li 116.3 96.8 108.5 HO.6 106.9 127.1 (U) 119.6 123.3 108.2 131.6 110.2 m .3 iou.5 127.5 91.3 12U.U 118.7 153.6
1956: Average 110.2 108.7 H8.1 99.1 HO.7 120 .U 105.3 127,0 135.1 H9.U 122.2 108.1 132.7 111.3 112.U 105.2 130.1 92.2 126.6 120.5 157.9March------ 107.9 105.6 118.9 9lt.3 109.0 HU. 7 102.8 126.2 135.0 H9.U 123.2 107.6 131.7 HO.7 111.5 io5.o 128.7 91.5 12U.5 H8.7 153.6uune-— - 131.3 110.0 H8.3 100.0 109.5 130.1 10U.0 126.6 (U) H9.U H7.9 107.8 132.6 110.7 112.U 10U.0 130.1 92.2 12U.3 H8.3 15U.8September 111.9 HO.9 117.5 103.5 H2.6 121.5 107.0 127.0 135.2 H9.U 120.1 108.2 133.6 H2.U H3.0 106.6 131.2 93.0 128.9 122.5 163.1December- 111.1 109.8 H9.2 99.7 H2.5 H9.e 107.U 128.5 135.5 119.lt 127.0 108.8 133.7 H I .9 H3.1 105.3 132.1 92.7 130.7 12U.U 163.1
1957: Average 113.3 112.1 123.2 107.8 112.lt 118.9 105.6 129.6 136.2 H9.U 125.6 109.3 135.2 113.0 llit.O 106.1 135.2 93.1 13U.5 127.2 17U.2March----- 111.8 H0.5 119.9 10U.9 113.1 117.8 10U.7 129.3 136.1 119.U 127.0 108.3 13U.9 H2.8 H3.7 106.1 13U.0 93.0 135.6 129.7 16U.3June— — 113.7 H2.lt 12lt.3 109.2 133.2 123.1 101.8 129.5 136.2 H9.U 121.5 109.3 13U.8 112.3 H3.U 105.2 135.0 92.8 133.8 127.7 16U.3September 115.U lllt.5 12lt.2 H2.2 113.6 120.8 107.U 130.2 136.3 H9.U 121.5 109.9 135.8 H3.8 11U.5 107.0 136.2 93.3 132.3 123.0 188.3December 113.6 H2.2 125.3 108.7 i n . 3 HU.6 107.U' 130.0 136.7 H9.6 130.7 110.3 136.1 U3.8 115.0 106.6 137.U 93.3 139.0 130.U 188.3
1958: Average 118.0 117.5 126.3 H7.9 HU.lt 129.3 105.9 130.7 137.5 12U.0 129.2 uo.o 137.3 11U.0 H6.1 105.8 138.8 93.5 1U0.U 132.1 188.3March-— 119.3 119.1 126.8 U7.lt UU. 2 136.1 106.3 130.2 137.1 119.6 130.7 109.5 136.1 11U.5 116.6 106.U 139.2 93.8 139.8 131.3 188.3June------- 119.2 118.8 126.9 120.3 113.9 135.0 1DU.7 131.0 137.2, 126.0 12U.9 109.8 136.8 113.7 116.0 105.U 138.1 93.U 139 .U 130.9 188.3September U8.lt 118.0 126.5 U8.2 H6.5 126.0 106.2 130.7 137.8 126.2 12U.9 no.3 138.3 UU.O H6.0 105.7 139.7 93.6 139.9 131.5 188.3December- 115.7 nit.6 125.0 115.6 113.6 120.7 103.9 131.5 138.6 126.2 13U.1 110.2 139.0 H3.8
1______116.2 105.5 138.3 93.U 1UU.5 136.6 188.3
B a lt lmore. Manrland___________________________________________________________________
19U7: Average 95.8 93.8 93.2 96.5 98.lt 100.0 9U.7 9U.6 92.5 90.2 96.7 99 .U 97.5 98.2 96.3 97.1 102. U 89.6 88.2 91.5January— 90.0 . . . . . . . 85.7 86.0 97.0 92.2 9U.3 91.5 91.6 81.1 87.8 93.1 97.3 96.1 100.8 90.3 92.8 H6.1 87.2 8U.1 91.UFebruary- 89.2 86.5 81t.O 95.1 93.2 93.7 (U) (U) 81.1 87.9 9U.U 98.U 96.7 100.U 91.6 9U.3 H6.0 87.1 83.9 91. UMarch------ 93.7 ■r.— 86.1 90.0 90.3 98.3 99.5 (U) (U) 81.1 88.0 93.8 99.3 97.6 100.2 95.U 97.1 96.2 87.0 83.8 91.UA pril------ 93.0 —— 93.0 86.8 93.6 98.U 100.U (U) (U) 9U.U 86.2 9U.U 100.U 97.3 99.7 95.1 97 .U 95.9 88.0 85.5 91 .UMay--------- 93.lt . . . . . . . 93.1 88.0 88.7 10U.6 96.U (U <U) 9U.5 8U.7 93.6 99.6 96.0 97.0 9U.3 97.1 95.7 88.0 85.5 91.UJune—— 95.1 . . . . . . . 9l*.7 92.8 89.5 103.9 95.0 (u5 (U) 95.0 8U.8 95.5 97.3 9U.9 9U.U 9U.U 96.7 95.3 88.1 85.U 91.6September 100.1 95.8 102.8 100.7 9U.8 103.9 97.1 96.1 97.1 93.9 99.U 98.9 98.3 97.U 99.0 97.2 101.9 92.2 92.7 91.6December- 102.U 102.2 98.3 106.U 101.7 110.2 99.0 97.U 98.2 96.0 101.1 103.1 101.1 99.U 101,9 100.9 106.5 92.5 93.2 91.6
See footnotes at end of table.97
Digitized for FRASER http://fraser.stlouisfed.org/ Federal Reserve Bank of St. Louis

Table C-3. Consumer Price Index—20 large c it ie s : Indexes of food, housing, ap p a re l, t ra n s p o rta tio n , and th e i r subgroupsby y ear and month, 19U7-58—Continued
(19U7-U9"100)
Tearand
month
Food Housing Apparel T ra n sp orta tion
Tot
al
1/
___ Food a t home
Tot
al
2/
1i_________________ Qas
and
el
ectr
icit
y
Sol
id f
uel
s an
d fu
el o
il
Hou
se-
furn
ish
ings
Hou
seho
ldop
erat
ion
Tot
al
Men
’s a
nd
boys
'
Wom
en's
and
gir
ls'
Foo
twea
r
Oth
erap
pare
l 3
/
Tot
al
1
Tot
al
Cer
eals
and
ba
kery
pr
oduc
ts
Mea
ts,
pou
ltry
, an
d fi
sh
Dai
rypr
oduc
ts
Fru
its
and
vege
tabl
es
Oth
er f
oods
at
hom
e
Pri
vate
Pu
blic
B a ltim ore , Maryland— Continued
19U8: Average lOU.O ___ 103 .1 106 .3 105 .5 100 .9 1 02 .U 1 0 1 . U 9 9.8 101.3 1 03 .6 1 0 2 . 8 1 0 2 .1 10U.3 102 .7 1 05 .5 103 .9 1 07 .5 9 7 .5 1 01 .7 9 1 .9March------- 9 9 .9 _______ 103 .0 9 7 .3 1 0 2 .it 1 0 2 .6 9 7 .1 1 0 0 . 1 98.7 1 0 0 . 6 • 9 9 .U 1 0 1 . 6 1 0 2 . 0 1 0 U.1 1 0 2 . 0 1 05 .1 10U.9 1 09 .9 95.2 9 7 .9 9 1 .6June-— - 1 0 6 . 0 1 03 .1 1 09 .7 1 0 6 . 1 10U.7 100 .7 1 0 1 . 0 9 9 .U 1 0 2 .3 100 .9 1 0 2 .6 1 0 2 . U 10U.3 1 0 3 .0 105.3 1 0 3 .8 1 0 9 .0 9 5 .3 9 8 .0 9 1 .6September 107 .6 _______ 103 .0 1 15 .3 1 0 9 .2 9 6 .7 1 0 5 .8 102 .7 1 0 0 . 6 101 .9 108 .9 1 0U.U 1 0 2 . 1 1 05 .5 1 0 U.2 107 .0 1 0 U.8 1 07 .0 100 .9 1 07 .6 9 2 .0December- 100 .9 — 102 .3 1 0 2 .5 103 .3 9U.it 1 0 2 .0 1 03 .0 1 0 1 . 6 102 .5 109 .0 103 .5 1 0 1 .3 1 0 U.2 102 .9 1 0 6 .1 103 .1 1 0 3 .U 101 .3 1 0 8 . 2 9 2 . 0
19U9* Average 1 0 0 . 1 — — 1 0 3 . 0 1 0 0 .5 9 8 .0 100 .8 9 7 .6 1 0 U.0 105 .7 106.2 1 0 6 . 1 1 00 .5 9 8.6 9 8 .3 9 9.1 98.2 9 9 .0 9 0 .0 112 .9 1 10 .1 116 .6March------- 1 00 .1 ______ 1 03 .0 9 9.2 9 9.7 1 05 .0 9 3 .6 103 .2 1 0 3 .U 102 . U 108 .9 1 01 .8 99.2 100 .9 100 .2 103 .1 9 9 .7 9U.5 113 .7 109 .8 1 18 .9June--------- 101 .7 1 02 .9 1 03 .7 9 5 .1 1 07 .7 9U.2 1 0 3 .5 105 .5 109 .0 1 0 2 .U 100 .0 9 8 .6 9 7 .9 9 9 .U 97.3 98.9 8 7 .5 11U.2 110 .7 H 8 .9September 101 .8 ___ ___ 1 02 .3 105 .1 9 8 .6 9 7 .5 1 01 .8 10U.U 107.U 107 .1 105 .9 9 9 .5 9 7 .7 9 6.1 9 7 .6 95.2 9 7 .6 86.2 11U.1 1 1 0 .6 1 18 .9December- 9 7 .9 1 02 .8 9 5.8 9 8 .3 9 5 .7 101 .3 1 0 5 .6 1 0 9 .U 107 .1 109 . U 9 8 .? 9 7 .U 9 5 .0 9 7.3 9 2 .6 9 7 .8 85.8 113 .9 110 .0 119 .2
1950: Average 1 01 .3 ______ 1 01 .9 103 .9 9 7.3 96.U 1 0 2 .5 1 0 6 . 1 109.U 10U.5 110 .0 98.7 9 8.1 9 5 .8 96.U 93.3 102 .1 89.8 117 .3 1 09 .6 128 .3March------- 97.it _______ 103.2 9 8 .7 95.3 9U.0 9 6 . 8 1 0 5 .U 1 09 .9 108 .1 108.U 9 7 .1 9 6.8 9U.3 96.2 9 1.2 99.2 8 5 .6 H 3 .9 HO.O 119 .2June— — 101 .U ______ 1 03 .0 1 05 .0 9it.9 1 05 .2 9U.7 10U.9 H O .3 1 05 .7 107 .7 95.2 9 7 .1 9U.1 9 5 .0 9 1 .6 9 9 .8 8 6 .U 1 1 3 .2 1 08 .8 119 .2September 10U.3 _______ 107 .0 112 .1 9 7 .8 9 0.2 108 .7 107 .1 H 0 .8 1 07 .3 H I . 8 1 00 .5 9 8 .8 9 7 .2 9 6.6 95.3 lO /t.2 9 2 .9 1 22 .5 1 09 .7 1U1.0December- 1 06 .5 — 108 .5 1 0 6 .U 1 01 .5 9 8 .5 H 8 .1 107 .7 H I . 2 9 7 .1 H 5 .5 103 .6 101 .0 9 9 .1 97.9 96.2 109 .0 9 8 .5 1 22 .7 110 .1 1U1.0
1951: Average 112 .1 1 1 6 .0 115 .3 108 .0 1 05 .8 113 .7 H 0 .1 H 3 .0 9 6.9 H 6 .9 1 0 8 . 1 103 .0 10U.1 1 02 .0 100 .9 1 1 8 .U 9 8 .8 125 .0 1 1 U.0 1U1.0March------- l l l . U ____ __ l l l . l n i t . 5 107 .6 1 0 6 . 2 1 12 .2 1 09 .7 111 .5 9 6 .8 H 7 .7 108 .5 1 03 .9 103 .8 101 .1 100 .9 119 .0 9 9 .1 1 23 .6 1 11 .6 1U1.0June-— — 112 .U _______ 1 15 .0 n i t . 7 107 .6 109 .7 1 13 .1 H O .O 1 12 .2 9 6 .8 1 16 .0 109 .0 1 03 .5 10U.6 102 .2 1 0 1 . U U 9 .7 1 00 .2 123 .7 1 11 .8 1U1.0September 112 .1 _____ _ 117 .1 1 1 7 .lt 107 .2 9 8 .8 117.it 1 10 .5 H ii.O 9 7 .0 H 6 .6 1 08 .3 102 .5 1 05 .1 103 .5 1 0 1 .5 1 20 .2 9 9 .1 1 26 .7 116 .7 1 U1 . 0December- 11U.1 — 117 .8 H it . 9 111 .2 1 13 .1 1 13 .5 H I . 3 1 15 .6 9 7 .0 H 7 .8 1 08 .2 1 02 .9 10U.7 1 03 .0 101 .9 1 18 .0 96.3 1 27 .9 1 18 .8 1 U1 . 0
1952: Average llU .6 ___ 117 .7 1 16 .0 111 .7 1 18 .7 107 .7 1 12 .0 H 8 .0 97.2 120 .8 1 0 U.O 10U.5 103.U 1 02 .0 1 00 .6 1 16 .0 9U.U 1 32 .6 121 .7 1 U8 .3March------ 112 .7 1 18 .1 l i l t . 8 1 12 .0 U U .l 103 .8 H 1 .0 116 .7 97.1 117 .9 10U.8 102 .7 1 0 3 .U 101 .6 1 00 .9 116. U 9 3 .9 128 .7 120 .1 1U1.0June-------- llU .0 ____ __ 117.2 116 .6 110.7 119 .8 103.2 1 11 .7 H 8 .0 9 7 .1 116 .5 105 .7 1 02 .7 103 .6 102 .L 101.2 1 15 .7 9 3 .0 128 .7 1 2 0 .0 1U1.0September 116 .1 117 .3 1 19 .9 112 .2 115 .5 112 .0 112 .7 118 .9 97.1 123 .7 103 .2 1 07 .1 1 02 .9 101.8 100 .0 115.U 9U.6 1 38 .2 12U.3 1 58 .5December- 1 13 .5 — H 7 .0 uit.lt 1 11 .6 1 15 .6 1 08 .5 H 3 .5 119 .9 9 7 .5 126 .8 1 03 .9 1 0 6 .8 1 02 .9 1 01 .8 9 9.5 H 5 .9 9 5 .e 138 .3 12U.3 1 5 8 .5
1953: Average 113.2 1 12 .8 117.1 1 11 .6 1 12 .1 H 2 .9 110 .3 H 3 .6 1 21 .2 9 7 .5 125 .2 103 .2 1 09 .0 1 03 .3 1 0 2 . a 9 9 .8 1 16 .3 9 5 .8 139 .0 125 .0 1 5 8 .5March------- 111 .7 111 .2 116 .5 108 .3 1 12 .5 H it . 3 1 0 7 .U 1 13 .8 1 20 .2 9 7 .8 126 .7 103 .2 109 .1 1 02 .8 102 .0 99.2 1 15 .6 9 5.8 1 38 .0 123 .9 1 58 .5June-------- 1 1 1 .6 111 .5 117 .1 112 .8 1 1 2 . 5 122 .5 108 .9 H 3 .3 (U) 9 7.3 122.3 103 .U 109 .2 10U.2 102 .7 1 0 1 . U H 6 .2 9 6.9 1 38 .8 12U.8 1 58 .5September 1 1 1 .? 1 1 1 .3 I I 6 . 0 1 15 .7 112 .1 107 .7 115 .5 H 3 .6 1 21 .7 97.U 12U.5 103 .2 109 .2 1 03 .5 1 03 .1 9 9 .5 116 .7 9 6 .5 1U0.1 126.2 1 5 8 .5December- 112 .9 112 .1 1 21 .0 1 09 .9 112 .1 108 .2 1 11 .3 H 3 .7 (U) 9 7 .5 12U.1 1 02 .7 109 .1 102.U 301.9 9 8 .7 H 7 .2 9 3.1 1 3 9 .6 125 .6 1 58 .5
195U: Average l l l . l 113.3 1 21 .8 n o . 6 109 .3 111.2 11U.U l i l t . 2 12U.2 9 8 .7 1 23 .6 100. C 1 1 0 .U 1 0 2 . 5 101 .5 99.0 1 17 .1 9U.2 1 37 .6 123 .0 1 6 1 .2March------- 113 .6 112 .7 1 21 .6 112 .2 111 .9 1 07 .5 1 11 .0 H 3 .8 1 23 .7 9 7 .5 126 .9 100 .9 109 .7 1 0 2 .U 101 .3 9 8.9 H 7 .5 9 3 .1 138 .2 12U.1 1 58 .5June-------- 1 1 6 .0 115 ;6 121 .7 1 15 .0 107 .2 1 18 .2 H i t .8 113 .9 (U) 9 7 .5 121 .1 9 9 .8 109 .3 102 .2 101 .7 9 8.0 1 1 7 .0 9U.7 1 37 .8 123 .8 1 57 .9September 1 11 . 2 113 .3 1 21 .9 1 0 8 .8 lb 8 .9 H I .9 H 6 .5 llU .U 12U.7 9 9 .6 121 .1 9 9 .1 H I . 3 103 .1 1 0 1 .U 100 .1 H 6 .8 9 5 .1 135 .3 119 .9 165.UDecember- 111.1 110 .0 122 .3 10lt.lt 109 .1 105 .5 H 2 .6 H 5 .1 (U) 100 .0 127 .2 9 9.1 112 .6 1 0 2 . 5 1 0 1 .U 98.9 117 .0 9U.U 138 .9 123 .8 165.U
1955: Average 111 .7 1 10 .1 121 .9 1 02 .a 108 .6 H 2 .U 1 H . 2 H 6 .6 1 25 .9 9 9 .9 12U.6 9 8 .2 1 12 .2 1 0 2 . 5 101 .2 98.9 H 7 .U 9U.3 1 36 .5 1 20 .9 1 66 .8March------ 111 .7 110 .3 122 .0 103 .7 108 .3 no.o H 2 .1 H 5 .9 125 .0 100 .1 127 .2 9 8 .5 H O .9 102 .7 101 .2 9 9 .5 1 16 .7 9U.U 136 .8 1 2 1 .5 165.UJune— — 112 .2 110 .7 121 .9 I0lt.2 1 08 .1 118 .6 107 .U H 5 .8 (U) 9 9 .9 1 21 .7 97.7 1 31 .9 102 .5 1 01 .U 9 8.9 H 7 .0 9U.2 137 .0 1 21 .7 165.USeptember u . 2 .5 1 11 .0 1 21 .9 lOU.O 109 .0 1 11 .0 H 3 .7 H 6 . 9 126 .7 9 9 .7 1 2 2 .6 98.2 131 .9 1 0 2 .3 1 00 .9 9 8 .6 H 7 .8 9U.2 1 35 .6 H 9 .7 1 68 .7December- 110 .1 107 .8 121 .3 9 5.7 108 .9 107 .9 H 3 .2 H 9 .0 (U) 9 9 .9 127 .9 98.2 H U . 7 1 0 2 .U 1 0 1 . U 98.2 H 8 .7 9U.2 135.3 H 9 .3 168 .7
1956: Average 112 .9 110 .2 1 22 .5 9 8 .1 109.it H 7 .3 H 2 .8 H 7 .1 1 28 .2 9 9 .9 1 3 1 .6 9 8 .0 H 6 .6 10U.9 103 .3 100 .7 1 23 .5 9 5 .5 1 3 9 .0 1 20 .9 18U.9March------- 1 10 .2 107 .1 121 .3 9 3 .7 1 08 .9 112 .7 H O .7 H 6 J 1 126 .8 9 9 .9 130 .3 9 7 .5 H 5 .2 103 .7 102 .6 9 9 .5 121.1 9U.9 1 36 .8 H 8 .3 I 8 5 .eJune-------- 111 . 2 1 12 .0 1 2 1 .8 98.li 1 09 .1 129 .9 H 1 .U H 5 .9 (U) 9 9 .9 129 .6 9 6 .8 H 7 .1 10U.7 103 .8 1 00 .0 123.2 9 5.3 137.U 1 18 .8 1 86 .6September llU .5 111 .9 1 22 .2 102 .7 I09 .lt H 5 .5 H 5.U H 6 .1 129 .3 1 00 .0 1 30 .0 9 8.2 H 7 .2 1 0 6 .5 1 03 .7 103 .1 125 .7 9 6 .3 1 U0 . 0 121 .7 186 .6December- llU .8 1 1 1 .0 126 .6 9 9 .3 1 12 .5 112 .1 H it . 2 120.2 1 29 .8 1 00 .0 137 .9 100 .2 H 7 .9 105 .9 103 .9 101 .3 126 .8 9 6 .3 1U5.3 127.U 186 .6
1957: Average 1 1 6 .8 1 13 .5 127 .2 105 .8 H 3 .2 115.U H 2 .9 1 21 .1 131.5 100 .6 1 39 .2 1 00 .7 1 21 .5 1 0 6 .U 1 05 .2 101.3 126.9 9 6 .3 1U7.7 1 29 .8 187 .2March-— - llU .9 1 11 .5 127 .2 102 .0 H 2 .5 1 12 .7 1 12 .1 120 .2 1 31 .0 100 .1 1U5.U 1 0 0 .U H 9 .0 1 05 .3 10U.2 9 9 .8 127 .0 9 5 .8 1U7.3 1 2 9 .U 187 .3June--------- 117 .5 111 .1 127 .1 1 07 .5 112 .6 122 .3 H O.O 1 2 1 .5 131.U 1 00 .3 139 .6 1 01 .1 121 .6 105 .2 105 .2 99.0 1 27 .0 95.3 1U6.7 1 28 .8 187 .3September 118 .1 1 11 .9 1 2 7 .0 u o . l t 111 .9 115 .1 H i t . l 1 2 1 .1 131 .8 1 0 1 .U 13U.6 100 .7 1 21 .6 108 .3 1 0 6 .2 10U.7 126 .3 97 .U 1U7.8 1 29 .9 187 .3December- 117 .1 113 .9 1 2 7 .U 1 0 5 .8 H 7 .2 1 12 .0 H it . 3 122 .2 132 .7 1 0 1 . U 13U.6 1 0 1 .0 1 27 .0 1 07 .0 1 0 6 .1 101 .9 127 .3 9 6.7 1 50 .7 1 33 .1 1 87 .3
1958: Average 120.9 1 18 .2 128.3 H lt .2 H 7 .5 12U.5 112.3 12U.1 13U.5 105.U 129.U 9 9 .5 130.3 207 .5 106 .2 103 .0 128.1 9 5 .2 1 5 1 .6 133 .2 1 92 .5March— - 121 .5 118 .8 128.U 1 12 .7 H 7 .lt 127 .3 H U .5 122 ."8 13U.0 101 .5 128 .7 100 .7 1 3 0 .0 107 .7 1 0 6 .? 1 03 .2 127 .7 9 6 .9 1U9.7 1 31 .9 1 8 8 .0June--------- 122 .1 1 20 .1 1 28 .6 U 7 .0 H 7 .5 131.7 1 H .3 12U.U 13U.6 105.6 125 .6 9 9 .0 130.3 107 .7 1 05 .9 103.2 127 .9 9 7 .U 1U8.1 130 .1 1 8 8 .0September 120 .3 117 .5 128 .2 l l l t . 5 H 7 .7 116 .9 H U .1 12U.7 13U.7 108 .2 129 .5 9 9 .0 131.1 1 0 6 .0 106.3 io u .5 128 .5 92.U 152 .2 13U.5 1 8 9 .0December- 118.8 115 .9 1 28 .7 1 12 .8 H 7 .it U 6 .lt 109 .9 125 .9 135.8 1 08 . U 135.U 9 8 .7 1 31 .5 1 06 .3 106.3 100.8
1___ ____128 .7 9 2 .9 1 59 .5 138 .1 215.U
Boston , M assachusetts
19U7: Average 9 5 .5 ___ 9 1 .9 9 3 .e 95.it 9 8 .9 99 .U 9U.U 95.3 9U.U 8 8 .9 9 6.7 9 8.9 96.9 9 8 .1 9 7 .8 9 2 .6 9 5.3 9U.9 9U.1 9 5 . UJanuary— 9 2 .2 - — — 86.2 88.lt 9 8 .7 9U.2 9 5 .0 (U) (U) 93 .2 85.2 9 3.7 9 6 .5 9 3.9 9 9 .5 93.3 8 6.8 8 0 .1 9 3 .9 9 1 .9 9 5 .3F ebruary- 89.7 — 8 6 .3 8U.7 93.1 9 5 .8 9 2.0 (U) (U) 93.1 8U.8 9U.8 9 7 .1 9 5 .9 1 02 .3 95.1 88.0 7 9.8 9 3 .9 9 1.9 9 5 .3March------- 9 3 .5 — — - 89.0 89.6 9U.3 9 9 .5 9 8.5 9 2 .7 9 2 .7 93.2 8 5 .0 9 6 .3 9 8 .5 9U.9 9 7 .8 96.2 8 8.8 8 0.0 9U.1 9 2 .u 95.3A p r i l ------- 9 1 .5 ---------- 9 0 .6 86.lt 89.8 9 8 .7 9 9 .0 (U) (U) 9 3 .9 8 7.8 9 7.1 100 .3 9U.8 9 7 .5 9 6 .5 8 8.0 8 0 . 0 9U.U 9 3 .2 95 .3May----------- 9 1 .2 — 9 1 .6 8 8 .3 8U.7 1 00 .6 9 5 .8 (U) (U) 9U.0 85.1 9 6 .9 9 9 .1 9U.U 9 7.3 9 5 .7 88.U 8 0.0 9U.U 9 3 .2 9 5 .3June--------- 93.3 — 91.6 9 3 .9 81t.8 1 00 .8 96.U (U) (U) "9U .0 85.1 9 7.2 9 8.6 95.U 9 6 .2 9 5.9 9 1 .1 10U.2 9U.5 9 3 .1 9 5 .5J u ly --------- 95 .3 — 91.7 93.lt 9 2 .2 100.U 101 .6 (U) (U) 9 3 .9 86.6 9 6 .0 9 7.7 9 6 .0 9U.7 9 6 .5 9 5 .5 10U.2 9U.9 93.9 9 5 .5A u g u s t - 9 7 .6 — 9 2.2 9 7 .e 96.lt 100 .1 100 .9 (U) (U) 9U.7 9 1 .1 9 6 .1 9 7 .9 9 8 .3 9 7 .1 99.9 9 5 .6 105 .6 9 5 .2 9U.8 9 5 .5Sept ember 101 .1 — 9 2 .2 1 05 .3 102 .2 97.2 10U.6 9 6 .U 9 7 .2 9 5 .0 9 1 .1 98.3 9 7 .8 9 9 .2 9 8 .0 100 .8 9 6 .5 1 0 7 .0 9 5 .7 9 6 .0 9 5 .5O ctober— 9 9 .6 — 9 2 .9 101 .2 9 9 .5 9 8 .5 1 03 .8 (U) (U) 9 5 .7 9 1 .5 97 .U 9 9 .3 9 9 .3 9 8 .2 101 .0 9 6 .5 1 0 6 . 0 9 5 .7 9 6 .0 9 5 .5November- 9 9 .9 - — — 9 6 .6 9 9.3 102 .9 100 .1 99 .U (U) (U) 9 5 .8 95.U 9 7 .9 101 .2 100 .1 9 9 .5 101.U 9 6 .9 1 08 .2 9 5 .8 9 6 .3 9 5 .5Dee ember- 1 01 .6 101.lt 9 7 .5 106 .2 101.Ii 105 .3 9 9 .1 98.U 9 6 .0 9 8.2 99.1 1 03 .0 1 00 .8 9 9 .5 1 01 .9 9 9.2 1 08 .6 9 5.9 96.6 9 5 .5
See footnotes at end of table.98
Digitized for FRASER http://fraser.stlouisfed.org/ Federal Reserve Bank of St. Louis
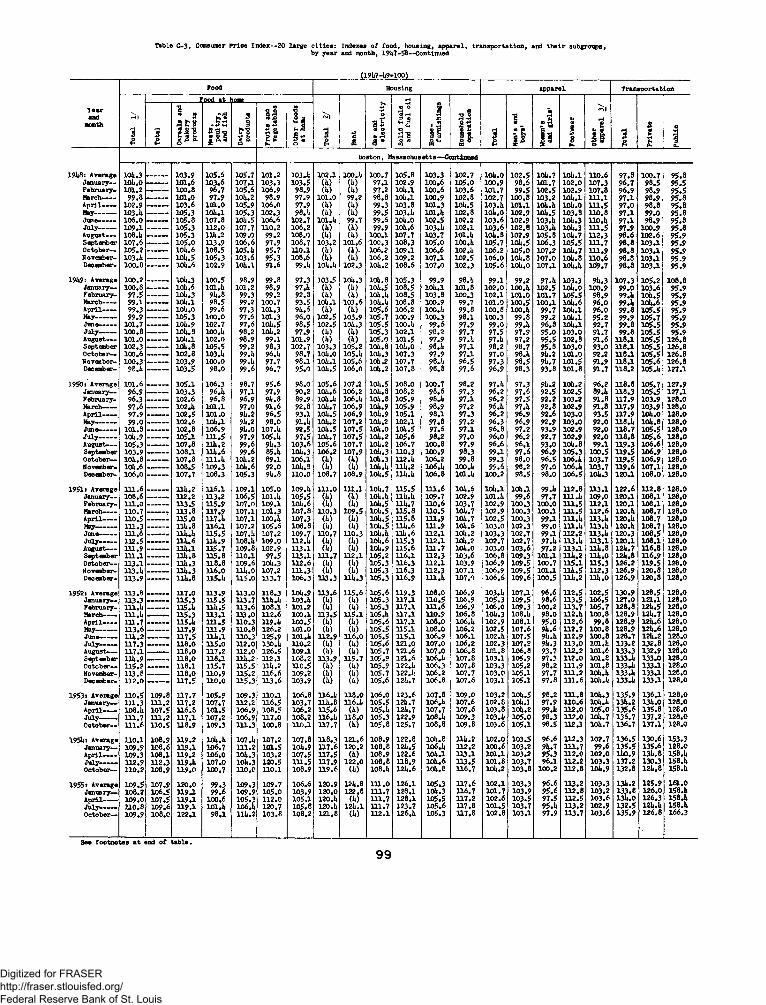
Table C-3. Consumer Price Index—20 large c i t ie s : Indexes o f food , housing, apparel, transportation, and th eir subgroups;by year and month, 19U7-58—Continued
(19U7-U9-100)
Tearand
month
Food Housing Apparei Transportation
To
tal
1/
Food at
To
tal
2/
Ren
t
Oas
an
de
lec
tric
ity
So
lid
fu
els
an
d fu
el
oil
Hou
se-
furn
ish
ing
s
Hou
seh
old
op
era
tio
n
Tot
al
Men
's
and
bo
ys'
Wom
en's
an
d g
irls
'
Foo
twea
r
Oth
era
pp
are
l 3
/
To
tal
Tot
al
Cer
eals
an
d b
aker
y p
rod
uct
s
Mea
ts,
po
ult
ry,
and
fish
Dai
ryp
rod
uct
s
Fru
its
and
veg
eta
ble
s
Oth
er f
oo
ds
at
hom
e
Pri
va
te
Pu
bli
c
boston, Massachusetts—Continued
191*8: Average 10lu3 103.9 105.6 105.7 101.2 103.U 102.1 ioo.U 100.7 105.8 103.3 102.7 IOU.O 102.5 10U.7 10U.1 110.6 97.8 100.7 95.8January— 10U.0 — 101.6 103.6 107.1 103.3 103.5 (U) (U) 97.1 102.9 100.6 105.0 100.9 98.6 101.7 102.0 107.3 96.7 98.5 95.5February- 101.2 — 100.8 96.7 105.6 106.9 98.9 (U) (U) 97.2 IOU.1 100.6 103.6 101.7 99.5 102.5 102.9 107.8 96.9 98.9 95.5March---- 99.8 — 101.0 97.9 10U.2 98.9 97.9 101.0 99.2 98.8 10U.1 100.9 102.8 102.7 100.8 103.2 10U.1 H l . l 97.1 98.9 95.8April---- 102.9 — 103.6 101.0 105.9 1 06 .0 97.9 (U) (U) 99.3 103.3 101.3 IOU.5 103.U 101.1 10U.U IOU.O 1H .5 97.0 98.8 95.8May------ 103.1* — 105.3 10l*.l 105.3 102.3 98. U (U) (U) 99.5 103.U KXL.U 102.8 IOU.O 102.9 10U.5 103.8 110.8 97.1 99.0 95.8June----- 106 .0 — 105.8 107.8 10U.5 106 .6 102.7 ioi.U 99.7 99.6 IOU.O 102.5 102.2 103.6 102.9 103.U 10U.3 1 1 0 . U 97.1 98.9 95.8July----- 109.1 105.3 312.0 107.7 110.2 106.2 (U) (U) . 99.9 10U.6 103.U 102.1 103.6 102.8 103.U 10U.3 hjl. 5 97.9 100.9 95.8August— 108.1* ___ _ 105.3 13i*.2 109.0 99.2 108.0 (U) (U) 100.1 107.7 103.7 IOI.U 10U.3 102.9 105.3 10U.7 H 2.3 98.6 102.6 95.9September 107.6 — — 105.0 113.9 1 0 6 .6 97.9 108.7 103.2 101.6 100.3 108.3 105.0 IOO.U 105.7 10U.5 106.3 105.5 111.7 98.8 103.1 95.9October— 105.2 -—— 10U.6 108.5 105. U 95.7 110.1 (U) (U). 106.2 109.1 1 06.6 102. U 106.2 105.0 107.2 10U.7 H I . 9 98.3 103.1 95.9November- 103.1* ——— 10l*.5 105.3 103.6 95.3 108.6 (U) (U) 1 06 .2 109.2 107.1 102.5 1 06 .0 10U.8 107.0 10U.8 H 0.6 98.8 103.1 95.9December- 100.8 — IOU.6 102.9 1QU.1 91.6 99.U loU.U 102.3 10U.2 1 0 8 .6 107.0 102.3 105.6 10U.0 107.1 10U.U 109.7 98.8 103.1 95.9
19U9: Average 100.2 _____ 10l*.3 100.5 98.9 99.8 97.3 103.5 10U.3 ioU.3 105.3 99.9 98.U 99.1 9 9.2 97.U 103.3 9U.3 107.3 105.2 108.8January— 100.8 -—— 102*.6 101.1* 101.2 98.9 97 .U (U) (U) 10U.5 108.5 IOU.1 101.8 102.0 1 00 .U 102.5 10U.O 100.9 99.0 103.6 95.9February- 97.5 -— — lot*.3 9U.8 99.3 99.2 92.3 (U) (U) 10U.U 108.5 103.8 100.3 102.1 1 0 1 .0 101.7 105.5 98.9 99.U 10U.5 95.9March---- 99.1 -— — 10t*.l 98.5 99.2 100.7 93.5 loU .l 103.6 10U.U 108.8 100.9 99.7 101.0 1 00 .5 100.1 10U.6 96.0 99.U 10U.6 95.9April---- 99.3 — —- ioU.o 99.6 97.3 101.3 9U.6 (U) (U) 105.6 106.2 IOO.U 99.8 100.8 ioo.U 99.7 10U.1 96.0 99.8 105.5 95.9May------ 99.9 -— — 105.3 100.0 97.6 101.3 96.0 102.5 103.9 105.7 100.9 100.3 98.1 100.3 99.8 99.2 IOU.1 95.2 99.9 105.7 95.9June----- 101.7 —— 10ii.9 102.7 97.6 10U.5 98.5 102.5 10U.3 105.5 IOO.U 99.6 97.9 99.0 99 .U 96.8 10U.1 92.7 99.8 105.5 95.9July-— - 100.8 — — lot*. 8 100.1* 98.2 10U.2 97.9 (U) (U) 105.3 102.1 98.2 97.7 97.5 97.9 95.0 1 03 .0 91.7 99.8 105.5 95.9August— 101.0 — 10U.1 102.0 98.9 99.1 101.9 (U) (U) 105.0 1 0 1 .5 97.9 97 .U 97 .U 97.2 95.5 102 .8 91.6 H 8.1 105.5 126.8September 102.3 lot*.8 105.5 99.2 98.3 102.7 103.3 105.2 10U.8 IOU.O 98.U 97.1 98.2 98.7 95.8 1 0 3 .0 93.0 H 8.1 105.5 126.8October— 100.6 — — 102.8 103.1* 99.U 96.U 98.7 IOU.O 105. U 10U.3 107.3 97.9 97.1 97.0 98.U 9U.2 1 0 1 .0 92.2 H 8.1 105.5 126.8November- 100.3 — — 103.9 100.0 99.U 97.7 98.1 10U.1 105.6 10U.2 107.7 98.U 96.5 97.3 98.5 9U.7 1 0 1 .5 91.9 H 8.1 105.6 126.8December- 98.U — 103.5 98.0 99.6 96.7 95.0 10U.5 1 0 6 .0 10U.2 107.8 98.8 97.6 96.9 98.3 93.8 1 01 .8 91.7 H 8.2 105 .U 127.1
1950s Average 101.6 ___ 105.1 106.3 98.7 95.6 98.0 105.6 107.2 ioU.5 108.0 100.7 98.2 97 .U 97.3 9U.2 10U.2 96.2 H 8.8 105.7 127.9January— 96.9 — — 103.3 96.1* 97.1 97.9 90.2 10U.6 1 06.2 loU.3 108.2 98.6 97.3 9 6.2 97.6 92.5 102 .5 89.U H 8.3 105.5 127.1February- 96.3 ------ 102.6 96.8 96.9 9U.8 89.9 10U.U 1 06 .U 10U.8 105.9 98.U 97.1 96.2 97.5 92.2 103 .2 91.8 H 7.9 1 03 .9 128.0March— 97.6 —__ _ 102.1* 101.1 97.0 91.6 92.8 10U.7 106.9 10U.9 105.9 98.9 97.2 96.U 97.U 92.8 102 .9 91.8 H 7.9 103.9 128.0April---- 97.9 102.5 101.0 9U.2 96.5 93.1 10U.5 106.9 10U.9 105.1 98.1 97.3 9 6.2 96.9 92.6 1 0 3 .0 93.5 H 7.9 10U.0 128.0May------ 99.0 ——— 102.6 lOli.l 9U.2 98.0 91.U 10U.2 107.2 10U.2 102.1 97.8 97.2 96.3 96.9 92.9 1 0 3 .0 92.0 H8.1* 10U.8 128.0June----- 101.8 102.8 106.9 9U.0 107.U 92.5 10U.5 107.5 ioU.o ioU.5 97.6 97.1 9 6 .8 97.2 93.9 1 02 .9 92.0 H 8.7 105.5 128.0July—— 10l*.9 — — 105.1 131.5 97.9 105.U 97.5 10U.7 107.5 10U.2 105.6 98.2 97.0 9 6.0 9 6.2 92.7 1 02 .9 92.0 H 8.8 1 0 5 .6 128.0August-— 105.3 _____ 107.8 111*. 2 99.6 9U.3 103.6 105.6 107.7 10U.2 106.7 100.8 97.9 9 6.6 96.1 93.0 10U.8 99.1 H 9.3 1 0 6 .6 128.0September 103.9 _____ 108.1 Hi*. 6 99.6 85.U 10U.3 106.2 107.9 10U.3 HO.3 100.9 98.3 99.1 97.6 96.9 105.3 100.5 H 9.5 1 0 6 .9 128.0October— 10l*.8 _____ 107.8 111.1* 10U.2 89.1 1 06 .1 (U) (U) 10U.3 H2.U 1 06.2 99.8 99.3 98.0 96.5 1 06 .U 103.7 H 9.5 1 0 6 .9 128.0November- 10l*.6 —__ 108.5 109.3 10U.6 92.0 10U.3 (U) (U) loU.U llU .2 1 06 .U IOO.U 99.6 98.2 97.0 1 06 .U 103.7 H 9.6 1 0 7 .1 128.0Dee ember- 1 0 6 .0 — 107.7 108.3 105.3 9U.8 HO.O 108.7 108.9 10U.5 llU.U 1 0 6 .8 IOI.U 100.2 98.5 98.0 106.5 10U.3 120.1 1 0 8 .0 128.0
1951* Average 111.6 ____ _ 111*. 2 n 6 . i 109.1 105.0 109.U H 1.0 1H .1 10U.7 H 5.5 H I .6 10U.6 10U.1 10U.1 99 .U H 2.8 H 3.1 122.6 H 2.8 128.0January— 108.6 _____ 112.2 113.2 106.5 ioi.U 105.5 (U) (U) 10U.U HU.U 109.7 102.9 ioi.U 99.6 97.7 U l.l* 109.0 120.1 1 08 .1 128.0February- 111.0 — 113.5 115.9 107.0 109.1 10U.6 (U) (U) ioU.5 HU.7 H 0.6 103.7 102.9 100.3 100.0 111.5 H 2.1 120.1 108 .1 128.0March—— 110.7 — - 113.8 117.9 107.1 101.3 107.8 H 0.3 109.5 loU.5 115.8 H 0.5 10U.7 102.9 100.3 100.1 1H .5 112.6 120.U 1 08 .7 128.0April---- 110.5 _____ 115.0 117.U 107.1 ioo.U 107.3 (U) (U) ioU.5 H 5.8 H I .9 10U.7 102.5 100.3 99.1 1 1 1 .U H3.U 120.1* 1 08 .7 128.0May------ 111.3 _____ lit*. 8 1 1 6 .1 107.2 105.6 108.8 (U) (U) ioU.5 11U.6 1H .9 10U.6 103.0 102.3 99.0 1H.U H3.U 120.U 1 08 .7 128.0June-— - 111.6 _____ Hl*.l* 115.5 107.U 107.2 109.7 n o .7 HO.3 10U.U 11U.6 H 2.1 10U.2 103.3 102.7 99.1 H 2.2 H3.U 120.3 108.5 128.0July— — 112.5 —— 111*. 6 111*. 9 108 .U 109.0 H2.U (U) (U) 10U.6 H 5.3 H 2.1 10U.2 102.7 102.7 97.U H3.U 113.1 120.1 1 0 8 .1 128.0August— 111.9 ____ l l i i . l 115.7 109.8 102.9 U 3.1 (U) (U) 10U.9 H 5.6 H I . 7 ioU.o 103.0 103.6 97.2 H 3.1 HU.8 12U.7 H 6.8 128.0September 111.1 _____ 111*. 8 115.8 110.1 97.5 133 .1 H I .7 H 2.1 105.2 H 6.1 H 2.3 103.6 1 0 6 .8 109.3 101.1 llU .2 hlU.o 12U.8 H 6 .9 128.0October— 113.1 _____ 111* .3 118.8 109.6 10U.3 112.6 (U) (U) 105.3 H 6.3 H 2.1 103 .,9 106.9 109.5 100.7 H 5.1 H 5.3 126.2 119.5 128.0November- 113.U ____ 111*. 3 1 16.0 11U.0 107.2 131.3 (U) (U) 105.3 H 6.3 H 2.3 107.1 106.9 109.5 101.1 11U.5 H 2.3 126.9 120.8 128.0Dee ember- 113.9 — 111*. 8 115.1* 115*0 113.7 106.3 U 3.3 HU.3 105.3 H 6.9 in .U 107.0 1 0 6 .6 109.6 100.5 HU.2 11U.0 126.9 120.8 128.0
1952: Average 113.8 ___ H 7.0 113.9 113.0 118.3 10U.9 H 3.6 115.6 105.6 119.3 1 0 8 .0 106.9 103.U 107.1 9 6 .6 H 2.5 102.5 130.9 128.5 128.0January— 113.3 ___ 115.3 115.5 113.7 11U.U 103.U (U) (U) 105.3 117.1 H 0.5 106.9 105.3 109.5 98.6 H 3.5 106.5 127.0 i a . i 128.0February- 111.1* ___ U5.1* llU .5 313.6 108.1 101.2 (U) (U) 105.3 H 7.1 1 H .6 106.9 106 .0 109.3 100.2 H 3.7 105.7 128.8 12U.5 128.0March---- ll l . l * — —- 115.3 113.1 133.0 112.6 100.1 H 3.5 H 5.1 105 .U 117.1 110.9 106.8 10U.3 108 .U 98.0 H2.U 100.8 128.9 12U.7 128.0April---- U 1.7 _____ 315.1* U 1 .5 110.3 119.U 100.5 (U) (U) 105.6 H 7.1 108.0 106.U 102.9 108.1 95.0 H 2.6 99.8 128.9 12U.6 128.0May------ 113.6 -___ _ 117.9 111.9 110.8 126.2 101.0 (U) (U) io 5 .5 H 5.1 108.0 106.2 102.5 107.6 9U.6 H 2.7 100.8 128.9 12U.6 128.0June----- llU .2 _____ 317.5 11U.1 110.3 125.9 ioi.U H 2.9 H 6.0 105.5 H 5.1 106.9 106.1 102.U 107.5 9U.U H 2.9 100.8 128.7 12U.2 128.0July----- 117.3 __ __ 318.0 115.0 112.0 130.U HO.2 (U) (U) 105.6 121.0 107.0 106 .2 102.3 107.2 9U.3 H 3.0 IOI.U 133.2 132.8 128.0August--- 117.1 ___ 318.0 117.2 112.0 126.5 109.1 (U) (U) 105.7 121.6 107.0 106.8 101.8 1 06 .8 93.7 H 2.2 101.6 133.3 132.9 128.0September 111*.9 ___ 318.0 118.1 11U.2 112.1 1 0 8 .2 H 3.9 H 5.7 105.9 121.6 1 0 6 .U 107.8 103.1 105.9 97.3 112 .0 101.8 133.U 133.0 128.0October— 115.2 ___ 118.1 115.7 H 5.5 11U.2 H 0.5 (U) (U) 105.9 122.U 106.3 107.8 103.3 105.2 98.2 H I .9 I d . 8 133.U 133.1 128.0November- 113.8 ___ 318.0 H 0.9 115.2 116.6 109.2 (U) (U) 105.7 122.U 1 0 6 .2 107.7 103.0 105.1 97.7 H I .2 loU.U 133.U 133.1 128.0Dee ember- 112.0 — 117.5 HO.O 115.3 113.6 103.9 (U) (U) 105.6 12U.7 1 06 .8 107.6 103.1 105.1 97.8 111.6 loU.U 133.U 133.1 128.0
1953 s Average 110.5 109.8 317.7 105.9 109.3 110.1 1 06 .8 H6.U 118.0 1 06 .0 123.6 107.8 109.0 103.2 10U.5 98.2 H I .8 10U.3 135.9 136.1 128.0January— 111 .3 111.2 117.2 107.7 112.2 116.5 103.7 11U. 8 116.U 105.5 12U.7 1 0 6 .U 107.6 102.8 10U.1 97.9 110.6 10U.U 13U.2 13U.0 128.0April---- 1 08 . 1* 107.5 116.8 101.5 106.9 108.5 106 .2 H 5.6 (U) 105.U 12U.7 107.7 107.6 103.8 10U.2 99 .U H 2.0 1 05 .0 135.6 135.8 128.0July----- 111.7 111.2 317.1 107.2 106.9 117.0 1 08.2 H6.U 118.0 105.3 122.9 108.U 109.3 103.U 105.0 98.3 112.0 10U.7 136.7 137.2 128.0October— 111.6 n o .5 118.9 109.3 111.3 100.8 n o . i H 7.7 (U) 105.8 125.7 108.8 109.8 103.6 105.1 98.5 112 .1 10U.7 136.7 137.1 128.0
195U: Average 110.1 108.9 119.2 loU.U 107 .U 107.2 107.8 H 8.3 121.6 108.9 122.8 10U.8 HU.2 102.0 103.5 9 6.6 H 2.3 1 0 2 .7 136.5 130.6 153.3January— 109.9 108.6 319.1 106.7 111.2 101.5 10U.9 H 7.6 120.2 1 0 8 .8 12U.5 1 0 6 .U H 2.2 100.6 103.2 9U.7 H I .7 99.6 135.5 135.6 128.0April---- 109.3 108.1 119.2 106 .0 10U.3 103.2 107.5 H 7.5 (U) 108.9 122.6 IOU.1 113 .1 101.1 103.2 95.3 H 2.0 102.0 11*0.9 13U.8 158.UJuly--- - 112.9 112.3 119.U 107.0 10U.3 120.5 i n . 5 H 7.9 122.0 1 0 8 .8 H 8.9 10U.6 113.5 101.8 103.7 96.1 H 2.2 103.3 137.2 130.3 158.1*October— 110.2 1 08.9 319.0 100.7 110.0 110.1 108.9 H 9.6 (U) 108.U 12U.6 10U.8 H 6.7 10U.2 103.8 100.2 H 2.8 10U.9 132.8 12U.8 158.U
1955s Average 109.5 107.9 120.0 99.3 109.3 109.7 1 06.6 120.9 3L2U.8 H I .0 126.1 105.3 H 7.6 102.1 103.3 96.6 H 3.2 103.3 13U.2 125.9 161.0January— 108 .2 106.5 119.1 99.6 109.9 io5.o 103.9 120.0 122.8 H 1.7 128.1 10U.3 H 6.7 101.7 103.9 95.6 H 2.8 103.2 133.e 126.0 158.UApril---- 109.0 107.5 119.1 100.6 105.3 112.0 105.1 120.U (U) H I .7 128.1 105.5 H 7.2 102.6 103.5 97.5 112.5 103.6 13U.0 126.3 158.1*July----- n o .8 109.6 119.1 101.U 106 . 1* 120.7 105.8 120.U 12U.1 H I .7 123.7 105.6 H 7.8 101.5 103.7 95.U 113.2 102.9 132.5 HU.U 158.UOctober— 109.9 1 08 .0 122.1 98.1 HU.2 103.8 1 08.2 121.8 (U) H 2.1 126.U 105.3 H 7.8 102.8 103.1 97.9 H 3.7 103.6 135.9 126.8 166 .3
See footnotes at end of table.
99
Digitized for FRASER http://fraser.stlouisfed.org/ Federal Reserve Bank of St. Louis

Table C-3. Consumer Price Index—20 large c i t ie s : Indexes o f food , housing, apparel, transportation, and their subgroupsby year and month, 191*7—58—Continued
(191*7-1*9-100)
Tearand
month
Food Housing Apparel Transportation
Tot
al
1/ cvT|
306-* Rent
Qas
and
elec
tric
ity
Solid
fue
ls
and
fuel
oil
Hou
se-
furn
ishi
ngs
Hou
seho
ldop
erat
ion
Tota
l
Men
's an
d bo
ys'
Wom
en's
and
girl
s'
Foot
wea
r
Oth
erap
pare
l 3/
Tot
al
1
Tot
al
Cer
eals
and
ba
kery
pr
oduc
ts
Mea
ts,
poul
try,
an
d fi
sh
Dai
rypr
oduc
ts
Fru
its
and
vege
tabl
es
Oth
er f
oods
at
hom
e
Priv
ate
Pub
lic
Boston, Massachusetts—-Continued
1956: Average 111.0 108.6 123.1 9 6 .6 110.2 115.6 1 06 .8 125.6 132.2 109.1 132.7 105.9 120.1* 103.1 103.3 96.9 119.1 103.1* 138.9 130.1. 166.6January— 108.1* 105.8 122.1 93.8 108.9 1 06 .6 106 .8 123.1* 129.2 107.1 131.5 106 .2 118.9 l d . 2 101.1 95.7 111*. 8 102.6 135.9 126.8 166.3A p ril------ 107.9 105.3 122.1 92.2 106.1* 310.1* 105.6 121*. 7 (U) 107.3 131.5 105.7 120.1 102.5 103.1 96.1 118.2 103.5 136.3 127.3 166.3July-------- 111*. 2 112.7 122.9 99.3 110.0 13U.2 107.5 125.5 132.7 110.3 130 .9 106 .1 120.8 102.8 103.9 95.8 120.6 103.2 135.6 126.3 166.9October— 113.2 110.9 123.7 101.0 1u*.i* n i . 5 110.1 127.2 133.9 110.7 136 .3 106 .2 120.8 105.3 lOb.b 100.2 120.2 lOb.l* 11*5.3 138.3 166.9
1957: Average 115.0 112.8 129.3 103.6 115.7 116 .2 107.7 129.6 137.0 111.2 11*2.2 10l*.2 123.9 10l*.l* lOit.O 97.9 123.9 103.1* ll*l*.6 137.2 167.1*January— 112.1 109.6 126.8 98.2 115.2 112 .9 105.3 128.6 135.1 110.8 11*6.3 10l*.6 122.2 102.5 102.8 95.1 122.9 102.6 11*2.9 135.3 166.9A p ril------ 113.1* 111.1 128.3 101.8 112.2 115.1 1 0 6 .6 129.2 135.7 111.0 11*6.1* 10l*.2 123.2 10U.5 10l*.7 97.8 123.7 103.5 11*3.7 136.1 167.5July-—— 118.2 116.5 131.1 107.2 111* .7 129.9 108.7 129.6 136.7 111.0 11*3.1 103.6 123.6 103.8 103.7 96.9 123.7 103.0 U*l*.6 137.3 167.5O ctober-- 116.6 111*. 7 129.8 10l*«9 120.7 115.3 110.8 129.9 138.7 m . 5 138.6 10U.7 125.7 105.9 iol*.$ 100.1* 123.7 lOlt.l* 11*5.7 138.6 167.5
1958s Average 119.7 117.9 131.9 m . 6 lllwO 126.2 107.1* 132.9 11*2.8 113.5 135.1 102.9 128.6 105.9 10ii.7 100.6 12b.0 102.5 11*9.0 11*2.5 168.1January— 117.1 115.2 131.1 108.9 117.9 118 .li 106.6 132.3 11*0.6 112.2 139.0 103.8 125.5 105.0 lOli* 2 99.0 12U.3 103.5 11*7.0 110.2 167.5A pril------ 120.1* 119.0 131.0 111*. 2 113.9 133.5 107.9 131.9 11*1.5 112.0 132.0 103.0 127.2 105.3 101*.? 99.5 12i*.0 103.5 11*9.5 11*3.2 168.1July------- 121.9 120.3 131.6 118.$ 110.$ 136.0 108.2 132.7 ll*2.i( Ul».7 132.3 102.7 127.6 106.0 10U.6 101.0 12l*.l 102.0 11*9.0 11*2.6 168.1October— 119.9 117.9 132.1* 115.5 115.3 122.1 107.9 133.7 11*1*.1» l l l .U 136.1 103.1 132.1 107.7 105.6 103.7 123.9 102.7 II18.I1 11*1.8 168.1
Chicago, I l l in o is
19l*7: Average 95.5 ___ 95.1* 92.2 97.8 97.1 99.9 93.3 92.1* 100.0 88.6 99.0 95.1* 95.8 96.8 96.7 91.7 97.3 87.9 90.9 83.3January— 89.3 — 88.1 82.8 98.2 90.9 9U.0 (1*) (li) 100.0 82.1* 96.2 93.0 90.9 91.7 92.6 86.3 88.9 81*.5 87.9 79.2February- 88.6 — 88.3 81.8 95.5 92.1 93.1* (1*) (li) 100.0 82.6 96.8 92.3 92.3 92.6 93.0 90.3 90.7 81*. 1* 87.8 79.2March— 92.3 — 89.1 86.7 96.9 96.8 97.9 (U) (U) 100.0 83.0 97.1* 92.2 9l*.5 95.9 9l*.5 92.1 92.8 81*. 6 88.1 79.2A pril------ 91.2 —------ 9U.1* 81*. 2 93.7 9l*.9 99.3 (1*) (1*) 100.0 83.8 98.1 93.8 93.8 96.0 92.5 92.2 9l*.6 86.0 90.5 79.2May--------- 92.2 93.9 86.6 91.1 99.8 95.8 90.7 88.3 100.0 83.8 97.5 93.2 9l*.8 95.6 95.1 92.1* 96.3 87.6 90.2 83.7June-------- 93.8 — 91*.5 93.8 89.7 96.7 9l*.2 (1*) (li) 100.0 81*.2 98.8 93.1 95.8 97.3 96.2 91.3 98.1* 87.7 90.2 83.9July------- 96.0 — — - 9l*.8 95.5 95.0 98.0 97.0 (1*) (U) 100.0 88.1 100.8 92.5 95.3 97.2 95.6 90.5 98.1 87.7 90.2 83.9August— - 98.3 . . . . . . 95.2 99.8 96.8 99.1 97.9 (1*) (li) 100.0 9 2.8 99.1* 96.6 96.5 97.3 98.1* 90.8 99.0 88.2 91.0 83.9September 102.1 96.2 103.5 103.3 101.1 10U.U 97.1* 96.8 100.0 93.2 100.1 96.1* 98.0 99.3 99.8 91.1* 101.0 89.3 92.8 83.9October— 100.2 — 97.9 99.9 101.1* 97.9 106.3 (1*) (li) 100.0 91*. 0 100.3 98.6 98.1 99.0 100.2 91.6 101.6 91.1 93.2 87.8November- 100.5 ——_ 1 06 .0 95.8 1 0 6 .0 97.3 106 .6 (1*) <U) 100.0 97.1* 101.2 100.5 99.0 99.5 100.9 93.2 102.5 91.9 9U.6 87.8December- 101.8 — 105.9 96.1 106 .0 100.1 U 1 .9 99,6 98.1 100.0 98.1* 101.8 102.1 100.2 99.7 101.1* 97.8 103.1* 92.0 9U*7 87.8
191*8 s Average 10l*.l 102.9 106 .2 106 .$ 100.3 101.8 101.8 101.0 100.0 10l*.7 102.2 103.1 103.6 103.1* 103.0 10i*.5 108 .6 101.5 101.7 101.0January— 103.1 . . . . . . 1 06 .8 100.7 107.0 100.8 105.0 (1*) (li) 100.0 99.2 102.0 102.6 100.3 100.7 99.8 99.5 10l*.9 93.8 97.7 87.8February- 99.1 . . . . . . 102.8 92.6 106 .1* ' 102.1 98.3 (1*) <U) 100.0 99.2 101.5 103.6 102.6 102.7 101.2 10l*.l 108.7 93.8 97.7 87.8March------ 98.8 . . . . . . 102.6 9U.8 103.1* 100.3 97.3 100.1* 99.2 100.0 98.8 101.6 103.1 103.3 103.0 102.1 105.1 109.1 93.8 97.7 87.8A pril------ 102.7 . . . . . . 103.8 99.7 105.8 107.0 97.6 (1*) (U) 100.0 102.1 101.1 102.6 103.2 103.1* 101.6 10l*.9 110.3 93.7 97.5 87.8May--------- 105.7 --------- 103.9 106 . 1* 106.7 109.0 98.0 (1*) (10 100.0 102.7 1 00 .5 102.1* 103.2 103.7 1 01 .5 10U.7 110.2 97.2 98.2 95.7June-------- 107.1 . . . ___ 103.8 113.3 107.6 102.5 98.7 101.2 100.1 100,0 103.3 1 0 1 .1 101.9 103.2 103.1* 101.9 10l*.6 109.1* 97.1 98.1 95.7July-------- 108.7 102.1 115.6 110.7 10l*.l 100.2 (1*) (li) 100.0 107.0 102 .0 102.7 102.5 102.6 100.8 10l*.6 108.6 106.6 103.5 111.3August— 1 08 .2 —— - 101.6 116.1 112.6 98.1 102.2 (1*) (li) 100.0 108.1* 101.1* 101* .0 103.9 102.8 lOit.O 105.1 109.3 108.0 105.6 111.7September 107.1 — — 101.6 111*.8 110.5 96.6 103.6 103.3 i d . 8 100.0 108.9 1 03 .1 103.7 105.5 10li.9 105.8 105 . i 1 10 .0 1 08 .1* 1 0 6 .2 111.7October— 105.5 . — ___ 101.6 131.1 106 . 1* 96.3 107.1* (1*) (li) 100.0 108.9 103.7 103.8 105.7 1 05 .0 1 06 .2 105.3 109.7 108.1* 1 06 .2 111.7November- 102.5 ______ 101.3 106 . 1* 101.8 93.2 109.5 (1*) (li) 100.0 108.9 10l*.3 103.7 105.3 lol*. 5 105.7 105.3 108.0 108.1* 1 06 .2 111.7Dee ember- 100.7 102.5 103.6 99.5 9U.3 103.6 105.5 105.3 100.0 108.9 10l*.6 103.5 10l*,9 1 03 .8 105.6 105.1* 10l*.6 108.1* 106 .2 1 U .7
19U9 s Average 100.3 — — 101.7 101.5 95.7 102.6 98.3 105.0 1 06 .6 100.0 106.8 98.7 i d . 5 100.6 99.9 100.3 103.9 91*.1 110.6 107.3 115.6January— 100.3 . . . . . . 103.0 99.8 99.1 100.0 1 01 .5 (1*) (li) 100.0 108.9 103.8 102.9 103.1* 101.8 10l*.3 105.1 100.5 108.5 1 0 6 .3 111.7February- 98.1 102.2 93.5 97.9 105.9 9U.0 (U) (li) 100.0 108.9 102.5 102.0 102.6 101.2 103.0 105.0 98.9 109.2 107.6 111.7March------ 99.6 . . . . . . 102.5 99.1 9U.1* 106.3 93.2 105.3 106 .0 100.0 108.9 102.1* 101.2 102.9 101.0 10li.l 105.0 97.3 109.2 107.5 111.7A pril------ 100.9 . . . . . . 102.3 101.9 93.U 109.2 92.7 (U) (li) 100.0 105.8 99.9 301.3 101.9 100,0 102.8 lol*.5 97.0 109.1* 107.9 111.7May--------- 100.1 —. . . . 102.1* 101.5 91.2 107.9 93.5 (1*) (li) 100.0 10l*.9 99.0 100.6 101.5 100.0 101.9 10U.6 9l*.6 109.3 107.8 111.7June— 102.1* 102.1 106.7 92.9 107.5 9l*.5 I0l*.l* 1 06 .3 100.0 1 05 .0 97.8 100.1* i c a . i 99.8 101.1* 10U.5 93.2 109.2 107.6 111.7July-------- 100.3 — 101.0 10U.0 92.8 102.6 96.0 (U) (li) 100.0 lOit.O 96.8 100.3 99.9 99.2 99.3 lol* .3 91.7 109.2 107.6 111.7August-— 101.2 — 100.8 105.8 96.1* 99.2 9 8 .6 00 (li) 100.0 10U.0 96.2 99.7 99.8 99.2 99.U 103.1 92 .U 109.2 107.5 111.7September 102.6 . . . . . . 101.3 108.3 96.5 99.2 102.1* 10l*.7 106.8 100.0 1QU.2 97.1 101.9 99.1 99.1 97.9 102.9 90.7 109.1 107.3 111.7October— 99.9 101.1 101.9 98.0 96.3 102.3 1 05 .0 107.5 100.0 10l*.3 96.1* 101.8 98.5 98.9 97.1 102.5 90.7 H 5 .2 107.3 127.UNovember- 100.8 ______ 101.2 100.0 99.1 100.2 106.5 105 .9 1 08 .0 100.0 110.1 96.3 101.6 98.1* 99.0 96.6 1 0 2 .5 90.6 U 5 .2 107.2 127.1*Dee ember- 97.8 — 101.0 95.9 97.1 96.5 103.9 106.1* 108.1 100.0 111.5 96.0 10l*.3 98.2 99.2 96.0 102.5 91.2 11U.8 106 . 1* 127.6
1950: Average 101.3 102.3 10U.9 96.5 97.9 105.1 107.8 109.2 100.0 1 13 .9 98.1* I0l*.7 99.7 101.8 96.li 1 03 .9 9U.0 U 3 .8 105.0 127.6January— 96.7 — — 100.7 9U.1 96.9 97.6 98.5 106.5 108 .1* 1 06 .0 112.5 95.2 103.6 98.1* 99.6 95.9 102.1* 92.8 lll* .7 106.3 127.6February- 96.1 100.6 93.8 9 6 .6 96.8 97.0 1 06 .8 108.8 100.0 1 13 .8 95.1* 103.5 98.1 99.7 95.2 102.1* 92.8 111*.3 105.8 127.6March— 97.3 . . . . . . 100.6 97.2 9 6 .6 95.3 99.8 1 0 6 .8 108.9 100.0 111*. 3 95.1 103.2 98.0 98.9 95.7 102.0 91.3 113.8 1 05 .0 127.6A pril— 97.3 . . . . . . 100.9 98.0 96.1* 9U.8 99.0 107.0 109.0 100.0 ll lt .7 95.9 103.1 97.7 98.6 95.5 102.0 89.9 112.6 1 03 .3 127.6May--------- 99.7 — — 100.9 10U.5 93.0 99.0 98.2 106.8 108.9 100.0 112.0 95.9 103.2 98.1 99.9 95.5 101.7 90.2 112.6 103.3 127.6June— — 100.8 . . . . . . 100.1* 307.7 93.0 99.5 98.5 1 06 .6 109.0 100.0 112.0 95.2 103.0 98.3 100.2 95.7 101.7 89.6 112.8 103.6 127.6July-------- 103.9 . . . . . . 100.7 U l .lt 95.U 103.9 100.9 107.1 109.U 100.0 112.0 95.9 103.3 98.5 100.7 95.7 101.9 90.1 U 3 .1 lo lt.o 127.6August-— 105.0 . . . . . . id*.!* 112.1 97.0 100.2 108.3 107.7 109.6 100.0 113.7 97.3 ioU.1* 99.1* 102.1 96.1 102.0 95.0 ni*.u 105.8 127.6September 103.9 . . . . . . lOlt.l* 111.5 97.2 9U.7 110.9 109.0 109.9 100.0 113.7 101.9 106 .2 101.2 10l*.2 97.1* 101*.$ 97.2 113.9 105.1 127.6October— lOit.O — — i0U.lt 109.1 97.6 95.6 115.1* (U) (li) 100.0 1 1 6 .0 103.9 107.2 102.3 105.1* 97.9 106.7 99.0 113.8 105.0 127.6November- 103.9 10U.U 107.5 98.2 97.6 111*. 3 <U) (U) 100.0 1 16 .0 10U.0 107.3 103.1 1 06 .1 98.1* 108.6 99.3 111*. 2 105.5 127.6Dee ember- 107.2 — 10l*.6 111.5 100.0 100.3 121.2 110.1* 110.1* 100.0 116.1* 105.3 1 0 8 .2 103.1 106 . 1* 97.5 110.5 100.9 115.0 106.7 127.6
1951: Average 112.9 111.7 117.5 1 0 8 .0 108.3 118.2 113.3 113.3 100.0 118.8 110.9 110.6 107.3 111.3 100,1* 1 16 .2 105.1 120.3 112.1 132.2January— 108,9 no.3 111*.!* 10l*.0 101.7 111*.!* 0 0 (U) 100.0 118.3 109.1 109.1* 10U.8 108.5 97.9 l l i t . l 105.6 115.1 1 0 6 .8 127.6February- 112.7 — 111.6 117.2 1 0 6 .1 131.9 113.7 (1*) (U) 100.0 119.5 310.0 109.6 1 06 .0 109.1* 99.6 111*. 8 106.1 115.5 107.1* 127.6March— 112.0 131.1 117.8 107.7 106.1 316.0 112.7 111.7 100.0 119.8 110.9 109.6 106.3 109.3 100.0 115.6 107.3 117.5 110.1 127.6A pril------ 111.8 . . . . . . 110.9 118.0 107.6 105.0 1 1 6 .1 (U) (U) 100.0 119.8 111.7 109.6 106.7 110.1* 99.8 115.7 109.1 117.5 110.1 127.6May--------- 112.7 111.3 117.0 107.6 109.8 116.3 (U) (li) 100.0 118.3 131.7 110.1 1 06 .6 110.8 99.2 115.9 109.5 117.5 110.1 127.8June— — 112.9 111.5 117.5 107.8 109.6 116.5 113 .li 112.9 100.0 118.3 111.7 109.8 106.5 110.9 99.2 115.9 1 06 .0 117.5 110.1 127.6
Ses footnotes at end of table.100
Digitized for FRASER http://fraser.stlouisfed.org/ Federal Reserve Bank of St. Louis

Table C-3. Consumer Price Index—20 large c i t ie s : Indexes o f food , housing, apparel, transportation, and their subgroups,by year and month, 19it7-$8—Continued
(19U7-U9-100)
Yearand
month
Food Housing Apparel Transportation_____ Food at ome
Tot
al
2/
Rent
i ------
------
------
-----
Qas
and
elec
tric
ity
Solid
fue
ls
and
fuel
oil
Hou
se-
furn
ishi
ngs
Hou
seho
ldop
erat
ion
Tota
l1 M
en's
and
boys
'
Wom
en's
and
girl
s'---
------
------
------
---1
Foot
wsa
r
Oth
erap
pare
l 3/
Tot
al
1
Tota
l 1/
Tota
l
Cer
eals
and
ba
kery
pr
oduc
ts
Mba
ts,
poul
try,
an
d fi
sh
Dai
rypr
oduc
ts
Frui
ts a
nd
vege
tabl
es
Oth
er f
oods
at
hom
e
Priv
ate
Pub
lic
Chicago, I l l in o is —Continued
1951— Con.July-------- 113.3 ------- - 111.8 117.5 107.2 113.5 H 6 .6 (U) (it) 100.0 H 8 .3 H I . 2 109.6 106.3 110.7 98.it H 6 .6 107.5 H 9 .8 113.3 127.6August— 112.9 112.1 118.1 108.6 106 .3 H 9 .1 (U) (U) 100.0 H 8 .3 HO.O 109.5 106.3 H 1 .3 97.9 H 6 .9 106 .!; 123.7 H it.2 138.6September H 2.lt 112.0 118.2 108.5 102.9 121.3 H 3 .7 H it.2 100.0 118.3 H 0 .8 108.7 110.3 H 3 .2 105.3 H 7 .9 102.7 12it.8 H 5 .7 138.6October— HU. 3 ---- —- 112.7 119.1 109.2 106.5 125.1 (It) (It) 100.0 H 8 .9 H I .3 H 3 .1 109.lt 113.6 103.2 H 7 .7 102.1 125.3 116.1; 138.6November- 115.0 — —— 112.8 117.6 108.9 112.3 12ii.3 (it) (It) 100.0 H 9 .0 H I . 2 H 2 .9 109.1 H 3 .6 102.9 116.8 99.7 126.3 H 7 .8 138.6December- 115.2 — 112.8 116.7 112.6 li lt . 5 1 19 .0 115 .6 H 5 .9 100.0 119.0 H l . l lllt .7 108.5 H 3.lt 101.9 H 6 .6 99.2 122.9 113.1 138.6
1952: Average ll lt .7 .. .____ 111;. U llit .7 ll lt .l ; 115.7 H it. 2 116.3 H 7 .9 100.0 H 9 .9 109.U r .7 105.9 111.8 99.1 H 2 .9 9U.6 130.9 119.7 1U9.3January— 11U.9 — - 112.5 116.9 113.1 116.1 H 3 .2 Ot) Ot) lo o .o 119.0 110.5 H it.6 106.2 H 2 .6 98.6 l l l t . l 96.3 126.6 H 8 .2 138.6February- 111.9 ------- - 113.2 115.1 115.0 105.9 H O .8 (It) (It)’ 100.0 119.0 H O .7 lllt .7 105.5 H I . 8 98.1 H 3 .6 95.1 127.U H 9 .3 138.6March------ 112.9 ______ llit.O llit .8 H5.U 110.3 109.7 H 5 .7 116.3 100.0 119.0 H O .7 H it.6 106.0 1 H .7 99.1 113.7 9it.9 127.lt H 9 .3 138.6April------ 113 .6 113.3 n it.6 113.0 115.2 110.0 (It) (It) 100.0 119.0 H 0 .2 l i l t . 5 105.3 111.2 98.2 H 3.lt 9U.5 127.lt H 9 .3 138.6May--------- 115.8 115.6 1 15 .9 111.7 123.0 109.1 (It) (It) 100.0 119.0 H O ,2 115.7 105.5 H I . 2 9 8.6 H 3 .3 9lt.5 127.5 H 9 .5 138.6June------- 115.7 —------ 111;.8 117.3 109.8 122.3 HO.O 116.2 H 7 .2 100.0 H 9 .2 109.U 115.9 105.lt 111.2 98.5 113.0 9it.l 133.2 119.7 157.0July-------- 116.1 ______ 111;. 9 Uit.lt llit .2 121.3 l i l t .9 (It) (It) 100.0 120.0 109.1 H 5 .S 105.2 111.1 98.3 H 2 .7 93.0 133.lt 120.0 157.0August— 1 17 .0 lilt.It 118 .1 115.1 H 8.it H 7 .2 (It) (It) 100.0 120.0 109.1 H 5 .9 105 . It 111.1 98.9 112.1 9it.5 133.6 120.2 157.0September n 5 .lt ______ Hlt.lt 116.2 116.5 113.2 H 7 .8 H 6.lt H 7 .8 100.0 120.0 108.7 H 5 .8 1 06 .3 1 H .8 100.5 111.8 93.7 133.6 120.2 157.0October— 115.1; ______ 111;. 9 H it .2 118.1 112.1 121.5 (It) (It) 100.0 121.2 107.8 H 5 .8 1 06 .2 111.9 100.2 1 H .9 9it.l 133.6 120.2 157.0November- 115.2 ______ 115.1 110.7 116.9 116.8 121.0 (It) (It) 100.0 121.2 108.3 H 7 .3 106 .7 H 3 .0 100.2 H 2 .3 95.3 133.6 120.2 157.0December- 112.3 — 115.6 108.3 llit.O 113.7 H 5 .1 H 9 .2 122.7 100.0 122.0 108.3 H 7.lt 106 .7 113.0 100.2 H 2.lt 95.3 133.6 120.2 157.0
1953: Average 111.3 110.8 115.3 105.0 109.6 111.9 H 8 .3 121.5 130.2 100.0 122.3 109.0 H 9 .2 1 07 .1 113.0 100.1; l i lt . 6 9U.3 133.8 120.lt 157.0January— 111.2 111.0 115.7 105.6 111.6 113.3 115.5 H 9 .1 (It) 100.0 122.0 107.0 117.5 1 06 .0 112.9 98.9 112.lt 9lt.l 13U.5 121.2 157.0February- 109.6 109.3 115.1; 102.7 109.2 llit.O H 3 .2 H 9 .6 (It) 100.0 122.0 108.2 117.5 1 06 .1 H 2 .7 99.2 112.5 9U.9 13lt.lt 121.1 157.0March— - 109.7 109.3 113.0 101.9 109.1 lllt .l ; H 5 .5 119.3 123.5 100.0 122.0 108.0 117.6 1 0 6 .3 112.6 99.6 H 2 .5 9U.9 13lt.O 120.7 157.0A pril------ 110.2 109.7 ll lt .l ; 102.2 108.7 113.7 H 7 .2 H 9.lt (U) 100.0 122.0 107.7 H 7 .6 1 0 6 .5 H 2 .7 99.9 112.5 95.0 133.8 120.lt 157.0May------— 110.8 110.5 115.2 lOit.7 108.6 113.5 H 6 .8 120.0 (it) 100.0 119.8 108.7 H 8 .6 106 .lt H 2 .5 99.9 H2.lt 9lt.9 133.5 120.1 157.0June------- 112.U 112.3 lllt .l ; 106.9 108.3 120.0 H 7 .2 120.3 (It) 100.0 H 9 .8 109.7 H 8 .6 106 .8 H 2 .5 100.2 113.8 95.1 133.8 120.lt 157.0July-------- 112.7 1 12 .5 113.9 108 .1; 109.7 116.7 H 7 .5 121.0 (It) 100.0 122.0 H 0 .3 120.3 106.7 112.8 99.9 H lt.5 9it .9 13lt.3 120.9 157.0August—- 112.3 111.6 l l l t . l 107.7 109.8 111.0 H 9 .7 123.1 (It) 99.9 122.6 109.it 120.2 107.2 112.6 100.lt H 5 .7 95.1 13lt.3 120.9 157.0September 112.5 112.0 116.3 108.5 110.2 105.5 122.5 123.6 135.5 99.9 122.9 109.8 120.2 108.1; H 3 .8 102.1 H 6 .0 95.7 133.8 120.lt 157.0October— 112.8 112.3 116.7 106.3 n o .5 107 .8 125.1 123.9 Ot) 99.9 123.9 109.9 120.7 I 0 8 .lt 113.8 101.7 117.5 95.7 133.lt 120.0 157.0November- 110.1; 109.6 117.2 KXI.li 110.3 106 .lt 120.9 12U.2 (It) 99.9 123.9 H O .2 120.7 108.1; H 3 .9 101.9 H 7 .5 9lt.l 132.8 H 9 .3 157.0December- n o .5 109.6 117.2 103.1; 1 08 .8 1 07 .0 H 8 .7 12it.2 Ot) 99.9 12it.5 109.5 120.8 108.1 113.8 101.3 H 7 .5 93.6 132.8 H 9 .3 157.0
195U: Average 110.8 109.8 116.9 103.1 10U.9 110.3 120.7 126.5 llt2.7 105.7 123.6 108.1 120.9 107.5 112.8 100.3 118.5 93.9 132.9 H 8 .5 I 62 .ltJanuary— 111.1; H 0.li 117.2 105.5 108.9 107.9 H8.lt 12it.3 (it) 99.9 I2it.5 108.9 121.0 107.8 H 3 .5 101.0 117.5 93.5 133.7 120.3 157.0February- 111.2 110.0 117.3 10i;.9 1 08 .1 105.9 H 9 .3 12U.9 (It) 1 06 .0 I2lt.5 109.3 121.0 108.1 H 3 .5 1 01 .5 H 7 .5 93.6 132.8 H 9 .3 157.0March------ 110.7 109.7 117.0 105.1 107.1 105.8 119.0 125.1 138.9 106 .2 I2it.5 108.9 121.5 108.2 H 3 .8 101.7 H 7 .5 93.6 132.7 H 9 .2 157.0April------ 110.1; 109.8 117.2 105.8 10it.lt 105.6 120.1 12lt.9 (It) 106.2 12lt.O 107.5 120.5 108 .1 Hit.O 101.2 H 7 .5 93.6 132.lt H 9 .0 155.9May--------- 111.7 111.0 116.8 106 .U 102.1 112.7 121.1; 126.1 Ot) 106.3 122.9 107.3 120.6 108.1 H lt .l 101.1 117.5 9U.1 133.7 H 8 .9 165.3June-------- 111.6 110.9 117.0 106 .2 100.6 113.7 121.3 126.2 (it) 106.3 122.9 107.3 120.6 108.1 H 3 .8 101.1 117.5 9lt.8 13li.2 H 9.lt 165.3July------- 112.6 112.0 116.9 iolt.5 103.2 118 .e 122.9 126.9 (it) 106.3 122.9 107.lt 120.8 107.9 H 3 .0 101.2 H 8 .0 9it.7 133.7 H 8 .9 165.3August— 111.9 111.2 116.9 102.0 lfllt.O Hit.lt 126.1 127.1 (it) 106.3 122.9 106.7 .120.9 106.9 H 2 .8 98.7 H 9 .3 9lt.0 133.lt H 8 .6 165.3September 110.2 109.2 116.6 101.7 103.6 109.6 121.5 127.9 lit5.5 106.3 123.0 108.5 121.1 106.9 H l .lt 99.7 H 9 .8 9U.1 133,1 H 8 .2 165.3October— 110.0 108.8 H 6 .5 98.3 105.5 H l . l 122.lt 128.2 (it) 106.3 123.0 108 .it 121.1 106 .6 1 H .3 99.1 H 9 .8 93.6 127.8 H 2.lt 165.3November- 109.6 108.5 116.5 99.1; 1 0 5 .6 H 0 .9 H 9 .2 128.3 (it) 106.2 123.it 108 .lt 121.1 106 .6 111.3 98.8 120.1 93.9 13U.1 H 9 .3 165.3Dee ember- 108.2 106.7 116.7 97.5 105.5 107.2 H 6 .6 128.5 (it) 1 06 .2 12U.6 108.1; 121.1 106 .2 111.3 98.0 120.1 93.6 133.1 118.2 165.3
1955: Average 109.1 107.5 119.1 96.1 io5 .9 112.1; H 6 .9 129.9 150.7 109.8 128.1 106.3 122.7 105.8 H O .8 97.0 122.0 93.5 131.5 H 6.lt 165.3January— 108.7 107.1 116.9 97.8 105.3 109.3 H 6 .7 128.1 (it) .106.2 126.2 1 06 .1 121.1 lO it.l H O .3 9it.5 120.1 92.6 133.8 H 8 .9 165.3Februazy- 108.7 107.3 120.7 96.9 105.3 108.1; H 7 .6 128.3 (it) 106.2 12$.2 106 .6 121.0 I0lt.7 H O .3 95.6 120.lt 92.9 132.8 H 7 .9 165.3March— - 108.3 106.6 119.2 95.lt 105.5 108.5 H 7 .3 128.3 lit9.it H 0 .5 126.2 106.7 121.1 lOit.8 HO.O 96.0 120.5 92.9 133.0 H 8 .1 165.3April------ 109.0 107.6 118.9 97.2 105.5 l l l t . l ll lt .7 128.2. Ot) H 0 .5 126.2 1 06 .1 121.1 lOit.O 109.6 9U.6 120.8 92.5 129.6 H lt.3 165.3May------— 109.2 107.7 118.8 96.9 103.1; H 8 .6 H 3 .9 129.0 (it) H 0 .5 1 26 .2 105.5 121.1 10it.2 109.6 9it.8 121.2 92.6 130.2 H 5 .0 165.3June————— 109.2 107.6 118.7 98.2 ioit.6 H 6 .0 112.8 129.5 (it) H 0 .5 126.6 1 05 .7 122.3 10U.0 109.5 9lt.5 121.2 92.5 130.lt H 5 .2 165.3July------- 110.5 109.0 119.3 98.li 106 .U 120.0 113.9 130.2 (it) H O .5 127.lt 106.2 12it.O 105.0 UO.ii 95.7 121.7 93.2 130.0 Hi*. 8 165.3August---- 110.5 109.0 119.6 97.0 1 09 .5 H it.2 117.9 130.9 (it) H 0 .5 129.0 105 .8 12li.l 105.6 H O .6 96.7 121.8 93.6 130.5 H 5.lt 165.3September 110.5 108.9 119.3 98.9 1 06 .0 lH .7 H 9 .8 131.0 151.8 H 0 .5 128.8 106 .lt 121; .1 107.9 1 H .9 100.1 123.3 9it.8 130.7 H 5 .6 165.3October— 109.1 107.2 118.8 95.3 106 .2 108.6 H 9 .7 132.1 (U) H O .3 131.6 107 .6 12lt.O 108.0 H 2 .2 100.2 123.3 9lt.8 132.lt H 7.lt 165.3November- 107.8 105.9 119.0 91.8 105.5 109.0 H 9 .3 132.3 (it) H O .3 131.3 107 .9 12lt.l 108.8 H 2.lt 101.2 12Jt.6 95.2 133.3 H 8 .5 165.3Dee ember- 107.6 105.6 119.5 88.8 1 07 .1 H 0 .9 H 9 .7 131.2 (it) H O .5 131.8 105 .2 12it.5 108.0 H 2.lt 99.5 125.1 9U.8 131.3 H 6 .3 165.3
1956: Average 109.3 107.lt 120.1 90.5 1 09 .8 H 5 .8 H 9 .1 131.2 156.0 H 3 .8 13U.7 1 01 .6 128.0 108.9 H 3 .7 99.5 127.8 95.U 13U.0 H 9 .0 166.1January— 106.5 10k.h 118.9 87.0 107 .6 1 0 8 .6 H 8.lt 131.0 (it) 113.6 13lt.8 1 02 .0 125.1 108 .0 H 2.lt 99.3 125.6 9U.8 130.8 H 5 .6 165.3February- 106 .8 101;.7 118.9 87.6 1 07 .6 H 2 .6 H 6 .0 131.2 (U) H 3 .8 13U.8 101.lt 126.7 107.9 H 2 .8 99.2 12lt.8 9lt.8 131.1 H 6 .0 165.3March------ 106.3 lOlt.l 119.0 86.2 107 .6 H O .3 H 7 .1 129.7 153.9 H 3 .8 13U.9 1 01 .9 126.7 108.5 H 2 .8 100.3 12lt.6 95.1 130.6 H 5 .5 165.3A pril------ 107.1 105.1 119.8 86.1; 1 09 .1 113.9 117.1 129.8 (It) H 3 .8 135.0 101.it 127.0 108.5 H 3 .2 99.5 126.5 95.1 131.1 H 6 .0 165.3May--------- 108.8 107.1 120.0 89.1 1 10 .3 H 7 .8 H 7 .8 129.9 (it) H 3 .8 131.3 101.lt 127.0 108.2 H 3 .6 98.5 126.7 9lt.9 131.6 H6.U 166.5June-------- 110.6 109.1 120.1 91.3 110 .7 12lt.lt H 8 .3 130.9 (it) H 3 .8 132.3 1 01 .3 127.3 1 0 8 .0 H 3 .7 97.9 127.0 9lt.8 131.9 H 6 .7 166.5July—---- 112.8 111.1; 120.3 93.0 1 0 9 .5 133.7 119.6 131.2 (it) 113.8 133.2 101.2 128.1 1 0 8 .5 H 3 .7 98.6 128.3 95.1 133.6 H 8 .6 166.5August---- 110.9 109.1 120.7 93.2 1 10 .2 H 8 .5 120.0 131.2 (it) H 3 .8 13it.2 100.8 128.1 109.2 H lt .l 99.3 129.3 95.6 133.9 H 9 .0 166.5September 110.8 109.0 120.6 95.1; 110 .2 H I . 8 121.lt 131.9 157.7 H 3 .8 135.3 102.3 129.3 109.9 H lt .l 100.8 129.3 96.0 133.8 H 8 .8 166.5October— 110.7 108.8 120.6 9lt.7 U l .lt 109.6 122.6 132.2 (it) H 3 .8 135.9 101.9 129.9 H O .3 ll !t .5 100.9 130.5 96.2 139.9 125.5 166.5N ovember- 110.1; 108.5 120.5 91.8 1 12 .0 l l it .2 121.5 132.2 158.2 H 3 .8 137.5 101.7 129.9 109.9 H it. 6 100.1 130.5 96.0 139.8 125.it 166.5December- 109.8 107.6 121.3 90.8 1 11 .2 H lt .l H 9 .2 132.7 (it) H 3 .8 137.5 101.8 130.8 HO.O H it.8 100.1 130.6 96.0 139.3 12lt.9 166.5
1957* Average 112.9 110.7 123.0 98.3 1 10 .9 H 7 .6 H 8.lt 131; .7 160.3 H it.2 139.5 102.3 131.6 109.9 H6.it 98.6 131.5 95.9 llt2.9 126.lt 180.9January— 109.5 107.5 120.1* 92.2 1 10 .7 H 3 .7 H 7.lt 132.lt 157.9 H 3 .8 llt2.7 102.3 128.9 108.7 H 5 .1 97.lt 130.6 95.lt lU0.7 126.1; 166.5February- 110.9 108.8 122.1 9U.0 1 11 .0 113.2 120.1 132.9 (it) U 3 .8 lit2.9 103.8 128.3 109.ii H 6 .3 97.6 131.5 95.7 139.3 12lt.7 167.7March------ 110.2 107.9 122.3 92.5 109.1; l i l t .3 H 8 .5 133.lt 158.6 Hit.O litl.O 102.9 130.8 109.6 H 6 .5 97.9 131.5 95.8 lilO.O 125.5 167.7A pril------ 111.6 109.1; 122.6 9it.9 110.3 H 9 .3 H 7 .0 133.8 (it) llit.O 138.2 102.it 130.9 109.5 H 7 .0 97.lt 131.5 95.8 139.6 12it.9 167.7May--------- 112.0 109.9 122.9 9 6 .6 110.8 119.2 H 6 .3 13it.l 160.3 Hit.O 136*2 102.0 130.8 109.5 H 6 .8 97.3 131.7 95.7 139.2 12U.5 167.7June-------- 113.6 111.6 123.0 100.6 107.8 125.2 H 5 .6 13lt.8 (it) llit.O 136.8 101.8 132.3 109.3 H 7 .0 97.0 131.3 95.7 139.2 12U.5 167.7July— — 115.6 113.7 123.1 103.6 109.6 128.8 H 6 .1 135.1 160.7 llit.O 138.3 101.3 132.6 109.2 H 6 .8 96.9 13l.lt 95.6 litlt.6 125.9 19U.3
See footnotes at end of table.
101
Digitized for FRASER http://fraser.stlouisfed.org/ Federal Reserve Bank of St. Louis

Table C-3. Consumer price Index—20 large c i t ie s : Indexes o f food, housing, apparel, transportation, and their subgroups,by year and month, 191*7-58—Continued
(191*7-1*9-100)
Tearand
month
____ Food at 1lome
Tota
l
Cer
eals
and
ba
kery
pr
oduc
ts
Nea
ts,
poul
try,
an
d fi
sh
Dai
rypr
oduc
ts
Fru
its
and
vege
tabl
es
as
Housing
IS3 ® & *
€ 23 8.O O
Apparel
. fC 60I I
£
U <0£ 8 :
Transportation
Chicago, I l l in o is — Continued
1957— Con. August----- 115.0 113.0 122.6 1C5.1 111.1 118.5 118.3 135.2 (U) llit.O 138.7 100.7 132.9 109.2 116.6 9 7.0 131.lt 95.6 11*5.3 126.7 19U.3September m . o 111.8 123 .2 102.8 111.7 113.1 119.5 136.1 161.1 llit .6 139.7 102.3 132.9 111.5 116.2 102 .0 131.5 96.9 11*3.7 12it.9 19U.3October— llit.O 111.6 125.1 99.0 112.5 llit .6 121.5 136.1 (it) llit .6 139.7 102.lt 132.9 111.3 116.2 101 .7 131.5 96.8 lit3.lt 12U.6 19lt.3November- lU u l 111.7 12U.5 98.7 U 2 .7 116.1 121.5 136.it 162.0 llit .6 139.9 102.6 133.1 110.9 116.2 100.7 131.7 96.6 11*9.1 130.9 19U.3Dee ember- 113.9 H l.lt 12iu5 99.lt 112.7 115.1 119.5 136.it (it) llit .6 139.9 103.3 133.2 110.6 116.2 100 .1 132.0 95.6 150.7 132.7 19li.3
1958: Average 117.3 115.1 12U.J 107.9 112.1 12lt.l 117.lt 137.7 163.9 121.9 138.7 102.0 135.2 109.8 115.3 98.5 133.lt 96.0 150.5 132.2 195.6January— 115.5 113.3 125.5 102.7 113.0 121.ii 117.6 136.2 162.3 llit .6 139.9 102.6 133. it 109.5 115.9 98.3 131.0 95.9 151.1 133.1 19lt.3February- 116.2 113.9 12lt.9 105.0 112.5 123.2 116.3 136.9 (It) H it.7 139.9 103.8 133.lt 109.3 115.9 97.7 131.5 95.8 lli9.lt 131.0 195.6March----- 117.9 115.9 12lt.lt 107.7 111.It 127.0 119.8 137.0 162.5 l i l t .7 139.9 102.8 135.0 109.3 116.0 97.5 132.0 95.8 lltB.li 129.9 195.6A pril------ 118. 1* 116.5 12lt.lt 108.3 111.1 132.0 117.6 137.1 (»■> l i l t .7 136.0 102.it 135.3 108.9 116.3 96.0 133.7 95.lt llt8.2 129.7 195.6May--------- 118.5 116.5 121.5 109.5 111.1 131.0 116.3 137.2 I6it.l l l i j . 7 133.7 102.it 135.1 109.0 116.0 96.i< 133 .it 95.7 1U3.5 130.0 195.6June----- - 118.8 116.7 12li.l 111.6 111.1 129.7 115.3 137.9 (It) 123.0 13lt.l 102.5 135.1 109.6 116.0 97.lt 13U.1 96.0 11*9.3 130.9 195.6July-— — 119.5 117.6 123.9 112. )i 111.8 131.9 116.0 137.7 I6it.2 123.3 135.1 102.1 135.0 110.2 115.3 99.0 13 it. 3 96.3 H18.8 130.3 195.6August---- 117.0 1U .7 123.5 110.8 112.2 117.6 116.5 133.1 (It) 128.3 139.7 100.9 136.1 109.ii 115.1 97.6 13lt.l 95.9 150.0 131.7 195.6September 117.7 115.6 123.7 109.0 112.6 119.5 121.3 138.ii I6ii.li 123.3 110.8 100.7 136.1 110.8 i n . 5 101.0 13ii.l 96.6 150.3 131.7 195.6October— 316.7 11U.3 123.6 106.9 112.7 119.9 113.5 138.5 (It) 128.7 llt l.6 101.2 136.2 110.5 nit.it 100.2 13lt.lt 96.it 152.8 13lt.7 195.6November- 116.3 113.9 123.lt 105.9 112.7 119.1 118.5 138.8 165.1 128.7 lit l.6 101.5 136.2 110.9 llit.O 101.it 13 it.1 96.it 153.8 135.8 195.6Dee ember- 115.1 112.lt 123.2 105 .0 112.8 1 1 6 . 1i 115.5 138.7 (It) 128.7 lltl.7 101.2 136.3 109.9 113.7 99.6 13lt.l 95.9 155.2 137.1 196.9
Cincinnati, Ohio
19lt7: Average 96.2 95.1 9U.1 97.7 96.6 100.3 91*. 8 95.1 91* .5 86.8 97.6 96.3 97.5 97.2 99.5 93.7 9it.8 8 9.6 9 0 .6 87.ltJanuary— 89.7 — 86.8 81t.9 100 .lt 88.0 96.0 (it) (it) 93.5 80.3 92.8 95.0 90.9 92.it 93.6 85.6 69.5 85.9 86.3 85.1February- 89.9 87.6 85.lt 96.8 90.3 95.3 (U) (it) 93.5 80.3 95.1 9U.5 92.5 9U.1 95.3 86.lt 69.5 85.9 86.3 85.1March------ 9 li.l _____ _ 90.6 89.0 100.3 96.5 100.0 (it) (it) 93.5 80.3 95.2 9 li.l 93.5 9lt.O 96.3 86.2 88.0 87.8 89.0 85.1A pril------ 92.9 ______ 93.2 87.lt 9li.9 9li.O 100.8 (it) (it) 93.5 80.8 96.9 97.2 96.2 9U.5 100.0 92.2 88.5 87.8 89.0 85.1May--------- 92.it ------- - 93.9 88. 1* 88.9 97.5 96.7 (it) (it) 93.5 80.8 96.5 95.6 96.3 95.U 99.8 90.9 88.9 87.8 89.0 85.1June-—— 9it.O _____ - 9U.2 9lt.3 87.0 98.0 9U.2 93.6 93.8 93.5 80.3 97.1 95.7 98.2 97.6 100.9 92.3 101.3 87.8 89.0 85.3July-------- 95.6 __— - 9lt.6 96.3 89.3 98.9 96.2 (it) (it) 93.5 80.6 99.5 91.9 100.6 98.3 102.6 100.0 10l*.3 89.0 90.7 85.3August— 97.5 __— . 95.3 99.6 96.9 96.2 97.3 (it) (it) 93.5 93.it 98.2 9l*.l 99.1 98.1* 100.8 95.7 103.6 89.1* 91.1* 85.3September 101.7 96.6 10U.6 103.9 98.9 102.0 96.lt 96.6 93.5 93.lt 98.lt 9li.5 100.6 99.1 103.lt 96.2 103.9 91.3 93.1 87.5October— 101.3 100.3 103.5 99.1 99.0 105.5 (It) (it) 93.5 96.5 99.5 98.2 101.0 100.8 102.0 98.1 106.0 91.lt 93.2 87.5November- 100 . 1* 102.7 96.8 102.6 99.2 106.3 (It) (it) 100.0 96.7 99.8 101.9 101.2 101.1 101.5 100.0 106.3 95.1 9lt.7 96.1Dee ember- lO lt.l — 10lt.3 98.2 i n .5 102.1 1 13 .0 100.1 98.lt 100.0 97.7 101.7 103.lt 100.1 101.3 98.1 100.8 108.3 96.1 96.1 96.1-
19118: Average 10ii.7 __ _ 103.lt 106.7 107.1 102.)* 102.3 102.2 100.7 100.1* 10lt.3 103.5 103.8 102.8 103.1* 101.lt 103.6 109.7 101.2 101.6 100.5January— 10lt. 8 —------ 105.1 102.9 110.7 102 .5 106 . 1* (It) (It) 100.0 98.8 102.1 105.6 100.0 102.9 95.7 102.9 111.3 96.7 97.0 96.1February- 102.8 — — 10l*.l 97.6 109.9 107.2 100.)* (It) (It) 100.0 98.8 103.5 lGlt.6 101.2 102.9 97.7 103.3 112.9 96.7 97.1 96.1March------ 101.it 103.9 96.7 108.lt 10ii.2 98.9 101.3 99.2 100.0 98.8 103.8 10i*.8 KJl.it 102.7 98.5 103.3 113.1 96.7 97.1 96.1A pril------ 103.3 ______ 103.8 99.9 107.7 109.7 97.9 (It) (it) 100.0 99.1 102.7 105.0 101.7 103.0 99.3 103.3 110.5 96.7 97.1 96.1May--------- 105.0 — — 102.6 lOit.3 107.9 110.0 98.3 (It) (it) 97.9 103.6 102.8 103.9 102.2 103.7 99.6 lOlt.O 109.8 96.8 97.2 96.1June-------- 106 .U ______ 102.3 110.lt 108.lt 106.5 99.lt 101.7 100.1 97.9 103.6 103.3 103.0 102.0 103.6 99.2 10i*.0 109.7 98.7 99.9 96.1July-------- 108.lt ______ 102.3 ll it . 7 109.3 107.0 101 . 1* (U) (it) 97.9 108.6 103.7 103.2 102.3 103.6 99.7 lOlt.O 109.8 103.5 102.9 10lt.6August— - 107.3 ______ 102.0 116.7 107.7 98.1 103.7 (it) (it) 97.9 108.6 102.7 101.6 10i*.6 103.1* 105.lt lOlt.O 109.8 105.3 105.5 105.0September 107.2 103.3 115.5 107.7 98.3 10i*.6 103.0 102.0 97.9 109.6 103.1 101.7 10i*.9 lOlt.l 105.3 103.lt 109.2 105.8 106.3 105 .0October— 105.5 103.1 112.1 103.8 97.1 106 .1 (It) (It) 10l*.9 109.6 10l*.l 103.3 105.0 iolt.5 105.9 103.U 108.6 105.8 106.3 1 05 .0November- 103.0 ______ 10lt.0 1 06 .2 102.1 91*. 2 108.2 (It) Ot) 10l*.9 109.6 lOit.7 103.9 10i*.5 lOlt.O 105.3 103.6 106.2 105.9 106.3 105 .0Dee ember- 100.9 — 103.9 102.8 101.5 9it.lt 102.3 10lt.7 103.1 10ii.9 109.6 lOit.8 10it.it 103.8 103.lt 10lt. 2 103.6 105.7 105.9 106 .3 1 05 .0
19119: Average 99.1 ___ 101.5 99.3 95.3 101.0 97.5 102.9 lOlt.l 10i*.9 108.3 • 98.9 99.9 99.6 99.2 99.1 102.7 95.1* 109.2 107.8 U 2 .1January— 101.1 ______ 10li.2 100.it 101.it 100.1 100.7 (It) (It) ioi*.9 110.6 10lt.9 102.9 102.1* 102.0 102.0 103.9 103.5 105.9 106.3 1 05 .0February- 98.2 _—- — 103.5 9U.9 97.7 103.1* 93.8 (It) (it) 10lt.9 110.6 103.6 101.1* 101.7 101.7 101.2 103.0 102.3 106.3 107.8 105 .0March------ 99.3 103.2 97.8 96.6 105.5 92.9 ioit .0 103.8 10l*.9 110.6 102.2 100.6 101.3 101.0 100.9 103.0 100.9 109.6 107.8 H 3 .5A pril—— 100.0 — — 101.9 99.8 93.U 108.8 92.5 (It) (It) I0lt.9 107.2 101.1* 100.2 99.8 99.9 98.6 103.0 98.7 110.0 108.3 H 3 .5May--------- 98.5 ______ 101.8 98.1 90.0 106.2 93.8 (It) (It) 10it.9 105.2 99.U 99.2 99.2 99.6 98.it 101.1 95.2 109.9 108 .2 H 3 .5June-------- 100 .It ______ 100.lt 102.2 89.lt 109.3 9l*.3 102.6 lOlt.l* 10U.9 105.2 98.6 99.3 99.1* 99.0 98.6 103.U 9lt.2 109.8 108.0 113.5July-------- 98.6 ______ 100.5 100.lt 90 J* 102.it 95.U (It) (it) iolt.9 105.2 96.7 98.7 98.3 97.6 97.lt 103.2 92.1 109.6 107.8 113.5August----- 99.2 100.8 102.lt 9U.3 95.8 99.8 (U) (it) 10U.9 105.2 95.2 97.9 97.9 97.lt 97.0 102.9 91.U 109.7 107.9 H 3 .5September 101.0 100 .5 10U.2 97.3 97.7 102.7 102.1* lOlt.7 10U.9 108.6 95.7 99.9 98.3 97.8 98.9 102.3 91.6 109.8 107.9 113.5October— 98.2 __- ___ 100.1 100.0 97.1 92.2 101.7 102 .5 ioit.5 loi*.9 109.0 96.0 99.9 99.2 98.5 99.2 102.3 91.7 109.8 107.9 H 3 .5November- 97.7 100 .5 96.9 97 6 95.3 100.8 1 02 .5 lOlt.1 10lt.9 109.2 96.7 99.5 99.0 98.7 98.6 102.3 91.7 109.8 108.0 H 3 .5Dee ember- 97.0 — 100.3 9U.6 97.9 9l*.6 101.6 102.8 10lt.3 10l*.9 113.3 96.2 99.U 98.6 98.5 97.9 102.3 91.6 109. U 107.U H 3 .8
1950: Average 101.lt ______. 10l*.0 103.7 97.1 96.3 103.9 103.9 10li. 8 10l*.7 lli* .9 97.6 99.9 98.6 99.U 96.3 105.6 92.0 n i . i t 107.9 H 9 .2January— 97.1 101.0 9U.0 98.3 98.7 96.9 102.9 lQlt.5 10it.9 l i l t .9 95.9 98.1* 98.0 97.8 97.0 102 .3 91.3 109.1 106 .8 H 3 .8February- 96.9 ______ 102.2 95.1 98.3 96.6 95.1 102.8 10li. 6 i d * .9 116.2 95.2 98.1* 97.0 97.5 95.2 102.5 91.3 109.0 1 06 .8 113.0March------ 97.5 102.U 96.3 97.9 95.2 98.3 103.2 lOli. 7 lOi*.9 118.6 96.0 98.2 97.2 97.7 95.lt 102 .5 90.7 109.0 106.7 113.8A pril------ 97.2 ______ 102.lt 97.0 9U.8 95.0 98.5 3.02.7 10lt.5 I0l*.9 117.0 95.1 98.1* 96.8 97.8 9lt.lt 102.8 90.8 108.5 106 .0 113.8May----- — 99.U ______ 102.6 102.U 9U.7 97.6 96.9 1 02 .5 10U.6 10U.9 110.2 95.lt 98.2 96.5 97.8 93.9 103.0 88.9 111.3 106.7 121.9June-------- 100.9 ______ 102.5 106 .2 9lt.5 99.6 96.1 1 02 .5 10lt.9 10U.9 110.1 95.1 98.2 96.1* 97.9 93.6 103.0 88.9 111.5 107.0 121.9July-------- 103.U ______ 102.7 110.5 9lt.6 101.9 99.3 102.6 10li.9 10U.9 110.1 95.lt 98.1 96.3 98.1 93.lt 103.8 86.7 111.9 107.5 121.9August----- 10U.9 ______ 1 06 .1 111.6 98.»* 9U.5 108.6 103.8 105.2 10U.9 H it. 2 97.3 99.3 96.9 98.7 93.7 lOli.!* 91.0 113.1 109.2 121.9September 105.U ______ 1 06 .0 112.1 98.3 9l*.3 110.7 10it.6 105.lt 10U.9 ll ii .2 99.2 100.6 100.9 100.9 99.3 107.2 9l*.2 113 .1 109.2 121.9October— 10lt.6 ______ 106.9 107.5 98.5 95.3 113.U (It) (It) lO lt.l 117.8 101.1 103.2 101.9 101.9 99.9 109.2 95.7 113 .1 109.2 121.9November- 103.6 ______ 106.3 105.6 98.5 95.1 112.1 (It) Ot) lo i t . l 117.8 102.8 103.U 102.3 102.5 99.3 112.8 96.6 113 .it 109.7 121.9Dee ember- 1 06 .2 106.7 106.5 99.0 97.5 121.5 106.9 106.2 10lt.2 117.8 103.3 10it.3 103.3 103.7 100.1 113.6 97.7 113 .5 109.7 121.9
1951: Average 112.1 112.0 115.3 106 .it 105.5 118.1* 109.6 108.7 103.8 116.6 107.6 107.7 108.0 108.6 103.U 12U.1 97.9 119 . U H 3 .7 132.6January— 110.0 — — 111.0 113.1 105.6 102.7 115.7 (It) (It) 10li*2 118.0 105.1 105.9 106 . 1* 105.7 102.8 120.6 101.1 116.1 H 0 .1 129.9February- 111.6 ______ m . o 115.3 105.9 107.0 115.1 (It) (It) 10it.2 118.0 107.5 106.3 107.8 106.9 10li.l 123.3 101.1 116 .2 H O .3 129.9March— 111.1 ______ 111.6 115.2 105.7 102.6 117.0 109.5 107.lt 10U.8 118.0 108.6 106.1* 108.1* 107.8 101*. 7 123.8 101.1 117 .U 112.0 129.9April------ 111.2 ______ 111.8 115.1 108.0 101.9 116.5 (It) (It) 10it.7 118.0 108 .8 106 .1 108.3 108.3 lO lt.l 123.7 101.1 117 . it 112.0 129.9May------— U 1.7 112.1 115.0 105.2 106 .0 117.0 (It) (It) 10lt.7 111.3 1 08 .8 106.2 108.1* 109.2 103.5 12U.6 101.1 117 .l1 H 1 .9 129.9June-------- 111.6 112.1 li lt . 8 105.2 105.8 117.2 109.8 108.8 103.3 112.0 109.2 106.3 108.1 109.0 103.1 123.8 101.2 117 .U 1 H .9 129.9
See footnotes at end o f table.
102
Digitized for FRASER http://fraser.stlouisfed.org/ Federal Reserve Bank of St. Louis
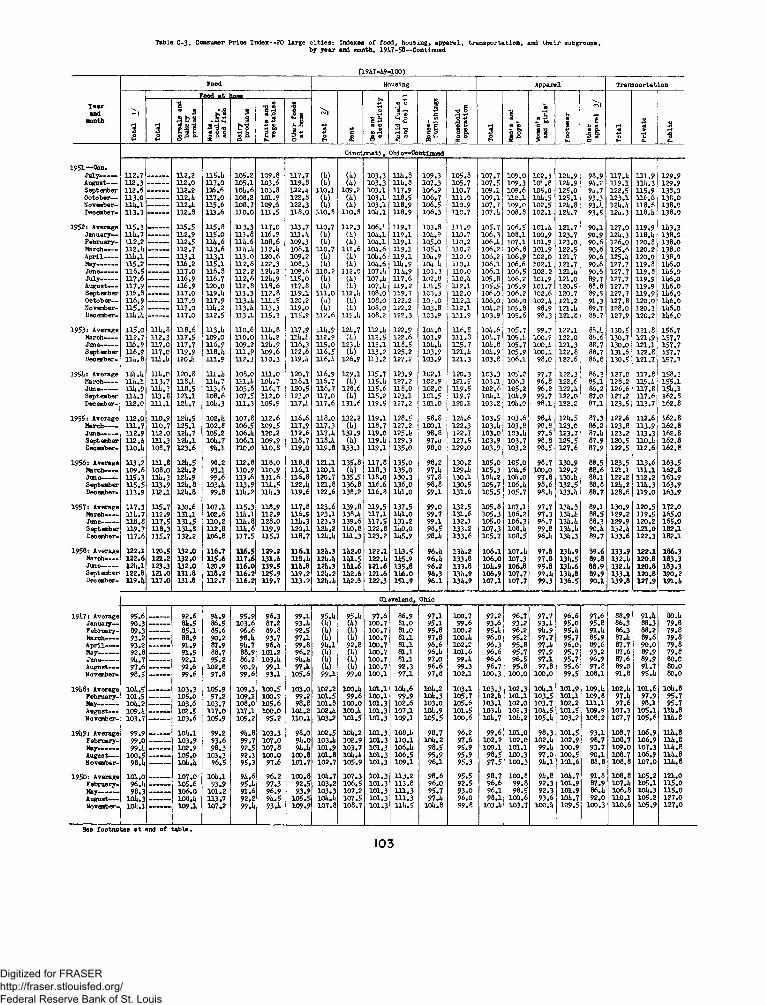
Table C-3. Consumer Price Index—20 large c i t ie s : Indexes o f food, housing, apparel, transportation, and their subgroupsby year and month, 191*7-58— Continued
(191*7-1*9-100)
Yearand
month
Food Housing Apparel Transportation
Tota
l 1/
________ Food at icme
Tot
al
2/
Rent
Qas
and
elec
tric
ity
Solid
fue
ls
and
fuel
oil
Hou
se-
furn
ishi
ngs
Hou
seho
ldop
erat
ion
Tota
l
Men
's an
d bo
ys'
Wom
en's
and
girl
s'
Foot
wea
r
Oth
erap
pare
l 3/
Tota
l
!
Tota
l
Cer
eals
and
ba
kery
pr
oduc
ts
Mea
ts,
poul
try,
an
d fi
sh
Dai
rypr
oduc
ts
r Frui
ts a
nd
vege
tabl
es
Oth
er f
oods
at
hom
e
Priv
ate
Publ
ic
C incinnati, Ohio— Continued1951— Cwu
July— — 112.7 --------- 312.2 315.1* 105.2 109.8 117.7 (U) 0 0 103.3 111*.8 109.3 105.3 107.7 109.0 102.3 12a.9 98.9 117 . a 111 .9 129.9August-— 112.3 — — - 112.0 117.0 105.1 103.6 319.8 (U) 0*) 103.3 111*. 8 107.3 105.7 107.5 109.3 101.8 12a.9 9a.2 n 9 . i n a .3 129.9September 112.6 - — — 112.2 136.6 10i*.6 103.3 122.1* 110.1 109.2 103.1 117.9 106.9 110.7 109.1 109.6 105.0 125.0 9a.7 122.5 115.9 138.0O ctober-- 113.0 ------- - 112.1* 117.0 108.2 101.9 122.3 (1*) <10 103.1 118.5 106.7 111.0 109.1 110.1 io a .5 125.1 93.3 123.1 116.6 138.0November- ll l* . l ——— 112.1* 115.6 108.7 109.6 122.3 (h) 0*) 103.1 118.9 106.5 110.9 107.7 109.0 102 .5 12a .8 93.a n a .a 118.6 138.0December- 113.3 — 112.9 133.6 110.0 131.5 318.0 110.8 110.8 101*.1 118.9 106.3 H 0 .7 107 . a 108.3 102.1 12a.7 93.5 i2a.3 n 8 .a 138.0
1952: Average 115.3 ______ H 5.5 315.8 113.3 117.0 113.7 310.7 112 .3 106.1* 119.1 103.8 111.0 105.7 106.5 101 . a 121.7 90.1 127 .0 119.9 U 3 .3January— 111*.7 ---- —. 112.9 315.0 113.8 116.9 133.1* 0 0 (U) 10l*.l 119.1 10U.9 110.7 106.3 108.1 100.9 123.7 90.9 n a .3 n 8 .a 138.0February- 112.2 - — — 112.5 111*. 6 llh .6 108 .6 109.3 0*) 0*) io a . i 119.1 105.0 110.2 106 . a 107.1 101.9 123.0 90.6 126.0 120 .8 138.0March------ 112.1* - — __ 312.7 313.6 lliu i* 312.1* 108.1 110.7 111.6 10lt.6 119.1 105.1 110.2 106 .2 106.8 101.9 122.5 90.6 125.6 1 20 .2 138.0A pril---- - ll l* . l — — 113.1 113.1 313.0 120.6 109.2 0*) 00 101*. 6 119.1 iol*.9 110.0 106.2 106.9 102.0 121.7 90.6 i25.a 120 .0 138.0May--------- 115.2 136.2 115.1 312.6 122.3 108.3 0*) 0 0 101*. 6 111*.9 loi* h 110.1 106.1 106.6 102.1 121.7 90.6 127.7 119 .8 ia 6 .oJune——- H 6 .5 —------ 317.0 116.8 112.2 121*.2 109.6 310.2 112.0 107.1* 11U.9 103.3 n o .o 106 .1 106.5 102.2 121 . a 90.6 127.7 119 .8 ia 6 .oJuly-—— 117.6 - — — 116.9 116.7 112.6 121*. 9 115.0 0*) 0*) 107.1* 117.6 102.8 110 . a 105.8 106 .2 101.9 121.0 89.7 127.7 119 .9 ia 6 .oAugust-— 117.9 — 116.9 120.0 312.8 118.6 317.8 0*) 0 0 107.U 119.2 101.5 n 2 . i 105.5 105.9 101.7 120.5 88.8 127.7 119 .9 ia 6 .oSeptember 116.8 - —---- 117.0 319. U 113.3 112.8 119.1 1 11 .0 112.1* 108.0 119.7 1C 3.3 112 .0 106 .0 1 06 .2 102.6 120.7 89.5 127.7 119 .9 ia 6 .oOctober— 116.9 — 317.0 117.9 113.1* 131*.5 120.2 0 0 00 108.0 122.2 103.0 112 .1 106.0 106.0 102 . a 121.2 91.3 127.8 1 20 .0 ia 6 .oNovember- 115.2 --------- 117.0 111*.2 113.U 113.3 119.0 (U) 0*) 108.0 122.2 103.8 n 2 . i ioa .2 105.8 98.9 121.a 89.7 128.0 120.3 ia6 .oDecember- Ui*.l; — 117.0 112.5 113.1 115.3 115.9 112.6 115.1* 108.2 122.3 103.9 m . 9 103.9 105.6 98.3 121.8 88.7 127.9 120.2 ia6 .o
1953* Average 115.0 111*. 8 318.6 313.1* 110.6 131*. 8 117.9 111*. 9 121*. 7 112.1* 122.9 10i*.0 n 6 .e 10a. 6 105.7 99.7 122.1 88. a 130.5 121.8 156.7March------ 112.7 112.3 117.5 109.0 110.0 111*. 2 11k . k 112.? 0*) 112.5 122.6 103.9 111.0 io a .7 105. a 100.2 122.0 88.6 130.7 121.9 157.7June-------- 136.9 117.0 117.7 116.9 109.2 12U.9 116.3 115.0 123.1* 113.1 118.5 10a.it 115.7 10a. 8 105.7 ioo .a 121.3 88.7 130.0 121.1 157.7September 116.9 317.0 119.9 118.1; 311.9 109.6 122.6 316.5 0*) 113.? 125.2 103.9 121.a 10a. 9 105.9 100.1 122.8 88.7 131.6 122.8 157.7December- 111*. 8 lll*.ii 120 J* 111.9 112.3 13 0.3 119.1* 316.1* 126.9 113.2 127.2 103.9 121.3 103.8 106.1 98.C 122.6 86.8 130.5 121.7 157.7
1951*: Average 131*.1* m * .o 120.8 121.1; 108.0 111.0 120.7 116.9 129.1 115.7 123.9 102.1 120.3 103.3 105.2 97.7 122.3 86.3 127.0 117.8 158.3March------ l l l i . l 113.7 118.1:. 111*. 7 111.1. 10J*.7 318.1 116.7 <10 115.1* 127.2 102.9 121.5 103.1 106.] 96.8 122.6 85.1 128.2 i i9 .a 155.1June——- 111* .9 111*.? 118.5 113.6 103.6 116.7 120.5 316.7 128.6 115.6 118.0 102.0 n 9 .5 102.6 105.2 96.2 122.a 86.2 126.6 n 7 .8 I 5 a .lSeptember lll*.3 113.8 121.1 108.6 107.5 112.0 123.0 117.0 0*) 115.2 123.1 101.5 n 9 .7 io a . i io a .9 99.7 122.0 87.0 127.2 117.6 162.8December- 112.0 111.1 121*.7 10l*.3 311.3 105.9 117.1* 117.6 131.6 119.5 127.2 101.0 120.1 103.2 io a .o 98.1 122.2 87.1 123.5 113.7 162.8
1955: Average 112.0 110.9 12it.5 102.1; 107.8 112.6 116.6 318.0 132.2 119.1 128.5 98.8 i2 a .6 103.5 103.6 98.a 12a.5 87.3 122.6 112.6 162.8March--- - 111.7 310.7 125.1 102.8 106.5 109.5 117.9 117.3 0*) 118.7 127.2 100.1 122.3 io 3 .a 103.8 98.8 123.0 86.2 123.8 113.9 162.8June------ 112.9 112.0 121*.7 105.2 106.1* 120.2 112.6 117.1* 131.9 119.0 125.1i 98.8 122.7 103.0 103.a 97.6 123.7 87.U 123.2 U 3 .3 162.8September 112.1* 311.3 12U.1 10l*.7 106.1 109.9 118.7 118.1* 0*) 119. h 129.3 97.a 127.5 103.9 103.7 98.8 125.5 87.9 120.5 u o .a 162.8December- 110.U 108.7 123.6 9l*.l n o .o 110.8 119.0 319.8 133.1 119.1 135.0 98.0 129.0 103.9 103.2 98.5 127.6 87.9 122.5 n 2 .6 162.8
1956* Average 113 .2 311.8 12l*.5 98.2 312.8 118.0 118.8 121.1 135.8 117.8 135.0 98.2 130.2 105.0 105.0 98.7 130.9 88.5 123.5 113.6 163.5March------ 109.6 108.0 12l*.2 93.1 110.9 310.9 116.1 120.1 0*) 118.3 135.0 97 .a 129.a 105.3 io a .6 100.0 129.2 88.6 121.1 m . i 162.8June------- 115.3 Hi*. 3 121*.9 99.6 313.6 131.6 116.8 120.7 135.5 118.0 130.3 97.8 130.1 io a .2 10a .0 97.8 130.U 88.1 122.2 112.2 163.9September 115.5 113.9 121*. 8 103.1* 113.9 n i* .5 122.lt 121.8 136.8 116.6 136.0 98.8 130.5 105.7 io 6 .a 98.6 132.5 88.8 12a. 2 11a.3 163.9December- 113.9 112.1 121*. 8 99.8 111*.2 111* .3 119.6 122.6 138.2 116.8 11*1.0 99.1 131.6 105.5 105.7 98.a 133.a 88.7 128.6 n 9 .o 163.9
1957: Average 117.3 315.7 130.6 107.1 315.3 118.9 117.8 123.6 139.8 119.5 137.5 99.0 132.5 105.8 107.1 97.7 i3 a .3 89.1 130.9 120.5 172.0March------ 111*. 7 112.9 131.1 102.6 111* .1 112.9 116.9 123.1 138.1* 117.1 11*1.0 99.7 131.6 105.3 106.2 97.3 i3 a .a 88.5 129.2 119.5 165.0June-------- 118.8 317.5 131.5 110.2 ll l* .8 128.0 111*. 3 123.3 139.6 117.5 131.2 99.1 132.1 105.0 106.3 96.7 i3 a .a 88.3 129.9 120.2 165.0September 119.7 118.3 131.8 112.8 111*. 6 119.9 120.1 121*.2 11*0.8 122.8 11*0.0 98.5 133.2 107.3 108.a 99.8 i3 a .a 90.a 132.a 121.0 182.1December- 117.6 115.7 132.2 106.8 317.5 115.1 118.7 12U.U 11*1.3 123.2 11*5.9 98.a 133.6 105.7 108.5 96.a i3 a .3 89.7 133.6 122.3 182.1
1958: Average 122.1 120.5 132.0 116.7 116.5 129.2 116.1 121* .3 11*2.0 122.1 11*3.5 96. a n a .2 106.1 107.a 97.8 m . 9 99.6 133.9 122.1 186.3March----- 122.6 121.2 132.0 H 5.6 117.6 131.ii 118.1* 121* .1* 11*1.5 122.1* 11*5.9 96.a 133.8 106.0 107.3 97.8 m . 5 89.8 132.a 120.8 183.3June-------- 121*.1 123.3 132.0 120.9 116.0 139.5 lli*.8 12U.3 11*1.6 121.6 135.8 96.2 133.8 io a .9 106.8 95.8 13U.6 88.9 m . a 120 .8 183.3September 122.8 121.0 131.8 118.2 116.2 125.9 119.2 121*. 2 11*2.6 121.6 11*6.0 96.3 1311.9 106.9 107.7 9 9 .a m . 8 89.9 133.1 120 .8 190.2December- U9.1* 117.0 131.8 112.7 116.2 119.7 113.9 12li.l* 11*2.8 122.3 151.9 96.1 w a .9 107.1 107.7 99.3 136.5 90.1 139.8 127 .9 191.a
Cleveland, Ohio
19l*7: Average 95.6 92.6 9U.9 95.9 96.3 99.1 95.1* 95.1* 97.6 86.9 97.1 100.7 97.2 96.7 97.7 96.6 97.6 88.9 91 .a 80.aJanuary— 90.3 _____ 8U.5 86.5 103.6 87.2 93.1* 0*) 0*) 100.7 81.0 95.1 99.6 93.6 93.2 93.1 95.0 95.8 86.3 88.3 79.8February- 89.3 ______ 85.1 85.6 96.6 89.8 92.5 0*) 0*) 100.7 81.0 95.8 100 .2 95.a 96.2 9a.9 95.a 91.U 86.3 88.2 79.8March------ 93.2 ______ 88.9 90.2 98.1* 93.7 97.1 0*) 0 0 100.7 81.1 97.8 100.a 96.0 95.2 97.7 95.7 85.9 87.a 89.6 79.8A pril------ 93.2 91.9 87.9 9U.7 96.1* 99.8 91*. l 92.8 100.7 81.1 96.6 102.2 96.3 95.8 97.a 96.0 89.6 87.7 90.0 79.8May--------- 92.8 ______ 91.5 88.7 88.9 101.2 96.2 0*) 0*) 100.7 81.1 96.a 101.6 96.6 95.7 97.9 95.7 93.2 87.6 89.9 79.8June— — 91*. 7 92.1 95.2 86.2 103.1* 9U.U 0 0 0*) 100.7 81.1 97.0 99.a 96.6 96.5 97.1 95.7 96.9 87.6 89.9 80.0August— 97.6 92.6 102 . e 90.9 99.1 97.1* <10 00 100.7 92.3 96.6 99.3 96.7 95.8 97.8 95.6 97.8 89.0 91.7 80.0November- 98.5 — 99.6 97.8 99.6 93.1 105.6 99.1 99.0 100.1 97.1 97.8 102.1 100.3 100.0 100.0 99.5 108.1 91.8 95.a 80.0
191*8: Average iol*.5 ____ 103.3 105.9 109.3 100.5 103.0 102.2 100.1* 101.1 10U.6 io a .2 103.1 103.3 102.3 i o a . i 101.9 109.a 102.a 101.6 io a .8February- 101.5 _____ _ 105.0 97.2 109.1 100.9 99.2 101.5 99.6 100.1 99.9 io a .3 105.7 102.a 101.1 103.5 101.1 109.8 97 .a 97.9 95.7May--------- 10l*.2 ______ 103.6 103.7 108 .0 105.6 98.8 101.8 100.0 101.3 102.6 1 03 .0 105 .6 103.1 102.0 103.7 102 .2 i n . i 97.6 98.1 95.7August— 109.1* ______ 102.5 117.0 117.1 100.0 10l*.2 102.1* 100 J* 101.3 107.1 io a .9 1 01 .5 103 . a 102.3 io a .5 101 .5 109.9 107.3 105.1 n a .8November- 103.7 — 103.6 105.9 105.2 95.2 U 0 .1 103.2 101.5 101.3 109.1 105.5 1 00 .6 io a .7 io a .2 io5 .a 103 .2 108.2 107.7 105.6 l i a . 8
191*?: Average 99.9 ____ 10i*.l 99.2 9U.8 103.3 98.0 1 02 .5 10l*.2 101.3 108.1* 98.7 96.2 99.6 101.0 9 8.3 101 .5 93.1 108.7 106.9 n a .8February- 99.0 _____ _ 103.9 93.6 99.7 107.0 9l*.0 103.1* 102.9 101.3 110.1 10a. 2 97.6 102.2 102.0 102 . a 102 .9 98.7 108.7 106,9 n a .8May--------- 99.1* ______ 102.9 98.3 92.5 107.8 9U.U 101.9 103.7 101.3 106 . 1* 98.5 95.9 100.1 101.1 99.a 100 .9 93.7 109.0 107.3 n a .eAugust---- 1 00 .5 ____ 105.0 103.3 92.3 100.0 100.8 101.8 10l*.l* 101.3 106.5 95.9 95.9 98.5 100.3 9 7 .0 1 00 .5 90.1 108.7 106.9 n a .8November- 98.1* — 10U.lt 96.5 95.3 97.6 101.7 102.7 105.9 101.3 109.1 96.1 9 5 .3 97.5 100.3 9 a .i 101 .6 88.8 108.8 107.0 n a .e
1950: Average 101.0 ___ 107 .0 10l*.l 9U.6 96.2 100.8 10l*.7 107.3 101.3 H 3 .2 98.6 95.5 98.7 100.8 9a.e 10a. 7 91.8 108.8 105.2 1 21 .0February- 96.1* ______ 105.6 93.9 95.U 97.3 92.5 103.2 106.5 101.3 113.8 96.0 9 2 .5 96.6 99.8 9 2.3 1 01 .9 87.9 107 . a 105.1 1 15 .0May--------- 98.3 ___ 1 06 .0 101.2 91.6 96.9 93.9 103.3 107.2 101.3 111.3 95.7 9 3.0 96.1 98.5 9 2 .3 101 .9 86.a 106 .8 io a .3 n 5 .oAugust---- 10l*.3 ______ 108.1* 113.7 9 2 .2 9U.5 105.5 10U.U 107.5 101.3 111.3 97.a 9 6 .0 98.1 100.6 9 3 .6 io a .7 92.0 110.1 105.2 127 .0November- 10i*.l 109.1 107.2 99.1* 93 .U 109.9 107.8 108.7 101.3 n a .5 io a .8 99.8 103 .a 103.7 io o .a 109 .5 100.3 n o .6 105.9 1 27 .0
See footnotes at end of table.
103
Digitized for FRASER http://fraser.stlouisfed.org/ Federal Reserve Bank of St. Louis
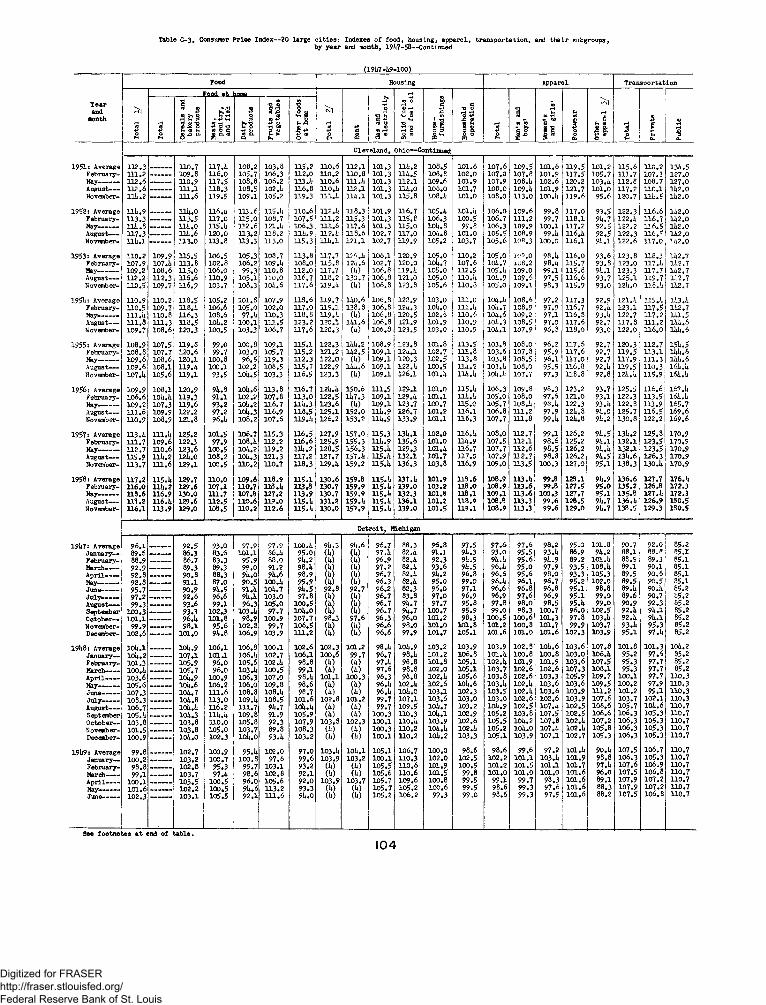
Table C-3. Consumer Price Index—20 large c i t ie s : Indexes o f food , housing, apparel, transportation, and th eir subgroupsby year and month, 191:7-58—Continued
(19U7-U9-100)
Tearand
month
Food Housing Apparel Transportation
To
tal
1/
Food at home____
To
tal
2/
Ren
t
Oas
an
d e
lec
tric
ity
So
lid
fu
els
and
fue
l o
il
Hou
se -
fu
rnis
hin
gs
Hou
seh
old
op
era
tio
n
Tot
al
Men
's
and
bo
ys'
Wom
en's
an
d g
irls
'
Foo
twea
r
Oth
era
pp
are
l 3
/
To
tal
____
____
____
_i
1
To
tal
Cer
eals
an
d ba
ke r
y p
rod
uct
s
Mea
ts,
po
ult
ry,
and
fish 5
Jr!<u aa
1F
ruit
s an
d 1
veg
eta
ble
s
! Oth
er f
ood
s a
t ho
me
Pri
va
te
Pu
bli
c
Cleveland, Ohio—Continued
1951 : Average 112.3 n o . 7 H7.it 108.2 103.8 115.2 n o .6 112.1 101.3 n u .2 108.5 101.6 107.6 109.5 101.61
n 9 .5 101.2 115.6 110.2 13U.5February- 111.2 — 109.8 116.0 105.7 106.3 n 2.o n o .2 110.8 101.3 Hit. 5 108.8 102.0 107.0 107.8 101.9 U 7.5 105.7 111.7 107.3 127.0May------ 112.6 — n o . 9 117.5 108.8 1 06.2 113 .U n o .6 m .u 101.3 1 12 .1 109.6 101.9 107.9 108.U 102.6 120.2 103.U 112.8 108.7 127.0August—- 132.6 ___ _ m . i 118.3 108.5 102 .U n 6 .8 n o.it n 2 . i 101.3 n u .o 1 08 .0 101.7 108.0 109.It 101.9 121.7 101.0 117.2 110.1 1U2.0November- 111:.2 — i n . 6 119.5 109.1 105.2 119.3 U1.U n it . i 101.3 1 15.8 108.it 101.0 108.0 113.0 1 00 .U 1 19 .6 95.6 120.7 11U.5 1U2.0
1952: Average li lt .9 n it.o n 6.it 113.6 115. U n o .6 n 2 .u 118.3 101.9 n 6 .7 105.U 1 01 .U 106 .0 109.6 99.8 117 .0 93.5 122.3 116.6 11:2.0February- 113.3 ------ n 3 .5 n 7 .o 115.0 108.7 107.5 1 11.2 n 5 .3 101.3 115.8 106 .3 100.5 106.7 111.2 99.7 118.1 9U.7 122.lt 116.7 1U2.0May------ lilt .8 __ -_ n it.o 115 .it 112.6 121.U 106.3 m . 6 1 17 .6 101.3 115 .0 10U.8 99.8 106.3 109.9 100.1 117.2 92.5 122.2 116 .5 1U2.0August— 117.3 lilt. 6 1 20 .0 n 3 .2 n 8.2 Hit. 9 n 2.u 118.6 102.7 1 17.0 10U.8 101.0 105.5 108.9 99 .U 1 16 .u 92.5 122.3 116.5 1U2.0November- lllt . l — n 3 .o m . 8 n 3 .3 113.0 n 5 .3 n u . i 1 21 .1 102.7 n 9 .9 105.2 103.7 105.6 IO8.3 100.0 116.1 9U.1 122.6 117.0 , !it2.0
1953: Average 110.2 109.9 115.5 1 06 .5 105.3 108.7 1 1 3 .8 1 17 . v 1 29 .U 106.1 1 20.9 1 05 .0 n o .2 105.0 iC’S.O 98.U 116.0 93.6 123.8 n 8 .3 1U2.7February- 107.9 107.it n 3 .8 1 02 .8 106.2 109.U 1 08 .0 n 5 .e 12U.6 102.7 120 .0 10U.7 107.6 10U.7 108.2 98.it 115.7 93.8 123.0 1 17 .u 11:2.7May------ 109.2 108.6 n 5 .o 1 06 .0 99.3 110.8 112 .0 n ? .7 (U) 106.8 1 19 .U 105 .0 112.5 105.it 109.0 99.1 115.8 9U.1 123.3 n 7 .7 1U2.7August—- 112.2 112.3 n 6 .6 n o .9 105.1 110.0 116.7 n 8.2 130.7 106 .8 1 21.0 105 .0 no.U 10U.9 109.6 97.5 116.6 93.7 125.1 119.7 1.12.7November- u o .5 109.7 n 6 .9 103.7 108.3 10U.6 n 7 .6 n 9 .it (U) 106.3 123.8 1 05 .6 n o . 3 105.0 109.1 98.3 115.9 93.0 12U.0 118.U 1U2.7
19 5U: Average 110.9 110.2 n 8 .5 105.2 101.8 107.9 118.6 1 19.7 1U0.6 106.8 122.9 1 03.0 m . o 10U.U 108.6 97.2 117.3 92.9 121. U 115.U 1U3.UFebruary- n o .5 109.7 n 8.it 106.6 105.0 102.0 117.0 n 9 . i 138.8 1 06.8 12U.3 lOit.O m .u ioU.7 108.9 97.9 116.7 92.U 123.1 n 7 .5 1U2.7May------ in . i t 110.8 116.3 108.6 97. it 110.3 n 8 .8 n9.U (U) 106.8 120 .5 1 02.8 n o .6 10U.6 109.2 97.1 116. S 93.U 122.7 117 .2 litl.5August-— m . 8 111.3 n 8 .5 lOit.2 100.1 111.5 123 .2 120 .1 1U1.6 106.8 121.9 1 01.9 n o .9 loll. 3 108.5 97.0 117.6 92.7 117.8 111.2 1UU.6November- 109.7 108.6 120.3 1 00.5 103.3 106.7 n 7 .6 1 20.3 (U) 106.8 1 23.5 103 .0 n o .9 lo li.l 107.9 96.3 118.0 93.0 122.0 116.0 Hilt. 6
1955: Average 108.9 107.5 n 9 .8 99.0 100.8 109.1 1 15.1 1 22.3 1UU.2 108.9 123 .8 1 01.8 n 3 .5 103.8 108.0 96.2 n 7 .6 92.7 120.3 112.7 15U.5February- 1 08.8 107.7 120.6 99.7 103.0 105.7 n 5 .2 121.2 1U2.5 109.1 12U.1 1 02.7 i n . 8 1 03.6 107.8 95.9 117.6 92.7 119.5 113.1 1UU.6May---- - 109.6 108.6 120.1 1 00.8 96.5 119.3 n 2 .3 1 2 2 .0 (U) 109.1 120.3 102 .5 1 13 .8 1 03.8 108.5 96.1 n ? .o 92.7 n 7 .9 111.3 1UU.6August-— 109.6 108.1 n 9 .it 100 .1 102.2 108.5 n 5 .7 122 .9 1UU.6 109.1 122. U 1 00.5 n u .? 103.U 108.0 95.5 116.8 92.lt n 9 .5 110.3 16U.UNovember- 107.lt 105.6 n 9 . i 93.5 10it.5 103.3 n 6.5 1 23.3 (U) 109.1 126.1 1 01 .U 11U.U ioU.U 107.7 97.3 118.8 92.8 12U.U 115.9 16U.U
1956: Average 109.9 108.1 120.9 9it.8 lOlt.6 n 3 .8 n 6 .7 12U.U 150.6 111.5 129.1 101 .0 n5.U 1 06.3 109.3 98.3 123.2 93.7 125 .5 116.6 167. UFebruary- 106.6 10U.U n 9 .3 91.1 102.2 107.8 1 1 3 .0 1 22 .5 1U7.3 109.1 129.u 1 01 .1 11U.U 1 05 .0 108.0 97.6 121.0 93.1 122 .3 113.5 16U.UMay------ 109.2 107.3 n 9 .6 93.2 10lt.2 n 6 .7 n u .3 1 2 3 .6 (U) 109.1 1 23 .7 100 .7 n 5 .o 105.7 1 0 8 .u 98.U 122.3 93. U 1 22.8 113.9 165.7August--- 111.6 109.9 122.2 97.2 iali.3 n 6 .9 118.5 125 .1 152.0 n )i,o 126.7 101 .2 n 6 . i 1 06 .8 111.2 97.9 12U.8 9U.0 125 .7 116.5 169.6November- 110.9 108.9 121.8 96.lt 108.2 107.6 1 19 .U 126.2 153.2 n u .9 133.9 101.1 n 6 .3 107.7 n i . 8 99 .U 12U.8 9U.2 1 30 .8 122.2 1 69 .6
1957: Average 13-3.it l l l . i t 125.2 101.5 106.7 n 5 .3 n 6 .5 127.9 157.0 n 5 .3 13U.1 102 .0 n 6 .u 108.0 n 2 .7 99.1 126.2 9U.5 13U.2 125.8 170.9February- 111.7 109.6 122.3 97.9 108.lt 112.2 116.6 125.9 155.3 llit. 9 135.6 101 .0 n u . 9 107.5 112.1 98.6 125.2 9U.1 132.1 123.5 170.9May------ 112.7 110.6 123.6 100 .5 10li.2 119.2 nU.2 128.5 156.3 115.U 129.3 1 01 .U n 6 .7 107.7 112.6 98.5 126.2 9U.U 132.1 123.5 170.9August--- U 5.9 llit . 2 12it.O 1 08 .2 10ii.3 121.3 117.2 127.7 157.U 115.U 132.1 101.7 n 7 .o 107.9 n 2 .? 98.8 126.2 9U.5 13U.6 126.3 170.9November- 113.7 111.6 129.1 1 00 .5 n o . 2 n o . 7 118 .3 129. U 159.2 n5.U 136.3 103.8 n 6 .9 109.0 113.5 100.3 127.0 95.1 138.3 130.U 170.9
1958: Average 117.2 ll5 .lt 129.7 1 10.0 1 09 .6 118.9 n 5 . i 130.6 159.8 1 1 5 . U 137. U 101.9 118.6 108.9 113. U 99.8 128.1 9U.9 136.6 127.7 176.UFebruary- 116.0 m . 2 129.6 1 07.1 n o .7 llfl.lt 113.8 130.7 159.9 1 15 . U 139.0 103.2 n fl.o 108.9 U 3.6 99.8 127.5 95.0 135.2 126.8 172.3May----- 118.6 116.9 130.0 i n .7 107.8 127.2 113.9 130.7 159.9 n5.U 132.3 101.8 n 8 . i 109.1 n 3 .6 100.3 127.7 95.1 135.8 127. U 172.3August— 113.2 ii6 .it 129.6 112.5 110.6 n ? .o 115.U 131.2 159. U U5.U 136.1 101.2 118.9 108.8 U 3.3 99.6 128.5 9U.7 136.U 126.9 180.5November- 116.1 113.9 129.0 ID8 .5 n o . 2 112 .6 115. U 130.0 159.9 n s .u 139.0 101.5 n ? . i 108.9 113.3 99.6 129.0 9U.7 138.5 129.3 180.5
Detroit, Michigan
19^7: Average 96.1 92.5 9 3.0 97.9 97.9 1 00 .U 9U.3 9U.6 9 6.7 88.3 96.8 9 7.5 97.6; 97.6 98.2 95.0 101.8 9 0.7 ?2.0 | 85.2January— 89.6 _____ 86.3 83.6 101.1 86.U 95.0 (U) (U) 97.U 8 2 .u 91.1 9U.3 93.0 95.5 93 .U 86.9 9U.2 88.1 88,8;I 85.1February- 88.9 _____ 86.7 83.3 95.9 88.0 9U.2 (U) (U) 9 6.9 82.U 92.3 9U.5 9U.U 95.6 9U.9 89.2 1 0 1 . U 88.5 89.3 1 85.1March---- 92.9 ____ _ 89.3 89.3 99.0 91.2 98.U (U) (U) 9 7.2 82.U 93.6 9U.5 9 6 .u 95.0 97.9 93.5 108. !t 89.1 90.1 85.1April---- 92.8 90.8 88.3 9U.0 9U.6 98.9 (U) (U) 9 6.7 82.U 9U.2 9 6.8 96.6 95.6 98.0 93.3 105.3 89.5 90.6 85.1May—— - 92.8 ___ 91.1 87.0 90.5 1 00 .U 95.9 (U) (U) 9 6.3 82.U 95.0 9 9.0 96.U 96.1 96.7 95.2 102.0 89.5 90,5 85.1June----- 95.7 90.9 9it.5 91.U 10U.7 9U.5 9 2.8 9 2.7 9 6.2 82.3 96.0 9 7.1 96.6 96.8 96.8 95.1 98.8 89.U 90.U 65.2July----- 97.2 92.6 96.6 9U.lt 103 .0 97.8 (U) (U) 96.7 83.8 97.0 9 6.9 96.9 97.6 96.9 95.1 99.0 89.6 90.7 85.2August--- 99.3 93.6 99.1 96.3 105 .0 100.5 (U) (U) 96.7 9U.7 97.7 95.8 97.8 98.0 98.5 95.U 99.0 90.9 92.3 85.2September 100.3 — — 93.3 102.3 103 .U 97.7 IOU.O (U) (U) 96.7 9U.7 100.7 95.9 99.0 98.3 100.7 96.0 102.5 92.U 9U.1 85.2October— 101.1 96.lt 101.8 9 8.9 100.9 107.7 98.3 97.6 96.3 96.0 101.2 98.3 100.5 100.6 101.3 97.8 1 03 . U 92.U 9U.1 85.2November- 99.9 ____ 98.1 95.6 102.8 99.7 106.5 (U) (U) 96.6 98.0 101.0 101.3 101.2 100.3 101.7 99.9 103.7 93.U 95.3 85.2December- 102.6 — 101.0 9U.8 106.9 103.9 i n .2 (U) (U) 96.6 97.9 101.7 105.1 101.6 101.0 101.6 102.3 103.9 95.1 97.U 85.2
19U8: Average lOit.l 10lt.9 1 06 .1 106.8 100.1 102.6 102.3 101.2 98.U 10U.9 103.2 103.9 103.9 102.3 10U.6 103.6 107.8 101.8 101.3 10U.2January— lOlt.2 _____ 107.1 101 a 1 06 .U 102.7 1 0 6 .1 100.6 99.7 96.7 98.U 101.2 106 .8 101. U 100.8 100.8 103.0 106.U 95.2 97.6 85.2February- 101.3 _____ 105.9 9 6.0 105.6 102 .U 98.8 (U) (U) 97.U 98.8 101.8 105.1 102. U 101.9 101.9 103.6 107.5 95.3 97.7 85*2March---- 100.lt ___ _ 105.7 9 6.0 103 Jt 100.5 99.1 (U) (U) 97.6 98.8 102.0 105.1 103.7 102.6 102.6 107.3 108.1 95.3 97.7 85.2April---- 103.6 ___ 10ii.9 100.9 106.3 107.0 98.U 101.1 100.3 96.3 98.8 102.U 105.6 103.8 102.6 103.3 105.9 109.7 100.1 97.7 110.3May—---- 105.6 ___ 10lt.6 106.2 106.0 109.8 98.6 (U) (U) 96.U 102 .U 102.6 10U.6 103. U 102.U 103.6 103.6 109.5 100.2 97.9 n o .3June—-— 107.3 ___ 10it.7 111.6 1 08.8 108.U 98.7 (U) (U) 96.U 10U.0 103.1 102.3 103.5 102. U 103.6 103.9 i n . 2 101.2 99.1 110.3July--- - 108.3 ____ _ 10lt.8 n 3 .o 109 .U 108.5 101.6 1 02.8 101.2 99.7 107.1 103.6 103.0 103.0 102.6 102.6 103.9 1 07 .6 103.7 102.1 110.3August-— 106.7 ___ 10it.lt n 6 .2 111.7 9U.7 10U.U (U) (U) 99.7 109.5 10U.7 103.2 10U.9 102.5 107.U 102.5 108.6 105.7 10U.6 n o .7September 105.lt 10lt.3 nu.it 109.8 91.9 105.9 (U) (U) 100.3 n o .3 10U.1 102.9 105.2 103.8 107.5 102.5 1 06 .6 106.3 105.3 n o .7October— 103.8 ____ 103.8 n o .o 105.8 92.3 107.9 1 03 .8 102.3 100.1 1 10 .U 103.9 102.6 105.5 10U.2 107.8 102. U 107.2 106.3 105.3 110.7November- 101.5 ___ 103.8 105 .0 103.7 89.8 108.3 (U) (U) 100.3 n o .2 10U.U 102 .U 105.2 10U.0 107.U 102. U 105.8 106.3 105.3 n o .7Dee ember- 100.9 — lOit.O 1 02.3 10U.0 93. U 103.2 (U) (U) 100.1 n o .2 10U.2 103.3 105 .1 1 03 .9 107.1 102.7 105.3 106,3 105.3 n o .7
19119: Average 99.8 102.7 1 00.9 95.U 102.0 97.0 103 .u 10U.1 105.1 1 06 .7 100.0 98.6 98.6 99,6 97.2 101.U 90.u 107.5 106.7 110.7
January— 100.2 103.2 1 00.7 100.8 97.6 99.6 103.9 103.2 100.1 n o .3 102,0 102 .5 102.2 101.1 103.U 101.9 98.8 106.3 105.3 n o .7February- 98.8 102.8 95.3 99.7 103.1 93.2 (U) (U) 105.5 1 10 .6 101.9 100.5 101.2 101.5 101.1 101.7 97.U 107.6 1 06 .9 110.7
March— 99.1 ___ 103.7 97.lt 98.6 102.8 92.1 (U) (U) 105.6 n o .6 101.5 99.8 101.0 101.0 101.0 101.6 96.0 107.5 1 06.8 n o .7April---- 100.1 __ _ 103.5 1 00.5 96.0 105.6 92.0 103.9 103.7 105.7 109 .6 100.8 99.5 99.1 99.7 98.3 101.6 89.1 107.9 107.2 n o .7May— — 101.6 ___ 102.2 100 .5 9U.6 113.2 93.3 (U) (U) 105.7 105.2 100.6 99*5 98.6 99,3 97.6 101.6 88.3 107.9 107.2 n o .7June—— 102.3 103.1 105 .5 92.1 i n . 6 9U.0 (U) (U) 105.2 1 06 .2 99.3 99,0 98.6 99,3 97.5 101.6 88.2 107.5 1 0 6 .8 1 10.7
See footnotes at end o f table.
104
Digitized for FRASER http://fraser.stlouisfed.org/ Federal Reserve Bank of St. Louis
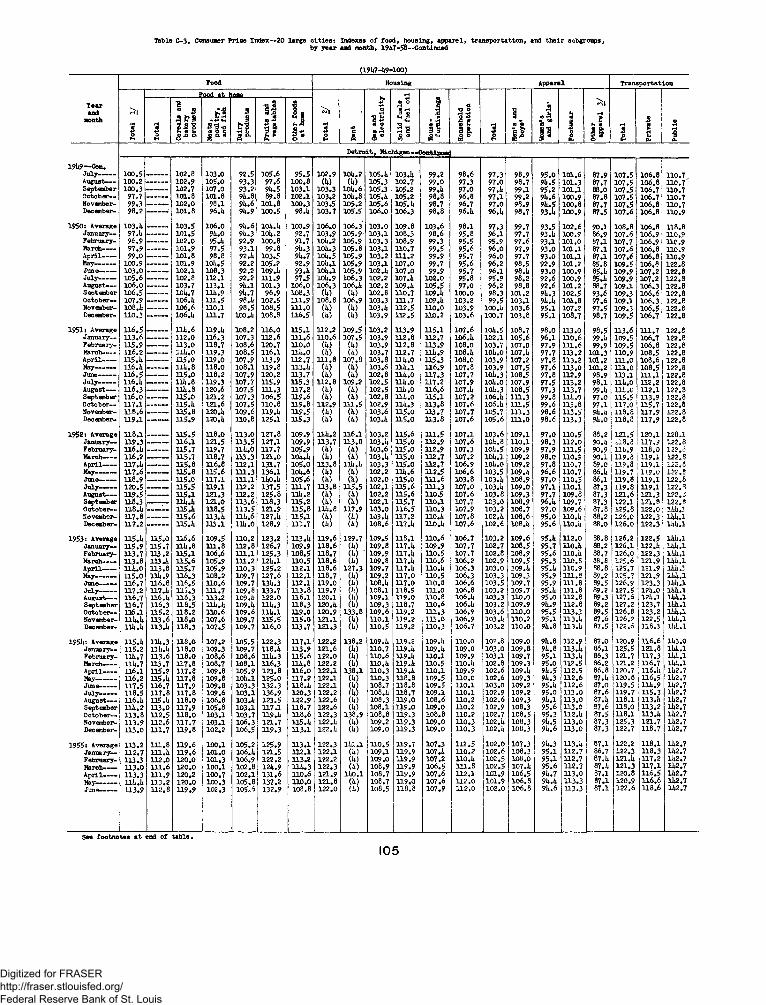
Table C-3. Consumer Priee Index—20 large c i t ie s : Indexes o f food , housing, apparel, transportation, and th eir subgroupsby year and month, 19U7-58—Continued
(191*7-149-100)
Tearand
month
Food Housing Apparel Transportation___ Food at tome_______________
rH5otr> Re
nt
Gas
and
elec
tric
ity
Solid
fue
ls
and
fuel
oil
Hou
se-
furn
ishi
ngs
Hou
seho
ldop
erat
ion
Tota
l
Men
's an
d bo
ys'
Wom
en's
and
girl
s'
Foot
wea
r
Oth
erap
pare
l 3
/
Tot
al
Priv
ate
Pub
lic
Tota
l 1/
Tot
al
Cer
eals
and
ba
kery
pr
oduc
ts
Mea
ts,
poul
try,
an
d fi
sh
Dai
rypr
oduc
ts
Fru
its
and
vege
tabl
es
Oth
er f
oods
at
hom
e
D etroit, Michigan— Continuedl
192*9— Con.July-------- 100.5 ——— 102.8 103.0 92.5 105.6 95.5 102.9 10U.2 105.U 103.a 99.2 98.6 97.3 98.9 95.0 101.6 87.9 107.5 106.8 U 0 .7August---- 100.2 102.9 105.0 93.3 97.6 100.8 (U) (it) 105.3 102.7 99.0 97.3 97.0 98.7 9a.s 101.3 87.7 107.5 106,8 n o .? ~September 100.3 — — 102.7 107.0 93.2 9it.5 103.1 103.3 10lt.6 105.3 105.2 99 .a 97.0 97. a 99.1 95.2 101.1 88.0 107.5 106.7 n o .7October— 97.7 —— - 101.8 101.8 9l*.8 89.8 102.1 103.2 10U.8 105.U 105.2 98.8 96.8 97.1 99.2 9h.6 100.9 87.8 107.5 106.7 n o .7November- 99.3 — — 102.0 98.1 9U.6 101.8 100.3 103.5 105.2 105.6 105. a 98.7 96.7 97.0 98.9 9a.5 100.8 87.7 107.5 106.8 n o .7December- 98.2 101.8 96.1* 9U. 9 100.5 98.1* 103.7 105.5 106.0 106.3 98.8 96.a 96.a 98.7 93.a 100.9 87.5 107.6 106.8 n o .9
1950: Average 103.U ______ 103.5 106.0 91*. 6 10lt.lt 100.9 106.0 106. 3' 103.0 109.8 103.6 98.1 97.3 99.7 93.5 102.6 90.1 108.8 106.8 U 8 .8January— 97 .U — 101.5 9U. 0 9l*.3 10it.2 ?2.7 103.9 105.9 103.1 108.3 98.6 95.8 96.1 97.7 93 .a 100.9 86.9 107.6 106.9 n o . ?February- 96.9 -------- 102.0 95.1* 92.9 100.8 91.7 10l*.2 105.9 103.3 108.9 99.3 95.5 95.9 97.6 93.1 101.0 87.1 107.7 106.9 n o .9March------ 97.9 101.9 97.5 93.1 99.8 9lt.3 10i*.3 105.8 103.1 U 0 .7 99.5 95.6 96.0 97.9 93.0 101.1 87.1 107.6 106.8 110.9A pril------ 99.0 101.8 98.8 92.1* 103.5 9l*.7 10U.5 105.9 103.2 111.2 99.9 95.7 96.0 97.7 93.0 101.1 87.1 107.6 106.8 110.9May--------- 100.9 ——— 101.9 10lt.5 92.2 105.2 92.9 10lt.l 105.9 103.1 107.0 99.7 95.6 96.2 98.5 92.9 101.2 85.8 109.5 106.8 122.8June—---- 103.0 — — . 102.1 108.3 92.2 109.1* 93.1* 10U.1 105.9 102.1* 107.0 99.9 95.7 96.1 98 .a 93.0 100.9 85.1 109.9 107.2 122.8July---- — 105.6 —,— . 102.8 132.1 92.2 U 1 .9 97.5 10l*,9 106.3 102.2 I07.a 102.0 95.8 95.9 98.2 92.6 100.9 85.a 109.9 107.2 122.8August— 106.0 —------ 103.7 U 3 .1 9U.1 101.3 106.0 106.3 106. 1* 102.2 109.a 105.5 97.0 96.2 98.8 92.6 101.2 88.7 109.1 106.3 122.8September 106.5 -------- I0lt.7 111*.? 9U.7 96.9 108.3 <U> (U) 102.8 110.7 109.a 100,0 98.3 101.2 9a.3 102.5 93.6 109.3 106.6 122.8October— 107.9 — — 106.lt n i . 5 98.1* 102.5 m . 9 108.8 106.9 103.3 m . 7 io9 .a 103.2 99.5 103.1 9a.a ioa .8 97.6 109.1 106.3 122.8November- 108.lt 106.6 n o . i 98.5 108.5 m . o (it) (it) 103.it 112.5 n o . o 103.9 io o .a 103.6 95.1 107.2 97.5 109.3 106.5 122.8December- 110.3 — 10 6.1* i n .7 100.1* 108.8 n 6 .5 (it) (U) 103.9 112.5 110.2 103.6 100.7 103.8 95.1 108.7 98.7 109.5 106.7 122.8
1951* Average 116.5 ______ n i* . 6 U9.lt 108.2 U 6 .0 n 5 . i U 2 .2 109.5 103.2 U 3 .9 U 5 .1 107.6 ioa .5 108.7 98.0 U 3 .0 98.5 113.6 111.7 122.8January— 113.6 --------- 112.0 U 6 .3 107.3 112.6 m . 6 n o .6 107.5 103.9 U 2 .8 U 2 .7 106.a 102.1 105.6 96.1 n o .6 99.a 109.5 106.7 122.8February- 115.9 —— - U 3 .0 U 8 .7 108.6 120.7 n o . o (i*) (it) 103.9 U 2 .8 113.9 108.0 103.7 107.0 97.9 m . 6 99.9 109.5 106.8 122.8March----- 116.2 — ll lt .o U 9 .3 108.5 116.1 n i* .o (it) (it) 103.7 U 2 .7 l i a .9 io 8 .a io a .o 107. a 97.7 113.2 101.3 110.9 108.5 122,8A pril------ 115.U , — iiS .o U 9 .0 107.9 113.9 112.7 i n . 8 107.8 103.8 n a .o U 5 .3 108.0 103.9 107.2 97.8 U 3 .2 101.2 m . o 108.6 122,8May--------- 116.U ------- - 111*. 8 U 8 .0 108.1 119.8 113.1* (it) (U) 103.6 n a . i U 6 .9 107.8 103.9 107.5 97.6 U 3 .0 101.2 m . o 108.5 122.8June-------- 116.5 . —— U 5 .0 U 8 .2 107.9 120.2 U 3 .7 (it) (it) 102.8 n a .o U 7 .3 107.7 io a .3 108.5 97.8 U 2 .9 98.9 113.1 m . i 122.8July-------- ll6 .lt — — _ 111*.8 U 9 .3 107.7 115.9 U 5 .3 112.8 109.2 102.5 11a .0 U 7 .2 107.9 io a .o 107.9 97.5 113.2 98.1 n a .o U 2 .2 122.8August-— 116.3 __—__ l i l t .8 120.6 107.5 i n . 3 U 7 .2 (U) (it) 102.5 n a .o U 6 .6 107 .a io a .3 108.5 97.3 U 3 .7 99.a n a .o 112.1 122. SSeptember 116.0 — — n 5 .o 121.2 107.3 106.5 U 9 .6 (it) (it) 102.8 n a .o U 5 .1 107.2 106.U m .3 99.8 n a .o 97.0 115.5 U 3 .9 122,8October— 117.1 - —— 115.1* 121.6 107.5 110.8 U 9 .8 112.9 n i . 5 102.9 n a .3 U 3 .8 107.6 io6 .a n i . 5 99.6 113.8 97.1 117.0 U 5 .7 122,8November- 118.6 ------- - n s . 8 120.lt 109.6 119.lt U 9 .5 (U) (it) 103.6 n s . o U 3 .7 107.7 105.7 111.3 98.6 U 3 .5 9h,U 118.8 U 7 .9 122,8December- 119.1 — U 5 .9 120.lt n o . e 125.1 U 5 .3 (it) (i*) 103.lt n s . o U 3 .8 107.6 105.6 m . o 98,6 U 3 .3 9a .o 118.8 117.9 122.8
1952* Average 118.1 ______ n 5 .5 U 8 .0 U 3 .0 127.8 109.9 n i t .2 U 6 .1 103.2 n s . 6 U 1 .5 107.1 103.6 109.1 97.0 n o .5 88.2 121.5 120.1 128,1January— 119.3 — - — U 6 .1 121.5 U 3 .5 127.1 109.9 U 3 .7 U 3 .8 103.lt 115.0 112.9 107.6 10a. 8 110.1 98,3 U 2 .0 90.a 118.3 117,9 122.8February- n 6 .lt U 5 .7 U 9 .7 n i* . o 117.7 105.9 (U) (it) 103.6 n s . o U 2 .9 107.3 io a .s 109.9 97.9 n i . 5 90.9 1X6.9 : 118.0 122.8March------ n 6.2 — U 5 .7 U 8 .7 113.3 121.0 10li.lt (it) (it) 103. a n s . o 112.7 107.2 i o a . i 109.2 98.0 n o . ? 90.1 H 9 .8 j U 9 .1 122*8A pril------ 117.1* U 5 .8 U 6 .8 U 2 .1 131.7 io 5 .o U 3 .8 Uit.i* 103.3 115.0 U 2 .7 106.9 io a .o 109.2 . 97.8 n o . 7 89.0 119.8 ; 119,1 122,8May— — U 7 .6 — U 5 .8 U 5 .6 i n . 3 136.1 10l*.6 (it) (U) 102.2 n a .6 U 2 .5 106.6 103.5 109. a 96.6 110.7 86.a 1U 9 .7 119.0 122,8June-------- 118.9 ______ n 5 .o U 7 .1 n i . i 11*0.1* 105.6 (U) (It) 102.0 115.0 m . 6 103.8 103. a 108,? 97.0 110.5 86.1 1U 9 .8 119.1 122.8July------- 120.5 — n 5 .5 U 9 .1 U 2 .2 137.5 n i . 7 U 3 .8 n S .5 102.1 n 5 .6 m . 3 107.0 io3 .a 109.0 97.1 n o . i 87.3 119.8 U 9.1 122.8August---- n 9 .5 ___ U 5 .1 121.3 132.2 125.8 111*. 2 (it) (it) 102.2 n 5 .6 n o .5 107.6 103.8 109.3 97.7 109.8 87.3 121.6 121.3 122.8September 118.3 ______ n lt.lt 121.0 113.6 118.3 115.2 (it) (it) 102.1 U 5 .7 n o . i 107.7 103.0 108.9 96.a 109.7 87.3 122.1 121.8 122.8Octobers- n 8 .lt __—__ U5.1* 118.5 113.5 121.9 U 5 .8 li lt . 8 117.9 103.0 116.5 n o .3 107.9 103.2 108.7 97.0 109.6 87.8 125.8 122.0 ia a .iNovember- n 7.8 ___—_ U 5 .6 U 3.it n a .6 127.U U 5 .1 (it) (it) 103.U 117.2 n o .a 107.8 i o 2.a 108.6 95,0 n o .a 88.2 126.0 122.3 ia a .iDee ember- n 7 .2 — n5.1* 133.1 n it .o 128.9 n i . 7 (U) (i*) 108.6 n ? .a n o .a 107.6 102.6 108.a 95.6 n o .a 88.0 126.0 122.3 ia a . i
1953* Average 115.1* n 5 .o U 6 .6 109.5 n o .2 123.2 113.1* U 9 .6 129.7 109*5 U 8 .1 n o .6 106.7 103.2 109.6 95.a U 2 .0 88.8 126.2 122.5 ia a .iJanuary— n 5 .9 n 5 .7 111*. 8 311.8 U 2 .8 126.7 109.9 U 8 .6 (it) 109.8 117. a 109.? 107.7 102.7 108.5 95.7 n o .a 88.2 126.1 i22 .a ia a . iFebruary- n 3 .7 113.2 U 5 .1 106.6 i n . i 125.3 108.5 U 8 .7 (U) ' 109.9 n 7 .a n o .5 107.7 102.8 108.9 95.6 n o .a 88.7 126.0 122.3 ia a .iMarch------ n 3 .8 113.1* U 5 .6 105.9 i n . 2 12l*.l n o .5 U 8 .6 (it) 109.8 n 7 .a n o .6 106.2 102.9 109.5 95.3 110.8 88.8 125.6 121.9 ia a . iA pril------ n i* .o U 3 .8 U 5 .7 105.9 n o .3 125.2 U 2 .1 118.6 127.3 109.7 n 7 .a n o .a 106.3 103.0 109.a 95.a n o .9 88.8 125,7 121.9 ia a .iMay——— n 5 .o lilt .9 U 6 .3 108.2 109.7 127.6 U 2 .1 U 8 .7 (it) 109.2 U 7 .0 n o .5 106.3 103.3 109.3 95.9 m . 8 39.2 125.7 121.? ia a . iJune-—— 116.7 n 6 .8 U 6 .5 n o .6 109.7 13U.3 U 2 .1 U 9 .0 (U) 108.a U 7 .0 n o .8 106.6 103.5 109.7 95.9 m . 8 89.5 126.9 123.3 ia a .iJuly— ■— n 7.2 117.lt n s .3 311.7 109.8 133.7 U 3 .8 U 9 .7 (i*) 108.1 U 8 .5 m . o 106.8 103.2 109.7 95.a m . 8 89.2 127.5 12U.0 ia a . iA u g u s t - n 6 .? n 6 .u n 6 .3 113 .2 109.1* 122.0 116.1 120.1 (U) 109.1 U 9 .0 n o .8 io 6 .a 103.3 n o . o 95.0 112.8 89.3 127.6 i2 a . i ia a . iSept ember n 6 .7 116.3 U 8 .S n it.lt 109 .U n it.3 U 8 .3 120.it (it) 109.3 U 8 .7 n o .6 io 6 .a 103.2 109.9 9a.9 112.8 89.2 127.2 123.7 ia a . iOctober— 116.1 n 5 .2 n 8.2 110.6 109.6 n i u i U 9 .0 120.9 133.8 109.6 119.2 m .3 106.9 103.6 110.0 95.5 113.3 89.5 126.8 123.2 ia a .iNovember- n luU n 3 .6 U 8 .0 107.6 109.7 115.5 n 5 .o 121.1 (1*) n o . i U 9 .2 m . o 106.9 103. a n o . 2 95.1 n 3 .a 87.6 126,2 122.5 ia a .iDee ember- n it .a n 3 .it U 8 .3 107.5 109.7 U 6 .0 U 3 .7 121.3 (it) 110.5 119.2 n o .3 106.7 103.2 110.0 9a. 8 n 3 , a 87.5 122,6 118.3 ia a .i
1951*: Average 115.U 111*. 3 U 8 .0 107.2 105.5 122.3 U 7 .1 122.2 138.2 109. a 119.2 109. u n o . o 102.8 109.0 9a. 8 U 2 .9 87.0 120.9 U 6 .6 ia 3 .oJanuary— 115.2 11 lull 118.0 109.3 109.7 118.1* U 3 .9 121.6 (it) n o . ? U 9 .a io 9 .a 109.0 103.0 109.8 9a.e n 3 .a 86.1 125.5 121.8 ia a . iFebruary- n i*.7 n 3 .6 U 8 .0 108.6 108.6 U lu3 U 5 .6 122.0 (it) 110.6 U 9 .a n o . i 109.9 103.1 109.7 95.1 n 3 .a 86.3 121.7 117.3 ia a .iMarch------ lll*.7 n s .7 U 7 .8 108.7 108.1 116.3 n i* . 8 122.2 (it) n o .a U 9 .a n o .5 n o .a 102.8 109.3 95.0 112.5 86.2 121.2 U 6 .7 ia a . iA pril------ 116.1 n 5 .2 117.8 109.8 105.9 123.8 U 6 ,0 122.1 138.1 n o .3 n 9 .a n o . i 109.9 102.6 109.a 9a.5 112.5 86.8 120.7 i i 6 .a ia2 .7May--------- 116.2 n 5 .l* U 7 .8 109.8 10lt.l 125.0 U 7 .2 122.1 (it) n o .3 118.8 109.5 n o . o 102.6 109.3 9a.3 U 2 .6 87. a 120.8 U 6 .5 ia2 .7June------- 117.5 n 6 .7 117.9 109.8 103.3 132.3 U8.1* 122.1 (it) 108.7 U 8 .8 109.5 n o . i 103.0 109.2 95.a 112.6 87.0 119.5 n a .9 ia2 .7July—---- 118.5 n 7.8 U 7 .8 109.6 103.1 136.9 120.3 122.2 (it) 108.U U 8 .7 109.1 n o . i 102.9 109.2 95.0 113.0 87.6 U 9 .7 U 5 .3 ia2 .7A u g u s t - n 6 .lt U 5.lt U 8 .0 106.8 103.1* 123.5 122.9 122.6 0*) 108.3 U 9 .0 108.6 n o .2 102.6 109.3 9 a .i U 3 .0 87. a U 8 .1 i i3 .a U 2.7Sept ember n i*.2 U 3 .0 U 7 .9 105.8 103.1 U 7 .1 U 8 .7 122.6 (it) 108.1 119.0 109.0 n o .2 102.9 108.3 95.6 U 3 .0 87.6 U 8 .0 113.2 U 2.7October— n 3.8 U 2 .5 U 8 .0 103.1 103.7 U9.1* U 8 .6 122.3 138.9 108.8 U-9.3 108.8 n o .2 102.7 108.5 95.3 n 2.a 87.5 U 8 .1 113. a ia2 .7November- 113.9 U 2 .6 U 7 .7 103.1 106.3 121.7 115.1* 122.lt (it) 109.2 119.3 109.0 n o .3 102 .a 108.3 9a.5 113.0 87.3 125.3 121.7 ia2 .7Dee ember- 113.0 n i . 7 U 9 .8 102.2 106.5 U 9 .3 U 3 .1 122. it (it) 109.0 119.3 109.0 n o .3 102. a 108.3 9a.6 U 3 .0 87.3 122.7 118.7 ia2 .7
1955* Average n 3.2 111.8 U 9 .6 100.1 105.2 125.9 U 3 .1 122.3 11*1.1 n o .5 U 9 .7 107.3 112.5 102.0 107.3 9a.3 n 3 .a 87.1 122.2 118.1 ia2 .7January— n 2 .7 n i . i t U 9 .6 101.0 106. 1* 121.5 112.1 122.1 (U) 109.1 U 9 .9 107 .a 110.2 102.6 108.3 95.1 U 2 .7 86.7 122.3 118.3 1U2.7February- n 3 .3 112.0 120.0 101.3 106.9 122.2 U 3 .2 122.2 (it) 109.0 119.9 107.2 n o .a 102.5 108.0 95.1 U 2 .7 8?.a 121 .a 117.2 U 2.7March-— n 3.o m . 6 120.0 100.1 102.8 121*.9 111*. 3 122.3 (it) 108.9 U 9 .9 106.5 m . 8 102.5 107. a 95.6 112.7 87. a 121.3 U 7 .1 ia2 .7A pril—— 113.3 n i . 9 120.2 100.7 102.1 131.6 U 0 .6 121.9 li*0.1 108.7 119.9 107.6 112.1 101,9 106.5 9a.7 U 3 .0 87.1 120.8 116.5 U 2 .7May--------- nit.it 113.2 120.0 100.3 3.05.8 137.2 n o . o 121.8 (1*) 108.7 U 9 .0 107.6 U 2 .0 101.9 106.8 9a.a U 3 .3 87.1 120.9 116.6 ia2 .7June——- 113.9 U 2 .8 U 9 .9 ! 102.3 105.6 132.9 108.8 122.0 (it) 108.5 118.8 107.9 112,0 102.0 106.8 9a.6 113.3 87.1 122.6 U 8 .6 ia 2 .?
See footnotes at end of table.
105
Digitized for FRASER http://fraser.stlouisfed.org/ Federal Reserve Bank of St. Louis
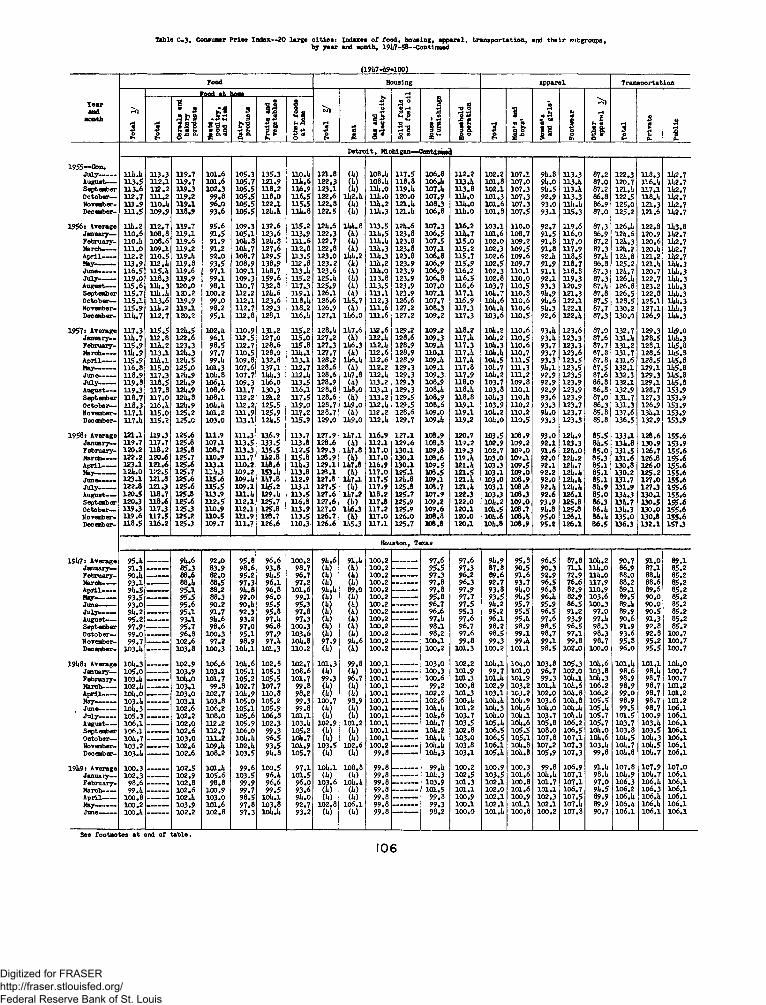
Table C-3. Consumer Prioe Index— 20 large cities: Indexes of food, housing, apparel, transportation, and their subgroupsby year and month, 191:7-58— Continued
Tearand
month
1955— Con.July—----August-----September October— November- Dee ember-
1956: Average January— February-March------A pril------May---------June--------July--------August— September October— November- Dee ember-
1957: Average January— February-March------A pril------May---------June-------July— —August-----September October— November- Dee ember-
1958: Average January— February- March— April—May---------Jun&—— July—
SeptemberOctober—November-December-
19U7: Average January— February- March— -A pril------May-----June——July--------August-----September October— November- December-
19U8: Average January— February-March------A pril------May— ------
. June-— -July—----A u g u s t - Sept ember October— November- Dee ember-
19U9: Average January— February-March------A pril------May---------June—
(19U7-U9-100)
Food Housing Apparel Transportation
To
tal
1/
To
tal
2/
Ren
t
5oiii* S
oli
d f
ue
ls
and
fue
l o
il
Hou
se-
furn
ish
ing
s
Hou
seh
old
op
era
tio
n
Tot
al
Men
's
and
bo
ys'
Wom
en's
an
d g
irls
'
Foo
twea
r
Oth
era
pp
are
l 3
/
To
tal
!
To
tal
Cer
eals
an
d b
aker
y p
rod
uct
s
i !p i D
airy
pro
du
cts
Fru
its
and
veg
eta
ble
s
Oth
er f
oo
ds
at
hom
e
Pri
va
te
Pu
bli
c
Detroit, Michigan—Continued
nu.u 113.3 119.7 101.6 105.3 135.3 110.U 121.8 (U) 108.U 117.5 106 .8 112.2 102.2 107.1 9U.8 113.3 87.2 122.3 118.3 1U2.7113.5 112.1 119.7 101.6 105.7 121.9 111:. 6 122.3 (U) 108.U 118.8 106 JU 113 .U 101.8 107.0 9U.0 113.U 87.0 120.7 116. U 1U2.7113.6 112.2 319.3 102.3 105.5 118.2 116.9 123.1 (U) 11U.0 119 .U 107.U 113.8 102.1 107.3 9U.5 113 .U 87.2 121.U 117.1 1U2.7112.7 111.2 119*2 99.8 105.5 118.0 116.5 122.6 1U2.U 11U.0 120.0 107.9 11U.0 101.3 107.3 92.9 113.3 86.3 122.5 118.U 1U2.7111.9 110.1: 119.1 96.0 105.5 122.1 115.5 122.8 (U) 111:.2 121.U 108.3 11U.0 101.6 107.3 93.0 nU.U 86.9 125.0 121.3 1U2.7111.5 109.9 H 8.9 93.6 105.5 12U.U 11U.8 122.5 (U) 11U.3 121. U 1 0 6 .8 11U.0 101.8 107.5 9 3 a 115.3 87.0 125.2 121.6 1U2.7
lli:. 2 312.7 119.7 95.6 109.3 132.6 115.2 12U.6 1UU.8 113.5 12U.6 107.3 116.2 103.1 110.0 92.7 119.6 87.3 126.U 122.8 1U3.8110.6 108.8 119.1 91.5 105.1 123.6 113.9 122.3 (U) 11U.5 123.8 106.5 11U.7 101.6 108.7 91.5 116.0 86.9 12U.6 120.9 1U2.7110.U 108.6 119.6 91.9 ioU.8 12U.8 H I .6 122.7 (U) nU.U 123.8 107.5 115.0 102.0 109.2 91.8 117.0 87.2 12U.3 120.6 1U2.7111-0 109.1 119.2 91.2 10U.7 127.6 112.8 122.8 (U) 11U.3 123.8 107J. 115.2 102.3 109.5 91.8 117.9 87.3 12U.2 120.U 1U2.7112.2 110.5 119.U 92.0 108.7 129.5 113.5 123.0 1UU.2 llU.3 123.8 1 06 .8 115.7 102.6 109.6 92 .U 118.5 87 .U 12U.8 121.2 1U2.7113.9 112.2: 119.8 93.5 108.9 138.9 112.8 123.2 (U) 11U. 2 123.9 106.9 115.9 102.5 109.7 91.9 118.7 86.8 125.2 121.U 1UU.3116.5 115.U 119.6 97.1 109.1 1U8.7 113.U 123.6 (U) 11U.0 123.9 106.9 116.2 102.3 110.1 91.1 118.8 87.3 12U.7 120.7 1UU.3119.0 118.3 119.9 99.1 109.3 159.6 115.2 125. U (U) 113.8 123.9 106 .8 116.5 102.8 110.0 92.1 119.3 87.3 126.U 122.7 1UU.3115.6 Hi:. 3 120.0 98.1 110.7 132.8 U 7.3 125.9 (U) 113.5 123.9 107.0 116.6 103.7 110.5 93.3 120.9 87.U 126.8 123.2 1UU.3115.7 uU.U 120.2 100.2 112.2 12U.6 119.1 126.1 (U) 113.1 123.9 107.1 117.1 10U.7 110.8 9U.9 121.3 87.8 126.5 122.8 1UU.3115.1 113.6 119.9 99.0 112.1 123.6 118.U 126.6 1U5.7 112.3 126.6 107.7 116.9 10U.6 n o .6 9U.6 122.1 87.5 128.5 125.1 1UU.3115.9 im .2 119.1 98.2 112.7 129.3 118.2 126.9 (U) 111.6 127.2 108.3 117.3 IOU.U 110.6 9U.3 122.1 87.7 130.2 127.1 1UU.311U.7 112.7 120.2 95.1 112.8 128.1 116.U 127.1 1U6.0 H I .6 127.2 109.2 U 7.3 103.6 n o .5 92.6 122.U 87.3 130.0 126.9 1UU.3
117.3 115.5 12U.5 102.U 110.9 131.2 115.2 128.U 1U7.6 H 2.6 129.2 109.2 118.2 10U.2 110.6 93 .U 123.6 87.0 132.7 129.3 1U9.0llU .7 132.8 122.6 96.1 112.5 127.0 115.0 127.2 (U) 112 .U 128.6 109.3 117.U 10U.2 n o .5 93.U 123.3 87.6 131.U 128.5 1UU.3115.9 llU .2 123.3 98.5 112.7 128.6 115.8 127.3 1U6.3 112. U 128.9 109.U 117.3 10U.3 110.6 93.7 123.3 87.7 131.2 128.1 1U5.811U.9 113.1 12U.3 97.7 110.5 128.0 11U.1 127.7 (U) 112.6 128.9 110.1 317.U ioU.U 110.7 93.7 123.6 87.8 131.7 128.6 1U5.9115.9 im . i 12l:.5 99.U 109.8 132.8 113.1 128.2 1U6.U 112.6 128.9 109 .U 117.U ioU.5 m.5 93.3 123.5 87.8 131.6 128.5 1U5.81 1 6 .8 n 5 .o 125.0 101.3 107.6 137.1 112.7 128.6 (U) 112.2 129.3 109.1 117.8 10U.7 111.3 9U.1 123.5 87.5 132.1 129.1 1U5.8118.9 117.3 12U.9 10U.8 107.7 1UU.3 112. U 128.6 1U7.8 112.U 129.3 109.3 117.9 10U.2 111.2 92.9 123.5 87.6 132.3 129.3 1U5.8119.3 118.5 12U.9 106 .1 109.3 1U6.0 113.5 128.9 (U) 113.2 129.3 108.9 118.0 103.7 109.8 92.9 123.9 86.8 132.1 129.1 1U5.9119.3 117.8 12U.9 1 0 8 .6 111.7 130.3 116 .1 128.8 1U8.0 113.1 129.3 108.U 118.U 103.8 110.1 92.9 123.9 86.8 132.9 128.7 153.9118.7 117.0 12U* 8 108.1 112.2 12U.2 117.5 128.6 (U) 113.2 129.5 108.9 118.8 10U.3 110.U 93.6 123.9 87.0 131.7 127.3 153.9118.3 116.2: 122:. 9 10U.U 112.2 125.5 119.0 128.7 11:9.0 112. U 129.5 108.6 119.1 103.9 110.2 93.3 123.7 86.3 131.3 126.9 153.9117.1 115.0 125.2 101.2 111.9 125.9 117.2 128.7 (U) 132.2 128.6 109.0 119.1 10U.2 110.2 9U.0 123.7 85.8 137.6 13U.1 153.9117 .U 115.2 125.0 103.0 113.1 12U.5 115.9 129.0 1U9.0 112.U 129.7 109 .U 119.2 10U.0 u o .5 93.3 123.3 85.8 136.5 132.9 153.9
121.1 119.3 125.6 111.9 111.3 13.6.9 113.7 127.9 1U7.1 116.9 127.1 108.9 120.7 103.5 108.9 93.0 12U.9 85.5 133.1 128.6 155.6119.7 117.7 125.8 107.1 113.5 133.5 113.8 128.6 (U) 112.1 129.6 108.8 119.2 102.9 109.2 92.1 123.3 8U.5 13U.8 130.9 153.9120.2 118.2 125.8 108.7 113.3 135.5 112.5 129.3 1U7.8 117.0 130.1 109.8 119.3 102.7 109.0 91.6 12U.0 85.0 131.5 126.7 155.6122.2 120.6 125.7 110.9 111.7 1U2.8 115.8 128.9 (U) 117.0 130.1 108.6 119. U 103.0 109.1 92.0 12U.2 85.3 131.6 126.8 155.6123.1 121.6 125.6 U 3 .1 110.2 1U8.6 11U.3 129.1 1U7.8 116.9 130.1 109.5 121.U 103.3 109.5 92.1 12U.7 85.1 130.8 126.0 155.612lt.O 122.5 125.7 11U.3 109.2 153.U 113.8 128.1 (U) 117.0 125.1 108.5 121.5 103.1 109.0 92.2 12U.U 85.1 130.2 125.2 155.6123.1 121.8 125.6 115.6 109 .U 1U7.8 112.9 127.8 1U7J. 117.5 12U.8 109.1 121. U 103.0 106.9 92.0 12U.U 85.1 131.7 127.0 155.6122.8 121.3 125.6 U 5 .5 109.1 1U5.2 113.1 127.5 (U) 117.9 125.8 108.7 121.U 103.1 108.8 92 .U 12U.U 8U.9 131.9 127.3 155.6120.5 118.7 125.8 113.9 m . u 129. U 113.5 127.6 1U7.2 118.2 125.7 107.9 122.3 103.3 108.3 92.6 126.1 85.0 13U.3 130.1 155.6120.3 118.6 125.6 112.5 112.1 125.7 116.8 127.6 (U) 117.8 125.9 109.2 122.0 10U.2 109.0 93.9 125.8 86.3 13U.7 130.5 155.6119.3 117.3 125.3 110.9 112.1 125.8 113.9 127.0 1U6.3 117.2 125.9 109.6 120.1 10U.5 108.7 9U.8 125.8 86.U 13U.3 130.0 155.6119.6 117.5 125.2 110.5 111.9 128.7 113.5 126.7 (U) 117.0 126.0 108.8 120.0 10U.6 108.U 95.0 126.1 86. U 135.0 130.8 155.6118.5 116.2 125.3 109.7 111.7 126.6 110.3 126.6 1U5.3 117.1 125.7 108.8 120.1 10U.8 108.9 95.2 126.1 86.5 136.3 132.1 157.3
Houston, Texas
95.U 9U.6 92.0 95.8 9 6 .6 100.2 9U.6 91.U 100.2 _________ 97.6 97.6 9U.9 95.8 96.5 87.8 10U.2 90.7 91.0 89.191.3 ______ _ 85.3 83.9 98.6 93.8 98.7 (U) (U) 100.2 -------— 95.5 97.3 87.8 90.5 90.3 71.1 11U.0 86.9 87.1 85.290 .U ______ _ 88.6 82.0 95.2 9U.5 96.7 (U) (U) 100.2 _________ 97.3 96.2 89.6 91.6 92.9 72.9 11U.0 88.0 88 .U 85.293.1 88.U 88.5 97.3 96.1 97.2 (U) (U) 100.2 — — ----- 97.8 96.3 92.7 93.7 96.5 76.6 117.9 88.2 88.6 85.29U.5 95.1 88.2 9U.8 96.8 101.6 9U.U 89.0 100.2 _________ 97.8 97.9 93.8 9U.0 96.8 82.9 110.9 89.1 89.6 85.293.5 ___ 95.5 88.3 92.0 96.0 99.1 (U) (U) 100.2 _________ 95.8 97.7 93.5 9U.5 96.U 82.9 103.6 89.5 90.0 85.293.0 ________ 95.6 90.2 90 .U 95.5 95.3 (U) (U) 100.2 ------ ----- 96.7 97.5 9U.2 95.7 95.9 86.5 100.3 89 .U 90.0 85.29U.2 95.1 91.7 92.3 95.8 97.8 (U) (U) 100.2 _________ 96.6 95.3 95.2 95.5 96.5 91.2 97.0 89.9 90.5 85.295.2 ________ 93.1 9U.6 93.2 97.U 97.3 (U) (U) 100.2 97.U 97.6 96.1 95.U 97.6 93.9 97.U 90.6 91.3 85.297.9 ________ 95.7 98.6 97.0 9 6.8 100.3 (U) (U) 100.2 98.1 96.7 98.2 98.9 98.5 96.5 98.3 91.9 92.8 85.299.0 ________ 96.8 100.3 95.1 97.9 103.6 (U) (U) 100.2 -------- — 98.2 97.6 98.5 99.1 98.7 97.1 98.3 93.6 92.8 100.799.7 ________ 102.6 97.2 98.9 97 .U 10U.8 97.9 9U.6 100.2 — 100.1 99.8 99.3 99 .U 99.1 99.8 98.7 95.3 95.2 100.7
103 .U — 103.8 100.3 10U.1 101.3 110.2 (U) (U) 100.2 100.2 101.3 100.2 101.1 98.5 102.0 100.0 96.0 95.5 100.7
10U.3 ______ _ 102.9 1 06 .6 10U.6 102.8 102.7 101.3 99.8 100.1 103.0 102.2 10U.1 10U.0 103.8 105.3 10U.6 101.U 101.1 IOU.Oio5.o ______ _ 103.9 103.2 105.1 105.3 108.6 (U) (U) 100.1 -------- — 100.3 101.9 99.7 101.0 96.7 102.0 103.8 98.6 98.U 100.7103 .U ______ _ IOU.0 101.7 105.2 105.5 101.7 99.3 96.7 100.1 ------ ----- 100.6 101.3 101.U 101.9 99.3 10U.1 10U.3 98.9 98.7 100.7102.1: ________ 103.1 99.8 102.7 107.7 99.8 (U) (U) 100.1 99.2 100.8 102.9 103.2 101.U 10U.6 1 06 .2 98.9 98.7 101.2IOU.O 103.0 102.7 10U.9 110.8 98.2 <U) (U) 100.1 — ------ 102.2 101.3 103.1 103.2 102.0 10U.8 106.2 99.0 98.7 101.2103.U — 103.1 103.8 105.0 105.2 99.3 100.7 98.9 100.1 ______ — 102.6 100.U IOU.U 10U.9 103.6 10U.8 105.5 98.9 98.7 101.210U.3 ____ 102.6 1 06.2 105.1 105.9 99.8 (U) (U) 100.1 — — 10U.U 101.2 10U.3 10U.6 IOU.0 IOU.U 105.U 99.5 98.7 1 06.1
105.3 102.2 108.0 105.6 106.8 101.1 (U) (U) 100.1 ______ — 10U.6 103.7 IOU.0 loU .i 103.7 IOU.U 105.7 101.5 100.9 1 06 .1106 .1 — — 102.0 112.2 105.9 102.3 103.U 102.9 101.2 100.1 10U.7 103.5 105.U 10U.6 105.8 1 06.2 105.7 103.7 103. U 1 06 .1106 .1 ____ 102.6 112.7 1 06 .0 99.3 105.2 (U) (U) 100.1 ______ — 10U.2 102.8 106.5 105.5 108.0 106.5 ioU.o 103 .8 103.5 1 06 .110U.7 ___ 103.0 111.2 10U.U 96.? 10U.7 (U) (U) 100.1 _________ loU.U 103.0 106.5 105.1 107.8 107.1 10U.6 10U.5 10U.3 io 6 a103.2 ___ 102.6 109.U 102. U 93.5 10U.9 103.5 102.6 100.2 _________ ioU.U 103.8 1 0 6 a ioU.8 107.2 107.3 103.U 10U.7 10U.5 1 06 .1
103.U — 102.6 108.2 103.5 9U.8 105.7 (U) (U) 99.8 — 10U.3 103.1 105.U ioU.8 105.9 107.3 99.8 10U.8 10U.7 106 .1
100.3 102.5 101.U 99.6 100.5 97.1 loU .i 108.8 99.8 ___ 99.U 100.2 100.9 100.3 99.8 106.9 91.U 107.8 107.9 107.0102.3 ___ 102.9 105.6 103.5 96.U 101.5 (U) (U) 99.8 _____ ____ 10U.3 102.5 103.5 101.6 IOU.U 107.1 98.U 10U.9 10U.7 1 0 6 .1
98.6 ______ _ 102.8 98.8 99.9 96.6 96.0 103.6 10U.U 99.8 -------- - 103.9 101.3 102.1 100.8 101.7 107.1 97.0 106.3 1 0 6 .U 106 .1
99.U ___ 102.6 100.9 99.7 99.5 93.6 (U) (U) 99.8 - _______ l d . 5 101.1 102.0 101.6 101.1 106.7 9U.5 106.2 106.3 106 .1100.8 ___ 102 .U 103.0 98.5 10U.1 9U.0 (U) (U) 99.8 99.8 100.9 102.1 100.9 102.3 107.5 89.9 106.U 1 06 .U 106 .1100.2 ____ 103.9 101.6 97.8 103.8 92.7 102.8 1 06 .1 99.8 — 99.3 100.1 102.1 101.1 102.1 107 .U 89.9 106.U 1 06 .U 1 06 .1100 .U 102.2 102.8 97.3 10UJ: 93.2 (U) (U) 99.8 98.2 100.0 loi.U 100.8 100.2 107.8 90.7 1 06 .1 106 .1 106 .1
See footnotes at end of table.
106
Digitized for FRASER http://fraser.stlouisfed.org/ Federal Reserve Bank of St. Louis
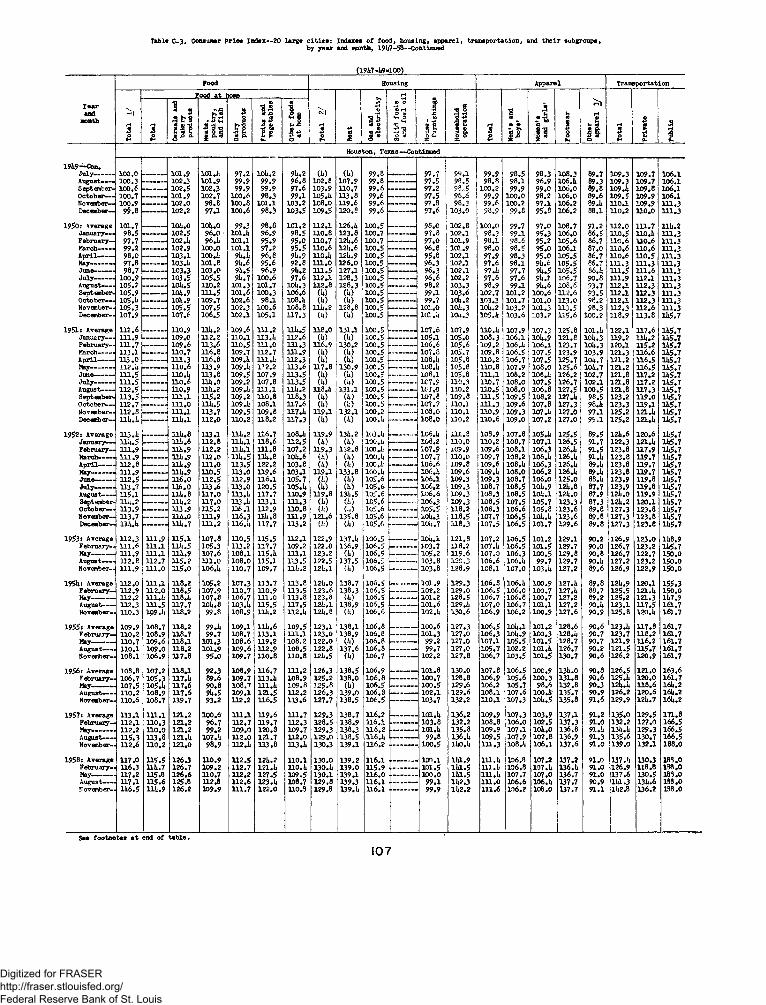
Table C-3. Consumer Priee Index—20 large c i t ie s : Indexes o f food , housing, apparel, transportation, and th eir subgroups;by year and month, 1917-58—Continued
(191*7-1*9-100)
Tearand
month
Food Housing Apparel Transportation
Tota
l 1/
___Food at lose__________________
30E-i Rent
Oas
and
elec
tric
ity
Solid
fue
ls
and
fuel
oil
Hous
e-
furn
ishi
ngs
Hou
seho
ldop
erat
ion
1To
tal
Men*
s an
d 1 b
oys'
1 ------
------
------
----
Wom
en's
and
girl
s'I---
------
------
------
-:
Foot
wear
Othe
rap
pare
l 3/
Tota
l
Priv
ate
Publ
ic
Tota
l
Cere
als
and
bake
ry
prod
ucts
Mea
ts,
poul
try,
an
d fi
sh
Dairy
prod
ucts
Frui
ts a
nd
vege
tabl
es
Othe
r fo
ods
at h
ome
Houston, Texas—Continued
19i*9—Con.July-------- 100.0 101.9 101.l> 97.2 10U.2 9U.2 (U) (U) 99.8 97.7 99.1 99.9 98.5 98.3 108.3 89.7 109.3 109.7 106.1August-— 100.3 — 102.3 101.9 99.9 99.9 96.8 102.8 107.9 99.8 97.5 98.5 98.8 98.1 96.9 106.lt 89.3 109.3 109.7 106.1September- 100.6 --------- 102.5 102.3 99.9 99.9 97.6 103.9 n o .7 99.6 — ------- 97.2 98,5 100.2 99.9 99.0 106.0 89.8 109.lt 109.8 106.1October— 100.7 ______ 101.9 102.7 100.6 98.3 99.1 105 .ii 113.8 99.6 — 97.5 98*6 99.9 100.0 98.2 106.0 89.6 109.5 109.9 106.1November— 100.9 102.0 98.8 100.8 101.1 103.2 108.0 n 9 .6 99.6 — ----- 97.8 98.3 i 99.6 100.2 97.1 106.2 89 .li n o . i 109.9 m .3December— 9$.8 102.2 97.1 100.6 98.3 103.5 109.5 120.8 99.6 — 97.6 103.0 98.9 99.8 95.8 106.2 88.1 n o .2 n o .o m .3
1950: Average 101.7 lOli.O 10U.0 99.3 98.8 101.2 n 2. i 126.li 100.5 ______ 98.0 102.8 100.0 99.7 97.0 108.7 91.2 112.0 m .7 llii.2January— 98.5 _—. . . . 102.5 96.0 101 .li 96.9 98.5 n o .8 123.8 100.7 97.8 102,1 98.3 99.1 95.3 106.0 86.5 u o .5 n o.li m .3February— 97.7 102.Ii 96.it 101.1 95.9 95.0 n o .7 12U.6 100.7 ----------- 97.0 101.9 98.1 98,6 95.2 105.6 86.7 n o .6 n o .6 m .3March—— 99.2 102.9 100.0 101.1 97.2 95.5 110.6 12li.6 100.5 -------- __ 96.8 101.9 98.0 98.5 95.0 106.1 87.0 n o .6 n o .6 m .3April------- 98.0 ______ 103.1 100.ii 9li.li 96.8 9li.9 no.li 12li.9 100.5 -— 95.8 102.1 97.9 98.3 95.0 105.5 86.7 n o .6 n o .5 m .3May— —— 97.8 -------- - 103.ii 101.8 9li.6 95.6 92.8 m . o 126.0 100.5 -------- — 96.3 102.1 97.6 98.1 9l1.6 105.5 86.7 111.3 111.3 m .3June-------- 98.7 --------- 103.3 103.0 9li.5 96.9 9h,2 m .5 127.1 100.5 — 96.3 102.1 97.ii 97.7 9U.5 105.5 86.1; m .5 n i .6 m .3July—— - 100.9 -----—- 103.5 105.5 9li.7 100.6 97.6 n 2. i 128.3 100.5 96.6 102.2 97.6 97.6 9U.1 106,7 90.8 m .9 n 2. i m .3August----- 105.2 — ----- 10ii.5 110.2 101.3 101.7 10li.3 n 2 .8 128.3 100.5 ----------- 98.2 103.3 98.9 99 .1 9U.6 108.6 93.7 112.1 n 2 .3 m .3September- 105.9 — loll.9 m .5 101.6 100.3 106.6 (U) (li) 100.5 ----- ____ 99.1 103.6 102.7 101.2 100.6 n 2 .6 93.5 n 2. i 112.3 m .3October— io5.li 10U.9 109.7 102.6 98.1 108.li <fr> Oi) 100.5 —-------- 99.7 lOli.2 103.3 101.7 101.0 n 3.o 98.2 n 2. i 112.3 m .3November— 105.3 — 105.5 107.5 102.3 100.6 108.8 llii.2 128.8 100.5 —----- — 101.0 IOU.3 10l;.2 103.2 101.3 113.5 98.3 n 2 .3 n 2.6 m .3December— 107.9 — 107.6 106.5 102.1 105.1 U7.3 (h) Oi) 100.5 — 101.ii lQli.3 105.ii 103.6 103.2 115.6 100.2 118.9 113.8 1U5.7
193>lt Average 112.6 110.9 llii.2 109.6 m .2 n ii.5 n 8 .o 131.1 100.5 .. 107.6 107.9 n o .i; 107.9 107.3 125.8 101.ii 122.1 n 7 .6 1U5.7January— 111.9 — 1.09.0 112.2 n o . i 113. ii 112.6 (h) (ii) 100.5 105.1 105.0 108.3 106.1 10ii.9 121.8 10li.3 U9.2 11U.2 11*5.7February— 111.7 —------- 109.6 n 3 .6 n o .5 m . o m .3 n 6 .9 130.2 100.5 ----------- 106.6 105.6 109.2 106.li 106.1 123.7 lOli.3 120.1 n 5.2 lii5.7March------- 113.1 110.7 n 6 .8 109.7 112.7 i n . 9 (li) (ii) 100.5 ----------- 107.8 105.7 109.8 106.5 107.5 123.9 103.9 121.3 n 6 .6 U5.7i n i 1lA.fi m ,1. (i,) ((,) 100.5 108 .ii 105.8 n o .2 106.7 IO7.5 125.7 lOli. 7 121.2 n 6 .5 1U5.7MAy---------- 112.lt ______ 110.6 113.9 109.1; 13 2.2 n3.'6 n 7 .8 130.9 ipo.5 i_ _ _ _ _ _ _ 108.li 105.8 110.8 107.9 ioe)o 125)6 10U.7 12ll2 116)5 1U5!7
111.5 nn,li 111,8 109,5 107,9 n % 5 (I,) 100,5 108.1 105.8 111.1 108.2 IO8.I1 126.2 102.7 121.8 n 7 .2 11,5.7July-------- 111.5 ______ n o .6 n ii.o 109.2 107.8 n 3 .5 (U) 100.5 1C7.9 110.3 110.7 108.0 107.5 126.7 102.1 121.8 n 7 .2 Ui5.7August-— 112.5 —------ 110.9 n ii.2 109.1i i n . i n i i . 2 n8 .ii 131.1 100.5 167,0 110.2 n o .5 108.0 106.8 127.5 100.5 121.8 n 7 .3 11*5.7September- 113.5 ----- — 121.1 115.2 109.2 n o . 8 n 8 .3 (W (U) 100,5 ----------- 107,8 109.8 m .5 109.5 108.2 127.U 98.5 123.2 119.0 1U5.7October— 112.7 — ----- 121.0 n ii. 5 109.lt 108.1 n ? .6 (i;) (l) ioo,5 — -— 107.7 n o . i m .3 109.6 107.8 127.3 98.li 123.3 n 9 . i 11*5.7November— 112. e ______ 111.1 133.7 109.5 109.8 n 7.i1 n 9 . i 132.1 100.2 108.0 110.1 110.9 109.3 107.ii 127.0 97.1 125.2 121.lt 1U5.7December- n li.li — l l i l . l 112.0 n o . 2 n 8.2 n 7 .3 <U) Oi) 100,1; ----------- 108.0 n o .2 110.6 109.0 107.2 127.0 95.1 125.2 121.U Ui5.7
1952! Average 113. 1* liU . 8 113.1 llii.2 n 6 .7 108.lt n 9 .9 13ii.2 103.ii _ _ _____ 106.li m .8 108.9 107.8 105.ii 125.5 89.5 12it.6 120.6 lfr5.7January— nli.5 ___----- llii.6 n 2.8 n u .1 n 8 .6 n 2 .5 (U) (li) 100.il — —— .... 106.2 110.0 110.2 108.7 107.1 126.5 91.7 122.3 121.1| ll»5.7February— 111.9 — lib . 9 112.2 n u .1 m .8 107.2 n 9 .3 132.8 100.i1 — — 107.9 109.9 109.6 108.1 106.3 126.1i 91.5 123.8 n 7 .9 lfr5.7March— — 111.9 11), ,0 112 .0 n i i .5 33ii.8 10li. 6 (ii) (li) ioo.it 107*7 110.0 109,7 108.2 106.ii 126 .li 91 .li 123.8 U9.7 lfr5.7April------- 112.8 ______ nii .9 m . o 113.5 122.2 103.8 (li) (U) 100, k 106.6 109.8 109.6 108.li 106.3 126.ii 89.ii 123.8 n 9 .7 XU5.7May---------- 111.9 _____ n.ii.9 n o .5 n 3 .o n 9 .6 103.1 n 9 . i 133.8 100.il 106,1; 109.6 109. ii 108.0 106.2 126.li 89.ii 123.8 n 9 .7 11*5.7
U 2.5 116.0 112.5 112.9 116.1 105.7 (it) (li) 105.6 106.1 109.3 109.3 108.7 106.0 125.0 88.li 123*9 119.8 Ui5.7July-------- 113.7 ______ 116.0 133.6 n 3 .o 120.5 io5.li (U) (U) 105.6 _____ — 106.2 109.3 108.7 108.5 10U.9 12U.8 87.7 123.9 n 9.8 11*5.7A u g u s t - 115.1 liU. 8 117.0 n 3.i1 117.7 110.9 n 9 .s 13)4.5 105.6 — _—_ 106.6 109.3 108.3 108.5 ioii.1 12U.0 87.9 12li.0 n 9 .9 U5.7Sept ember- 111;. 2 . . . . — n ii.2 n 7 .o n 3 .l1 n 3 . i m .3 ( h ) 00 105.6 X06.3 109.3 108.5 107.5 105.7 123.3 87.3 j 12it.2 120.1 1U5.7October— 113.9 n 3 .9 n 5 .2 136.1 U2.9 n o .8 (ii) Oi) 105.6 ...— _—_ 105.5 n 8.2 108.3 106.6 105.8 123.6 89.8 1127.3 123.8 11*5.7November— 113.7 — ----- llii.O 111.9 n 6 .3 n ii. 8 i n . 9 121.6 135.8 105.6 • iofr.3 U 8.5 107.7 106.5 10li.il 123.6 89.8 127.3 123.8 1U5.7December- liU.)* — liU .7 111.2 n 6 .ii 117.7 n 3.2 (ii) Oi) 105,6 .— lOii.,7 n 8 .3 107.5 106.5 101.7 129.6 89.8 127.3 123.8 11*5.7
1953: Average 112.3 111.9 n 5 . i 107.8 n o .5 115.5 n 2. i 122.9 137. ii 106.5 ______ _ lOli.l 121,8 107.2 106.5 101.2 129.1 90.2 126.9 123.0 lii8.9February— 111.6 111.1 n ii .5 105.3 113.2 n 7 .7 109.2 122,0 136.9. 106.5 — 103.7 U8.2 107.li 106.5 101.5 129.7 90.0 126.7 123.2 11*5.7May---------- 111.9 111.1 n li.9 107.6 108.1 ll5.1i m . i 123.2 Oi) 106.5 -------- 105.2 n 9 .6 107.0 106.3 100.5 129.8 90.8 126.7 122.7 150.0August----- 112.8 112.7 125.2 m .o 108.0 n 5 . i 113.5 122.5 137.5 106.5 --------- 103.8 120.3 106.6 106.li 99.7 129.7 90.lt 127.2 123.2 150.0November- 111.9 111.0 n 5 .o 106.it 110.7 109.7 n ii. 2 12I1.1 00 106.5 — 103.8 128.9 108.1 107.0 103.ii 127.2 89.6 126.9 122.9 150.0
1951*: Average 112.0 111.1 128.2 105.2 107.3 113.7 n 3 .e 12U.0 138.7 106.5 101,9 129.3 106.8 106.ii 100.9 127.il 89.8 12 li.9 120.1 155.3February— 112.9 112.0 228.5 107.9 n o .7 n o .9 n 3 .5 123.6 138.3 106.5 --------- - 102.2 129.0 106.5 106.0 100.7 127.ii 88.7 125.5 121.U i5o.oMay---------- 112.2 l l l . i i ll8 .il 107.8 106.7 m . o 113.8 123.8 (ii) 106.5 ------ .---- 101.2 128.5 106.7 106.8 100.7 127.2 89.2 125.2 121.3 1U7.9August----- 112.3 111.5 117.7 10li. 8 103. U n 5 .5 n 7 .5 12I1.1 138.9 106.5 ------ ___ 101.6 129.1i 107.0 106.7 101.1 127.2 90.it 123.1 n 7 .5 161.7November- 110.3 109. ii n 8.2 99.8 108.9 n i i .2 112 .u 12U.8 Ui) 106.6 — 102.U 130.6 106.9 106.2 100.9 127.6 90.9 125.8 120.lt 161.7
1955: Average 109.9 108.7 128.2 99.11 109.1 llii.6 109.5 123.1 138.1 106.8 ____ 100.6 127.3 106.5 lOii.1 101.2 128.6 90.6 123.lt n 7 .8 161.7February— 110.2 108.9 118.7 99.7 IO8.7 n 3 . i m . i 123.0 138.9 106.8 --------- 101.3 127.0 106.3 lOli, 9 100.3 128.ii 90.7 123.7 118.2 161.7May - - n n ,7 109.6 128.1 101.3 108.6 119.2 108.2 122.0 (ii) 106.8 99.2 127.0 107.1 105.5 101.5 128.7 90.7 121.9 n 6.2 161.7August— 110.1 109.0 118.2 101.9 109.6 n 2.9 108.5 122.8 137.6 106.8 ______ _ 99.7 127.0 105.7 102.2 101.li 126.7 90.2 121.5 n 5 .7 161.7November- 108.1 106.9 n7.8 95.0 109.7 n o .8 n o .8 12U.5 Oi) 106.7 102.2 127.8 106.7 103.5 101.5 130.7 90.6 126.2 120,9 161.7
1956: Average 108.8 107.2 118.1 92.3 108.9 116.7 m .2 126.3 138.5 106.9 _____ _ 101.8 130.0 107.8 106.5 100.9 13U.0 90.8 126.5 121.0 163.6February— 106.7 105.3 117 .U 89.6 109.7 n3.U 108.9 125.2 138.0 106.8 _____ 100.7 128.8 106.9 105.6 100.3 131.8 90.6 125.U 120.0 161.7May— —— 107.5 105.1* n 7.6 90.8 108.7 n i . i i 109.8 125.8 00 106.5 --------- - 100.5 129.6 106.2 105.7 98.6 132.8 90.3 12lt.it n 8 .6 I6I1.2August----- 110.2 108.9 117.6 9U.5 109.1 121.5 n 2.2 126.3 139.0 106.8 _______ 102.1 129.6 108.1 107.6 100.fr 135.7 90.9 126.2 120.6 l6l*.2November— 110.6 108.7 n 9 .7 93.2 112.2 n 6 .5 133.6 127.7 138.5 106.5 — 103.7 132.2 n o . i 107.3 ioli.5 135.8 91.6 129.9 12U.7 16U.2
1957: Average 113.1 111.1 121.2 100.6 111.1 U 9.6 m .7 129.3 138.7 n 6.2 ______ _ 101.1| 136.2 109.9 107.3 103.9 137.1 91.2 135.0 129.5 171.8February— 112.1 110.3 121.2 96.7 n 2 .7 n 9 .7 n 2.3 128.5 138.9 116.1 103.8 132.2 108.8 106.0 102.5 137.3 91.0 132.2 127.0 166.5May---------- 112.2 n o .o 121.2 99.2 109.0 120.8 109.7 129.3 138.3 116.2 . . . —___ 101.U 135.8 109.9 107.1 lOli.O 136.8 91.it 13it.lt 129.3 166.5August----- 115.3 113.8 121.U 107.U 112.0 121.7 n 2.o 129.0 138.5 116.u ------ --- 99.8 136.li 109.5 107.9 102.8 136.9 91.3 135.6 130.7 166.5November— 112.6 110.2 121.0 98.9 n 2.ii 113.8 n 3.l1 130.3 139.1 n 6.2 — 100.5 1I10.U m .3 108,)i 106.1 137.6 91.0 139.0 132.1 188.0
1958: Average 117.0 115.5 126.3 110.9 U 2.5 121l.2 n o . i 130.0 139.2 116.1 _____ 100.1 n a .9 l l l . i i 106.8 107.2 137.2 91.0 137. it 130.3 188.0February— 116.3 HU.7 126.7 109.2 112.7 121.il n o .u 130.U 139.0 n 5 .9 ------ 101.5 H11.5 U l.l. 106.8 107. U 136.U 91.0 126.9 118.8 188.0May---------- 117.2 115.8 126.6 110.7 112.2 127.5 109.5 130.1 139.1 116.0 ----- 100.0 m.5 U l.u 107.7 107.0 136.7 91.0 137.6 130.5 188.0August-— 117.1 115.6 125.8 112.8 112.6 123.U 108.7 129.8 139.3 116.1 --- — 99.1 lli2.3 m . o 106.6 106.U 337.7 90.9 liil.3 13lt.6 338.0November— 116.5 11U.9 126.2 109.9 111.7 122.0 n o.9 129.8 139.ii 116.1 • 99.9 1)42.2 111.6 106.2 108.0 137.7 91.1 1J;2.8 136.2 188.0
See footnotes at end of table.
107
Digitized for FRASER http://fraser.stlouisfed.org/ Federal Reserve Bank of St. Louis

Table C-3. Consumer Price Index—20 large c i t ie s : Indexes o f food , housing, apparel, transportation, and th e ir subgroups,by year and month, 191x7-58—Continued
108
Digitized for FRASER http://fraser.stlouisfed.org/ Federal Reserve Bank of St. Louis

Table C-3. Consumer P rice Index—20 large c it ie s : Indexes o f food, housing, a p p arel, t ra n s p o rta tio n , and t h e i r subgroups,by year and month, 19h7-58—Continued
(19U7-U9-100)
Housing Apparel T ransportation
Yearand
month
___ Food a t ioroe
To
tal
Ce
rea
ls
and
b
ak
ery
p
rod
uc
ts
Mea
ts,
po
ult
ry,
and
fis
h
Da
iry
pro
du
cts
Fru
its
an
d
ve
ge
tab
les
« 1Ih X!
a s
rH$
rt O
3 -S J8 3
n f i
19h7—Con.Ju ly—— 9h.3 —----- 9h .9 90 J , 96.2 9 3 .0 1 00 .0 9h .8 9 1 .6August— 9 5 .0 9 5 .2 9 2 .5 96.8 9 2 .1 101.7 (h ) (h )September 9 9.3 -------- 96.h 9 9 .8 9 9 .9 96.6 10h .2 (h ) (h )October— 9 8 .2 9 6 .8 9 7 .3 9 7 .6 9 6 .0 I 0 h .5 (h ) 0 *)November- 1 0 0 .5 — 1 03 .9 9 8 .0 1 0 0 .5 9 8 .8 io h .9 98.2 96 .2December- 1 02 .7 -------- • 10h .7 9 8 .1 1 02 .2 1 0 2 .6 109 .3 (1*) (h )
19h8t Average 1 0 3 .h _____ 1 03 .6 1 05 .6 1 05 .7 1 00 .2 1 0 2 .2 1 0 1 .3 1 00 .7January— 1 03 .2 — — 10h.8 1 00 .5 1 0 2 .h 10h .8 lOh.h (h ) (h )February- 1 0 2 .6 _____ lOh.O 9 7 .0 1 05 .7 1 07 .7 9 8 .8 1 0 0 .1 9 7 .9March— 1 0 1 .6 ______ 103 .2 9 6 .0 1 0h .3 1 06 .3 9 8 .8 (h ) (h )A p ril------ lOh.O ——— 1 03 .5 98.h 1 06 .1 1 1 3 .0 96.h (h ) (h )May— 103.1* 1 0 3 .7 1 02 .6 106.6 1 05 .8 97 .1 1 0 0 .9 9 9 .1June------- 1 03 .2 —- —_ 1 03 .3 106.8 1 0 7 .5 9 8 .7 9 9 .9 (h ) (h )Ju ly — 1 0 3 .6 — 1 03 .3 1 0 9 .h 1 08 .5 96.6 1 01 .3 (h ) (h )August— 1 0 3 .5 103.1, 3 12 .2 1 0 8 .7 9 0 .8 10h .6 1 0 2 .3 1 02 .2September 1 03.2 -------- 103 .2 1 1 3 .0 106.8 90.2 10h .9 (h ) <h)October— 1 03 .6 _——_ 1 03 .2 1 1 1 .5 103.1, 9h .6 1 0 6 ^ (h ) (h )November- 103 .9 ______ 1 03 .6 U 0 .9 1 03 .7 9h .8 1 0 8 .1 103.h 1 03 .6December- I0 h .5 — 1 03 .7 1 09 .3 lOh.h 9 9 .2 1 06 .2 (h ) (h )
19h9: Average 1 00 .1 1 0 3 .0 102 .2 9 7 .3 1 0 0 .6 9 6 .5 lOh.O 1 07 .1January— lOh.8 ______ 1 03 .9 10h .9 1 03 .1 1 0 7 .1 103 .2 (h ) (h )Februaiy- 1 0 2 .5 _—— 1 03 .6 96. h 1 02 .9 1 1 1 .9 9 5 .6 io h .5 1 05 .7March— 1 02 .7 ______ 1 03 .7 101.1, 1 01 .9 1 3 0 .1 9 2 .7 (h ) (h )A pril------ 103 .2 — 103 .2 1 03 .1 9 7 .6 1 13 .2 9 2 .2 (h ) (U)May--------- 1 01 .5 — 1 02 .8 103 .1 9 6 .5 1 0 7 .8 92.6 103 .h 106.5June------- 100.5 _—. . . 1 0 3 .0 1 0 6 .5 9 5 .9 1 0 0 .8 9 2 .9 (h ) (h )J u ly ----- - 98.1, ----- — 1 02 .9 106.6 9 6 .0 9 2 .3 9 h .l (h ) (h )August— 9 8 .1 1 02 .7 io h .5 9 6 .7 9 0 .9 97 .h 1 03 .9 1 0 7 .8September 9 8.6 ______ 1 02 .8 103.8 9h .2 9 3 .6 99 .8 lOh.O 108aOctober— 97.6 1 02 .6 101.5 9 h .3 9 1.1 101.h 1 0h .5 108.1,November- 9 7 .5 ______ 1 02 .6 9 7 .9 9 h .5 9 h .7 1 00 .5 10h .9 108.8December- 9 5 .9 — 102 .h 96.h 9h.3 9 3 .5 9 5 .8 1 05 .1 1 09 .3
1950: Average 1 00 .0 ______ 10h.7 10h .9 9 3.9 9 h .0 9 8.6 1 08 .3 llh .OJanuary— 9 8 .0 — 1 0 2 .5 9 7 .3 9 h .0 1 00 .5 9 5 .h 1 05 .5 1 1 0 .0February- 9 6.7 ------- - 102.5 9 7 .1 9h .2 9 7 .2 9 2 .9 106.1 1 10 .7March— - 9 7 .0 102.5 9 9 .3 9 h .l 9h.2 9 3 .8 106.h l l l . hA pril— 9 8 .1 1 02 .9 lO l.h 9 3 .6 9 7 .0 9 2 .8 1 0 7 .0 1 1 2 .7May-------- 9 7 .9 ______ 1 0 3 .2 10h .2 9 3 .3 9 3 .5 9 i a 1 0 7 .5 1 13 .8June— 9 8.1 — 103 .3 1 05 .1 9 3 .2 9 3 .2 9 1 .0 1 0 7 .3 llh .OJu ly ------- 9 9.h _____ 1 03 .2 106.1 9 3.3 9h .9 9h.h 1 0 7 .6 l l h . 7August---- 1 01 .5 ______ 106.h 1 0 9 .1 9 3 .7 89 .9 1 0 2 .5 1 08 .6 1 15 .6September 1 01 .1 ------— 1 0 7 .2 1 0 9 .6 9h .2 86.3 1 02 .7 (h ) (h )October— 1 02 .6 ______ 1 0 7 a 1 09 .8 9 h .3 89.3 106.6 (h ) (h )November- 103 .2 ______ 1 07 .6 1 08 .9 9h.h 9h .h 1 0 5 .7 1 31 .6 1 1 6 .5Dee ember- 106.0 — 1 0 7 .8 1 10 .6 9 h .5 9 6 .9 l l h . 2 (h ) (U)
1951: Average 112. e _____ 1 1 2 .5 1 20.2 1 0 3 .5 10h .5 l l h . 9 1 1 7 .6 125.1,January— 1 1 0 .1 _____ 3 1 1 .1 1 1 6 .0 1 00 .2 lOh.h 1 1 1 .5 (h ) (h )February- n o .h — 1 3 1 .6 3 1 7 a 1 01 .3 1 03 .9 1 1 0 .6 3 1 6 .6 123.7-March— 1 11 .8 ______ l l l . h 1 1 7 .5 1 0 1 .5 1 07 .7 3 1 3 .0 (U) (h )A p ril------ 1 11 .3 ——— 1 1 3 .1 117 .3 1 0 1 .7 1 05 .2 1 12 .5 (h ) (h )May— —- 1 12 .3 —— 1 13 .2 1 2 0 .0 1 00 .9 103 .7 1 1 5 .1 3 1 7 .8 1 25 .2June------- 1 12 .3 ______ 112 .h 1 2 0 .8 1 02 .8 1 01 .3 1 1 5 .0 (h ) (h )July——- 113.2 ______ 1 1 2 .8 1 21 .9 1 0 2 .7 lOh.O l l h . 7 (1») a *)August---- 1 1 3 .0 ______ 1 1 2 .8 1 22 .1 1 0 5 .8 99 .7 1 1 5 .0 3 18 .7 1 26 .2September 1 1 3 .5 ______ 113 .3 1 2 2 .0 106.0 9 8 .7 1 18 .2 (h (h )October— l l h . l ______ 3 1 2 .8 1 2 2 .6 106.0 1 01 .2 1 1 8 .0 (h ) (h )Novemberw 1 15 .3 1 13 .0 1 2 2 .7 106.2 106.6 1 1 8 .3 3 19 .3 1 2 7 .5December- 117.1 — 1 1 3 .0 122 .3 1 0 7 .1 117 .3 3 16 .3 (h ) (h )
1952: Average l l h . 5 ______ 3 15 .9 1 19 .9 1 1 1 .0 1 11 .3 1 0 8 .9 1 20 .2 1 3 0 .6January— 116. h _____ 313.2, 121 .6 108 .3 1 2 0 .7 1 09 .7 (h ) (h )February- 1 13 .9 _____ 1 3 3 .8 121 .1 1 1 1 .0 1 09 .6 1 0 6 .8 3 1 9 .7 1 2 8 .7March---- - l l h . l 1 13 .9 1 2 0 .0 1 1 0 .8 l l h . h 1 0h .8 (h ) (h )A p ril—— 1 1 5 .3 ______ l l h . l 1 1 9 .9 1 1 0 .9 1 19 .7 1 0 5 .6 (h ) (h )May--------- l lh . 6 ______ 116.6 1 2 0 .0 1 1 0 .5 1 16 .6 lQh.3 1 19 .7 1 2 9 .8June— — l l h . 5 3 1 6 .7 1 2 0 ^ 130 .h l l h . 5 10h .8 (U> (h )July——- l l h . 6 ______ 3 16 .7 120 .h .1 1 0 .8 3 10 .0 1 0 9 .6 (h ) (h )August— l l h . h ___ _ 3 1 6 .8 1 21 .8 1 1 0 .8 ia h .5 3 1 1 .8 120 .h 131 .3September l l h . l —— 3 16 .9 1 2 1 .6 1 1 1 .3 101.9 3 1 2 .3 a *) (h )October— 1 1 3 .7 1 1 7 .5 3 1 9 .5 1 11 .2 102.9 1 1 2 .6 (U> (h )November- l l h . 3 ______ 1 1 7 .1 1 17 .0 3 1 3 .1 109.0 3 12 .0 121.6 1 32 .7Dee ember- l l h . 5 — 117.2 1 1 5 .3 1 1 3 .0 112.5 3 12 .5 <h) (h )
1953: Average 1 13 A 1 12 .3 1 2 0 .0 1 1 0 .7 1 0 9 .9 108.1 1 1 3 .2 123.5 1 3 5 .6January— l l h . l l l h . 0 1 17 .2 1 13.2 3 1 3 .0 112.9 1 12 .6 1 22 .2 a *)February- 1 1 2 .h 1 11 .9 317 .h 1 1 0 .5 3 1 3 .0 3 1 0 .6 1 09 .2 1 2 2 .2 (U)March---- - U 3 .2 1 12 .8 1 17 .3 n o . h 1 1 2 .9 113.0 3 1 1 .1 1 2 2 .5 a *)A p ril— 1 12 .8 1 1 2 .1 117 *h 109.8 1 0 9 .6 1 1 2 .6 3 1 1 .5 1 23 .5 (h )May— — 1 12 .2 i u . U 1 17 .7 109.5 1 0 9 .5 109 .7 1 H .3 123 .3 1 3 5 .1June-—— 1 12 .3 1 11 .5 1 18 .3 1 31 .1 1 09 .3 1 06 .9 3 11 .7 1 2 3 .5 (It)
Los Angeles, C alifo rn ia—Continued
100.0100.0100.0100.0100.0100.0
100.0100.0100.0100.0100.0100.0100.0100.0100.0100.0100.0100.0100.0100.0100.0100.0100.0100.0100.0100.0100.0100.0100.0100.0100.0100.0
103.9100.010h.310h.310U.310h.3ioh.310h.310h.310h.3loh.llo h .ll o h . l
l o h . ll o h . ll o h . llO h .ll o h .llO li.llO h .lio h .1l o h . llO h .ll o h . ilO h .lio U .i
106.0lO h .llO h .llO h .l1 06 .71 06 .71 06 .71 0 6 .71 06 .7106.71 06 .71 06 .7106.7
1 0 9 .3108 .71 08 .71 0 8 .71 0 9 .51 09 .51 0 9 .5
9 7 .5 96.U 9 8 .09 8 .6 98 .9 9 9 .6
1 02 .3101.11 0 1 .7102.1,1 02 .91 02 .3101.2101.1*102.01 03 .1103 .11 03 .21 03 .1
9 9 .9103 .31 02 .91 01 .9100.2
9 8 .1 9 8 .19 9 .09 8 .1 9 8 .09 9 .59 9 .59 9 .9
1 0 1 .9 100.2 100 .7 1 0 0 .5 100.U100.2
9 9 .39 9 .1
100.21 02 .7 10h .7 1 06 .91 0 7 .8
112.21 0 9 A110.0n o a111.21 1 1 .7111.81 1 3 .51 13 .6 l l h . h1 1 3 .71 13 .7 U 3 .7
1 1 0 .5112.61 1 1 .91 10 .71 1 0 .91 09 .81 0 9 .51 09 .5
---------- 1 0 9 .U1 1 0 .3 llO .h 1 1 0 .7i i o . h
1 1 0 .7n o . 7110.6111.11 11 .'1 H .61 11 .0
9 7 .19 7 .19 6 .69 8 .9
1 00 .9101.8
1 02 .7 102.2 1 03 . U 102. U 102.6 103.21 02 .3103.8102 .3 102.0 103.0 102.h 1 02 .7
9 9 .61 03 .31 0 2 .5 lO l.h1 0 1 .5
9 9 .5 98.8 98.1* 98.09 7.99 7 .798 .99 7 .6
9 8 .2 97 .h9 6 .99 6 .7 9 6 .6 9 6 .59 6 .2 96.1, 9 8 .09 8 .89 9 .8
1 0 2 .3102.6
1 0h .6103.1,1 05 .6 io h .5 lo h .h1 0 5 .11 0 5 .2 io h .3 10h .31 03 .91011.3 10h .3105.1,
1 05 .91 05 .31 05 .910 5 .91 05 .9 105 .h1 05 .71 0 5 .51 0 5 .6 106.1 106.0106.61 0 6 .5
1 0 7 .51 0 6 .51 0 6 .5 1 06 .71 0 7 .51 0 7 .61 07 .6
9 5 .39 5 .89 8 .29 8 .99 8 .9
lOO.h
1 0h .51 01 .9 1 0h .5 10h .2 lOh.O1 05 .1 1 05 .3 1 05 .0 10h .6 lo h .h 10h .8 I0l*.9 10h .6
9 9 .11 03 .11 01 .91 00 .9100.2
9 9 .698 .9 98.1*9 7 .79 7 .39 7 .19 7 .29 7 .0
9 8 .79 7 .09 7 .9 9 8 .598 .39 7 .89 7 .79 7 .79 7 .89 8 .8 9 9 .7
100.81 01 .7
1 07 .11 02 .71 05 .71 07 .91 07 .9108.1,108.2 108.11 07 .8 108 .2 107.6 106.6 106.0
1 05 .8 105.U1 06 .5 1 07 .21 06 .91 0 6 .5 1 0 6 ,0 1 05 .7 10h ,81 0 5 .1 1 0h .7105.21 05 .2
1 0 3 .9 10h .6 10h .h lOh.O1 0 3 .51 0 3 .61 03 .2
9 h .09h .397.h 1 0 1 .09 7 .99 8 .19 8 le 1 03 .5
1 02 .99 9 .8
1 01 .2100 .9 1 01 .1 lOh.O I0h .3 1 0h .2 lOh.O1 0 3 .5 lO h .li o h a1 0 3 .8
1 00 .61 0 2 .5 102.1 101.1 100.2 100.2
9 9 .8 1 0 0 .0
9 9 .91 00 .3 100.1,1 00 .31 0 0 .5
99 .h1 00 .3
9 9 .89 8 .8 9 8 .5 97 .h 9 7 .3 97*h 9 8 .3
100.6 100.6 1 0 1 .81 0 2 .5
1 0 8 .3 10h .71 06 .5106.51 0 7 . h 108.81 0 8 .91 08 .71 0 8 .71 0 9 .9 1 1 0 .01 09 .91 09 .7
108. h1 0 8 .7109 .1 1 0 9 .0108 .71 0 8 .5 108. h 108.h1 07 .81 0 8 .3108.1 108.01 07 .9
1 0 7 .6 1 0 7 .01 0 7 .51 07 .51 07 .61 07 .6 1 07 .5
97 .39 8 .1
1 01 .81 0 1 .8
105.31 0 5 .0107.6106.7 1 0 6 .0105.81 0 5 .9105.2 lOh.h 1 0 3 .8 1 0h .3 lQh.7 lQh.295.8
1 02 .199.898.998.297.796.5 9h.793.9 92.h 9 2 .092.19 1 .8
95.092.093.7 96.095.595.695.995.6 9h.393.9 95.h95.896.3
1 0 1 .895.8
1 0 0 .h 10h.8 10h.2 10h.2103.6102.91 0 2 .6 103.0 101.699.698.7
1 0 1 .699.5
101.9 lOh.O 103.6 103 .h 102.h 101.8100 .2 1 0 0 .61 0 0 .1 101.1 1 01.0
98.1*100.599.69 8 .6 97.7 97.5 97.2
9 1 .89 2 .19 2 .39 3 .193 .3 9 5 .7
1 0 3 .6 9 8 .0
1 02 .31 02 .9102 .9103 .7 lO h .l 10h.2 lOh.O1 05 .1 io 5 .h 105.h1 05 .6
lO h.81 0 5 .61 0 5 .81 05 .91 05 .8 1 0 5 .0 I 0 h .71 05 .11 03 .8 lO h .l lOh.O lOh.O1 0 3 .5
1 06 .71 0 3 .61 05 .1 1 0 5 .01 05 .1105.0 1 0h .81 05 .0105 .21 0 7 .8109 .21 11 .11 1 3 .3
119 .2115.21 1 7 .1 1 18 .91 19 .31 1 9 .13 19 .31 2 0 .31 20 .31 2 0 .31 20 .3120.213.9.5
1 15 .0 3 1 7 .h l l 6 . h3 1 6 .0115.83 15 .1 l l h . 5 l l h . 3 l l h . l l lh .O l l h . 0 l lh .O 1 13 .8
l l h . 3llh .Ollh .Ol l h . 0l l h . 2l l h . 8l l h . 2
101.7 101.6 103.9 10h.8 10h.8 106.1lll.h108.3 U1.3112.71 1 1 .8312.3 112.7113.1312 .2 lll.h 1 1 1 .61 3 1 .0108.592.2
10h.61 02 .6
96.1* 9 2 .689.288.789.5 8 9 .088.5 88.h 88 .h8 8.6
91.68 8 .089.89 1 .292.190.586.189.193.992.591.196.698.2
96.799.0
100.1 1 01 .1 1 00.0 1 00.099.299.6 98.h93.7 91.h 89.588.0
8h.685.187.886.9 8 5.8 83.8 83.8 8h.083.883.882.1 8h.0 8h.8
83.3 8h.O 8h.2 8h.O83.3 83.9 82.7
9 2 .09 2 .693.6 9h.0 9h.3 9h.3
101.3 9 8 .098.1 98.39 8 .698.198.1
102.6 10h.3 10h.6 10h.6 10h.6105.5
1 07 .2105.5107.3107.1 107.h 107 .h107.2107.3107.3 3X37.3107.5107.6107.5
106,0107.6106.9 106.0 lOh.9 10h.9 10h.9 1 0 5 .0105.7106.1106.5106.9107.2
110.7107.5108.9109.9109.9 1 1 0 .0 1 10 .0110.3110.3 l ll .h 112.1,113.9113.9
1 21 .8 113. e 120.2 120.2 120.2 121.1 121.1123.6123.6123.8123.9125.0125.0
126.8125.8125.7 127.h 127.2126.8126.8
91.391.993.1 93.h93.993.9
101.698.198.198.2 98.698.09 8 .0
103.2 105.0105.510 5.5105.5 105.8
107.7105.8 107.8107.6 108.0 107.9107.7107.8107.8 108.0 108.0108.2 108.1
106.3108.1107.3106.5 10h.9 10h.9 10h.9 105.0105.8 106.h 106.8107.3107.7
111.8108.0109.7310.9110.9 111.0 111.0111.3111.3112.7113.9115.7315.7
120.3115.5 1 1 8 .2 118.2 118.2119.2319 .2122.2 122.2122.5122.6122.7122.7
12h.h123.6123.5125.3125.112U.312h.2
9 7.79 7 .79 7 .797.79 7 .797.7
9 8 .89 7 .79 7 .7 98.6 98.6 98.6 98.6 98.69 8 .69 8.698.6 98.6
103.1,
1 03 .h 1 0 3 .h103.1, 1 0 3 .h 1 0 3 .h 103 .h 103 .h 103.h 103.1* 103.1* 103 .h 103 .h 1 0 3 .h
103 .h 1 0 3 .h 103.h103.1, 103 .h 1 0 3 .h 1 0 3 .h 103 .h103.1, 1 0 3 .h 103 .h 103 .h I0 3 .h
1 0 3 .h 103.1* 1 03 J ,103.1, 1 0 3 .h 103 .h 103 .h103.1, 103.1* 103 .h 1 0 3 .h 103.h 103 .h
127 .h 1 0 3 .h 128.h128.1, 128 .h 128.h 128 .h 1 2 8 ,h 1 2 8 .h 1 28 .h 128.1, 13h.7 13h.7
1 37 .613h.713h.713h .713h .7138.3138 .3
See footnotes at end of table.
109
Digitized for FRASER http://fraser.stlouisfed.org/ Federal Reserve Bank of St. Louis
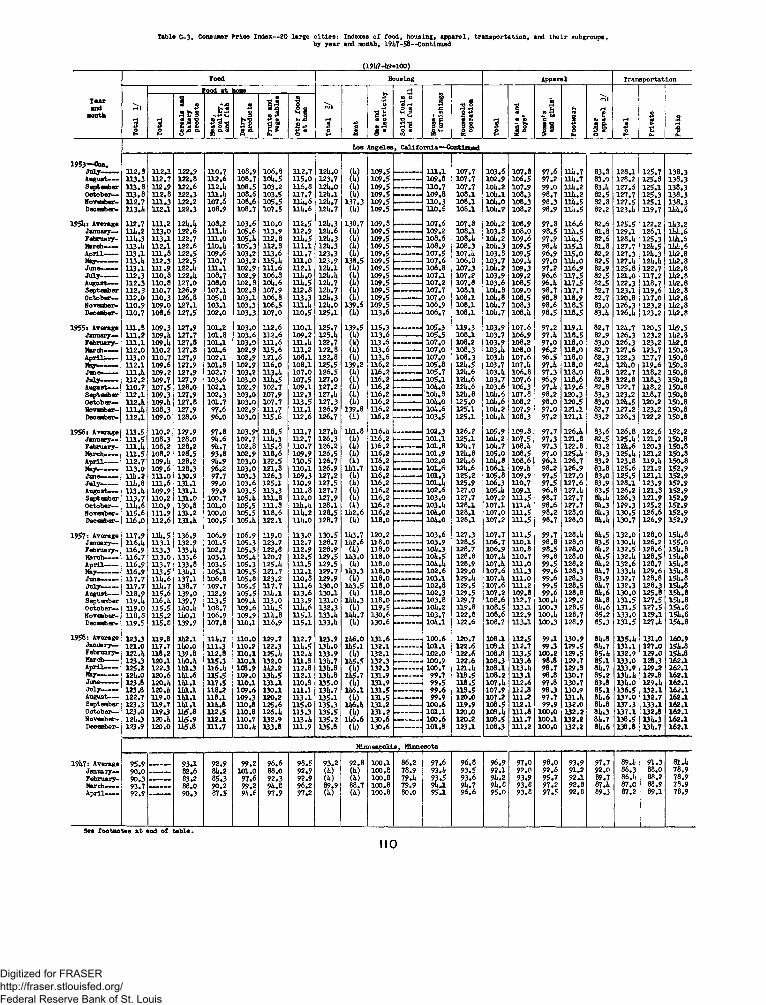
Table C-3. Consumer priee Index—20 large cities: Indexes of food, housing, apparel, transportation, and their subgroupsby year and month, 19U7-58—Continued
Tearand
month
1953—Con.July-—August----SeptemberOctober—November-
1951*: Average January— February-March------A pril------May--------June—July-------August----SeptemberOctober—November-December-
1955* Average January— February-March------April:-----May-------
July-——August----September October— November- December-
1956: Average January— February-March-----April------May--------
July------August- Sept ember October— November- Dee ember-
1957* Average January— February-March------A p ril-----May---------June-------July-------August----September October— November- Dee ember-
1958: Average January— February-March____A pril------May---------June-------Ju ly -------August----September October— Noveaber- December-
(19l*7~l*9»100)Food Housing Apparel Transportation
Food at 1ione fH !
Tota
l 1
/
Tota
l
Cere
als
and
bake
ry
prod
ucts
Mea
ts,
poul
try,
an
d fi
sh
Dair
ypr
oduc
ts
Frui
ts a
nd
vege
tabl
es
Othe
r fo
ods
at h
ome
iH3O Rent
Oas
and
elec
tric
ity
Solid
fue
ls
and
fuel
oi
Hous
e-
furn
ishi
ngs
Hous
ehol
dop
erat
ion
Tota
l
Men
's an
d bo
ys'
Wom
en's
and
girl
s'
Foot
wear
Othe
rap
pare
l 3/
Tota
l
Priv
ate
Publ
ic
Los Angeles, California—'-Continued
106,8 n ? ,7 (1*) 109.5 m ,i 107.7 103.6 107*8 97.6 Hi* .7 83.8 128.1 lift 1113.3 112 .7 122.8 H 2.6 108.7 10l*.5 115 .0 123.7 (U) 109.5 _______ 109.8 107.7 102.9 106.5 97.2 ni*.7 83!o 128.2
Ac?* f 125.8 138.3
113 .8 112 .9 122.6 H2.lt 108.5 103.2 H 6.8 12lt.O (l*) 109.5 _______ HO.7 107.7 lOlt.2 107.9 99.0 lllt .2 83.1* 127.6 125.1 138.3113 .8 H 2.8 122.3 U l.lt 108.6 103.5 H7.7 12lt.l (1*) 109.5 —-------- 109.8 10 8 .1 lOlt.l 108.3 98.7 lllt .2 82.5 127.7 125.3 138.3112.7 H I . 3 122.2 107.6 108.6 105.5 Hi*. 6 12lt.7 137.3 109.5 _______ HO. 3 10 8 .1 lOlt.O 108.3 98.3 lllt.5 82.3 127.5 125.1 138.3H3.lt H2.1 122.3 108.9 108.7 107.5 Hlt.6 12it.7 (it) 109.5 — 110 .6 10 8.1 10lt.2 108.2 98.9 Hlt.5 82.2 123.1* 119.7 lltU.6
112.7 H I .2 12 lt.lt 108.2 103.6 HO.O H2.5 12lt.3 138.7 109.8 107.6 307.8 10lt.2 108.9 97.8 H 6.6 82.6 125.5 122.2 11*3.2lllt .2 113 .0 122.6 H l.lt 105.6 H3.9 H2.9 12U.6 (1») 109.5 ______ _ 109.2 108.1 103.3 108.0 98.5 Hlt.5 81.8 129.1 12 6 .1 ll*l*.6lilt .3 H 3.1 122.7 1H .0 105.lt H 2.8 Hlt.5 12i*.3 (1*) 109.5 — 108.6 108.lt lOlt. 2 109.6 97.9 Hlt.5 82.6 128.1* 125.3 1 UU.6U3.it H 2.1 122.6 H0.lt 105.3 112 .8 H l . l 12lt.3 (1*) 109.5 108.9 108.3 I0li.3 109.5 98.1* H5.1 81.8 127.7 12lt.5 11*1*. 6113.1 i n . 8 122.5 109.6 103.2 113 .6 H I .7 123.3 (1*) 109.5 107.5 107.1* 103.8 109.5 96.9 H5.0 82.2 127.3 12U.3 11*2.8H3.lt 112.3 122.5 H0.7 103.2 115.1* U 1 .0 123.9 138.5 109.5 — — — 107.6 106.8 103.7 109.it 97.0 n it.o 82.5 127.1* 12lt.lt 11*2.8113.1 H I . 9 122 .lt H l . l 102.9 1 1 1 .6 H2.1 121* . 1 (it) 109.5 106.8 107.3 10ii.2 109.3 97.2 H 6.9 82.9 125.8 122.7 11*2.8112.3 HO. 8 122 . 1* 108.7 102.9 106.8 Hit.O 12lt.lt (1*) 109.5 — 107.1 107.2 103.9 109.2 96.6 H 7.5 82.5 12 1.0 H7.2 11*2.8H2.3 HO. 8 12 7.0 108.0 102.8 10lt.6 llit.5 121*. 7 (1*) 109.5 ——----- 107.2 107.8 103.6 108.5 96.lt H 7.5 82.5 122.3 H8.7 11*2.8112.3 HO. 7 126.9 107.1 102.8 107.9 H 2.8 12U.7 (1*) 109.5 107.7 108.1 10lt.8 109.0 98.7 H7.7 82.7 123.1 H 9.6 11*2.9H2.0 H0.3 126.8 105.8 103.1 106.8 H3.3 12lt.3 (1*) 109.5 107.0 108.1 lOlt. 8 108.5 98.8 H8.9 82.7 120.8 H 7.0 11*2.8HO.9 109.0 127.1 103.1 103.3 106.5 H l.lt 12it.O 139.6 109.5 — 106.9 10 8.1 10U.7 108.3 98.6 H 8.5 83.0 126.3 123.2 11*2.8H0.7 108.6 127.5 102.0 103.3 107.0 H 0.5 125.1 (U) H3.6 — 106.7 10 8 .1 10lt.7 108.1* 98.5 H 8.5 83.1* 126 . 1* 123.2 11*2.8
H I . 8 109.3 127.9 10 1.2 103.0 H2.6 HO.l 125.7 139.5 H5.3 ______ 105.3 H 9.3 103.9 107.6 97.2 H9.1 82.7 121*.7 120.5 11*9.5H I .2 109.U 127.7 10 1.8 103.6 112 .6 109.2 125.1* (It) H 3.6 — 105.5 10 8 .1 103.7 106.9 97.1* H 8.5 82.9 126.3 123.2 11*2.9H l . l 109.U 127.8 10 1 .1 103.0 H I . 6 HL.li 122.7 (U) H3.6 107.0 108.2 103.9 108.2 97.0 H 8.0 83.0 126.3 123.2 11*2.8H 2.0 HO.2 127.8 10 1.6 102.9 H 5.6 H I .2 122.8 (it) H 3.6 — 107.0 108.3 103.1* 108.0 96.2 H 8.0 82.7 12 7 .6 123.7 150.8H 3.0 HO.7 127.9 10 2 .1 102.9 12 1 .6 10 8 .1 122.8 (It) H3.6 ____ — 107.0 108.3 103.lt 107.6 96.5 H8.0 82.3 122.3 H7.7 150.8H2.1 109.6 127.9 10 1.8 102.9 H 6.0 10 8 .1 125.5 139.2 H6.2 __—— 105.8 121*.5 103.7 107.1* 97.1* H8.0 82.1* 12it.0 H 9.6 150.8lH .lt 109.2 127.9 102.7 103.2 H3.U 107.0 126.5 (It) H 6.2 105.7 12l*.6 103.lt 106.8 97.3 H 8.0 81.9 122.7 H8.2 150.8H2.2 109.7 127.9 103.6 103.0 lllt.5 107.5 127.0 (It) H 6.2 105.1 12U.6 103.7 107.6 96.9 H 8.6 82.9 122.8 H8.3 150.8HO.7 107.5 128.0 10 2 .1 102.9 102.7 109.1 12 7.2 (it) H6.2 — —— 10it.0 12it.6 103.6 106.3 97.1* 119 .6 82.8 122.7 H 8.2 150.91 1 2 .1 109.3 127.9 102.3 103.0 107.9 11 2 .3 127.1* (it) H6.2 10lt.8 121*. 8 lOlt.6 107.8 98.2 120.3 83.3 123.2 H8.7 150.8H2.lt 109.1* 12 7.8 101.7 103.0 107.7 H 3.5 127.3 (1*) H6.2 — — - 10U.0 125.0 10lt.6 108.2 98.0 120.5 83.0 12lt.5 120.2 150.8H l.lt 108.3 127.9 97.6 102.9 H I . 7 H l . l 126.9 139.8 H6.2 — 10lt.6 125.1 lOlt. 2 107.9 97.0 1 2 1 .1 82.7 12 7.2 123.2 150.8112 H 109.0 128.0 96.0 103.0 H5.6 H2.6 126.7 (it) 116 .2 — 103.5 125.1 10lt.lt 108.3 97.2 121.1 83.2 126.3 122.2 150.8
H3.5 HO .2 129.9 97.8 103.9- H 8.5 H I .7 127.1* 11*1.8 H6.lt ____ __ 102.3 126.2 105.9 109.8 97.7 126 . 1* 83.6 126.8 122.6 152.21H .5 108.3 128.0 9U.6 102.7 111*.3 H2.7 126.3 (it) H6.2 ______ 101.1 125.1 lolt.2 107.5 97.3 121.8 82.5 125.lt 121.2 150.8H l.lt 108.2 128.2 9U.7 102.8 115.8 HO. 7 126.2 (It) 116 .2 ___ ___ 101.8 121*. 7 10lt.7 108.U 97.3 122.8 83.2 12U.6 120.3 150.8H I .5 108.2 128.5 93.8 102.9 H 8.6 109.9 126.5 (1*) H6.2 ---- ---- 101.9 12U.8 105.0 108.5 97.0 125.1* 83.3 125.lt 121.2 150.8H2.7 109.1* 128.2 9U.9 103.0 122.5 H 0.5 126.7 (U) 116.2 ______ 102.0 121*.6 10lt.8 108.6 96.1 126.7 83.2 123.8 H9.lt 150.8H3.0 109.6 128.3 96.2 103.0 121.8 HO .l 126.9 11*1.7 H6.2 — 101.6 12lt.6 10 6 .1 109.U 98.2 126.9 83.8 125.6 121.2 152.9lllt.2 1H.0 130.9 97.7 103.3 126.3 109.3 127.2 (It) H6.2 -------— 10 1.3 125.2 105.8 109.9 97.5 127.0 83.0 125.5 121.1 152.9lllt.8 H I . 6 131.1 99.0 103.6 125.1 130.9 127.5 (It) H6.2 — 101.lt 125.9 106.3 HO.7 97.5 127.6 83.9 128.1 123.9 152.9H3.lt 109.9 131.1 99.9 103.5 H3.3 H I . 8 127.7 (It) H6.2 — 102.6 127.0 105.1* 109.1 96.8 127.1* 83.5 126.2 121.8 152.9H3.7 HO .2 131.0 100.7 105.1* 111.8 H2.0 127.9 (1*) H6.2 ___ — - 103.0 127.7 107.2 m . 5 98.7 127.7 8l*.l* 126.3 121.9 152.9Hit .6 HO.9 130.3 101.0 105.5 H I .8 Hlt.it 128.1 (1*) H 6.2 _______ 103.lt 128.1 107.1 H l.l* 98.6 127.7 81*.3 129.3 125.2 152.9H5.6 H I .9 131.2 100.0 105.5 H8.6 Hit. 2 128.5 11*2.6 H6.2 ———— lGlt.0 128.1 107.0 HL. 5 98.2 128.0 81*. 3 130.5 126.6 152.9116 .0 H2.6 131.1* 100.5 105.1* 122.1 Hi*.0 128.7 (1*) H8.0 — 10lt.0 128.1 107.2 H I . 5 98.7 128.0 81*.l* 130.7 126.9 152.9
117.9 Hi*. 5 136.9 106.9 106.9 119.0 H3.0 130.5 11*3.7 120.2 _______ 103.6 127.3 107.7 1 1 1 .5 99.7 128.1* 81t.5 132.0 128.0 15U.8116.L 113.1 132.9 10 1.5 105.3 123.7 H2.7 128.7 11*2.6 H 8.0 __ —. — 103.9 128.5 106.7 HO.l 98.8 128.0 83.5 130.lt 126.2 155.0H6.9 H3.3 133.1* 102.7 105.3 122.8 H2.9 128.9 (1*) H 8.0 —— — 10it.3 128.7 106.9 HO. 8 98.5 128.0 Blt.2 132.5 128.6 151*. 8116.7 H3.0 133.6 103.1 105.1* 120.7 H 2.5 129.5 11*3.0 118.0 —___ — 10U.5 128.8 107.1* 110.7 99.8 128.0 81t.5 132.lt 128.5 15U.8
12 5 . 1* H1.5 129.5 (It) H8.0 mJ4.i1 128.9 107.1* 1H .0 99.5 128.2 81*. 2 132.6 128.7 151*. 8H 6*,9 H3l5 13l*.l 10 5 .1 105.5 171.1 1H .1 129.7 11*3.3 H 8.0 ______ 102.6 129.0 107.6 i n . 3 99.6 128.3 81*.7 133.lt 129.6 15U.8H7.7 111*.6 137.1 106.8 105.8 123.2 HO.8 129.9 (1*) H 8.0 ------—« 10 3.1 129.1* 107.1* n i .o 99.6 128.3 83.9 132.7 128.8 151*. 8H7.7 HU. 7 138.7 109.7 105.5 H7.7 H I . 6 130.0 11*3.5 H 8.0 102.8 129.5 107.6 H I . 2 99.5 128.5 81*.7 132.3 128.3 15U.8H8.9 H5.6 139.0 112.9 105.5 ll l t . l H 3.6 130.1 (U) 118.0 — — 102.3 129.5 107.2 109.8 99.6 128.8 81t.6 130.0 125.8 15U. 8119.lt H 6 . 1 i 139.7 H 3.5 109.lt H3.0 H 3.9 131.0 litit.3 118.0 103.8 129.7 108.6 112 .7 100.1* 129.2 81*. 8 131.5 127.5 151*. 8H9.0 H 5.5 HtO.lt 108.7 109.6 lll*.5 lllt.6 132.3 (it) H9.5 — — 10U.2 H 9.8 108.5 H3.1 100.3 128.5 81*.6 131.5 127.5 151*. 8H 8 .8 H5.2 UtO.l 106.9 109.9 H it.8 H5.1 133.1* 11*1*.7 130.6 103.7 122.8 108.6 112.9 100.lt 128.7 85.2 133.0 129.1 151*. 6H9.5 H5.8 139.9 107.8 HO.l 116.9 H 5.1 133.U (it) 130.6 — 10it.l 122.6 108.7 H 3.1 100.3 128.9 85.3 131.5 127.lt 151*. 8
123.3 H9.8 11*2.1 lllt.7 110.0 129.7 112.7 123.9 11*6.0 131.6 _______ 100.6 120.7 108.1 112.5 99.1 130.9 81*.8 335.lt 131.0 160.9121.0 H7.7 110.0 111.3 110.2 122.3 Hlt.5 13U.0 11*5.1 132.1 101.1 122.6 108.1 H2.7 99.3 129.5 8it.7 131.1 127.0 I5it.8121.it H8.2 139.8 H2.8 n o . i 125.lt 112.lt 133.9 (1*) 132.1 --------- - 102.0 122.6 108.8 H3.5 100.2 129.5 85.1* 132.9 129.0 151*.8123.3 120.1 HtO.lt U 5.3 n o . i 132.0 H I. 8 13li.7 11*5.5 132.3 _______ 100.9 122.6 108.3 113.6 98.8 129.7 85.1 133.0 128.3 162.1125.2 122.3 11*1.3 H6.lt 108.9 11*2.2 112.8 13l*.8 (1*) 132.3 . . . ___ _ 100.7 121.1* 10 8 .1 113.1* 98.7 129.8 81*.7 133.9 129.2 162.112lt.O 120.6 11*1.6 H5.5 109.0 13U.5 H2.1 13U.8 11*5.7 131.9 — 99.7 118.5 108.2 113.1 98.8 130.7 85.2 13l*.l* 129.8 162.1123.8 120.1* 11*1.1 H 7.5 h o .i 131.1 110.8 335.0 (1*) 131.9 — 99.5 H 8.5 107.1* H 2.6 97.8 130.7 83.8 13U.0 129.lt 162.1123.8 120.it 11*1.1 118.2 109.6 130.1 H l . l 131*.7 H16. I 131.5 . . . —. . . 99.6 H 3.5 107.9 H2.8 98.3 130.9 85.1 136.5 132.1 162.1122.7 H 9.0 11*1.1 H8.1 109.3 120.2 113.1 135.1 (It) 131.5 99.9 120.0 107.2 H I .2 97.7 131.1* 81t.6 137.0 132.7 162.1123.3 H9.7 11*1.1 llii.8 HO .8 125.6 115.0 135.3 11*6. It 131.2 _______ 100.6 H9.9 108.5 112.1 99.9 132.0 81*.8 137.3 133.1 162.1123.0 H9.3 11*5.8 11 2 .5 HO.8 126.lt H3.3 135.5 (1*) 131.2 —------- - 101.1 120.0 100.1* 111.8 100.0 132.2 81*.3 137.1 132.8 162.112lt.3 120.lt 11*5.9 112.1 110.7 132.9 113.lt 135.2 11*6.6 130.6 ----------- 100.6 120.2 108.5 H I .7 100.1 132.2 81*.7 138.5 13lt.3 162.1123.9 120.0 11*5.8 m .7 HO.l* 133.8 H I .9 135.8 (l*) 130.6 — 101.8 123.1 108.3 H I .2 100.0 132.2 81*.6 138.8 13l*.7 162.1
19l*7: Average January— February-March------A pril------
95.9 93.1 92.9 99.2 96.6 98.590.0 — — 82.6 81*.2 101.0 88.0 92.990.3 ________ 83.2 85.3 97.6 92.3 92.993.7 — _____ 88.0 90.2 99.2 9U.8 96.292.9 90.3 87.5 9U.6 97.9 97.2
M inneapolis, Minnes o ta
9 3.2 92.8 1 00 .1 86.2 9 7 .6 96.8(it) (U) ioo.e 78.9 93.1* 9 3 .5(1*) (1*) 1 00 .8 79.1* 9 3 .5 9 3 .68 9.9 88.7 1 0 0 .8 7 9 .9 9ltH 91*. 7(it) (l*) 1 00 .8 8 0 .0 9 5 .1 9 6 .6
9 6 .9 9 7 .0 9 8 .0 9 3 .9 9 7 .7 89.1* 9 1 .39 2 .1 9 2 .0 9 2 .6 9 1 .2 9 2 .0 86 .3 88 .09U.2 9 3.9 9 5 .7 9 2 .1 89 .7 86.1, 88.2911.8 9 3 .8 9 7 .2 9 2 .8 87.1* 8 7 .0 88 .99 5 .0 9 3 .8 9 7 .5 9 2 .8 89 .3 87.2 8 9 .1
See footnotes at end of table.
8l.it78.978.978.978.9
no
Digitized for FRASER http://fraser.stlouisfed.org/ Federal Reserve Bank of St. Louis
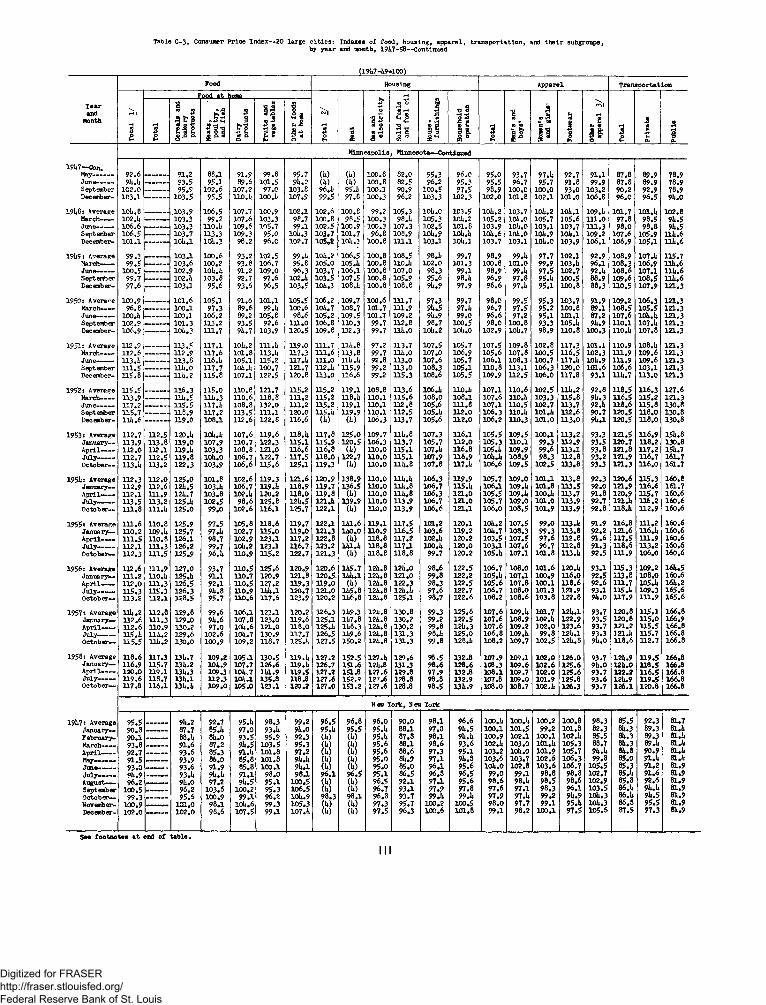
Table C-3. Consumer P rice Index—20 large c i t ie s : Indexes of food, housing, a p p arel, tra n s p o rta tio n , and th e i r subgroupsby year and month, 1 9^7-58—Continued
III
Digitized for FRASER http://fraser.stlouisfed.org/ Federal Reserve Bank of St. Louis
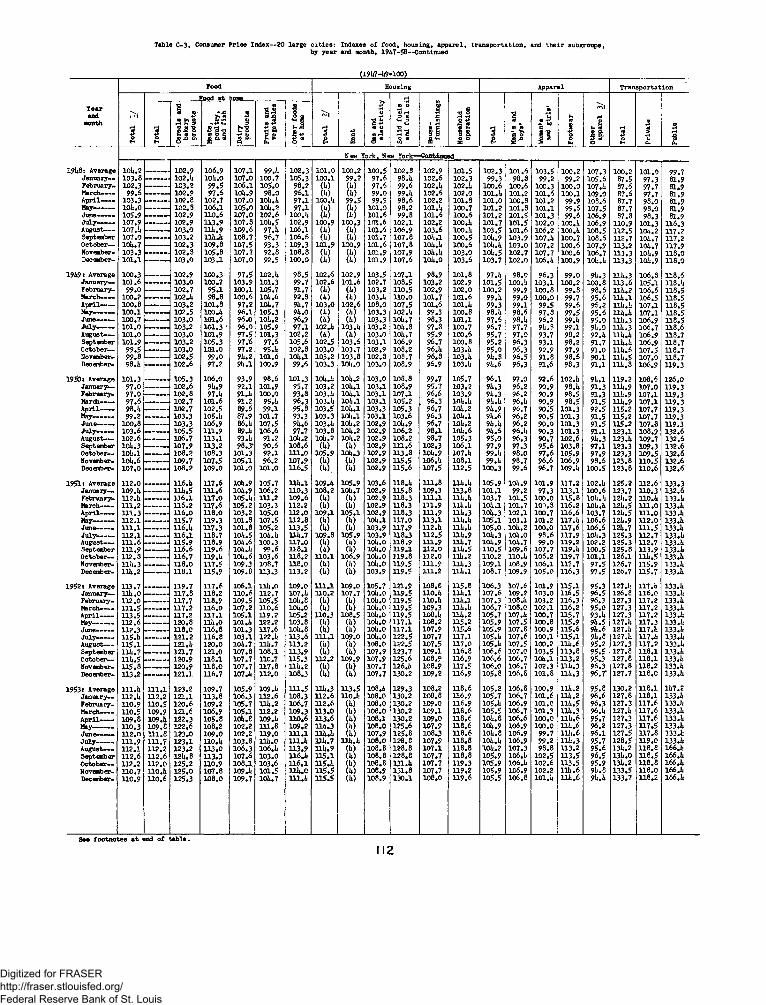
Table C-3. Consumer Price Index—20 larg e c it ie s : Indexes of food, housing, a p p arel, tra n s p o rta tio n , and th e i r subgroups;by y ear and month, 191*7-58—Continued
(191*7-1*9-100)
Food Housing Apparel T ra nsportation
To
tal
1/
Food a t lome
To
tal
2/
Ren
t
Oas
an
d
ele
ctr
icit
y
So
lid
fu
els
an
d
fue
l o
il
Hou
se -
fu
rnis
hin
gs
Ho
use
ho
ldo
pe
rati
on
To
tal
Men
's
and
b
oy
s'__
___
1
3i
c 60I ' is 8 F
oo
twea
r
Oth
era
pp
are
l 3
/
To
tal
Pri
va
te
Pu
bli
c
To
tal
Ce
rea
ls
and
b
ak
ery
p
rod
uc
ts
Mea
ts,
po
ult
ry,
and
fis
h
Dai
ryp
rod
uc
ts
Fru
its
an
d
ve
ge
tab
les
Oth
er
foo
ds
at
hom
e
New York, New York—Continued
191*8: Average 10l*.2 ______ 1 02 .9 1 06 .9 1 07 .1 99.1* 1 0 2 .3 1 0 1 .0 100.2 100.5 1 02 .8 1 02 .9 1 0 1 .5 1 02 .3 101.6 1 03 .5 1 00 .2 107 .3 1 00 .2 1 0 1 .0 9 9 .7January— 1 0 3 .8 ---- ----- 102.)* 10i*.0 1 07 .0 1 00 .7 1 05 .3 1 00 .1 9 9 .2 9 7 .6 98.1* 1 0 2 .6 1 02 .3 9 9 .3 9 8 .3 9 9 .2 99 .2 1 05 .6 8 7 .5 9 7 .3 81 .9February- 1 02.3 — 1 03 .2 9 9 .5 106.1 1 0 5 .0 9 8 .2 (i*) (it) 9 7 .6 9 9 .6 102.!* 102.!* 1 00 .6 1 00 .6 1 00 .3 1 0 0 .0 107.1* 87 .6 97 .7 81 .9March----- 9 9 .6 _______ 1 02 .9 9 7 .6 10lt.9 9 8 .0 9 6 .1 (U) (it) 9 9 .0 99.»* 1 02 .6 1 02 .0 101.1* 101.2 1 01 .6 1 00 .1 1 09 .0 87 .6 97 .7 81 .9A p ril------ 103 .3 ----- — 102 .8 1 02 .7 1 07 .0 10l*.l* 9 7 .1 100.!* 9 9 .5 99.5 9 8 .6 102 .2 1 01 .3 1 0 1 .0 1 00 .3 1 01 .2 9 9 .9 1 08 .6 87.7 9 8 .0 81 .9May—------ 10U.0 —_____ 1 02 .8 1 0 6 .1 1 05 .0 10l*.2 9 7 .1 0 *) (it) 1 01 .0 98 .2 101.!* 1 00 .7 1 01 .2 1 01 .3 1 01 .1 9 9 .6 1 07 .5 8 7.7 9 8 .0 81 .9June------- 1 05 .9 _______ 102 .9 1 10 .6 1 0 7 .0 1 02 .6 100.1* (1*) (i*) 1 01 .6 9 9 .3 1 0 1 .6 1 0 0 .6 1 01 .2 1 01 .5 101 .3 9 9 .6 106 .9 8 7 .3 9 8 .3 81 .9Ju ly ------- 107 .9 _______ 1 02 .9 1 1 3 .9 1 07 .3 I0it.5 1 02 .9 100 .9 1 00 .3 301 .6 1 0 2 .1 102.2 100.!* 1 01 .7 1 01 .5 1 0 2 .0 100.!* 1 06 .9 H O .9 1 01 .3 H 6 .3August— 107.it 1 0 3 .0 111*.9 1 0 9 .6 97.1* 106.1 (1*) (it) 1 01 .6 1 0 6 .9 1 03 .6 100.!* 1 03 .5 1 01 .6 106.2 100.1* 1 08 .5 1 1 2 .5 10U.2 1 17 .2Sent ember 1 0 7 .0 — — 1 03 .2 11U.1* 1 08 .7 9 6 .7 1 06 .6 (it) (it) 101 .7 1 0 7 .8 1 0l* .l 1 0 0 .5 10l*.9 1 0 3 .9 107.!* 1 00 .7 1 0 8 .6 1 12 .7 10ii.7 117 .2October— 10U.7 — —J 1 0 2 .3 1 09 .8 1 07 .5 9 3 .3 109 .3 101.9 1 00 .9 1 01 .6 1 0 7 .8 101*.!* 1 0 0 .6 10lt.lt 1 03 .0 1 07 .2 1 0 0 .6 1 07 .9 113 .2 10U.7 1 17 .9November- 1 03 .3 ----- — 1 0 2 .8 1 0 5 .8 1 07 .7 92 .8 1 08 .8 (it) (it) 1 01 .9 1 07 .9 10!*.!* 1 03 .0 10i*.5 1 02 .7 1 07 .7 1 0 0 .6 1 06 .7 H 3 .3 10li.9 H 8 .0December- 1 01 .1 — 1 03 .0 1 03 .1 1 0 7 .0 9 2.5 1 0 0 .0 (1*) (it) 101 .9 1 07 .6 10i*.0 1 03 .6 1 03 .7 1 0 2 .0 106. 1* 1 00 .9 10lt.lt H 3 .3 10l*.9 H 8 .0
19U9* Average 1 00 .3 ______ 102 .9 1 00 .3 9 7 .5 1 02 . >4 9 8 .5 1 02 .6 1 02 .9 1 03.5 1 0 7 .1 9 8 .9 1 01 .8 9 7 .i* 9 8 .0 9 6 .3 9 9 .0 9U.3 H lt.3 1 06 .3 1 1 8 .6January— 1 01 .6 1 0 3 .0 100 .7 1 03 .9 1 01 .3 9 9 .7 1 02 .6 1 0 1 .6 102.7 1 08 .5 1 03 .2 102 .9 1 0 1 .5 100.1* 1 03 .1 1 00 .2 1 00 .8 H 3 .6 105 .1 118.1*February- 9 9 .0 — 1 0 2 .7 9 5.1 1 00 .1 1 05 .7 9 1 .7 Ut) (it) 1 03 .2 1 1 0 .5 1 02 .9 1 0 2 .0 1 00 .2 9 9.9 1 00 .8 9 9 .3 9 8 .6 l l l t . 2 106.6 1 18 .5March— 100 .2 — — 102.1* 9 8 .8 1 00 .6 10lt.6 9 2 .8 (it) (it) 103.!* HO.O 1 01 .7 1 0 1 .6 99.!* 9 9 .0 1 0 0 .0 99 .7 9 5 .6 l l l t . l 1 06 .5 H 8 .5A pril------ 1 00 .8 1 0 3 .2 1 01 .8 9 7 .2 101*. 7 91*.7 1 03 .0 1 02 .6 1 08 .0 1 07 .5 1 0 1 .6 101.it 9 9 .3 9 9 .1 9 9 .5 9 9 .6 9 6 .2 111*.!* 1 07 .1 1 18 .5May— — 1 00 .1 -------- 1 0 2 .5 100.1* 9 6 .1 1 05 .3 91*.0 0 *) (it) 103 .3 1 02 . <* 99 .3 1 00 .8 98.1* 9 8 .6 9 7 .8 9 9 .5 9 5 .6 lli t.l* 1 07 .1 1 1 8 .5June——- 1 00 .7 1 0 3 .0 1 0 1 .6 9 6 .0 10l*.2 96 .9 (it) (it) 103 .3 10i*,7 98 .3 1 0 1 .1 9 7 .6 98.!* 9 6 .2 99.1* 9 5 .0 111*. 3 1 06 .9 H 8 .5July------- 1 0 1 .0 103 .2 1 01 .3 ’ 9 6 .0 1 0 5 .9 9 7 .1 102.1* 103.it 103 .2 10i*.3 9 7 .3 1 00 .7 9 6 .7 9 7 .7 9it.S 9 9.1 9U.0 111*.3 1 06 .7 H 8 .6August---- 1 01 .0 —— — 1 0 3 .0 1 01 .9 9 7 .5 1 01 .3 1 02 .2 (it) (it) 1 03 .0 I0 lt.7 9 5 .9 1 0 0 .6 9 5 .7 9 7 .0 93 .7 9 8 .2 92.1* l li t . i t 1 0 6 .9 U 8 .7September 1 01 .9 ----- — 1 03 .2 1 05 .3 9 7 .6 9 7 .6 105 .6 102 .5 1 03 .6 1 03 .1 106 .9 9 6 .7 1 00 .8 9 5 .2 96 .3 93.1 98 .2 9 1 .7 l li t.l* 1 06 .9 H 8 .7October— 9 9 .5 — 1 03 .0 1 0 1 .0 9 7 .2 95.U 1 0 2 .8 1 03 .0 1 03 .7 102 .9 1 08 .2 96.1* 103.1* 9 5 .0 96 .3 9 2 .9 97 .9 9 1 .0 111*.6 1 07 .5 H 8 .7November- 9 9 .8 — 102.5 9 9 .0 9l*.2 1 0 1 .6 1 0l* .l 1 03 .2 1 03 .8 1 02 .3 1 08 .7 9 6 .3 103.1* 9it.S 9 6 .5 9 1 .8 9 8 .6 9 0 .1 H it.5 1 07 .0 1 18 .7December- 9 8 . !* 1 0 2 .6 9 7 .2 9U.1 1 00 .9 9 9 .6 1 03 .3 101*.0 1 0 3 .0 1 08.9 9 6 .9 103.1* 9it.6 96 .3 91 .6 9 8 .3 91 .1 l l i i . 8 1 06 .9 H 9 .3
1950: Average 1 01 .3 ______ 1 05 .3 106.0 9 3 .9 9 8 .6 1 0 1 .3 10i*.i* 10lt.2 1 03 .0 1 08 .8 9 9 .7 1 05 .7 9 6 .1 9 7 .0 9 2 .6 102.!* 9 li .l 1 1 9 .2 1 08 .6 1 2 6 .0January— 9 7 .0 1 02 .6 9l*.9 9 2 .1 1 01 .9 95 .7 103 .2 1 0 lt .l 1 03 .1 1 08 .9 9 5 .7 1 03 .2 91*. 3 9 6 .2 9 0 .9 98.1* 9 1 .3 111*.9 1 07 .0 1 1 9 .3February- 9 7 .0 — 1 02 .8 97.U 91.1* 1 0 0 .0 9 3 .8 103.1* 1 0l*.l 1 03 .1 1 0 7 .1 96.6 1 03 .9 9i*.3 9 6 .2 9 0 .9 9 8 .5 91 .3 l l i * .9 1 07 .1 H 9 .3March----- 9 7 .6 __ ___ 1 0 2 .7 1 01 .6 9 1 .2 95.U 9 6 .3 103.U lO lt.l 1 03 .1 1 05 .2 . 9 6 .3 10U.I* 9ii.i* 96.1* 9 0 .9 9 8 .5 9 1 .5 H i* .9 1 07 .1 H 9 .3A pril------ 98.1* . . . . — 1 02 .7 1 02 .5 89 .6 9 9 .1 9 5 .3 1 03 .5 10U.1 103.3 105 .3 9 6 .7 10i*. 2 9i*.9 9 6 .7 9 0 .5 1 01 .3 9 2 .5 1 15 .2 107 .7 H 9 .3May--------- 99 .2 —. 103 .3 105.U 87.9 101 .7 9 3 .3 1 0 3 .3 1 0l*.l 1 03 .1 1 0 3 .6 9 6 .3 lO lt.l 9l*.6 9 6 .2 9 0 .5 1 01 .3 9 1 .5 1 15 .2 1 07 .7 H 9 .3Jun&—— 1 00 .8 1 03 .3 106.9 86.1* 1 07 .5 9l*.6 103.U id * .2 102 .9 10i*.9 96 .7 10J*.2 9ii.U 96.2 9 0 .0 1 01 .3 9 1 .5 1 15 .2 1 07 .8 H 9 .3Ju ly ----- - 1 03 .6 1 0 5 .5 1 31 .9 89.1* 1 06 .6 9 7 .7 1 0 3 .8 101t.2 102 .9 106.2 9 8 .1 10lt.6 9l*.6 96.1* 9 0 .3 1 01 .3 9 1 .1 1 2 3 .1 1 08 .9 1 3 2 .6August---- 1 02 .6 _— . . . 106 .7 1 13 .1 9 3 .li 9 1 .2 10l*.2 10lt.2 10U.2 102 .9 1 0 8 .2 9 8 .7 1 05 .3 9 5 .0 9 6 .3 9 0 .7 1 02 .6 9l*.3 123.1* 1 09 .7 1 3 2 .6September 10U.3 ______ 1 07 .9 1 13 .2 9 8 . ? 9 0 .6 1 08 .6 (U) (It) 102 .9 m .6 102 .3 106.1 97.9 97 .3 9 5 .6 1 03 .8 9 7 .1 1 23 .3 1 09 .3 1 32 .6October— lO lt.l ----—__ 108.2 1 08 .3 1 01 .3 92 .1 1 1 1 .0 1 05 .9 10t*.3 102 .9 H 3 .8 101*.9 107.1* 99.1* 9 8 .0 9 7 .6 1 05 .9 9 7 .9 123 .3 1 0 9 .5 1 3 2 .6November- 10lt.6 ______ 1 09 .7 1 07 .5 1 05 .1 96 .2 1 0 7 .9 (1*) (It) 1 0 2 .9 115 .5 106.!* 1 08 .1 99.1* 9 8 .7 9 6 .6 1 06 .9 9 8 .6 1 2 3 .8 u o . 5 1 32 .6Dee ember- 1 07 .0 — 1 08 .2 1 0 9 .0 1 0 1 .0 1 01 .0 1 16 .5 (1*) (it) 1 02 .9 H 5 .6 1 0 7 .5 H 2 .5 1 00 .3 9 9 .6 9 6 .7 109.it 1 0 0 .5 1 2 3 .8 1 1 0 .6 1 3 2 .6
1951: Average 1 12 .0 ______ I l6 .l t 1 1 7 .6 101*.9 3 05 .7 l l l t . l 109.U 105.9 103 .6 118.1* 1 11 .8 111*.!* 1 05 .9 10l*.9 1 01 .9 H 7 .2 102.1* 1 2 5 .2 1 12 .6 1 33 .3January— 1 0 9 .U ______ 11U.5 1 1 1 .6 10i*.9 106.2 U 0 .3 1 08 .2 101* .7 102 .9 1 1 5 .8 1 09.3 H 3 .8 1 01 .1 9 9 .2 9 7 .3 H 3 .1 1 0 0 .6 1 23 .7 H O . 3 1 3 2 .6February- 112.1* -- ----- 1 16 .1 1 1 7 .0 1 0 5 . U 111 .2 1 0 9 .6 (U) (it ) 1 02 .9 H 8 .3 1 1 1 .1 H i*. 1* 1 03 .7 1 01 .5 1 0 0 .0 1 1 5 .8 lOlt.l* 121*. 2 HO.l* 133.!*March------ 1 11 .2 ______ 1 16 .2 1 1 7 .6 1 0 5 .2 1 03 .3 1 12 .2 (1*) (it) 1 02 .9 H 8 .3 1 1 1 .9 Hi*.!* lO ii.l 1 01 .7 1 00 .3 116.2 10it.lt 121*.5 1 H .0 133.1*A pril------ 1 11 .3 _—----- 116.0 1 18 .0 103.2 1 05 .0 1 1 2 .0 1 09 .1 105.1 1 02 .9 H 8 .3 1 11 .9 n i t . 3 10it.3 1 02 .1 1 00 .7 n 6 . 6 103 .7 12U.5 H 1 .0 133.1*May-------- 1 12 .1 115 .7 1 19 .3 101.8 1 0 7 .5 1 1 2 .8 0 *) (1*) lO lt.l 1 17 .0 H 3 .1 iiit.1* 1 05 .1 1 03 .1 1 01 .2 117.1* 106.6 12lt.9 1 1 2 .0 1 3 3 .UJune— — 111.1 ______ 116. 1* 1 17 .3 101.8 105 .2 1 1 3 .5 (1*) (U) 1 03 .9 1 17 .9 112.1* H lt.lt 1 05 .0 10U.2 1 00 .0 1 1 7 .6 1 06 .6 12U.7 1 H .5 133.1*Ju ly—— 112 .1 ______ 1 1 6 .1 1 18 .7 lol*.5 10l*.l* l l i* .7 1 0 9 .8 1 0 5 .9 103 .9 H 8 .3 H 2 .5 n i i . 9 lot*. 3 lOlt.O 9 8 .6 1 17 .9 101*. 3 1 25 .3 1 1 2 .7 133.1*August— 1 1 1 .6 _______ 115 .9 1 18 .9 io lt.6 1 00 .3 1 17 .0 (i*) (i t ) lOlt.O 1 18 .9 1 1 1 .9 n i t . 7 io lt.9 10U.7 9 9 .0 1 19 .2 102 .2 1 2 5 .3 112 .7 133.1*September 1 11 .9 ______ 1 16 .6 1 1 9 .6 101*.1* 9 9 .6 118 .1 (1*) (i*) 10l*.0 H 9 .1 H 2 .0 i n *.5 1 1 0 .5 1 09 .6 1 07 .7 H9.1* 100.5 1 2 5 .3 1 13 .9 133.1*October— 1 32 .8 ______ 1 16 .7 119.1* 101*. 6 1 0 3 .6 1 18 .2 1 1 0 .1 106.9 lOlt.O 3 1 9 .8 1 12 .0 l l i l . 2 1 10 .2 110.1* 106.2 119 .7 1 01 .1 1 26 .1 l l i t . 5 133.UNovember- 111*. 3 1 1 8 .0 1 17 .5 109.3 1 08 .7 1 18 .0 (it) (i.) lOil.O 1 1 9 .5 111 .9 H i t .3 109.1 108 .9 106.1 1 17 .7 9 7 .5 1 26.7 1 15 .9 133.1*Dee ember- 111*.2 — 118 .1 1 15 .9 109 .8 113 .3 1 13 .2 (1*) (it) 103 .9 H 9 .5 1 11.2 n i t . i 108.7 109 .9 1 0 5 .0 116 .3 9 7 .5 1 26 .7 H 5 .7 133.1*
1952: Average 1 13 .7 1 1 9 .7 1 1 7 .6 106.1 lllj.O 1 09 .0 1 1 1 .1 109.0 105 .7 1 21 .9 1 08 .8 115.8 106 .3 1 0 7 .6 1 01 .9 1 15 .1 9 5 .3 127.1* 1 1 7 . It 133.1*January— lllt.O _______ 1 17 .8 1 18 .2 1 1 0 .6 H 2 .7 107.1* 1 10 .2 107.7 10i*.0 1 1 9 .5 HO.l* H l t . l 1 0 7 .6 1 09 .2 1 0 3 .0 1 1 6 .5 9 6 .5 1 2 6 .8 1 1 6 .0 133.ltFebruary- 1 12 .0 ______ 1 17 .7 1 18 .9 1 0 9 .5 1 0 5 .5 101*. 8 (1*) (it) lOlt.O H 9 .5 llO .i* i i i * . i 1 0 7 .3 108 .it 1 03 .2 1 16 .3 9 6.3 1 27 .3 1 17 .2 133.1*March-—- 1 1 1 .5 ______ 117 .2 1 1 6 .0 1 07 .2 1 1 0 .6 lOlt.O 0 *) (U) 10i*.0 1 1 9 .5 1 09 .3 Hlt.l* 1 06 .7 1 08 .0 1 02 .1 H 6 .2 9 5 .0 1 27 .3 H 7 .2 133.1*A p ril— 113 .5 ______ 1 17 .2 1 1 7 .1 1 05 .1 119 .2 1 05 .2 110 .3 1 0 8 .5 lOlt.O 1 1 9 .5 108.1* H it. 2 105 .7 107.1* 1 00 .7 H 5 .7 93.1* 1 27 .3 H 7 .2 133.1*May----— 1 12 .6 ______ 1 20 .8 llit.O 101.1* 1 22 .2 1 03 .8 (1*) (it) 10lt.0 1 17 .1 1 08 .2 H 5 .2 1 05 .9 1 07 .5 1 0 0 .8 H 5 .9 9li.5 127.1; H 7 .3 1 3 3 .1June------- 112.3 3 1 8 .0 1 1 6 .8 1 01 .3 1 17 .6 10U.8 0 *) (1*) lOlt.O 1 1 7 .1 1 07 .9 1 15 .6 1 05 .9 1 07 .8 1 00 .9 H 5 .6 9l*.6 127.1* H 7.U 133.1*Ju ly ------- ll5 .1 i __ ____ 1 2 1 .2 1 16 .8 1 0 3 .1 122.1* 1 1 3 .6 l l l . l 1 09 .0 ioli.0 1 2 2 .5 1 07 .7 1 17 .1 105.1* 1 0 7 .6 100 .1 1 15 .1 9i*.8 1 2 7 .1 117.1* 133.1*August---- 1 15 .1 ______ 121.1* 1 2 0 .0 10l*.7 111*. 7 113 .2 (it) (it) 1 08 .0 1 2 2 .5 1 0 7 .5 H 7 .0 105.1* 1 0 7 .5 1 00 .2 n i t . 6 9 5 .2 127 .3 1 1 7 .2 133.1*September 111*.7 ___ __ 1 2 1 .7 1 21 .0 1 0 7 .8 1 08 .1 1 13 .9 (1*) (i*) 1 07 .9 1 2 3 .7 1 0 9 .1 1 16 .8 106.6 1 0 7 .0 1 03 .5 113.8 9 5 .5 1 2 7 .8 1 1 8 .1 133.liOctober— lil * .5 ______ 1 20 .9 1 18 .1 1 0 7 .7 1 10.7 1 15 .3 1 12.2 1 09 .9 1 07 .9 1 25 .6 1 08 .9 116 .9 106.6 106 .7 1 0 li .l H 3 .2 9 5.3 1 2 7 .e 1 1 8 .1 133.itNovember- H 5 .8 1 20 .9 1 1 8 .0 1 07 .7 1 1 7 .8 U lt .2 (U) (it) 1 07 .7 126.1* 1 08 .9 H 7 .5 1 0 6 .0 1 06 .7 1 02 .3 H it.3 9 6 .3 1 2 7 .8 1 18 .2 133.1*Dee ember- 113 .2 — 1 21 .1 1 16 .7 107.1* 1 1 2 .0 1 08 .3 (U) (it ) 1 07 .7 1 30 .2 1 09 .2 1 1 6 .9 1 0 5 .8 106.6 1 0 1 .8 i l l * . 3 9 6 .T 1 27 .7 H 8 .C 133.1*
1953: Average 111.1* 1 1 1 .1 123 .2 1 09 .7 1 05 .9 109.1* 1 1 1 .5 111*.3 1 1 3 .5 108.1* 1 29 .3 1 08 .2 H 8 .6 1 05 .2 106.8 1 00 .9 111*.2 9 5 .8 1 3 0 .2 1 18 .1 11*7.2January— 112.1* 112 .2 1 2 1 .1 1 1 3 .8 106 .3 1 1 2 .6 1 08 .3 1 1 2 .6 H0.1* 108 .0 1 3 0 .2 1 08 .8 H 6 .9 105 .7 1 06 .7 1 01 .6 l l l i .2 96.6 1 27 .6 1 18 .1 133.1*February- 1 1 0 .9 1 1 0 .5 1 2 0 .6 1 09 .2 1 05 .7 l l l i .2 106.7 3 1 2 .6 (1*) 1 08 .0 1 30 .2 1 0 9 .0 H 6.9 105.1* 1 06 .9 1 01 .0 i l l * .5 9 6 .3 1 2 7 .3 1 1 7 .6 133.1*March—— 1 10 .5 1 09 .9 1 21 .6 1 06 .9 105 .1 112 .2 1 09 .3 1 1 3 .0 (U) 1 08 .0 1 30 .2 1 0 9 .1 H 8 .6 1 0 5 .5 106 .7 1 01 .3 l l i t .3 96.1* 127.1* H 7 .6 133.1*A p ril------ 1 0 9 .8 109.1* 1 22 .3 1 05 .8 lOit.8 109.1* 1 1 0 .6 1 13 .6 (it ) 108 .1 1 3 0 .2 1 09 .0 H 8 .6 10lt.8 106.6 1 0 0 .0 H l*.6 95 .7 1 27 .3 H 7 .6 133.1*May------- - 1 10 .3 1 0 9 .8 1 22 .6 108 .2 1 02.2 1 11 .8 1 09 .2 l l i t .3 (1*) 1 08 .0 1 2 5 .6 1 0 7 .9 H 8 .6 10i*.9 106 .9 1 0 0 .0 i u . 6 96.2 1 2 7 .3 U 7 .5 133.1*June------- 1 1 2 .0 1 1 1 .8 1 23 .0 1 0 9 .0 102.2 1 19 .0 l l l . l H lt.lt <U) 1 07 .9 1 2 5 .8 108 .3 H 8 .6 lo u .e 1 06 .9 9 9 .7 H i* .6 9 6 .1 1 2 7 .5 H 7 .8 133.UJ u ly -— - 111 .9 1 11 .7 1 23 .1 110.1* 1 03 .8 l l l * .0 111.1; 111*. 7 lll t.l; 108.0 1 2 8 .8 1 0 7 .9 H 8 .8 10li.lt 1 06 .9 9 9 .2 l l i t . 3 9 5 .7 1 2 8 .5 H 9 .0 133.1*August---- 1 12 .1 1 12 .2 1 23 .2 1 1 3 .0 1 0 6 .3 106. 1* 1 1 3 .9 111*. 9 (U) 1 08 .8 1 2 8 .8 1 0 7 .1 1 1 8 .8 10li. 2 1 07 .3 9 8 .8 1 13 .2 9 5 .6 131*.2 1 1 8 .8 166.1*September 1 1 2 .6 1 1 2 .6 121*. 8 1 13 .3 1 07 .6 1 0 3 .0 116. 1* 1 1 5 .1 (it) 1 08 .8 1 2 8 .8 1 0 7 .7 H 8 .8 105.9 106.L 1 0 2 .5 H 3 .5 9 6 .5 13ll.0 H 8 .5 166.1*October— 1 12.2 1 1 2 .0 1 2 5 .2 1 10 .9 1 0 8 .1 1 03.6 1 1 6 .1 H 5 .it <U) 1 0 8 .8 131.ii 1 0 7 .7 H 9 .3 105.9 106.L 102 .6 H 3 .5 9 5.9 13U.2 1 1 8 .8 166.1*November- 3 10 .7 110.1* 1 2 5 .0 1 07 .8 109.1* 1 0 1 .5 D1U.0 1 1 5 .5 (it) 1 08 .9 1 3 1 .8 107 .7 H 9 .2 105.9 1 06 .9 102 .2 111* .6 91-.8 1 3 3 .5 H 8 .0 166.1*Dee ember- 1 10 .9 1 10 .6 1 25 .3 1 0 8 .0 1 09 .7 lOlt.7 H l .l i H 5 .5 (It) 108 .9 1 3 0 .1 1 0 8 .0 H 9 .6 1 05 .5 106.6 101.1* 111*. 6 9l*.l* 1 33 .7 118 .2 166. 1*
See footnotes a t end of tab le ,
112
Digitized for FRASER http://fraser.stlouisfed.org/ Federal Reserve Bank of St. Louis

Table C-3. Consumer p ric e Index—20 larg e c i t ie s : Indexes of food, housing, a pparel, t ra n s p o rta tio n , and t h e i r subgroups.by y ear and month, 19U7-58—Continued
(19U7-U9-100)
Yearand
month
Food Housing Apparel Transportation
Tota
l 2/
4»c& Oa
s an
del
ectr
icit
y
Solid
fue
ls
and
fuel
oil
Hous
e-
furn
ishi
ngs
Hous
ehol
dop
erat
ion
Tota
l
Men
's an
d bo
ys' , !
| |
Foot
wear
Othe
rap
pare
l 3/
Tota
l
Priv
ate
i
Publ
ici
Tota
l 1/
Tota
l
Cere
als
and
bake
ry
prod
ucts
Mea
ts,
poul
try,
an
d fi
sh
Dair
ypr
oduc
ts
Frui
ts a
nd
vege
tabl
es
Othe
r fo
ods
at h
ome
.
New York, New York—Continued
195U: Average m .U no.9 125.6 107.8 105.2 106.U 115.6 n5.5 n6 .6 108.5 126.6 106.1 n 9 .i 10U.1 106.2 98.8 115.8 9U.0 132.U nu.2 178.8January— 110.9 n o . 8 125.5 108.7 108.8 10U.5 n2 .2 115.3 n5 .5 108.8 131.9 107.0 n9 .6 10U.8 106.8 100-.0 n5 .3 9U.1 135.6 m .8 179.6February- 110.6 no.U 125.7 108.8 107.8 101.2 n3.U n5 .3 (U) 108.7 133.U 107.1 119.3 10U.9 106.6 100.2 n5.u 93.8 135.1 117.2 179.6March------ 109.9 109.3 125.1 107.6 106.U 100.8 112.1 115.3 (U) 108.7 130.5 107.U 119.U 10U.5 106.6 99.6 m .u 93.6 13U.6 n 6 .6 179.6April—— 111.0 no.6 125.2 no.U 101.3 103.U n 5 .6 n5.o (U) 108.7 129.U 106.6 n 8 .6 10U.0 106.5 98.5 m .u 93.8 13U.1 n6 .2 178.6May--------- 111.3 m .u 125.2 no .5 100.6 108.8 n 5 .9 115.2 (U) 108.7 122.1 106.1 U8.9 103.9 106.7 98.2 m .u 9U.1 13U.5 116.7 178.6June——- 111.6 m . i 125.0 no.o 100.3 108.0 116.3 n5.U (U) 108.7 122.1 106.2 U8.8 103.9 106,3 98.1 n 6 .6 9U.1 13U.6 n 6 .8 178.6July—— 113.6 113.U 125.1 109.7 10U.2 nU.2 n9 .o n 5 .5 n6 .8 108.5 122 ,U 105.9 n8 .9 103.5 106.2 97 .U n 6 .6 93.8 129.3 110.7 178.6August— 113.1 n2 .8 125.2 107.8 105.2 no.9 120.9 115.5 (U) • 108.U 122.5 105.6 118.9 103.3 105.8 97.2 n6 .9 93.8 129.0 no.U 178.6September 111.8 i n .2 125.2 107.5. 106.0 107.2 n6 .3 115.8 (U) . 108.2 123.0 106.0 n8 .9 10U.U 105.9 99.6 m .3 9U.3 129.7 in .2 178.6October— 111.3 no .8 125.U loU.l 107.U 108.8 n6 .6 n5 .9 (U) 108.2 125.6 105.5 n8 .9 loU.l 105.3 99.3 m .u 9U.U 129.8 m .U 178.6November- 131.0 no .5 127.3 105.1 107.2 105.3 n 5 .8 n6.o (U) 108.2 126.0 105.0 n9.U 10U.U 105.8 99.U n 6 .i 9U.5 131.U 113.2 178.6December- 110.1 109.0 127.3 103.U 107.0 103.6 112.9 136.1 (U) 108.2 129.8 io5.o n 9 .i 103.7 105.9 98.0 m .9 9U.1 130.8 n2 .5 178.6
1955 s Average 110.8 109.7 128.5 103.9 10U.7 107.5 n3.3 n5 .7 n s.o 109.0 127.U 10U.3 m .3 102.U 105.8 95.U n7.o 93.3 128.9 no .3 178.6January— 110.6 109.6 127.3 10U.8 106.1 106.0 n2 .3 n6.U n7 .8 108.3 130.7 105.8 119.1 102.2 105.U 95.U m .9 93.3 130.1 m .7 178.6February- 111.1 310.2 128.3 106,2 106.1 105.1 113.2 n6 .3 (U) 108.6 130.7 105.5 m .o 101.9 105.5 95.0 m .8 93.2 130.1 m .7 178.6March-— 111.0 no.o 128.2 106.U 10U.2 105.U 113.3 n6.U (U) 108.8 130.7 105.1 m . i 102.1 106.1 9U.9 m .8 93.3 130.1 m .6 178.6April------ 111.6 no.7 128.2 106.6 IOU.1 m .U m .5 115.3 (U) 109.0 130.2 105.1 m . i 101.U 105.6 93.9 m .9 92.9 129 .U no.8 178.6May— — 110.5 109.3 128.0 10U.0 101.6 113 .U 109.5 11U.9 (U) 109.0 123.9 103.6 m .3 101.U 105.7 93.6 n 6 .8 92.9 128.8 no.2 178.6Jun S—-»■••• n o . 3 109.7 128.7 105.9 101.5 m .6 109.6 11U.9 (U) 109.1 123.9 103.U m .3 101.2 106.0 93.1 n6 .8 92.5 128.6 109.9 178.6July—— 111.6 no.6 128.9 10U.8 102.7 115.3 111.3 nU.9 m .8 108.9 12U.2 103.2 m .3 100.9 105.7 92.5 m .o 92.6 127.U 308.6 178.6August---- m .u no.U 129.0 10U.8 105.1 10U.9 n7.o n5.o (U) 108.6 125.5 103.1 m .3 101.2 105.9 93.0 m .o 92.6 126.8 108.0 178.6September m .9 no.9 128.8 105.0 105.9 107.0 n6.9 115.3 (U) 108.9 125.9 103.2 m .5 10U.2 106.0 98.6 m .u 9U.1 126.8 108.0 178.6October— no.5 109.2 3.28.7 101.9 106.P 103.8 n5 .5 116.3 (U) 108.9 126.6 10U.7 m .u 10U.1 105.9 98.U m .9 9U.1 127.8 109.1 178.6November- 109.9 108 .U 128.7 99.5 107.3 10U.1 llU.6 n 6 .5 (U) 109.8 126.6 10U.6 m .5 10U.2 105.9 98.U 118.3 9U.2 131.1 m .9 178.6December- 108.7 106.9 128.6 97 .U 105.3 101.7 nU.6 116.6 (U) 109.9 129.7 10U.2 m .5 10U.3 106.0 98.2 m .3 9U.2 129.5 m .o 178.6
1956: Average 111.5 109.9 129.8 99.9 105.7 llU.5 113.2 n 7 .9 120.5 110.3 137.2 102.9 m .u 10U.6 106.9 97.2 123.0 9U.5 133.1 m .u 187.5January— 109.1 107.3 128.7 96.6 10U.6 107.U 113.5 n6 .6 n9.o n o .i 132.7 102.6 120.7 102.9 106.2 95.U m .7 93.5 130.U no.U 186.7February- 108.6 106.6 129.0 96.3 10U.5 108.U 109.7 n6 .7 (U) n o .i 135.8 102.2 120.8 103.8 106.5 96.5 m . i 93.9 131.3 m .5 186.7March—— 108.8 106.9 129.1 95.6 10U.3 109.5 111.3 116.9 (U) 110.3 135.8 102.7 120.8 103.7 106.5 96.3 120.8 93.9 131.0 m . i 186.7April— 108.9 106.9 128.8 96.6 102.2 110.3 m . i n6.9 (U) no.2 135.8 102.1 m .u 103.7 105.9 96.3 122.3 9U.0 131.U m .6 186.7May--------- no .6 109.0 129.2 99.1 102.6 n 6 .6 m . i n7.o (U) n o .i 133.8 102.3 m .u 103.5 106.2 95.8 122.1 93.9 131.8 m .8 187.9
n2 .7 111.6 129 .U 99.6 103.3 128.7 m .5 n7.2 (U) no.o 135.5 102.7 m .u 103.8 107.2 95.7 122.9 9U.1 131.5 m .5 187.9July—— liU.o 312.9 129.8 100.9 106.0 128.5 n 3 .6 n 8 .i 120.8 no.2 135.8 103.1 m .6 10U.2 107.2 96.1 123.U 9U.3 132.1 m . i 187.9August---- n2 .6 no.9 130.3 101.8 106.8 113.7 11U.2 n 8 .3 (U) no.3 136.2 102.6 123.2 10U.1 107.U 95.9 123.U 9U.U 133.6 113.9 187.9September n3.U m .9 130.5 10U.3 107.1 112.0 n6 .7 n8 .6 (U) no.3 136.2 103.2 123.3 106.U 107.5 99.8 125.2 95.6 133.0 m .2 187.9October— 113.6 n2 .2 130.6 10U.0 108.0 113 .U n6.2 n 9 .i m .U no.u 1U0.2 103.7 12U.7 106.3 107.3 99.8 12U.9 95.5 137.7 n 8 .5 187.9November- n3.3 m .7 131.1 103.2 109.5 111.2 U5.U n9.U (U) 110.8 1U2.9 103.9 12U.7 106.2 107.5 99.U 125.1 95.5 136.8 m .5 187.9Dee ember- 112.6 m .o 131.1 100.6 109.7 U3.7 113.6 n 9 .6 121.9 no .8 1U5.9 10U.0 12U.7 106.1 107.9 99.0 125.U 95.5 136.8 m .5 187.9
1957s Average n5.o n3.o 13U.8 106.0 m .7 122 .U 112.3 121.8 123 .U m .o 1U6.U 10U.7 126.0 106.1 108.5 97.5 128.7 95.6 138.0 n8 .6 188.9January— 112.3 no.U 131.U 100.5 109.6 n2.3 n2 .2 120.1 (U) m .o 150.5 103.2 125i0 105.6 107.9 97.8 125.9 95.3 136.9 m .6 187.9February- n2.9 n i .2 132.9 103.U 109 .U 110.8 112.2 120.8 122.3 m .o 150.5 10U.5 125.0 10U.7 107.7 96.1 126.7 9U.U 137.7 n8 .2 189.0March— 112.3 no .3 13U.6 101.8 109.1 109.9 no .5 121.1 (U) 111.2 150.5 10U.6 125.1 106.2 108.3 98.0 128.1 95.6 137.8 118.U 189.0April------ 112.8 m ;o 13U.8 103.1 108.9 lll.U n o.5 122.2 122. U m . i i5o.o 105.7 125.2 105 .U 108.1 96.8 127.5 95.2 138.3 n 8 .9 189.0May— — 113.8 n 2 .i 135.1 105.2 108.1 116.5 108.8 1220. (U) m . i 1U5.8 10U.7 125.5 105.8 108.5 96.9 128.5 95.U 138.2 n 8 .8 189.0June— — 115.6 n3 .6 135.2 107.U 108.3 120.9 108.7 122.1 123.2 m . i 1U3.9 105.0 125.5 105.9 108.9 96.8 128.6 95.6 138.U m . i 189.0July------- n7 .3 n5.U 135.1 109.8 109.1 120.6 n2.U m .8 (U) no.9 1UU.6 10U.1 125.9 105.6 108.5 96.5 129.3 95.5 137 .U m .9 189.0August---- n7 .7 n5 .9 135.1 m .7 n2.U 116.9 n3 .2 122.1 123.7 m .o 1U2.8 loU.l 125.9 105.9 108.8 96.7 129.U 95.6 137.6 n 8 .i 189.0September n6.6 11U.2 135.2 109.8 UU.5 107.U nU.i 122.0 (U) m . i 1UU.1 1050- 126,0 106.7 108.7 98.5 129.2 96.1 137.1 m .6 189.0October— 136.5 nu.3 135.6 106.7 115.7 108.6 n7 .o 122.1 12U.U1m . i 1U3.8 105.2 126.2 107.0 108.6 98.8 129.6 96.2 136.9 m .3 189.0November- 136.0 n 3 .7 135.9 105.6 n7.U 107.6 115.0 122 .U (U) no.9 1U5.U 10U.9 128.2 107.2 108.7 99.0 130.9 96.U 1U0.3 m .2 189.0Dee ember- 115.8 U3.6 136.7 107.1 n7.U 106.1 n3.o 123.0 125.2 m .o 1U5.U 10U.9 128.2 107.0 108.8 98.5 130.9 96.3 139.6 120 .U 189.0
1958s Average 120.9 U9A 139.2 115.6 n5.8 123.5 m .6 12U.3 127.0 115.2 139.2 103.8 131.2 106.2 108.0 97.3 131.6 95.9 1U0.3 l a .o 190.3January— 118.6 U6.8 137.U no .7 n6.5 120.0 m .5 123.7 (U) 113.5 1U5.7 10U.9 130.3 106.7 108.7 97.8 131.6 96.1 139.6 120,U 189.0February- 119 a 117.5 137.2 n 2 .6 116.6 121.2 110.6 12U.3 125.7 n3 .5 1U3.9 105.2 130. U 106.7 108.6 97.8 132.1 96.1 139.0 n 9 .5 190.2March----- 122.0 120.5 137.7 U5.5 U5.2 129.9 nu.2 12U.0 (U) 113.5 1U2.1 10U.2 130.5 106.8 108.2 98.2 131.7 95.7 138 .a 119.3 190.2April------ 122.1 120.5 137.7 n 6 .6 nu.o 132.0 m .8 12U.2 126.2 113.5 137.1 10U.1 130.6 105.8 108.5 96.X 131.9 95.7 139.3 U9.8 190.2May--------- 121.9 120.5 137.7 U7.0 U2.1 13U.7 no.3 12U.3 (U) n6.U 135.6 10U.2 130.6 105.5 107.9 96.0 131.7 95.5 139.1 U9.6 190.2June------- 121.6 n9.8 137.8 118 .U 112.0 129.0 no.o 12U.3 126.9 n 6 .2 135.6 10U.2 130.6 105.5 107.8 95.9 131.7 95.7 139.0 119.5 190.2July-— - 121.7 120.1 137.7 118.8 nu.8 126.8 110.3 12U.2 (U) 116.2 135.6 10U.0 130.6 105.6 107 .U 96.U 131.U 95.8 139 .U 119.9 190.2August— 121.0 n9.o 137.7 116.7 n6.o 121.7 m .7 12U.U 127.6 n5.9 138.0 103.0 131.5 105.9 107.9 96.8 131.5 95.9 110 .1 120.7 190.2September 121.3 119.5 1U1.8 n6.7 n7 .8 U5.9 n5.o 12U.U (U) n5.9 138.3 103.0 132.1 106.7 107.9 98.2 131.5 96.3 110.1 120.7 190.2October— 1Z U n9.U 1U2.5 115.9 117.8 n8.3 n3.3 12U.6 127.9 U5.9 138.3 102.6 132.3 106.3 106.3 98.5 131.2 95.U 1U0.9 m .6 190.2November- 121.0 n9.o 1U2.U nu.9 U9.2 118 a 112.0 12U.7 (U) U5.7 138. U 102.9 132.3 106.7 108.2 98.0 131.7 96.1 1U3.7 12U.6 191.UDecember- 119 a U6.9 1U2.U 113.5 n7.9 n3.8 109.0 125.0 126.5 U5.6 1U1.U 103.2 132.U 106.6 108.2 97.9 131.7 96.1 1UU.7 125.8 191.U
Philadelphia, Pennsylvania
19U7s Average 95.9 9U.1 93.5 96.7 97.3 99.6 9U.6 9U.7 95.1 91.3 95.5 97.6 97.1 96.9 98.1 95.1 98.2 92.0 91.3 92.8January— 91.1 85.2 85.7 98.7 93 .U 9U.3 (U) (U) 90.3 89.7 93.6 95.7 9U.1 9U.0 95.5 91.9 90.8 85.U 88.9 81.6February- 89.8 ____ 85.5 8U.3 95.2 93.2 93.2 92.8 91.5 95.5 89.7 93.7 95.8 9U.5 9U.1 95.9 93.0 91.3 85.3 88.9 81.6March------ 9U.2 ___ 90.2 89.U 97.9 98.1 97.1 (U) (U) 95.5 89.7 93.7 96.3 96.5 97.1 97.1 95.1 92.1 91.8 89.1 9U.7April------ 92 2 93.8 86.5 90.3 97.2 97.5 (U) (U) 95.5 89.7 9U.0 98.3 96.6 96.5 97.9 9U.6 9U.5 92 .U 90.3 9U.7
Q'i f) 9U.* 87.8 88.8 102.1 9U.5 (U) (U) 95.5 86.1 9U.0 97.3 96.2 95.8 97 .U 9U.1 97.2 92.6 90.6 9U.7nay— —9U.8 9U.5 9U.1 88.7 102 .U 93.9 (U) (U) 95.5 86.1 9U.0 97.7 97.3 98.1 98.1 93.8 99.7 92.7 90.5 95.1o«J 7 9U.5 9U.2 93.3 99.7 97.5 9U.3 9U.1 95.5 88.3 95.0 97.6 97.0 97 .U 97.0 96.2 99.6 92.9 90.8 95.1y -------r
August— 97.2 95.0 97.8 95.5 97.6 99.5 (U) (U) 95.5 92.8 9U.9 95.8 97.0 96.9 97.8 95.2 100.0 93 .U 91.8 95.1101.3 96.U 105.1 101.3 95.2 106.5 (U) (U) 95.5 9U.6 97.1 96.5 97.9 97.7 99.2 95.2 100.5 9U.3 93.5 95.1SsptflnbBT
October— 99 .U ___ 95.7 101.8 99.U 93.3 106.8 (U) (U) 95.5 95.5 97.2 97.3 98.6 98.1 99.8 96.7 101.U 9U.3 93.6 95.1November- 100.1 . . . . . . . 101.0 97.3 103.U 96.2 105.8 98.8 99.2 95.5 96.3 98.5 100.U 99.1 98.6 100.2 96.9 10U.7 9U.5 9U.0 95.1Dee ember- 102.3 102.8 97.U 107 .U 99.7 108.5 (U) (U) 95.5 96.3 100.6 102.6 99.7 98.U 101.0 98.2 106.0 9U.6 9U.0 95.1
See footnotes at end of table.
113
Digitized for FRASER http://fraser.stlouisfed.org/ Federal Reserve Bank of St. Louis

Table C-3. Consumer Price Index—20 large c i t ie s : Indexes o f food , housing, apparel, transportation, and th eir subgroups,by year and month, 19U7-58—Continued
(19U7-U9»100)
Housing Apparel Transportation
Tearand
month
Food at tione
Tot
al
Cer
eals
and
ba
kery
pr
oduc
ts
Nea
ts,
poul
try,
an
d fi
sh
Dai
rypr
oduc
ts
Fru
its
and
vege
tabl
es
: I5s
ts •H-Po
« OHO «H 1•sS • -H3 e
« O«r3 2? 11oe-« £ OCO
2 S
l l
IQ 5 >1
n a c 60(4C0S
r4u% <0 3
i * 8a.3£ ■5
Pu 3PL,Philadelphia, Pennsylvania— Oontlnoad
19U8: Average- lQ U .l ___ 103 .3 1 0 6 .U 1 0 6 .U 1 00 .1 1 02 .3 102 .3 1 01 .5 100 .6 102.U 103 .7 103 .3 1 03 .1 1 0 2 . 7 1 0 3 . 3 1 02 .6 109 .9 100 .9 100 .2 1 01 .5January-— 10U.2 — — 103.lt 1 03 .0 1 08 .6 1 0 1 . 5 I05 .lt (li) (U) 100 .6 9 8 .5 9 9.3 IOU.1 1 00 .6 1 0 0 .2 1 0 0 . 3 100 .2 107 .0 95.U 9 5 .6 9 5 .1February— 1 01 .0 ________ 1 03 .9 9 6 .0 1 0 6 .U 1 03 .1 98.U 1 00 .7 1 00 .2 1 00 .6 9 8 .5 100 .9 1 02 .7 102 .2 1 0 1 .1 1 0 2 . 6 101 .9 110 .1 9 5 .6 9 6 .1 9 5 .1March-------- 9 9 .5 — — — 1 03 .8 9 5 .5 10U.9 9 9 .9 9 6.1 (U) (U) 100 .6 9 8 .5 1 02 .1 10U.9 102 .2 1 0 0 . 9 1 0 2 . 3 101 .9 1 H .5 9 5.7 96.2 9 5.1A p r il--------- 1 02 .8 _______ 1 03 .7 100 .7 1 0 8 .U loU .5 9 6 .7 (U) (U) 100 .6 9 8 .5 103 .2 105.2 1 02 .1 1 0 1 .U 1 0 2 . 0 101 .9 1 11 .7 9 9 .6 9 6.2 1 03 .3May------------ 103 .9 — 1 03 .5 1 05 .1 105 .9 105 .6 9 6.9 101 .6 1 01 .0 100 .6 9 8 .5 102 .6 io U .o 103 .U 1 03 .7 1 0 2 . 6 103 .U H l.U 9 9 .7 9 6 .3 103 .3June----------- 1 0 6 .1 . - — — 103 .3 H 0 .1 1 05 .0 1 08 .0 9 9 .6 (U) (U) 1 00 .6 9 9 .7 1 02 .8 1 02 .3 1 03 .1 102 .9 1 0 2 . 3 1 03 .5 112 .1 IOC.8 9 8 .5 103 .3J u ly ---------- 106 .9 ________ 103.lt H 2 .8 1 08 . U 103 .0 1 02 .1 (U) (U) 100 .6 9 9 .7 1 03 .7 102 .2 1 03 .1 103.2 1 0 2 .2 103 .5 H 2 .2 1 02 .3 1 01 .5 103 .3August— — 1 07 .7 103.3 H 6 .2 1 0 8 .1 9 9 .2 1 0 6 .U 103 .7 102 .1 100 .6 107.U 105 .7 102 .8 1 0 3 .6 103 .1 1 0 U. 0 102 .7 HO.U 1 0 U. 0 1 0 U. 0 IOU.OSeptember- 107 .5 1 03 .1 H 5 .3 109 .3 9 7 .5 107 .1 (U) (U) 1 00 .6 107.U 1 06 .7 102 .9 1 0 U.1 103 .3 io U .5 1 02 .9 109 .1 10U.3 10U.5 IOU.OO ctober— 1 05 .6 ____ — - 1 02 .8 H I . 3 105.U 9 6 .8 109 .3 0 0 (U) 100 .6 107.U 1 0 6 . 8 102 .9 10U.5 10U.2 1 0 5 .3 102 .8 108 .7 10U.3 10U.5 IOU.ONovember— 102.lt 102 .9 1 06 .5 1 03 .5 9 0 .5 108 .9 1 03 .9 1 02 .8 100 .6 107.U 105 .6 1 02 .6 10U.6 IOU.O 1 0 5 .U 103.U 107 .9 10U.2 10U.U IOU.ODecember— 1 0 1 .0 — 102 .9 1 0 5 . 0 103 .3 9 2 .3 100 .7 (U) Ot) 100 .6 107 .U 105 .2 1 02 .8 10U.3 103 .9 1 0 5 .0 103.U 1 0 6 . 6 10U.5 1 0 5 .0 IOU.O
19h9t Average^ 1 00 .1 1 0 2 .5 100 .1 9 6 .9 1 02 .5 9 8 .1 1 0 3 .1 1 03 .7 loU .U 1 0 6 .U 100 .7 9 9.2 9 9 .8 1 0 0 .U 9 8 .6 1 0 2 . 3 9 2 .0 107 .1 1 0 8 .U 105 .7January— 1 01 .6 _______ 102 .9 103 .2 1 00 .5 1 00 .1 1 0 0 .5 (U) (U) 1 00 .6 1 09 . U 102 .6 1 01 .5 1 01 .3 102 .5 100 .7 1 03 .1 9 9 .9 10U.9 1 0 5 .8 1 0 U. 0February— 9 8 .3 1 02 .8 9 7 .1 9 9 .8 1 0 3 .5 9 0 .7 1 03 .7 1 0 3 . 2 100 .6 109.U 1 02 .8 1 01 .3 1 0 1 .3 1 0 2 .U 1 0 1 .0 1 03 .1 9 9 .5 1 05 .3 1 0 7 .U 1 0 U.0March—— 9 9 .7 _______ 102 .3 9 8 .7 9 9 .0 lo U .5 9 2 .7 (U) 0 0 100 .6 109 .It 101 .9 1 01 .7 1 0 1 .U 102 .3 1 00 .3 102 .3 9 5 .9 105 .7 107 .3 1 0U.0A p r il— * 1 0 0 .3 102 .7 101 .9 9 5 .2 1 0 6 .U 9 3 .0 0 0 (U) 100 .6 1 03 .5 101.U 1 01 .3 100 .9 101 .3 9 9 .7 102 .3 9U.7 105 .9 107 .7 IOU.OMay 1 02 .6 9U.3 n n .n 9 3 .9 1 02 ,6 103.U 1 0 6 . 3 1 0 3 .7 l o o . U 9 8.7 1 0 0 .U 101 .2 9 9 .U IO3 .3 8 8 .3 H 5 .8 1 08 .3 1 0 3 .9June---------- 1 0 0 .7 1 02 .6 1 02 .8 9U.1 105.U 96.7 ( U) (U) 1 0 6 .3 103 .7 9 9 .5 98.U 1 0 0 .2 101 .2 98.7 1 03 .3 8 7 .6 1 0 6 . 3 1 0 8 .5 IOU.OJ u ly -— — 9 8 .9 ____ — 102 .3 9 9 .5 9 3 .e 102 .2 9 6 . 8 (10 (U) 106 .3 10U.1 1 00 .1 9 8.7 9 8 .1 9 8 .9 9 6.1 102 .1 9 0 .9 106 .8 1 09 .3 10U.0August------ 1 0 0 .5 — — 102 .2 102 .3 9 5 .0 1 00 .5 102 .2 1 02 .7 i o U.o 106 .3 10U.1 1 00 .1 9 7 . U 9 8 .0 9 8 .7 9 6 .0 102 .1 9 0 .2 106 .3 109 .3 1 0 U. 0September- 101 .3 . . . — — 102 .3 103 .9 9 5 .6 9 9 .9 10U.5 1 03 .0 10U.2 1 0 6 .3 105 .5 100 .2 9 7 .3 9 9 .0 9 9 .3 9 3 .3 101 .6 8 9 .5 1 06 .3 1 0 9 .U 1 0 U.0O ctober— 100 .3 . . . . . . . 1 02 .2 9 9 .8 98.3 1 0 0 .5 101 .9 1 03 .2 10L.3 106 .3 107 .1 9 9 .9 9 7 .3 9 8 .7 9 8 .8 9 8 .1 101 .U 89.3 1 0 6 .8 109.U 1 0 U.0November— 9 9.7 . . . . . . . 1 02 .3 9 7 .5 9 8 .5 9 9 .5 10U.0 1 03 .5 10U.U 1 06 .3 108 .2 9 9 .3 9 8 .U 9 8 .6 9 8 .7 9 8 .0 1 0 1 . U 89.3 106 .9 109 .5 1 0 U.0December— 9 8 .1 — 1 02 .2 9 5 .0 9 8.7 9 7 .3 1 00 .0 103 .5 io U .5 106.3 1 08 .3 99.9 9 7 .9 98.U 9 9 .0 9 7 .5 100 .8 89.2 1 06 .9 109.2 1 0 U.6
1950: Average- 1 02 .0 lO it.3 10U.8 9 6.3 99.2 103 .2 10U.U 105 .2 101 .8 108 .7 1 0 2 .U 9 9 .U 9 8 .0 9 9 .6 9 5 .U 101 .8 9 1 .3 107 .1 108 .1 1 0 6 . 0January— 9 7 .0 _______ 102.2 9 2 .2 9 5 .3 102.2 9 5 .8 1 03 .0 10U.7 101 .8 1 08 .3 9 8 .6 97.5 9 7 .3 9 8 .6 9 5 .3 100 .8 88.7 107 .0 1 0 9 .U 1 0 U.6February— 96.lt _______ 102 .0 9U.3 9 5 .3 9 8 .0 9 3 .8 1 02 .9 10U.S 101 .8 1 07 .5 9 8 .7 9 7.3 9 6 .7 9 8.7 9U.0 1 00 .3 8 9 .3 106 .9 109 .2 1 0 U. 6March-----— 9 8 .0 _______ 1 0 1 .6 98.2 9 5.7 9 7 .5 9 6.7 1 02 ,8 IOU.3 1 01 .3 1 0 6 . 0 9 8 .6 9 7 .U 9 6 .5 9 7 .6 9U.U 100 .2 8 9 .8 106 .9 109 .1 1 0 U.6A p r i l-------- 9 8 .1 . . . . — 102 .0 9 9 .5 9 2 .U 99.1 96.U 1 03 .0 1 05 .0 101 .8 1 07 .8 9 8 .7 9 7.3 9 6.3 9 7.9 9 3 .6 100 .2 89.8 1 06 .0 1 0 7 .U 10U.6May-— ------ 9 9 .1 . — ____ 102 .3 1 02 .9 92.3 1 00 .8 9 3 .6 1 02 .8 io 5 .o 101 .8 IOU.O 9 9 .0 9 7 .3 9 6 .5 9 9 .1 9 3 .5 1 00 .1 8 7 .U 106.U 108 .2 1 0 U.6June-----— - 102 .1 _______ 1 02 .2 106 .9 9 2.3 1 07 .8 9 5.2 1 02 .9 10U.9 1 01 .8 105.U 99.3 97.2 9 6 .5 9 3 .9 9 3 .5 1 00 .1 8 8 .6 1 06 .5 1 0 8 .U 1 0 U. 6J u ly ---------- 10lt.lt . . . . . . . 102 .0 H I . 5 9 5 .U 105.lt 9 9 .5 1 03 .2 i o 5 . o 1 01 .8 1 06 .1 9 9 .9 97.2 9 6 .3 98.3 9 3 .5 1 00 .2 8 7.9 1 06 .5 108.U 1 0 U.6August— — 1 05 .5 — 1 06 .3 11U.2 9 6 .0 9 6 .5 107 .7 10U.U 1 05 ,5 101 .8 1 09 .0 1 01 .5 9 9 .8 9 6 .5 9 8 .1 9 3 .3 101 .2 9 1 .3 1 06 .9 1 09 .0 1 0 U.6September* 1 0 5 .8 . . . . . . . 1 0 8 . 8 H 3 .3 9 6 .0 93.lt H 3 .1 (U) (U) 1 01 .8 110 .9 1 03 .9 101.U 9 9 .U 1 0 0 .8 9 7 .3 1 02 .0 9 3 .U 1 0 6 . 0 107 .3 1 0 U.6O ctober— 105.U . — . . . . 107 .7 108 .0 1 0 0 .6 9 5 .0 H U .2 (U) 0 0 1 01 .8 H 1 .9 1 08 .8 103 .8 1 00 .3 1 0 1 . 5 9 7 .6 103 .9 97.U 1 05 .2 1 05 .7 1 0 U.6November— 10U.8 --- -------- 106 .7 1 0 7 .5 100 .9 9 5 .8 1 H .0 107 .7 1 05 .9 101 .8 H 3 .6 H 0 .2 1 03 .5 1 01 .5 1 0 2 .U 9 9 .1 1 0 5 .6 9 8 .U 105.U 1 0 6 .2 1 0 U.6Decem ber- 107 .9 — 1 07 .1 108 .8 1 01 .5 9 9 .5 121 .3 (U) (U) 1 01 .8 11U.U H 2 .0 1 03 .7 1 02 .3 102 .8 9 9 .6 1 0 7 .U 9 8 .8 H 5 .0 1 0 9 .0 1 2 1 .3
1951: Average- 113 .It ___ H lt .9 H 7 .3 107 .8 107 .1 H 6 .7 109 .9 1 07 .2 1 01 .8 116 .9 H U .1 107 .0 107.U 107 .0 10U.9 HU.O 1 01 .2 1 26 .9 H 0 .1 lliU .3January— n o . 3 ________ 112 .9 H 2 .8 105.lt 1 05 .0 H 3 .6 0 0 0 0 1 01 .8 H U .5 H U .2 105 .8 105 .1 1 0 U.U 103.3 H 0 .1 101 .9 1 1 6 .0 H O .9 121 .3February— 112 .6 ___ ____ H lt .0 H 6 .3 1 05 .8 1 11 .6 1 H . 5 109 .7 1 0 6 . 1 101 .8 H 7 .2 H 5 .1 106 .7 1 07 .3 1 05 .5 1 0 6 . 1 H 3 .0 1 03 .5 128.U 1 H .2 1U6.UMarch— — 112 .2 _______ H lt.lt H 7 .5 105.U 1 05 .5 H U .1 (U) (U) 1 01 .8 1 1 8 .1 H 5 .3 1 0 6 . 6 107. U 1 0 5 . 7 1 05 .9 H 3 .7 1 0 3 .5 1 29 .0 1 12 .2 1U6.UA p r i l-------- 112 .7 ________ H 6 .0 H 7 .5 1 0 5 .7 1 0 6 .8 H 3 .3 (U) (U) 101 .8 H 7 .2 H 5 .1 106.U 1 07 .6 1 0 6 .1 1 05 .8 llU .2 105 .2 1 28 .9 H 2 .0 1U6.UMay------------ 113 .It _____ _ H 5 .0 117 .8 1 05 .8 109 .7 H U .9 1 09 .7 106.U 101 .8 11U.5 H 5 .U 1 0 6 .2 1 0 8 . 1 1 07 .5 1 05 .6 H U .7 1 03 .6 1 28 .9 132 .0 1U6.UJune-------- - 112 .6 ________ lllt .U H 6 .U 105 .9 1 08 .1 115 .2 .(U) 0 0 1 01 .8 H 5 .8 H 5 .0 1 0 8 .U 1 08 .0 1 07 .8 1 05 .1 11U.7 105 .2 126.U 1 07 .3 1U6.UJ u ly ---------- 113 .3 ________ H 6 .lt H 7 .U 107.U 1 05 .0 H 7 .9 (U) Oi) 101 .8 H 6 .2 H 3 .6 1 07 .7 1 06 .7 1 0 6 .9 1 0 3 .0 H 5 .0 IOU.O 125 .2 10U.8 1U6.UA u g u s t - 1 13 .1 . . . . ___ l i l t . 7 H 9 .0 107 .2 100 .3 120.2 1 0 9 .8 107 .1 1 01 .8 H 7 .1 H 3 .0 1 0 7 .U 1 06 .7 1 0 6 . 9 1 03 .1 H U .8 1 00 .9 1 26 .2 1 0 6 . 8 1U6.USept ember. 1 13 .6 H 5 .7 H 8 .8 108 .2 1 0 0 .U 1 21 .5 (U) (U) 1 01 .8 H 7 .1 H 3 .6 1 0 6 . 8 1 0 8 . 0 1 0 8 .2 1 0 5 .6 H 3 .9 9 9 .6 1 26 .3 1 0 7 .0 1U6.UO ctober— 115 .1 H lt .5 H 9 .U 1 H .5 10U.9 1 21 .1 (U) (U) 1 0 1 .8 H 7 .5 H 2 .5 107 .1 1 0 7 . 6 1 0 8 .U 1 0 U.7 H U .2 9 6 .6 1 25 .2 10U.8 1U6.UNovember-- 1 15 .9 . . . ____ H 5 .5 H 8 .U 1 11 .8 1 10 .2 1 20 .2 H 1 .0 1 0 9 .U 101 .8 H 8 .5 H 3 .2 1 07 .2 1 08 .0 1 08 .5 105.U 11U.6 9 5 .U 1 30 .8 H 5 .9 1U6.UD ecem ber- 1 1 6 . 0 — H lt .5 1 1 6 . 1 H 3 .U 1 1 7 .5 H 5 .6 (U) (U) 1 01 .8 1 1 8 .5 H 3 .U 1 07 .2 108 .0 1 0 8 . 6 105.U H U .5 9 5 .0 131 .0 H 6 .3 1U6.U
1952: Average 1 16 .5 ___ 1 1 6 . 6 H 7 .U H 3 .U 1 21 .6 H 0 .1 1 H .0 u i .U 1 0 1 .8 H 8 .6 . H O .3 1 07 .1 1 05 .2 1 0 5 .5 1 0 2 . 8 H I . 7 9 3 .5 131 .8 H 7 .9 1U6.UJanuary— 116 .3 _______ H U . 3 H 8 .1 l i l t . 7 H 9 .9 1 09 .5 (U) (U) 1 01 .8 1 1 8 .5 H 3 .1 107 .0 1 0 6 .2 1 0 7 .0 103 .1 H 3 .U 9 5 .7 1 3 0 .8 1 15 .8 1U6.UF ebruary-. 113 .7 ________ 113 .8 H 7 .U H 5 .2 1 12 .0 105.U H l . l H O . 8 101 .8 H 8 .5 1 H .9 1 0 6 .6 1 0 6 . 1 1 0 6 .3 1 03 .5 113 .1 9 5 .8 1 2 7 .1 1 09 .0 1U6.UMarch— 113 .7 ____ ___ 115 .2 H 5 .2 H 3 .7 1 16 .5 10U.6 (U) (U) 1 01 .8 1 1 8 .5 H I . 2 1 06 ,5 1 0 6 .U 1 0 6 . 0 10U.2 1 13 .1 9 5.3 1 32 .0 H 8 .2 1U6.UA p r i l-------- n 5 . o ________ 11U.9 H 5 .1 H O .2 1 25 .3 1 0 6 . 1 (U) (U) 101 .8 H 8 .2 1 10 .1 1 0 6 . 1 1 05 .1 1 05 .3 1 02 .1 1 12 .8 9U.1 1 31 .9 H 7 .9 1U6.UMay----------- 115 .6 _______ H 7 .8 H 5 .7 109 .5 1 27 .7 10U.6 H O .2 1 H .6 101 .8 H 2 .6 109 .1 105 .9 1 0 U.7 1 05 .5 101 .9 H 2 .0 9 0 .9 1 31 .8 H 7 .8 1U6.UJune— — — 1 1 6 . 0 H 7 .3 H 7 .U 1 09 .5 1 26 .1 105 .7 (U) (U) 1 01 .8 1 12 .5 109 .1 1 05 .8 1 0 U. 5 1 05 .5 1 01 .5 H I . 3 9 2 .3 1 32 .6 H 9 .3 1 U6 .UJ u ly ---------- 1 19 .2 ____ . . . H 7 .7 H 7 .2 112 .9 131 .0 l lU . 8 (U) (U) 101 .8 H 7 .6 1 08 .7 105 .8 1 0 U.6 1 0 5 . 0 1 0 2 .3 1 H .0 9 2 .0 1 32 .6 119 .3 1U6.UAugust— — 119 .3 ________ 115 .8 121 .U 1 13 .2 1 2 6 .1 ll lt .U H O . 8 1 H .6 1 01 .8 1 17 .8 1 09 .7 1 0 6 .1 1 0 3 . 8 1 0 U.7 1 00 .8 1 10 .6 9 2 .3 1 32 .6 H 9 .U 1 U6 .USeptember. 117 .7 H 7 .2 1 20 .8 113 .6 117 .8 11U.9 (U) (U) 101 .8 H 9 .3 H O . 2 1 0 6 . 1 1 0 5 . 7 1 0 U. 8 10U.8 HO.U 9 2 .6 1 32 .7 H 9 .6 1U6.UOctober— 1 17 .3 . . . ___ H 7 .8 H 7 .7 H 6 .3 H 5 .8 H 6 .7 0 0 (U) 101 .8 1 22 .8 H O.O 108 .2 305 .1 1 0 U.9 103 .7 H 0 .1 9 3.3 132 .7 1 19 .6 1U6.UNovember— 117 .2 H 8 .6 H 5 .6 116 .3 H 9 .9 H 5 .0 112 .2 H 2 .0 1 01 .8 1 2 3 .1 HO.U H 0 .1 1 0 5 . 1 1 05 .5 102 .7 H I . 3 9 3 .9 132 .7 H 9 .5 3.U6.UDecember— 1 16 .9 — H 8 .2 H 6 .7 H 5 .9 1 21 .5 H O .2 (U) (U) 1 01 .8 123 .7 H 0 .6 H l . l 1 0 5 .2 1 0 5 . 6 102 .8 1 11 .3 93.3 1 3 2 .5 1 19 .2 1U6.U
1953: Average* l i l t . 7 ll lt . l t H 9 .3 H 1 .5 112 .2 1 17 .2 1 H .9 113 .0 1 13 .0 101.9 123 .1 H O .2 H 2 .5 1 0 5 .0 1 0 5 .8 1 0 2 .5 110 .8 9 3 .2 13U.2 120 .3 150 .2January— 1 15 .5 115 .3 H 8 .0 H 3 .lt H lt .0 121 .3 109.U 112 .7 0 0 101 .8 125.U H 0 .1 H l . l 1 03 .9 1 0 5 . 8 1 0 0 .6 H O .7 9 1 .5 133 .3 119 .3 150 .2February— 113 .2 1 12 .7 H 7 .9 1 08 .6 1 1 3 .U H 8 .8 1 07 .0 1 12 .9 1 1 2 .U 1 01 .8 125.U H I . 3 H I . 2 10U.6 105 .7 1 01 .7 H 0 .9 9 2 .5 1 32 .8 1 18 .8 150 .2March— — 1 13 .5 U 3 .1 H 8 .0 108 .9 l l l i . l H 7 .5 1 08 .9 H 3 .0 (U) 1 01 .8 125.U H I . 3 H l . l 1 0 5 . 1 1 0 6 . 0 102 .2 H I . 2 9 3 .5 1 32 .8 H 8 .8 1 50 .2A pril------- 112 .9 H 2 .it H 8 .5 107 .8 109 .9 H 6 .6 H 0 .9 H 2 .6 (U) 101 .3 125.U H 0 .1 H I . 3 io U .o 1 0 6 .U 1 00 .2 H 0 .5 9 2 .8 133 .1 H 9 .1 1 50 .2May— —— 1 13 .3 112 .9 1 18 .6 H 0 .2 109 .7 1 16 .0 H 0 .1 H 2 .U (U) 1 01 .8 H 8 .9 1 0 9 .5 H 2 .5 1 0 U.2 1 0 6 , 5 1 0 0 .0 112 .1 9 3 .0 133 .5 H 9 .6 1 50 .2June—— . 115 .8 1 1 5 .8 H 9 .0 H I .9 109 .6 128 .7 H l . l H 2 .6 0 0 1 01 .8 H 8 .2 109 .9 H 3 .2 1 0 U.1 1 0 6 ,3 1 00 .0 1 12 .1 9 2 .9 1 33 .5 119 .5 1 50 .2July— — 1 15 .8 1 1 5 .8 H 8 .5 H 3 .5 111 .1 123 .1 H 2 .1 1 13 .0 0 0 1 01 .8 121 .8 1 09 .9 1 13 .2 1 0 3 . 8 1 0 6 , 5 1 00 .0 109 .7 9 2 .6 13U.9 121.3 1 50 .2August— 1 1 6 .5 1 1 6 .5 H 8 .9 H 6 .8 H l . l H 7 .8 11U.3 H 3 .0 113 .1 101 .8 1 21 .8 1 09 .5 H 3 .2 1 0 3 . 7 1 0 6 .2 100 .0 H 0 .1 9 2 .6 1 3 U.8 1 21 .0 1 5 0 .2Septemben- 1 15 .7 H 5 .5 120 .8 H U . 8 H l . l 1 11 .3 H 6 .7 H 3 .3 0 0 101 .8 123 .0 HO.U 113.U 1 0 6 . 5 1 0 5 .1 1 0 5 . 7 H O . 3 9U.3 135 .3 121 .5 1 50 .2October— 1 15 .8 l l 5 . l t 1 20 .9 H 3 .1 llU .O H I . 3 1 16 .3 323 .U (U) 102 .3 12U.3 H O . 5 113 .6 1 0 6 . 5 1 0 5 .0 1 0 5 . 9 110 .1 9U.7 135 .8 122 .1 1 5 0 .2
November- l l l i . l 113.lt 121 .2 1 0 8 .5 11U.2 1 10 .6 HU .O 113 .3 (U) 102.3 12U.3 H O . 2 H 3 .1 1 0 6 . 9 1 0 5 .1 1 0 6 . 6 1 10 .6 9U.U 135.U 1 21 .7 1 5 0 .2
Dee ember— l i l t .7 H 3 .9 121 .2 H O . 3 l l U . l H 3 .2 H I . 8 H 3 .2 0 0 102 .3 1 23 .0 H 0 .1 1 13 .2 1 0 6 .9 1 0 5 .1 1 06 .6 H O . 8 93.7 1 35 .3 1 21 .5 150 .2
See footnotes a t end o f table.
114
Digitized for FRASER http://fraser.stlouisfed.org/ Federal Reserve Bank of St. Louis

Table C-3. Consumer Price Index—20 large c i t ie s : Indexes o f food , housing, apparel, transportation, and th e ir subgroupsby year and month, 191:7-58--Continued
(191:7-1:9-100)
Tearand
month
Food Housing Apparel Transportation
Tota
l 1/
Food at
Tot
al
2/
I Qas
and
elec
tric
ity
Solid
fue
ls
and
fuel
oil
Hou
se-
furn
ishi
ngs
Hou
seho
ldop
erat
ion
Tota
l
Men
's an
d bo
ys'
SI Foot
wea
r
^1
J1* T
otal
Priv
ate
Pub
lic
Tota
l
Cer
eals
and
ba
kery
pr
oduc
ts
Mea
ts,
poul
try,
an
d fi
sh
Dai
rypr
oduc
ts
Fru
its
and
vege
tabl
es
Oth
er f
oods
at
hom
e
Philadelphia., Pennsylvania— Continued
1951:: Average 115.0 n b .2 120.9 110.1 109.2 115.7 115.6 113.9 115.2 102.3 119.5 109.0 113.8 105.8 10b.9 10b.6 111.0 92.8 137.3 120.9 165.1January— 115.3 111:.6 121.2 113.7 m .3 112.8 112.8 113.U (b) 102.3 123.8 109.5 H 3 .b 1 06 .2 105.5 105.1 110.8 92.5 136.1 122 .b 150.2February- llU .5 113.7 121.5 112.0 111.1, 109.9 113.0 113.6 l lb .5 102.3 12b.O 109.7 1 1 3 .6 1 06 .1 105.3 1 0 5 .0 110.8 92 .b 137.2 120.b 1 66 .9March------ 113.7 112.6 120.6 110.5 110.8 108.7 112.3 113.6 (b) 102.3 12b.O 109.3 1 1 3 .9 105.8 105.2 10b.5 110.8 92.2 137.b 120.6 166.9A pril------ llb .3 113.1: 120.8 112.li 105.5 110.0 115.8 113.5 (b> 102.3 123.2 109.1 H 3 .b 105.7 105.3 10b.2 110.8 92.6 137.2 120.6 1 66 .3May——— 115.6 11U.8 120.8 113.U 105.3 116.6 115.9 H3.U <U) 102.3 112 ,b 107.9 113.7 105.1 10b.9 103.3 110.8 9 2 .6 137.3 120.6 1 6 6 .3June— —- 116.5 115.9 121.6 113.5 105.3 122.1: 1 1 6 .0 113.7 (b) 102.3 113.b 108.7 113.7 105.1 10b.8 103.3 111.1 92.6 137.2 120.6 1 6 6 .3July— — 117.7 317.2 120.9 112.8 1 0 8 .1 126.2 118.2 113.7 (b) • 102.3 l lb .3 1 0 8 .8 113.7 105.3 10b. b lOb.O 110.7 92.7 136.9 120.1 166.3August— 117.2 116.6 120.9 110.3 1 0 8 .0 12U.U 120.7 113.9 115.5 102.3 117.1 108.1 113.8 105.6 10b.2 10b .6 m . i 92.9 137.1 120 .b 166.3September 115.2 llb .3 120.7 108.6 1 0 8 .3 117.8 117.3 llb .3 (b) ' 102.3 117.3 109 .b 113.8 106.3 10b.6 105.6 111.1 93.2 137.3 120.6 1 6 6 .3October— llb .5 113.5 120.5 10b.5 111.1: 118.3 117.1 n b .3 (b) 102.3 120.0 109 .b 113.8 106 .b 10b. 8 105.7 m . i 93.3 137 .b 120.7 1 6 6 .3Novenker- 113.1: 112.1: 120.8 105.3 112.3 l l l . i 115.U llb .5 <U) 102.3 1 2 1 .3 109.3 l lb .7 1 06 . b 10b.8 105.8 1 11 .2 93.3 138.8 122.3 1 6 6 .3December- 112.6 111.3 120.7 10b.5 112.5 110.2 112.1; n b .5 (b) 102.3 123.b 109.3 llb .7 105.8 10b.8 10b.6 1 11 .2 92.9 137.9 121.3 1 66 .3
1955: Average 113.0 111.8 121.8 10lt.lt 109.1 116.1: 112.0 llb .3 116.5 102.2 121.0 105.6 l i b . 8 10b. 9 10b.0 103.3 1 1 2 .0 92.0 136.3 H 8 .b 171.8January— 112.7 111.5 120.8 1 0 6 .5 109.5 U 1 .3 111.9 113.9 (b) 102,3 126.9 106.5 l lb .7 105.5 10b.7 lO b .l l l l . b 92.8 137.5 120.9 1 66 .3February- 113.2 112.1 121.0 106 .b 109.2 113.6 112.9 llb .b 116.3 102.3 126.9 107.0 l lb .6 105.6 10b .6 10b.3 l l l . b 92.8 137.9 121.3 1 66 .3March— — 113.3 112.1 121.0 1 06 .3 109.2 l l l i . 3 112.8 l lb .9 (b) 102.3 126.9 106.5 llb .3 10b.6 103.8 103.0 m . o 92.2 137.3 120.7 1 6 6 .3A pril—— 113 .a 112.3 121.0 107.0 1 0 6 .3 119.9 110.8 l lb .9 (b) 102.3 126.9 105.6 llb .3 10b.5 lO b .l 102.5 1 1 1 .5 92.0 137.1 120 ,b 166.3May--------- 112.9 111.7 120.9 10b.9 1 0 6 .0 12b.b 108.0 llb .O (b) 102.3 113.1 105.0 llb .3 10b .1 10b.3 101.6 1 1 1 .5 91.1 138.7 120.6 17b.6June-— - 113.1 111.9 119.9 106.7 1 06 .1 123.1 107.7 llb .2 (b) 1 02 .3 113.1 105.7 llb .3 103.9 10b.3 101.2 1 1 1 .5 91.5 139.1 120.9 17b.6July— — llb .2 113.3 122.9 106.3 1 0 8 .8 123.6 110.2 llb .O (U) 102.3 l lb .b 10b.9 l lb .3 103.5 10b* 3 100.3 m . 8 91.2 138.6 120.b 17b.6August— - l l b . l 113.1 123.0 105.6 108.7 117.8 l i b . 6 l l b . l 116.5 102.3 115.6 10b.2 llb .2 10b.3 lO b .l 101.8 1 12 .3 91.7 138.3 120.1 17b.6September 113.8 112.9 122.1 1 0 6 .6 108.9 115.5 llb .3 l lb .2 (b ) 102.3 118.1 10b.2 llb .O 105.9 103 .b 105.5 112 .3 92.3 129.5 110.3 17b.6October— 112.8 111.6 123.0 102.3 m .3 113.9 113.8 l i b . 8 (b) 101.8 121.0 105.7 llb .O 105.7 103 .b 105.0 1 12 .7 92.2 131.8 112.9 17b.6November- l l l . b 110.1 122.8 98.6 112.8 110.1: 113.6 n b . i (b) 101.8 122.1 105.8 117.2 1 0 6 .0 103.2 105.5 1 1 3 .0 92.b 135.5 117.0 17b .6December- 110.6 109.0 123.2 96.1 112.8 109.2 113.1 llb .O (b) 101.8 126.9 105.8 117.1 105.7 103.2 10b. 8 1 1 3 .0 92.2 13b.3 115.7 17b.6
1956: Average 113.8 112.2 126.7 99.1: 1 1 1 .1 121.9 112.6 l l6 .b 118.2 1 0 3 .0 128.b 107.1 119.3 105.1 lOb.b 101.1 1 18 .9 92.5 136.5 115.8 186.5January— n o .5 109.0 123.1 95.0 1 10 .1 115.0 112.1: 113.9 (b) 101.8 127.9 10b.2 U 7 .b 102.9 102.7 99.b l lb .2 90.7 135.8 115.1 186.0February- 110.3 108.7 123.5 96.0 1 1 0 .1 116.0 108.5 l l b . l 117.3 101.8 129.1 105.2 117.2 103.7 103.5 100.2 H 5 .b 91.2 135.3 l l b .6 186.0March------ m . i 109.2 123.9 95.3 1 0 9 .7 118.7 110.1 115.9 (b) 101.8 133.1 1 0 8 .8 l l8 .b lO b .l 103.9 100.1 117.2 92.0 136.0 115.3 186.0A pril------ 111.1: 109.5 12U.5 96.6 1 0 7 .2 119.3 110.6 116.2 (b) 103 . b 130.2 1 0 8 .5 l l8 .b 10b.2 103.9 100.1 117.6 92.0 13b.9 n b .i 186.0May--------- 112.9 111.2 12U.6 98.3 1 07 .5 125.3 111.0 115.9 (b) 103 .b 122.2 •1 0 6 .7 119.0 103.6 lOb.O 99.0 117.6 91.9 13b.3 1 1 3 .3 186.7June—— llb .6 113.2 12U.7 99.1: 107.7 135.0 110.8 116.2 (b) 103. b 121.5 107.9 119.3 103.7 lO b .l 9e.8 118.1 91.9 133.6 1 1 2 .5 186.7July-------- 117.5 116.2 12U.7 102.6 m .b 11*0.0 113.2 116.1 (b) 103.b 122.9 1 06 .7 119.7 103.9 lOb.b 98.9 119.1 92.0 135.5 l lb .6 186.7August---- 115.9 lllj.U 129.9 103.2 m .b 123.5 llb .O 117.2 n 8 .b 103 .b 12b.9 107.0 119.9 lO b .l lOb.b 99.0 120.3 92.0 137.2 116.5 186.7September 115.9 llb .3 130.0 103.2 1 11 .9 U 8 .7 116.U 117.8 (b) 103. b 126.2 107.8 120.0 107.8 105.8 10b. 7 121.8 9b.0 136.9 116.2 186.7October— 116.0 llb .3 129.9 102.3 m . 9 117.2 116.5 118.1 (b) 103 . b 130.1 107.8 120.0 107.3 105.3 lOb.O 122.0 93.9 137.5 116.9 186.7Novembar- m . 8 113.0 130.6 99.9 111:.6 115.9 115.2 117.2 119.3 103.b 13b. b 107.3 120.0 107.6 105.5 10b. 5 122.0 9b.2 lb o .6 120.3 186.7Deceriber- 115.2 113. li 130.6 100.6 1 16 .1 118.2 112.8 118.0 (b) 103.b 138.7 107.6 122.5 107.8 105.5 10b. 8 122.0 9b.3 lb 0 .8 120.6 186.7
1957: Average 118.5 116.5 132.5 107.6 116.7 121.8 112.5 120.7 123.0 103.b 136.1: 109.9 127.9 106.b 1 07 .0 100.b 12b.8 93.7 lb l .2 120.8 187.3January— 115.5 113.7 130.8 101.3 1 1 6 .0 118.3 112.0 118.6 120.1 103 .b lb l .5 109.0 123. >: 105.9 1 06 .2 10C.5 123.1 93.3 lb l .5 121.3 186.7February- 116.5 111:. 8 131.3 10b J: 1 16 .1 119. U 112.6 120.1 (b) 103 .b lb l .6 109.5 126.8 106 .b 1 06 .6 101.0 123.7 93.6 lb l .7 121.b 187.bMarch— - 1 16 .2 l lb .2 132.1 103.1: 1 16 .0 119.1 111.2 120.3 121.9 103.b lb l .6 3-10.5 127.5 1 06 .6 306.9 101.5 123.0 93.7 lbL.6 121.3 187 .bA pril------ 116.1: 111) .1 132. b 103.6 113.9 121.2 110.6 120.1 (b) 103.b lb l .6 110.2 128.1 105.6 107.1 99.2 123.1 93.b lb l .3 121.0 187.bJ fey-_____ 117.6 115.5 132.5 105.5 l l b . l 126.3 109.8 119.5 123.0 103.b 128.6 109.1 128.2 10b.5 107.0 97.1 123.6 92.8 lld .b 121.0 I87.bJune---- — 118.6 116.6 132.6 108.9 113.6 127.6 109.3 120.0 0 0 103. b 128.1 110.0 123.1 10b .b 106 .9 96.5 123.8 92.7 139.7 119.2 I87.bJuly-------- 121.1 119.3 132.7 112.1 116.7 129.7 112.7 120.0 123.5 103. b 128.9 108.9 128.1 1 06 .1 107.2 99.9 12b.0 93.6 139.1 118.5 187. bAugust---- 121.5 119.7 133.2 llb .O 117.0 127.2 113.2 120.6 (b) 103 ,U 131 .b 108.5 127.6 1 06 .1 107.1 99.b 126.3 93.6 139.5 118.9 187.bSeptember 120.7 118.5 133.0 112.b 117.): 121.9 11b.1 121.7 123.8 103 ,b 13b.0 110.3 127.3 107.8 107.1 102.7 1 2 6 .0 9b.5 139.8 119.2 187.bOctober— 120.b 113.1 133.0 108.9 120.0 120.1 116. u 122.2 (b) ‘ 103 .b 138.3 111.1 129.1 108.2 107.3 103.1 126.7 9b.6 139.5 118.9 187. bNoveriber- 119.0 116.6 132.9 107. b 119.9 116.9 l lb .b 122.1 12b. 7 103. b 138.3 n o .b 129.2 108.2 107.2 103.1 127.0 9b.6 lbb .9 12b.9 187.bDecember- 118.3 116.3 133.5 108.5 119.9 113.1: 113.7 122.6 (b) 103. b lb2 .5 111.2 130.8 106.7 107.2 100.2 127.1 93.8 lbb .3 12b.3 187.b
195” : Average 123.1 120.9 135. >: 115.9 118.9 129.9 111.1} 121.2 126.1 103.1: 133.b 109.3 132.8 105.1 106.2 96.1 128.6 92.6 lb5 .5 125.5 188.2January— 121.2 118.9 13b.O 112.2 119.8 12b.6 l l l . b 121.9 12b.7 103.b lb2 .5 110.1 130.0 103.8 106.8 95.0 127.5 9 1 .b lb 2 .2 122.0 187. bFebruary- 121.7 119.1: 133.7 113.7 119.9 125.3 111.0 121.9 (b ) 103.1: 1U2.0 111.0 129.9 103.9 107.1 95.0 127.0 91.9 lU l.b 120.9 188.1March---- - 123.1: 121.3 1314.1 115.7 119.8 129.3 113.6 121.8 125.6 103. b lb l.O 110.0 132.0 10b.3 107.1 95.6 127.1 92.2 lbb.6 12b.5 188.1Ap^il------ 123.1: 121.1: 133.8 116.5 115.6 135.1* 111.9 121.2 (b) 103. b lb0 .3 109.1 132.0 103.7 107.1 9b.2 128.7 92.0 lbb .9 12 b. 8 188.1May--------- m .o 122.2 13li.5 117.1 115.5 lb l .5 109.9 120.5 125.6 103.b 125.1: 108.5 132.0 10b.5 109.5 9 b .1 128.7 92.3 lbb.2 12b.0 188.1June----- - 123.9 122.0 13b.3 118.9 115.5 136.9 109.9 120.9 (b) 103.b 125. b 109.6 13b.3 10b.5 109.5 9 b .l 128.7 92.3 lbb.3 12b.1 188.1July------- 12b.7 122.7 13U.5 120.2 119.3 135.1: 110.1 120.7 126.5 103.1: 126.8 108.7 13b.2 103.1 109.1 91.7 128.8 91.6 lb5 .b 125.b 188.1August— - m .3 122.2 131:. 2 118.6 118.7 133.2 111.7 121.0 (b) 203 .b 129.1 108.6 13b.9 103.8 108.9 93.0 129.1 92.0 II46.I1 126.5 188.1September 123.3 120.9 13U.6 115.7 113.8 126.5 11U.6 120.6 126.5 103. U 130.8 109.5 133.b 107.6 108.3 100.9 129.1 9b.0 lb6 .7 126.8 188.1October— 122.9 120.7 138.5 113.6 121.7 126.1 112.1: 120.8 (b ) 103.b 130.8 108.7 133.6 107.2 108.3 100.0 129.2 93.7 II16.2 126.3 188.1November- 122.3 120.0 139.0 l lb .7 121.1: 121.3 111.5 121.3 127.2 103. b 132.2 109.0 133.7 107.3 108.2 100.1 129.6 93.7 lb 9 .9 130.2 183.9Dee ember- 121.8 119.1: 139.5 113.8 121.3 123.1 108.2 121.5 (b) 103.b 13U.9 108.6 133.7 107.1 108.2 99.8 129.6 93.7 150.3 130.7 188.9
Pittsburgh, Pennsylvania
19U7: Average 96.2 93.1 9 b .l 97.8 97.0 100.11
95.5 95 .b 100.0 86.9 96.0 98.2 96.3 96.3 98.2 92.3 96.6 91.6 92.3 90.bJanuary— 90.0 90.2 81:.3 98.0 8 6 .9 95.1: (b) (b) 99.9 80.0 93 .b 96.b 93.1 96.6 9 b .8 8b.b 82.b 89.7 89 . b 90.2Februa ry- 90.2 ------- - 90.1 85.5 95.8 89.6 93.3 (b) (b) 100.0 79.9 93.5 97.0 9b.b 96.7 96.6 86.9 85.U 89.6 89.3 90.2March------ 93.3 ___—_ 92.1 88.3 99.1 92.8 96.9 (b) (b) 100.0 79.9 9b.2 96.6 95.9 96.0 98.5 90.2 95.0 90.2 90.3 90.2A pril------ 92.3 ___—. 9b .1 86.8 9lu9 92.8 98.0 9b.0 93.1 99.9 79.9 9b.b 99.6 95.6 9b.9 98.1; 91.1 95.0 90.9 91.3 90.2May--------- 93.5 ______ 9U.7 85.5 90.7 101.3 95.3 (b) (b) 100.0 79.9 93.6 98.3 95.7 95.2 9 8 .b 91.1 95.0 90.9 91.b 90,2June-------- 95.7 --------- 92.1 9b.3 91.7 10b.6 9b .2 (b) (b) 100.0 79.9 92.8 96.5 95.0 95.b 96.b 91.1 95.0 91.1 91.b 90.6July-------- 97.1 92.1 96.9 9U.5 103.5 97.5 (b) (b) 100.1 91.9 9b. 9 97.2 9k. b 95.2 95.1 91.3 9 b .7 91.2 91.6 90.6August-— 98.2 --------- 90.U 300.9 ?6.1 100.9 98.7 0 6 .7 96.2 100.0 91.9 97.9 95.6 96.b 96.5 97.6 93.5 97.3 92.0 92.9 90.6September 101.9 — 92.7 105.5 101.8 100.8 105.0 (b) (b) 100.0 91.9 98.0 95.7 98.1 97.9 99.9 9 b .l 103.6 93 .b 95.1 90.6October— 100.1 ______ 93.6 103.1 98.9 95.8 107.5 98. b 98.3 100.0 91.9 99.1 98.3 98.6 96.9 101.2 95.7 103.9 93.b 95.0 90.6November- 99.7 ______ 97.2 96.7 103.U 96.1 108.1 •:>*> (b) 100.0 9b.9 99.5 101.9 99.1 97.1 101.2 97.9 105.2 93.5 95.2 90.6Dee ember- 101.3 99.0 97.3 108.1 98.3 110.7 (b) (b) 100.0 101.1 100.1 10b. 7 99.6 97.6 100.6 100.2 106.7 93.b 95.1 90.6
See footnotes at end o f table.
115
Digitized for FRASER http://fraser.stlouisfed.org/ Federal Reserve Bank of St. Louis

Table C-3. Consumer Price Index—20 large cities: Indexes of food, housing, apparel, transportation, ani their subgroups,by year and month, 1917-58—Continued
rood Housing Apparel
Tota
l 1/
Food at iome
Tota
l 2/
Rent
>»o
•sS<* o
Solid
fue
ls
and
fuel
oil
Hous
e-
furn
ishi
ngs
Hous
ehol
dop
erat
ion
Tota
l
1■ £ i * W
omen
's an
d gi
rls'
Foot
wea
r
Othe
rap
pare
l 3/
Tota
l
Cere
als
and
bake
ry
prod
ucts i t
Pi3
if Frui
ts a
nd
vege
tabl
es
Othe
r fo
ods
at h
ome
Transportation
Tearand
month
Pittsburgh, Pennsylvania—
191*8* Average 1 03 .8 1 02 .9 106.0 10lt.9 1 01 .2 1 02 .3 1 02 .2 1 00 .9 1 0 0 .0 106.1 1 01 .1 1 03 .3 1 0 2 .7 1 02 .0 1 02 .1 1 0 1 .5 1 0 8 .1 1 03 .1 1 00 .0 1 03 .7January— 103.1* . . . . . . 1 03 .1 1 0 1 .5 1 0 6 .7 1 0 1 .5 106.0 1 00 .9 9 9 .1 1 00 .0 1 0 2 .1 100 .2 1 0 6 .5 98 .3 9 8 .0 9 6 .1 3 01 .5 1 06 .9 9 8 .3 9 5 .2 1 0 3 .1February- 9 9 .8 . . . . . . 1 0 1 .0 9l*.l 1 05 .3 1 0 1 .9 9 8 .3 (1 ) (D 1 00 .1 1 02 .1 1 01 .3 1 03 .7 9 9 .9 9 9 .8 9 7 .1 1 0 1 .8 1 0 8 .1 9 9 .3 9 6 .8 3 0 3 .1March----- 9 9 .5 -------- 103 .2 96.2 103 .3 99.1* 9 8 .3 ( l ) ( l ) 1 00 .0 1 0 2 .1 1 0 2 .8 1 0 2 .1 1 0 0 .5 1 00 .1 9 7 .7 106.1 1 08 .8 99 .3 9 6 .8 1 0 3 .1A p ril------ 1 01 .9 1 01 .6 100.1* 106. 1* 10lt.2 9 6 .9 1 00 .8 9 9 .1 9 9 .9 1 0 2 .1 1 03 .0 1 0 1 .8 1 0 0 .8 1 00 .2 9 8 .1 106 .2 1 09 .1 9 9 .3 9 6 .8 1 0 3 .1May-------- 103.8 — —. 1 0 1 .5 1 05 .7 10U.6 1 07 .2 97.1* (1*) (D 1 0 0 .0 1 0 2 .1 1 03 .9 1 02 .8 1 01 .0 1 01 .9 9 7 .9 1 01 .7 1 0 7 .1 9 9 .1 9 7 .0 1 03 .1June------- 1 0 6 .7 — 1 03 .2 1 11 .7 101*.!* 1 0 9 .8 9 9 .2 ( l ) ( l ) 1 00 .1 1 0 2 .1 1 0 3 .1 1 02 .2 101 .7 1 01 .1 1 0 0 .1 101 .7 1 08 .9 9 9 .8 9 7 .6 1 0 3 .1J u ly ------- 1 0 8 .0 . . . . . . 1 0 3 .8 Iliu O 1 07 .3 1 0 8 .0 1 01 .0 1 0 3 .0 1 01 .7 1 00 .1 1 0 7 .5 1 05 .0 1 0 3 .1 1 01 .8 1 0 2 .0 1 00 .1 1 03 .9 1 0 9 .5 1 01 .8 1 00 .9 103.UAugust— 1 0 7 .3 -- ------ 103.1* H 5 .9 106.1 101 .1 1 0 3 .5 (U> (U) 1 00 .1 U 0 .5 1 05 .3 1 0 3 .1 1 01 .0 1 0 2 .1 1 05 .2 1 0 1 .6 1 09 .1 1 0 3 .6 1 03 .2 10I .1September 1 0 6 .7 . —---- 1 03 .3 111*. 7 106.8 9 7.3 1 05 .9 ( l ) ( l ) 1 0 0 .1 u o . 5 106.0 1 0 3 .0 1 05 .7 1 0 1 .5 1 07 .1 1 0 1 .6 1 09 .3 1 03 .8 1 03 .6 1 01 .1O ctober-- 1 0 1 .5 1 03 .0 1 09 .5 1 03 .3 9 6 .5 108.0 1 0 3 .6 1 02 .1 1 00 .0 u o . 5 106.2 1 02 .7 1 05 .9 1 01 .6 107 .6 1 0 b .1 1 09 .0 1 01 .0 1 03 .8 l O l . lNovember- 1 0 2 .5 ______ 1 02 .7 105 .3 1 0 1 .7 9 3 .2 1 1 0 .0 ( l ) (D 1 0 0 .0 u o . 5 106.1 1 02 .7 1 0 6 .5 1 0 5 .0 108 .9 1 0 1 .5 1 07 .6 1 03 .9 1 03 .7 1 01 .1December- 1 01 .1 — 1 0 2 .6 1 02 .7 1 02 .9 9l*.3 1 0 3 .0 ( l ) (D 1 0 0 .0 u o . 5 106.2 1 0 1 .6 1 06 .3 1 0 1 .1 1 08 .9 i o l . 5 1 0 6 .8 lO tu l 1 01 .1 l o l . l
1 9l9 : Average 1 0 0 .0 l o l . o 1 00 .0 9 7 .3 101 .9 9 7 .6 102.1* 1 03 .7 1 0 0 .1 1 0 7 .1 9 9 .9 9 8 .6 1 00 .9 1 01 .7 99 .7 1 0 3 .1 95 .2 1 0 7 .0 1 0 7 .7 105.8January-- 1 0 1 .1 — — 1 0 5 .1 100.5 1 0 2 .5 9 8 .7 1 0 0 .0 1 0 3 .8 1 03 .1 1 0 0 .0 u o . 5 1 01 .3 1 03.3 1 01 .8 1 03 .1 1 06 .5 1 01 .3 101 .9 1 0 1 .7 1 0 5 .0 l o l . lFebruary- 9 8 .3 ______ 10U.3 9 l . 5 1 01 .2 101.1* 9 2 .5 (D ( l ) 1 0 0 .1 u o . 5 1 02 .3 100 .9 1 0 1 .3 103 .2 1 05 .5 1 01 .3 1 03 .0 1 0 5 .6 1 0 6 .5 l o l . lMarch------ 9 9 .1 — 1 03 .2 9 7 .5 1 0 0 .1 10l*.l* 9 2 .7 ( l ) CD 1 00 .1 u o . 5 1 0 2 .1 1 00 .8 1 0 3 .5 102 .2 1 01 .9 l o l . l 9 7 .0 1 0 5 .5 106.1 l o l . lA pril------ 1 0 0 .1 1 0 7 .0 9 9 .2 9 5 .9 106.6 9 2 .6 1 0 2 .6 103 .3 1 00 .1 io 5 .7 1 0 1 .5 1 0 0 .1 103 .3 1 0 1 .6 1 0 1 .9 1 01 .1 9 6 .0 1 05 .9 1 0 6 .9 l o l . lMay—------ 1 01 .1 -- ------ 1 06 .7 9 9 .1 9l*.9 112.2 93.1* CD ( l ) 1 00 .1 io 5 .6 1 0 0 .0 98 .3 101 .2 1 0 1 .6 100 .2 l o l . l 93 .1 1 06 .3 1 07 .6 l o l . lJune------- 1 0 1 .5 103.U 103 .2 9 l . 9 1 09 .1 9l*.5 ( l ) ( l ) 1 0 0 .1 io 5 .6 99 .2 9 8 .1 1 0 1 .0 1 0 1 .9 9 9 .6 1 03 .3 9 l . l 1 06 .9 108.6 l o l . lJu ly ------- 9 9 .8 . . . . — 1 0 3 .0 1 01 .5 9 1 .6 1 03 .6 9l*.9 1 02 .3 1 03 .9 1 0 0 .1 1 05.3 1 00 .6 9 7 .6 1 0 0 .0 1 0 1 .6 9 6 .8 1 01 .7 9 1 .9 1 06 .9 1 08 .6 l o l . lAugust---- 1 01 .0 . . . . . . 102 .7 10U.7 95.U 1 0 1 .1 9 9 .0 ( l ) ( l ) 1 00 .1 1 05 .5 9 7 .9 9 6 .8 9 9 .7 1 01 .1 9 6 .3 101 .7 93 .3 1 0 6 .9 1 08 .6 101.1September 1 01 .1 . —. — 1 0 3 .0 101 .8 9 5 .6 98.1* 1 02 .0 1 01 .8 1 0 1 .0 1 00 .1 io 5 .5 9 8 .0 9 6 .3 9 9 .0 101 .2 9 6 .5 1 01 .2 9 2 .2 1 0 6 .9 108.6 1 01 .1October— 9 9 .5 . . . ---- 1 0 3 .1 1 00 .3 9 7 .2 9 6 .0 1 02 .3 1 01 .9 1 01 .3 1 00 .0 106.8 9 7.7 9 6 .3 9 8 .6 1 00 .8 9 5 .9 1 01 .2 9 1 .3 1 06 .9 1 08 .6 10I .1November- 9 9 .8 -------- 1 03 .3 9 8 .3 9 7 .5 9 7 .2 1 05 .9 1 01 .9 1 01 .3 1 00 .0 3 0 6 .8 9 7.7 9 6 .3 9 8 .1 1 00 .7 9 1 .9 1 00 .8 9 2 .6 1 0 7 .0 1 08 .7 l o l . lDecember- 9 7 .6 — 1 0 3 .2 95.7 9 7 .6 9 3 .6 101.1* 1 0 2 .0 101 .3 1 00 .1 106.8 9 7 .1 9 7 .7 9 7 .6 1 0 0 .1 9 3 .9 1 00 .8 9 2 .1 U l . 5 1 0 8 .1 1 21 .6
1950: Average 1 01 .1 ___ 1 02 .6 103.1* 9 5 .0 9 8 .0 1 01 .6 103 .2 1 05 .3 1 00 .1 106.8 9 9 .3 5 8 .1 98.1 1 0 0 .3 93 .9 1 02 .3 9 5 .7 1 1 8 .9 1 0 9 .1 135.1January— 9 7 .0 ___. . . 1 02 .5 93.1* 9 7 .8 9 9 .0 95.9 1 02 .1 1 01 .6 1 00 .1 106.8 9 7.2 9 7 .2 9 7 .5 1 00 .8 9 3 .1 1 00 .8 9 3 .5 111 .7 108 .7 1 21 .6February- 9 6 .1 . . . . . . 1 02 .6 9 3 .1 97.U 9 8.9 9 l . 8 101 .9 1 01 .6 1 00 .1 106.8 9 6 .5 9 6 .8 9 7 .3 1 00 .7 9 2 .8 101 .3 9 3 .5 U l . 6 1 08 .5 1 21 .6March-— 9 6.5 . . . . . . 1 01 .8 9 6 .0 92.1* 9 6 .1 9 7 .1 1 01 .9 1 01 .7 9 9 .9 1 0 7 .6 • 9 6.7 9 6.7 97.2 1 00 .0 9 3.2 100 .6 9l.O u l . 5 108 .3 1 21 .6A p ril------ 9 7 .7 ______ 101.1* 98 .2 9 2 .3 98 .2 9 8 .0 1 01 .9 101 .7 1 00 .1 1 07 .6 96.6 9 6 .7 9 6 .5 9 9 .8 9 1 .9 1 00 .6 9 3 .3 U 3 .9 1 0 7 .5 1 21 .6May-------- 99 .7 101.9 1 0 2 .3 9 2 .3 1 03 .1 9 6 .2 1 01 .6 105 .1 1 00.1 1 0 1 .1 9 1 .9 9 6 .5 9 6 .7 99 .7 9 2 .6 100 .2 9 2 .3 U l . 6 1 08 .5 1 21 .6June------ 1 0 0 .8 __. . . 1 0 1 .6 105.1* 9 1 .9 10li .5 9 6 .0 1 01 .8 1 05 .7 1 00 .1 1 0 1 .1 9 5 .1 9 6 .3 9 7 .0 9 9 .1 9 3 .3 1 00 .9 9 1 .9 U 5 .0 109 .2 121 .6Ju ly ------ 1 0 2 .6 ___. . . 1 03 .7 1 09 .0 9 2 .0 103.8 9 9.9 1 0 2 .3 105 .7 1 00 .1 1 0 1 .1 9 7 .0 9 6 .2 9 6.7 9 8 .9 9 3 .0 1 00 .9 9 1 .9 1 15 .3 1 0 9 .5 121 .6August— 1 0 3 .6 . . . . . . 1 0 3 .0 111.1* 9 2 .7 97.3- 1 0 7 .1 1 03 .3 105 .7 1 00 .0 1 07 .7 99 .2 98.3 9 7 .3 9 9 .1 93 .2 3 01 .9 9 6 .1 1 21 .6 1 10 .2 I 5 b . lSeptember 1 01 .3 . . . __ 1 0 3 .5 111.1* 9 7 .5 92 .1 1 10 .7 ( l ) CD 1 0 0 .0 1 07 .6 1 0 1 .1 9 8 .6 9 9 .6 1 0 2 .1 9 5 .5 1 0 1 .0 9 7 .5 1 2 1 .8 1 1 0 .5 150.UOctober— 101 .9 __ __ 1 03 .7 1 07 .6 9 7 .7 9U.9 1 1 8 .0 1 0 5 .1 105 .9 1 00 .0 1 07 .6 1 0 1 .7 1 01 .1 1 00 .1 1 02 .7 95 .6 1 0 1 .8 9 9 .5 1 21 .9 1 10 .6 1 50 .1November- 103 .9 1 03 .9 1 05 .8 9 7 .6 9 3 .9 1 16 .9 ( l ) (D 1 00 .1 1 0 8 .5 1 05 .1 101 .2 1 00 .6 1 03 .0 96 .3 1 0 1 .9 1 01 .3 1 2 1 .9 U 0 .7 i 5 o . lDecember- 105 .9 — 1 03 .9 106.8 98.3 9 5 .0 12l*.5 ( l ) ( l ) 1 00 .1 1 0 8 .5 1 06 .7 1 02 .0 1 00.6 103 .2 9 5 .5 106.1 1 0 3 .? 1 2 5 .0 1 10 .8 1 5 0 .1
1951: Average 1 12 .0 ___ 1 1 2 .7 1 1 3 .5 1 05 .5 1 0 6 .0 1 20 .7 u o . l 1 0 8 .5 1 09 .8 U 1 .8 U 1 .2 1 09 .3 1 06 .3 309.1 1 00 .9 u l . l 1 06 .7 1 2 8 .6 1 13 .1 1 56 .1January— 108.1 1 09 .6 1 10 .2 1 01 .9 1 00 .3 U 7 .1 1 08 .5 1 05 .9 1 10.6 1 0 9 .0 U 0 .6 1 01 .2 103.3 3 05 .9 9 6 .7 1 U .0 1 08 .9 1 2 5 .0 1 1 0 .8 1 50 .1February- 1 1 0 .5 ____ 1 1 1 .9 112 .8 1 0 2 .8 1 07 .0 1 16 .1 Cl) ( l ) 1 10 .6 XU . 2 1 U .0 101 .6 1 05.6 1 0 7 .0 100.9 1 11 .7 1 0 9 .5 1 21 .8 111 .1 150.1Karch----- 110 .1 1 H .8 1 13 .1 1 02 .7 1 0 3 .8 U 8 .7 ( l ) ( l ) U 0 .6 U l . l m . i 1 0 1 .8 106.1 107.3 1 0 1 .8 U 3 .2 U 0 .9 126.0 1 1 2 .3 l 5 o . lA pril------ 1 10 .7 ______ 1 1 1 .8 llii.O 1 0 1 .5 1 0 2 .8 1 1 7 .5 109 .7 1 07 .1 1 10 .6 1 12 .1 U 2 .0 1 01 .7 1 06 .5 107.1 1 01 .5 1 1 1 .5 109. e 126.0 1 12 .3 150.1Kay—— 1 12 .0 — 1 1 1 .1 u l . l 10l*.5 108 .9 U 8 .5 (D (D u o . 5 1 12 .1 U 2 .0 108 .2 106.7 1 08 .7 1 00 .9 3 11 .6 U 0 .1 1 26 .1 1 1 2 .1 i 5 o . lJune---- — 1 11 .9 1 12 .7 1 1 3 .5 10it.9 107 .7 1 19 .2 (1 ) ( l ) u o . l 112 .1 U 1 .9 1 07 .7 106.0 1 08 .5 1 0 0 .0 U l.O 1 09.2 1 26 .1 112 .1 1 50 .1Ju ly — — 1 13 .2 . . . __ 1 1 3 .6 n l* .3 1 06 .7 109 .1 1 2 1 .0 i n . 5 108 .3 110 .7 1 12 .1 U 2 .3 U 3 .5 1 07 .0 1 09 .5 1 00 .2 1 1 6 .5 1 12 .0 126.1 U 2 .5 1 50 .1August---- 1 12 .7 _____ 1 13 .6 n 5 . i 107 .2 103 .2 1 22 .7 ( l ) ( l ) U 0 .7 1 12 .1 U 0 .8 U 3 .3 106.7 1 09 .5 99 .9 U 6 .3 1 07 .6 126.3 U 2 .5 150.1September 112.2 ______ 1 13 .5 U l . 8 1 06 .9 99.U 1 21 .1 (U) (D 110 .7 U 2 .1 1 11 .0 U 2 .3 108 .8 U l . l 103 .8 115 .3 101 .8 1 3 2 .0 1 12 .5 167.5October— 1 13 .5 _____ 1 13 .9 U l.l; 106.8 1 05 .0 1 26 .6 m . 8 l i o . l 1 10 .8 1 12 .5 1 10 .3 112.7 10P .7 1 12 .6 102 .9 U 5 .3 1 00 .5 1 3 3 .1 1 H .6 167.5November- U l . 3 _____ 111*. 8 1 13 .6 1 07 .9 109.1; 126 .3 ( l ) ( l ) 105 .7 1 12 .6 U 0 .6 1 12 .6 1C8.1 1 12 .7 1 01 .6 1 15 .1 9 9 .6 1 36 .0 1 18 .1 3-67.5Dee ember- U l.O — lll* .6 111 .7 108 .7 1 15 .8 1 20 .3 ( l ) ( l ) 1 05 .7 1 12 .6 1 11 .1 1 12 .6 1 07 .1 1 U .8 1 00 .9 115.0 9 9.9 1 3 6 .0 u e . i 167.5
1952: Average 1 11 .0 ___ 116.9 XLl.li 1 1 0 .5 3 18 .9 l l l i . 3 m . 9 113 .2 1 07 ,6 U l . 5 107 .7 1 11 .9 1 01 .1 1 07.2 98.1 U 3 .0 9 9 .7 1 38 .1 1 21 .7 167.5January— i i l i . 5 1 15 .0 1 12 .3 n o . i 1 20 .9 1 11 . 8 m .9 331 .6 1 07 .0 1 12 .6 1 09 .9 U 2 .3 1 06 .0 1 1 0 .8 9 8 .6 1 11 . 8 1 00 .9 1 37.3 1 2 0 .5 167.5February- 1 1 1 .7 ______ 1 17 .0 112 .1 1 10 .2 1 09 .6 109 .5 ( l ) ( l ) 1 07 .0 1 12 .6 1 09 .8 U 1 .9 106.7 1 10 .3 1 00 .5 U l . 5 101 .2 1 38 .0 1 2 1 .5 167.5March—— l l l . l _____ 1 16 .5 1 11 .0 1 09 .8 1 12 .0 108 .3 ( l ) (D 1 07 .0 1 12 .6 1 09 .5 U l . 5 i o i . e 109 .1 9 7.2 1 11 .6 1 01 .0 1 38 .0 1 21 .5 167.5A pril------ 112.1* ______ 1 1 7 .8 109 .8 1 08 .6 1 19 .6 1 0 8 .8 111 .7 U 2 .6 1 0 7 .0 U 2 .6 108.1 U l.O i o i . e 1 0 8 .9 9 7 .6 1 11 .1 9 9.9 1 38 .1 1 21 .7 1 6 7 .5May--------- 1 13 .2 ______ U 7 .0 108 .6 108.0 1 26 .8 1 0 9 .0 ( l ) ( l ) 1 06 .9 1 12 .6 1 08 .1 U l.O 1 01.1 106.8 9 7 .6 U l . l 9 9 .9 138 .1 1 2 1 .6 167 .5June-—— 1 13 .2 ______ U 7 .2 1 09 .8 1 0 8 .0 1 2 3 .8 109.1 ( l ) (D 1 0 8 .0 1 1 2 .6 106.1 U l.O 1 03 .9 1 0 6 .5 9 7 .6 U 3 .6 9 9 .1 1 3 8 .0 1 2 1 .5 1 67 .5J u l y - 1 15 .3 ______ 1 1 8 .6 110 .6 108 . 1* 1 26 .7 1 15 .9 m . 8 U 3 .1 1 08 .0 U 2 .6 1 0 7 .5 1 11 .5 1 0 3 .0 1 0 5 .6 9 6 .5 U 3 .0 9 8.7 1 38 .1 1 2 1 .6 1 67 .5August— 1 1 7 .1 . . . . . . 1 1 8 .1 111;. 8 111.1* 123.7 U 8 .3 CD ( l ) 1 0 8 .0 1 12 .6 106.6 U l . 5 102 .9 1 0 5 .5 9 6 .1 1 12 .9 9 8 .9 1 3 8 .0 1 21 .6 1 67 .5September 1 15 .2 1 16 .7 111*.7 1 1 1 .7 1 13 .5 U 9 .1 ( l ) CD 1 0 8 .0 1 12 .6 106 .7 m . 8 l o l . 5 1 06 .1 100.3 U l . 5 9 8 .6 138.2 1 2 1 .8 1 67 .5October— 1 15 .2 116.0 H 3 .1 1 31 .8 i l l * . 5 1 21 .6 U 2 .5 U l . l 1 0 8 .0 1 20 .3 106.1 U 1 .7 1 01 .2 106.1 9 9.7 1 10 .8 9 8 .7 1 38 .2 1 2 1 .8 1 6 7 .5November- 115.1* . . . . . . 1 15 .8 1 10 .8 l l l i . l U7.1* 1 21 .6 ( l ) CD 1 0 8 .0 120.3 1 06 ,7 U 2 .1 101 .1 106.1 9 9 .1 U 0 .9 99.7 138 .2 1 21 .8 1 6 7 .5December- 111*.2 — 1 17 .6 1 09 .5 1 13 .3 1 18 .6 U 5.1* ( l ) ( l ) 1 0 8 ,0 120 .3 106.8 U 6 .0 103 .7 1 0 1 .8 9 9 .1 3 10 .9 99 .7 1 3 9 .3 1 23.1 1 6 7 .5
1953: Average 1 13 .6 1 1 3 .5 1 1 9 .1 106 .7 1 11 .5 U l . l 1 20 ,1 u 5 . o 118 .1 U l . l 1 2 1 .0 1 06 .3 1 1 7 .7 1 03 .9 1 06 .8 9 8 .2 1 12 .1 9 9 .5 1I 0.0 123 .9 1 68 .9January— 113.0 112 .8 1 1 7 .5 1 0 6 .5 113 .1 U 6 .0 U 5 .3 U 3 .7 (D U 3 .7 1 20 .3 106.2 U 6 .3 1 03 .1 1 0 5 .0 9 8 .7 U l . l 9 9 .7 1 39 .1 1 2 3 .5 1 6 7 .5A p ril------ 1 11 .8 1 11 .5 1 19 .1 1 0 2 .8 110.1* U 3 .9 U 8 .0 1 11 .3 U 6 .1 U 3 .5 1 20 .6 105.8 U 7 .5 1 0 1 .1 1 07 .1 9 8 .5 U 2 .1 9 9.9 1 39 .0 1 23 .0 1 6 7 .6
Ju ly ------- 111*. 8 111*. 7 1 19 .6 1 08 .9 1 09 .5 1 20 .1 U 9 .7 u 5 . o ( l ) 1 13 .7 1 20 .6 106.6 U 7 .1 1 0 3 .1 107 .3 9 6 .6 m . 8 9 8 .9 1 10 .7 1 21 .9 1 67 .6O c to b e r- 1 15 .0 111*. 9 1 19 .3 108.6 1 12 .3 U 0 .7 1 2 6 ,3 116.2 1 21 .3 U l . 5 1 21 ,8 1 06 .7 U 8 .1 1 0 1 .5 1 07 .0 9 8 .9 U 3 .8 9 9 .7 l l o . 8 1 25 .0 1 67 .6
1951: Average 1 13 .5 113.0 1 22 .6 10i*.2 1 09 .3 U l . l 1 21 .2 U 6 .8 1 23 .2 U 7 .3 1 20 .9 1 0 5 .0 U 9 .9 1 03 .6 1 0 6 .5 96.8 U 6 .1 9 8 .7 1 37 .3 U 8 .7 1 81 .9January— 113.1* 1 13 .0 119 .2 1 05 ,5 1 1 2 .6 1 0 9 .8 122,1* U 6 .1 ( l ) U 6 .7 1 23 .2 1 05 ,6 U 9 .9 l o l . l 106 .9 98.8 U l.O 9 9.2 1 39 .1 1 20 .8 1 8 3 .0A p ril—— 113.3 1 1 2 .6 1 2 1 .1 1 07 .0 1 0 7 .1 1 07 .7 123 .1 U 6 .5 1 22 .8 1 16.7 1 23 .2 1 01 .6 1 19 .8 1 03 .1 1 07 .1 96.6 U l . 9 9 8 .3 1 38 .6 120 .1 1 81 .7Ju ly— — 1 15 .6 n 5 . l i 122.1* 106.6 106.8 1 22 .5 1 2 5 .3 XL7.1 ( l ) 1 16 .9 122 .9 1 05 .3 1 2 0 .0 103 .7 106.8 96.2 U 8 .0 9 8 .9 1 37 .5 U 8 .9 1 81 .7O c to b e r- 1 13 .0 1 12 .6 1 2 1 .1 100.1* 1 09 .9 3 11 .3 1 26 .2 U 7 .0 123 .9 U 8 .8 U 9 .7 1 05 .1 1 2 0 .0 1 03 .7 106 .3 9 6 .5 1 1 8 .1 9 8 .7 1 31 .2 U 5 .3 1 8 1 .7
1955: Average 111 .2 1 10 .5 1 21 .6 9 8 .7 108.1* 111 .1 120 .2 n 6 . u 1 2 1 .5 122 .2 1 17 .2 1 03 .2 U 9 .7 1 02 .1 101 .1 9 5 .3 115 .7 9 7 .7 1 36 .9 U 8 .2 1 81 .9January— 1 1 1 .0 1 10 .1 121*,3 9 8 ,5 1 1 0 .0 107 .3 120.1* 1 16 .8 ( l ) U 8 .8 U 8 .8 1 03 .9 1 20 .0 1 0 2 .1 1 03 .2 9 6 .0 U 5 .5 9 7 .8 1 3 8 .0 U 9 .5 131 .7A p ril------ 1 1 1 .5 1 10 .7 12l*.5 9 9 .3 1 06 .9 1 1 5 .6 118.1* U 6 .2 1 21 .0 1 20 .5 1 18 .8 1 05 .2 120 ,0 102 .7 1 01 .9 96 .1 115 .7 98 .2 1 37 .7 U 9 .2 1 81 .7July—.— 1 12 .3 1 11.7 1 2 1 .5 100 ,8 106.5 1 2 0 .0 1 17 .0 1 1 6 .1 (D 1 21 .2 1 1 2 ,5 1 0 2 .1 U 9 .6 101.2 1 0 1 .5 9 3 .6 U l . 9 97 .2 1 37 .7 U 9 .2 181.7October— 1 3 1 .1 1 10 .3 1 2 5 .0 99.1; 109.1* 103.U 123.U 1 16 .1 1 25.1 1 23 .1 119.1 102 .1 1 18 .9 1 02.2 i o l . 5 9 5 .5 1 15 .7 97 .3 1 35 .5 U 6 .8 1 81 .7
See footnotes at end of table.
116
Digitized for FRASER http://fraser.stlouisfed.org/ Federal Reserve Bank of St. Louis
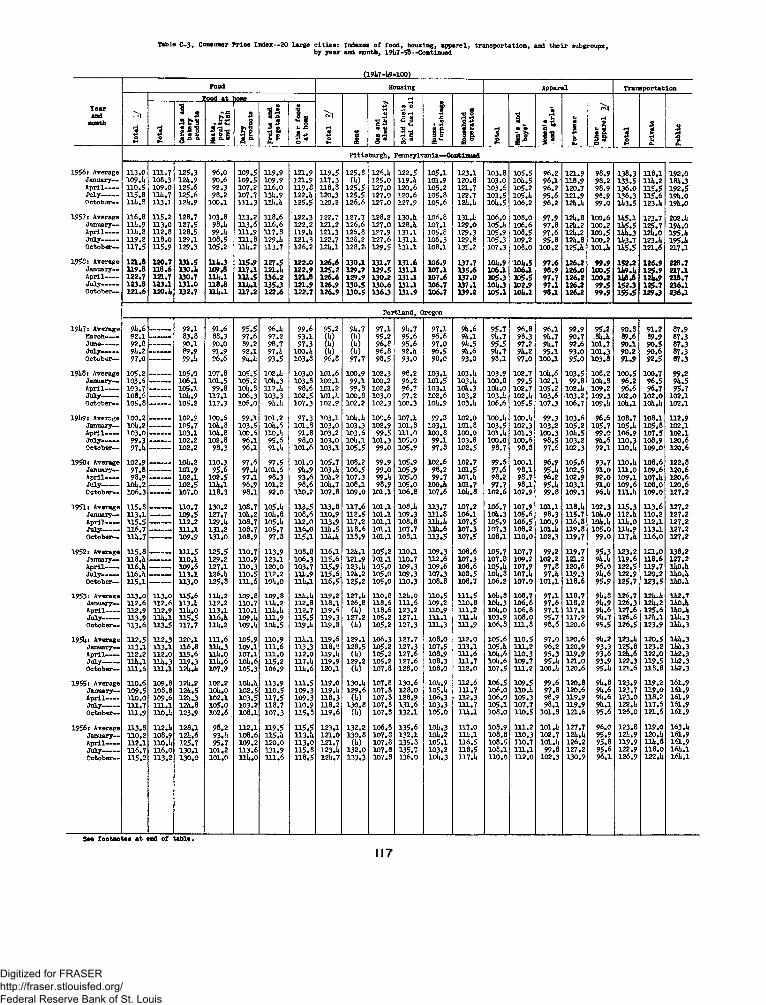
Table C-3. Consumer Priee Index—20 large cities: Indexes of food, housing, apparel, transportation, and their subgroupsby year and month, 191:7-58—Continued
(19b7-b9-100)
Food Housing Apparel Transportation
Tota
l 1/
Food at tome
Tota
l 2/
Rent
Qas
and
elec
tric
ity
Solid
fue
ls
and
fuel
oil fJB
if
Hous
ehol
dop
erat
ion
Tota
l
1? & i s W
omen
's an
d gi
rls'
1sh Ot
her
appa
rel
3/
Tota
l
Priv
ate
Publ
ic
Tota
l
Cere
als
and
bake
ry
prod
ucts i !
pi Dair
ypr
oduc
ts
Frui
ts a
nd
vege
tabl
es
Othe
r fo
ods
at h
one
Pittsburgh, Pennsylvania—Continued
1956: Average 1 13 .0 1 1 1 .7 1 25 .3 9 6 .0 1 0 9 .5 119 .9 1 21 .9 1 1 9 .5 1 2 5 .8 126.1: 1 2 2 .5 105.1 123 .1 1 03 .8 1 0 5 .5 96.2 1 21 .9 9 8 .9 1 38 .3 1 18 .1 1 9 2 .0January— 1 09 . b 1 08 .3 12U.9 9 0.6 1 0 9 .5 1 09 .9 1 21 .9 1 1 7 .3 (b ) 1 2 5 .0 1 1 9 .U 101.9 1 2 0 .8 1 03 .0 10U.5 9 6.1- 1 18 .9 9 8 .2 1 33 .5 l l b . 2 18b.3A p ril------ no.5 1 0 9 .0 1 25 .6 9 2 .3 107 .2 116.0 1 1 9 .8 1 18 .8 1 2 5 .5 1 2 7 .0 1 2 0 .6 105.2 121 .7 1 0 3 .6 105.2 9 6 .2 1 20 .7 9 8 .9 1 3 6 .0 1 1 5 .5 1 9 2 .5Ju ly ------- 1 15 .8 Ulx. 7 1 2 5 .6 9 8 .2 1 07 .7 1 31 .9 1 2 2 ,b 1 20.3 1 25 .5 1 27 .0 1 20 .6 1 0 5 .8 122.7 1 0 3 .5 105.U 9 5 .6 1 21 .9 9 8 .9 1 36 .3 1 1 5 .6 19b.OOctober— nb.3 113 .7 12U.9 1 00 .1 1 11 .3 m.u 1 2 5 .5 120.2 1 26 .6 1 27 .0 1 27 .9 1 0 5 .6 12b.b 101 . 5 106.2 9 6 .2 12U.U 9 9 .0 11:3.5 123.U 1 9b .0
1957: Average 116.8 1 15 .2 i 2 8 .7 1 03 .8 113 .2 1 18 .6 1 22 .3 222.7 1 2 7 .7 1 28 .2 1 3 0 .b 1 0 6 .8 1 31 .1 106.0 108.0 9 7.9 12U.8 1 0 0 .6 11:5.1 1 23 .7 202.1:January— l l b . 9 1 13 .0 1 2 7 .5 98.U 1 13 .6 1 16 .6 1 22 .2 1 21 .2 126.6 1 27 .0 128.1: 107 .1 1 2 9 .0 105.1: 106.6 9 7 .8 12U.2 1 00 .2 11*5.5 1 25 .7 19U.0A p ril------ l i b . 8 1 12 .8 1 28 .5 9 9 .b 111 .9 1 17 .8 119 .b 121 .3 1 26 .8 127 .9 1 3 1 .1 1 05 .8 1 29 .3 1 05 .9 108.5 9 7 .6 12U.2 1 0 0 .5 llil:. 3 12U.0 195.UJ u ly ------- 1 19 .2 1 18 .0 1 29 .1 1 08 .5 1 11 .8 1 29 .1 1 21 .3 122 .7 1 28 .2 1 27 .6 1 31 .1 1 06 .3 1 29 .8 105 .3 109.2 9 5 .8 121:. 8 1 00 .2 1U3.7 123.1: 195.UO c to b e r- 1 1 7 .5 1 15 .9 1 29 .3 1 05 .2 l l l i .2 1 13 .7 1 26 .2 12U.1 128,2. 1 29 .5 1 3 1 .1 1 08 .1 135 .2 1 07 .3 108.0 1 00 .2 125.1: 101.1: 11*5.5 1 21 .6 2 17.1
1958: Average 121.8 120.7 131.5 nu.3 U5.9 127.5 122.0 126.6 130.1 131.7 131.6 106.9 137 .7 10b.9 iob.5 97.6 126.2 99.9 152.2 126.9 228.7January— 119.8 118.6 130.1: 109.8 1 1 7 .1 121.U 122.9 1 2 5 .2 129.2 129.5 13ia 107.1 135.6 106.1 106a 98.9 126.0 100.5 11:9.1: 125.9 217.1A p ril----- 122.7 121.7 130.7 llb .l llb .5 136.2 121.8 126.6 1 2 9 .9 130.2 131 .1 107.6 137.0 105.3 105.5 9 7 .7 126.2 100.2 110.8 12U.9 218.7Ju ly -—— 123.8 123a 131.0 118.8 Uli.1 135.3 121.9 126.9 130.5 130.6 131.1 106.7 137.1 10b.3 102.9 9 7 .1 126.2 99.5 152.3 125.7 236.1October— 121.6 120.Ii 132.7 m .1 117.2 122.6 122.7 126.9 130.5 136 .3 131.9 106.7 139.2 105.1 lOlul 98a 126.2 99.9 155.5 129.3 236.1
Portland, Oregon
19b7: Average 9U.6 92.1 91.6 95.5 96. b 99.6 95.2 9 b .7 97.1 9b.7 07.1 9b. 6 95.7 96.8 96.1 92.9 95.2 90.8 91.2 87.9March----- 92.1 — 83.8 88.3 97.6 97.2 93.1 (b) (b) 95.2 95.6 96.6 9 b .l 9b.7 98.3 9b.7 90.7 .3b.b 89.6 89.9 87.3June— — 92.8 90.1 90.0 89.2 98.7 97.3 (b) (b) 96.8 95.6 97.0 9b.5 95.5 97.2 9b.7 92.6 101.7 90.1 90.5 87.3July------- 9b.2 - — ----- 89.9 91.9 92.1 97. b lOO.b (b) (b) 96.8 11 92.b 96.5 9b .6 9b. 7 9b.2 95.1 93.0 101.3 90.2 90.6 87.3October— 97.0 — 99 .b 96.6 9b.b 93.5 103.8 96.8 97.7 98.5 93.0 98.0 93.0 98.1 97.0 100.1 95.0 103.8 91.9 92.5 87.3
19U8: Average 105.2 ___ 105.0 107.8 105.5 302.b 103.0 101.6 100.9 102.3 98.2 103.1 103.b 103.9 102.7 10b.6 103.5 108.2 100.5 100.7 99.2January— 103.6 -----— _ 106.1 101.5 105.2 10b. 3 103.8 100.1 99.1 100.2 96.2 101.5 103.b 100.8 99.5 102.1 99.8 10b. 8 96.2 96.5 9b.5A pril------ 103.7 — 105.1 99.8 10b. 8 112.b 98.6 101.2 99.8 102.2 96.7 103.1 10b. 3 lOb.O 102.7 105.2 102.b 109.2 96.6 96.7 95.7July-------- 108.6 10b.9 117.1 106.3 103.3 102.5 103 .b 100.8 103.0 97.2 102.6 103.2 103 .b 102.b 103.6 103.2 109.3 102.0 102.0 102.1October— 105.8 — 105.2 112.3 106.0 9b. b 107.3 302.? 102.2 102.3 100.3 10b. 9 103.b 106.6 105.5 107.3 106.7 109.b IQ b.l 10b.b 102.1
19U9: Average 100.2 ___ 102.9 300.6 99.1 101.2 97.3 103.1 lOb.b 100.6 107.1 99.8 102.0 lOO.b lOO.b 99.3 103.6 96.6 108.7 108.1 n 2 .9January— 10b. 2 — 105.7 10b. 8 103.5 10b.6 101.8 103.0 103.3 102.9 101.8 103.1 101.8 103.5 102.3 103.2 105.2 105.7 105.b 105.8 102.1A p ril------ 103.0 103.1 10b. 8 100.6 n o .b 91.8 103.2 103.6 99.5 111.0 100.8 100.0 101.b 101.3 100.3 io b .5 99.0 106.9 107.5 102.1July-------- 99.3 — 102.2 102.8 96.1 95.6 98.0 103.0 10b. 1 101.3 105.0 99.1 103.8 100.0 100.6 98.5 103.2 9b.6 n o .3 108.9 120.6O cto b e r- 97.b — 102.2 98.3 96.1 . 91. b 101.6 103.1 105.5 99.0 105.9 97.8 102.5 98.7 98.8 97.6 102.3 92.1 n o .b 109.0 120.6
1950: Average 102.9 — — 10b.2 130.3 97.6 97.5 101.0 105.7 108.2 99.9 105.9 102.6 102.7 99.6 100.1 96.9 105.6 93.7 n o .b 108.6 122.8January— 97.8 — 101.9 95.6 97.b 101.6 9b.9 103 .b 106.5 99.0 105.9 98.2 101.5 97.6 98.1 95 .b 102.5 91.0 m . o 109.6 120.6April------ 98.9 ___ 102.1 102.5 97.1 98.3 93.6 10b.2 107.3 99.b 105.0 99.7 l o i .b 9 8.2 9 8.7 96.2 102.9 92.0 109.1 107 .b 120.6July—---- 10U.2 ___ 102.5 l l b . l 96.9 101.2 98.6 10b.7 108.1 98.9 105.0 100.b 101.7 97.7 98.1 95.b 103.1 91.0 109.6 108.0 120.6O cto b e r- 106.3 107.0 118.3 98.1 92.0 n o .2 107.8 109.0 101.1 106.8 107.6 10b. 8 102.6 102.9 99.8 109.3 96.b m . b 109.0 127.2
1951: Average 115.8 ___ 110.7 130.2 108.7 105.b 113.5 n 3.8 117.6 101.1 108. b n 3 .7 107.2 106.7 107.9 101.1 n 8 .b 102.3 n 5 .3 n 3.6 127.2January— 113.1 109.5 127.7 10b.2 10b. 8 108.6 n o .9 n 2 .5 101.1 109.3 i n . 8 106.1 10b.3 105.6 98.3 n 5 .7 lOb.O H 2 .b 110.2 127.2April------ 115.5 — 112.2 129.b 108.7 105.b n 2.o n 3 .9 n 7.2 101.1 108.8 n b .b 107.5 105.9 106.5 100.9 n 6 .8 lOb.b n b .o n 2. i 127.2July-— - 116.7 ___ 111.1 131.2 108.7 105.7 n 6 .o l lb .5 118.6 101.1 107.7 l i b . 6 107.3 107.3 108.2 lO l.b n 9.8 105.0 n b .9 n 3 . i 127.2O ctob er- l i b . 7 109.9 131.0 108.9 97.8 n 5 . i llb .b n s .9 101.1 108.1 113.5 107.5 108.1 n o . o 102.3 n 9 .7 99.0 n 7 .b n 6 .o 127.2
1952: Average 115.8 ___ 131.5 125.5 110.7 113.9 108.8 n 6 . i 12b .l 105.2 n o . i 109.3 108.6 105.7 107.7 99.2 n 9 .7 95.3 123.2 m . o 138.2January— 118.U ___ 110.1 129.2 110.9 123.1 106.3 n 5 .6 121.9 101.1 110.7 n 2.6 107.3 107.8 109.2 102.2 121.2 9b.b n 9 .6 n 8 .6 127.2A pril------ 116.1: ___ 109.6 127.1 110.3 120.0 103.7 n 5 .9 123.b 105.0 109.3 109.6 108.6 105.b 107.9 97.8 120.6 96.0 122.5 n 9 .7 lbO.bJuly-------- 116. b — — 113.1 126. b 110.5 112.2 i n . 9 n 5 .6 12b.2 105.0 109.3 107.3 108.5 10b. 8 107 .b 97. b n 9 .3 9b.6 122.9 120.2 lbO.bO cto b e r- 115.1 — U 3 .0 125.8 131.6 lOb.O n b . i n 6 .5 125.2 105.0 n o .3 108.8 108.7 106.2 107.0 101.1 n 8 .6 95.9 125.7 123.5 lbO.b
1953: Average H 3 .0 113.0 115.6 3lb .2 109.8 109.8 n b .b n 9 .2 127.b n o . 8 12b.0 n o .5 n i . 5 10b. 8 108.7 97.1 n 8 .7 9b .8 126.7 12b.b ib2 .7January— 112.6 112.6 113 *b 112.2 310.7 l i b . 2 n 2.8 n s . i 126.8 n 8 .6 m . 6 109.2 110.8 10b.3 106.6 97.6 n 8.2 9b.9 126.3 12b. 2 lb0 .bA pril------ 112.9 112.9 n b .o 113.1 110.1 n b .b 112.7 n 9 .6 (b) n 8 .6 123.2 n o .9 m .2 lOb.O 106.8 97.1 n 7 . i 9b.6 127.6 125.6 lbO.bJuly-------- 113.9 l l b . l 115.5 n 6 .b 109.b i n . 9 n 5 .5 n 9 .3 127.2 105.2 127.1 m . i i n . b 103.9 108.0 95.7 n 7 .9 9b .7 126.6 1 2b .l lb b .3O cto b e r- 113.6 113.5 117.7 l i b . 2 109. b 10b. 5 119 .b n 9.8 (b) 105.2 127.3 m . 3 i n . 9 106.8 i n . 8 98.6 120.6 95.5 126.5 123.9 lbb .3
1951:: Average 112.5 112.3 120.1 111.6 105.9 110.9 n b . i n 9 .6 129.1 106.3 127.7 108.0 n 2.o 105.6 n o .5 97.0 120.6 9b.2 123.b 120.5 lbb .3January— 113.1 113.1 116.8 H b .3 109.1 111.6 113.3 n 8 .8 128.5 105.2 127.3 107.5 113.1 I05.b m .2 96.2 120.9 93.3 125.8 123.2 lbb .3A pril------ 112.2 112.0 115.6 n b .o 107.1 m . o 112.0 n 9 .b (b) 105.2 127.6 108.9 m . 6 10b.6 n o .3 95.3 n 9 .9 93.6 12b.6 122.0 lb2 .3July-------- n b . i l i b . 3 119.3 n b .6 10b.6 115.2 n 7 .b n 9 .9 129.2 105.2 127.6 108.3 n i . 7 10b .6 109.7 95.b 121.0 93.9 122.3 n 9 .5 lb 2 .3October— 111.6 111.1 12b.b 107.9 105.3 106.9 l lb .6 120.1 (b) 107.8 128.0 108.0 n 2.o 107.5 m .2 100 ,b 120.6 95.b 121.6 n 8 .8 lb2 .3
1955: Average 110.6 109.8 12b.2 102.2 lOb.b 113.9 n i . 5 n 9.o I30.b 107.8 130.6 10b.9 n 2.6 106.5 109.5 99.6 120.8 9 b .8 123.9 n 9 .2 161.9January— 109.5 108.8 12b.5 io b .o 102.5 110.5 109.3 119.b 129.6 107.8 128.0 105.b m . 7 106.0 n o .b 97.8 120.6 9b.6 123.7 n 9.o 161.9A pril------ 110.0 109.6 12b.3 102.1 103.5 117.5 109.3 n 8 .3 (b) 107.8 128.9 106.3 n 2 .3 106.0 109.3 98.9 2 1 9 .9 9b.6 123.0 n 8.2 161.9July—— 111.7 111.1 12b. 8 105.0 103.2 118.7 110.9 n 8.2 130.8 107.8 131.6 103.3 m .7 105.1 107.7 98.1 2 1 9 .9 9b.1 122.b 117.6 161.9O cto b e r- 111 .9 110.b 123.9 102.6 108.1 107.3 115.3 n 9 .6 (b) 107.3 132.1 105.0 l l b . l 108.0 110.5 101.3 121.6 95.6 126.0 121.6 161.9
1956: Average 113.8 112.b 128.1 98.2 312.1 n 9 .5 n 5 .5 123.1 132.2 106.8 135.6 10b.3 117.0 108.9 111.2 101.b 127.7 96.0 123.8 n 9.o 163 .bJanuary— 110.2 108.9 12b.6 93.b 108.6 ll5 .b H 3 .b 121.0 130.8 107.8 132.1 10b.2 l l b . l 108.8 n o .3 102.7 12b.b 95.9 12b.9 120.b 161.9A pril------ 112.1 UO.b 125.7 95.7 109.2 120.0 113.0 121.7 (b) 107.3 135.3 105.1 n 6 .5 108.5 110.7 101. b 126.2 95.8 119.9 11b . 8 161.9July-------- 116.7 116.0 130.1 101.2 313.6 131.9 115.8 3 23.b 132.0 107.8 135.7 103.2 n 8 .5 108.1 m . i 99.8 127.2 95.6 122.9 n s . o I6 b .lOctober— 115.2 313.2 130.0 101.0 n b .o 111.6 118.5 12b.7 133.3 107.8 136.0 10b.3 117.b 110.0 n 2.o 102.3 130.9 96.1 126.9 122. b I6 b .l
See footnotes at end of table.
117
Digitized for FRASER http://fraser.stlouisfed.org/ Federal Reserve Bank of St. Louis

Table C-3. Consumer Price Index—20 large c i t ie s : Indexes o f food , housing, apparel, transportation, and their subgroupsby year and month, 191:7-58—Continued
(19l«7-U9»100)Pood Housing Apparel Transportation
Tota
l 1/
Food at lome
^r.#H3oEh Re
nt
Oas
and
elec
tric
ity
Solid
fue
ls
and
fuel
oil
Hou
se -
furn
ishi
ngs
Hou
seho
ldop
erat
ion
Tota
l
Men
's an
d bo
ys'
Wom
en's
and
girl
s'
Foot
wea
r
Oth
erap
pare
l 3/
IT
otal
r
Tot
al
Cer
eals
and
ba
kery
pr
oduc
ts
Nea
ts,
poul
try,
an
d fi
sh 3
de a Fru
its
and
vege
tabl
es
Oth
er f
oods
at
hom
e
Priv
ate
1 Pub
lic
Portland, Gregor.— Continued
1957j Average- 117.0 115.2 133.0 106.6 116.5 l l i i . l i 115.1; 126.7 135.a 102 .0 1U6.7 106.ii 122.7 1 11 .0 113.8 102.2 132.5 97.9 129.7 12a. 3 175.1January— 115.5 113.il 1 30 .0 100.ii 113.9 118.0 1 15 .8 125.6 13a. 5 102 .0 l i i l .8 105.2 1 18 .8 109.7 112.7 101.0 130.2 97.a 1 26 .8 1 22 .1 166. aA p ril------- 116.0 113.8 131.7 103.9 116.5 115.U 112.7 127.9 13U.9 102 .0 lu5.li 107.7 1 19 . a 1 10 .8 113.3 102.5 131.6 97.9 129.2 123.5 176.9July--------- 118.5 117.3 1 32 .0 111.5 117.2 1 19 .6 l l i i . 5 126 .1 135.5 102 .0 lii9 .0 1 05 .7 1 22 .0 1 1 1 .0 113.9 io 2 .a 131.6 98.0 i3 i .a 1 26 .0 176.9October— 116.9 115.3 135.0 1 08 .0 117.3 108.5 116.5 126.6 136.1 1 02 .0 1U9.0 106.6 127.5 111.9 n a .6 102.8 i3 a .9 98.5 129.2 123.5 176.9
1958: Average- 120.7 119.6 137.1 117.6 117.2 119.8 U ii.3 127.6 136.0 102.0 139.9 106.3 1 28 .6 i n . a 113 .a 102.1 136.3 98.1 137.2 130.6 193.5January-— 118.9 117.5 135.7 112.2 117.2 115.7 U 5 .5 127.2 136.1 102.0 U 9.3 106.5 127.6 111.3 ua.6 101.7 135.7 96.9 133. a 128.2 176.9A p ril------- 121.2 120.li 135.3 117.0 117.0 128.2 113.5 128.9 135.8 102.0 139.9 1 0 8 .0 128.0 111.7 11a. 2 io2.a 135.7 93.5 136.9 130.0 196.8J u ly -------- 121.it 120.6 135.6 120.8 117.0 121.0 n a .9 127.6 135.7 102.0 139.9 106.0 128.2 111 .a 113 .a 101.8 137.0 98.3 138.1 131.2 196.8October— 120.5 119.2 110.2 118.3 117.6 11U.1 ll iw l 126.9 136.2 102.0 138.0 105.5 129.9 111.2 112.1 102.7 i3 6 .a 98.3 139.5 132.8 196.8
St. Louis, Missouri
19a7: Average- 96.2 9ii.5 9a .2 97 .9 96 .9 99 .8 9U.8 9 a .3 10 3 .a 8 ? .a 95 .8 97 .6 9 a .6 95 .1 95 .5 91 .1 97 .6 92 .9 91 .8 96 .0January— 39.5 ---------- 87.8 83.6 98 .3 89 .9 95 .3 (a) (a) 105.3 80 .5 93 .0 91 .6 90 .2 92 .3 90 .7 85 .8 ea .2 90 .5 88 .6 96 .0February— 90 .0 — 89.0 85.0 96 .1 91 .1 9a .9 (a) (U) 105.3 80 .5 92 .5 91 .9 91 .8 9a .2 92 .2 87.2 85 .6 90 .7 88 .8 96 .0March------- 95 .0 ---------- 39.a 91 .1 97 .9 101.0 97 .9 (a) (a) 105.3 80.6 92 .6 92 .1 92 .8 9a .3 93 .9 88 .2 37.2 91 .2 0 9 .6 96 .0A p ril------ 93.3 93 .9 87.9 9li.5 96 .5 99 .0 (a) (a) 105.3 eo.6 92 .8 9 c .a 93 .2 9a.a 9a.a 88 .1 91.2 91 .3 9 0 .a 96 .0May---------- 9 2 .a — — 91.1 88 .3 90 .5 99 .3 95 .2 (a) (a) 105.3 80.6 93 .3 98 .1 93 .1 911.2 9a .2 88.1 95 .1 91 .8 90 .3 96 .0June--------- 9a .0 ---------- 91 .6 95 .0 91 .0 96 .5 93 .9 92 .5 01 .6 102.0 80.7 9a.7 96 .9 92 .9 93 .6 0^.9 88.0 99 .1 91 .7 90 .2 96 .0September- 103.2 ---------- 96 .6 106.5 io a .7 1 0 0 .a io a .2 97 .6 97 .a 102.0 92 .2 93 .3 98 .7 95 .7 95 .3 96 .a 93 .3 103.9 93 .9 93 .2 96 .0Dec ember— 102.8 — io a .2 97 .2 106.9 101.5 112.5 100.5 99 .5 102.0 98 .1 10 0.5 io a .7 100.7 99 .5 101.6 99 .6 108.9 96 .6 96 .8 96 .0
19a8: Average- 103.9 ____ 103.1 105.a io 7 .a 101.1 10 2.1 102.5 101. a 100.9 105.5 103.0 103.9 io a .o 103.0 io a .2 io a .6 109.0 100.9 101.3 99 .6March------- 100.8 — 103.2 97.2 10a. 7 103.6 98 .5 101.2 99 .8 102.0 99 .1 102.3 105.1 io a .o 102.5 103.7 106.6 n o .3 97 .8 98 .3 96.aJune-— — 106.1 . . . . — 102.6 109.2 107.1 106.9 100.0 102.1 100.5 102.0 105.1 102.0 io a .5 102.3 102.9 102.0 1 0 3 .a 108.1 99 .9 99.a 101.3September- 10 6.5 - —- — 102.8 n a .a 109.5 96 .8 io 3 .a io a .2 103.3 102.0 110.1 io a .3 103.0 105.6 103.9 3.06.9 105.0 n o .6 lO ii.l 105.1 101.3December— 101. a — 103.1 102.0 10)1.8 95 .2 10a .2 103.8 103.5 95 .8 110.1 io a .7 102.0 105.2 io a .5 105.6 105.5 106.2 io a .2 105.2 101.3
19a9: Average- 99.8 ______ 102.3 100.3 9a . 8 102.0 98 .1 102.7 io a .3 95 .8 107.2 • 101.2 98 .5 10 1 .a 101.9 100,3 io a .a 93 .5 106.3 107.0 10! i.3March------- 99 .2 —— — 102.7 98 .8 95 .3 103.3 9if.a 103.3 103.7 95 .8 109.5 103.5 99 .7 103.1 102. a 10 3 .a 105.7 95 . a 105.8 107.3 101.3June--------- 101.7 — 102.3 101.7 90 .9 109. a 93 .7 101.8 10a .3 95 .8 102.5 100.1' 9 8 .i: 3.02.1 102.3 101.6 105.0 92 .3 105.8 107.3 101.3September- 101.1 ___— 101.6 105.0 9a. 3 93 .6 102 .a 102.2 io a .5 95 .8 107.7 99 .6 96 .9 99 .3 100.8 97 .5 102.ii 90 .6 105.5 107.0 101.3Dee ember- 98 .5 — 102.2 95 .5 97 .1 98 .0 10)1.1 103.1 105.3- 95 .8 i n . * 99 .6 97 .5 98 .6 100.7 95.i1 103.7 90 .0 109.9 106.8 119.2
1950: Average- 102.1 ____ 10iu6 105.3 95 .3 98.2 3-0a.9 105.5 106.9 95 .3 n a .9 102.3 99 .7 100.1 102.1 96 .1 106.a 91.9 109.0 105.5 n 9 .3March-— 97.8 ____—. 102.2 9 8.a 9U.8 95.7 98 .7 10)1.1 106.2 95 .8 n 7 .3 99 .7 96 .6 98 .5 10 0 .a 95 .1 io a .o 9 1 .a 109.0 105.5 n 9 .2June--------- 100 .a ______ _ 102.5 106.5 88.7 10 1.0 96 .8 io a .o 107.2 95 .8 m . i 99.1 96 .7 98 .5 100.8 95 .0 io a .o 88 .6 107.a 103.3 n 9 .2September- 105.3 ---------- 106.1 i i3 .a 98 .1 93 .6 109.9 106.8 107.7 95 .8 n a .6 io a .6 102.7 101.0 103.1 96 .6 107.9 99 .7 109 .a 106.1 119.2Dee ember — 109.7 ------------ 109.2 109.8 102.0 103.2 125.5 109.0 1 0 8 .a 95 .8 118.7 108.9 105.5 103.9 105.8 98 .9 n 2 ..8 io a .7 n o .a io ? .a 119.2
1951: Average- n a . i 1 U .9 118.1 105.6 110.0 120.9 110.9 110.5 95 .8 118.3 i n . 3 107.9 307.a 109.7 101.2 319.7 io a .8 119.9 n o .3 ia 5 .eMarch------- n a .a — — m . o 119.7 105.9 109.6 120.1 320.6 109.1 95 .8 118.9 n i . 9 1 0 8 .a 106.3 108.0 100.3 n 9 .o 108.3 n 9 .7 109.1 ia s .3
113 8 i n .a 117.5 103.1 11 2 .5 119 .a 110.7 109.7 95 .8 135.5 12.2s 108.5 IO6.9 3.09.0 100.2 120.6 108.8 119.3 10 8.5 ia s .3September- n a . i _______ 111.3 119.6 103.1 106.5 125.3 m . a 111.7 95 .8 n 7 .9 132.3 107.8 109.3 112.2 103.0 122.1 101. e 121.0 n o !« ia s .3Dee ember—- 116 .5 i n ,n 116.0 113.3. 118 .0 122 .a 111.9 113.il 95 .8 120.6 n o .3 107.7 108.5 m . 8 3.02.6 n 9 .a 98 .1 12a .1 115.2 H18.3
1952: Average- 116.3 311.6 115.8 n a .o 122.2 11a. 8 113.2 115.1 95 .8 122.2 109.1 U 2 .6 106.3 309.8 99 .9 11 7.5 °6 .a i 3 i .a n 8 .8 i6 a .sMarch— 113.9 _______ H 1 .2 3.1a .0 n a . i 117.8 109.6 322.8 n a .6 95 .8 120.9 109.2 111.9 107.2 109.9 101.1' 3 1 8 .C 97 .3 130.5 3-17.8 i6 a .2June—- —- 118.3 _______ 112.1 117.9 m . e 132.5 320.5 112.6 115.1 95 .8 120.9 107.9 111.7 106.5 110.0 100.5 11 7 .a 93 .0 130.9 n 8 .a i6 a .2September- 116.7 _______ i l l . 8 13-9.6 315.9 113.6 118.3 113.5 n 5 .6 95 .e 122.3 109.0 113.8 105.5 1 0 9 .a 98 .9 116.7 96 .0 i 3 a .i 122.9 i6 a .2Dee ember- n a .9 — m . e n o .5 115.5 119.a 118.6 n a .7 n 6 #? 95 .6 126.0 n o . 2 115.7 lo a .a 109.2 96 .9 n 5 .8 98 .0 133.0 116.6 176.2
1953: Average- n a .a 11a.0 313.9 110.9 106.0 119.7 119.5 116.6 3.22.8 99 .1 129.6 109.2 326.9 105.0 109.7 97 .6 n 7 . i 97 .8 136.6 n o .a 176.2March— 112. a 112.0 113.0 107.9 107.2 11 8.5 125.3 n a .6 (a ) 95 .3 127.il 105.7 n 6 .5 10a .a 109.5 96 .5 n 6 .a 98 .0 137.2 121.1 176.2June—— - 115.0 l i a . 8 113.5 113.5 100.5 127.8 117.3 115.7 117.1 100.3 127.9 109.3 116.7 10a .6 1 0 9 .a 96 .9 117.0 98 .0 136.9 120.7 176.2September- 115.7 U -5.2 115.6 n a .5 106.1 112.8 123.8 328.6 (a ) 99 .1 130.7 1 0 9 .a n 7 .2 106.0 n o . 3 99 .0 n 7 .8 98 .6 137.0 120.9 176.2Dee ember— 115.1 n a .2 115.9 108.8 106.8 118. a 122.6 118.9 130.0 103.8 132.9 3-09.3 n c .2 105.3 109.7 98 .3 n 7 .8 96 .0 136.5 120.3 176.2
195a: Average- 115.3 113.9 117.8 108.6 100.2 120.0 12ii.2 119 .5 133.5 103.8 135.a 105.0 n 9 .o 10a. 3 108.9 96.6 118.5 95 .9 132.5 11 5.8 178.aMarch— - i i a .9 113.3 116.5 n o .U 101.6 115.3 121.9 11 9.1 (a) 103.8 135.1 106.7 11 9 .c io a .5 109.7 96 .8 n 7 .8 95.6 136.2 120.1 176.2June----- — 116.6 115.3 316.5 m . 8 96.6 125.6 125.0 329.6 133.8 103.3 133.0 106.7 11 8.8 10U.7 109.6 96 .7 n 8 .9 96 .0 136.2 n 9 . 5 179.5September- n 5 .a lli i .o 118.8 106.6 101.6 118.3 127.2 119.7 (a) 103.8 136.8 102.7 n 9 .o 103.9 108.0 96 .2 n s . 7 96 .0 125.1 107.7 179.5December— 112.3 110.1 118.8 102.3 98 .2 315.7 120.6 119.9 135.5 103.8 138.7 101.3 119.8 103.7 107.8 95 .7 n 8 .9 95 .8 130.6 n 3 . 5 179.5
1955: Average- 112.3 110.0 118.9 101.0 95 .8 121.3 119.3 i2 o .a 136.5 103.8 138.2 102.1 121.3 103.8 106.8 96.a 119.7 95 .7 133.3 n 6 . i 181.6March— — 111.8 109.2 118.9 101.3 91 .5 118.5 120.8 H 9 .a (a) 3.03.8 139.6 101.7 n 9 .a io a .i 107 .6 96 .7 119.0 96 .0 i3 a .e 118.1 179.5June--------- 11 2 .a 110.1 118.5 103.6 91 .1 126.7 115.7 119.3 136.0 103.8 132.9 101.5 n 9 .o 103.5 106.7 96 .0 n 9 .7 95 .6 13U.8 n 7 . 5 182.6September- 113.7 111.6 119.1 102,9 100.9 119.5 121.a 121.1 (a) 103.8 139.9 103.2 123.5 103.9 106.1 97 .0 119.7 95 .8 131.0 n 3 . 5 182.6Dee ember— 110.2 107.9 119.0 91 .7 100.9 328.9 121.9 122.5 138.1 103.8 l i a . 8 102 .5 125.3 103.7 106.1 96 .1 121.3 95.U 133.6 316.3 182.6
1956: Average- 112.8 110.1 120.1 9a .6 102.7 12a. 5 12 1 ,a 121. a 139.5 103.8 U 2 .5 101.7 126.6 10 a .3 106.9 96 .2 123.9 95 .8 i3a .a n 6 .7 186.1March— — 110.7 108.2 U 9 .a 91.8 100.2 122.5 120.5 120.1 (a) 103.8 ia ^ .5 302.2 125.6 io a .o 105.8 96.a 123.0 95 .6 132.2 n a .8 182.6June——— 113.8 111.9 119 .a 96 .2 101.7 135.1 120.1 120.9 139.3 103.6 136.8 100.9 125.9 10a. 3 107.1 96.1 123.8 95 .8 133.8 n 5 .7 187.9September- 11a. 7 111.5 120.6 98 .1 106.1 118.8 12U.0 122.0 ia o .2 103.3 ia a .5 101.1 12 7.5 1CH.7 107.3 96 .5 12a.6 96 .0 13a .3 3-16.3 187.9Dee ember— n a .5 n o .a 122.7 9a .6 1 0 2 .a 122,8 122.9 122 .a D1O.9 103.8 ia 7 .5 1 0 2 .a 128.3 10 a .6 107.9 95 .6 i2 5 .a 96 .2 139.2 121.6 187.9
See footnotes a t end o f table.
118
Digitized for FRASER http://fraser.stlouisfed.org/ Federal Reserve Bank of St. Louis

Table C-3. Consumer Price Index—20 large c i t ie s : Indexes o f food , housing, apparel, transportation, and th eir subgroups;by y ea r and month, 19U7-5B— Continued
(19U7-1*9-100)
Tearand
month
Food Housing Apparel Transportation
Tot
al
1/
To
tal
2/
Ren
t
Oas
an
d e
lec
tric
ity
So
lid
fu
els
an
d fu
el
oil
Hou
se-
furn
ish
ing
s
Hou
seh
old
op
era
tio
n
To
tal
Men
's
and
boy
s' 4c “
J ?
Foo
twea
r
Oth
era
pp
arel
3
/
3g .
i
To
tal
Cer
eals
an
d b
aker
y p
rod
uct
s
Mea
ts,
po
ult
ry,
and
fish 3
i t Fru
its
and
veg
eta
ble
s
Oth
er f
ood
s a
t ho
me
Pri
va
te
Pu
bli
c
St. Louis, Missouri—Continued
1957: Average- 116.3 112.7 12)*. 8 101.9 1 02.9 123.7 120.2 121*.$ 1U2.5 103.8 150.0 10li.3 131.lt 105.0 107.8 96.3 1 26.0 96.1 1U3.0 12U.5 195.8March----- 111*. 9 110.9 125.3 97.5 103.2 121.1* 319.6 12i*.0 11*1.8 103.8 152.2 lOlt.6 131.7 10lt.8 107.U 96.3 125.lt 96.2 lU0.9 123.1 189.1June------ 116.7 113.6 125.1 IOI4.3 1 00.0 131.0 117.3 12l*.6 lU l.9 103.8 11*3.2 103.9 131.6 lOlt.3 107.2 95.5 1 26.0 95.0 1U3.0 125.5 189.1September- 117.8 11U.5 12U.6 1 0 6 . 1* 105.5 1 20.3 122.2 125.0 11*3.0 103.8 150.0 10U.6 131.5 105.3 108.3 96.6 126.2 96.5 1UU.U 12U.6 205.3December-- 117.5 113.1* 12U.6 103.0 103.3 121.0 123.2 125.6 1UU.6 103.8 153.7 105.0 132.1 105.8 108.6 97.3 127.0 96.7 1U6 .1 126.1* 205.3
1958: Average- 121.2 117.1* 125.2 112.2 103.9 130.9 119.8 126.1* 11*6.1 10lt.2 153.6 10U.6 135.5 106.3 108.1 99.0 126.5 95.0 l $ l . l 129.8 a 8 .9March---- 121.8 118.5 125.5 111.1* 103.0 136.7 i a . 8 126.6 11*5.1 103.8 155.7 105.1 13it.7 106.5 108.6 98.8 126. It 96.9 1U7.5 127.7 206.$June------ 122.2 118.1* 125.7 1 15.1 101.3 135.6 118.1* 126.2 11*6.0 103.8 11*6.9 10U.9 135.li 106.0 108.0 98.5 126.1* 9U.7 11*8.3 128.6 206.$September- 122.1* 118.5 121*.7 113.2 107.3 127.7 123.1* 126.2 11*6.9 203.8 151*.8 lOli.l 136.7 106.5 107.8 99.6 126.6 9U.3 153.3 129.7 235.9December— 119.9 115.1* 12lt.8 HO.3 105.5 12U.6 117.5 126.8 11*7.1 1 06 .2 159.2 10b.2 137.0 106.5 107.9 99.8 126.7 92.6 159.9 136.5 237.1
San Francisco, California
19U7: Average- 95.5 91.8 92.8 97.1 97.0 100,0 96,2 95.8 100.0 96.8 96.3 96.0 95.8 96.6 93.9 99.8 91.U 89.5 96.9January— 9l*.0 — 81*.5 92.1* 97.8 95.9 98.1 (U) (U) 100.0 93.6 9lt.O 92.1* 93.0 92.1 90.2 93.6 89.2 86.U 96.7February— 91.6 8)4.7 89.5 95.0 98.0 89.1* 93.5 100.0 — 9l*.2 95.0 95.0 9li.5 95.3 92.li 106.5 99.6 87.0 96.7March-— 93.5 ______ 8U.9 92.5 99.3 97.3 91.5 ()*) ( h ) 1OC.0 9U.8 96.1* 9l* .1 97.6 93.2 11U.2 89.8 37.3 96.7April---- 91*. 6 86.1 91.9 93.8 102.7 96.3 (U) (M 100.0 -----— 9li.6 96.3 96.3 95.3 97.8 9U.lt 107.2 90.5 88.2 96.7May------ 93.7 ___ 92.2 87.1' 91.3 302.3 98.1 (U) (U) 100.0 — 95.5 96.5 96.3 95.lt 97.2 9U.6 100.U 90.2 87.8 96.7June------ 92.3 ___ 92.2 88.5 91.5 96.0 95.6 <U) (It) 100.0 -------- 96.8 95.5 95.2 9U.8 96.0 9U.7 93.U 90.1 37.7 96.7September- 98.6 ------ 93.8 97.2 100.8 95.5 3.07.0 97.3 96.9 100.0 ------— 98.1 9 6.0 96.it 96.9 96.8 9U.3 96.5 92.9 91.6 96.7December— 101.1 — 102.2 97.8 303.8 98.7 107.3 99.it 98.6 100.0 — 100.6 99.8 97.8 93.5 98.6 9U.8 97.5 9U.5 93.2 97.8
19U8: Average- 103.5 ______ 103.7 105.5 105.7 99.8 102.1* 101.3 IOC.9 100.0 ______ 102.7 101.0 103.8 103.2 103.9 103.U 107.6 1 00.5 101.2 98.UMarch---- 100.9 ------ 102.1* 97.8 103.8 1 06.1 96.5 100.8 99.7 100.0 -------- 103.0 101.7 103.3 103.2 103.1 102.1 109.6 97.0 96.U 9 8 .UJune----- 103.9 ______ 303.6 106.9 308.8 101.0 97.5 100.7 101.0 100.0 -------- 100.7 99.8 102.9 102.3 102.6 102.9 108.0 100.2 100.9 98.USeptember- 105.1 10l*.5 112.2 107.1' 90.5 108.7 101.8 101.9 100.0 ---- — 103.1 100.8 1 06 .0 iolt.5 106.8 106.3 109.1 103.8 105.7 98.UDecember— 103.7 — 10U.U 106.9 102.3 97.2 1 06 .8 103.1 102.6 100.0 105.8 1C2.9 105.7 105.2 105.6 106.0 107.3 10U.2 106.3 98.U
19U9: Average- 100.9 io)*.l* 101.8 97.2 103.1 97.6 3 02.5 103.3 100.1 _______ 100.6 102.6 100.3 101.0 99.lt 102.7 92.6 108.1 109.3 10U.7March---- 101.1* _____ 10U.7 3.01.8 99.3 108.0 91.7 102.6 103.0 100.0 --- ---- 103.9 101.2 102.1; 101.9 102.0 105.2 98.9 107.6 108.U 105.3June----— 101.0 . ____ 10l*.3 103.6 91*. 7 106.1 93.2 101.8 103.3 100.0 —- 97.3 101.1* 100.3 100.7 99.5 103.8 91.0 108.3 109.U 105.3September- 100.2 ----—. 10i*,7 101.6 96.0 96.1 103.6 102.8 103.5 100.0 ' 99.1* 10l*.5 98.0 99.5 97.1 99.9 86.7 108.9 110.3 105.3Dee ember-- 98.5 — lOU.Ii 97.9 96.5 99.6 95.7 102.9 103.9 102.3 — 99.0 103.5 97.7 100.1 95.9 10C.1 86.7 109.1 no.U 105.3
1950: Average- 100.? _____ 106 .8 105.0 95.3 97.8 98.9 10l*.3 10U.6 10ll.3 ______ 102.U 103.5 99.2 100.1 97.lt 101..0 90.7 108.2 109.2 105.UKaroh—_— 98.7 10U.7 100.1* 9U.8 100.9 92.7* 103.1 30li. 3 102.3 99 .U 103.0 97.8 99.5 96.0 100.6 89.3 109.1 1 10 .5 105.3June— 99.0 ------- 3-05.2 10U.8 9)!.l* 96.0 92.7 103.2 10l*,9 10U.3 -------- 98.3 102.5 97.7 98.9 96.3 100.9 89.3 107.1 1 07.7 105.3September- 10c .5 — 3-09.1* 109.6 95.2 83.9 lol* .9 105.2 10l*.9 101*. 8 — 105.9 lOij.l 99.7 99.8 98.1 105.7 92.1 108 .0 1 09 .0 105.3Dee ember— 107.1* — 110.3 110.9 96.1* 105.7 112.0 107.1 1 06.7 lOlj.8 — 109.6 105.0 103.6 103.5 101.0 113.3 9U.6 108.2 1 09.2 105.3
• Averap©- 111.9 l 15 1 118.7 105.3 105.6 111.6 111.5 3-13.0 111.)' m .3 106.7 108.0 106 .3 106,9 H 8.7 95.9 116.0 1 13 .1 123.9Kerch---- 113 O _____ lli-I? 118.0 103.8 116.7 108.9 13.1,1 112.1 m .u '\ _ m . 7 107.0 107.lt 10U.9 107.0 117.3 100 ,U 11U.8 1 10 .9 125.7June——— 111.3 — _ 115.1* 118.1 10ii.7 10U.2 111.3 H 2.0 113.3 111.1* 113 .5 106.7 108.5 1 06 .il 107.2 H 9.7 99.U 115.6 1 11.9 125.7September- 110.1 •__ 115.3 319.1* 1 0 6 .U 91.6 116.9 112.1 11U.0 111.1* ------ - 112.9 1 06 .0 109.3 107.5 108.0 121 .U 93.U 118.3 1 15.7 125.7Dee ember- 116.5 — 3-15.3 119.7 108.6 123.0 309.9 113.0 1 15 .8 118.2 — 109.1 ioe.o 108.6 107.9 107.8 118.1 88.3 118.9 1 1 6 .u 125.7
1952: Average- iil*.5 120.5 118.6 111.7 113.2 107.5 ll i* . l 118.3 121.5 ____ 107.3 1 07.8 106.3 107.1 10U.0 H 5.3 88.3 132.1 1 22 .1 159.8March—— 115.0 117.7 318.2 112.5 123.1 101.6 113.1* 117.1* 119 .7 ------- - 106.9 107.7 107.it 108.0 105.2 117.1 88.2 120.U 118.5 125.7June------ 1 16.0 __ 122.3 119.0 110.3 123.6 3.02.3 11U.0 118.7 119.7 ■---- --- 1 06 .6 107 .8 106 .0 107.0 103.2 115.7 88.7 13U.li 119.1 176.8September- 112.9 _____ 122.0 120.1* 112.9 97.6 H 3.3 11U.1 n 8 .a 119.7 107.1 107.9 105.lt 1 06 . 1* 102.9 llU .l 89.1 IU0 .3 127.2 176.8Dee ember- 11U.9 — 122.6 11U.6 112.1 116.5 110.3 115 .7 120.2 130 .1 -------- 108.3 1 07.3 105.1 106.3 102.8 112.6 89.U 1U0.3 127.2 176.8
1953: Average- 1 13.6 113.5 125.6 110.0 110.5 115.5 110.8 1 17.2 125.3 1 30.1 ______ 109.3 108.8 101*. 8 1 06.6 101.3 112.7 89.3 1U2.9 129.6 179.2March— — 112 .6 112.1 122.3 108.3 111.9 115.8 107.1 116 .1 (U) 130.1 109.2 108.3 105.3 107.0 102.9 111.8 89.7 1U3.1 130.1 176.8June— — llU .l 111*. 6 127.6 112.0 110.2 120.7 108.6 1 17 .0 122.1 130 .1 —-- --- 109.7 109.0 103.6 105.9 100.1 111.9 89.0 1U2.0 128.6 180.USeptember- ll!*.l 11U.0 127.8 112.0 109.9 107.3 116.0 1 18.3 (1*) 130.1 __-—— 109.7 109.0 105.1 106.9 102.0 113.6 89.3 1U3.6 130.2 I 80.UDoc ember- 111*.2 113.0 127.3 107.8 110.3 116.6 113.5 118.0 127.8 130.1 — 109.1 109.5 105.0 106 .8 102.0 113.8 89.0 lUU.l 130.7 180.1*
1951*: Average- 113.9 113.2 129.1 109.0 105.9 111*.8 U 3.1 117.7 129.3 130.1 105.8 109.1 103.2 105.6 99.0 llU.U 87.8 1U2 .2 128.9 179.1March——— 113.2 112.3 127.!; 109.1* 1 06.8 116.0 108.ii 118.0 (it) 130.1 .— 106.9 109.6 103.5 105.6 100.0 113.5 87.8 1U3.U 130.0 180.UJune----- 115.3 11U.9 127.7 111.7 105.3 120.1* 113.7 117.5 129.0 130.1 ____ — 105.1 108.9 103.2 105.6 99.0 11U.2 87.8 1U2.9 129.7 178.5September- llU .l 113.5 131.0 109.1 105.1* 3.09.8 117.5 117.5 (It) 130.1 --- ---- 10l*.8 109.0 103.1 105.5 98.7 115.1 87.8 1U0.2 126.9 178.5Dee ember— 111.8 110.7 130.3 105.9 10l*.? 110.!* 310.3 117.8 130.3 130.1 105.2 108.9 101.9 105.3 96.3 115 .U C7.2 lU l.3 128.0 178.5
1955: Average- 112.9 312.0 130.7 105.9 1 05.0 117.1 110.3 116.5 132.3 135.0 ______ lOli.O 109.9 103.5 10U.8 98.9 118.7 88.1 139.5 126.1 178.5March-—— 113.1 312.3 130.7 106.2 10U.9 118.2 110.!* 115.9 (It) 132.5 ______ 103.9 109.3 103.1 10U.9 98.7 116.3 87.8 lUO.8 127. U 178.5June—--- 113.U 112.9 130.9 106.7 10U.9 123.5 108.!* 116.3 132.1 136.3 ___—— 10l*.6 109.7 103.2 10l:.3 98.6 118.5 87.8 137.9 12U.U 178.5September- 113.0 112.0 130.8 107.U 10U.5 111.3 112.9 116.1* (U) 136.3 ---- —... 103.lt 110.6 10U.3 10l*.9 99.9 120.6 88.7 138.U 125.0 178.5Dee ember- 112.5 111.3 130.8 101.2 105.3 118.1 112.0 117.3 133.7 136.3 — 103.7 110.5 10U.U 105.1 99.6 i a . 5 88.7 lU0.7 127.3 178.5
1956: Average- llU .l 112.9 133.7 102.8 107.9 122.5 no.!* 120.8 135.3 136.3 ___ 105.5 112.3 105.7 106.7 100.1 125.3 89.0 ll*1.6 128.2 179.9March---- 112.1 110.7 130.6 100*0 105.7 121.5 108.3 119.3 (it) 136.3 —— I0lt.3 110.9 105.3 1 0 6 .0 100.li 123.2 89.1 139.3 125.9 178.5June—--- lli*.5 113.2 130.8 103.7 105.8 130.5 107.5 120.6 135.0 136.3 . . . . . . . . 105.0 110.8 105.U 106 .8 99.7 12U.6 88.8 1U0 .0 126.1* 180.6September- 115.3 ll l* . l 137.U 105.1 110.5 117.8 112.5 121.1* 135.8 136.3 . . . . . . . . 1 05 .8 111.1* 105.9 107.0 99.8 127.0 89.0 11*1.1 127.6 180.6December-- 116.3 lli*. 9 138.2 103.5 113.2 121.)* 112.7 12i*.l 137.2 136.3 1 0 8 .5 118.9 106 .9 107.9 100.7 129.0 39 .U 1U8.7 135.5 180.6
1957: Average. 117.8 116.2 11*0.0 108.6 113.2 121.2 111.1* 125.1* 139.5 136.8 107.3 119.7 107.5 108.9 100.6 131.1 90.3 150.7 137.1* 182.UMarch---- 116.2 llU .5 139.6 105.3 113.3 118.3 110.1 125.1 138.9 136.3 1 08 .6 H9.lt 107 .6 1 08 .8 100.9 130.7 90.3 i5 i .o 137.7 182.6June----- 118.2 1 16.8 11*0 .1 109.8 109.3 130.8 107.9 12i*.9 139.2 136.3 —— —- 107.2 119.5 107.3 109.2 100.0 130.6 90.3 1U9.3 136.5 182.6September- 119.U 117.7 11*0 .1 112.6 116.5 117.2 113.2 125.3 139.9 136.3 -------- 105.7 119.9 107.5 108.6 100.6 131.2 90.3 150.7 137.U 182.6
December- 119.5 117.3 11*0.8 108.9 316.6 118.7 111*.6 127.1* 11*1.5 139.3 — 107.2 120.6 108.2 109.U 100.9 133.6 90.6 152 .U 139.2 182.6
1958: Average. 123.1 121.7 11*1*.!* 113.5 U 5 .$ 130.3 111.7 129.1 11*1*.7 11*2.9 ______ _ 106.6 121.2 108.2 109.3 100.6 13U.6 9 0 .5 157.6 1UU.6 182.6March---- 122.9 121.6 11*1.0 119.0 116.9 130.2 111.1* 128.1* 11*3.6 11*1.3 . . . ----- 107.1 120.9 308.3 109.1 101.2 133.8 90.6 155.7 11*2.6 182.6June----- 12U.5 123.1* 1U5.U 120.7 u l *.0 139.8 109.7 129.2 11*1* .3 11*1.3 106.8 120.9 108.1 109.3 100.7 133.9 90.6 157.8 1UU.B 182.6September- 123.9 122.5 11*7.2 118.8 116.1* 126.0 115.8 129.6 11*5.7 11*5.2 —.—. . . . 106.2 i a . 6 108.1 109.3 100.3 135.2 90.3 160.7 11*7.9 182.6Decenber— 122.8 i a . 1 11*7.3 116.5 116.8 127.9 111.2 130.1 11*7.0 11*5.2 ------- 106.1 122.0 108.1 109.3 100.0 136.5 90.3 158.2 11*5.2 182.6
See fo o tn o te s a t end o f ta b le .
Digitized for FRASER http://fraser.stlouisfed.org/ Federal Reserve Bank of St. Louis

Table C-3. Consumer Price Index—20 large c i t ie s : Indexes o f food , housing, apparel, transportation, and th eir subgroupsby year and month, 19^7-58—Continued
(19W-U9-100)
120
Digitized for FRASER http://fraser.stlouisfed.org/ Federal Reserve Bank of St. Louis
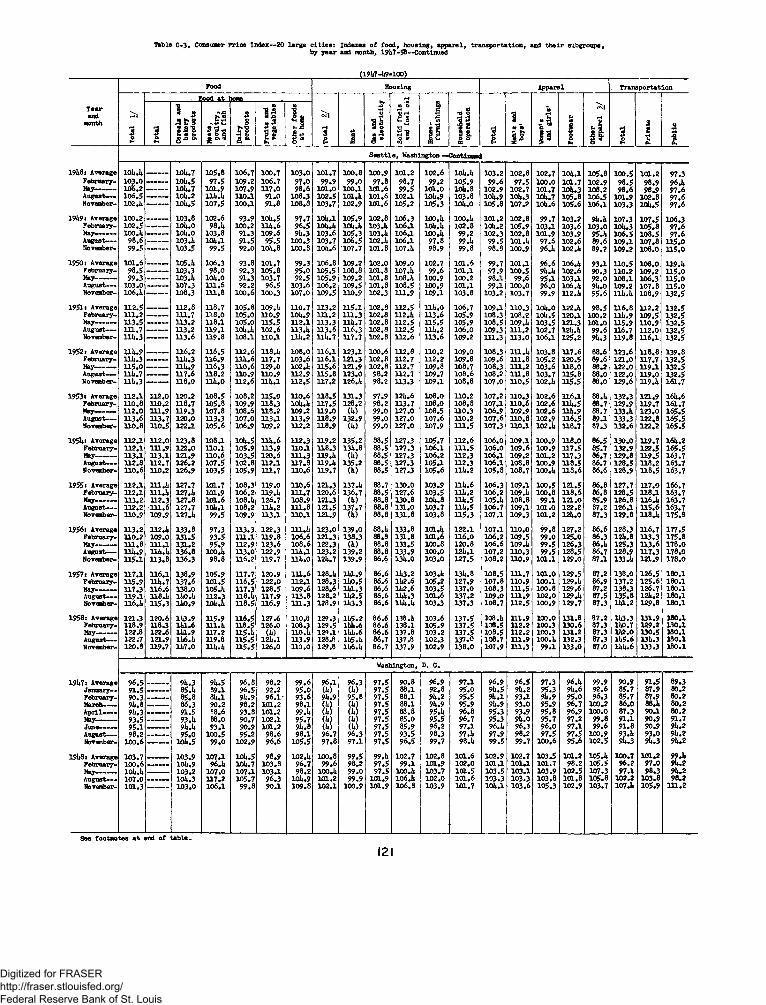
Table C-3. Consumer Price Index—20 large c i t ie s : Indexes o f food , housing, apparel, transportation, and th eir subgroups,by year and month, 191*7—58—Continued
(191*7-1*9-100)
Food Housing Apparel Transportation
Tota
l 1/
. Food at
Tot
al
2/
Rent
Oas
and
elec
tric
ity
Solid
fue
ls
and
fuel
oil
Hou
se-
furn
ishi
ngs
Hou
seho
ldop
erat
ion
Tota
l
Men
's an
d bo
ys'
3
c1 1 Fo
otw
ear
Oth
erap
pare
l 3
/
Tota
l
r
Tota
l
Cer
eals
and
ba
kery
pr
oduc
ts
Nea
ts,
poul
try,
an
d fi
sh
Dai
rypr
oduc
ts
Frui
ts a
nd
-veg
etab
les
Oth
er f
oods
at
hom
e
Priv
ate
Publ
ic
S ea ttle , Washington —Continued
191*8: Average 10U.1* — — 10U.7 105.8 106.7 100.7 103.0 101.7 100.8 100.9 101.2 102.6 10l*.i* 103.2 102.8 102.7 10i*.l 105.8 100.5 101.2 97.3February- 103.0
10S.2------ I0lt.5 97.5 109.2 106.7 97.0 99.9 99.0 97.8 98.7 99.2 105.9 99.6 97.5 100.0 1O0L.7 102.9 98.5 98.9 96.lt
May------ ---—- iolt.7 101.9 107.9 117.0 98.6 101.0 100.1 101.6 99.5 101.0 10lt.8 102.9 102.7 101.7 iolt.3 108.2 98.6 98.9 97.6August— 106.5 — 10li.2 Ult.lt 110.1 91.0 108.3 102.5 101.1* 101.6 102.1 10lt.9 103.8 lOlt.9 10l*.3 10i*.7 105.8 106.5 101.9 102.8 97.6November- 102.1* — iolt.5 107.5 100.1 91.8 108.8 103.7 102.9 101.6 105.2 105.3 lOlt.O 105.8 107.2 10lt.6 105.6 1 06 .1 103.3 10lt.5 97.6
19 k 9 t Average 100.2 _____ 103.8 102,6 93.9 id t.5 97.7 10U.1 105.9 102.8 106.3 100.1* 100.1* 101.2 102.8 99.7 103.2 9lt.lt 107.3 107.5 106.3February- 102.5 — — lOlt.O 98.1* 100.2 11U.6 96.5 102t.it 10lt.lt 103.U 1 0 6 a iait.lt 102.8 10li.2 105.9 103.1 103.6 103.0 10lt.3 1 0 5 .8 97.6May— — 100.lt — — 10lt.0 103,8 91.3 1 0 9 .6 9l*.3 103.6 105.3 103.1* 1 06 .1 100.1* 99.2 102.3 102.8 101.9 103.9 95.1* 106.5 108.5 97.6August— 98.6 . . . —. 103.1* 10l*.l 91.5 95.5 100.3 103.7 106.5 102.1* 1 06.1 97.8 99.1* 99.5 101.1* 97.6 102.6 89.6 109.1 107.8 U 5 .0November- 99.5 — 103.5 99.5 92.0 10i*.8 100.8 10i*.6 107.7 101.8 107.1* 98.9 99.8 98.8 100.9 96.1* 102.1* 89.2 109.2 108.0 n 5 .o
1950: Average m . 6 ____ _ 105.1* 106.3 93.8 101.7 99.3 106.8 109.2 102.0 109.0 102.7 101.6 99.7 101.1 9 6 .6 1 06 .1* 93.1 n o .5 108.0 U 9.ltFebruary- 98.5 ----- 103.3 98.0 92.3 105.8 95.0 105.5 108.8 101.8 107.1* 99.6 101.1 97.9 100.5 9lt.it 102.6 90.3 n o .2 109.2 n 5 .oMay------August—-
99.3103.0
103.1*107.3
lOlt.O111.6
91.392.2
103.796.5
92.5103.6
105.9106.2
109.2109.5
101.8101.8
1 08 .1*108.5
100.9100.9
100.2101.1
98.199.1
99.6100.0
95.196.0
103.1 1 0 6 .1*
92.09U.0
108.11 09.2
106.3107.8
n 5 .oH 5.0
November- 1 0 6 .1* — 108.3 111.8 1 0 0 .6 100.3 107.0 109.5 110.9 102.3 111.9 109.1 103.8 103.2 1 0 3 .7 99.9 H2.1* 95.6 ni*.it 108.9 132.5
1951* Average February-
112.5111.2
112.8U 1.7
118.71 1 8 .0
105.8105.0
109.1*110.9
H 0.710it.9
113.2131.2
115.1111.3
102.8102.8
112.5112.1*
llit.O113.6
106.7105.9
109.1108.3
110.3108.2
10U.010lt.5
122.1*120.1
98.5100.2
n 6 .8lllt.9
U 2.2109.5
1 32 .51 3 2 .5
May——— 113.5 ----— 113.2 118.1 105.0 115.5 112.1 H 3.3 111*. 7 102.8 112.5 H 5.5 105.9 108.5 109.1* 103.5 121.3 101.0 n 5 .9 n o .9 132.5August— 111.7 . . . . . . 113.2 119.1 10U.1* 102.6 113.U 113.6 116 .3 102.8 H 2.5 lllt.2 1 0 6 .0 109.3 m .2 102.7 12i*.i* 99.6 n 6 .7 112.0 132 .5November- Hlt.3 — 113.6 119.8 108.1 110.1 lUt.2 111*. 7 117.7 102.8 112.6 H 3.6 109.2 111.3 113.0 106 .1 125.2 9l*.3 U 9 .8 n 6 . i 1 3 2 .5
1952: Average February-
lllt.911U.3
116.2m *.3
116.5116.9
112,6 111*.6
118.1*117.7
108.0103.6
116.1116 .1
123.1121.3
100.6102.8
112.8112.7
110.2H 2.2
109.0109.8
108.3109.6
111.1* i n . 8
103.8105.2
H 7.6120.5
88.689.6
123.6121.0
H 8.8H 7.7
139.81 3 2 .5
May— — 1 1 5 .0 — lllt.9 116.3 110.6 129.0 102.1; 115.6 121.9 102.8 112.7 109.8 108.7 108.3 m .2 103.6 n 8 .o 88.2 122.0 H 9.1 1 3 2 .5August— 11U.7 — 117.6 118.2 H 0.9 H 0.9 H 2.9 115.8 123.0 98.2 112.7 109.7 108.6 108.2 m . 8 103.7 H 5.8 88.0 122.0 H 9.0 132.5November- 111*. 3 — 118.0 llit.O 112.6 11U.1 112.5 117.2 1 26 .1* 98.2 H 3.3 109.1 1 0 8 .8 107.0 n o .5 102.1* H 5.5 88.0 129.6 H9.it 1 6 L.7
1953: Average 112.1 112.0 120.2 108.5 108.2 115.0 110.6 118.5 131.3 97.9 121*.6 108.0 110.2 107.2 n o .3 102.6 n 6 . i 88.1* 132.3 121.9 16U.6February- 110.8 110.2 118.7 105.8 109.9 118.3 10lt.it 117.5 128.2 98.2 113.7 108.0 108.8 107.1 1 1 0 .6 102.6 n it.5 88.7 129.9 H 9.7 161.7May------ 112.0 111.9 119.3 107.8 1 0 8 .6 118.2 109.2 119.0 (U) 99.0 127.0 108.5 110.3 106.9 109 .9 102.6 lll*.9 88.7 133.1* 123.0 165.5August— 113.6 113.7 120.0 113.3 107.0 113.1 113.9 118.9 132.9 99.0 127.6 107.6 110.2 107.6 n o .8 102.9 116.5 89.1 133.3 122,8 165.5November- 110.8 110.5 122.1 105.6 106.9 109.2 112.2 318.9 (1*) 99.0 127.0 107.9 1 H ,5 107.3 n o . i 102 .1* H 8.7 87.3 132.6 122.2 165.5
1951*: Average 112.1 112.0 1 2 3 .8 1 08 .1 10lt.5 ll it .6 112.3 119.2 135.2 88.5 127.3 105.7 112.6 1 06 .0 109 .1 100.9 118.0 86.5 130.0 H 9.7 16U.2February- 112.1 111 .9 122.0 110.1 105.9 113.9 110.1 118.3 13U.8 88.5 127.3 1 06 .1 m . 5 1 06 .0 1 0 9 .6 100.9 H 7.5 85.7 132.9 122.5 165.5Way------ 113.1 113.1 121.9 110.6 103.5 120.6 111.3 319.1* (It) 88.5 127.3 1 0 6 .2 112.3 1 0 6 .1 109 .2 l d . 2 H 7.3 86.7 129.8 H 9.5 163.7August— 112.8 112.7 126 .2 107.5 102.8 112.1 117.8 319.1* 135.2 88.5 127.3 105.1 112.3 1 0 6 .1 1 08.8 100.9 H 8.5 86.7 128.5 n 8 .2 163.7November- 110.6 110.2 126.9 103.5 105.9 111.7 110.6 119.7 (1*) 88.5 127.3 105.6 111*. 2 105.8 1 08.7 100.1* H 8.6 86.6 128.9 H 8.5 163.7
1955* Average 112.1 111.1* 127.7 101.7 108.3 119.0 110.6 121.3 137.1* 88.7 130.0 103.9 111*. 6 1 06 .3 109.1 1 0 0 .5 121.5 86.8 127.7 H 7.0 166.7February- 112.1 111.1* 127.1* 101.9 1 06 .2 119.lt 111.7 120.6 136.7 88.5 127.6 103.5 lllt.2 1 0 6 .2 1 0 9 .1* 100.8 H 8.6 86.8 128.5 n 8 . i 163.7May------ 113.2 112.3 127.8 101.6 1 0 8 .it 126.7 108.9 121.3 (It) 88.8 130.8 10U.8 ill* .5 105.1* 1 08 .8 99.1 121.0 85.9 126.8 n 6.U 163.7August— 112.2 •111.6 127.7 10U.1 108.2 111*. 2 111.8 121.5 137.7 88.8 131.0 103.7 n it.5 106.7 109.1 101.0 122.2 87.2 126.1 H 5.6 163.7November- 110.9 109.9 127.U 99.5 109.9 113.1 110.1 121.9 (1*) 88.8 131.8 103.8 315.3 107.1 109 .3 101.2 12U.0 87.3 129.8 H8.1* 175.8
1956: Average 113.2 112.1* 133.8 97.3 113.3 122.3 H l.lt 123.0 139.0 88.1* 133.8 101.1* 1 2 2 .1 107.1 n o .o 99.8 127.2 86.6 128.3 n 6 .7 177.5February- 110.2 109.0 131.5 93.5 111.1 119.8 106 .6 121.3 138.3 88.8 131.8 10GL.6 1 16 .0 106 .2 1 0 9 .5 99.0 125.0 86.3 12l*.8 1 1 3 .3 175.8May------ 111.8 111.1 131.2 95.9 112.9 123.6 108.6 122.3 (It) 88.8 133.5 100.8 1 20 .8 1 0 6 .6 1 09 .1* 99.5 126.3 86.1* 125.3 H 3.6 178.0August--- 11U.9 11U.I* 136.8 100.1* 113.0 122.9 111*. 1 123.2 139.2 88.8 133.9 100.0 12lt.l 107.2 n o .3 99.5 128.5 8 6.7 128.9 H 7.3 178.0November- 115.1 113 .8 136.3 98.8 1 16.2 119.7 Hl*»0 12U.7 139.9 86.6 13U.0 103.0 1 27 .5 108 .2 n o .9 101.1 129.0 87.1 133.1* 121.9 178.0
1957* Average 117.1 116.1 138.9 105.9 117.7 120.9 131.6 1 2 8 .1* 11*1.9 86.6 11*3.2 103.1* 13U.8 108.5 1 11 .7 101.0 129.5 87.2 138.0 126.5 180.1February- 115.9 n i*.7 137.6 101.5 116.5 122.0 112.1 128.3 11*0.5 86.6 11*2.6 105.2 1 27 .9 107.8 1 10 .9 100.1 129.1* 8 6.9 137.2 125.6 180.1May------ 117.3 1 1 6 .6 138.0 105.U 117.3 128.5 109.6 128.6 11*1.3 86.6 11*2.6 103.5 137.0 108.3 m . 5 100.8 129.6 87.2 138.3 126 .7 180.1August--- 119.1 118.1* 11*0.1* 1 12 .3 H8.lt H 7 .9 113.8 128.2 ll*2.5 86.6 11*1*.3 101.6 137.2 109.0 i n . 9 102.0 129.1* 87.5 135.8 12l*.2 180.1November- U6.1* 115.3 11*0.9 iat*.l* 118.5 116.9 H 1.3 128.9 ll*3.3 86.6 lliit.lt 103.3 137.3 108.7 U 2.5 100.9 129.7 87.3 11*1.2 129.8 180.1
1958* Average 121.3 120.6 11*3.9 115.9 116.5 127.6 110.8 129.3 11*5.2 86.6 138.1* 103.6 137.5 108.1* m . 9 100.0 131.8 87.2 11*3.3 131.9 180.1February- 118.9 118.3 11*1.6 111.1* 118.5 126.0 108.3 129.5 lldi.6 86.6 138.1 105.9 137.5 108.5 112.2 100.3 130.6 87.3 11*0.7 129.2 130.1May------ 122.8 122.6 11*1.9 117.2 115.1* (U) 110.1* 129.1 lltli.6 86.6 137.8 103.2 337.5 108.5 H 2.2 100.3 131.2 87.3 11*2.0 130.5 180.1August--- 122.7 121.9 11*6.1* 119.8 115.5 121*.1 U 3.9 128.8 11*5.1* 86.7 337.8 102.3 137.0 108.7 m .9 100.1* 132.3 87.3 11*5.6 131*.3 180.1November- 120.8 119.7 11*7.0 lll*.l* U 5 .5 126.0 110.0 129.8 11*6.1* 86.7 137.9 102.9 138.0 107.9 111.3 99.1 133.0 87.0 ll*i*.6 133.3 180.1
Washington, D. C.
19U7* Average 96.5 9U.3 9l*.5 96.8 98.2 99.6 96.1 96.3 97.5 90.8 96.9 97.1 9 6.9 96.5 97.3 96.1* 99.9 90.9 91.5 89.3January— 91.5 85.1* 89.1 96.5 92.2 95.0 (1*) (U) 97.5 88.1 92.8 95.0 9U.5 91*. 2 95.3 9U.6 92.6 85.7 87.9 80.2February- 90.3 85.8 8i*.l 9U.9 96.1 93.6 9U.9 95.8 97.5 88.1 9U.2 95.5 9l*.l 93.1 9l*.9 95.0 96.3 85.7 87.9 80.2March---- 9l*.8 _____ 86.3 90.2 98.2 101.2 98.1 (1*) (It) 97.5 88.1 9U.9 95.9 9U.9 93.0 95.9 96.7 100.2 86.0 88.1* 80.2April---- 9U.3 ___ — 91.5 88.6 93.8 101.2 99.1* (1*) (1*) 97.5 88.8 95.1* 96.8 95.3 93.9 95.8 96.9 100.0 87.3 90H 8 0.2May— — 93.5 _____ 93.1* 88.0 90.7 102.1 95.7 (!*) (1*) 97.5 85.0 95.5 96.7 95.3 9l*.0 95.7 97.2 99.8 91.1 90.9 91.7J u n e - 95.1 — — 9l*.U 93.1 90.9 101.2 9U.8 (It) (1*) 97.5 85.9 96.2 97.1 96.1* 96.3 96.0 97.1 99.6 91.8 90.9 9l*.2August— 98.2 95.0 100.5 95.2 98.6 98.1 96.7 96.3 97.5 93.5 98.3 97.1* 97.9 98.2 97.5 97.5 100.9 93.1* 93.0 9l*.2Novembsr- 100.6 — 10l*.5 99.0 102.9 96.6 105.5 97.8 97.1 97.5 96.5 99.7 98.1* 99.5 99.7 100.6 95.6 102.5 9U.3 9lt.3 9lt.2
191*8: Average 103.7 ___ 103.9 107.1 10it.5 98.9 102.1* 100.8 99.5 99.1* 102.7 102.8 101.6 102.9 102.7 103.5 m .2 105.1* 100.7 101.2 99.1*February- 100.6 _____ 10l*.9 96.1* 10U.7 103.8 96.7 99.6 98.2 97.5 99.1 m .9 102.0 10EL.1 101.1 101.7 98.2 105.5 96.2 97.0 9U.2May------ lOli.U _____ 103.2 107.0 107.1 103.1 98.2 100.1* 99.0 97.5 100.1* 103.7 m .5 103.5 103.1 103.9 102.$ 107.3 97.1 98.3 9U.2August— 107.0 10lt.3 U 7.2 105.7 96.3 10l*.9 101.2 99.9 101.9 106.1* 102.0 m .6 103.3 103.3 103.8 I d . 8 105.8 102.2 103.8 98.2November- 101.3 103.0 106.1 99.8 90.1 109.8 102.1 100.9 l d . 9 1 06 .8 103.9 1 01 .7 10lt.l 103.6 105.3 102.9 103.7 107.U 105.9 m .2
See footnotes a t end o f tab le .
121
Digitized for FRASER http://fraser.stlouisfed.org/ Federal Reserve Bank of St. Louis

Table C-3. Consumer Price Index—20 large c i t ie s : Indexes o f food , housing, apparel, transportation, and their subgroupsby year and month, 191:7-58—Continued
(19U7-U9-100)
Tearand
month
Food Housing Apparel Transportation
Tot
al
1/3s R
ent
i____
____
____
____
_Q
as
and
ele
ctr
icit
y
So
lid
fu
els
an
d fu
el
oil
Hou
se -
fu
rnis
hin
gs
Hou
seh
old
op
era
tio
n
Tot
al
Men
's
and
bo
ys'
Wom
en's
an
d g
irls
'
Foo
twea
r
Oth
era
pp
are
l 3
/
To
tal
To
tal
Cer
eals
an
d b
aker
y p
rod
uct
s
Mea
ts,
po
ult
ry,
and
fish
Dai
ryp
rod
uct
s
Fru
its
and
veg
eta
ble
s
Oth
er f
ood
s a
t ho
me
Pri
va
te
Pu
bli
c
Washington, D, C.—Continued
191:9 s Average 99.9 _____ 101.9 98.U 98.7 102.9 98.1 1 0 3 .1 10U.1 103.0 106.5 100.3 l d . 3 100.2 100.9 99.2 102.ii 9i:.7 108.5 107.3 111.3February- 97.2 ——— 102 .7 91.6 99.0 103.8 92.7 1 02 .7 102.1 101.9 107.6 103.7 101.1* 101.7 l d . 8 101.8 101.8 99.8 1 08 .0 1 06 .6 U 1.2May------ 100.2 — l d . 8 97.6 95.2 109.9 9U.6 102 .2 1 0 3 .3 101.9 102.2 99.8 101.5 100.1: 100.7 100.3 loo.e 97.0 108.7 107.7 111.2August— 101.3 101.3 101.3 100.3 102.9 100.1 1 0 2 .9 10U.U 101.9 1 0 6 .1 98.6 101.5 99.5 100.6 97.8 103.3 91.0 108.3 107.1 111.2November- 100.9 — 101.1: 98.1 101.0 103.1 103.U 10U.5 1 06 .9 103.9 UO.O 99.1 100.8 98.9 100.2 96.5 103.5 90.2 108.9 107.9 m .2
1950* Average 100.9 — — 103.3 102.1 100.5 97.1* 100*1 1 0 6 .5 107.5 109.0 1U .7 102.1* lOlt.l 99.2 98.9 97.2 105.5 9U.6 m . i 107.9 U 9.2February- 96.6 _______ 101.9 9U.U 101.0 97.0 91.1: 10l*.9 107.2 109.0 109.1: 99.6 100.5 98.0 100.0 96.U 103.li 91.6 109.2 107.1 11U.2May------ 98.1 ___ ___ 101.3 100.3 97.7 98.3 90.9 105.5 107.3 109.0 106.9 99.7 10U.0 98.0 97.6 9 6.6 lOli.O 90.8 109.1 107.0 111:. 2August— 103.3 10U.9 110.2 100.1 91.8 lOli. 7 106 .7 108.1 109.0 111.2 101.8 I0l*.8 98.3 97.1* 96.5 105.1 97.0 U 2 .8 108.3 12U.UNovember- lOlwO — 106.5 ioU.5 103.7 96.1* 109.0 1 08 .7 108.5 109.0 U 7 .1 108.0 1 06.7 101.1 100.3 99.2 108.6 98.5 U 3.2 108.9 12U.U
1951* Average 111.7 ___ _ 112.8 1 1 5 .0 109.2 1 0 6 .6 111.6 U 2 .0 U 2.3 108 .6 120.6 111.6 1 09.6 105.5 1 06 .0 101.5 U 5.6 101.9 115.1 1U.U 12U.5February- 111.2 ______ 112.6 113 .U 108.8 111.5 106*8 1 10 .3 108.7 109.0 121.0 U 2 .8 108.6 10U.6 103.7 101.5 115.3 iol:.U U3.U 109.2 12U.UMay------ 111.7 -______ 113.3 ii5 .3 108.5 108.3 109.9 u o.3 109.3 1 0 8 .8 119.3 112,1 1 0 8 .1* 105.6 1 06 .0 101.6 U 5.8 lOli.l* llU.U U 0 .6 12U.UAugust— H 0.9 _____ 113.5 1 16.3 108.2 99.6 U 3.2 U 2.8 111:.9 1 0 8 .8 120.8 uo.U 107.9 105.8 106.7 101.5 U 6.5 101.7 n u .5 U 0.6 12U.UNovember- 113.6 — 113.1: 1 15 .6 111.6 108.1 U 6 .5 Ul*.8 U 6.1 1 08.8 121.6 111.8 U 3.7 1 06 .U 108.3 102.0 U 5.8 99.0 U 7 .8 U 5 .1 12U.U
1952* Average 113.6 — — 113.7 11U.8 U 3.2 U 7 .1 106.3 115.1* U 7.7 112.8 12U.0 109.1 U 3.1 103.8 105.8 99.7 U 3.3 90.5 122.8 U 9.8 1 30 .2February- 111.1 — — 11U.U HU.6 113.8 108.6 101.8 111:.9 U 7.2 108.8 121.6 109.6 U 3.5 I0l».7 106.7 100.1: 115.6 90.2 120.1: U 7 .6 127.3May——— 112.9 1 1 3 .7 U 3 .1 111.9 123.2 100.3 U 5.2 U 7.5 UU.9 U 9.3 109.2 113.0 lOli.O 106.5 99 .U llli.O 90.1 120.2 U7.1* 127.3August— 1 16.1 UU.O U8.1: 113.8 U 9.2 U 0.3 U 5.5 118.0 111: .9 125.1 107.7 U 3 .0 103.5 105.8 99.7 H I . 7 89.6 123.5 121.8 127.3November- 113.U — 112.6 111.5 113.8 116.U U 2 .0 U 6 .0 U 8.2 111:.9 128.0 109.7 U 2.9 102.5 103.7 98.9 U 2.0 91.1 127.1: 122.8 139.1
1953* Average 111.1: 1 11 .0 n l:.5 107.1: m .o 109.8 109.9 116.8 120.1 U6.U 130.9 109.2 U3.U 103.7 106 .0 99.3 U 3.7 91.8 127.9 123.3 139.3February- 110.1 109.7 1 12 .2 10U.8 U 3.ll 11U.8 105.9 116.3 (U) UU.9 132.2 109.1 U 3 .1 103.3 105.1 99.5 U 2.3 91.8 127.1 122.1: 139.1May------ 110.8 110.1 115 .7 105.U U 3.2 109.7 108.7 116 .2 U 8 .6 111:. 9 126.6 108.9 U 3.0 103.8 106.1 99.5 U 3.0 92.5 127.3 122.7 139.1August— 113.3 113.1 H 5.5 113.5 UU.3 107.1 U 2.1 U 6.1* <10 U 7 .0 130.2 108.6 U 3.1 IOU.0 1 06.7 99.0 U 5 .0 92.7 128.8 12U.1* 139ANovember- 110.6 109.8 1 15 .3 10l:.9 lll*.3 10U.2 111.7 U 8.3 122.7 118.1 13U.0 U 0.3 llU.U 103.8 106.3 99.1* lH i.5 90.5 128.1* 123.9 139.1
195U* Average 111.8 110.9 119 .9 10U.1 1 U .9 108.2 U 3.3 U 7.2 1 23 .0 U 7 .0 129.9 107.1* U 5.9 102.5 105.1* 97.1 115.0 90.5 127.1* 122.0 1UU.1February- 110.9 1 10.3 118.1 105.2 uU .i 10U.U 111.6 U 7.7 (U) U 8 .1 133.3 108.2 ll li.7 103.1: 105.6 99.1 U li.6 90.3 128.1 122.5 1U5.UMay------ 112.9 1 12 .1 120.7 107.2 U 0 .8 U 0 .1 U 3.3 U 6.8 123.0 U 8 .1 125.5 107.2 111:. 8 102.5 105.5 97.0 U 5.2 90.8 127.1 121.6 1U3.9August— UU.5 1 13 .7 121.5 105.2 111.9 11U.U 118.1 117.0 (U) U 5.9 127.3 107.1 U 7.0 101.7 10l».9 95.8 U5.U 90.1: 125.2 U9.U 1U3.9November- 110.1 108.7 120.7 98.7 111.2 103.5 llli.li U 7.2 123.0 U lt.3 130.3 106.9 U 7 .0 102.3 105.1: 96.8 llli.7 90.5 129 .U 12U.3 1U3.9
1955* Average 111.2 1 0 9 .6 122.1 99.2 111.0 1 U .1 111.7 1 16 .6 123.5 121.3 132.9 1 03 .2 120.1 1 0 1 .5 105.0 95.2 U 5.8 90.3 129.5 123.6 1U8.6February- 110.9 1 09 .5 122.5 100.1 n o .9 108.5 U 1 .9 1 16 .1* (1*) 118.2 13U.7 105.2 U 6.9 101.2 105.2 9li.8 U li.7 90.1 129.0 123.8 1U3.9May------ 111.3 109.7 122.0 99.3 109.5 U 7.7 108.0 U 6 .9 123.5 1 21 .6 128.6 105.1* U9.1* 101.1 loU.7 9U.8 U 5.2 90.1 128.6 123.3 1U3.9August— 111.7 110.1 121.9 100.5 109.1: uo.U U 3 .5 1 16 .8 (10 123.1 132.0 101.6 121.1 101.6 105.1 95.1* 115.U 90.3 129.1 122.3 153.3November- 109.9 107.8 121.7 9U.2 U 2.8 105 .7 U 3 .5 1 16 .1* 1 23 .7 122.7 133.5 100.6 122.9 102.1 105.1 95.6 117.9 90.5 131.1* 125.0 153.3
1956* Average 112.6 110.7 122.7 95.2 111:. 2 118.7 I13.li U 6 .9 12U.U 123.1 139.U 99.6 125.1 103.1: 106.5 96.6 121.1 91.2 131.2 12U.6 15U.5February- 109.9 107.8 121.8 93.0 U 3 .1 113.6 109.1 U 5.5 CU) 123.1 138.9 99.1* 123.9 102.6 105.6 95.7 120.1 91.0 130.1* 123.9 153.3May------ 112.0 109.9 121.9 93.0 U 2.1 122.3 U 2 .1 U 6.6 121*. 2 123.1 136.2 100.1* 125.2 103.6 105.8 97.1* 120.8 sa.l: 129.0 121.9 15U.9August--- 113.7 112.0 122.5 97.1 U 5 .3 120.5 111:.3 U 7.9 12U.7 123.1 138.3 99.1 125.6 103.8 107.1 96.8 121.9 91.1: 130.3 123.U 15U.9November- 112.8 110.7 123.0 96.9 115.9 U 0.6 115.8 117.1* 12U.7 123.1 11:2.9 99.1* 125.6 103.7 107.3 96.5 121.5 91.0 135.2 129.1 15U.9
1957: Average 116.9 111:. 6 129 .U 10ii.6 U 6 .9 U 6 .5 U 3.9 U 8.9 125.6 121.6 11:5.8 99.9 126.2 103.9 107.8 96.9 122.9 88.6 137.7 131.6 156.6February- 115.9 113.6 129.3 102.3 U 5.6 U 5.1: HU. 2 U 9.2 125.1 120.8 151.7 100.1 125.8 10U.2 108.1 96.5 123.2 91.2 135.3 128.9 156.6May------ 115.9 113.1: 129.7 102.6 U 5 .8 118.0 1 U .0 U 7.7 125.1* 121.0 1UU.7 99.0 125.8 103.8 107.7 97.1 123.1 86.7 136.2 129.9 156.6August— 120.0 118.3 129.8 111.2 U 6.6 125.0 111. 6 118.3 125.8 122.7 llil.3 99.6 126.2 10U.2 107.7 97.7 122.7 87.8 137.9 131.9 156.6November- U 6.8 llii.2 129.6 103.5 U 9.3 109.7 U 7.0 120.5 126.1 122.7 11:2.7 100.8 127.1 103.6 107.8 96.3 122.8 88.7 n a .6 136.2 156.6
1958: Average 121.6 120.0 131.3 11U.6 U 8.6 126.8 113.9 120.2 127.2 126.3 138.9 100.1 130.2 103. U 107.5 96.1 122.8 83.2 llt0.3 133.3 161.9February- 120.0 118.1 131.6 111.3 119.5 123.9 111.7 U 9.5 126.7 12li.5 11,2.0 100.3 127.2 103.1. 107.7 96.0 122.1: 88.6 137.9 131.6 158. UMay--- — 123.1: 122.2 132.2 U 6.li U 7.8 138.5 112.1* 120.6 127.1 12U.5 132.6 100.5 130.5 103.2 107.1: 95.9 122.5 87.6 138.1 131.8 158. UAugust—- 122.1: 120.9 131.2 U 7.3 U 8.3 127.6 UU.I 120.1 127.1: 12h.5 139.0 99.0 131.1: 103.5 107.0 96.7 122.8 87.U 139.7 133.6 158. UNovember- 119.8 117.7 132.3 113.0 U8.U 11U.9 llli.7 120.1* 127.8 130.5 110.7 100.7 131.7 103.6 107.8 96.0 123.3 89.1 11:5.5 137.9 172. U
1 / Includes restaurant meals, not shown separately, from 1953 forward.5/ Includes house purchase and upkeep, not shown separately, from 1953 forward. 3/ Includes infants' wear, materials for home sewing, and Jewelry. h j Not available.
122
Digitized for FRASER http://fraser.stlouisfed.org/ Federal Reserve Bank of St. Louis

Bibliography
Additional references will be found in the Bibliography of Consumer Prices in the United States 1949-52. U.S. Department of Labor, Bureau of Labor Statistics, 1954
Bulletin 1165
DESCRIPTION OF CONSUMER PRICE INDEX
The Revised Consumer Price Index. Monthly Labor Review, February 1953, pp. 161-175. U.S. Department of Labor, Bureau of Labor Statistics.
The Consumer Price Indexi A Layman1 s Guide. U.S. Department of Labor, Bureau of Labor Statistics, 1953. (Bull. 1140).
Consumer Price Index. Reprint of Chapter 9, from BLS Bulletin 1168, ygqhplquag of Preparing Major BLS Statistical Series. U.S. Department of Labor, Bureau of Labor Statistics, December 1954.
The Consumer Price Index: A Short Description. U.S. Department of Labor, Bureau ofLabor Statistics, 1959.
TaT<t« the Conamer Price Index. Monthly Labor Review, January 1953, pp. 53-57. Reprint No. 2090. U.S. Department of Labor, Bureau of Labor Statistics.
Automobile Price. In the Consumer Price Index. Monthly Labor Review, November 1955, pp. 1269-1273. Reprint No. 2179. U.S. Department of Labor, Bureau of Labor Statistics.
Bouaing Costs In the Consumer Price Index. Pt. 1, Concept and the Expenditure Basie. February 1956, pp. 189-196} Pt. 2, Pricing Procedures. April 1956, pp. A42-4A6. Reprint No. 2188. UeS. Department of Labor, Bureau of Labor Statistics.
The British and the United States Consumer Price Indexes. Monthly Labor Review,April 1957, pp. 475-483. U.S. Department of Labor, Bureau of Labor Statistics.
The Computation of Cost-of-Living Indexes. International Cooperation Administration, Office of Labor Affairs. Prepared by U.S. Department of Labor, Bureau of Labor Statistics, May 1957.
Recurring Dwelling Unit Surveys for the Consumer Price Index. Monthly Labor Review, December 1957, pp. 1489-1491. U.S. Department of Labor, Bureau of Labor Statistics.
Footwear; Prices and Average Factory Values. Monthly Labor Review, February 1959, pp. 151-157. U.S. Department of Labor, Bureau of Labor Statistics.
RELATIVE IMPORTANCE OF COMPONENTS OF THE CONSUMER PRICE INDEX
Relative Importance of Items in the CPI. Monthly Labor Review, August 1954,pp. 891-896. Reprint No. 2146. U.S. Department of Labor, Bureau of Labor Statistics.
Relative Importance of Items in the Consumer Price Index. Monthly Labor Review, April 1955, pp. AAA-AA7. Reprint No. 2163. U.S. Department of Labor, Bureau of Labor Statistics.
123
Digitized for FRASER http://fraser.stlouisfed.org/ Federal Reserve Bank of St. Louis
RilfrtlY* af. foBMMBtf» Monthly Labor Review,May 195o, pp. 568-571. Reprint Mo. 2192. D.S. Department of Labor, Bureau of Labor Statistics*
Relative Importance of Consumer Price Index Components. Monthly Labor Review,May 1957, pp* 599-602* Reprint No* 2236* U*Se Department of Labor, Bureau of Labor Statistics*
Relative Importance of CPI Components. 1957. Monthly Labor Review, July 1958, pp* 767-770* Reprint No* 2287* U.S. Department of Labor, Bureau of Labor Stat1stics«
CONSUMER PRICE MOVEMENTS
Trend Contrasts in Cggnodltr Price and Service Sate*. Monthly Labor Review,May 1954-, pp. 516-521. D.S. Department of Labor, Bureau of Labor Statistics.
IranregrtnUda ,AP , BL§ CpaffUMg .Frtra 1235-£5» Monthly Labor Review,August 1956, pp. 922-925. Reprint No. 2202. D.S. Department of Labor, Bureau of Labor Statistics,
Recent Trend and the Outlook in the Price Situation. Monthly Labor Review, January 1957, pp. 8-14. Reprint No. 22l6. D.S. Department of Labor, Bureau of Labor Statistics*
An Analysis of the Price Situation at Mid-1957. Monthly Labor Review, August 1957, pp. 949-954. Reprint No. 2247. D.S. Department of Labor, Bureau of Labor Statistics.
Medical Care in the Price Index. 1936-56. Monthly Labor Review, September1957, pp* 1053-1058* Reprint No. 2251. U*S. Department Labor, Bureau of Labor Statistics.
Mortgage Interest Rates in the Consumer Price index. 1952—57. Monthly Labor Review, October 1957, pp* 1240-1245. Reprint No. 2261* U.S. Department of Labor,Bureau of Labor Statistics*
Interrelationships of Prices. Wages, and Productivity. 1946-57. Monthly Labor Review, January 1958, pp* 14-22* U.S. Department of Labor, Bureau of Labor Statistics.
The Consumer Price Index in the Current Price Situation. Speech by Ewan Cl&gue,before the Milwaukee Control of the Controllers Institute of America, Milwaukee,Wisconsin, April 8, 1958. Reproduced by U.S* Department of Labor, Bureau of Labor Statistics.
The Consumer Price Index in the Business Cycle. Monthly Labor Review, June 1958, pp. 616-620. D.S. Department of Labor, Bureau of Labor Statistics.
FAMILY EXPENDITURES AND INTERCITY DIFFERENCES
Family Income. Expenditures, and Savings in 1950. From the Survey of Consumer Expenditures in 1950. D.S. Department of Labor, Bureau of Labor Statistics,June 1953. (Bull. 1097).
Study of Consumer Expenditures. Incomes, and S * v W « - Statistical tables: UrbanD.S. - 1950. Tabulated by the Bureau of Labor Statistics, D.S. Department of Labor. Published by the Wharton School of Finance and Commerce, Oniveraity of Pennsylvania, (18 volumes). 1956-58.
I 2 4
Digitized for FRASER http://fraser.stlouisfed.org/ Federal Reserve Bank of St. Louis

Methodology of the Surrey of Consumer Expenditures in 1950. Prepared byHelen Ho m s Lamale, Bureau of Labor Statistics, U.S. Department of Labor. Published by the Wharton School of Finance and Coamerce, University of Pennsylvania, 1959.
Standards .and Levels .of Living of City-Worker Famiypg- Monthly Labor Review, September 195o, pp. 1015-1023* Reprint No. 2204. U.S. Department of Labor, Bureau of Labor Statistics.
Measuring Comparable -Living Costs In-Cities of Diverse Character!sties. Monthly Labor Review, October 1956, pp. 1187-1190. Reprint No. 2207. U.S. Department of Labor, Bureau of Labor Statistics.
Automobile and New Appliance Purchases in Six Cities. 1953-5^. Monthly Labor Review, March 1957, pp. 336-341# Reprint No. 2224* U.S. Department of Labor, Bureau of Labor Statistics.
INDEX AND AVERAGE PRICE SERIES
AZftCTgft .fatal! Prl<reg*t__Collection_an<i_Calculation Techniques and Problems*U.S. Department of Labor, Bureau of Labor Statistics, June 1 9 5 5 . (Bull. 1182).
Aygrare fatall.Erireqi l?55t__Selected^frMrooditles and Services (Other than Food andBousing) .Included in the Consumer Price Index. U.S. Department of Labor, Bureau of Labor Statistics, June 1 9 5 6 . (Bull* 1197).
ggaggngr Prices ip tj&_Unitsd_Statag. 1942-48. Analysis of Changes in the Cost-of- Living. U.S. Department of Labor, Bureau of Labor Statistics, 1949. (Bull. 966).
SansUMC Prices in theJUnitsd states., 1949-52. Price Trends and Indexes.U.S. Department of Labor, Bureau of Labor Statistics, 1954. (Bull. 1165).
Consumer Price Index. Monthly press release and detailed report of the U.S. Department of Labor, Bureau of Labor Statistics. Includes United States indexes for all items, major groups, and subgroups for current month, one month ago, year ago, and 1939; United States indexes for special groups, and purchasing power of the consumer dollar.
Consumer Price Index. Price Indexes for Selected Items and Groups. Annual Indexes, 1935-55 and Quarterly Indexes, December 1952- March 1956. U*S. Department of Labor, Bureau of Labor Statistics, July 1956.
Consumer Price Inde3[. Price Indexes for Selected Itemg,.and_Groung> Quarterly release of the U.S. Department of Labor, Bureau of Labor Statistics.
Consumer Price Index. Historical Series (1947-49=100) Series A, All Items: Series B, All Items and Major Groups: Series C, Food: Series D, Rent: Series E, Apparel: Above Series available for United States 1913 to date, 20 cities, 1914-17 to date. Series F, Housing and Housing Subgroups: Series G, Food and Food, Subgroups:Series H, Apparel and Apparel Subgrouppt United States and 20 cities above, 1947 to date; Series I, Transportation and Transportation Subgroups» United States 1935 to date. U.S. Department of Labor, Bureau of Labor Statistics!
Consumer Price Index. Special Groups of Commodities and Services. U.S. Includes:ML-ltfiee, All, itppp fpgj, All.-itcsE, Itftp. shelter> Ml_JB£HiS££» 411 ggrrt-p&fi ISfiB-ZSal, All commodities. Cownodltles lea6 food. Bw&frl? .ppmpodtt;!??, jjgpdyirafrlfc commodities l.ss food. Appliances. Available 1935 to date. U.S. Department of Labor, Bureau of Labor Statistics.
I 2 5
Digitized for FRASER http://fraser.stlouisfed.org/ Federal Reserve Bank of St. Louis

Consumer Price Index. Special Groups of Connoditlec and Service. U,.£. 1939-55,Quarterly; 1956 to date, Monthly. Nondurable commodities. Nondurable commoditise lees food and apparel. Durable commodities leas cars. ices, gag and electricity. Transportation genrige.fi. Mgfljg&l. ggire gggylQSS- U.S. Department of Labor, Bureau of Labor Statistics.
Consumer Price Index. All Items. Factors for Converting the Index. From the 1947-49 base to the base of 1935-39=100. U.S. Department of Labor, Bureau of Labor Statistics.
Indexes of Retail Prices of New Automobiles. 1953 to date. (1947-49=100).U.S. Department of Labor, Bureau of Labor Statistics.
Ipdpxes of ftetall Prices of Used Cars. 1953 to date. (January 1953=100).U.S. Department o f Labor, Bureau of Labor Statistics.
Purchasing Power of the Consumer Dollar in the United States. 1913 to date (1947-49=100). U.S. Department of Labor, Bureau of Labor Statistics.
Bfitajl Pglpgg. <?f,l9Q&x 1953r54« Indexes and Average Prices. U.S. Department of Labor Bureau of Labor Statistics, June 1955, (Bull. 1183).
Bfiftftlil-Prlppff of F$od, 1955-56# Indexes and Average Prices. U.S. Department of Labor Bureau of Labor Statistics, (Bull. 1217).
Retail,FpodJPrlces by Cities. U.S. and 20 cities. Monthly release of U.S. Department of Labor, Bureau of Labor Statistics.
M r f l Price IPdexes. of Fuels and Electricity. January 1935-December 1957.U.S. summary, historical. U.S. Department of Labor, Bureau of Labor Statistics. October 195#.
B&tsll Prices, and Indexes of Fuels and Electricity. U.S. and 20 cities. Monthly release of U.S. Department of Labor, Bureau of Labor Statistics.
CONSUMER PRICE INDEX IN MAGE ADJUSTMENTS
Deferred Increases and Escalator Clauses. Monthly Labor Review, December 1958, pp. 1362-1365, U.S. Department of Labor, Bureau of Labor Statistics.
1 2 6
* U.S. GOVERNMENT PRINTING OFFICE 1959 0 — 508134
Digitized for FRASER http://fraser.stlouisfed.org/ Federal Reserve Bank of St. Louis