Embed Size (px)
Citation preview
No. 142, Original
In The Supreme Court of the United States
STATE OF FLORIDA,
Plaintiff,
v.
STATE OF GEORGIA,
Defendant.
DIRECT TESTIMONY OF WEI ZENG, Ph.D.
October 26, 2016
i
TABLE OF CONTENTS
OVERVIEW OF TESTIMONY ..................................................................................................... 1
PROFESSIONAL BACKGROUND .............................................................................................. 3
GEORGIA EPD’S ANALYSIS AND MODELING OF CONSUMPTIVE WATER USE FOR STATE REGULATORY AND WATER PLANNING EFFORTS ........................... 4
I. M&I Consumptive Use ....................................................................................................... 7
A. Withdrawals & Returns........................................................................................... 8
B. Inter-Basin Transfers (“IBTs”) ............................................................................... 8
C. Thermoelectric ........................................................................................................ 9
D. Total M&I Consumptive Use (1994-Present) ......................................................... 9
E. Projected M&I Water Demands ............................................................................ 12
1. 2013 Water Supply Request ...................................................................... 12
2. 2015 Revised Water Supply Request ........................................................ 13
II. Agricultural Consumptive Use ......................................................................................... 15
A. Evolution of Georgia EPD’s Understanding of Agricultural Consumptive Use ........................................................................................................................ 15
1. Irrigated Acreage ...................................................................................... 16
2. Field Measurements .................................................................................. 18
3. Agricultural Metering Program ................................................................. 19
4. Groundwater Modeling ............................................................................. 20
B. Methodology for Calculating Total Agricultural Withdrawals and Consumptive Use .................................................................................................. 21
1. Surface Water Sources .............................................................................. 22
2. Groundwater Sources ................................................................................ 22
C. Total Agricultural Consumptive Use .................................................................... 23
D. Agricultural Forecasts ........................................................................................... 26
E. Corps UIF Development ....................................................................................... 26
III. State and Regional Water Policy & Planning ................................................................... 27
ii
GEORGIA EPD’S COORDINATION WITH THE CORPS REGARDING RESERVOIR OPERATIONS AND MANAGEMENT IN THE ACF BASIN ...................................... 27
I. Overview of Corps Reservoir Operating Rules ................................................................ 28
A. Reservoir Storage & “Guide Curves” ................................................................... 29
B. Revised Interim Operating Plan (“RIOP”) ........................................................... 30
C. Discretionary Releases .......................................................................................... 38
II. Monitoring of Corps Reservoir Operations ...................................................................... 39
III. Modeling of Corps Reservoir Operations ......................................................................... 41
IV. Evolving Corps Operations of the ACF System ............................................................... 43
A. Draft Water Control Manual (1989) ..................................................................... 44
B. IOP (March - December 2006) ............................................................................. 44
C. IOP “Concept 5” (December 2006 - November 2007) ......................................... 45
D. Exceptional Drought Operations (“EDO”) (November 2007 - June 2008) .......... 46
E. RIOP (June 2008 - May 2012) .............................................................................. 47
F. RIOP (May 2012 - Present) .................................................................................. 48
G. Water Control Manual Revision ........................................................................... 48
V. Tri-State Negotiations Regarding Water Management in the ACF Basin ........................ 48
A. Negotiation History ............................................................................................... 48
B. Georgia’s Proposal ................................................................................................ 49
GEORGIA EPD’S ANALYSIS OF NATURAL HYDROLOGY & WATER RESOURCES IN THE ACF BASIN ................................................................................ 50
I. Precipitation Patterns ........................................................................................................ 50
II. Streamflow Changes ......................................................................................................... 53
III. Incremental Flow .............................................................................................................. 54
IV. AUTHENTICATION OF ADDITIONAL TRIAL EXHIBITS ....................................... 56
1. I, Wei Zeng, Ph.D., offer the following as my Direct Testimony.
2. I am the State of Georgia’s chief hydrologist. For the past 10 years, I have served
as the Program Manager of the Hydrological Analysis Unit (“Hydrology Unit”) of Georgia’s
Environmental Protection Division (“Georgia EPD”).
3. As head of the Hydrology Unit, I direct a team of highly trained experts and
hydrologists in modeling streamflow, lake levels, and reservoir operations of the Apalachicola-
Chattahoochee-Flint (“ACF”) Basin. I am also the State of Georgia’s primary liaison to the U.S.
Army Corps of Engineers (“Corps”) regarding reservoir operations and water resource
management in the ACF Basin. For the past 15 years, I have provided scientific and technical
analysis to support the State of Georgia’s discussions with the States of Florida and Alabama and
the Corps regarding reservoir operations and water resource management in the ACF and
Alabama-Coosa-Tallapoosa (“ACT”) River Basins. For the past 10 years, I have served as the
State of Georgia’s technical lead for interstate negotiations for the ACF Basin. I advise state and
agency decision-makers, including the Governor and EPD Director, on issues of hydrology,
water resource management, and reservoir operations throughout the state.
4. As a result of my experience as chief hydrologist for Georgia, liaison to the
Corps, and technical lead for negotiations with Florida, I believe that I have been involved to
some degree in every key issue regarding hydrology, water resource management, and reservoir
operations in the ACF Basin over the past decade. I am not aware of anyone with comparable
knowledge and experience regarding the hydrology, reservoir operations, and consumptive use1
and water demand levels in the ACF Basin.
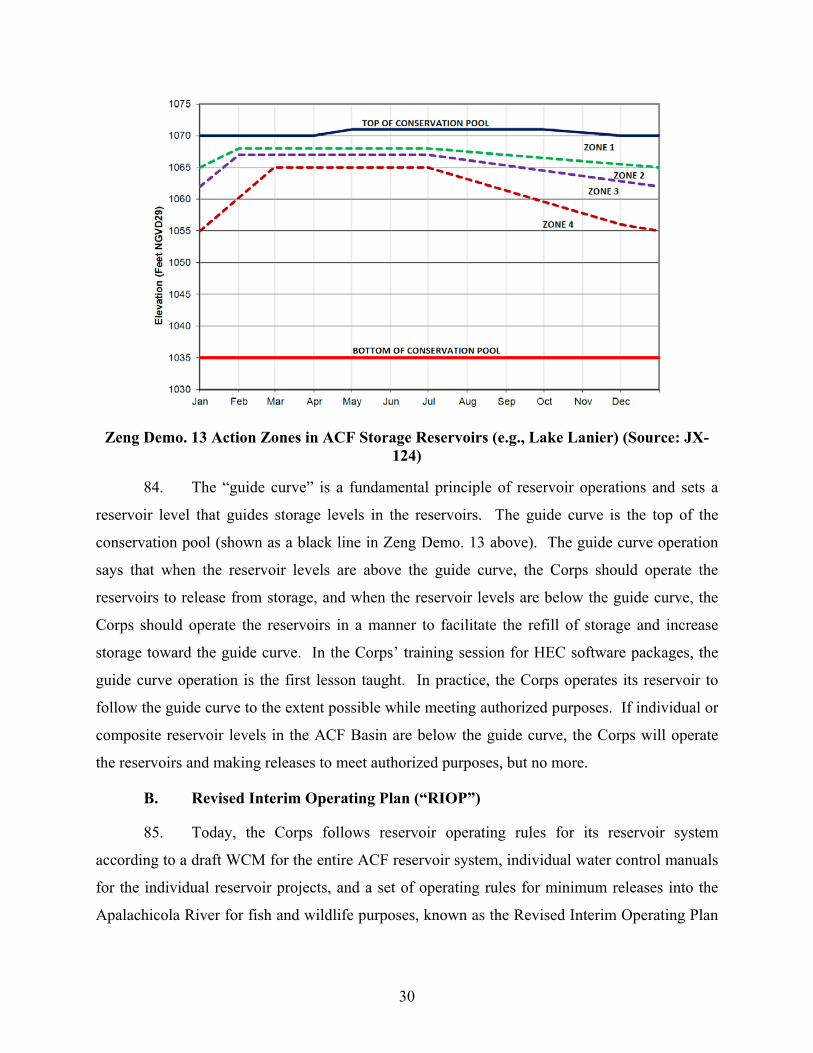
OVERVIEW OF TESTIMONY
5. My testimony focuses on the past 10 years of technical analysis and modeling
conducted by myself and the Hydrology Unit regarding the hydrology and federal reservoir
system in the ACF Basin. The Hydrology Unit has conducted thousands of hours of modeling
1 Although “consumptive use” is often defined to refer to water withdrawn but not returned from the river system, the Hydrology Unit uses the term “consumptive use” to refer to the total amount of surface flow reduction resulting from water use. As hydrologists, we study and model the impact of water use in terms of how it affects flow in the system, and not all withdrawals affect streamflow, whether directly or indirectly. For instance, groundwater withdrawals from deep, unconnected aquifers have minimal, if any, impact on surface water flows, and would not be considered under this definition of “consumptive use.”
2
and analysis of the total amount of consumptive use in Georgia to support Georgia EPD’s
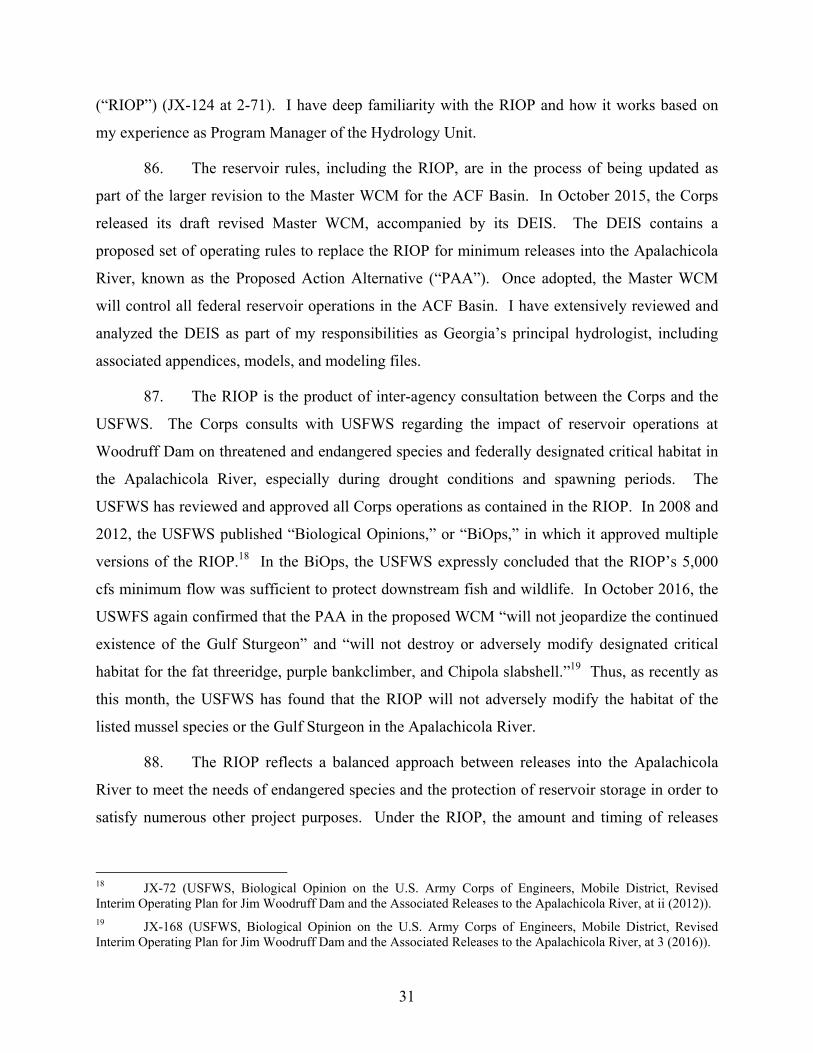
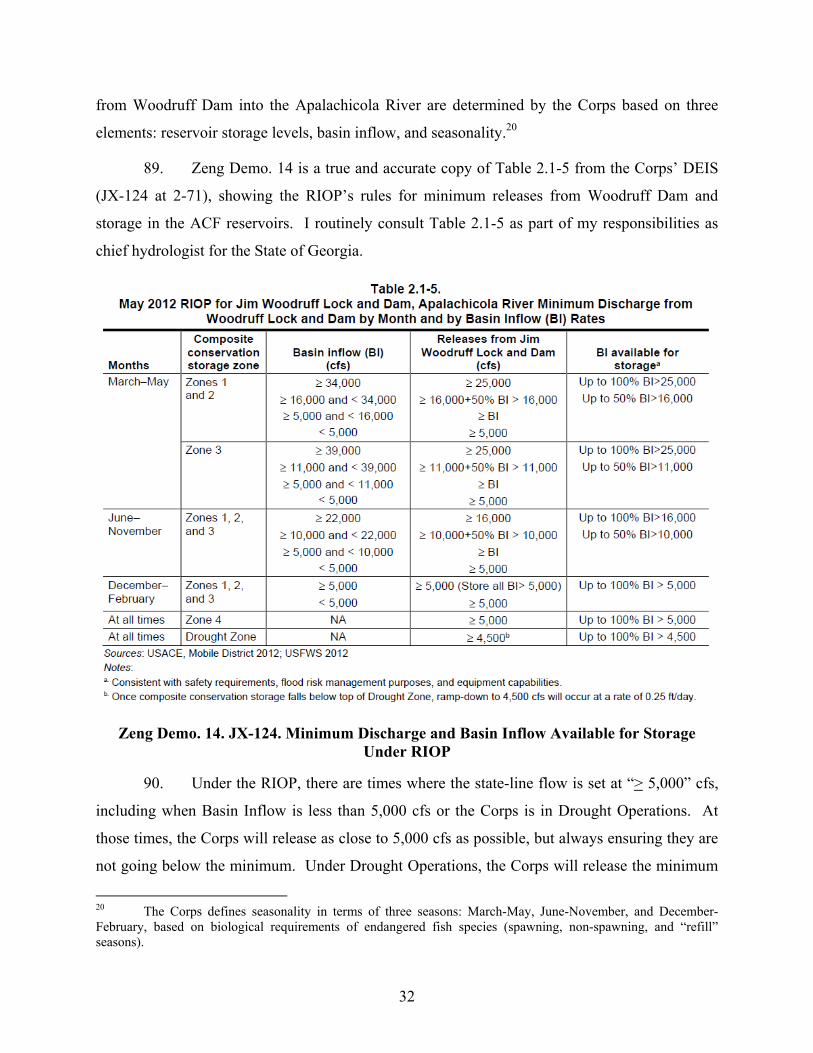
regulatory and water planning efforts throughout the state. Georgia has invested heavily in
collecting and compiling consumptive use data for the ACF Basin. Today, Georgia’s
consumptive use estimates are based on over a decade of work by multiple state agencies, state
universities, contractors, and regional and local water planning districts as part of a statewide
planning effort. Georgia maintains a comprehensive database of past, present, and projected
future water demand estimates for municipal, industrial, and agricultural uses. This data shows
that total consumptive use in Georgia’s ACF Basin has never exceeded 900 cfs on an annual
average basis. Our maximum monthly consumptive use has never reached 2,000 cfs, and has
only exceeded 1,400 cfs on rare occasions during extreme drought conditions.
6. The Hydrology Unit has extensively studied and modeled the Corps reservoirs in
the ACF Basin. Our work on a daily basis includes modeling reservoir operations and the impact
of consumptive use on water resources in the Basin using Corps computer models, including
primarily HEC-ResSim. In my testimony, I describe the use of Corps models for water resource
management by Georgia, the Corps, and the U.S. Fish and Wildlife Service (“USFWS”). I also
generally discuss Georgia’s coordination with the Corps on reservoir management and the
Corps’ fundamental role in regulating water resources in the Basin. I discuss how the Corps’
reservoir rules have evolved over time, and how the Corps operates the reservoir system today to
balance multiple federally authorized project purposes. I describe the Hydrology Unit’s
monitoring of Corps reservoir operations, and I explain how the Corps’ project data for its
reservoirs show that the Corps targets 5,000 cfs releases from Woodruff Dam during low-flow
periods, and that occasional releases in excess of 5,000 cfs do not demonstrate “discretion” to
support fish and wildlife, but instead show that the Corps is following the complex rules of its
Revised Interim Operating Plan (“RIOP”).
7. Additionally, my testimony focuses on my role as technical lead for the ACF Tri-
State negotiations and my interactions with Florida and the Corps. I discuss how throughout my
negotiations with Florida, Florida consistently took positions that made it difficult to ever reach a
compromise, including failure to specify an amount of state-line flow or flow into the
Apalachicola Bay that it believed would be satisfactory. I describe how Florida’s focus
throughout the negotiations was invariably on reducing storage in the Corps reservoirs,
especially Lake Lanier, and not on working cooperatively to outline its goals for the river or bay
3
ecosystem. I discuss proposals made by Georgia for resolution of the interstate dispute, and
describe how the Florida proposals of which I am aware always included direct participation of
the Corps.2
8. Finally, my testimony addresses the Hydrology Unit’s analysis of natural
hydrologic changes occurring in the ACF Basin. Georgia EPD has studied not only consumptive
use and reservoir operations, but also the natural hydrology of the Basin, in large part to better
understand and improve management of surface and groundwater resources. As a result of this
work, my team and I have found a marked shift in intra-annual rainfall patterns in the Basin in
recent years (more rainfall in the winter and less rainfall in the summer), which we found to
affect streamflow in dry months. The Hydrology Unit and I have also found that the amount of
runoff (i.e., the total amount of rainfall that enters the river system) in the Apalachicola River has
been declining at a faster rate than in other rivers in the region, suggesting a hydrologic change
occurring entirely within Florida that is reducing the amount of flow entering the Apalachicola
Bay over the long term. We found that these hydrologic changes have nothing to do with
consumptive use in Georgia.
PROFESSIONAL BACKGROUND
9. I have been an Environmental Engineer at Georgia EPD since 2000. I have held
the positions of Environmental Engineer (2000-2002), Senior Environmental Engineer (2002-
2003), and Principal Environmental Engineer (2003-2006). In April 2006, I was promoted to
Program Manager of the Hydrology Unit.
10. I have a bachelor’s degree (1992) in Hydraulic Engineering from Tsinghua
University, Beijing, China, and a Ph.D. (2000) in Forest Resources from the University of
Georgia (“UGA”). The focus of my Ph.D. study was hydrology and water resources. I am a
currently licensed Professional Hydrologist from the American Institute of Hydrology.
11. I have more than 20 years of experience in water resources analysis and
hydrologic and hydraulic modeling. In my graduate studies at UGA, I studied various
mathematical models of river systems. I developed my own computer model and calibrated it to 2 I am not referencing here in any way the mediation associated with this litigation, which I understand is subject to a strict confidentiality agreement. My testimony is limited to negotiations prior to the initiation of the current lawsuit.
4
an existing river system. I authored papers concerning applications of this model that were
published in the Journal of Hydrology and the Journal of Water Resources Planning and
Management.
12. I served as a peer reviewer for the American Society of Civil Engineers Journal of
Hydrologic Engineering, the Journal of American Water Resources Association, and the ASCE
(American Society of Civil Engineers) Press.
13. I am proficient in a variety of water resources models, including HEC-5, HEC-6,
HEC-HMS, HEC-ResSim, HEC-RAS, and BASINS/HSPF. The HEC models are developed by
the Hydrologic Engineering Center (“HEC”), the Corps’ technical research and development unit
for hydraulic, hydrologic, and reservoir system modeling. I have received formal training from
the HEC in computer models developed by the Corps for simulating reservoir operations.
14. My CV (GX-1028) is attached as Appendix A.
GEORGIA EPD’S ANALYSIS AND MODELING OF CONSUMPTIVE WATER USE FOR STATE REGULATORY AND WATER PLANNING EFFORTS
15. Georgia EPD and its contractors have been collecting water use data and
developing estimates of consumptive water use (including past, present, and projected future
water demands) for over a decade. For the most part, the Hydrology Unit performs or directs
these efforts, including compiling consumptive use data and running advanced hydrologic
models for studying the impact of consumptive use on the water resources of the state (e.g., use
of groundwater models necessary for determining the surface water impact of groundwater
pumping).
16. Georgia EPD’s work to understand and estimate consumptive use in the state is
based in part on the agency’s role as a regulatory agency, i.e., to ensure compliance with water
permitting and water laws and regulations. Georgia EPD also plays a major role in supporting
the State and Regional Water Planning Process. To support these efforts, the Hydrology Unit
invests in collecting data on how much ongoing consumptive use is occurring and how much is
projected to occur in the future in order to promote good management and stewardship of the
resource. From a planning perspective, it is necessary for policy-makers to have a firm grasp of
the level of consumptive water use occurring in Georgia, and we are charged with doing just that.
5
17. Based on the extensive work conducted by the Hydrology Unit and our
contractors in developing and refining estimates of consumptive use, we have developed a very
good understanding of the total amount of consumptive use in the state as well as the impact of
consumptive use on streamflow and water resources in the ACF Basin.
18. Georgia’s water use is generally broken down into two primary categories:
• Municipal and industrial (“M&I”) water use includes water withdrawn by public and private water suppliers for domestic, commercial, industrial, and public water uses. In the ACF, M&I consumptive use is primarily drawn from surface water sources (i.e., federal and non-federal reservoirs, as well as directly from rivers and surface streams). The largest M&I consumptive use in the ACF Basin occurs in Metro Atlanta.
• Agricultural water use refers to water withdrawn primarily for irrigation purposes. In the ACF, agricultural water use primarily occurs in the Flint River Basin. Agricultural withdrawals are primarily from groundwater sources, including the highly productive Upper Floridan Aquifer (“UFA”), and to a lesser extent surface water sources and deeper aquifers such as the Clayton, Claiborne, and Cretaceous Aquifers.
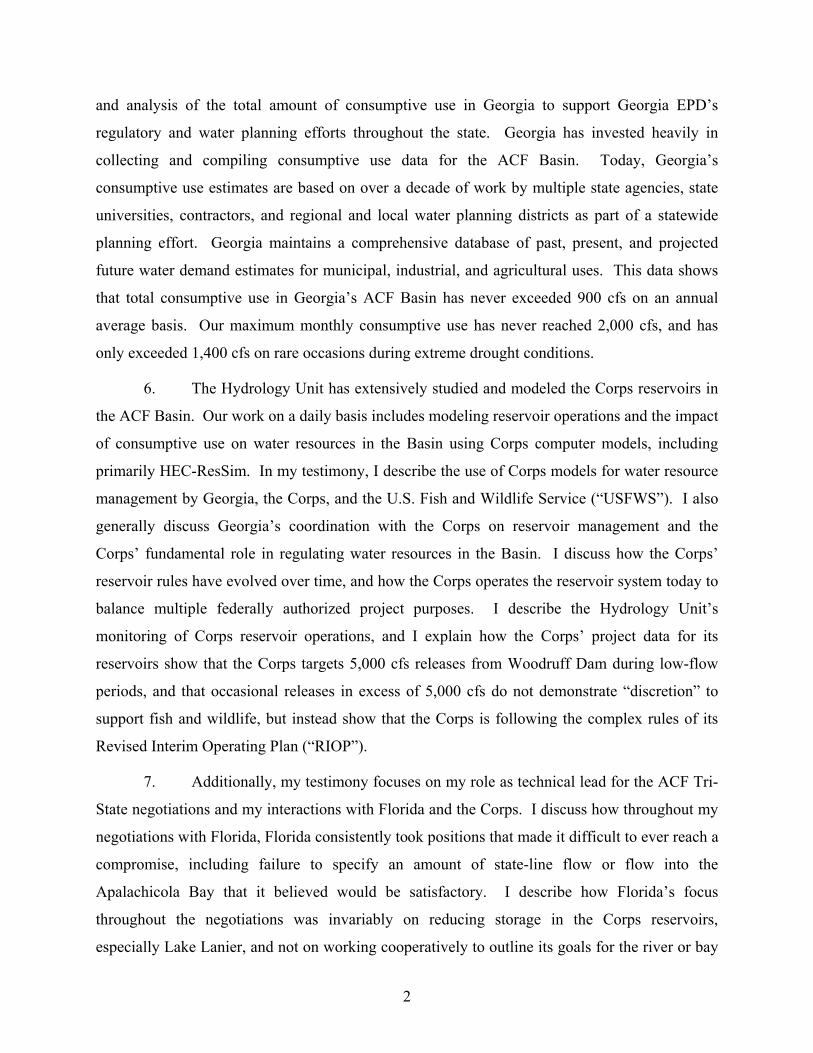
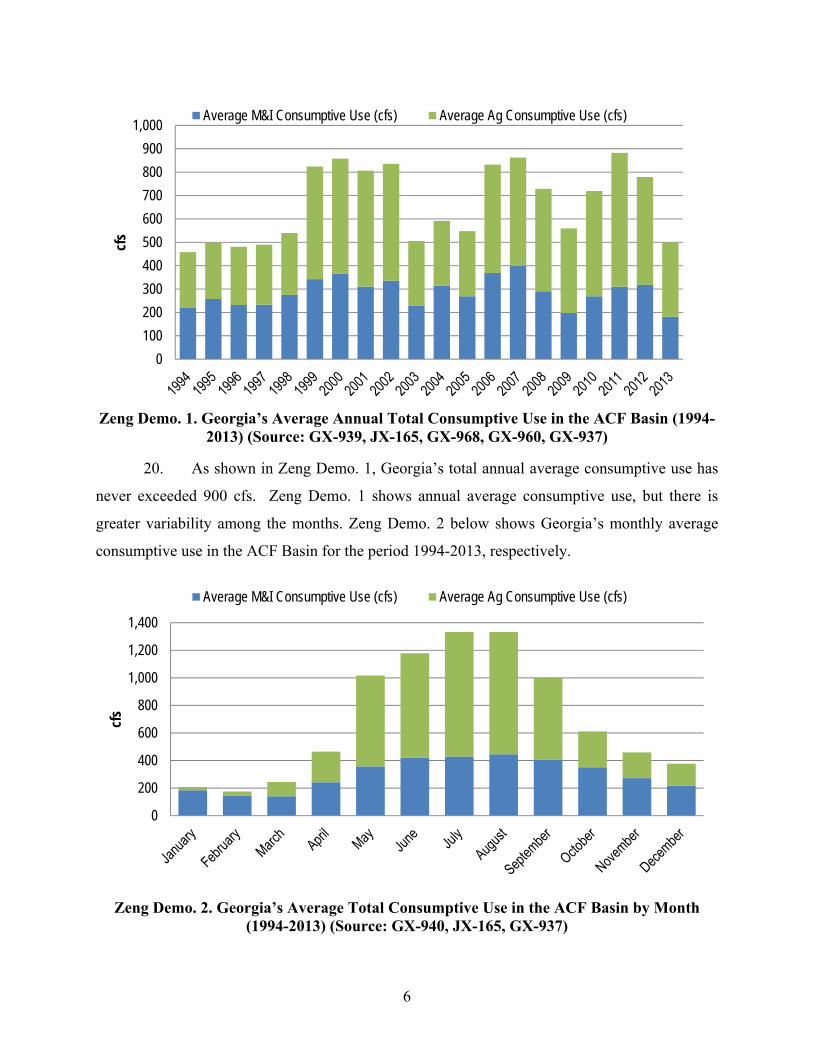
19. Zeng Demos. 1-3 below show Georgia’s total consumptive use in the ACF Basin
(including both M&I and agricultural) from 1994-2013 on an annual average basis.
Consumptive use is generally defined in terms of rates, rather than volumetric amounts, most
often expressed in terms of cubic feet per second (“cfs”) or million gallons per day (“mgd”); 1
cfs is equal to approximately 0.65 mgd. Zeng Demos. 1-3 are true and accurate representations
of the consumptive use data and estimates maintained by Georgia EPD. These databases include
GX-939, GX-940, JX-165, GX-968, GX-960, and GX-937. These databases of M&I,
agricultural, and total consumptive use in Georgia are maintained by Georgia EPD in the regular
course of business. As head of the Hydrology Unit, I am aware of and track consumptive use in
the state, and I am familiar with these databases. The consumptive use values in these databases
are consistent with my knowledge of Georgia’s consumptive use.
6
Zeng Demo. 1. Georgia’s Average Annual Total Consumptive Use in the ACF Basin (1994-
2013) (Source: GX-939, JX-165, GX-968, GX-960, GX-937)
20. As shown in Zeng Demo. 1, Georgia’s total annual average consumptive use has
never exceeded 900 cfs. Zeng Demo. 1 shows annual average consumptive use, but there is
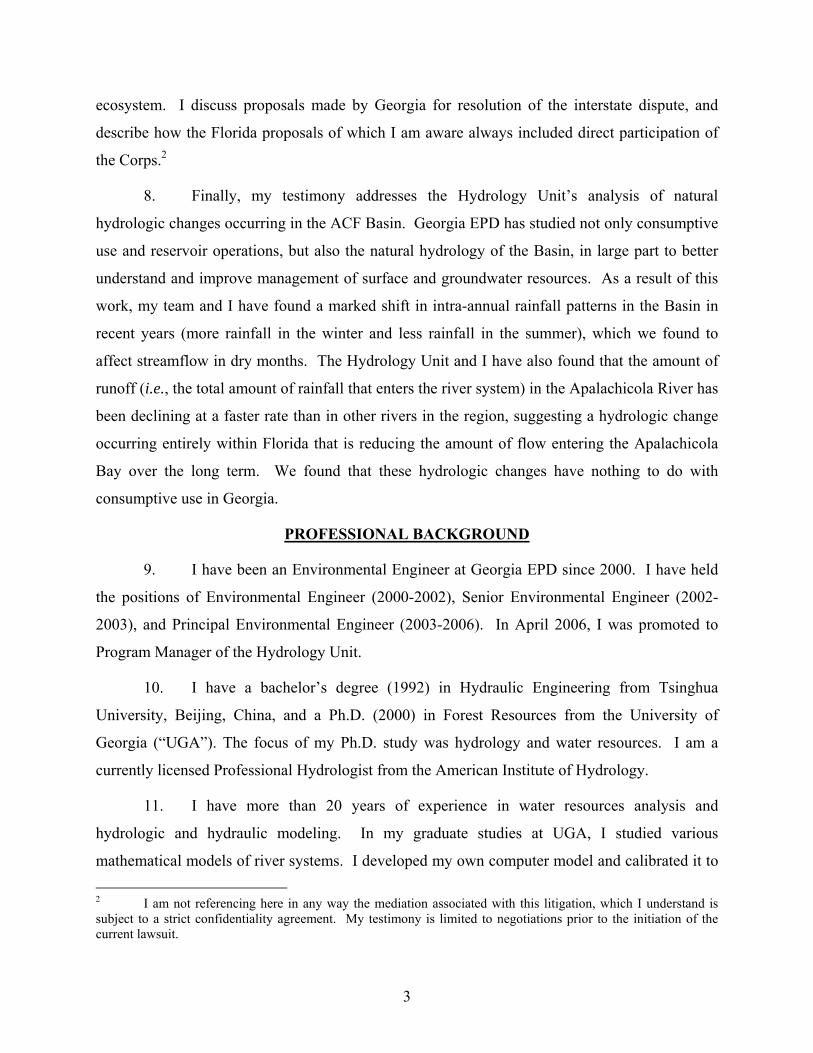
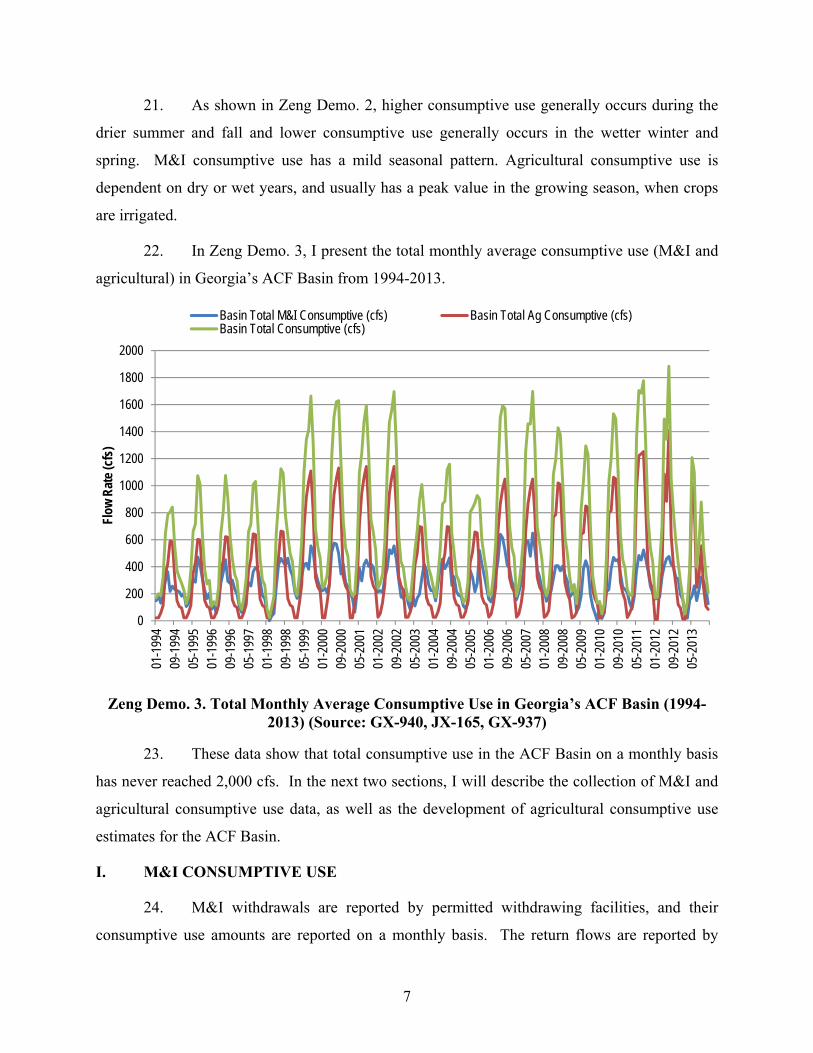
greater variability among the months. Zeng Demo. 2 below shows Georgia’s monthly average
consumptive use in the ACF Basin for the period 1994-2013, respectively.
Zeng Demo. 2. Georgia’s Average Total Consumptive Use in the ACF Basin by Month (1994-2013) (Source: GX-940, JX-165, GX-937)
0
100
200
300
400
500
600
700
800
900
1,000cf
sAverage M&I Consumptive Use (cfs) Average Ag Consumptive Use (cfs)
0
200
400
600
800
1,000
1,200
1,400
cfs
Average M&I Consumptive Use (cfs) Average Ag Consumptive Use (cfs)
7
21. As shown in Zeng Demo. 2, higher consumptive use generally occurs during the
drier summer and fall and lower consumptive use generally occurs in the wetter winter and
spring. M&I consumptive use has a mild seasonal pattern. Agricultural consumptive use is
dependent on dry or wet years, and usually has a peak value in the growing season, when crops
are irrigated.
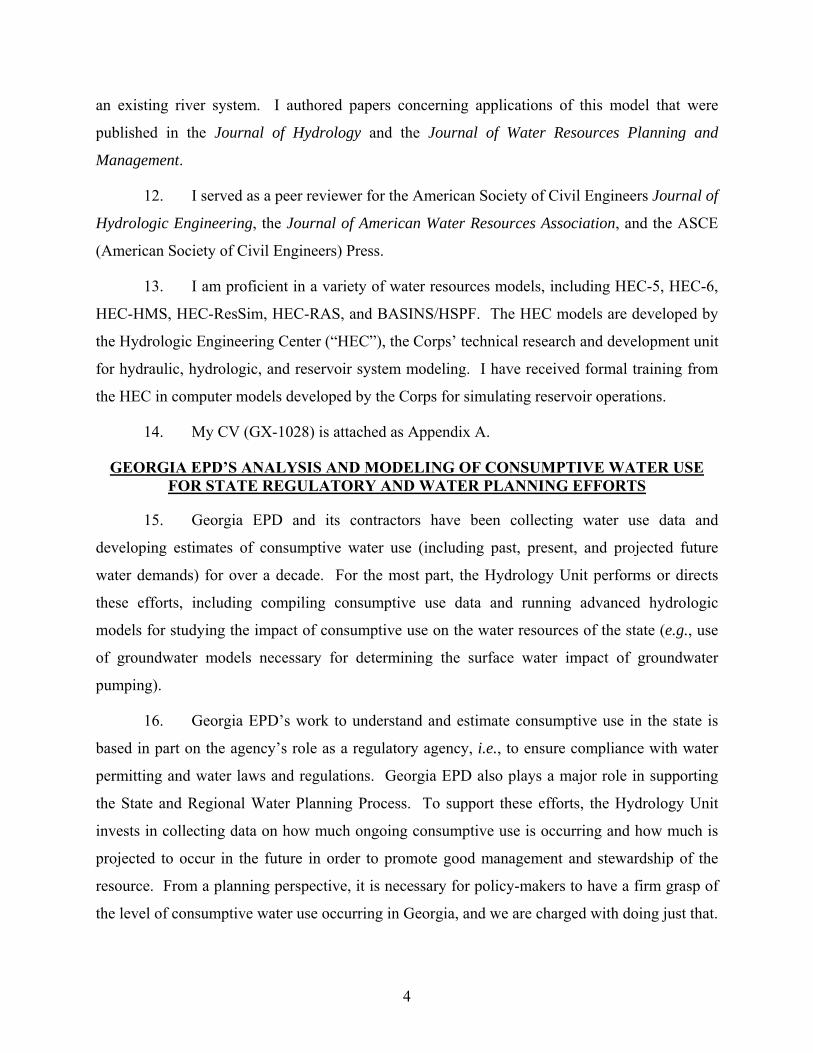
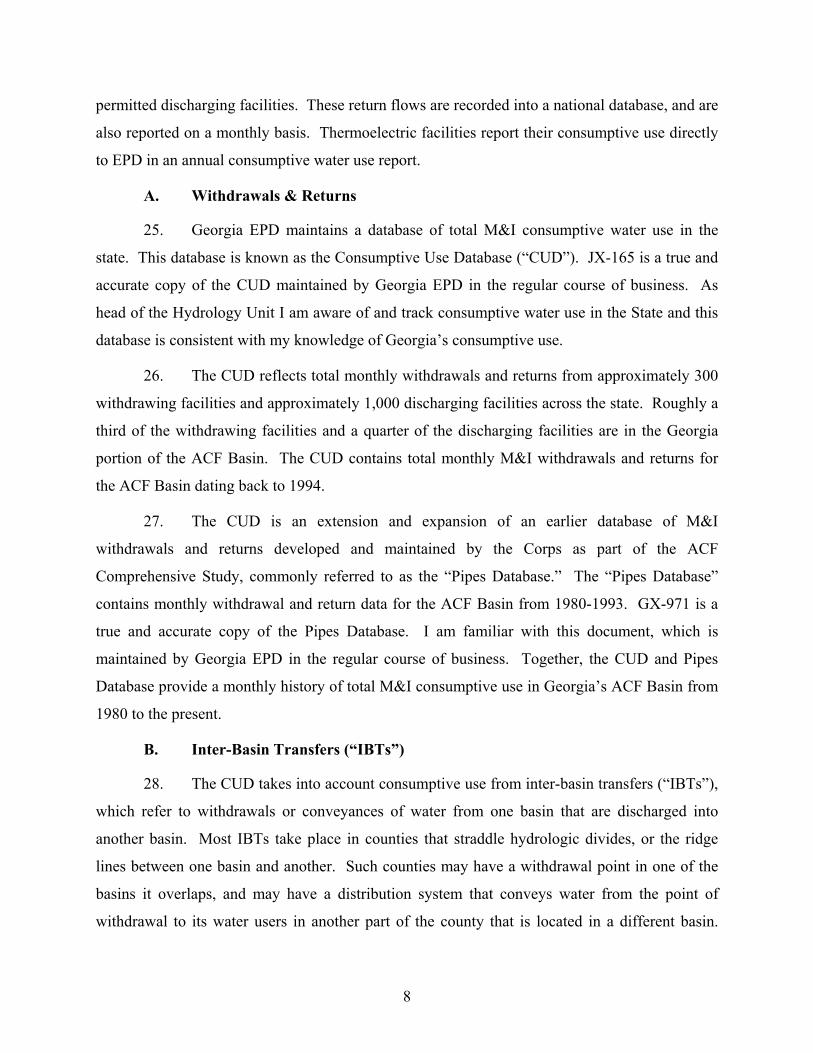
22. In Zeng Demo. 3, I present the total monthly average consumptive use (M&I and
agricultural) in Georgia’s ACF Basin from 1994-2013.
Zeng Demo. 3. Total Monthly Average Consumptive Use in Georgia’s ACF Basin (1994-2013) (Source: GX-940, JX-165, GX-937)
23. These data show that total consumptive use in the ACF Basin on a monthly basis
has never reached 2,000 cfs. In the next two sections, I will describe the collection of M&I and
agricultural consumptive use data, as well as the development of agricultural consumptive use
estimates for the ACF Basin.
I. M&I CONSUMPTIVE USE
24. M&I withdrawals are reported by permitted withdrawing facilities, and their
consumptive use amounts are reported on a monthly basis. The return flows are reported by
0
200
400
600
800
1000
1200
1400
1600
1800
2000
01-1
994
09-1
994
05-1
995
01-1
996
09-1
996
05-1
997
01-1
998
09-1
998
05-1
999
01-2
000
09-2
000
05-2
001
01-2
002
09-2
002
05-2
003
01-2
004
09-2
004
05-2
005
01-2
006
09-2
006
05-2
007
01-2
008
09-2
008
05-2
009
01-2
010
09-2
010
05-2
011
01-2
012
09-2
012
05-2
013
Flow
Rat
e (cf
s)
Basin Total M&I Consumptive (cfs) Basin Total Ag Consumptive (cfs)Basin Total Consumptive (cfs)
8
permitted discharging facilities. These return flows are recorded into a national database, and are
also reported on a monthly basis. Thermoelectric facilities report their consumptive use directly
to EPD in an annual consumptive water use report.
A. Withdrawals & Returns
25. Georgia EPD maintains a database of total M&I consumptive water use in the
state. This database is known as the Consumptive Use Database (“CUD”). JX-165 is a true and
accurate copy of the CUD maintained by Georgia EPD in the regular course of business. As
head of the Hydrology Unit I am aware of and track consumptive water use in the State and this
database is consistent with my knowledge of Georgia’s consumptive use.
26. The CUD reflects total monthly withdrawals and returns from approximately 300
withdrawing facilities and approximately 1,000 discharging facilities across the state. Roughly a
third of the withdrawing facilities and a quarter of the discharging facilities are in the Georgia
portion of the ACF Basin. The CUD contains total monthly M&I withdrawals and returns for
the ACF Basin dating back to 1994.
27. The CUD is an extension and expansion of an earlier database of M&I
withdrawals and returns developed and maintained by the Corps as part of the ACF
Comprehensive Study, commonly referred to as the “Pipes Database.” The “Pipes Database”
contains monthly withdrawal and return data for the ACF Basin from 1980-1993. GX-971 is a
true and accurate copy of the Pipes Database. I am familiar with this document, which is
maintained by Georgia EPD in the regular course of business. Together, the CUD and Pipes
Database provide a monthly history of total M&I consumptive use in Georgia’s ACF Basin from
1980 to the present.
B. Inter-Basin Transfers (“IBTs”)
28. The CUD takes into account consumptive use from inter-basin transfers (“IBTs”),
which refer to withdrawals or conveyances of water from one basin that are discharged into
another basin. Most IBTs take place in counties that straddle hydrologic divides, or the ridge
lines between one basin and another. Such counties may have a withdrawal point in one of the
basins it overlaps, and may have a distribution system that conveys water from the point of
withdrawal to its water users in another part of the county that is located in a different basin.
9
Since the CUD covers all permitted withdrawals and returns in a basin, it captures the amount of
IBTs in its consumptive use calculation.
C. Thermoelectric
29. The CUD takes into account net withdrawals from thermoelectric power
generating plants. There are currently two types of cooling systems associated with
thermoelectric facilities, “once through” and cooling towers. The thermoelectric facilities using
a once through cooling system typically have large withdrawals, but they do not have
consumptive losses; all of the water is returned to the source river after the cooling process is
completed. The facilities with cooling tower operations, however, often have some moderate
consumptive losses. This is because the cooling water is recycled in a closed system, and losses
occur when heated water evaporates when it is forced through the cooling towers. These
consumptive losses are generally relatively minor. For example, the largest thermoelectric
facility in the country, Georgia Power’s Plant Bowen, outside the ACF Basin, has a typical
consumptive use of 20 to 30 mgd.
D. Total M&I Consumptive Use (1994-Present)
30. Based on the CUD, Georgia’s total M&I consumptive use in the ACF Basin from
1994-present is presented in Zeng Demo. 4 below. Zeng Demo. 4 is a true and accurate
representation of data stored in the CUD, which is maintained by the Hydrology Unit in the
regular course of business. As head of the Hydrology Unit, I am aware of and track consumptive
use in the state and these figures are consistent with my knowledge of Georgia’s M&I
consumptive use.
10
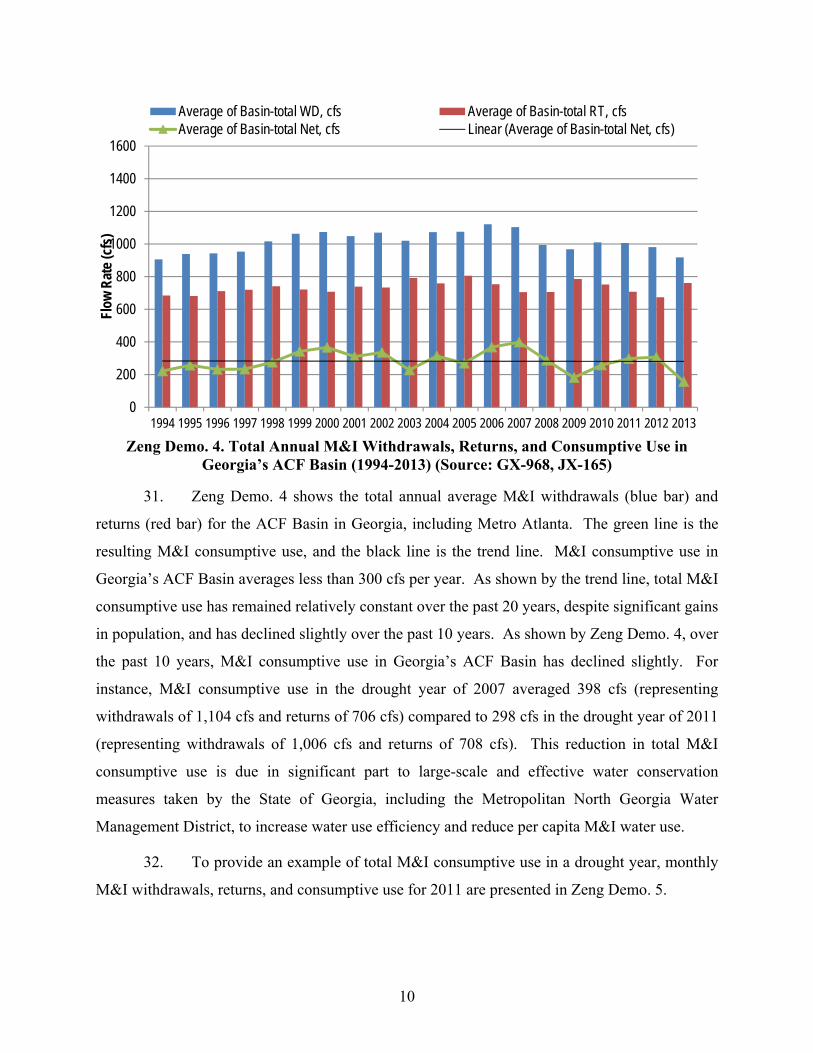
Zeng Demo. 4. Total Annual M&I Withdrawals, Returns, and Consumptive Use in
Georgia’s ACF Basin (1994-2013) (Source: GX-968, JX-165)
31. Zeng Demo. 4 shows the total annual average M&I withdrawals (blue bar) and
returns (red bar) for the ACF Basin in Georgia, including Metro Atlanta. The green line is the
resulting M&I consumptive use, and the black line is the trend line. M&I consumptive use in
Georgia’s ACF Basin averages less than 300 cfs per year. As shown by the trend line, total M&I
consumptive use has remained relatively constant over the past 20 years, despite significant gains
in population, and has declined slightly over the past 10 years. As shown by Zeng Demo. 4, over
the past 10 years, M&I consumptive use in Georgia’s ACF Basin has declined slightly. For
instance, M&I consumptive use in the drought year of 2007 averaged 398 cfs (representing
withdrawals of 1,104 cfs and returns of 706 cfs) compared to 298 cfs in the drought year of 2011
(representing withdrawals of 1,006 cfs and returns of 708 cfs). This reduction in total M&I
consumptive use is due in significant part to large-scale and effective water conservation
measures taken by the State of Georgia, including the Metropolitan North Georgia Water
Management District, to increase water use efficiency and reduce per capita M&I water use.
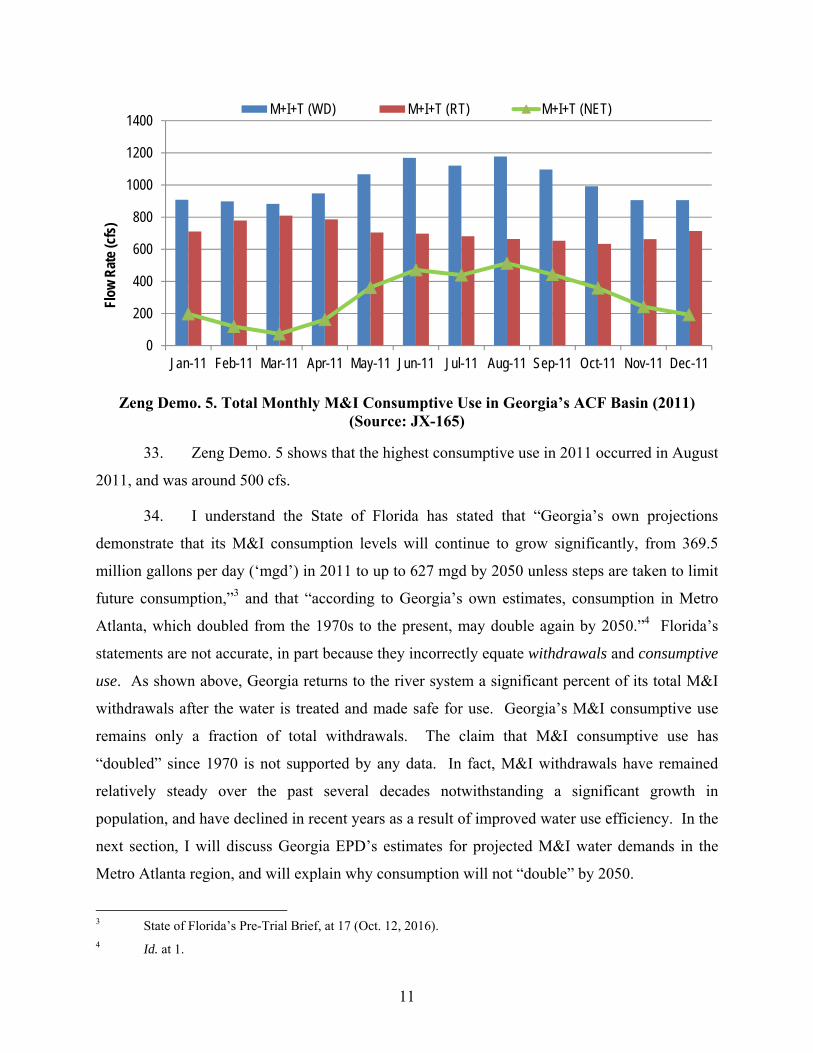
32. To provide an example of total M&I consumptive use in a drought year, monthly
M&I withdrawals, returns, and consumptive use for 2011 are presented in Zeng Demo. 5.
0
200
400
600
800
1000
1200
1400
1600
1994 1995 1996 1997 1998 1999 2000 2001 2002 2003 2004 2005 2006 2007 2008 2009 2010 2011 2012 2013
Flow
Rat
e (cf
s)Average of Basin-total WD, cfs Average of Basin-total RT, cfsAverage of Basin-total Net, cfs Linear (Average of Basin-total Net, cfs)
11
Zeng Demo. 5. Total Monthly M&I Consumptive Use in Georgia’s ACF Basin (2011) (Source: JX-165)
33. Zeng Demo. 5 shows that the highest consumptive use in 2011 occurred in August
2011, and was around 500 cfs.
34. I understand the State of Florida has stated that “Georgia’s own projections
demonstrate that its M&I consumption levels will continue to grow significantly, from 369.5
million gallons per day (‘mgd’) in 2011 to up to 627 mgd by 2050 unless steps are taken to limit
future consumption,”3 and that “according to Georgia’s own estimates, consumption in Metro
Atlanta, which doubled from the 1970s to the present, may double again by 2050.”4 Florida’s
statements are not accurate, in part because they incorrectly equate withdrawals and consumptive
use. As shown above, Georgia returns to the river system a significant percent of its total M&I
withdrawals after the water is treated and made safe for use. Georgia’s M&I consumptive use
remains only a fraction of total withdrawals. The claim that M&I consumptive use has
“doubled” since 1970 is not supported by any data. In fact, M&I withdrawals have remained
relatively steady over the past several decades notwithstanding a significant growth in
population, and have declined in recent years as a result of improved water use efficiency. In the
next section, I will discuss Georgia EPD’s estimates for projected M&I water demands in the
Metro Atlanta region, and will explain why consumption will not “double” by 2050.
3 State of Florida’s Pre-Trial Brief, at 17 (Oct. 12, 2016). 4 Id. at 1.
0
200
400
600
800
1000
1200
1400
Jan-11 Feb-11 Mar-11 Apr-11 May-11 Jun-11 Jul-11 Aug-11 Sep-11 Oct-11 Nov-11 Dec-11
Flow
Rat
e (cf
s)M+I+T (WD) M+I+T (RT) M+I+T (NET)
12
E. Projected M&I Water Demands
1. 2013 Water Supply Request
35. In January 2013, the State of Georgia submitted a formal request to the Corps to
allow withdrawals and make releases from Lake Lanier and the Upper Chattahoochee River to
meet Georgia’s projected M&I water supply needs in Metro Atlanta through the year 2040 (JX-
86). The 2013 Water Supply Request was an update to the 2000 Water Supply Request, based
on updated information on population and water use (GX-10). As of January 2013, more than
3.3 million Georgians in the Metro Atlanta area relied on withdrawals or releases from Lake
Lanier for water supply. In 2013, Georgia estimated that its total M&I withdrawals from Lake
Lanier would reach 705 million gallons per day (“mgd”) by 2040.5 Because Georgia expects that
by 2040, the majority (78%) of this 705 mgd water will be returned to the system after it is
treated and made safe for return, the actual amount of consumptive use (155 mgd) under the
2013 request was significantly lower than 705 mgd.
36. As part of the Water Supply Request, Georgia EPD provided the Corps an
analysis of the impact of projected 2040 water demands on the Corps’ ability to satisfy various
authorized project purposes of the reservoirs, including power generation, recreation, navigation,
and state-line flow into the Apalachicola River (GX-628). This modeling analysis was
conducted by Georgia EPD’s Hydrology Unit using HEC-ResSim (“ResSim”), the Corps’
reservoir simulation and water management model. It is used by the Corps to predict how
streamflow and reservoir levels will respond to changes in reservoir operations, consumptive
water use levels, and hydrologic conditions. I discuss ResSim in greater detail below.
37. The Hydrology Unit’s analysis and ResSim modeling of proposed 2040 water
demands included not only the M&I consumptive use demand projections for Metro Atlanta, but
also the 2040 forecasts of M&I and agricultural demand throughout the rest of the Basin, which
were developed by Georgia EPD and its contractors.
38. Georgia EPD’s modeling of projected 2040 water demands throughout the Basin
showed little difference in the Corps’ ability to satisfy its various authorized purposes of the
reservoirs when comparing current and projected demand. The modeling of future demand 5 The 2013 Water Supply Request revised and updated the 2000 Water Supply Request, which also requested 705 mgd from Lake Lanier and the Upper Chattahoochee River.
13
showed only minor changes to state-line flow, in large part because most of the water withdrawn
by Georgia is returned to the system by Georgia, thereby mitigating overall consumptive loss. In
addition, the Corps operates its reservoirs to release water in certain times of year to smooth over
variations in streamflow, including from consumptive use, thereby mitigating impact at the state
line.
39. As part of its update to the Master Water Control Manual (“WCM”) and
associated Draft Environmental Impact Statement (“DEIS”), the Corps studied Georgia’s Water
Supply Request. The WCM process involves analysis of reservoir management in the ACF
Basin and the adoption of rules for reservoir operations to replace the current set of interim
reservoir operating rules. The DEIS was published in October 2015. In the DEIS, the Corps
proposed granting Georgia’s request in part, allowing 633 mgd of withdrawal out of the 705 mgd
requested. The Corps also conducted modeling using ResSim in order to evaluate Georgia’s
Water Supply Request to confirm Georgia’s findings. The Corps studied the impact of Georgia’s
request on the ability to satisfy its authorized purposes and found, like Georgia EPD had, that it
can deliver Georgia the water it needs for water supply while still satisfying its authorized
project purposes in the ACF Basin. The Corps wrote:
The net withdrawals that Georgia has requested by 2030 would leave sufficient storage capacity in Lake Lanier to continue to operate the ACF projects together as a system to achieve the system purposes in keeping with Congressional expectations, including maintaining hydropower peaking operations and flood damage reduction, supporting greater seasonal navigation on the Apalachicola River, providing opportunities for recreation and fish and wildlife conservation, and safeguarding Atlanta’s downstream water supply needs.6
40. The Corps concluded that it had the authority to grant Georgia’s higher request of
705 mgd, implying that it also has the authority to grant Georgia’s lower, revised water supply
request while also achieving its project purposes.
2. 2015 Revised Water Supply Request
41. In December 2015, the State of Georgia revised its 2013 Water Supply Request to
extend its water demand projections from 2040 to 2050. Georgia submitted this revision once
6 GX-417, Stockdale, E. Memorandum to Chief of Engineers regarding authority to provide for municipal and industrial water supply from the Buford Dam/Lake Lanier Project, Georgia. Office of the Chief Counsel, U.S. Army Corps of Engineers, Washington, D.C.
14
we received new and updated information regarding population and water use in the ACF Basin
(GX-822). In this most recent request, Georgia revised its projected water demands downward.
Instead of projecting water demands for the Metro Atlanta area of 705 mgd for 2040, the revised
projections were for a maximum of 621 mgd for 2050. The reduction was due in significant part
to lower overall per capita water use demands, attributed to improved water conservation efforts
and lower population projections for Metro Atlanta.
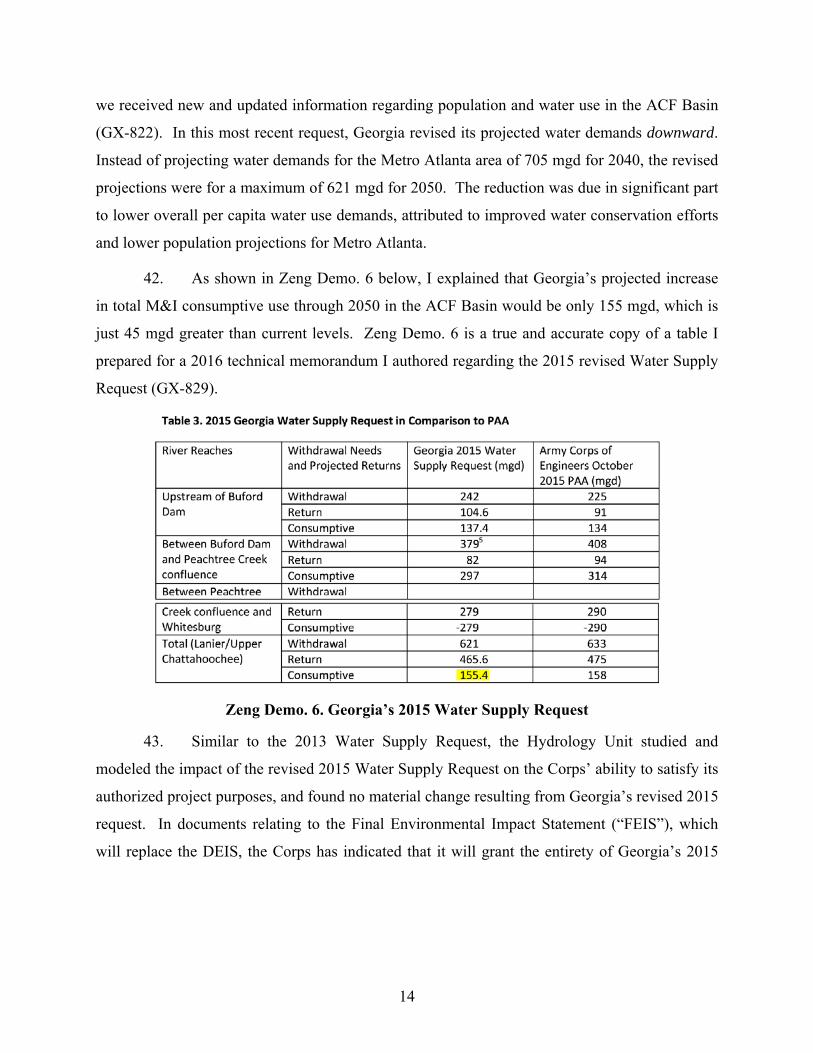
42. As shown in Zeng Demo. 6 below, I explained that Georgia’s projected increase
in total M&I consumptive use through 2050 in the ACF Basin would be only 155 mgd, which is
just 45 mgd greater than current levels. Zeng Demo. 6 is a true and accurate copy of a table I
prepared for a 2016 technical memorandum I authored regarding the 2015 revised Water Supply
Request (GX-829).
Zeng Demo. 6. Georgia’s 2015 Water Supply Request
43. Similar to the 2013 Water Supply Request, the Hydrology Unit studied and
modeled the impact of the revised 2015 Water Supply Request on the Corps’ ability to satisfy its
authorized project purposes, and found no material change resulting from Georgia’s revised 2015
request. In documents relating to the Final Environmental Impact Statement (“FEIS”), which
will replace the DEIS, the Corps has indicated that it will grant the entirety of Georgia’s 2015
15
revised Water Supply Request, i.e., 621 mgd of withdrawal through 2050 from Lake Lanier and
the Chattahoochee River.7
II. AGRICULTURAL CONSUMPTIVE USE
44. Unlike M&I consumptive use, which is simply the sum of total recorded net
withdrawals, there is no single database containing the total amount of agricultural consumptive
use. Agricultural consumptive use must be estimated based on our best understanding of the
total amount of water pumped from surface and groundwater sources, including the total amount
of irrigated acreage and how much water is pumped from irrigation systems. It also involves
estimating the total amount by which groundwater pumping reduces surface water streamflow,
since groundwater pumping does not have a direct, 1:1 relationship with reductions in surface
flows. The impact of groundwater pumping on surface streamflows must be estimated through
the use of advanced groundwater modeling tools.
45. Over the years, Georgia EPD has invested heavily in collecting data on
agricultural withdrawals and irrigated acreage in the state, including metering data for
groundwater pumping on farms and satellite mapping of wetted acreage. In addition, Georgia
EPD has also invested in developing and refining advanced hydrologic modeling tools for
estimating the impact of groundwater pumping on surface streams. These investments have
helped Georgia EPD to develop best estimates of agricultural withdrawals, including streamflow
impacts of groundwater withdrawals, in the Lower Flint and Chattahoochee Basins, where there
is interaction between surface water and groundwater. In the following sections, I discuss the
evolution of our knowledge on agricultural consumptive use in Georgia.
A. Evolution of Georgia EPD’s Understanding of Agricultural Consumptive Use
46. In 2000, when I first began working at Georgia EPD, the agency did not have a
sophisticated understanding of agricultural consumptive use in the ACF Basin. We did not have
the quantity or quality of data that we have today. Our rudimentary understanding led us to
make some very conservative assumptions about agricultural consumptive use. For instance, we
roughly estimated irrigated acreage to be as high as 900,000 acres. Today, we know as a result
of detailed data collection that this is an overstatement of wetted acreage. We were making 7 JX-168, September 2016 USFWS Biological Opinion on ACF Water Control Manual and FEIS (Section 1.11 Water Supply, page 31).
16
equally conservative assumptions about the average amount of water applied to crops, referred to
as “irrigation depth.” For all crops, we took a single assumed standard irrigation depth of around
10 inches and used simple “agricultural multipliers” to account for hydrologic variation, i.e.,
multiplied 10 inches by 1.0 for a normal year, 0.5 for a wet year, and 2.2 for a drought year. The
effect of our conservative assumptions was that we likely over-estimated our total agricultural
consumptive use. In fact, I would describe most of our understanding of agricultural
consumptive use at this time as being based on “educated guesses.”
47. Since that time, the amount of progress we have made in data collection and
understanding of the scope of agricultural consumptive use has been substantial. For the most
part, the improvement in our knowledge of agricultural consumptive use began in the late 1990s.
At that time, the State of Georgia launched a number of studies to quantify the amount of
consumptive use in agricultural irrigation in the Lower Flint and Chattahoochee River Basins.
This largely began in 1998, when Georgia EPD, under the leadership of Director Reheis,
initiated the Flint River Basin Plan and the Sound Science Study, which was officially completed
with publication of the Flint River Basin Plan in 2006 under the leadership of Director Couch.
The goal of these initiatives was to increase our knowledge of agricultural consumptive use. As
a result of our investment in the Sound Science Study and other initiatives, we began to make
great strides in our knowledge of, and our ability to quantify, total irrigation withdrawals and the
impact of those withdrawals on the water resources of the Basin.
48. Georgia’s initiative beginning in the late 1990s resulted in several major products
and datasets that have provided a comprehensive understanding of agricultural consumptive use
and its impact on the Flint River. These products include mapped and field-verified irrigated
acreage, field measurements of irrigation pumping, expanded metering of agricultural
withdrawals throughout the state, and a U.S. Geological Survey (“USGS”) groundwater model
for translating groundwater pumping to surface water streamflow reductions.
1. Irrigated Acreage
49. In the early 2000s, Georgia EPD and UGA collectively developed the first
geographic information system (“GIS”) map of wetted acreage in the ACF Basin.8 This map
8 For detailed discussion of the development of wetted acreage data for the ACF Basin, see the Direct Testimony of Mark H. Masters (October 26, 2016).
17
represented all of the HUC-8 units of the Flint River Basin for the period 1998-2003.9 In 2008-
2009, as part of the State and Regional Water Planning process, Georgia EPD and its contractors,
including UGA and the Georgia Water Policy and Planning Center (“Water Policy Center”) at
Albany State University, continued efforts to map irrigated acreage in the Basin. This resulted in
what is commonly referred to as the “NESPAL” database (UGA, 2010). These efforts
accelerated in 2013 under the leadership of Mark Masters and the Water Policy Center, including
through assessment of satellite imagery and on-farm visits to verify estimates from remote
sensing. By 2014, Georgia had again updated this comprehensive database of wetted acreage in
the ACF Basin.
50. The most recent database of wetted acreage data for the state is commonly
referred to as the 2016 Wetted Acreage Database (JX-129). The Wetted Acreage Database was
created as a deliverable to Georgia EPD, and I am familiar with the database through my work as
head of EPD’s Hydrology Unit. A copy of the database is maintained by Georgia EPD in the
regular course of business. JX-129 reflects the Water Policy Center’s work collecting field data
and remote imagery data to estimate total wetted acreage throughout the state. The irrigated
acreage in the Wetted Acreage Database reflects a maximum, or upper bound, estimate of
irrigated acreage for the present because we know that not all of the acres that can be irrigated
are in fact irrigated at any particular time.10
51. As of today, wetted acreage data exists from state, contractor, and university
mapping efforts reflecting total wetted acreage in the Chattahoochee and Flint River Basins from
2004 to 2014. Based on this data, EPD calculated the total irrigated acreage from surface water
sources and the UFA for 2004, 2009, 2010, 2013, and 2014. This includes all acres irrigated
from surface water sources and acres irrigated from the UFA in Sub-Area 4, a USGS designation
for the areas of the Lower ACF Basin where surface-groundwater interactions are high. For
2010, 2013, and 2014, EPD also separately calculated the acres irrigated from non-Floridan
Aquifer groundwater sources. For each year, the state collected or compiled data on statewide
irrigation withdrawals, which included the type of water source (surface water, groundwater, or
9 “HUC-8” refers to a USGS classification of hydrologic unit based on the size of the watershed. 10 See Direct Testimony of Mark H. Masters (Oct. 26, 2016).
18
well to pond), the aquifer source for groundwater and well to pond sources, and the acreage
associated with that withdrawal.
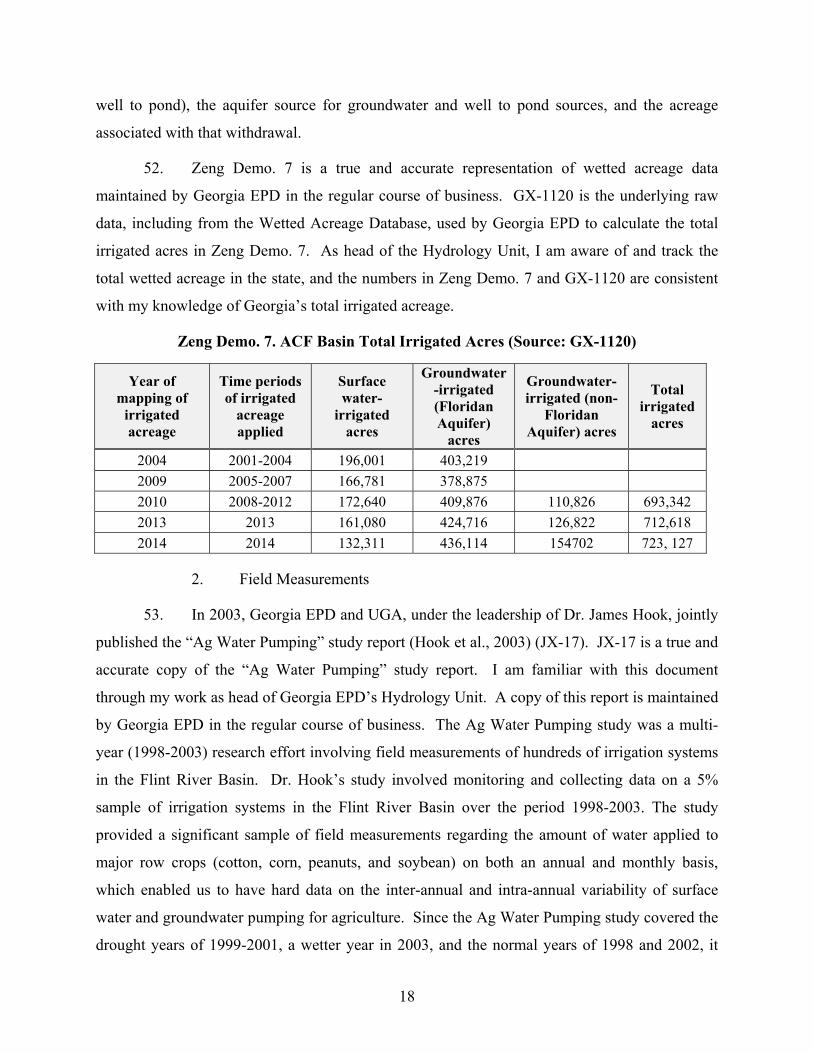
52. Zeng Demo. 7 is a true and accurate representation of wetted acreage data
maintained by Georgia EPD in the regular course of business. GX-1120 is the underlying raw
data, including from the Wetted Acreage Database, used by Georgia EPD to calculate the total
irrigated acres in Zeng Demo. 7. As head of the Hydrology Unit, I am aware of and track the
total wetted acreage in the state, and the numbers in Zeng Demo. 7 and GX-1120 are consistent
with my knowledge of Georgia’s total irrigated acreage.
Zeng Demo. 7. ACF Basin Total Irrigated Acres (Source: GX-1120)
Year of mapping of
irrigated acreage
Time periods of irrigated
acreage applied
Surface water-
irrigated acres
Groundwater-irrigated (Floridan Aquifer)
acres
Groundwater-irrigated (non-
Floridan Aquifer) acres
Total irrigated
acres
2004 2001-2004 196,001 403,219 2009 2005-2007 166,781 378,875 2010 2008-2012 172,640 409,876 110,826 693,342 2013 2013 161,080 424,716 126,822 712,618 2014 2014 132,311 436,114 154702 723, 127
2. Field Measurements
53. In 2003, Georgia EPD and UGA, under the leadership of Dr. James Hook, jointly
published the “Ag Water Pumping” study report (Hook et al., 2003) (JX-17). JX-17 is a true and
accurate copy of the “Ag Water Pumping” study report. I am familiar with this document
through my work as head of Georgia EPD’s Hydrology Unit. A copy of this report is maintained
by Georgia EPD in the regular course of business. The Ag Water Pumping study was a multi-
year (1998-2003) research effort involving field measurements of hundreds of irrigation systems
in the Flint River Basin. Dr. Hook’s study involved monitoring and collecting data on a 5%
sample of irrigation systems in the Flint River Basin over the period 1998-2003. The study
provided a significant sample of field measurements regarding the amount of water applied to
major row crops (cotton, corn, peanuts, and soybean) on both an annual and monthly basis,
which enabled us to have hard data on the inter-annual and intra-annual variability of surface
water and groundwater pumping for agriculture. Since the Ag Water Pumping study covered the
drought years of 1999-2001, a wetter year in 2003, and the normal years of 1998 and 2002, it
19
provided a very good basis for estimating agricultural consumptive use under a variety of
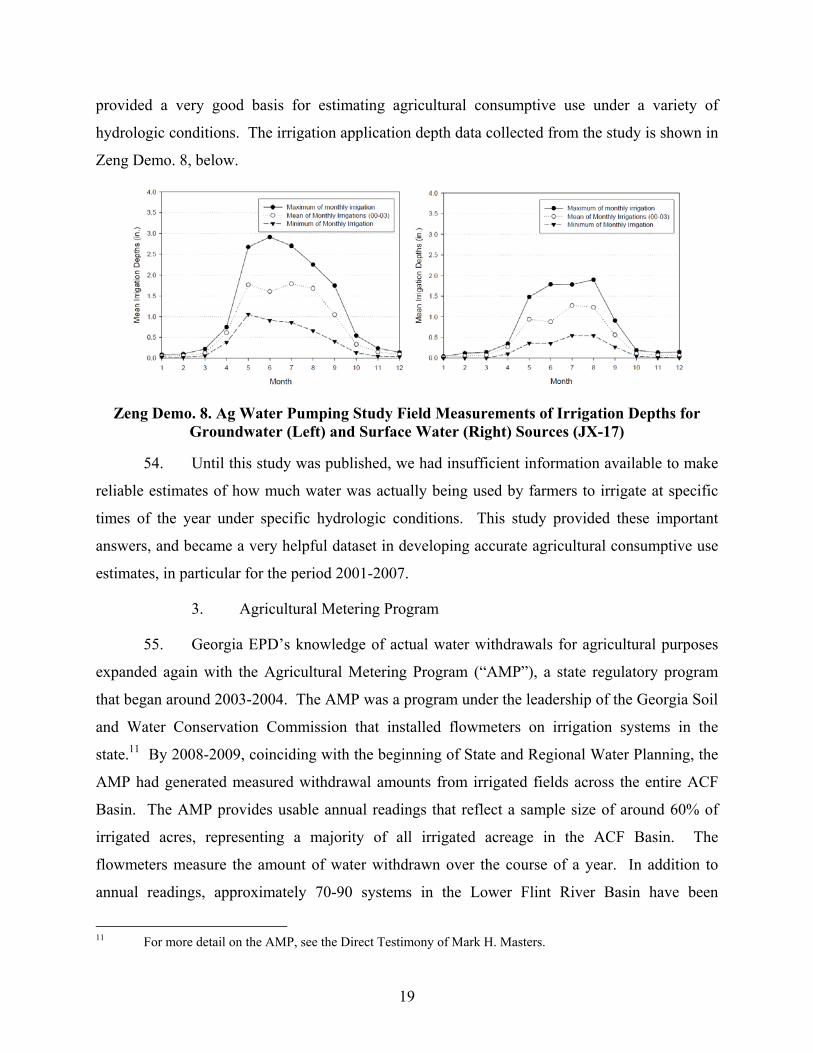
hydrologic conditions. The irrigation application depth data collected from the study is shown in
Zeng Demo. 8, below.
Zeng Demo. 8. Ag Water Pumping Study Field Measurements of Irrigation Depths for Groundwater (Left) and Surface Water (Right) Sources (JX-17)
54. Until this study was published, we had insufficient information available to make
reliable estimates of how much water was actually being used by farmers to irrigate at specific
times of the year under specific hydrologic conditions. This study provided these important
answers, and became a very helpful dataset in developing accurate agricultural consumptive use
estimates, in particular for the period 2001-2007.
3. Agricultural Metering Program
55. Georgia EPD’s knowledge of actual water withdrawals for agricultural purposes
expanded again with the Agricultural Metering Program (“AMP”), a state regulatory program
that began around 2003-2004. The AMP was a program under the leadership of the Georgia Soil
and Water Conservation Commission that installed flowmeters on irrigation systems in the
state.11 By 2008-2009, coinciding with the beginning of State and Regional Water Planning, the
AMP had generated measured withdrawal amounts from irrigated fields across the entire ACF
Basin. The AMP provides usable annual readings that reflect a sample size of around 60% of
irrigated acres, representing a majority of all irrigated acreage in the ACF Basin. The
flowmeters measure the amount of water withdrawn over the course of a year. In addition to
annual readings, approximately 70-90 systems in the Lower Flint River Basin have been
11 For more detail on the AMP, see the Direct Testimony of Mark H. Masters.
20
monitored and read at monthly intervals since 2012. These annual and monthly measurements
provide actual measurements of total annual agricultural withdrawals and monthly patterns for
those withdrawals. The metered agricultural withdrawals contain serial numbers, allowing those
meter readings to be associated with acreage values.
4. Groundwater Modeling
56. Georgia EPD has invested in improving our knowledge of the impact of
groundwater pumping on aquifers and streamflow. In 1999, Georgia EPD contracted with the
USGS for the development of a hydrologic model that could represent the complex groundwater-
surface water interactions of the Lower Flint and Chattahoochee River Basins (Jones et al., 2006;
Torak et al., 1996). The goal of the model was to quantify the surface water reduction resulting
from groundwater pumping. The Hydrology Unit began using this model around 2005,
eventually known as the Jones-Torak (USGS) model. The Jones-Torak model enabled us to
conduct a fairly detailed analysis of the impact of groundwater withdrawals from the UFA.
Since the time the Jones-Torak model was released, the Hydrology Unit has had groundwater
modelers working with that model, learning how to use it, as well as improving features of it.
Today, the Jones-Torak model is the best available tool for assessing the impact of groundwater
withdrawals on surface water flows in the ACF Basin. This model is much better and more
sophisticated than the tool Georgia EPD (as well as the Corps and Florida) was using when I first
started.
57. Due to these significant efforts, our understanding of actual irrigation withdrawals
and practices, and our confidence in our ability to estimate total agricultural consumptive use,
has improved significantly over time. Today, for at least the post-2008 period, we have:
• a comprehensive database of wetted acreage throughout the state, which has been developed and refined over time and field-verified to confirm estimates based on satellite imagery;
• a comprehensive network of agricultural metering, which provides hard data on actual annual irrigation withdrawals for thousands of metered irrigation systems and an intra-annual pattern based on a sample of monthly readings; and
• a high-quality groundwater model that gives us the best available analysis of how groundwater pumping may result in surface water flow reductions.
21
B. Methodology for Calculating Total Agricultural Withdrawals and Consumptive Use
58. Based on this data, total agricultural water withdrawals can be determined by
multiplying total irrigated acreage in the ACF Basin with average irrigation application depth, or
the volume of water pumped from irrigation systems. To determine total irrigated acreage for
the ACF Basin, Georgia EPD consults the statewide Wetted Acreage Database for wetted
acreage from 2004-2014.12 The Wetted Acreage Database also provides the source of irrigation,
so Georgia EPD is able to determine whether acres are irrigated from surface water or
groundwater sources, including the UFA or deeper aquifers. For the years 2001-2007, we rely
on wetted acreage data collected by Georgia EPD and UGA. For years prior to the availability of
wetted acreage data (pre-2001), we extrapolate to develop estimates of past acreage based on a
statewide trend of irrigated acreage from county agent surveys (Harrison et al., 2001).
59. Total irrigated acreage is then multiplied by a basin-wide irrigation application
depth for each year. For all years post-2008, Georgia EPD relies on the measured withdrawal
amounts from flowmeters in the AMP. The entire population of metered irrigation systems has
provided annual readings since 2008, and we rely on the sample of 70-90 monthly readings since
2012 for a growing season trend that is applied to the entire acreage. For the years 2002-2007,
Georgia uses recorded monthly application depths as reported by UGA’s Ag Water Pumping
study. As noted before, the study provides intra-annual irrigation depths for both dry (2002,
2006, 2007) and normal (2003, 2004, 2005) years. For pre-2001 irrigation depths, we categorize
each year as dry or normal according to the Ag Water Pumping study, and apply those annual
amounts and seasonal patterns. This provides estimates of irrigation depth for the years 1970-
2001.13 Together with the statewide irrigated acreage trend, Georgia EPD is able to “hind-cast”
estimates of total agricultural consumptive use for the years prior to 2000.
12 2001-2004 wetted acreage was considered to be the same as the 2004 wetted acreage. 2005-2007 wetted acreage was considered the same as the 2009 wetted acreage. 2008-2012 wetted acreage was considered to be the same as the 2010 wetted acreage. 13 The years 1981, 1986, 1988, 1999, 2000, and 2001 were determined to be drought years; and consequently assigned dry year application depths and patterns. The other years were assumed to follow normal year application depths and patterns.
22
1. Surface Water Sources
60. To determine agricultural consumptive use, i.e., surface streamflow impact, the
amount of irrigation withdrawals from surface water sources are treated as 100% consumptive,
because there is a direct, 1:1 relationship between surface water withdrawals and reduction of
surface streamflow. “Surface-to-pond” withdrawals, which refer to withdrawals for irrigation
from small impoundments on farms, are also considered direct, 1:1 removals. This is a
conservative approach, since I understand that these farm ponds are mostly filled during the
wetter seasons of the year, and water stored in the ponds is later used in the growing season for
irrigation. Thus, withdrawals from surface ponds would not actually result in any decrease of
streamflow during the growing season.
2. Groundwater Sources
61. Total consumptive use from agricultural groundwater withdrawals is determined
using the Jones-Torak model.14 The groundwater model translates pumping from hydraulically
connected aquifers to surface streamflow reduction, taking into account the amount, location,
and timing of the groundwater withdrawal. The only aquifer that has an extensive hydraulic
connection with surface water streams in the ACF Basin is the UFA. Water withdrawals from
non-UFA deeper aquifers (e.g., Claiborne, Clayton, Cretaceous) have limited to no hydraulic
connection with surface water streams in the ACF Basin, and thus are not included in the Jones-
Torak model.
62. I describe the methodology for estimating agricultural withdrawals and
consumptive use in GX-267. GX-267 is a true and accurate copy of an April 2009 memorandum
I drafted regarding agricultural consumptive use and its surface water effects in the Flint and
Lower Chattahoochee River Basins. I drafted this document as part of my work as head of
Georgia EPD’s Hydrology Unit. It was made as part of Georgia EPD’s regular practice and was
maintained in the course of its regularly conducted business.
14 The Jones-Torak model also includes recorded M&I groundwater withdrawals from the UFA. Thus, the output from Jones-Torak reflects all (M&I and agricultural) groundwater withdrawals from the UFA in the ACF Basin.
23
C. Total Agricultural Consumptive Use
63. The sum of consumptive use from surface and groundwater sources represents the
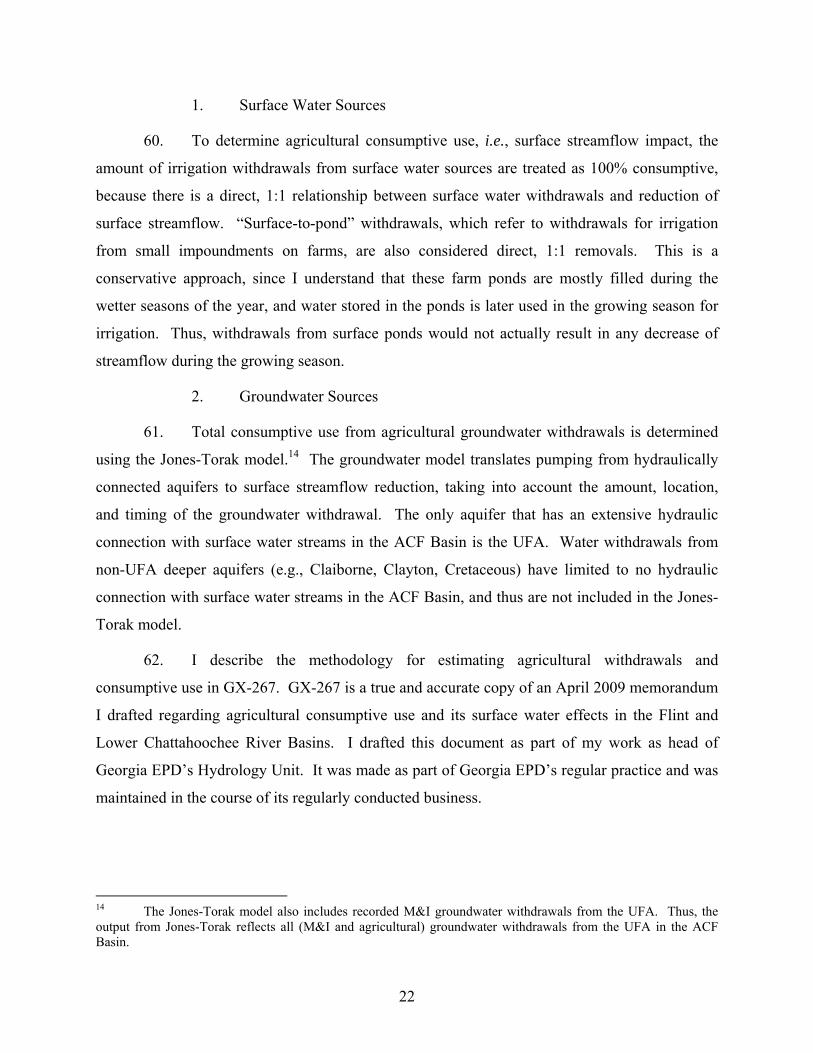
total agricultural consumptive use. Zeng Demo. 9 and Zeng Demo. 10 below are true and
accurate reproductions of estimates of Georgia EPD’s total agricultural consumptive use
maintained in databases by the Hydrology Unit in the regular course of business. This data is
collected and compiled by Georgia EPD as part of our regulatory and water planning efforts. As
head of the Hydrology Unit, I am familiar with Georgia’s agricultural consumptive use data, and
these demonstratives are consistent with my knowledge of Georgia’s agricultural consumptive
use.
Zeng Demo. 9. Total Monthly Average Agricultural Consumptive Use in Georgia’s ACF Basin (1970-2013) (GX-937)
64. Zeng Demo. 9 shows Georgia ACF Basin total monthly streamflow reduction
resulting from agricultural surface water withdrawals and groundwater pumping from the UFA.
As shown by this figure, Georgia’s total agricultural consumptive use has never exceeded 1,500
cfs in a single month, even during the agricultural growing season under drought conditions.
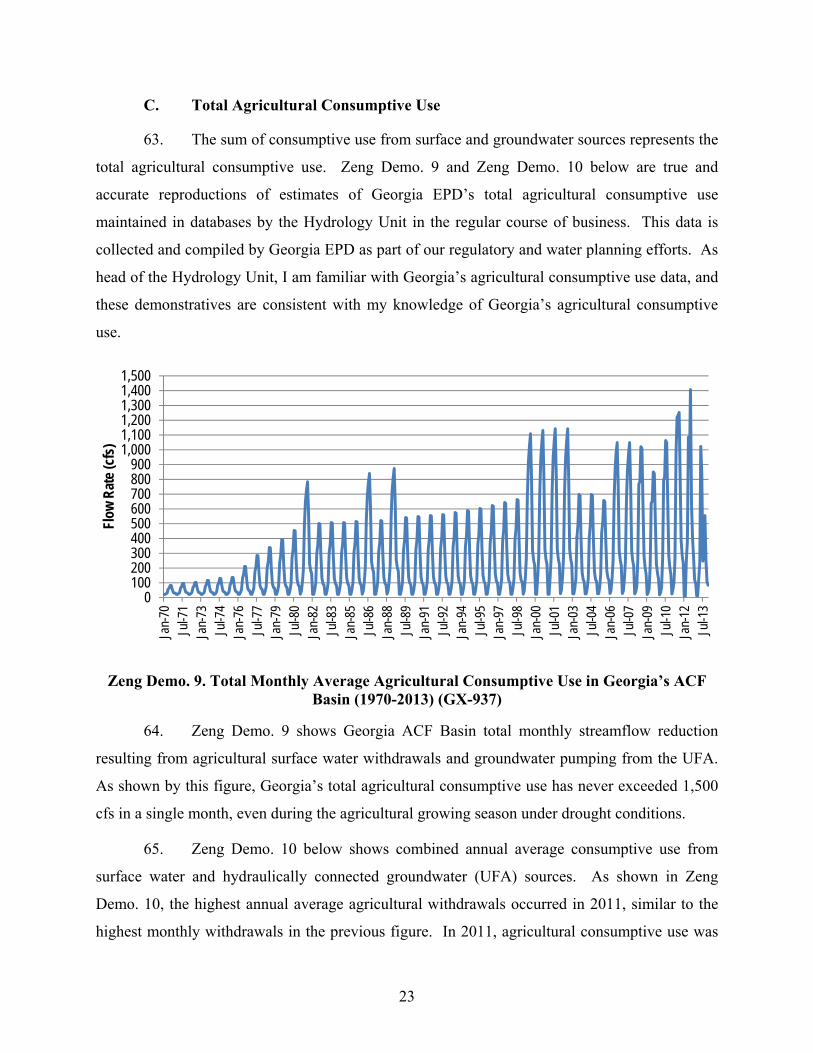
65. Zeng Demo. 10 below shows combined annual average consumptive use from
surface water and hydraulically connected groundwater (UFA) sources. As shown in Zeng
Demo. 10, the highest annual average agricultural withdrawals occurred in 2011, similar to the
highest monthly withdrawals in the previous figure. In 2011, agricultural consumptive use was
0100200300400500600700800900
1,0001,1001,2001,3001,4001,500
Jan-
70Ju
l-71
Jan-
73Ju
l-74
Jan-
76Ju
l-77
Jan-
79Ju
l-80
Jan-
82Ju
l-83
Jan-
85Ju
l-86
Jan-
88Ju
l-89
Jan-
91Ju
l-92
Jan-
94Ju
l-95
Jan-
97Ju
l-98
Jan-
00Ju
l-01
Jan-
03Ju
l-04
Jan-
06Ju
l-07
Jan-
09Ju
l-10
Jan-
12Ju
l-13
Flow
Rat
e (cf
s)
24
below 600 cfs. In comparison, agricultural consumptive use in 2009, a wetter year, was about
360 cfs.
Zeng Demo. 10. Total Annual Average Agricultural Consumptive Use in Georgia’s ACF Basin from Surface and Groundwater Sources (1970-2013)
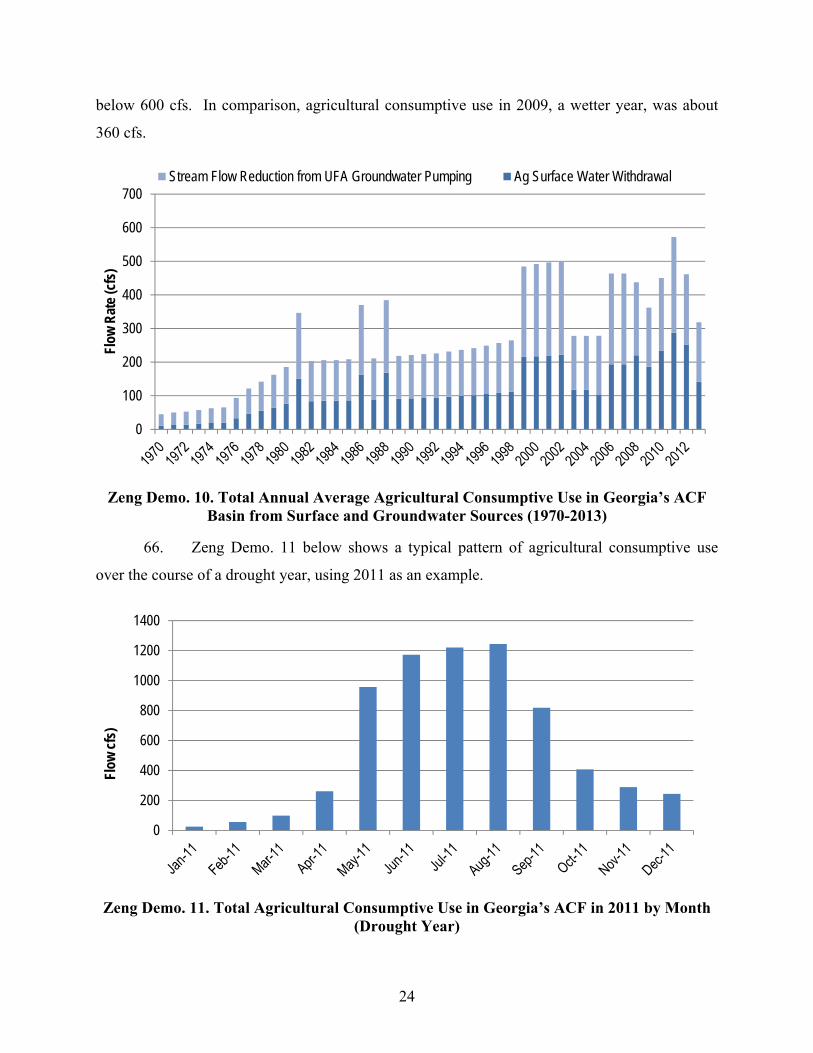
66. Zeng Demo. 11 below shows a typical pattern of agricultural consumptive use
over the course of a drought year, using 2011 as an example.
Zeng Demo. 11. Total Agricultural Consumptive Use in Georgia’s ACF in 2011 by Month (Drought Year)
0
100
200
300
400
500
600
700
Flow
Rat
e (cf
s)
Stream Flow Reduction from UFA Groundwater Pumping Ag Surface Water Withdrawal
0
200
400
600
800
1000
1200
1400
Flow
cfs)
25
67. As shown in Zeng Demo. 11, the highest monthly streamflow reduction took
place in August 2011, and was less than 1,300 cfs. August 2011 was the driest month of the
driest year on record and does not reflect normal conditions; instead, it reflects the maximum
monthly total consumptive use value on record.
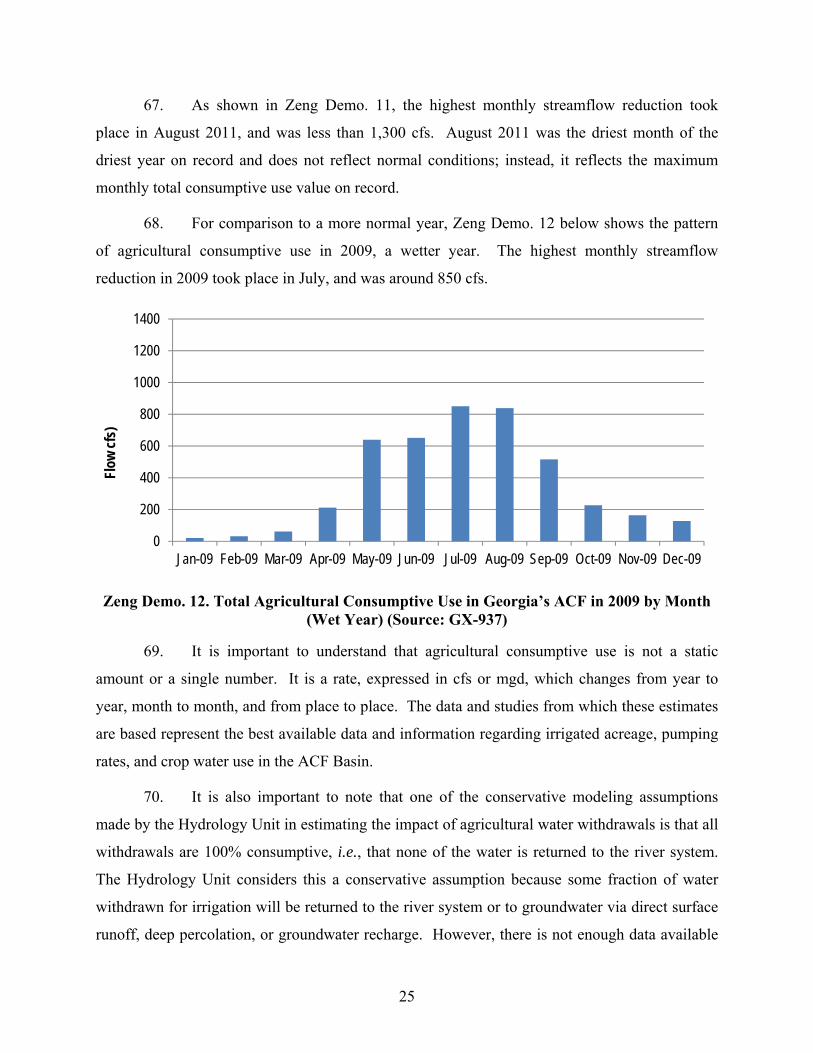
68. For comparison to a more normal year, Zeng Demo. 12 below shows the pattern
of agricultural consumptive use in 2009, a wetter year. The highest monthly streamflow
reduction in 2009 took place in July, and was around 850 cfs.
Zeng Demo. 12. Total Agricultural Consumptive Use in Georgia’s ACF in 2009 by Month (Wet Year) (Source: GX-937)
69. It is important to understand that agricultural consumptive use is not a static
amount or a single number. It is a rate, expressed in cfs or mgd, which changes from year to
year, month to month, and from place to place. The data and studies from which these estimates
are based represent the best available data and information regarding irrigated acreage, pumping
rates, and crop water use in the ACF Basin.
70. It is also important to note that one of the conservative modeling assumptions
made by the Hydrology Unit in estimating the impact of agricultural water withdrawals is that all
withdrawals are 100% consumptive, i.e., that none of the water is returned to the river system.
The Hydrology Unit considers this a conservative assumption because some fraction of water
withdrawn for irrigation will be returned to the river system or to groundwater via direct surface
runoff, deep percolation, or groundwater recharge. However, there is not enough data available
0
200
400
600
800
1000
1200
1400
Jan-09 Feb-09 Mar-09 Apr-09 May-09 Jun-09 Jul-09 Aug-09 Sep-09 Oct-09 Nov-09 Dec-09
Flow
cfs)
26
to estimate the fraction of agricultural withdrawals which are returned to the system, and
therefore the Hydrology Unit has historically used a conservative assumption that those
withdrawals are 100% consumptive.
D. Agricultural Forecasts
71. Georgia EPD, primarily through its contractor the Water Policy Center, has also
developed forecasts of agricultural water demands in the ACF Basin through 2040. These
projected agricultural consumptive use amounts were developed as part of the planning
associated with the State Water Plan and Regional Water Development Plans.15 Although the
Hydrology Unit does not generate these forecast data, we make use of this data in conducting
analysis and modeling of the impact of projected agricultural demands in the state for planning
and policy-making.
72. To produce the agricultural demand forecasts, analysts focused on the five crops
that account for 85% of irrigated acres in Georgia: corn, cotton, peanuts, soybeans, and pecans.
Irrigation water demand for other major commodities, including fruit and vegetables, was also
forecasted. Forecasts were developed through econometric modeling to predict the acres and
location of different crops that would be grown at each decadal time step, prediction of the
proportion of those acres expected to be irrigated, and crop modeling to estimate the water needs
of those crops under a range of potential weather conditions. The likely water sources were also
identified.
E. Corps UIF Development
73. For years, Georgia’s total consumptive use estimates for M&I and agricultural
purposes have been shared with the Army Corps and the states (i.e., Florida and Alabama) in
order to improve federal reservoir management and operations. The Corps uses and relies upon
the consumptive use data from the states for development of “unimpaired flows,” or “UIFs.”
Georgia also relies on UIFs for its modeling and analysis of surface and groundwater resources
for State and Regional Water Planning.
15 For more detail on the agricultural demand forecasts, see the Direct Testimony of Mark H. Masters and Gail Cowie, Ph.D.
27
74. UIFs are a key concept for water resource management and modeling. A UIF
dataset is a reconstructed estimate of flows “unimpaired” by human influence, including
consumptive use and reservoir operations. UIFs are developed in part based on estimates of total
consumptive use. UIFs are useful for water resources modeling because UIFs provide a common
input so alternatives can be compared against one another.
75. The UIF data are incorporated into reservoir and water resource management
models, such as ResSim. The Corps relies on consumptive use data provided by Georgia,
Florida, and Alabama in developing the UIFs used by ResSim. Throughout the process of
developing the UIFs, Georgia’s consumptive use data was shared with both the Corps and
Florida. Since 2006, Georgia EPD has provided the Corps with Georgia’s consumptive use data
on multiple occasions, including as recently as 2013. I have no recollection of instances when
Florida’s technical team questioned the technical validity or reliability of Georgia’s reported
consumptive use data until the current litigation began.
III. STATE AND REGIONAL WATER POLICY & PLANNING
76. The Hydrology Unit also performs technical analysis and modeling to support
Georgia’s statewide water planning efforts. This includes water resources and reservoir system
modeling for hydrologic “resource assessments” that are a major part of the planning process.16
As part of this process, the Hydrology Unit and the contractors we manage develop UIFs for
basins throughout the state, and we use the existing state flow policies to set thresholds for
evaluating current or future projected water demands, and how those projected water demands
would potentially impact streamflow in the system. The Hydrology Unit conducts this modeling
and informs the Regional Planning Councils of these results, including assisting in interpreting
the results. Based on these results, the Regional Planning Councils draw their plans.
GEORGIA EPD’S COORDINATION WITH THE CORPS REGARDING RESERVOIR OPERATIONS AND MANAGEMENT IN THE ACF BASIN
77. As Program Manager for the Hydrology Unit, I am the primary liaison between
the State of Georgia and the federal government regarding the Corps’ operations and
management of the federal reservoir projects in the ACF Basin. Because the state and federal
16 For more discussion on the State and Regional Water Planning Process, including the Surface Water and Groundwater Resource Assessments, see the Direct Testimony of Gail Cowie, Ph.D. (Oct. 26, 2016).
28
governments jointly share responsibility for managing water resources in the Basin, Georgia and
the Corps regularly interact and coordinate on all aspects of reservoir operations. The Hydrology
Unit and I review and comment on proposed reservoir operations, and we monitor Corps
reservoir operations on a daily basis. The Hydrology Unit and I have detailed knowledge of real-
world operations and extensive familiarity with HEC reservoir models for simulating those
operations. As a result, the Hydrology Unit and I have a deep understanding of the role and
impact of those reservoirs on water resources in the Basin.
78. The Hydrology Unit and I have also been directly involved in the evolution and
development of the reservoirs system’s operating rules over the past decade. As part of the
administrative process under the Endangered Species Act (“ESA”) and the Fish and Wildlife
Coordination Act (“FWCA”) for establishing and revising reservoir operations, the Corps
considers and weighs the analysis, advice, and recommendations of states and stakeholders. The
Corps has final say over how the reservoirs are operated, but historically they have been open to
receiving recommendations from the Hydrology Unit because of our technical understanding of
how the reservoir system works and our significant experience modeling the reservoir system
using the same tools used by the Corps.
79. Over the past 10 years, the Corps’ rules have changed significantly, in part based
on experience regarding what works and what does not work. Today, the reservoirs operate very
differently than they did a decade ago. In order to describe the evolution of the reservoir system
over time, it is important to begin by laying out the rules and explain how the system works
today. Then, I will describe how the system evolved over time to explain how it got where it is,
and to explain where it may be going.
I. OVERVIEW OF CORPS RESERVOIR OPERATING RULES
80. The federal reservoir system owned and operated by the Corps is integral to water
resources management in the ACF Basin (JX-124). The Corps’ five reservoir projects in the
ACF Basin are Lake Lanier, West Point, Walter F. George, George W. Andrews, Lake Seminole.
Lake Lanier provides a significant amount of water supply to the Metro Atlanta region.
Woodruff Dam, at the Georgia-Florida state line, controls inflows into the Apalachicola River
from Lake Seminole, which is formed by flows from the Chattahoochee and Flint Rivers. The
federal reservoirs are established to serve a number of authorized purposes, including water
29
supply, water quality, flood risk management, navigation, hydropower, recreation, and fish and
wildlife. These project purposes are both above the state line and below the state line. In GX-
544, the Corps wrote:
The complex hydrology and varied uses of the ACF system require that the USACE operate the system in a balanced operation in an attempt to meet all the authorized purposes while continuously monitoring the total system’s water availability to ensure that minimum project purposes can be achieved during critical drought periods.17
81. I have reviewed the testimony of Dr. Philip Bedient, Georgia’s expert on
hydrology and reservoir operations, and his description of Corps reservoir operations is, to the
best of my knowledge, correct and consistent with my experience and observations as Program
Manager of the Hydrology Unit.
A. Reservoir Storage & “Guide Curves”
82. To satisfy its project purposes, the Corps to maintain water storage in the
reservoirs to the extent possible (except during flood risk) while meeting these authorized
purposes. The Corps has defined “action zones” for its storage reservoirs in the ACF Basin,
which subdivide the conservation storage pool in each reservoir to guide Corps reservoir
operators in meeting project purposes during a variety of hydrologic conditions. I routinely work
with and perform analysis involving the Corps reservoir rules. I am very familiar with the
Corps’ rules and how they work.
83. Zeng Demo. 13 shows “action zones” for a reservoir (using Lake Lanier as an
example). Each action zone has a set of operational rules or guidelines that govern water
management operations for the reservoir when the pool elevation is within that zone (JX-124, p.
2-25). Zone 1, the highest action zone, is where all the Corps’ federal project purposes can be
satisfied. Zone 4, the lowest zone, reflects when the reservoirs are considered to be at critically
low levels. When Composite Conservation Storage falls into Zone 4, the Corps institutes a set of
protective rules for reservoir storage known as “Drought Operations.”
17 GX-544, at 18. GX-544 is a true and correct copy of the Corps’ March 2013 Final Scoping Report. I am familiar with this document and have utilized it in connection with my responsibilities as program manager of the Hydrology Unit.
30
Zeng Demo. 13 Action Zones in ACF Storage Reservoirs (e.g., Lake Lanier) (Source: JX-124)
84. The “guide curve” is a fundamental principle of reservoir operations and sets a
reservoir level that guides storage levels in the reservoirs. The guide curve is the top of the
conservation pool (shown as a black line in Zeng Demo. 13 above). The guide curve operation
says that when the reservoir levels are above the guide curve, the Corps should operate the
reservoirs to release from storage, and when the reservoir levels are below the guide curve, the
Corps should operate the reservoirs in a manner to facilitate the refill of storage and increase
storage toward the guide curve. In the Corps’ training session for HEC software packages, the
guide curve operation is the first lesson taught. In practice, the Corps operates its reservoir to
follow the guide curve to the extent possible while meeting authorized purposes. If individual or
composite reservoir levels in the ACF Basin are below the guide curve, the Corps will operate
the reservoirs and making releases to meet authorized purposes, but no more.
B. Revised Interim Operating Plan (“RIOP”)
85. Today, the Corps follows reservoir operating rules for its reservoir system
according to a draft WCM for the entire ACF reservoir system, individual water control manuals
for the individual reservoir projects, and a set of operating rules for minimum releases into the
Apalachicola River for fish and wildlife purposes, known as the Revised Interim Operating Plan
31
(“RIOP”) (JX-124 at 2-71). I have deep familiarity with the RIOP and how it works based on
my experience as Program Manager of the Hydrology Unit.
86. The reservoir rules, including the RIOP, are in the process of being updated as
part of the larger revision to the Master WCM for the ACF Basin. In October 2015, the Corps
released its draft revised Master WCM, accompanied by its DEIS. The DEIS contains a
proposed set of operating rules to replace the RIOP for minimum releases into the Apalachicola
River, known as the Proposed Action Alternative (“PAA”). Once adopted, the Master WCM
will control all federal reservoir operations in the ACF Basin. I have extensively reviewed and
analyzed the DEIS as part of my responsibilities as Georgia’s principal hydrologist, including
associated appendices, models, and modeling files.
87. The RIOP is the product of inter-agency consultation between the Corps and the
USFWS. The Corps consults with USFWS regarding the impact of reservoir operations at
Woodruff Dam on threatened and endangered species and federally designated critical habitat in
the Apalachicola River, especially during drought conditions and spawning periods. The
USFWS has reviewed and approved all Corps operations as contained in the RIOP. In 2008 and
2012, the USFWS published “Biological Opinions,” or “BiOps,” in which it approved multiple
versions of the RIOP.18 In the BiOps, the USFWS expressly concluded that the RIOP’s 5,000
cfs minimum flow was sufficient to protect downstream fish and wildlife. In October 2016, the
USWFS again confirmed that the PAA in the proposed WCM “will not jeopardize the continued
existence of the Gulf Sturgeon” and “will not destroy or adversely modify designated critical
habitat for the fat threeridge, purple bankclimber, and Chipola slabshell.”19 Thus, as recently as
this month, the USFWS has found that the RIOP will not adversely modify the habitat of the
listed mussel species or the Gulf Sturgeon in the Apalachicola River.
88. The RIOP reflects a balanced approach between releases into the Apalachicola
River to meet the needs of endangered species and the protection of reservoir storage in order to
satisfy numerous other project purposes. Under the RIOP, the amount and timing of releases
18 JX-72 (USFWS, Biological Opinion on the U.S. Army Corps of Engineers, Mobile District, Revised Interim Operating Plan for Jim Woodruff Dam and the Associated Releases to the Apalachicola River, at ii (2012)). 19 JX-168 (USFWS, Biological Opinion on the U.S. Army Corps of Engineers, Mobile District, Revised Interim Operating Plan for Jim Woodruff Dam and the Associated Releases to the Apalachicola River, at 3 (2016)).
32
from Woodruff Dam into the Apalachicola River are determined by the Corps based on three
elements: reservoir storage levels, basin inflow, and seasonality.20
89. Zeng Demo. 14 is a true and accurate copy of Table 2.1-5 from the Corps’ DEIS
(JX-124 at 2-71), showing the RIOP’s rules for minimum releases from Woodruff Dam and
storage in the ACF reservoirs. I routinely consult Table 2.1-5 as part of my responsibilities as
chief hydrologist for the State of Georgia.
Zeng Demo. 14. JX-124. Minimum Discharge and Basin Inflow Available for Storage Under RIOP
90. Under the RIOP, there are times where the state-line flow is set at “> 5,000” cfs,
including when Basin Inflow is less than 5,000 cfs or the Corps is in Drought Operations. At
those times, the Corps will release as close to 5,000 cfs as possible, but always ensuring they are
not going below the minimum. Under Drought Operations, the Corps will release the minimum
20 The Corps defines seasonality in terms of three seasons: March-May, June-November, and December-February, based on biological requirements of endangered fish species (spawning, non-spawning, and “refill” seasons).
33
5,000 cfs and maintain as much reservoir storage as possible (including all Basin Inflow over
5,000 cfs) until the reservoirs recover to healthier levels, i.e., Zone 1.21
91. Based on my experience and observations as the Program Manager of the
Hydrology Unit, and based on my review and knowledge of Corps project data, the Corps
effectively treats 5,000 cfs as a state line flow target during low-flow conditions and Drought
Operations. I am also familiar with numerous documents authored by the Corps that describe the
5,000 cfs minimum flow requirement as a “target.”22
92. The Corps’ actual historical releases from Woodruff Dam confirm that the Corps
treats 5,000 cfs as a target. These releases are reflected in the Corps’ daily project data for its
reservoirs. The Corps’ daily project data are published on its website on a daily basis
(http://water.sam.usace.army.mil/locals-7-day.pdf). This data includes recorded releases from
Woodruff Dam (under Column Title “Jim Woodruff Out”). The Corps’ recorded releases are
calculated daily average flows based on USGS provisional (real-time) data from the
Chattahoochee gage. The USGS real-time data is provided to the Corps every 3 minutes on a
digital display at the Woodruff Dam control center. It reflects the USGS’s real-time estimate of
the flow at the Chattahoochee gage. The Corps relies on the real-time data as the true outflow
from the project at the time. The Corps calculates its daily average recorded release based on
this real-time data, which is then recorded as the Corps’ releases from Woodruff Dam. The
Corps’ intended releases are reflected in the project data, not the final USGS flow records. The
final USGS flow records are also not available at the time the Corps makes its release decision,
and as such the Corps cannot rely on the final USGS flow data for determining its releases from
Woodruff Dam.
93. The Corps’ recorded releases can differ substantially from the USGS’s final,
official flow measurements, often by hundreds of cfs. This is because the USGS’s final flow
21 JX-124, at 4-17 (“Under the current May 2012 RIOP, the drought plan provisions remain in place until conditions improve to the point at which the composite conservation storage reaches a level above the top of Zone 2 (i.e., within Zone 1)).” 22 See, e.g., JX-124, USACE DEIS Vol. 2 at 7-6 (“Minimum flow targets are met.”); USACE DEIS Appendix E, HEC-ResSim Modeling Report at 63 (“Flow Target at Chattahoochee”); id. at E-5 (“The RIOP was set up such that the measures for operation for flow target were coupled with measures for drought contingencies…”); id. at H-1 (“Revised Interim Operations Plan (Flow Target) at Jim Woodruff”); id. at H-4 (“State Variable Used for Revised Interim Operations Plan (Flow Target) at Jim Woodruff”); id. at H-10 (“Drought operation first occurs until the target minimum flow is reached…”).
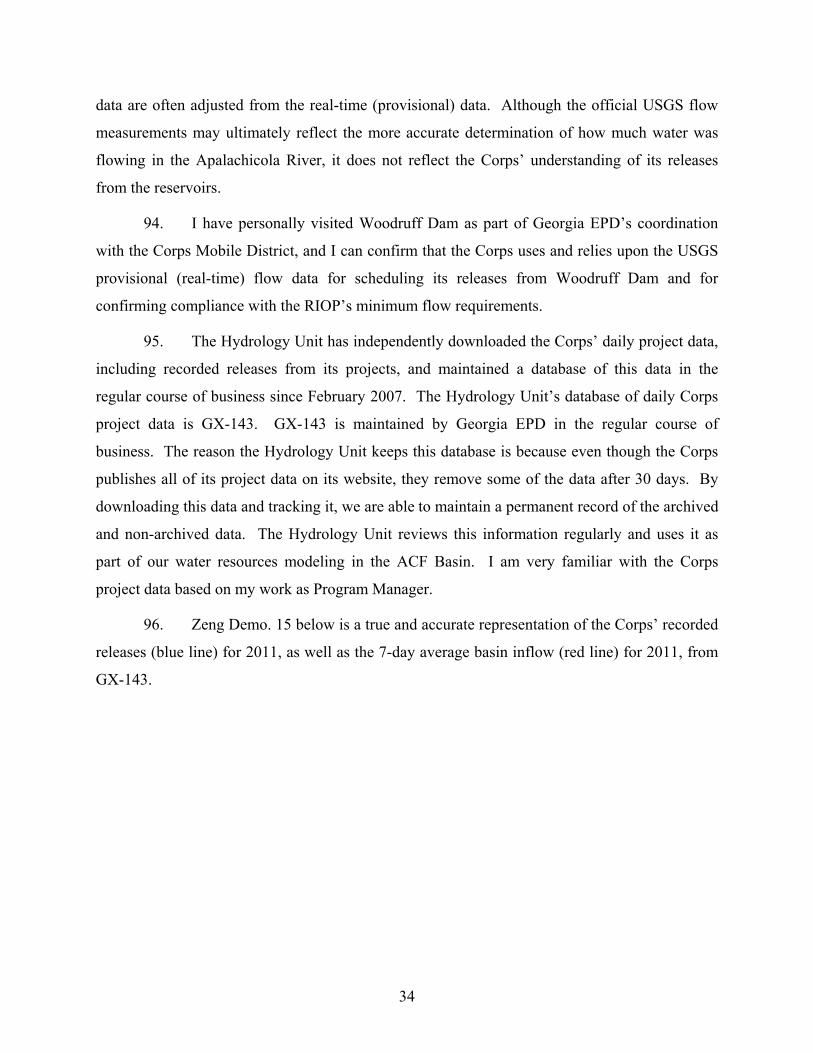
34
data are often adjusted from the real-time (provisional) data. Although the official USGS flow
measurements may ultimately reflect the more accurate determination of how much water was
flowing in the Apalachicola River, it does not reflect the Corps’ understanding of its releases
from the reservoirs.
94. I have personally visited Woodruff Dam as part of Georgia EPD’s coordination
with the Corps Mobile District, and I can confirm that the Corps uses and relies upon the USGS
provisional (real-time) flow data for scheduling its releases from Woodruff Dam and for
confirming compliance with the RIOP’s minimum flow requirements.
95. The Hydrology Unit has independently downloaded the Corps’ daily project data,
including recorded releases from its projects, and maintained a database of this data in the
regular course of business since February 2007. The Hydrology Unit’s database of daily Corps
project data is GX-143. GX-143 is maintained by Georgia EPD in the regular course of
business. The reason the Hydrology Unit keeps this database is because even though the Corps
publishes all of its project data on its website, they remove some of the data after 30 days. By
downloading this data and tracking it, we are able to maintain a permanent record of the archived
and non-archived data. The Hydrology Unit reviews this information regularly and uses it as
part of our water resources modeling in the ACF Basin. I am very familiar with the Corps
project data based on my work as Program Manager.
96. Zeng Demo. 15 below is a true and accurate representation of the Corps’ recorded
releases (blue line) for 2011, as well as the 7-day average basin inflow (red line) for 2011, from
GX-143.
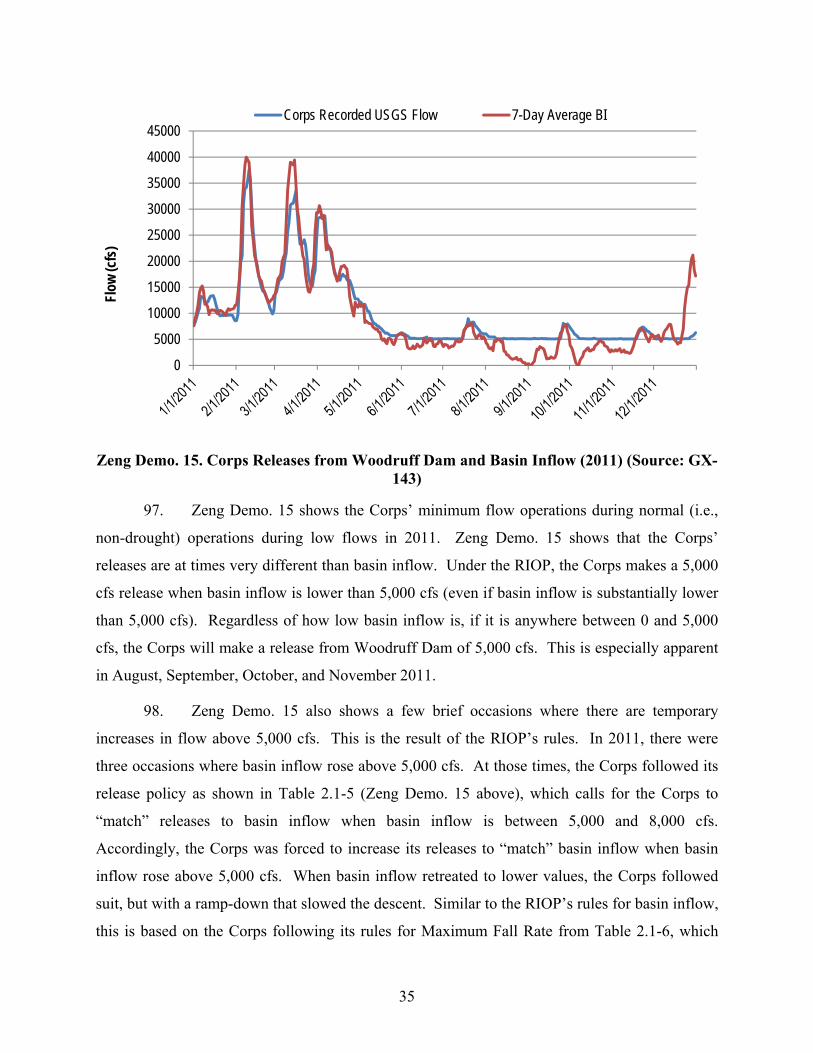
35
Zeng Demo. 15. Corps Releases from Woodruff Dam and Basin Inflow (2011) (Source: GX-143)
97. Zeng Demo. 15 shows the Corps’ minimum flow operations during normal (i.e.,
non-drought) operations during low flows in 2011. Zeng Demo. 15 shows that the Corps’
releases are at times very different than basin inflow. Under the RIOP, the Corps makes a 5,000
cfs release when basin inflow is lower than 5,000 cfs (even if basin inflow is substantially lower
than 5,000 cfs). Regardless of how low basin inflow is, if it is anywhere between 0 and 5,000
cfs, the Corps will make a release from Woodruff Dam of 5,000 cfs. This is especially apparent
in August, September, October, and November 2011.
98. Zeng Demo. 15 also shows a few brief occasions where there are temporary
increases in flow above 5,000 cfs. This is the result of the RIOP’s rules. In 2011, there were
three occasions where basin inflow rose above 5,000 cfs. At those times, the Corps followed its
release policy as shown in Table 2.1-5 (Zeng Demo. 15 above), which calls for the Corps to
“match” releases to basin inflow when basin inflow is between 5,000 and 8,000 cfs.
Accordingly, the Corps was forced to increase its releases to “match” basin inflow when basin
inflow rose above 5,000 cfs. When basin inflow retreated to lower values, the Corps followed
suit, but with a ramp-down that slowed the descent. Similar to the RIOP’s rules for basin inflow,
this is based on the Corps following its rules for Maximum Fall Rate from Table 2.1-6, which
0
5000
10000
15000
20000
25000
30000
35000
40000
45000Fl
ow (c
fs)
Corps Recorded USGS Flow 7-Day Average BI
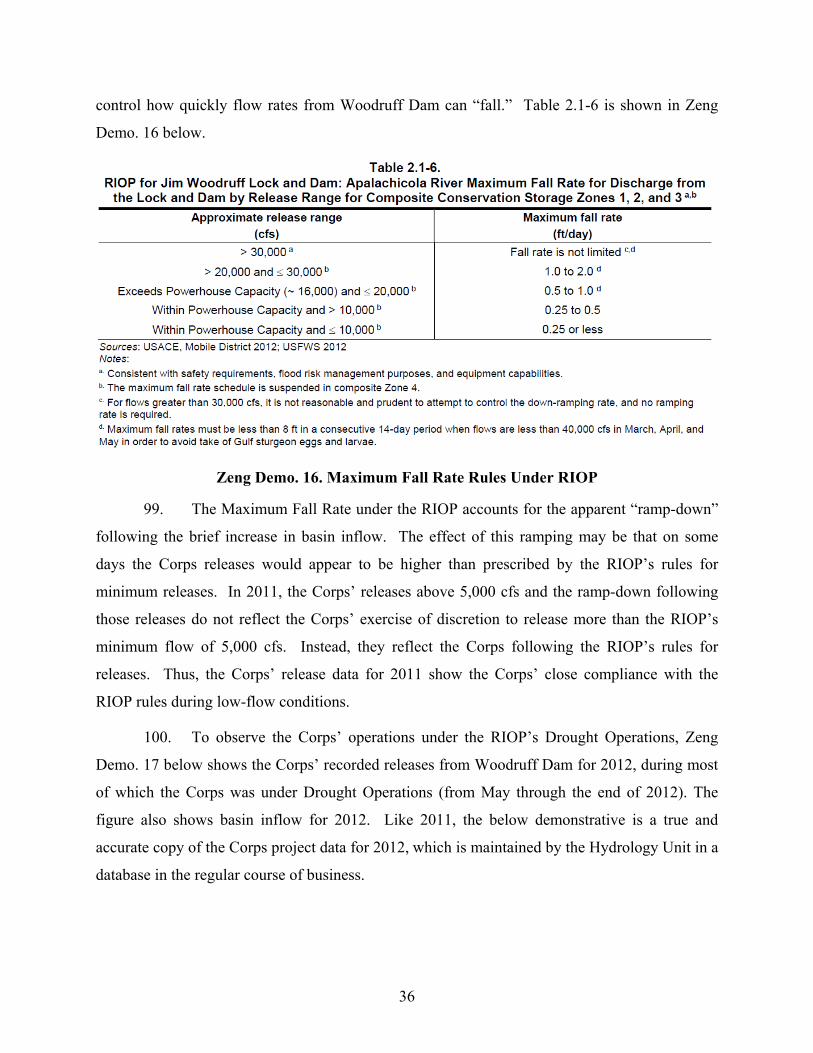
36
control how quickly flow rates from Woodruff Dam can “fall.” Table 2.1-6 is shown in Zeng
Demo. 16 below.
Zeng Demo. 16. Maximum Fall Rate Rules Under RIOP
99. The Maximum Fall Rate under the RIOP accounts for the apparent “ramp-down”
following the brief increase in basin inflow. The effect of this ramping may be that on some
days the Corps releases would appear to be higher than prescribed by the RIOP’s rules for
minimum releases. In 2011, the Corps’ releases above 5,000 cfs and the ramp-down following
those releases do not reflect the Corps’ exercise of discretion to release more than the RIOP’s
minimum flow of 5,000 cfs. Instead, they reflect the Corps following the RIOP’s rules for
releases. Thus, the Corps’ release data for 2011 show the Corps’ close compliance with the
RIOP rules during low-flow conditions.
100. To observe the Corps’ operations under the RIOP’s Drought Operations, Zeng
Demo. 17 below shows the Corps’ recorded releases from Woodruff Dam for 2012, during most
of which the Corps was under Drought Operations (from May through the end of 2012). The
figure also shows basin inflow for 2012. Like 2011, the below demonstrative is a true and
accurate copy of the Corps project data for 2012, which is maintained by the Hydrology Unit in a
database in the regular course of business.
37
Zeng Demo. 17. Corps Releases from Woodruff Dam and Basin Inflow (2012) (GX-143)
101. As Zeng Demo. 17 shows, outflows from Woodruff Dam very closely track the
5,000 cfs line in the summer and fall of 2012. The 2012 story is slightly different from 2011.
The Corps went into Drought Operation on May 1, 2012. From that point on, the Corps released
very close to 5,000 cfs regardless of what the basin inflow was. This is a good example of the
Corps following its Drought Operation protocol. Far from showing the Corps deviating from the
RIOP’s minimum flows as a result of its “discretion” to support fish and wildlife, this shows that
the Corps was following the RIOP to the letter.
102. As shown in Zeng Demo. 17, there were several “spikes” in recorded releases in
the summer and early fall. In response to local precipitation, the Corps increased its releases
from Woodruff Dam following its “Maximum Head Differential” rule, which is also a part of the
RIOP operation (JX-124, Appendix A, at E-C-3; Appendix A, at Plate 7-1). At the Corps project
of Jim Woodruff dam, there is a structural integrity consideration called the “head limitations.”
What this means is that the Corps needs to keep the difference between the head water (water
above the dam) and tail water (water below the dam) within a specified range to ensure dam
integrity. If the head water elevation is raised because of excessive inflow, the Corps may need
to increase releases to raise the tail water elevation in order to keep the head differential within a
0
5000
10000
15000
20000
25000
30000
35000
Flow
(cfs
)Corps Recorded USGS Flow 7-Day Average BI
38
prescribed range. This rule sometimes causes the Corps to release more than the minimum
releases set forth in Table 2.1-5. Such elevated releases are designed solely to maintain the
structural integrity of the dam, and are neither violations of the RIOP nor an exercise of
discretion by the Corps to support downstream fish and wildlife. Instead, they are a matter of
dam safety.
103. During the periods leading up to these “spikes” in 2012, there were local
precipitation events causing Lake Seminole elevation to rise. The elevated lake levels caused the
Maximum Head Differential rule to be triggered, which calls for the Corps to increase release to
bring up tail water elevation to reduce the head differential. This can be confirmed by reviewing
the Corps project elevation data (http://water.sam.usace.army.mil/gage/acf/prow1-12.txt) and
project precipitation data (http://water.sam.usace.army.mil/gage/acf/prow4-12.txt). I am familiar
with both of these documents, and regularly review them as part of my work at Georgia EPD.
The documents in these links are true and accurate copies of the project elevation data and
project precipitation data. The RIOP’s rules for “head limitations” explain most of the “spikes”
above 5,000 cfs that occurred in 2012.
104. It is noteworthy that unlike 2011, the Corps made no attempt in 2012 to ramp its
release slowly back down. Instead, they brought it back down to 5,000 cfs quickly. This is also
in accordance with the RIOP’s Drought Operations protocol, i.e., suspension of ramping during
Drought Operations. Thus, the spikes are more short-term in nature, and Woodruff Dam releases
quickly return to 5,000 cfs.
105. In the low-flow seasons in 2011 and 2012, the Corps’ releases of 5,000 cfs from
Woodruff Dam allowed the Corps to store most basin inflow over and above 5,000 cfs in the
reservoirs. The purpose of the 5,000 cfs minimum flow requirement is to allow the Corps to
recover the reservoirs back to healthy levels while ensuring all project purposes are satisfied.
C. Discretionary Releases
106. In addition to the Maximum Fall Rate and the Maximum Head Differential, there
are other explanations for the existence of flows in excess of 5,000 cfs at the Chattahoochee gage
when the 5,000 cfs minimum flow is in effect.
39
107. The reservoir operating rules provide for the use of discretion for specifically
enumerated purposes, referred to as “unplanned deviations.” These include maintenance,
emergencies, and hydropower (JX-124, DEIS, Appendix E, HEC-ResSim Modeling Report at
19, DEIS at 2-73, Table 2.1-6). Additionally, the Corps will make releases just above 5,000 cfs
frequently simply to ensure a “safety buffer” to avoid going below the USFWS-mandated
minimum flows. It is operationally very difficult, if not impossible, to maintain a flow of
precisely 5,000 cfs from Woodruff Dam, especially because these releases are in part a reflection
of scheduled releases from storage reservoirs upstream
108. In my experience analyzing and commenting on Corps operations for many years,
any observed recorded releases from Woodruff Dam in excess of 5,000 cfs can be explained by
the Corps following the complex rules of the RIOP or the “safety buffer” discussed above. I
have worked with Corps personnel for nearly 15 years on the operation of the reservoir system,
and I have studied and modeled the Corps’ reservoir operations as part of my daily
responsibilities in the Hydrology Unit. I have never witnessed the Corps Mobile District, when
operating under the RIOP, use its “discretion” to make releases from Woodruff Dam over and
above 5,000 cfs, nor have I witnessed the Corps deliberately draw down its reservoir levels to
increase flows into the Apalachicola River, especially while the Corps was under storage-
protective reservoir operations, e.g., Drought Operations. That would equate to purposefully
depleting reservoir storage at a time when the Corps is committed to holding on to as much
storage as possible.
II. MONITORING OF CORPS RESERVOIR OPERATIONS
109. As part of our day-to-day work, the Hydrology Unit observes and monitors the
Corps’ actual reservoir operations in the ACF Basin.23 The Hydrology Unit monitors and
records data regarding project inflow, project outflow, and basin inflow to the entire system. As
part of our day-to-day work, the Hydrology Unit compares actual reservoir storage and actual
reservoir releases to RIOP storage rules and RIOP thresholds to ensure compliance with the
RIOP. We have found that, in general, there is significant agreement between the RIOP and the
Corps’ actual operations. This because the Corps follows the RIOP rules in operating the
reservoirs in the ACF Basin. 23 JX-137, ACF Historical Project Data, http://water.sam.usace.army.mil/acfframe.htm.

40
110. Zeng Demo. 18 is a true and accurate copy of Corps project data for September
and October 2016, which I downloaded from the Corps website on October 26, 2016. This data
is published and updated daily by the Corps and recorded into Georgia EPD’s database. As head
of the Hydrology Unit, I am familiar with and regularly use this data.
Zeng Demo. 18 Sample Corps Daily Project Data Downloaded October 26, 2016 (GX-143)
111. This data shows daily recorded project releases, daily project inflow data, daily
local inflow data, recorded USGS provisional data (Jim Woodruff Out), and 1-day and 7-day
average basin inflows. The Hydrology Unit’s database of project data since February 2007
includes all of this data (GX-143). As the Corps data downloaded on October 26 shows, basin
inflow has been declining in the past few weeks. The current level of Basin Inflow is between
2,000 and 3,000 cfs. This is consistent with other sources of information on hydrologic
conditions in the ACF Basin (e.g., U.S. Drought Monitor, indicating “severe” to “extreme”
drought conditions). As the data shows, the Corps has been releasing water from storage to
augment flows to meet a flow target of 5,000 cfs. Releases in early October were slightly higher
41
than 5,000 cfs by a few hundreds of cfs, but the Corps has been ramping down its release toward
5,000 cfs in the first half of October. By October 16, 2016, the Corps was able to ramp its
release from Jim Woodruff down to 5,168 cfs. Releases have been near 5,000 cfs since then.
112. Based on our review and monitoring of Corps operations, the Hydrology Unit and
I have observed that the Corps closely follows the RIOP rules in its operation of the federal
reservoirs in the ACF Basin. Under the RIOP:
• The Corps uses the maximum amount of basin inflow “available for” storage to refill the reservoirs.
• The Corps releases the minimum amount of reservoir storage into the Apalachicola River (5,000 cfs or BI) under low-flow and drought conditions. The Corps releases 5,000 cfs into the Apalachicola River and stores any excess flow into storage to the extent possible under Drought Operations.
113. Although deviations from the RIOP are rare, they do occur. Some of these
deviations include releases from Woodruff Dam over and above the 5,000 cfs minimum flow.
When that happens, I usually call the Corps to inform them of what we are observing, and to
seek clarification. I will speak to Mr. James Hathorn, the Water Management Section Chief at
the Mobile District, who is in charge of daily decisions about how much water to store in or
release from the federal reservoirs. I do not recall any instance when the Corps provided an
explanation other than it was operating consistent with the RIOP, such as under the Maximum
Head Differential rule.
III. MODELING OF CORPS RESERVOIR OPERATIONS
114. The Corps’ has developed reservoir simulation tools for reservoir operations.
Today, the Corps’ flagship reservoir simulation software package is ResSim. ResSim was
developed and is used by the Corps for modeling of reservoir operations throughout the United
States. The ResSim software package is adapted to model different watersheds, including the
ACF Basin. For the ACF Basin, the Corps “selected HEC-ResSim as the tool most capable of
faithfully representing [Mobile] District water management practices at the culmination of a 3-
42
year model development and verification process” (JX-124 at 4-3). ResSim is part of a series of
advanced modeling tools developed by the Corps HEC.24
115. ResSim simulates the operation of the five reservoirs in the ACF Basin as a single
system, with each of the projects working in tandem according to the rules for the Master Water
Control Manual and the RIOP. ResSim was developed with close coordination between the
modeling branch (HEC) and operational branch (Mobile District) of the Corps to ensure that the
ResSim accurately reflects real-world reservoir operations. ResSim can simulate “recursive”
reservoir operations, meaning it can “look back” into the past and take into account pre-existing
conditions of the system in order to model current conditions. For these reasons, ResSim is used
by the Corps as its central tool for basin-wide reservoir and water resource management in the
ACF Basin.
116. The Corps relies on ResSim to study the impact of proposed changes in reservoir
operations on the environment and the ability to satisfy is various project purposes. For instance,
the Corps relies on ResSim as part of its ongoing WCM/DEIS process, and in evaluating
Georgia’s Water Supply Requests.
117. The Hydrology Unit and I have used ResSim and HEC-5 for analysis and
simulation of reservoir operations in the ACF Basin for the past 15 years. Georgia uses ResSim
to evaluate the impact of changes in consumptive use as part of its analysis for the Water Supply
Requests and the State and Regional Water Planning effort. ResSim has been used and relied on
by Florida, other federal agencies (e.g., USFWS), and stakeholders (e.g., Atlanta Regional
Commission). In fact, the Corps and the States of Georgia, Alabama, and Florida assisted with
development of the ResSim model for the ACF Basin.25
118. The purpose of the ResSim model is to encode the reservoir operating rules and
provide a reasonably accurate representation of how water resources would respond to changing
conditions (e.g., water demands, reservoir rules). The ResSim model is the best available tool
24 The Hydrology Unit and I have extensive familiarity with the Corps’ other hydrologic and hydraulic models, including HEC-2 for surface water hydraulics, HEC-RAS for open-channel hydraulics, HEC-6 for sedimentation, and HEC-HMS for rainfall-runoff analysis.
25 The Corps and the states also jointly developed the HEC-5 model for the ACF Basin. HEC-5 is the predecessor software to ResSim. The Corps and the states used this HEC-5 model of the ACF Basin extensively during the ACF Compact negotiations.
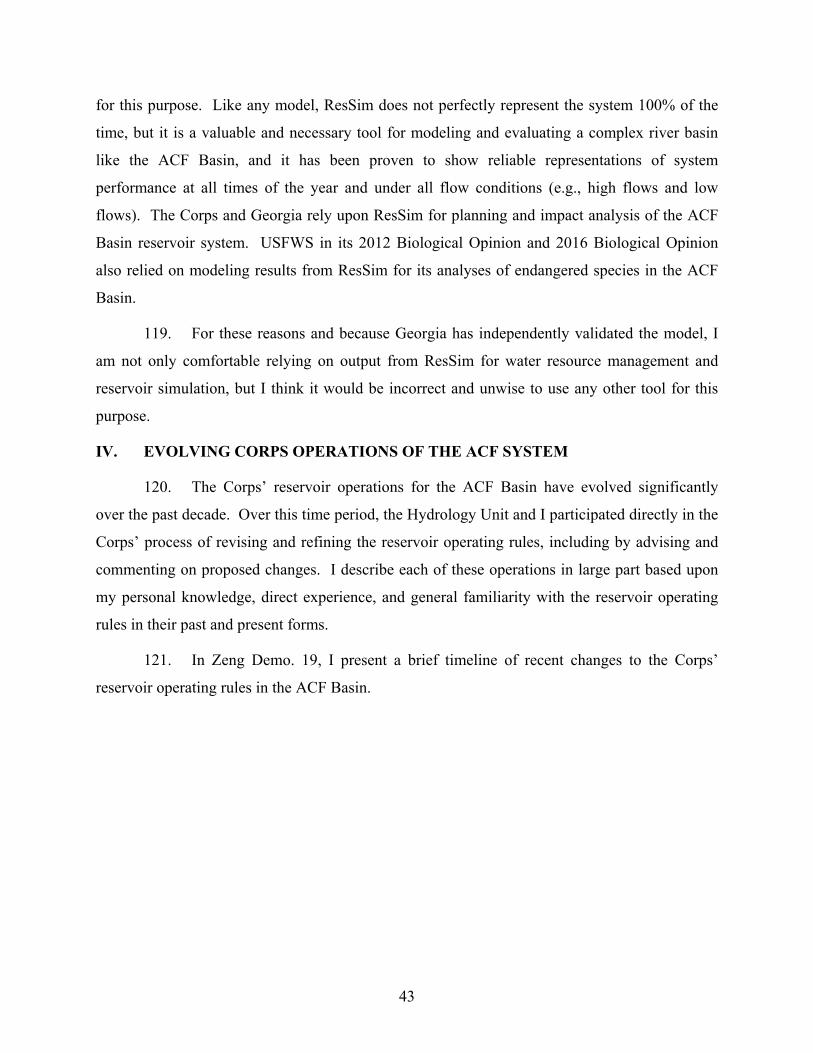
43
for this purpose. Like any model, ResSim does not perfectly represent the system 100% of the
time, but it is a valuable and necessary tool for modeling and evaluating a complex river basin
like the ACF Basin, and it has been proven to show reliable representations of system
performance at all times of the year and under all flow conditions (e.g., high flows and low
flows). The Corps and Georgia rely upon ResSim for planning and impact analysis of the ACF
Basin reservoir system. USFWS in its 2012 Biological Opinion and 2016 Biological Opinion
also relied on modeling results from ResSim for its analyses of endangered species in the ACF
Basin.
119. For these reasons and because Georgia has independently validated the model, I
am not only comfortable relying on output from ResSim for water resource management and
reservoir simulation, but I think it would be incorrect and unwise to use any other tool for this
purpose.
IV. EVOLVING CORPS OPERATIONS OF THE ACF SYSTEM
120. The Corps’ reservoir operations for the ACF Basin have evolved significantly
over the past decade. Over this time period, the Hydrology Unit and I participated directly in the
Corps’ process of revising and refining the reservoir operating rules, including by advising and
commenting on proposed changes. I describe each of these operations in large part based upon
my personal knowledge, direct experience, and general familiarity with the reservoir operating
rules in their past and present forms.
121. In Zeng Demo. 19, I present a brief timeline of recent changes to the Corps’
reservoir operating rules in the ACF Basin.
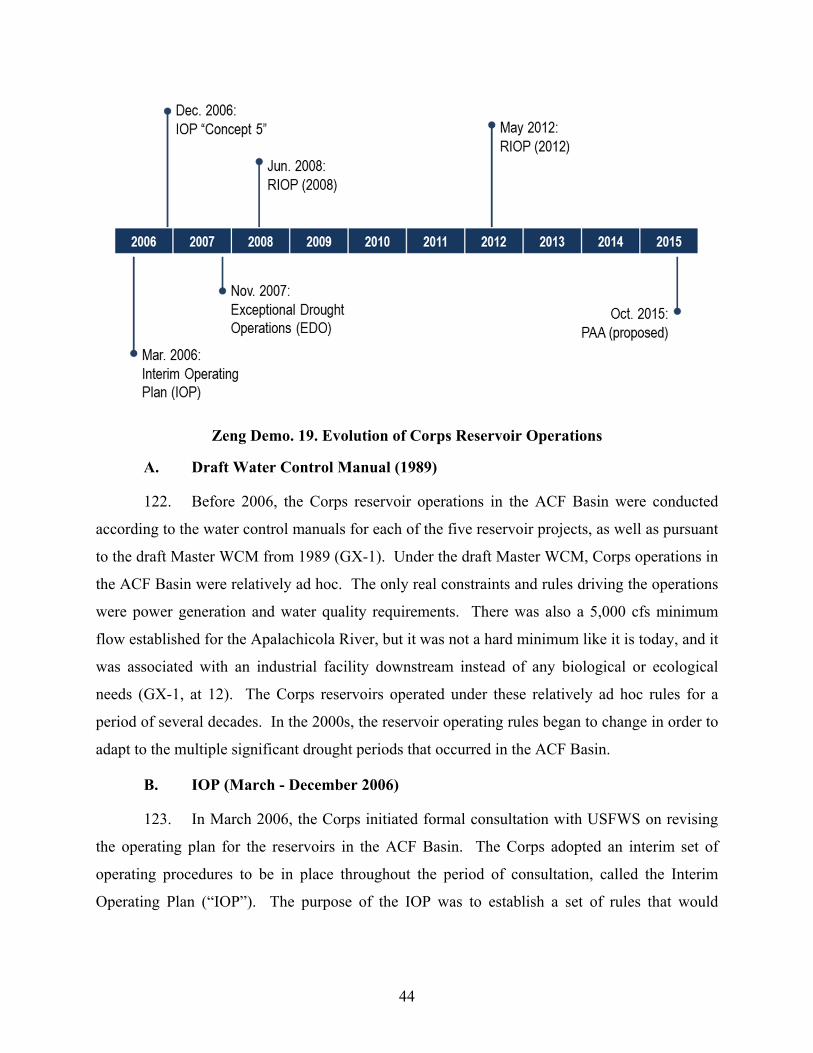
44
Zeng Demo. 19. Evolution of Corps Reservoir Operations
A. Draft Water Control Manual (1989)
122. Before 2006, the Corps reservoir operations in the ACF Basin were conducted
according to the water control manuals for each of the five reservoir projects, as well as pursuant
to the draft Master WCM from 1989 (GX-1). Under the draft Master WCM, Corps operations in
the ACF Basin were relatively ad hoc. The only real constraints and rules driving the operations
were power generation and water quality requirements. There was also a 5,000 cfs minimum
flow established for the Apalachicola River, but it was not a hard minimum like it is today, and it
was associated with an industrial facility downstream instead of any biological or ecological
needs (GX-1, at 12). The Corps reservoirs operated under these relatively ad hoc rules for a
period of several decades. In the 2000s, the reservoir operating rules began to change in order to
adapt to the multiple significant drought periods that occurred in the ACF Basin.
B. IOP (March - December 2006)
123. In March 2006, the Corps initiated formal consultation with USFWS on revising
the operating plan for the reservoirs in the ACF Basin. The Corps adopted an interim set of
operating procedures to be in place throughout the period of consultation, called the Interim
Operating Plan (“IOP”). The purpose of the IOP was to establish a set of rules that would
45
minimize effects on listed species in the Apalachicola River while also meeting the Corps’ other
authorized project purposes.
124. The IOP’s operating rules proved to be inefficient and unsuccessful. In my
experience, the IOP was an irresponsible set of reservoir operations that favored one project
purpose (downstream fish and wildlife) over all the other project purposes. Specifically, the IOP
established needlessly high mandatory flow thresholds for Gulf sturgeon egg spawning in the
Apalachicola River, which limited the amount of basin inflow that could be used to refill the
reservoirs. The mandatory flow thresholds were developed by the USFWS based on just four
data points obtained in a wet year in 2005, and the overwhelming majority of flows within those
ranges was required to be released.26 Under the IOP, the Corps was required to strictly follow
these flow thresholds as if they represented the only ranges within which the endangered species
are protected. These flow thresholds forced the Corps to release a significant amount of water
downstream rather than refilling the reservoirs, leaving the Corps with very limited flexibility to
replenish storage.
125. The impact of the IOP on reservoir storage was devastating. Reservoir storage
was stressed in order to satisfy the mandatory downstream flow requirements. The reservoirs
were unable to refill and recover from the severe drought conditions. In effect, the IOP put
system-wide storage at risk, while seriously restricting the ability of the Corps to satisfy
numerous other project purposes throughout the Basin. The IOP is a case study in what happens
when the operating rules favor one single project purpose (in this case, downstream flow) at the
expense of other project purposes.
C. IOP “Concept 5” (December 2006 - November 2007)
126. By the end of 2006, the Corps had adopted reservoir rules that were more
protective of reservoir storage than the original IOP. The precipitous decline of system storage
resulting from the IOP was so alarming that the Corps realized the excesses of the IOP operation
and was on its way to correct course. Unfortunately, the revisions were not conservative enough
to stop storage from dropping precipitously during extreme and prolonged drought conditions
experienced in the northern part of the Basin in 2007. In 2007, drought conditions lasted from
26 The IOP was also the first iteration of a mandatory, prescriptive 5,000 cfs minimum flow requirement from Woodruff Dam for fish and wildlife purposes.
46
the early part of the year through the end of the year. At its worst, the system had about one-
third of its total conservation storage left. At the same time, West Point and Walter F. George
had little remaining storage. The Corps was in “panic mode,” and there was great concern for
the ability of the reservoirs to provide a reliable water supply for Metro Atlanta.
127. At this time, the Hydrology Unit suggested a number of changes to the IOP
operation to provide a better balance between system storage and downstream flow needs. In
particular, we petitioned for reducing the flow thresholds for the Apalachicola River and
adopting a set of rules to allow for better “sharing” of basin inflow between reservoir storage and
downstream releases. The “sharing” proposal provided that when basin inflow was above a
certain threshold, a particular share of the water could be released downstream for fish and
wildlife considerations, while the other share would go to refilling the reservoirs. In part in
response to these proposals, the Corps revised its rules to implement a 70/30 “sharing” operation
for releases/storage. In other words, the new rules provided that 70% of excess basin inflow
would need to be passed downstream for fish and wildlife, whereas 30% could go to refill the
reservoirs.
D. Exceptional Drought Operations (“EDO”) (November 2007 - June 2008)
128. In light of the experience in the summer and fall of 2007, the Corps had to modify
its operations in response to drought conditions and the consequences of the overly aggressive
IOP. In November 2007, the Corps adopted a significant modification to the IOP, known as the
Exceptional Drought Operations (“EDO”). In essence, the EDO was an emergency response to
the drought conditions and the impact of low-flow conditions on system-wide reservoir storage.
This was the inception of the regime of Drought Operations in place today. I participated in
Georgia EPD’s discussions and consultation with the Corps that preceded these changes.
129. The IOP’s EDO called for a reduction of the minimum flow into the Apalachicola
River from 5,000 cfs to 4,500 cfs in extreme drought.27 The EDO also called for all basin inflow
over 4,500 cfs to be put into storage to the extent possible. Further, the EDO suspended all
ramp-down requirements under drought conditions. The EDO remained in place as the set of
27 In November 2007, the Corps decided to implement a first step of going down to 4,750 cfs, rather than dropping immediately to 4,500 cfs.
47
drought-protective operations for the ACF reservoirs throughout 2008 and well into 2009, when
the drought finally concluded.
130. In November 2007, when the Corps announced the EDO, the USFWS submitted
an amended Biological Opinion, in which it blessed the EDO as not jeopardizing the existence of
the endangered species. The USFWS concluded that the EDO “will not jeopardize the continued
existence of the Gulf sturgeon, fat threeridge, purple bankclimber, and Chipola slabshell” and
“will not destroy or adversely modify proposed critical habitat for the fat threeridge, purple
bankclimber, and Chipola slabshell” (GX-186 at 58).
E. RIOP (June 2008 - May 2012)
131. In June 2008, the Corps replaced the IOP/EDO with the “Revised” IOP, or the
“RIOP.” The RIOP was the product of a federally brokered series of discussions between
Florida, Georgia, Alabama, and the federal government in early 2008, when the ACF Basin was
recovering under the EDO operation, but still deeply impacted by the ongoing drought and the
overly aggressive operations of the IOP. These discussions took place in Atlanta, Florida, and
West Virginia, and were brokered by then-Interior Secretary Dirk Kempthorne.
132. During this discussion, Georgia EPD recommended a 50/50 split between storage
and release when Basin Inflow was above certain thresholds, rather than the existing 70/30 under
the IOP. The thresholds proposed by Georgia were designed to protect the overwhelming
majority of sturgeon spawning habitat, and would protect that habitat at the most economical
level of flow. Florida’s representatives recommended thresholds of their own, including for the
Gulf sturgeon spawning and non-spawning seasons. The Corps adopted a compromise approach.
The Corps agreed with Georgia’s proposal on the 50/50 split between storage/releases, but
adopted Florida’s thresholds for the spawning season. The Corps’ compromise approach in
effect adopted the current set of RIOP rules providing for 50/50 storage/releases and
spawning/non-spawning season flow thresholds.
133. In June 2008, the USFWS blessed the Corps’ RIOP with its Biological Opinion
(GX-232). The RIOP was officially adopted for the federal reservoirs in the ACF Basin. At this
time, the system was still recovering from drought conditions (under the EDO). The drought
operations lasted until spring 2009, when composite conservation storage finally recovered to
Zone 2.
48
F. RIOP (May 2012 - Present)
134. In May 2012, the Corps further revised the 2008 RIOP, creating the 2012 RIOP.
The differences between the 2008 and 2012 RIOP were not very significant. Two notable
revisions included: (1) postponing suspension of Drought Operation until system composite
storage recovers to Zone 1 (as opposed to Zone 2 under the 2008 RIOP) and (2) raising one of
the non-spawning season (June-November) flow thresholds from 8,000 cfs to 10,000 cfs and
revising the range of Maximum Fall Rate accordingly.
135. After formal adoption of the RIOP, it was tested in the 2011-2012 drought, a
significant multi-year event. Under the RIOP, we did not see the significant impact on reservoir
storage that was observed in the multi-year drought conditions from 2006-2008 under the IOP.
This result was the product of the Corps’ adoption of Drought Operations, which went into place
in May 2012. Under Drought Operations, the Corps was able to protect storage much better than
in previous droughts, and the reservoirs did not decline as significantly as in 2007.
G. Water Control Manual Revision
136. In October 2015, the Corps released its Draft Environmental Impact Statement.
The Draft EIS evaluates an array of potential water management alternatives to the existing
operations in the ACF Basin. The DEIS presented the results of the Corps’ preferred alternative
and was based, in part, on Georgia’s 2013 water supply request. In January 2016, Georgia
submitted comments on the DEIS for the Corps’ consideration before the Corps publishes the
final Water Control Manual.
V. TRI-STATE NEGOTIATIONS REGARDING WATER MANAGEMENT IN THE ACF BASIN
A. Negotiation History
137. In 2006, I was appointed by the EPD Director as technical lead for the State of
Georgia in the Tri-State negotiations over water resource management in the ACF Basin. Over
the years, I have spent a significant amount of time meeting with representatives of the State of
Florida and the Corps. Throughout my interactions with Florida during the Tri-State
negotiations, Florida took several positions that made it difficult ever to reach a compromise.
First, Florida would never specify a scientifically justified water or flow level that it believed it
needed for ecological purposes. As a water resource manager, I believe it is always important to
49
tie a targeted flow to an objective criterion, but Florida always refused to specify or quantify
amounts of flow that could be justified with specific purposes. Occasionally, Florida would
entertain the notion of solving Apalachicola River’s channel degradation and associated
ecological impacts with waters in the federal reservoirs, but would still not be able to articulate
what specific issues can be addressed by what magnitude or timing of flows.
138. Instead, Florida principally focused on the lowest level of Lake Lanier that
Georgia might be willing to tolerate, and would have all water above that lake level flow down to
Florida. This presented a number of problems. First, it would have put the reservoirs in
jeopardy and the Army Corps would not have allowed it. Second, Georgia could not agree to
simply flush water out of Lake Lanier without understanding the timing and amount of the flows
and the purposes for which it was being released. My impression throughout these negotiations
was that Florida was focused primarily on causing Georgia pain and did not have a clear idea of
how much water it wanted or how and when it would receive it. Florida did not focus on what
state-line flow it wanted, or what benefits to the ecosystem or to the Apalachicola River or Bay it
was seeking. Instead, Florida’s focus was always primarily on draining storage in the federal
reservoirs, especially Lake Lanier.
139. In addition, I do not recall Florida ever making a proposal to resolve this dispute
that did not include participation of the Corps. Florida consistently looked at the level of Lake
Lanier as the overriding measure of how much water Florida would receive. The Corps is the
only party that can change the target levels for Lake Lanier under varying hydrologic conditions
and it was always understood that Corps approval and participation would be necessary to
achieve a resolution. I have studied the hydrology of the ACF Basin and Corps operations for 16
years and I am not aware of any way to deliver a dependable additional flow above Corps
minima at specific times without the involvement of the Corps, and Florida has never suggested
a way to do so in the many negotiations I have attended.
B. Georgia’s Proposal
140. During the interstate negotiations, Georgia has made numerous proposals to
Florida to attempt to resolve the dispute based on active participation of the Corps. In 2012,
Georgia submitted a proposal to Florida in which we recommended phasing in a 6,000 cfs
minimum flow requirement at the state line to replace the current 5,000 cfs minimum flow
50
requirement. Like Florida’s prior proposals, Georgia’s 2012 proposal also would have required
involvement of the Corps, but Georgia was willing to advocate for the change as part of an
agreed resolution of these disputes.
141. I conducted modeling analysis of the benefit to Florida of ensuring a particular
flow regime into the Apalachicola River. My results showed that changing the RIOP’s minimum
flow requirement to 6,000 cfs in the summer was feasible, if Georgia increased storage during
the wetter spring months. Georgia considered a number of changes in order to implement the
water supply measures. As part of this proposal, Georgia considered bringing Glades Reservoir
online, using indirect potable reuse, developing monthly varying flow requirements to save
storage in Lake Lanier, changing the winter rules curves at West Point and W.F. George to store
more water in the spring, implementing groundwater augmentation in the Flint River, and
developing flow to support reservoirs in the middle reach of the Flint River Basin.
GEORGIA EPD’S ANALYSIS OF NATURAL HYDROLOGY & WATER RESOURCES IN THE ACF BASIN
142. The Hydrology Unit also studies the natural hydrology of the ACF Basin,
including how the hydrology of the Basin has changed over time. Understanding the natural
hydrologic processes is a key aspect of understanding how to manage the resource. It also helps
in understanding how much our consumptive use influences the system by better understanding
the system itself.
143. Fundamental to Georgia EPD’s approach to managing the Basin is a recognition
that the hydrology of the region is not static: it changes. Although consumptive use can have an
impact on water resource conditions in a basin, the Hydrology Unit studies whether and to what
extent observed changes occurring in the basin are attributable to consumptive use, natural
hydrologic changes, or some other factor. The Hydrology Unit therefore studies streamflow
patterns, precipitation (rainfall) patterns, changes in such patterns, and the long-term health and
sustainability of surface water and groundwater resources (e.g., rivers, lakes, aquifers).
I. PRECIPITATION PATTERNS
144. The Hydrology Unit has studied changes in precipitation and precipitation
patterns for the ACF Basin over the past several decades. This analysis was primarily conducted
in response to statements made by Florida during the ACF Compact and Tri-State Litigation
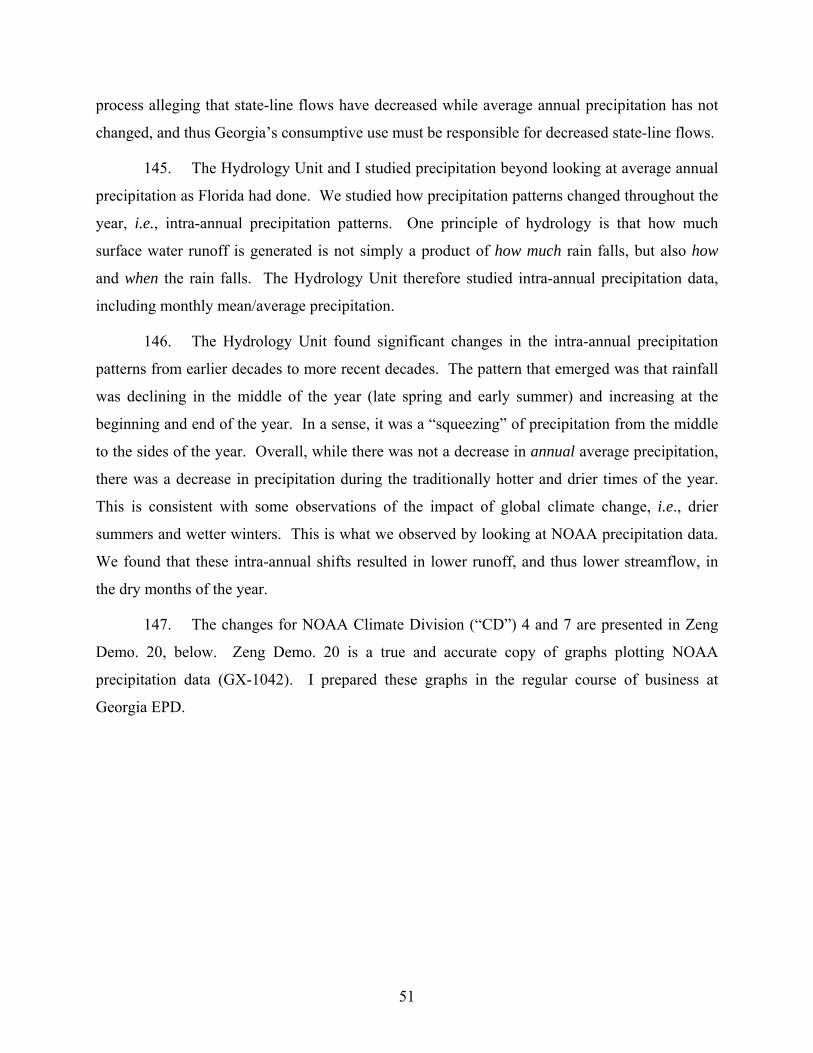
51
process alleging that state-line flows have decreased while average annual precipitation has not
changed, and thus Georgia’s consumptive use must be responsible for decreased state-line flows.
145. The Hydrology Unit and I studied precipitation beyond looking at average annual
precipitation as Florida had done. We studied how precipitation patterns changed throughout the
year, i.e., intra-annual precipitation patterns. One principle of hydrology is that how much
surface water runoff is generated is not simply a product of how much rain falls, but also how
and when the rain falls. The Hydrology Unit therefore studied intra-annual precipitation data,
including monthly mean/average precipitation.
146. The Hydrology Unit found significant changes in the intra-annual precipitation
patterns from earlier decades to more recent decades. The pattern that emerged was that rainfall
was declining in the middle of the year (late spring and early summer) and increasing at the
beginning and end of the year. In a sense, it was a “squeezing” of precipitation from the middle
to the sides of the year. Overall, while there was not a decrease in annual average precipitation,
there was a decrease in precipitation during the traditionally hotter and drier times of the year.
This is consistent with some observations of the impact of global climate change, i.e., drier
summers and wetter winters. This is what we observed by looking at NOAA precipitation data.
We found that these intra-annual shifts resulted in lower runoff, and thus lower streamflow, in
the dry months of the year.
147. The changes for NOAA Climate Division (“CD”) 4 and 7 are presented in Zeng
Demo. 20, below. Zeng Demo. 20 is a true and accurate copy of graphs plotting NOAA
precipitation data (GX-1042). I prepared these graphs in the regular course of business at
Georgia EPD.
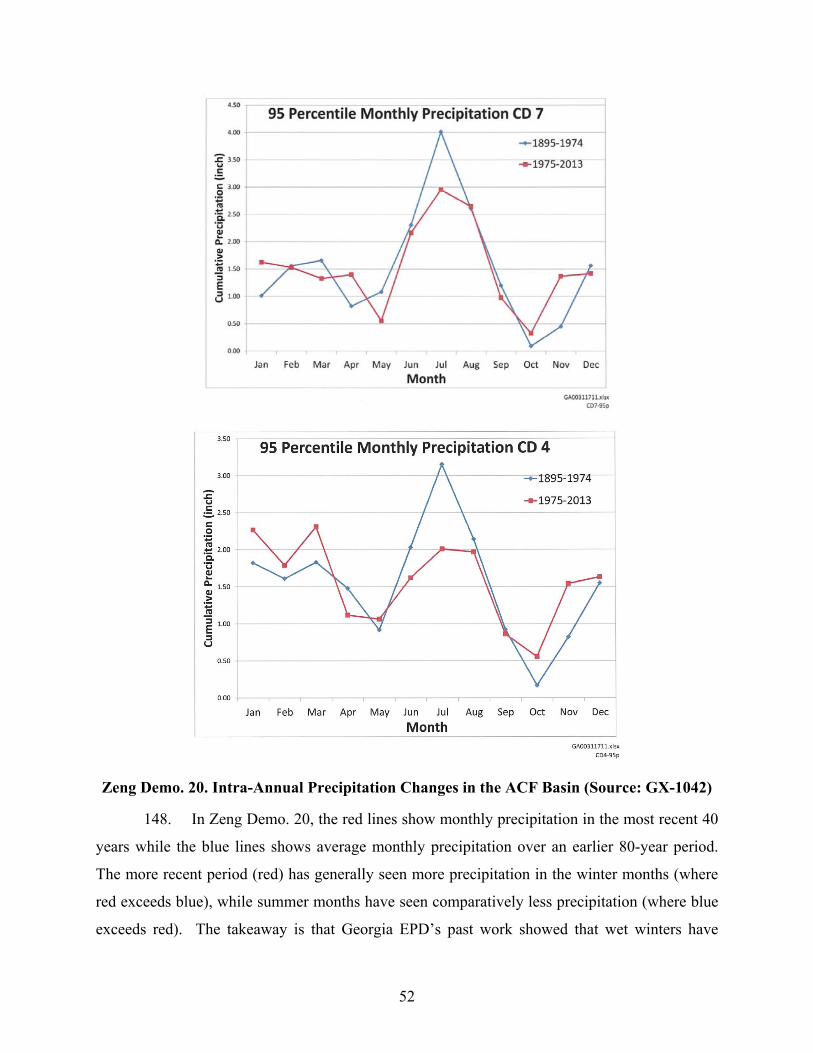
52
Zeng Demo. 20. Intra-Annual Precipitation Changes in the ACF Basin (Source: GX-1042)
148. In Zeng Demo. 20, the red lines show monthly precipitation in the most recent 40
years while the blue lines shows average monthly precipitation over an earlier 80-year period.
The more recent period (red) has generally seen more precipitation in the winter months (where
red exceeds blue), while summer months have seen comparatively less precipitation (where blue
exceeds red). The takeaway is that Georgia EPD’s past work showed that wet winters have
53
gotten wetter and the dry summers have gotten drier by a couple of inches.28 We found that the
reduction in summertime rainfall resulted in lower streamflow in summer. These natural
hydrologic changes, by definition, do not have anything to do with Georgia’s consumptive use.
II. STREAMFLOW CHANGES
149. The Hydrology Unit has also conducted analysis of streamflow patterns in the
ACF Basin. This analysis was largely in response to Florida’s claims during the Tri-State
Litigation process that streamflow in the Apalachicola River has been lower during recent
droughts than previous droughts, and that Georgia’s consumptive use is the reason. The
Hydrology Unit studied this claim and published our results in our comments to the U.S. Senate
Committee on Commerce, Science, and Transportation in 2013 (GX-659). I created the figures
in GX-659 in the regular course of my work at Georgia EPD, and I am familiar with the contents
of this document.
150. The Hydrology Unit found that the facts did not support this assertion. The
Hydrology Unit found that streamflows have been declining throughout the ACF Basin and other
basins in Florida for reasons that have nothing to do with water consumption in Georgia. The
trend of declining river flow is observed in other rivers throughout the region.
151. Zeng Demo. 21 below is a true and accurate copy of Figure 3 from GX-659. This
figure shows that the same trend observed in the Apalachicola River is observed in other rivers
and tributaries in the region. The figure below shows seven gages, all of which were normalized
by drainage area so the trends could be seen on a single plot.
28 To have a perspective of the recent decline in precipitation in the middle months of the year, a simple calculation can be performed. One inch less precipitation over an area of 10,000 square miles of drainage area (17,200 square miles at the USGS Chattahoochee gage) is equivalent to 533 thousand acre-feet (about half of Lake Lanier conservation storage) less water entering the basin. Spread over a month, it is equivalent to 8,965 cfs.
54
Zeng Demo. 21 Declining Streamflow in Other Rivers in Northwest Florida Unaffected by Georgia’s Consumptive Use (Source: GX-659)
152. As shown by Zeng Demo. 21, streamflows throughout the region show a general
declining trend over the period from 1972 to the present. Once again, we found that this is
entirely unrelated to consumptive use in Georgia.
III. INCREMENTAL FLOW
153. As part of the Hydrology Unit’s analysis of stream gage records in the region, we
determined that the downward trend in streamflow observed in other rivers in the region is more
pronounced in the Apalachicola River (almost entirely within Florida) than elsewhere. In other
words, the Hydrology Unit’s prior work showed that flows in the Apalachicola entirely on the
Florida side of the line are declining at a faster rate than other river stretches in the region.
154. To investigate this, the Hydrology Unit studied the difference between the
Chattahoochee gage (the northernmost gage on the Florida side) and the Sumatra gage (the last
gage before Apalachicola Bay). This difference in flow recorded at the two gages reflects the
amount of precipitation that is turned into surface water runoff through a hydrologic process that
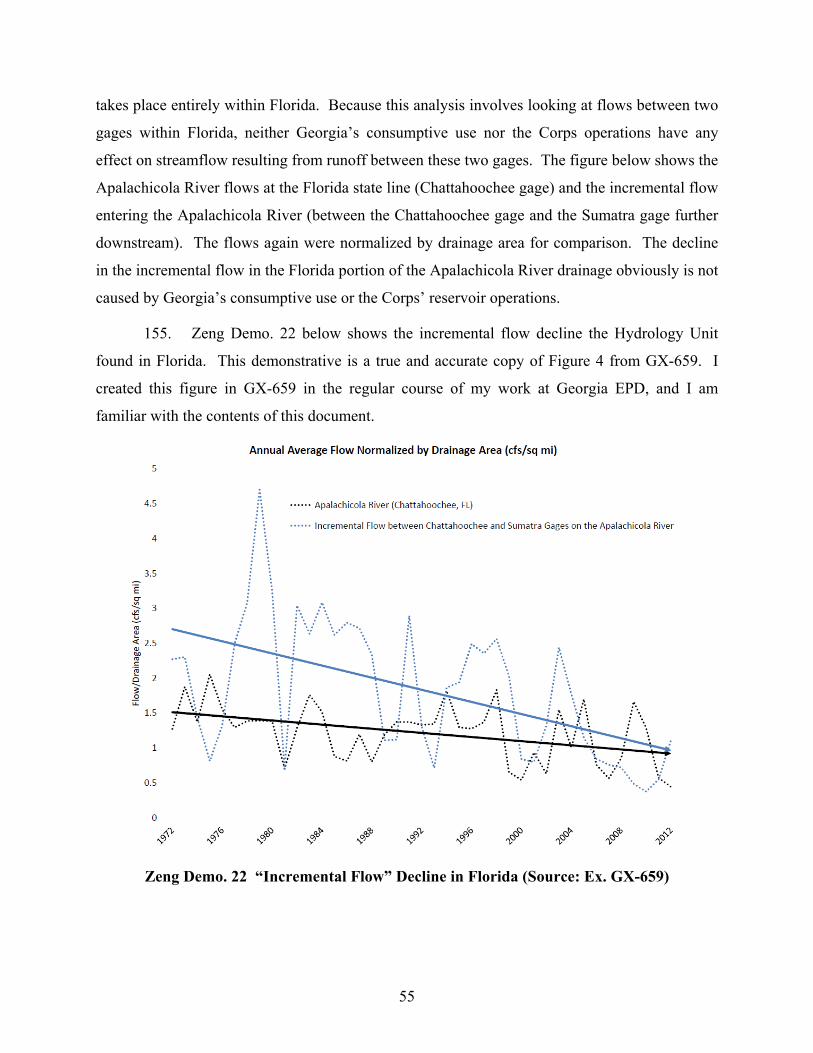
55
takes place entirely within Florida. Because this analysis involves looking at flows between two
gages within Florida, neither Georgia’s consumptive use nor the Corps operations have any
effect on streamflow resulting from runoff between these two gages. The figure below shows the
Apalachicola River flows at the Florida state line (Chattahoochee gage) and the incremental flow
entering the Apalachicola River (between the Chattahoochee gage and the Sumatra gage further
downstream). The flows again were normalized by drainage area for comparison. The decline
in the incremental flow in the Florida portion of the Apalachicola River drainage obviously is not
caused by Georgia’s consumptive use or the Corps’ reservoir operations.
155. Zeng Demo. 22 below shows the incremental flow decline the Hydrology Unit
found in Florida. This demonstrative is a true and accurate copy of Figure 4 from GX-659. I
created this figure in GX-659 in the regular course of my work at Georgia EPD, and I am
familiar with the contents of this document.
Zeng Demo. 22 “Incremental Flow” Decline in Florida (Source: Ex. GX-659)
56
156. As shown in Zeng Demo. 22, the total amount of flow being created in the
drainage area between the Chattahoochee and Sumatra gages entirely within Florida
(“incremental flow”) has been declining over time.
157. I am aware that the same issue was independently studied by two of Georgia’s
experts for this litigation, Dr. Bedient and Dr. Sorab Panday, and that they likewise found similar
results as the Hydrology Unit.
158. Georgia EPD brought this sharper decline in runoff and incremental flow inside
the Florida portion of the ACF Basin to Florida’s attention as early as August 2013. I am not
aware of any explanation offered by Florida as to the cause of the “incremental flow” decline in
the Apalachicola River.
IV. AUTHENTICATION OF ADDITIONAL TRIAL EXHIBITS
159. JX-46 is a true and accurate copy of the HEC-ResSim Reservoir System
Simulation User’s Manual Version 3.1 (May 2013). I am familiar with this document through
my work as head of Georgia EPD’s Hydrology Unit. A copy of the document has been
maintained by Georgia EPD in the regular course of business.
160. JX-72 is a true and accurate copy of the 2012 USFWS Biological Opinion on the
U.S. Army Corps of Engineers Updated of the Water Control Manual for the ACF Basin. I am
familiar with this document through my work as head of Georgia EPD’s Hydrology Unit. A
copy of the document has been maintained by Georgia EPD in the regular course of business.
161. JX-86 is a true and accurate copy of the State of Georgia’s Water Supply Request
to the Corps dated January 2013. I am familiar with this document through my work as head of
Georgia EPD’s Hydrology Unit, including my role in authoring parts of this document. It was
made as part of Georgia EPD’s regular practice and was maintained in the course of its regularly
conducted business.
162. JX-95 is a true and accurate copy of the Derivation of Water Demands in
Georgia’s January 2013 ACF Water Supply Request to the Army Corps of Engineers -
Memorandum from Wei Zeng to File. I created this document through my work as head of
Georgia EPD’s Hydrology Unit. It was made as part of Georgia EPD’s regular practice and was
maintained in the course of its regularly conducted business.
57
163. JX-112 is a true and accurate copy of Georgia’s response to the Corps’ request for
more information regarding Georgia’s 2013 Water Supply Request. I am familiar with this
document through my work as head of Georgia EPD’s Hydrology Unit. It was made as part of
Georgia EPD’s regular practice and was maintained in the course of its regularly conducted
business.
164. JX-113 is a true and accurate copy of the HEC ResSim Modeling Report
maintained by the Hydrology Unit in the regular course of business. I am familiar with this
document through my work as head of Georgia EPD’s Hydrology Unit. A copy of the document
has been maintained by Georgia EPD in the regular course of business.
165. JX-124 is a true and correct copy of the Corps’ DEIS, published October 2015. I
am familiar with this document and associated appendices, models, and modeling files, based on
my work with the Corps as head of the Hydrology Unit. A copy of the DEIS is maintained by
the Hydrology Unit in the regular course of business.
166. JX-126 is a true and and accurate copy of the State of Georgia’s revised Water
Supply Request to the Corps dated December 2015. I am familiar with this document through
my work as head of Georgia EPD’s Hydrology Unit, including my role in authoring part of this
document. It was made as part of Georgia EPD’s regular practice and was maintained in the
course of its regularly conducted business.
167. JX-164 is a true and accurate copy of technical evaluation of Georgia’s revised
Water Supply Request to the Corps dated December 2015. I am familiar with this document
through my work as head of Georgia EPD’s Hydrology Unit, including my role in authoring part
of this document. It was made as part of Georgia EPD’s regular practice and was maintained in
the course of its regularly conducted business.
168. JX-168 is a true and accurate copy of the 2016 USFWS Biological Opinion on the
U.S. Army Corps of Engineers Updated of the Water Control Manual for the ACF Basin. I am
familiar with this document through my work as head of Georgia EPD’s Hydrology Unit. A
copy of the document has been maintained by Georgia EPD in the regular course of business.
169. GX-10 is a true and accurate copy of Georgia’s 2000 Water Supply Request to the
Corps. I am familiar with this document through my work as head of Georgia EPD’s Hydrology
58
Unit. I am familiar with this document through my work as head of Georgia EPD’s Hydrology
Unit. A copy of the document has been maintained by Georgia EPD in the regular course of
business.
170. GX-150 is a true and accurate copy of the HEC-ResSim Reservoir System
Simulation User’s Manual Version 3.0 (April 2007). I am familiar with this document through
my work as head of Georgia EPD’s Hydrology Unit. A copy of the document has been
maintained by Georgia EPD in the regular course of business.
171. GX-186 is a true and accurate copy of USFWS’s Amended Biological Opinion
and Conference Report on the Corps’ Exceptional Drought Operations for the Interim Operating
Plan for Jim Woodruff Dam and the Associated Releases to the Apalachicola River. I am
familiar with this document through my work as head of Georgia EPD’s Hydrology Unit. A
copy of the document has been maintained by Georgia EPD in the regular course of business.
172. GX-417 is a true and correct copy of a memorandum from Chief Counsel of the
Corps to the Chief of Engineers regarding the authority to provide for water supply from Lake
Lanier, dated June 25, 2012. I am familiar with this document through my work as head of
Georgia EPD’s Hydrology Unit. A copy of the document has been maintained by Georgia EPD
in the regular course of business.
173. GX-543 is a true and correct copy of a press release from the Corps announcing
the suspension of drought operations in the ACF Basin. I am familiar with this document
through my work as head of Georgia EPD’s Hydrology Unit. A copy of the document has been
maintained by Georgia EPD in the regular course of business.
174. GX-580 is a true and accurate copy of a presentation prepared by the Hydrology
Unit regarding projected water withdrawals and discharges per Georgia’s 2013 Water Supply
Request. It was created as part of Georgia EPD’s regular practice and was maintained in the
course of its regularly conducted business.
175. GX-608 is a true and correct copy of an email sent by myself to the Corps Mobile
District, the Corps district responsible for day-to-day management of the reservoirs in the ACF
Basin, on June 11, 2013. GX-609 is a copy of the attachment to the email, containing Georgia’s
consumptive use estimates. I drafted this document as part of my regular practice as head of
59
Georgia EPD’s Hydrology Unit. The email and attachment were maintained by Georgia EPD in
the regular course of business.
176. GX-628 is a true and accurate copy of a memo I drafted regarding derivation of
water demands in Georgia’s 2013 ACF Water Supply Request. I created this document through
my work as head of Georgia EPD’s Hydrology Unit. It was made as part of Georgia EPD’s
regular practice and was maintained in the course of its regularly conducted business.
177. GX-829 is a true and accurate copy of a Technical Memorandum I sent to Judson
Turner, dated January 29, 2016. I drafted this document as part of my work as head of Georgia
EPD’s Hydrology Unit. It was made as part of Georgia EPD’s regular practice and was
maintained in the course of its regularly conducted business.
178. GX-830 through GX-845 are true and accurate copies of shape files for the 2016
Wetted Acreage Database. I am familiar with these documents through my work as head of
Georgia EPD’s Hydrology Unit. They were made as part of Georgia EPD’s regular practice and
was maintained in the course of its regularly conducted business.
179. GX-924 is a true and accurate copy of 2012 and 2013 ACF Basin Composite
Conservation and Flood Storage from the Corps. These figures are located at
http://water.sam.usace.army.mil/acfconstorage12.pdf and
http://water.sam.usace.army.mil/acfconstorage13.pdf. I am familiar with these documents
through my work as head of Georgia EPD’s Hydrology Unit.
180. GX-936 is a spreadsheet summarizing Georgia’s consumptive use in the ACF
Basin from 1975-2011. I am familiar with this document through my work as head of Georgia
EPD’s Hydrology Unit. It was made as part of Georgia EPD’s regular practice and was
maintained in the course of its regularly conducted business.
181. GX-937 is spreadsheet summarizing Georgia’s consumptive use in the ACF Basin
from 2008-2011. I am familiar with this document through my work as head of Georgia EPD’s
Hydrology Unit. It was made as part of Georgia EPD’s regular practice and was maintained in
the course of its regularly conducted business.
182. GX-1095 is a true and accurate copy of U.S. Army Corps of Engineers,
Hydrologic Engineering Center, “HEC-ResSim,” http://www.hec.usace.army.mil/software/hec-
60
ressim/. I am familiar with this document through my work as head of Georgia EPD’s
Hydrology Unit. A copy of the document has been maintained by Georgia EPD in the regular
course of business.
183. GX-1231 is a true and accurate copy of USACE, Hydrologic Engineering Center,
http://www.hec.usace.army.mil/. I am familiar with this document through my work as head of
Georgia EPD’s Hydrology Unit. A copy of the document has been maintained by Georgia EPD
in the regular course of business.