Embed Size (px)
DESCRIPTION
In the Shoes of a Fed Policy-Maker Federal Reserve Bank of New York What About Productivity?. Raymond W. Stone Stone & McCarthy Research Associates August 16, 2007. What Is Productivity?. Productivity is a measure of the efficiency of the labor force. - PowerPoint PPT Presentation
Citation preview
In the Shoes of a Fed Policy-MakerFederal Reserve Bank of New York
What About Productivity?
Raymond W. StoneStone & McCarthy Research Associates
August 16, 2007
What Is Productivity?
Productivity is a measure of the efficiency of the labor force.
Productivity is a function of a variety of factors including the skill set of workers (education), and the state of the tools available to these workers (technology)
How Do We Measure Productivity?
Productivity is measured in terms of units of output per hour of labor input
Productivity = Output/Hours
A proxy for productivity might be GDP per Hour Worked
Productivity Proxy = GDP/Hours
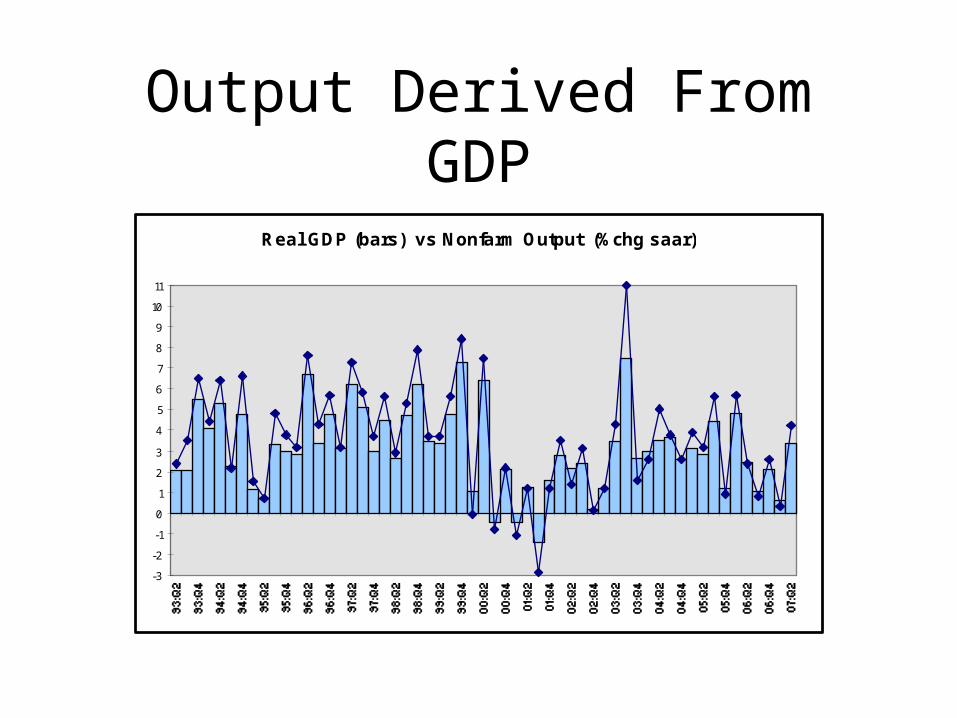
Output Derived From GDP
Real GDP (bars) vs Nonfarm Output (%chg saar)
-3
-2
-1
0
1
2
3
4
5
6
7
8
9
10
11
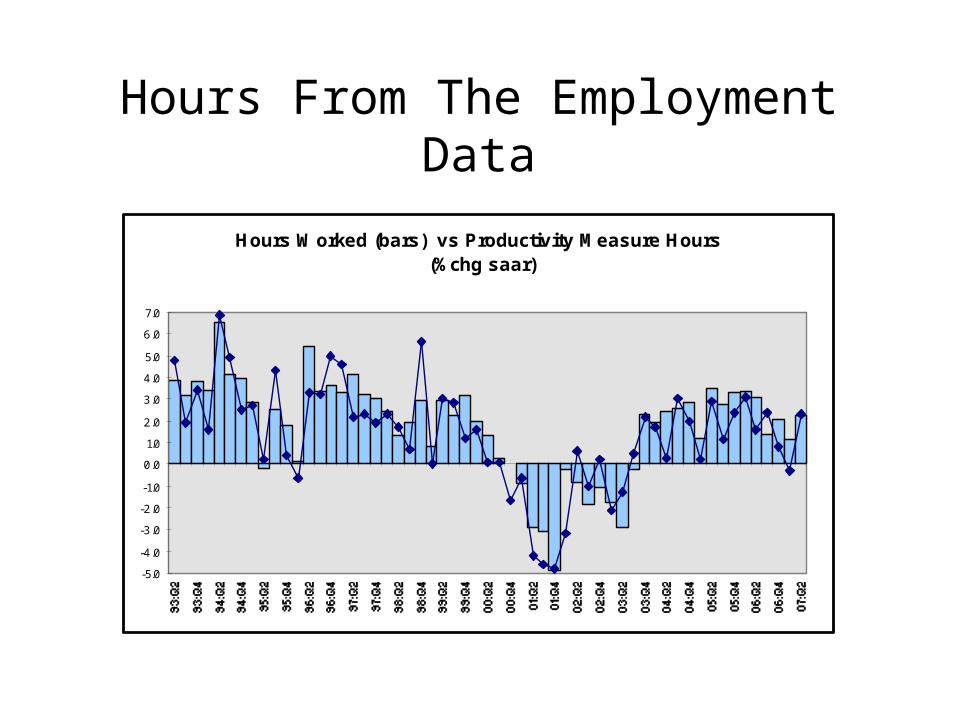
Hours From The Employment Data
Hours Worked (bars) vs Productivity Measure Hours (%chg saar)
-5.0
-4.0
-3.0
-2.0
-1.0
0.0
1.0
2.0
3.0
4.0
5.0
6.0
7.0
Why Do Policy-Makers Care About Productivity?
• Productivity Growth in Combination with Labor Force Growth Determines the Economy’s Trajectory of “Potential GDP”, the Speed Limit for Economic Growth
• Productivity Growth in Combination with Hourly Compensation Costs Determines “Unit Labor Costs”, a Key Factor Underpinning the Prospects for Inflation
• Productivity is a Critical Variable Influencing the Fed’s Ability to Fulfill the Dual Mandate of Maximum Sustainable Growth and Price Stability
Productivity and Maximum Sustainable Growth
The Trajectory of “Potential GDP” is Equal to the Growth Rate of the Labor Force Plus the
Growth Rate of Productivity
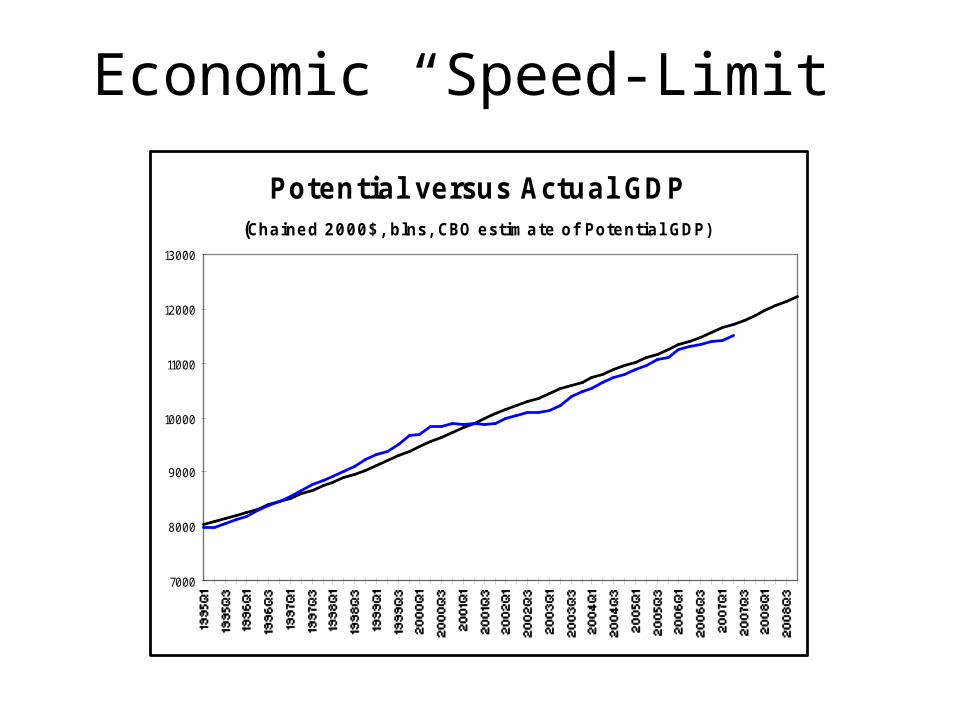
Economic “Speed-Limit”
Pot ent ia l versus Act ua l GDP(Cha ine d 2 0 0 0 $ , b lns, CBO e st im a te of Pote nt ia l GDP)
7000
8000
9000
10000
11000
12000
13000
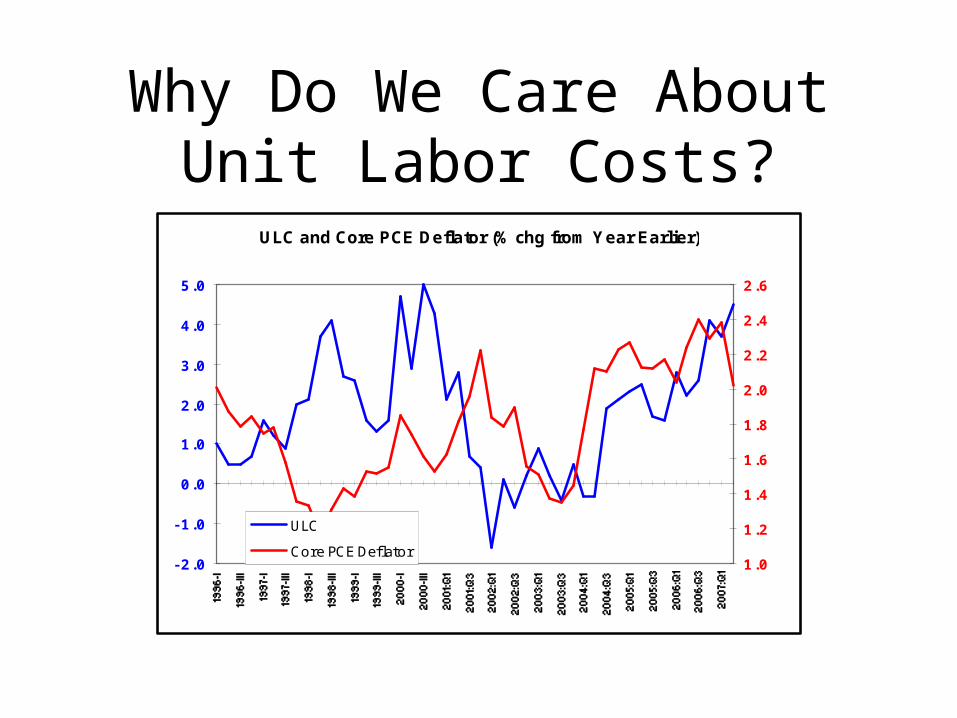
Why Do We Care About Unit Labor Costs?
ULC and Core PCE Deflator (% chg from Year Earlier)
- 2 .0
- 1 .0
0 .0
1 .0
2 .0
3 .0
4 .0
5 .0
1 .0
1 .2
1 .4
1 .6
1 .8
2 .0
2 .2
2 .4
2 .6
ULC
Core PCE Deflator
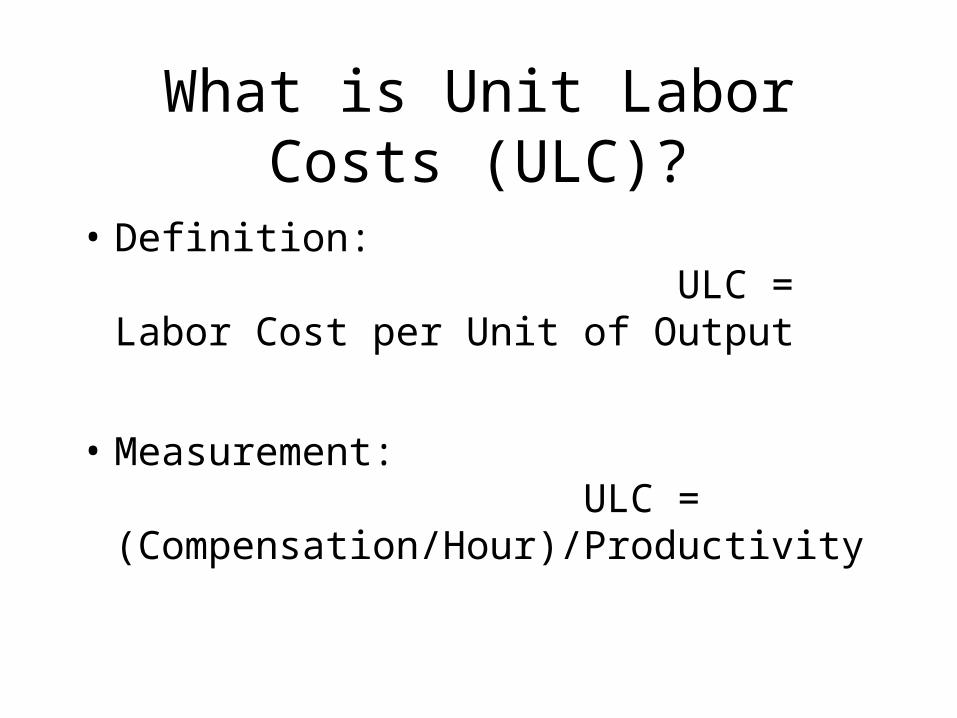
What is Unit Labor Costs (ULC)?
• Definition: ULC = Labor Cost per Unit of Output
• Measurement: ULC = (Compensation/Hour)/Productivity
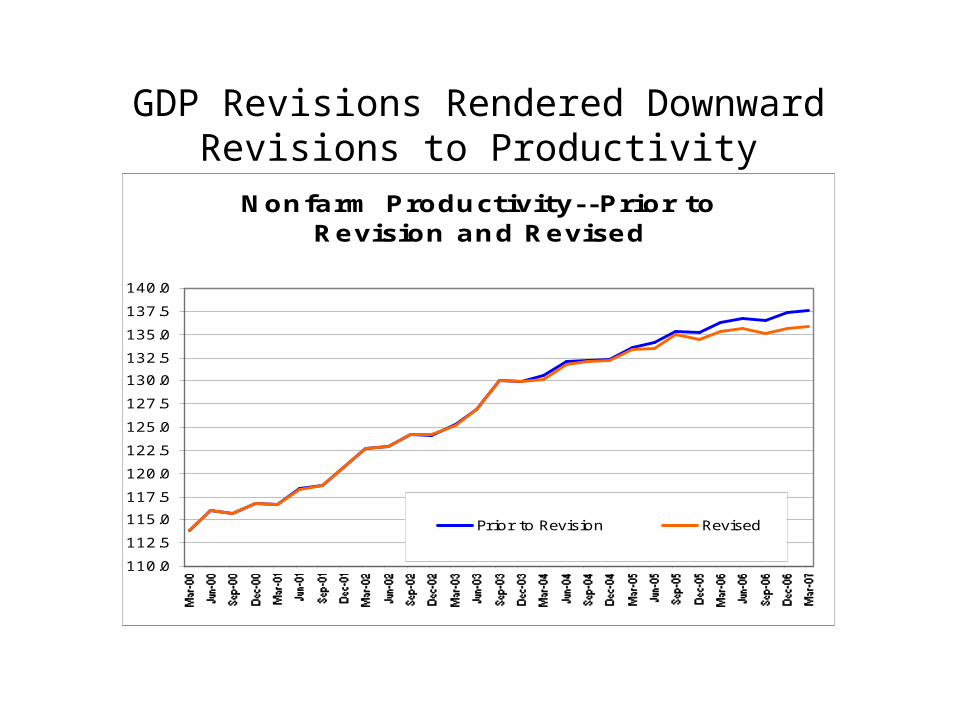
GDP Revisions Rendered Downward Revisions to Productivity
Nonfarm Product ivit y- - Prior t o Revision and Revised
110.0
112.5
115.0
117.5
120.0
122.5
125.0
127.5
130.0
132.5
135.0
137.5
140.0
Pr ior to Revision Revised
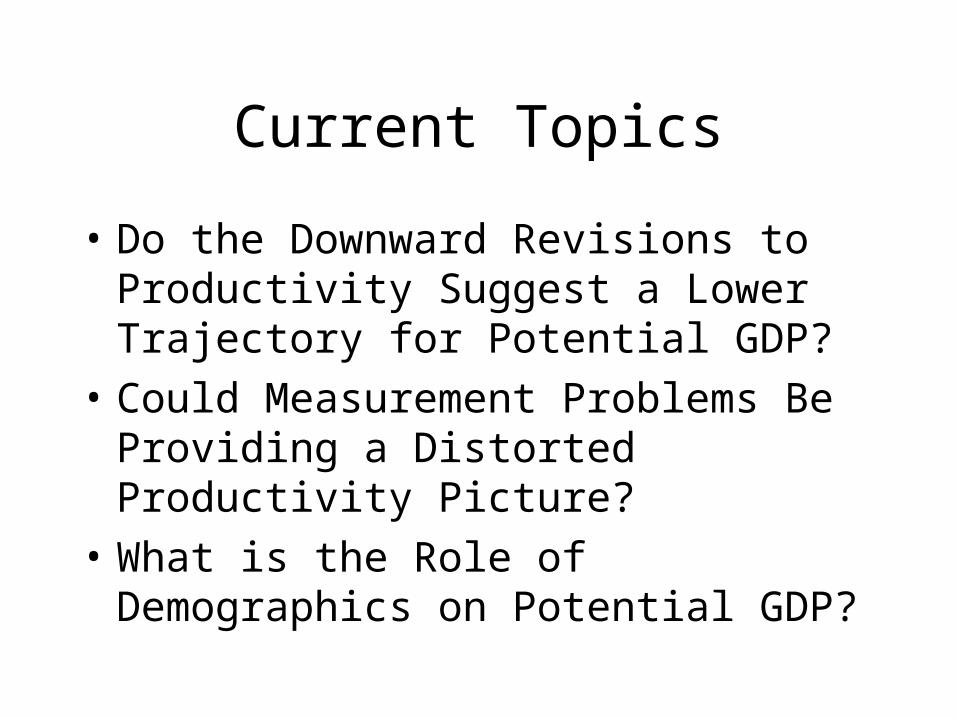
Current Topics
• Do the Downward Revisions to Productivity Suggest a Lower Trajectory for Potential GDP?
• Could Measurement Problems Be Providing a Distorted Productivity Picture?
• What is the Role of Demographics on Potential GDP?
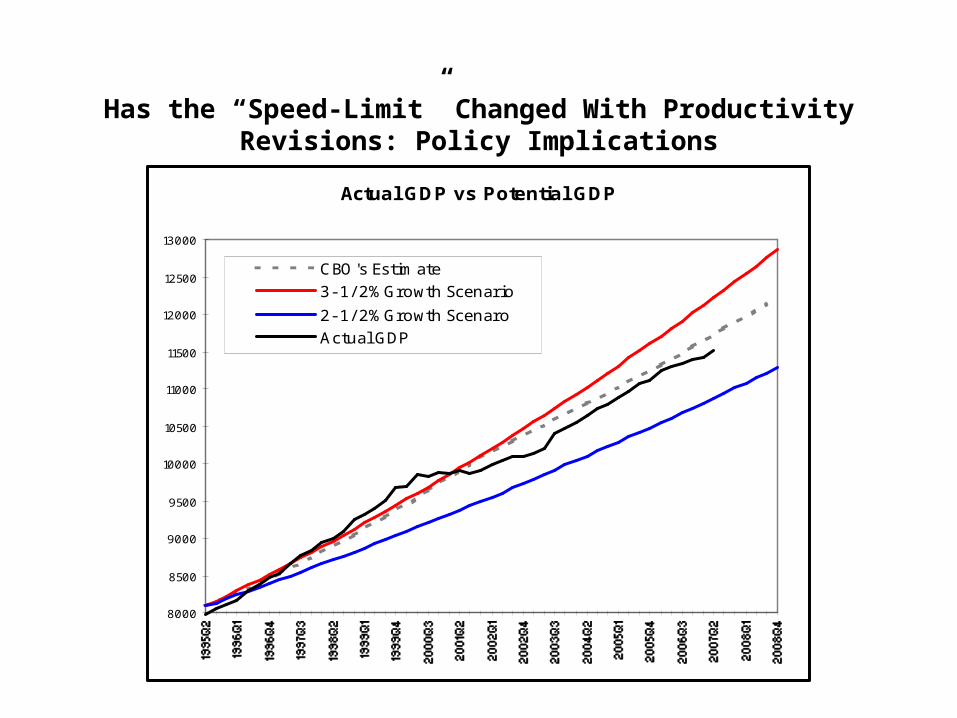
Has the “Speed-Limit” Changed With Productivity Revisions: Policy Implications
Actual GDP vs Potential GDP
8000
8500
9000
9500
10000
10500
11000
11500
12000
12500
13000
CBO's Estim ate
3- 1/ 2% Growth Scenar io
2- 1/ 2% Growth Scenaro
Actual GDP
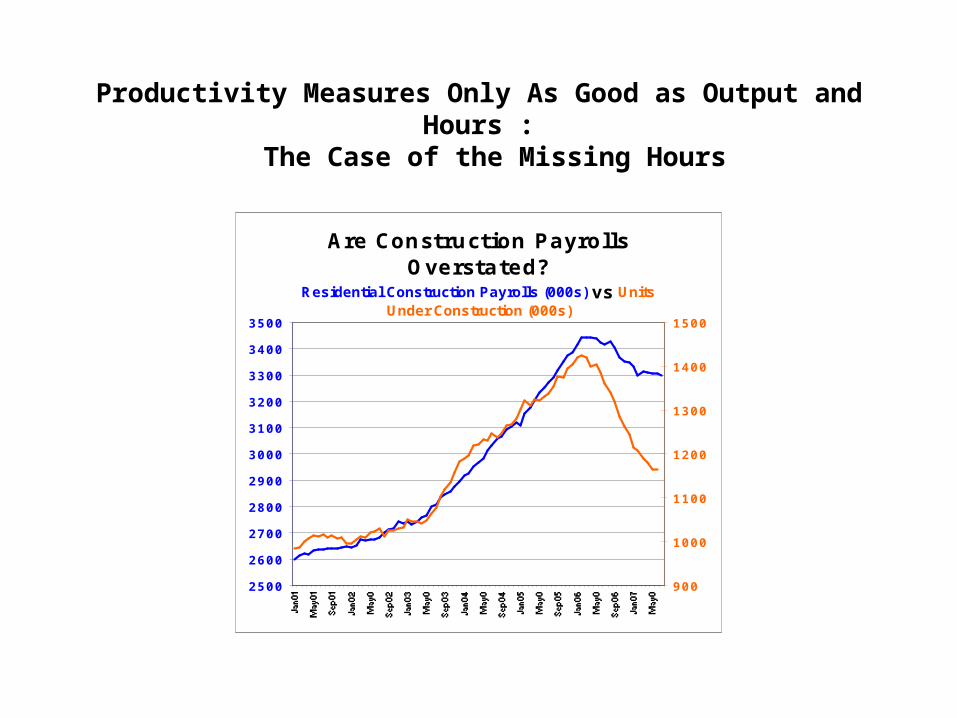
Productivity Measures Only As Good as Output and Hours : The Case of the Missing Hours
Are Const ruct ion Payrolls Oversta ted?
Residential Construction Payrolls (000s) vs Units Under Construction (000s)
2 5 0 0
2 6 0 0
2 7 0 0
2 8 0 0
2 9 0 0
3 0 0 0
3 1 0 0
3 2 0 0
3 3 0 0
3 4 0 0
3 5 0 0
9 0 0
1 0 0 0
1 1 0 0
1 2 0 0
1 3 0 0
1 4 0 0
1 5 0 0
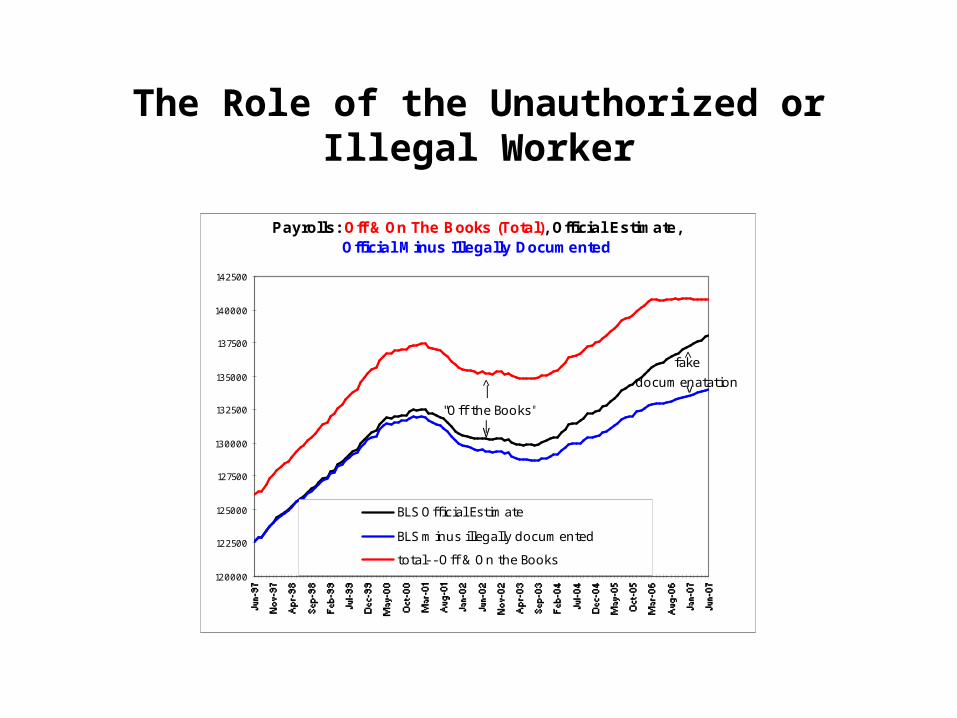
The Role of the Unauthorized or Illegal Worker
Payrolls: Off & On The Books (Total), Official Estimate, Official Minus Illegally Documented
120000
122500
125000
127500
130000
132500
135000
137500
140000
142500
BLS Official Estim ate
BLS m inus illegally docum ented
total- - Off & On the Books
^
V|
|
"Off the Books"
^
v
fake
docum enatation
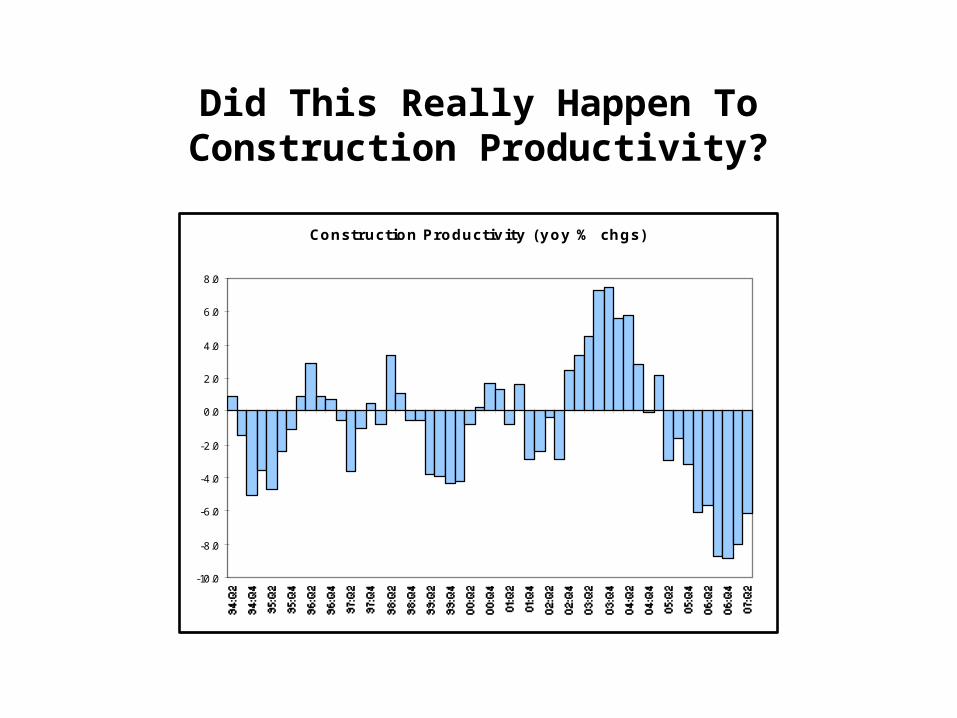
Did This Really Happen To Construction Productivity?
Constr uct ion Pr oduct iv ity ( y oy % chgs)
-10.0
-8.0
-6.0
-4.0
-2.0
0.0
2.0
4.0
6.0
8.0
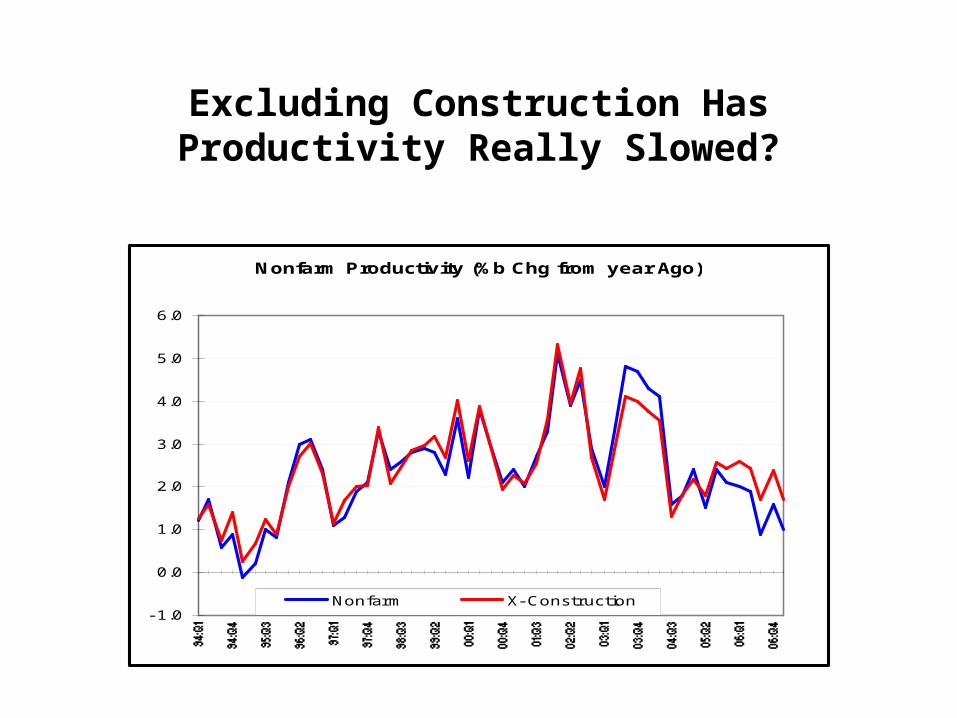
Excluding Construction Has Productivity Really Slowed?
Nonfarm Productivity (%b Chg from year Ago)
- 1.0
0.0
1.0
2.0
3.0
4.0
5.0
6.0
Nonfarm X- Construction
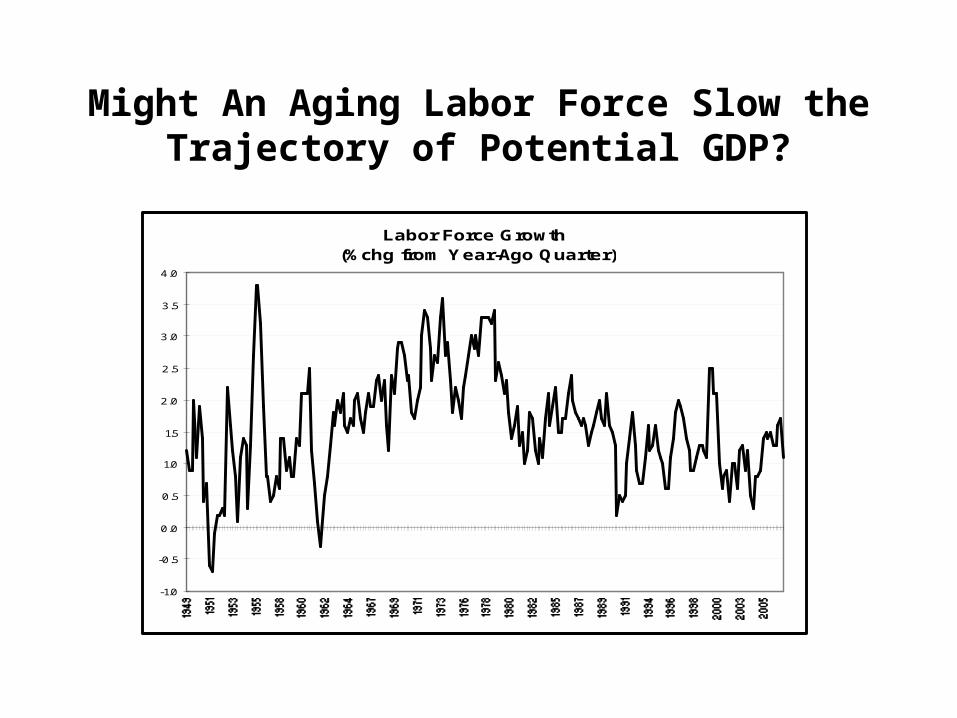
Might An Aging Labor Force Slow the Trajectory of Potential GDP?
Labor Force Growth (%chg from Year-Ago Quarter)
-1.0
-0.5
0.0
0.5
1.0
1.5
2.0
2.5
3.0
3.5
4.0