Embed Size (px)
Citation preview

FI-1
Chapter FI (Petroleum Occurrence and Timing of Migration)
EVIDENCE FOR PETROLEUM OCCURRENCE AND TIMINGOF MIGRATION: PETROLEUM FLUID INCLUSIONS, DEADOIL, STAINS, AND SEEPS
by Robert C. Burruss1
in The Oil and Gas Resource Potential of the 1002 Area, Arctic NationalWildlife Refuge, Alaska, by ANWR Assessment Team, U. S. GeologicalSurvey Open File Report 98-34.
1999
1 U.S. Geological Survey, MS 956, Reston, VA 20192
This report is preliminary and has not been reviewed for conformity with U.S. Geological Survey editorialstandards (or with the North American Stratigraphic Code). Use of trade, product, or firm names is fordescriptive purposes only and does not imply endorsement by the U. S. Geological Survey.

FI-2
TABLE OF CONTENTS
ABSTRACTINTRODUCTIONGEOLOGIC SETTINGMETHODS AND SAMPLESRESULTS
Distribution of samplesFluid inclusion petrography
Inherited vs. authigenic petroleum fluid inclusionsCrack-seal textures
Fluid inclusion temperaturesFluorescence color of fluid inclusions
DISCUSSIONGeneral aspects of timing of migrationTiming of migration in individual plays
Ellesmerian Thrust Belt Play, Eastern ANWR, at Leffingwell Ridge
Ellesmerian Thrust Belt Play, Kemik and Kavik Gas Field analogs
Thin-skinned Thrust-Belt PlayThin-skinned Thrust-Belt Play
CONCLUSIONSACKNOWLEDGMENTSREFERENCES
TABLESFI1. ANWR localities with indications of petroleum as fluid inclusions,
stains, seeps, and dead oilFI2. Fluid inclusion temperature measurements, outcrop samplesFI3. Fluid inclusion temperature measurements, subsurface core samples
FIGURESFI1. Locations of samples with indications of oil and gas as seeps, stains,
dead oil, and oil and gas fluid inclusions, with contours of vitrinitereflectance.
FI2. Oil seep at Angun Point, within the 1002 area of ANWR.FI3. Examples of oil-stained outcrops adjacent to the 1002 area of ANWR.FI4. Examples of dead oil (pyrobitumen) in Sadlerochit Group sediments,
Kavik Gas Field.

FI-3
FI5. Photomicrographs of oil inclusions in isolated grains in a thin section.FI6. Photomicrographs of oil fluid inclusions in authigenic quartz cement.FI7. Oil inclusions in crack-seal texture in fracture-filling quartz cement in
Kemik sandstone.FI8. Quartz fiber veins with gas-rich fluid inclusions in crack-seal textures
and later cross-cutting microfractures.FI9. API gravity inferred from fluorescence color of fluid inclusions in
samples from outcrops.

FI-4
ABSTRACT
Geologic constraints on the timing of oil and gas migration are evaluatedfrom evidence of the areal and stratigraphic distribution of hydrocarbons asseeps, stains, dead oil, and fluid inclusions. The petrographic setting andtemperature measurements on fluid inclusions combined with apatite fissiontrack analysis of host rocks places additional limits on the timing ofmigration. The most recent oil migration is documented by seeps ofbiodegraded oil along the coast of northeastern ANWR at Angun Point andManning Point. The next oldest stage of hydrocarbon migration is related tothe 20 to 25 Ma deformation associated with uplift of the SadlerochitMountains and formation of traps at the Kavik and Kemik gas fields wherean initial oil charge to Sadlerochit Group sediments was replaced by a gascharge. Oil migration in the Kemik Sandstone in the Ignek Valley occurred atabout 33 Ma to possibly as old as 45 Ma. Gas migration is linked to theformation of the Ellesmerian Thrust Belt in eastern ANWR by methane-richinclusions in crack-seal textures in fractures at Leffingwell Ridge. Gascharged fracture porosity in these rocks at depths of about 7 km. andtemperatures of 200 to 220 oC at about 45 Ma.
The occurrence of dead oil in deformed sandstones exposed at the surface andthe presence of gas and condensate fluid inclusions in fracture filling cementsin outcrop suggests that petroleum traps were once widespread throughout thefrontal outcrops of the Brooks Range in northern ANWR. These traps eitherlost hydrocarbon charge by remigration in the subsurface during deformationand uplift, or were breached by erosion and the hydrocarbons lost from thepetroleum systems by seeps at some time following uplift of the Sadlerochitand Shublik Mountains about 20 Ma.
INTRODUCTION
A key factor in assessing the petroleum resources of frontier areas is thetiming of oil and gas migration relative to trap formation. In tectonicallydeformed areas, the distribution of petroleum as oil stains, dead oil, and oiland gas fluid inclusions can reveal the distribution of oil and gas reservoirsthat were uplifted, breached, and presently exposed at the surface. Wherethrust tectonics uplifted reservoirs that are breached by erosion, it is possiblethat detrital sediment grains preserve a record of these earlier petroleum traps

FI-5
as fluid inclusions or dead oil within the grains. Finally, where fracturing andcementation associated with deformation occurs, petroleum fluid inclusionstrapped in cements provides direct evidence of the timing of petroleummigration relative to deformation. If there are adequate constraints on thegeologic age of diagenesis and deformation, it is possible to place petroleummigration in an absolute geologic time frame (Burruss, Cercone, and Harris,1983; Burruss, Cercone, and Harris, 1985). In addition, fluid inclusions canyield information the temperature and pressure at the time of entrapment,providing data that can be integrated with other thermal indicators such asvitrinite reflectance, Rock-Eval pyrolysis, and fission track analysis to furtherrefine estimates of the timing of petroleum generation and migration.
The goal of this study is to provide observations that constrain the time ofmigration of oil and gas in and adjacent to ANWR. These observations,combined with other geologic, geochemical, and geophysical data, form thebasis for interpreting the timing of petroleum charge in the petroleum systemswithin the 1002 area of ANWR.
GEOLOGIC SETTING
The general geologic setting of the 1002 Area of the Arctic National WildlifeRefuge is discussed by Bird (Chap. GG). The general tectonic framework ofthrust sheet development in and adjacent to ANWR 1002 is well developed(Wallace and Hanks, 1990). Kinematic modeling of deformation isdiscussed by Cole and others (Chap. SM). The timing of deformationconstrained by seismic stratigraphic and structural analysis is discussed byHouseknecht and Schenk (Chap. BS) and Potter and others (Chap. BD),respectively, and constrained by fission track analysis by O'Sullivan and others, 1993.
METHODS AND SAMPLES
Samples of reported oil seeps, oil stained rocks, and potential reservoir faciesin sedimentary rocks within and adjacent to ANWR were collected during the1995, 1996, and 1997 field seasons. In addition, samples collected duringearlier field seasons by C. M. Molenaar (USGS) and R. Carlson (Univ. ofKansas) were utilized where available. Samples from cores in five oil andgas exploration wells drilled in Alaska State lands west of ANWR or in stateand Federal offshore waters were also examined. All samples withindications of petroleum as seeps, stains, or fluid inclusions are listed in TableFI1.

FI-6
Oil seeps occurring as tarry oil in Quaternary alluvium or beach sands, and oilstained Tertiary and Mesozoic sedimentary rocks were characterized byorganic geochemical methods and petrographic examination of thin sections.Samples collected for reservoir quality studies, and fractured rocks collectedfor fluid inclusion observations were thin-sectioned and examined bytransmitted, polarized light microscopy, and epi-fluorescence microscopy. Afew samples were examined by SEM and SEM-cathodoluminescencemicroscopy. Samples sectioned since 1995 were prepared as uncovered thinsections or as polished thin sections. Older thin sections with mountedcoverslips had the coverslips removed and the Canada balsam cementdissolved with acetone. Where necessary coverslips were reapplied with non-fluorescent immersion oil.
All thin sections were examined with an ultraviolet (UV), epi-fluorescencemicroscope (long-wave UV, 366 nm, excitation) for the presence offluorescent, petroleum fluid inclusions (Burruss, 1991). Routinereconnaissance was done at about 100x and the presence of inclusionsconfirmed at higher magnification, up to 500x. Visible color of fluorescenceand number of phases (one phase, or two phase liquid and vapor) were noted.All thin sections contained at least a few fluorescent artifacts in the epoxymounting media, requiring careful observation to ensure that the fluorescinginclusions occur within the mineral grains of the thin section.
Inclusions of natural gas were identified as one phase, non-fluorescentinclusions that occur on healed microfractures crossing a number of detritalgrains or as primary inclusions related to growth zoning or crack-seal texturesrevealed by cathodoluminescence microscopy. In selected samples, thepresence of methane-rich natural gas was confirmed by observations of lowtemperature phase behavior on a heating and cooling stage microscope(Goldstein and Reynolds, 1994).
RESULTS
Distribution of samples
All localities with samples that contain a direct indication of petroleum areshown on the map in Figure FI1. These occurrences include seeps, oilstained rocks, sandstones with dead oil in porosity, and rocks with oil and gasfluid inclusions. Sample information is summarized in Table FI1.

FI-7
The seep occurrence at Angun Point, northeastern 1002, is shown in FigureFI2. Unconsolidated, Quaternary sand in a wave-cut bluff is indurated with atar that is a heavily biodegraded oil (Lillis and others, Chap. OA). Twoexamples of outcrops of oil stained sandstones are shown in Figure FI3.These oils are biodegraded and their geochemical characteristics are discussedby Lillis and others, (Chap. OA). Examples of the occurrence of dead oil(pyrobitumen) in porosity in Sadlerochit Group sediments in the gas reservoirof the Kavik Gas Field, west of ANWR, are shown in Figure FI4.
Fluid inclusion petrography
Inherited vs. authigenic petroleum fluid inclusions: The petrographicsetting or mode of occurrence of fluid inclusions provides the key evidencefor determining the time of inclusion trapping. In sedimentary environments,evidence for classically defined primary inclusions is rare and the vastmajority of inclusions are secondary (Roedder, 1984). In samples ofcemented fractures, a key feature is the presence of crack seal textures,indicating that inclusions were trapped during fracturing (see subsectionbelow “crack-seal textures”). In sandstones without obvious intergrainmicrofractures, a critical distinction is whether the secondary inclusions areauthigenic, formed sometime during the last sedimentary cycle or detrital.Inclusions on healed microfractures in the cores of detrital grains, may ormay not be authigenic, but secondary inclusions within authigenic cementphases are by definition authigenic. During reconnaissance observations ofthin sections, it was relatively common to find fluorescent inclusions in oneor several non-adjacent grains in Canning Formation or SagavanirktokFormation sandstones. The absence of pervasive, intergrain microfracturesmade the distinction between authigenic and inherited inclusions difficult. Intectonic environments such as the North Slope where there are multiple cyclesof sedimentation, uplift and erosion, the possibility of inherited inclusions isreal, but as yet undocumented.
An example of the difficulty of distinguishing inherited from authigenic fluidinclusions is shown in Figure FI5. Sample 96DH121 is a carbonatecemented litharenite in the Canning Formation outcropping on the MarshCreek Anticline. In the epi-fluorescence image, blue fluorescent inclusionsare present on a healed microcrack within one quartz grain, but there is noevidence that this microfracture extends through the carbonate cement intoadjacent grains. To resolve this type of ambiguity, another sample of aCanning Formation sandstone was examined in fluorescence and

FI-8
cathodoluminescence as shown in Figure FI6. Sample 95DH44, a quartz-rich litharenite in the Canning Formation on Hue Creek, contains three grainswith fluorescent inclusions on short, healed microcracks. Whether theinclusions (Figure FI6b) occur within authigenic quartz cement is difficult todetermine in transmitted light due to the absence of dust-rims that define themargins of the detrital grains (Figure FI6a). The cathodoluminescence image(Figure FI6c) demonstrates that a large percentage of the field of viewincluding the fluid inclusions is authigenic quartz. This clearly demonstratesthat these inclusions were trapped during or after quartz cementation of thissandstone and are not inherited.
Crack-seal textures: Crack-seal textures form in fracture-filling cementswhen rocks dilate and repeatedly fracture the actively precipitating cement,forming trails of fluid or solid inclusions (Ramsay, 1980). These trails areparallel to the maximum principle stress and their relationships to style andmechanism of deformation are reviewed by Passchier and Trouw (1996).Several examples of studies of fluid inclusions in crack-seal textures arepublished by Laubach (1989) and Xu (1997). Crack-seal textures areimportant for constraining the timing of migration of fluids because therepetitive, sequential cracking and sealing of fracture-filling cements trapsfluids that are present during deformation. If the time of deformation is wellconstrained by structural, stratigraphic, and chronologic studies, then the timeof migration is well constrained. Although the mode of occurrence of fluidinclusions in crack-seal textures, as decoration on healed microcracks, is“secondary” in the terminology of fluid inclusion studies (Roedder, 1984),these textures are can be overgrown by a generation of inclusion-free cement,classifying them as “pseudo-secondary”, as shown in Figures FI7 and FI8.
Both fluorescent oil inclusions and non-fluorescent gas inclusions occur incrack-seal textures in cements in deformed rocks adjacent to the 1002 area ofANWR. Oil inclusions occur in crack-seal microfractures in quartz cementwithin fractures in overturned Kemik sandstone at Hue Creek illustrated inFigure FI7. The crack-seal texture is overgrown by a relatively inclusion-freegeneration of quartz.
Extensively fractured outcrops of the Sadlerochit Group at the Aichilik Riverwater-gap in Leffingwell Ridge contain quartz fiber crystals with welldeveloped crack-seal textures. At this locality, all the petroleum inclusions aremethane-rich natural gas, as indicated by the low temperature phase behavior(see below), and the complete absence of any fluorescence from the

FI-9
inclusions. Examples of the fractures, quartz fiber crystals, and crack-sealtextures are shown in Figure FI8.
Fluid inclusion temperatures
Temperatures of phase changes (microthermometry) in fluid inclusions weremeasured with standard heating and freezing stage techniques (Roedder, 1984and Goldstein and Reynolds, 1994). The results are summarized in Table FI2and Table FI3. Where possible, all measurements were made on fluidinclusion assemblages (FIAs), (Goldstein and Reynolds, 1994) that containboth aqueous and gas (CH4-rich) inclusions. If the composition of the gas isknown or can be estimated, then both trapping temperature and pressure canbe estimated from microthermometric measurements.
Fluorescence color of petroleum fluid inclusions
The fluorescence color of petroleum fluid inclusions provides a generalindication of the API gravity of fluid trapped in the inclusions (Burruss, 1991and Goldstein and Reynolds, 1994). The interpretation is similar to that madeby a well-site geologist while examining the fluorescence color of solvent cutsof cuttings for oil shows. Inclusions of natural gas are non-fluorescent. Ahistogram showing the number of occurrences of inclusions with distinctlydifferent fluorescence colors is shown in Figure FI9. There is a distinctbimodal distribution of colors in classes of yellow to orange and white toblue. This is a strong indication that there are two distinct oil gravities in theNorth Slope of Alaska, within and adjacent to ANWR.
DISCUSSION
General aspects of timing of migration
The map in Figure FI1 shows contours of mean random vitrinite reflectance(%Ro) based on measurements from outcrop samples (Johnsson and others,1992 and USGS unpublished) and proprietary measurements on samplesfrom the bottom of seismic shotholes (Bird, Chap. VR). The outcrops of oilstained sandstones and fluid inclusion samples containing oil generally fallwithin the area bounded by the 0.6 % and 1.3% reflectance contours that areconsidered to bound the oil window (Hunt, 1996). Methane-rich gasinclusions occur in samples located within the area of reflectances greater than2.0% which is considered to be the top of the gas window. The general

FI-10
correspondence of the fluid type with the level of thermal maturity at thepresent day surface implies that migration occurred during maximum burial.
Surface seeps document recent migration of oil. Biodegradation of the oils inthe seeps at Angun Point and Manning Point (Lillis and others, Chap. OA)make conclusive correlation of these seeps to subsurface samples difficult,but the results indicate that they are part of the Canning-Sagavanirktok(?)petroleum system (Lillis and others, Chap. OA, and Magoon and others,Chap. PS). The presence of biodegraded oil in shallow (approx. 4000 ft.depth) Tertiary age sediments in the Aurora well (Lillis and others, Chap.OA, and Keller and others, Chap. SR) offshore northeastern 1002, suggestsat least a spatial relationship to the surface seeps.
The presence of dead oil in porosity indicates that oil was once present butwas altered by some geochemical process, leaving an insoluble residue.There are several processes that can cause this phenomenon (Connan, 1984)and the specific process can give important clues to migration history at aparticular location. Although initial precipitation may not require hightemperatures (for example, gas phase de-asphaltening) the formation of theresidue commonly requires higher levels of thermal maturity (deeper burial orhot fluids) than that at the time of initial oil charge. Thus the dead oil in thegas reservoir of the Kavik Gas field (see Figure FI4 and subsection belowdealing with Kavik gas field) documents an earlier oil charge to the reservoir.Similarly, dead oil in outcrops of the Kemik Sandstone and sandstones of theCanning Formation in Ignek Valley document oil charge to these rocks priorto reaching maximum thermal maturity and certainly prior to uplift of theserocks at about 25 to 20 Ma during uplift of the Sadlerochit and ShublikMountains.
Timing of migration in individual plays
The tightest constraints on the timing of oil and gas migration result fromcombining the mode of occurrence of fluid inclusions and the temperaturemeasurements. The occurrence of oil and gas inclusions in crack-sealtextures within vein-filling cements indicates that hydrocarbons weremigrating during an episode of continuous deformation that produced thecrack-seal texture. The homogenization temperatures of the inclusions andthe estimated trapping temperatures constrain the depth of burial duringmigration. These constraints apply to two plays, the Ellesmerian Thrust BeltPlay, and the Thin-Skinned Thrust-Belt Play.
FI-11
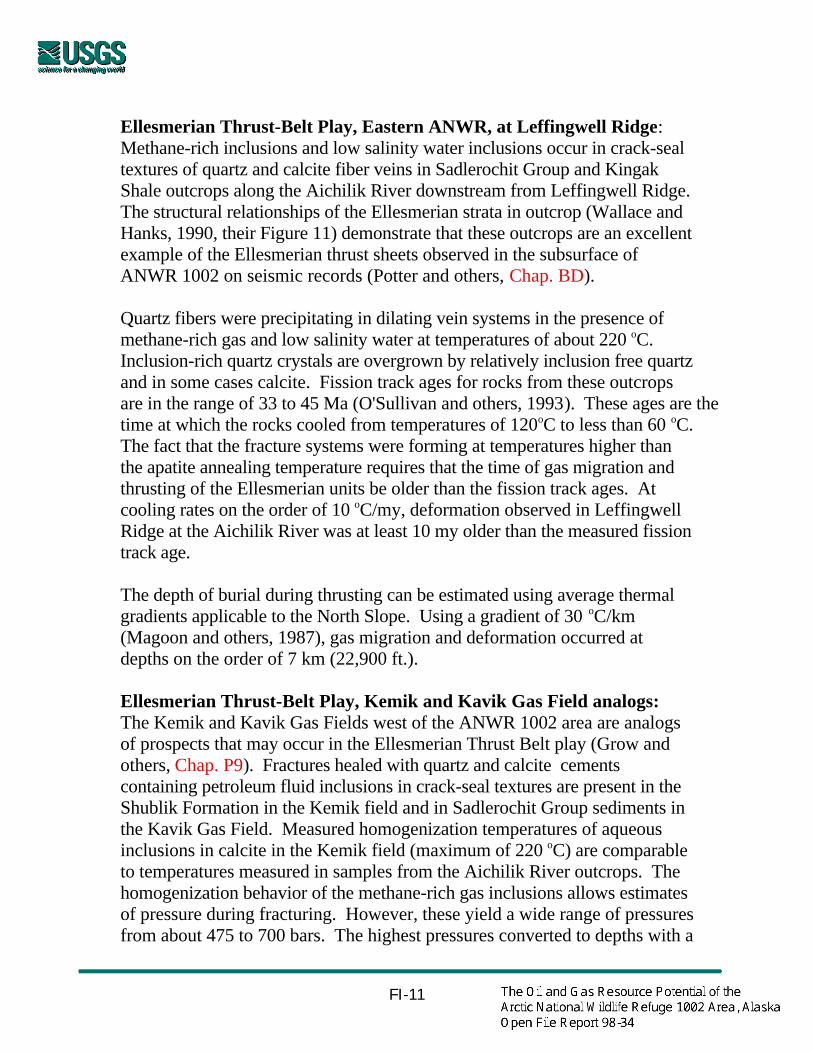
Ellesmerian Thrust-Belt Play, Eastern ANWR, at Leffingwell Ridge:Methane-rich inclusions and low salinity water inclusions occur in crack-sealtextures of quartz and calcite fiber veins in Sadlerochit Group and KingakShale outcrops along the Aichilik River downstream from Leffingwell Ridge.The structural relationships of the Ellesmerian strata in outcrop (Wallace andHanks, 1990, their Figure 11) demonstrate that these outcrops are an excellentexample of the Ellesmerian thrust sheets observed in the subsurface ofANWR 1002 on seismic records (Potter and others, Chap. BD).
Quartz fibers were precipitating in dilating vein systems in the presence ofmethane-rich gas and low salinity water at temperatures of about 220 oC.Inclusion-rich quartz crystals are overgrown by relatively inclusion free quartzand in some cases calcite. Fission track ages for rocks from these outcropsare in the range of 33 to 45 Ma (O'Sullivan and others, 1993). These ages are thetime at which the rocks cooled from temperatures of 120 oC to less than 60 oC.The fact that the fracture systems were forming at temperatures higher thanthe apatite annealing temperature requires that the time of gas migration andthrusting of the Ellesmerian units be older than the fission track ages. Atcooling rates on the order of 10 oC/my, deformation observed in LeffingwellRidge at the Aichilik River was at least 10 my older than the measured fissiontrack age.
The depth of burial during thrusting can be estimated using average thermalgradients applicable to the North Slope. Using a gradient of 30 oC/km(Magoon and others, 1987), gas migration and deformation occurred atdepths on the order of 7 km (22,900 ft.).
Ellesmerian Thrust-Belt Play, Kemik and Kavik Gas Field analogs:The Kemik and Kavik Gas Fields west of the ANWR 1002 area are analogsof prospects that may occur in the Ellesmerian Thrust Belt play (Grow andothers, Chap. P9). Fractures healed with quartz and calcite cementscontaining petroleum fluid inclusions in crack-seal textures are present in theShublik Formation in the Kemik field and in Sadlerochit Group sediments inthe Kavik Gas Field. Measured homogenization temperatures of aqueousinclusions in calcite in the Kemik field (maximum of 220 oC) are comparableto temperatures measured in samples from the Aichilik River outcrops. Thehomogenization behavior of the methane-rich gas inclusions allows estimatesof pressure during fracturing. However, these yield a wide range of pressuresfrom about 475 to 700 bars. The highest pressures converted to depths with a

FI-12
hydrostatic gradient of 100 bars/km are give depths of burial of 7km (22,900ft.) during deformation and gas migration.
Temperatures measured on aqueous inclusions in samples from the Kavikgas field are lower (maximum of 185 oC) than those in the Kemik fieldsamples. In addition to methane-rich gas inclusions in FIAs with the aqueousinclusions, Kavik field samples contain blue fluorescent, liquid and vaporinclusions. The blue color of the fluorescence of these inclusions indicatesthat they contain a high API gravity, gas-rich petroleum.
The Sadlerochit Group samples also contain pyrobitumen in the pore space,indicating that these reservoir rocks were once charged with oil (Figure FI4).This suggests a history of hydrocarbon charge that started as crude oil, the oilwas replaced by gas-rich, volatile oil or the reservoir was charged with gasand the oil displaced up-dip. Late gas charge could cause de-asphaltening ofthe oil and formation of the pyrobitumen now present in the pore space.
The relationship between the timing of deformation and petroleum migrationin the Ellesmerian thrust structures of these gas fields is not as wellconstrained as it is at the Aichilik River outcrops. Based on the general modelof Ellesmerian thrust sheet development (Wallace and Hanks, 1990) and thekinematic modeling by Cole and others (Chap. SM), I infer an age ofdeformation, and therefore oil and gas migration, of 45 to 33 mypb.However, according to the seismic data available for the Kavik gas field(Potter and others, Chap. BD), the fault that forms the trap extends tobasement as a high angle fault, analogous to the high angle faults that upliftthe Sadlerochit and Shublik Mountains. The AFTA results for uplift of thesemountain ranges indicate an age of trap formation at about 25 to 20 Ma(O'Sullivan and others, 1993). Also, AFTA of subsurface samples ofSadlerochit Group sediments in the Kemik Unit 2 well (O'Sullivan, 1990)yields ages at three depths of 13 to 22 mypb for the deepest to shallowestsamples, respectively. These young ages indicate relatively recent uplift ofthese sediments to temperatures less than 120 oC. This age presents somechallanges for modeling the history of hydrocarbon charge because it requiresthat an initial oil charge and the latest gas charge be younger than trapformation.

FI-13
Thin-skinned Thrust-Belt Play
Surface exposures of potential reservoir units within the Brookian Thin-skinned Thrust-Belt Play occur along the Marsh Creek anticline wherebroadly folded Canning and Sagavanirktok Formations crop out. These rockscontain small numbers of grains with yellow and blue fluorescent oilinclusions as shown in Figure FI5. South of the 1002 area, the moreintensely deformed Kemik sandstone is also part of this play. The thrustduplexes and tight folds in the Kemik are uncoupled from deformation in theyounger Brookian rocks and underlying Ellesmerian rocks through thedetachment surfaces in the Pebble Shale unit and Kingak Shale, respectively.Because deformation of the Kemik is mechanically uncoupled fromdeformation in the younger Canning and Sagavanirktok Formations, it mayhave occurred at a different time and possibly be older than deformation in theyounger strata.
The occurrence of oil inclusions in small numbers of grains in samples ofTertiary age sediments on the Marsh Creek Anticline does not place tightconstraints on the timing of migration of oil through these rocks. The onlyconstraint is that trapping occurred in the subsurface, prior to uplift. Seismicevidence presented by Potter and others (Chap. BD) demonstrates that upliftof the Marsh Creek Anticline began about 20 Ma, but in the absence oftemperature measurements, there is no way to constrain the time of trappingrelative to uplift.
Fluid inclusions of gas and oil occur in crack-seal textures in fracture-fillingcements within deformed Kemik sandstone at several locations listed in TableFI2 and shown on Figure FI1. Temperature measurements on three samplesindicate that oil migration occurred in the temperature range 120 to 160 oC andgas migration occurred during deformation at temperatures up to 195 oC.Blue fluorescence and homogenization at lower temperatures, in some casesto vapor, indicate that some of the migrating petroleum was condensate-like.
Petroleum inclusions in crack-seal textures at the Hue Creek locality areshown in Figure FI7. A separate sample from the same locality, 95FC14B(Table FI2), contains aqueous inclusions with a maximum homogenizationtemperature of 125 oC. This temperature is consistent with complete resettingof apatite fission track ages to a 33 Ma age of uplift for this location in theIgnek Valley (O'Sullivan and others, 1993). This fission track age requires that oil
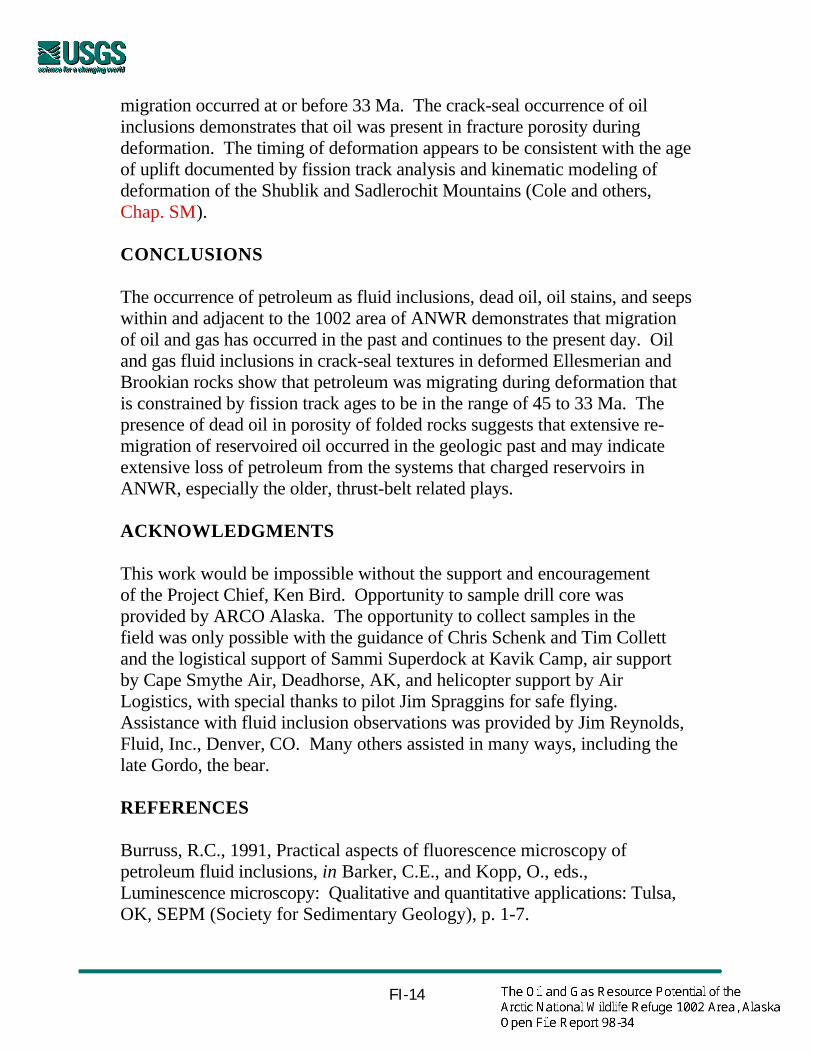
FI-14
migration occurred at or before 33 Ma. The crack-seal occurrence of oilinclusions demonstrates that oil was present in fracture porosity duringdeformation. The timing of deformation appears to be consistent with the ageof uplift documented by fission track analysis and kinematic modeling ofdeformation of the Shublik and Sadlerochit Mountains (Cole and others,Chap. SM).
CONCLUSIONS
The occurrence of petroleum as fluid inclusions, dead oil, oil stains, and seepswithin and adjacent to the 1002 area of ANWR demonstrates that migrationof oil and gas has occurred in the past and continues to the present day. Oiland gas fluid inclusions in crack-seal textures in deformed Ellesmerian andBrookian rocks show that petroleum was migrating during deformation thatis constrained by fission track ages to be in the range of 45 to 33 Ma. Thepresence of dead oil in porosity of folded rocks suggests that extensive re-migration of reservoired oil occurred in the geologic past and may indicateextensive loss of petroleum from the systems that charged reservoirs inANWR, especially the older, thrust-belt related plays.
ACKNOWLEDGMENTS
This work would be impossible without the support and encouragementof the Project Chief, Ken Bird. Opportunity to sample drill core wasprovided by ARCO Alaska. The opportunity to collect samples in the field was only possible with the guidance of Chris Schenk and Tim Collettand the logistical support of Sammi Superdock at Kavik Camp, air supportby Cape Smythe Air, Deadhorse, AK, and helicopter support by AirLogistics, with special thanks to pilot Jim Spraggins for safe flying.Assistance with fluid inclusion observations was provided by Jim Reynolds,Fluid, Inc., Denver, CO. Many others assisted in many ways, including thelate Gordo, the bear.
REFERENCES
Burruss, R.C., 1991, Practical aspects of fluorescence microscopy ofpetroleum fluid inclusions, in Barker, C.E., and Kopp, O., eds.,Luminescence microscopy: Qualitative and quantitative applications: Tulsa,OK, SEPM (Society for Sedimentary Geology), p. 1-7.

FI-15
Burruss, R.C., Cercone, K.R., and Harris, P.M., 1983, Fluid inclusionpetrography and tectonic-burial history of the Al Ali No. 2 well: Evidence fortiming of diagenesis and oil migration, northern Oman Foredeep: Geology, v.11, p. 567-570.
Burruss, R.C., Cercone, K.R., and Harris, P.M., 1985, Timing ofhydrocarbon migration: Evidence from fluid inclusions in calcite cements,tectonics and burial history, in Harris, P.M., and Schneidermann, N.M., eds.,Carbonated Cements Revisited: Special Publication No. 36: Tulsa, Society ofEconomic Paleontologists and Mineralogists, p. 277-289.
Connan, J., 1984, Biodegradation of crude oils in reservoirs, in Welte, D.,and Brooks, J., eds., Advances in Petroleum Geochemistry: New York,Academic Press, p. 299-335.
Goldstein, R.H., and Reynolds, T.J., 1994, Systematics of Fluid Inclusions inDiagenetic Minerals: Short Course: Tulsa, SEPM, v. 31, 199p.
Hunt, J. M., 1996, Petroleum Geochemistry and Geology: New York, W. H.Freeman and Co., 743p.
Johnsson, M.J., Pawlewicz, M.J., Harris, A.G., and Valin, Z.C., 1992,Vitrinite reflectance and conodont color alteration index data from Alaska:Data to accompany the thermal maturity map of Alaska: U. S. GeologicalSurvey 409.
Laubach, S.E., 1989, Paleostress directions from the preferred orientation ofclosed microfractures (fluid-inclusion planes) in sandstone, East Texas basin,U.S.A.: Journal of Structural Geology, v. 11, no. 5, p. 603-611.
Magoon, L. B., Woodward, P. V., Banet, A. C., Jr., Griscom, S. B., andDaws, T. A., 1987, Thermal maturity, richness, and type of organic matter ofsource-rock units, in Bird, Kenneth J. and Magoon, Leslie B., eds., PetroleumGeology of the Arctic National Wildlife Refuge, Northeastern Alaska: U. S.Geological Survey Bulletin 1778, p. 127-180.
O'Sullivan, P.B., 1990, Preliminary results of 25 apatite fission track analysesof samples from five wells on the North Slope of Alaska: Alaska Division ofGeological and Geophysical Surveys Public-data File 90-32.

FI-16
O'Sullivan, P.B., Green, P.F., Bergman, S.C., Decker, J., Duddy, I.R.,Gleadow, A.J.W., and Turner, D.L., 1993, Multiple phases of Tertiary upliftin the Arctic National Wildlife Refuge, Alaska, based on apatite fission trackanalysis: American Association of Petroleum Geologists Bulletin, v. 77, p.359-385.
Passchier, C.W., and Trouw, R.A.J., 1996, Microtectonics: Berlin, Springer-Verlag, 289 p.
Ramsay, J.G., 1980, The crack-seal mechanism of rock deformation: Nature,v. 284, p. 135-139.
Roedder, E., 1984, Fluid Inclusions: Reviews in Mineralogy, MineralogicalSociety of America, v. 12, 644 p.
Wallace, W.K., and Hanks, C.L., 1990, Structural provinces of theNortheastern Brooks Range, Arctic National Wildlife Refuge, Alaska:American Association of Petroleum Geologists Bulletin, v. 74, p. 1100-1118.
Xu, G., 1997, Fluid inclusions in crack-seal veins at Dugald River, Mount IsaInlier: implications of paleostress states and deformation conditions duringorogenesis: Journal of Structural Geology, v. 19, no. 11, p. 1359-1368.

Table FI1. ANWR localities with indications of petroleum as fluid inclusions, stains, seeps, and dead oil
Sample ID Latitude Longitude Formation Locality Petroleum indications97RCB13 69.50500 -143.38830 Arctic Creek Ridge west of Okerokovik River, Arctic Creek facies one phase (ph.) gas inclusions96RCB10 69.56950 -145.81217 Canning Hue Creek Rare blue fluorescent (fl.) inclusions (incl.)96RCB13 69.71583 -145.43333 Canning Katakturuk River South Blue fluorescent incl.95DH44 69.56950 -145.81217 Canning Hue Creek Dead oil and 2 grains (grn.) with yellow fl. incl.96DH121 69.93167 -144.66517 Canning Marsh Creek anticline (MCA2) a few grains with yellow fluorescent inclusions96DH146 69.71467 -145.43583 Canning Katakturuk #1 yellow fluorescent inclusions96DH149 69.71533 -145.32783 Canning Katakturuk #2 one grain with 2-phase yellow fl. incl.96RCB14B 69.65367 -146.24250 Sagavanirktok Canning River, Ken Bird oil stain locality oil stain, no fluorescent inclusions80AMK-26 69.57100 -145.80000 Canning? Brookian turbidites - Ignek Valley one grain with blue fluorescent 2-phase inclusions80AMK-41D 69.71500 -145.43333 Canning? Cret-Paleoc turb section – along Katakturuk River north of
Sadlerochit Mtnsyellow fl. 1 +2 ph. incl., 1 ph. blue fl. incl.
82AMK-20 69.58317 -146.30333 Canning? Paleocene turbidites - W bank of Canning River one grn. / 2 ph. yellow fl. incl.82AMK-78 69.54500 -146.29167 Canning? Oil-stained UK(?) turbs – West side Canning River abundant 2 ph. yellow fl. incl.DH95-29 69.53219 -145.20667 Fire Creek Fire Creek, Shublik Mtns. secondary, 1-phase methane-rich gas inclusions95FC-01C 69.39683 -146.41800 Kemik Kavik River south !!! Yellow, white, blue fluorescent inclusions95FC-14B 69.55555 -145.83333 Kemik Hue Creek Blue and Yellow fluorescent inclusions96RCB5 69.69167 -144.85000 Kemik Marsh Creek at Kelley's footwall cutoff Yellow and blue fl. inclusions, possible 1-phase gas96RCB12 69.55667 -145.83500 Kemik Hue Creek Blue fluorescent inclusions96RCB15B 69.46417 -146.34083 Kemik Canning River, Kemik duplexes Rare blue fluorescent inclusions96RCB15D 69.46417 -146.34083 Kemik Canning River, Kemik duplexes Yellow and blue fluorescent inclusions96DH34 69.55650 -145.45767 Kemik Horseshoe, Ignek Valley dead oil96DH35 69.55650 -145.45767 Kemik Horseshoe, Ignek Valley dead oil in clasts as detrital component96DH37 69.55650 -145.45767 Kemik Horseshoe, Ignek Valley dead oil96DH39 69.55650 -145.45767 Kemik Horseshoe, Ignek Valley trace dead oil96DH42 69.55650 -145.45767 Kemik Horseshoe, Ignek Valley dead oil96DH18 69.63200 -144.44817 Kemik Last Creek gas inclusions in quartz+calcite cement in breccia96DH84 69.61350 -144.46250 Kemik Sadlerochit #2 Section possible dead oil80AMK-18H 69.49733 -146.31133 Kemik 120' Kemik Ss Section - W bank Canning River blue fluorescent inclusions80AMK-23A 69.41050 -146.91667 Kemik 117' Kemik Ss Section – Fin Creek 1 and 2-phase blue fluorescent inclusions80AMK-49B 69.63067 -144.42817 Kemik Kemik Ss - Last Creek, E end of Sadlerochit Mtns dead oil??82AMK-55C 69.58617 -145.97000 Kemik Kemik Ss-Kps - Ignek Creek Section dead oil83AMK-40D 69.69567 -144.85983 Kemik Kemik Ss - E fork Marsh Creek Dead oil83AMK-40F 69.69567 -144.85983 Kemik Kemik Ss - E fork Marsh Creek Dead oil95DLG-7A 69.49950 -146.30933 Kemik Repeated Kemik Ss, Canning River 1 grain with blue fl. 2 ph. incl., possible dead oil95FC-17 69.55833 -145.83333 Kemik Kemik Ss, Hue Creek, Ignek Valley blue-white fl. 2 ph. in matrix and pebbles, dead oil97RCB11 69.53000 -143.06950 Kingak Aichilik R. section, deformed Kingak one phase gas inclusionsDH95-14 69.68658 -144.84267 Kingak? Marsh Creek one phase methane-rich gas96DH81 69.34267 -147.20933 Kingak? Peregrine Nest one phase methane-rich gasCarlsonMS 69.68030 -144.85000 Lisburne Marsh Creek measured section 2 phase yellow fluorescent inclusions and dead oil83AMK-1 69.81117 -145.57567 Sagavanirktok Sag. Fm. - E side of Tamiariak River 2 ph. yellow fl. incl, 1 ph. blue fl. incl.95DLG-2C 69.87100 -145.17933 Sagavanirktok Fluvial Sag. Fm., Bluff on east side of Kat. Riv. 2 phase yellow fluorescent inclusions96RCB2 69.65317 -146.72067 Sagavanirktok? Kavik oil stained SS oil stain and no fluorescent inclusions96DH122 69.94567 -144.66433 Sagavanirktok? Marsh Creek Anticline (MCA3) rare yellow fluorescent inclusionsDH95-34 69.53583 -145.20167 Shublik Fire Creek, Shublik Mtns. Secondary aqueous and 1 phase methane-rich incl.95FC-15B 69.55555 -145.83333 Shublik Hue Creek Possible one-phase methane-rich inclusions95DLG-MP1 70.11666 -143.51666 Quaternary Manning Point oil Seep oil saturated unconsolidated sand97RCB17 69.91800 -142.39500 Quaternary Angun Point oil seep oil saturated unconsolidated sand

FI-1
Table FI2. Fluid inclusion temperature measurements, outcrop samples
1. Location: Fire Creek, 95DH34 Formation: Fire CreekInclusions: water and CH4-rich gas
FIA: Aq. Th: 185-190 oC, 195-200 oCCH4-rich gas Th: -76 to -75 oC to L and Vsalinity: approx. 10,000 ppm TDS
max. obs. aq. Th: 225-230 oC
2. Location: Hue Creek, 95FC14B Formation: KemikInclusions: water and oil (yellow and blue fluorescent), crack seal texture
Blue fluorescence Th: 40-45 oCYellow fluorescence Th: 115-120 oCmax. obs. aq. Th: 125 oC (minimum trapping temp.)
3. Location: Kavik R. south, 95FC01C Formation: KemikInclusions: water and fluorescent oil
FIA: Aq. Th: 150-160 oCSalinity: approx. 10,000 ppm TDSBlue fluorescence Th: 65-70 oC to V
Fluorescent inclusionsMin. Th: 65-70 oC to VMax. Th: 130-135 oC to L
4. Location: Aichillik R., 97RCB11 Formation: KingakInclusions: water and CH4-rich gas, crack-seal texture
FIA: Aq. Th: max. 210-215 oCsalinity: approx. 10,000 ppm TDSCH4-rich gas Th: approx. -80 oC
5. Location: Leffingwell Ridge, 97RCB13 Formation: Arctic Creek faciesInclusions: water and CH4-rich gas, crack-seal texture
FIA: Aq. Th: max. 200-215 oCsalinity: approx. 10,000 ppm TDSCH4-rich gas Th: approx. -80 oC

FI-2
Table FI2. Fluid inclusion temperature measurements, outcrop samples (continued)
6. Location: Peregrine Nest, 96DH81 Formation: Kingak?/KemikInclusions: water and CH4-rich gas, crack-seal texture
FIA, crack-seal: Aq. Th: 185-195 oCsalinity: approx. 10,000 ppm TDSTh: CH4: -80 oC to L
FIA, post crack-seal: Aq. Th: 175-185 oCsalinity: approx. 10,000 ppm TDSCH4-rich gas Th: -80 oC to L

FI-3
Table FI3. Fluid inclusion temperature measurements, subsurface core samples
1. Well: Kemik Unit 1 Formation: Shublik, 8669 ft.
Inclusions: water and CH4-rich gas in quartz (qtz.-calcite frac.)FIA: Aq. Th: 210-220 oC
salinity: approx. 10,000 ppm TDSCH4-rich gas Th: -81.7 to -74.6 oC to L, V, and critical
Pressure estimate: 700 bars to 475 barsDepth estimate:Temperature gradient:
2. Well: Kavik Unit 3 Formations: Sag River: 4946.2 ft. Shublik: 5035.7 ft.
5069.3 ft.
Inclusions: water and blue fluorescent oil in quartz (qtz.-calcite frac.)FIA in qtz: Aq. Th: 175-180 oC
salinity: approx. 10,000 ppm TDSCH4-rich gas Th : -64 to -48 oC to L and V
FIA in calc.: Aq. Th: 180-185 oCsalinity: approx. 10,000 ppm TDSBlue fluorescent oil: Th: 35 to 50 oC
Depth estimate: 185oC/48 oC /km: 3.85 km (12,600 ft)

0
. .
.
.
.
.
.
.
.
.
. .. 8
.
.
. 0
.
2 . 1
..
. 4
.
.
.
1
.
3
1.3
1.3
1.3
0.6 0.6
2.0
2.0
2.0
2.0
1.3
0.5
0.5
0.5
0.4
0.4
0.4
Zone ofoil generation
Zone of oil andcondensate preservation
Zone ofdry gas2.0
2.0
0.6
0.6
0.4
0.4
0.4
0.5
0.5
0.5
0.5
0.5
1.3
1.3
3
3.03.0
3.04.0
4.0
4.0
3.0DH9529
96DH3496DH3596DH3796DH3996DH42
DH9534
Figure FI1: Locations of samples with indications of oil and gas as seeps, stains,dead oil, and oil and gas fluid inclusions. Also shown are selected contours of vitrinite reflectance at the surface. Samples are listed Table FI1.
97RCB13
96RCB10
96RCB13
95DH44
96DH121
96DH146 96DH149
96RCB14B
80AMK
26
80AMK41D
82AMK2082AMK78
95DH29
95FC01C
95FC14B
96RCB5
96RCB12
96RCB15B96RCB15D
96DH3
4
96DH35
96DH3796DH39
96DH42
96DH18
96DH84
80AMK18H
80AMK23A
80AMK49B
82AMK55C
83AMK40D83AMK40F
95DLG7A
95FC17
97RCB11
DH9514
96DH81
CarlsonMS
83AMK1
95DLG2C
96RCB2
96DH122
95DH3495FC15B
95DLGMP1
97RCB17

Figure FI2: Oil Seep at Angun Point, within the 1002area of ANWR. Quaternary sand indurated with taroccurs at the base of a low, wave-cut bluff on thenorthwestern shore of Beaufort Lagoon. Sample 97RCB17 was analyzed geochemically (Lillis and others, Chap. OA) and the tar is extremely biodegraded. This sample location is about the same as C. M. Molenaar's sample 83AMK-6 (AppendixCM). USGS field notes by Detterman and Brosge' indicate that other occurrences of tar were observed in the tundra within a mile to the west of this site.
A. Sand indurated with tar with the consistency of asphalt.
B. View of the outcrop, looking to the northeast. TomMoore for scale, Beaufort Lagoon in the background.

Figure FI3: Examples of oil stained outcrops adjacent to the 1002 area of ANWR.
A. Oil stained, massive sandstone with hummockycrossbedding, Canning Formation, east bank, Canning River.Shelley Orth (taking photograph) for scale. View to south. Location of sample 96RCB14 analyzed for geochemical characteristics of oil. This location is at the north end of the panorama used to illustrate the sequence stratigraphic interpretation of the Canning Formation presented by Houseknecht and Schenk, Chap. BS.
B. "Outcrop" of oil stained rocks, possibly the Sagavanirktok Formation, known as the "Kavik" locality.Blocks of sandstone on the tundra, humans and helicopterfor scale. View to the south.
C. Close-up of oil stained sand in B. Sample 96RCB2 analyzed for geochemical characteristics of oil.
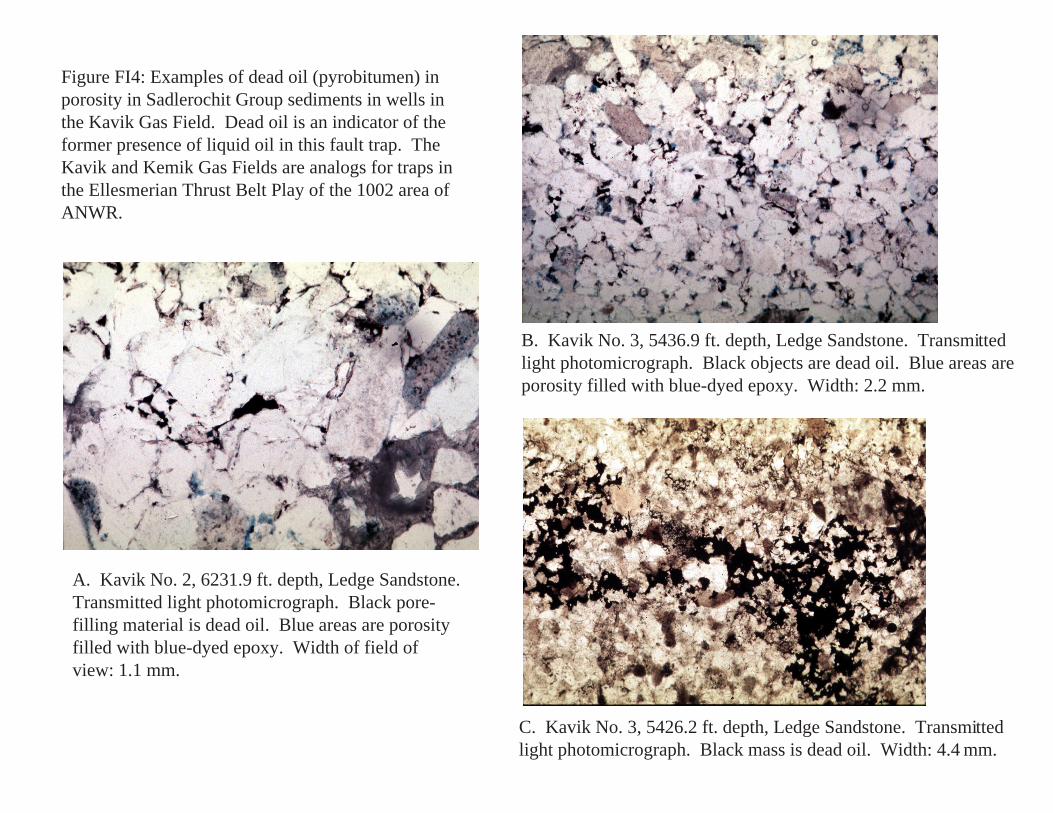
Figure FI4: Examples of dead oil (pyrobitumen) inporosity in Sadlerochit Group sediments in wells in the Kavik Gas Field. Dead oil is an indicator of the former presence of liquid oil in this fault trap. The Kavik and Kemik Gas Fields are analogs for traps in the Ellesmerian Thrust Belt Play of the 1002 area of ANWR.
A. Kavik No. 2, 6231.9 ft. depth, Ledge Sandstone.Transmitted light photomicrograph. Black pore-filling material is dead oil. Blue areas are porosity filled with blue-dyed epoxy. Width of field of view: 1.1 mm.
B. Kavik No. 3, 5436.9 ft. depth, Ledge Sandstone. Transmittedlight photomicrograph. Black objects are dead oil. Blue areas are porosity filled with blue-dyed epoxy. Width: 2.2 mm.
C. Kavik No. 3, 5426.2 ft. depth, Ledge Sandstone. Transmittedlight photomicrograph. Black mass is dead oil. Width: 4.4 mm.

Figure FI5: Photomicrographs illustrating the difficulty of determining whether oil inclusions in isolated grains in a thinsection are authigenic or inherited. See text and Figure FI.6 for further discussion. Sample: 96DH121, Canning Formation at Marsh Creek Anticline.
f.i.
C
A. Transmitted light, quartz litharenitecemented with calcite. Long axis of field of view 2.2 mm.
B. Epi-fluorescence image of part of field of view in A. Blue fluorescent oilinclusions (f.i.) occur in a single quartz grain surrounded with fluorescent carbonate cement (C). Long axis of field of view 1.1 mm.

ab
a
b
chert
quartzcement
detritalquartz
dead oil
oil fluidinclusions
Figure FI6: Photomicrographs demonstrating the occurrence of oil fluid inclusions in authigenic quartz cement. Sample 95DH44, Canning Formation, Ignek Valley, along Hue Creek.
A. Transmitted light, chert litharenite, field of view 1.1 mm.
B. Cathodoluminescence (SEM) image showing distinctionbetween authigenic (gray) and detrital quartz (white) and chert. Field of view 0.25 mm.
C. Epi-fluorescence image of field of view in B. focused onsurface of polished section. Points a and b correspond to labelled points in B. Field of view 0.2 mm.
D. Same field of view as C, focused into section to showfluorescence of oil fluid inclusions within quartz cement.

Figure FI7: Oil inclusions in crack-seal texture in fracture filling quartz cement in overturned Kemik sandstone along Hue Creek at the Shublik Mountain front. Sample96RCB12.
Frontal thrust fault
HueCreek
B. Quartz filled fracturein Kemik Sandstone.View of bedding surfaceindicated, above.
A.
C.
D.
E.
Photomicrographsof crack-seal textures in quartzcement.
Transmitted light
Epi-fluorescence

Figure FI8: Quartz fiber veins with gas-rich fluid inclusions in crack-seal textures and later cross-cutting microfractures, documenting gas migration during deformation, Leffingwell Ridge at the Aichilik River.
A. Outcrop of extensivelyfractured sandstone,Sadlerochit Group, possiblyFire Creek Sandstone,sample 97RCB7. Notehammer for scale.
Hammer
Quartzfiber Crack-seal
fluid inclusions
Crack-sealfluid inclusions
Cross-cuttingmicrofractures
Fracture edge
B. Transmitted light image of quartz fiber vein, with internalcrack-seal texture in curved fiber, overgrown with clear quartz. Field of view, 4.4 mm.
C. Same field of view as B with crossed polarizers,emphasizing fibrous nature of quartz crystals.
D. Transmitted light image showing crack-seal texturegas inclusions cross-cut by later generation of micro-fractures. Field of view 4.4 mm.

0
5
10
15
20
Num
ber
of o
utcr
op lo
cati
ons
API gravity: 10 to 20 20 to 30 30 to 40 40 and upFluorescence Color: orange yellow white blue
(red) (green)
Figure FI9: API gravity inferred from fluorescence color of fluid inclusions in samples from outcrops within and adjacent to 1002 area, ANWR.