Embed Size (px)
Citation preview

Household fuel choice in the National Energy Market
FINAL REPORT May 2018
Alternative Technology Association

Household Fuel Choice in the NEM 2
KP137 www.ata.org.au 21 May 2018
Document Information
Document Version Date Prepared By Reviewed By Comments
ATA Household Fuel Choice – DRAFT Report v0.1
8th March 2018 Dean Lombard – Senior Energy Analyst
Damien Moyse – Policy & Research Manager
Initial Version
ATA Household Fuel Choice – DRAFT Report v0.2
8th March 2018 Damien Moyse – Policy & Research Manager
Second Draft Version
ATA Household Fuel Choice – DRAFT Report v0.3
4th April 2018 Damien Moyse – Policy & Research Manager
Third Draft Version
ATA Household Fuel Choice – DRAFT Report v0.4
19th April 2018 Dean Lombard – Senior Energy Analyst
Damien Moyse – Policy & Research Manager
Fourth Draft Version
ATA Household Fuel Choice – DRAFT Report v0.5
19th April 2018 Dean Lombard – Senior Energy Analyst
Damien Moyse – Policy & Research Manager
Fifth Draft Version
ATA Household Fuel Choice – FINAL Report v1.0
20th April 2018 Damien Moyse – Policy & Research Manager
Damien Moyse – Policy & Research Manager
Final Version
Household fuel choice in the NEM
21 May 2018 Dean Lombard – Senior Energy Analyst
Andrew Reddaway—Energy Analyst
Public release version with updated charts and additional recommendation
© 2018 Alternative Technology Association. All rights are reserved. No part of this report may be reproduced without acknowledgement of source.
Prepared for Energy Consumers Australia
ATA Energy Projects Team Prepared by: Dean Lombard, Keiran Price, Andrew Reddaway, Damien Moyse Cover photograph: Alternative Technology Association Level 1, 39 Little Collins St, Melbourne VIC 3000 +61 3 9639 1500 +61 3 9639 5814 www.ata.org.au Promoting Renewable Energy, Energy Efficiency and Water Conservation since 1980
This project was funded by Energy Consumers Australia as part of its grants process for consumer advocacy projects and research projects for the benefit of consumers of electricity and natural gas. The views expressed in this document do not necessarily reflect the views of Energy Consumers Australia or the Australian Energy Market Commission.

Household Fuel Choice in the NEM 3
KP137 www.ata.org.au 21 May 2018
Contents
Executive Summary ...................................................................................................................... 4
1.0 Introduction ..................................................................................................................... 8
1.1 Context .................................................................................................................................... 8
1.2 Project Support ..................................................................................................................... 10
2.0 Methodology .................................................................................................................. 11
2.1 The 2014 Project ................................................................................................................... 11
2.2 Calculating Energy Usage ...................................................................................................... 13
2.3 Appliance Choice ................................................................................................................... 14
2.4 Model Structure .................................................................................................................... 16
3.0 Results ............................................................................................................................ 17
3.1 New Homes ........................................................................................................................... 18
3.2 Existing Homes – One Gas Appliance .................................................................................... 19
3.3 Existing Homes – Multiple Gas Appliances ........................................................................... 22
3.4 Value of Existing Solar ........................................................................................................... 29
3.5 Comparison Against 2014 Results ......................................................................................... 30
4.0 Findings & Recommendations ......................................................................................... 31
4.1 Findings ................................................................................................................................. 31
4.2 Recommendations ................................................................................................................ 33
4.3 Limitations & Further Work .................................................................................................. 35
5.0 Appendix A: Methodology – Heating & Cooling ................................................................ 38
6.0 Appendix B: Methodology – Water Heating ..................................................................... 42
7.0 Appendix C: Methodology – Cooking ............................................................................... 49
8.0 Appendix D: Methodology – Solar PV .............................................................................. 52
9.0 Appendix E: Methodology – Energy Prices ....................................................................... 55

Household Fuel Choice in the NEM 4
KP137 www.ata.org.au 21 May 2018
Executive Summary
Energy Consumers Australia (ECA) approved a grant to the Alternative Technology Association (ATA) to update and expand its previous research on the economics of household fuel choices in the National Energy Market (NEM). The objective of this project was to:
• understand the most cost effective way for residential consumers to access stationary energy in the NEM in 2018, taking into account the optimal balance between grid-supplied energy and demand side technologies; and
• improve the understanding of the consumer sector, energy market institutions and the gas and electricity industry of the latest trends in cost effective strategies for households.
Context Cost effective stratgies for household energy management are becoming increasingly complex – with a range of opportunities involving the use of grid (electricity and/or gas) and demand side technologies. More than ever, there is significant confusion among consumers, consumer advocates, governments and the energy industry with regard to making optimal fuel and technology choices to manage household energy use. The objective of this project is to capture as many household types, climate zones, appliance replacement cases and gas and electricity pricing zones as possible, in order that the results provide useful guidance for the widest number of residential consumers.
Consumer Decision Making For residential consumers, the primary use of reticulated (mains) gas occurs for any combination of the following end-use energy services:
• space heating (warming rooms and buildings);
• water heating; and
• cooking. Each of these end uses can be supplied by either gas or electric appliances. Regarding consumer decision making, an individual consumer may be considering:
• switching one or two gas appliances with electric appliances (or vice versa), and retaining an existing mains gas connection;
• a complete switch from gas to electric appliances, with subsequent disconnection from the mains gas network; or
• establishing a new connection to the mains gas network, and purchase of new gas appliances, for:
o an existing home without mains gas; or o a newly built home.
The ATA Model The model compares the total cost of ownership (i.e. purchase, installation and running cost) using a 10-year net present value (NPV) framework (see box for further explanation of NPV). All future cash flows/benefits projected in the model have been discounted by 2.5% real, to reflect typical household mortgage costs (net of inflation).

Household Fuel Choice in the NEM 5
KP137 www.ata.org.au 21 May 2018
Results Considering the range of results, ATA proposes the following consumer principles regarding the economics of fuel choice decisions at an appliance level:
Table 1: General Consumer Fuel Choice Decisions
No. of gas appliances
Appliance needing
replacement Solar? Best economic decision
NEW HOMES
N/A N/A Yes Go all-electric
No Go all-electric (neutral in Sydney and Adelaide)
EXISTING HOMES
One Any Yes Switch to electric
No Switch to electric
Two
Heating Yes Switch both to electric
No Switch both to electric
Hot water
Yes
HOT WATER AND HEATING
Sydney
Stay on gas (neutral outside CBD)
Elsewhere
Switch both to electric
HOT WATER AND COOKING
Queensland
Switch both to electric
Elsewhere
Neutral (better for large households)
No
HOT WATER AND HEATING
Sydney
Stay on gas
Adelaide
Neutral
Elsewhere
Switch both to electric
HOT WATER AND COOKING
Queensland
Switch both to electric
Elsewhere
Neutral (better for large households)
Three
Heating
Yes Switch all to electric (neutral in Sydney)
No
Sydney
Stick with gas (neutral outside
CBD)
Elsewhere
Switch all to electric (neutral in Adelaide and for small and
medium households in Melbourne)
Hot water
Yes
Sydney, Adelaide, Brisbane
Stick with gas
Elsewhere
Switch all to electric (neutral: Melb., small/med in
Dubbo and Wodonga)
No
Sydney, Adelaide, Brisbane
Stick with gas
Elsewhere
Switch all to electric (neutral: Melb., small/med in
Dubbo and Wodonga)

Household Fuel Choice in the NEM 6
KP137 www.ata.org.au 21 May 2018
Recommendations ATA’s general recommendations from this study are as follows: Recommendation 1: Educate the building and energy industries, along with new home buyers, of the substantial value of solar-based, all-electric homes. The major finding of this study, is that by choosing an all-electric home with solar PV, a new home buyer will be in the order of $9k to $18k better off over 10 years, as compared with establishing that home as dual fuel (i.e. electricity and gas) without solar. This finding applies to the majority of Class 1 dwellings that will be built across Australia over the coming decade. According to the RBA1, Class 1 dwelling approvals total approximately 150,000 in 2015, having been relatively consistent for the preceding 20 years. At this pace, new Class 1 dwelling approvals would total almost two million by 2030. Very few of these would be unable to install solar PV for technical reasons. Given the rate of connection to the reticulated gas grid of new homes in the major Australian cities, it is imperative that consumers understand the significant cost impact of choosing to establish a new home as dual fuel versus all-electric with solar. Recommendation 2: Review of policy and programs that subsidise/support the expansion of gas networks. Given the clear finding of this study regarding the economics of solar all-electric Class 1 new dwellings, it is critical that all governments and regulators with an interest in energy infrastructure review policies that seek to promote the expansion of reticulated gas networks to greenfields sites. To continue to promote reticulated gas to new Class 1 dwellings is to lock most of those new home buyers into significantly higher energy costs for the medium to longer term. The National Gas Objective states:
"promote efficient investment in, and efficient operation and use of, natural gas services for the long-term interest of consumers of natural gas with respect to price, quality, safety, reliability and security of supply of natural gas."
Continued expansion of reticulated gas to most greenfield developments across the NEM fails this objective on at least two important counts:
• The infrastructure delivered could not, by any credible measure, be considered ’efficient investment’; and as such
• such programs are clearly no longer in the ‘long term interests of consumers’, with particular reference to price.
Since the capital cost implications for existing all-electric households considering connecting to a new gas network are similar to or higher than they are for new homes, and gas prices in new areas of the network are usually higher than elsewhere, expansion of gas networks to existing residential is also likely to offer no financial benefit to households and thus may similarly fails the National Gas Objective. This needs to be verified by additional modelling.
1 https://www.rba.gov.au/publications/bulletin/2016/jun/3.html

Household Fuel Choice in the NEM 7
KP137 www.ata.org.au 21 May 2018
Recommendation 3: Provide better information for consumers regarding the cost of owning and operating gas and electric appliances. This analysis further strengthens the 2014 results that gas is no longer the cheapest fuel source for some residential activities in many locations. As such, consumers need to be better informed of the real cost of purchasing and operating both gas and electric appliances in order that they can confidently make better decisions regarding those appliance choices that are in their long-term interest. The role of governments and industry here is to assist in the provision of accurate, targeted information and advice, that is easy to understand, and that assists consumers in making these choices over the medium-to longer term. Recommendation 4: Strengthen the regulatory oversight of the marketing of gas as cheaper and more efficient than electricity. Questionable, and in some cases deceptive, claims about the affordability of gas continue to be communicated by gas appliance sellers, gas retailers and gas networks – often with very little detail as to how individual appliance loads and running costs are calculated, and little regard for appropriate alternatives.
ATA recommend that the ACCC and/or relevant jurisdictional departments of consumer affairs dedicate focus and resources to monitoring relevant marketing material in this area. Recommendation 5: Provide support to landlords, and disadvantaged owner-occupiers, to replace less efficient and expensive-to-run appliances with more efficient appliances.
Assistance measures – such as and low/no interest loans, rebates, energy efficiency schemes – should be provided to disadvantaged consumers, considering the findings of this report with respect to distributional impacts. These policies should be technology agnostic and designed in a way that achieves the reduction of the capital cost for the most cost-effective technologies for those consumers who face the strongest capital-cost barriers. Recommendation 6: Consider the impact of fuel switching when making energy consumption and demand forecasts. Energy market institutions and energy businesses use short- and long-range consumption and demand forecasts in planning and decision-making. Since the end result of households basing appliance replacement fuel choice on economic benefit is ultimately for most households to switch away from gas (whether all at once, or one at a time), this trajectory should be considered (along with other observable and predictable trends) when developing such forecasts.
Household Fuel Choice in the NEM 8
KP137 www.ata.org.au 21 May 2018
1.0 Introduction
Energy Consumers Australia (ECA) approved a grant to the Alternative Technology Association (ATA) to update and expand its previous research on the economics of household fuel choices in the National Energy Market (NEM). The objective of this project was to:
• understand the most cost effective way for residential consumers to access stationary energy in the NEM in 2018, taking into account the optimal balance between grid-supplied energy and demand side technologies; and
• improve the understanding of the consumer sector, energy market institutions and the gas and electricity industry of the latest trends in cost effective strategies for households.
The problem statement, as identified by the project Reference Group, is as follows:
Technological changes in heating, hot water and cooking appliances mean that people's understanding of the economics of different fuels may be out of date. Increasing fuel prices make the cost outcomes more significant. Accurate information on the economics of gas and electricity as household fuels for new appliances will help consumers make informed decisions about appliance replacement and inform public policy.
The ATA wishes to thank ECA for again supporting this work.
1.1 Context Cost effective stratgies for household energy management are becoming increasingly complex – with a range of opportunities involving the use of grid (electricity and/or gas) and demand side technologies. More than ever, there is significant confusion among consumers, consumer advocates, governments and the energy industry with regard to making optimal fuel and technology choices to manage household energy use. Whilst the purchase price of new appliances is highly visible, ongoing ownership costs, in particular when comparing across different fuel types, is largely hidden and/or complex. This problem can be exaccerbated by misleading or inaccurate appliance marketing material. The opening of Liquefied National Gas (LNG) export market from Eastern Australia has driven wholesale gas prices from around $3 per gigajoule in late 2010 to around $8 per gigajoule through the 17/18 financial year2. At the same time, recent coal plant closures have increased retail electricity prices substantially – from an average of $30-$40 per megawatt hour in 2005 to $75-$100 per megawatt hour in 20183. Network regulatory decisions have also added price pressure over this timeframe.
2 https://www.aer.gov.au/wholesale-markets/wholesale-statistics/sttm-quarterly-prices
https://www.aer.gov.au/system/files/AER%20gas%20weekly%20report%20-%204%20%E2%80%93%2010%20March%202018.pdf
3 https://www.aemo.com.au/Electricity/National-Electricity-Market-NEM/Data-dashboard#average-price-table

Household Fuel Choice in the NEM 9
KP137 www.ata.org.au 21 May 2018
Retail fixed daily charges for residential consumers to be connected to both mains gas and mains electricity networks are fast approaching $1,000 per year in certain network areas. On the demand side, the cost and efficiency of major residential heating appliances continues to improve; whilst solar photovoltaic (PV) technology has become even cheaper at larger scale and more efficient4. Space heating/cooling and water heating are typically the two most energy-intensive residential activities. Space heating and hot water can be supplied by electric or gas appliances. Electrical technology used to heat air and water, historically inefficient and high cost, is becoming increasingly efficient. Heat pumps (commonly known as reverse-cycle air conditioners) for space heating have reached coefficients of performance (CoP) of 5.95 – meaning that for every 1-kilowatt hour of energy input to the system, 5.9 kilowatt hours are generated to heat air. CoPs for the most efficient electric heat pumps (for water heating) now exceed 4.0. Gas hot water and space heating systems have also increased in efficiency over recent years, with the most efficient systems on the market achieving a CoP of 0.9. Heat pumps and other electric appliances also have the potential to be powered directly by on-site solar PV. The levelised cost of electricity from rooftop solar PV in Melbourne (which has one of the lowest levels of solar irradiance in the country) using 2018 prices is around eight cents per kilowatt hour6 – around one-third the price of a Melbourne retail electricity tariff. Solar PV in all other parts of the country (apart from Tasmania) generate electricity at a cheaper price than this. Cooking is the third residential activity for which either electricity or gas can be used – albeit with significantly lower overall energy consumption. Meaningfully comparing fuel and appliance choices is complex due to the variety of economic and other considerations that households are faced with in making such a decision.
4 A good quality 5 kilowatt solar PV system now costs as little as $5,000 and provides almost twice the annual
electricity demand of the average Victorian and NSW home. In 2013, a 5 kilowatt system would have required 25 panels; in 2017, this has fallen to 15.
5 https://www.daikin.com.au/our-product-range/split-system-air-conditioning/us7#tech-specs 6 ATA analysis using the Sunulator solar model. LCoE measured over 25 years, inverter replaced at years 10 &
20.
Household Fuel Choice in the NEM 10
KP137 www.ata.org.au 21 May 2018
1.2 Project Support
1.2.1 Reference Group
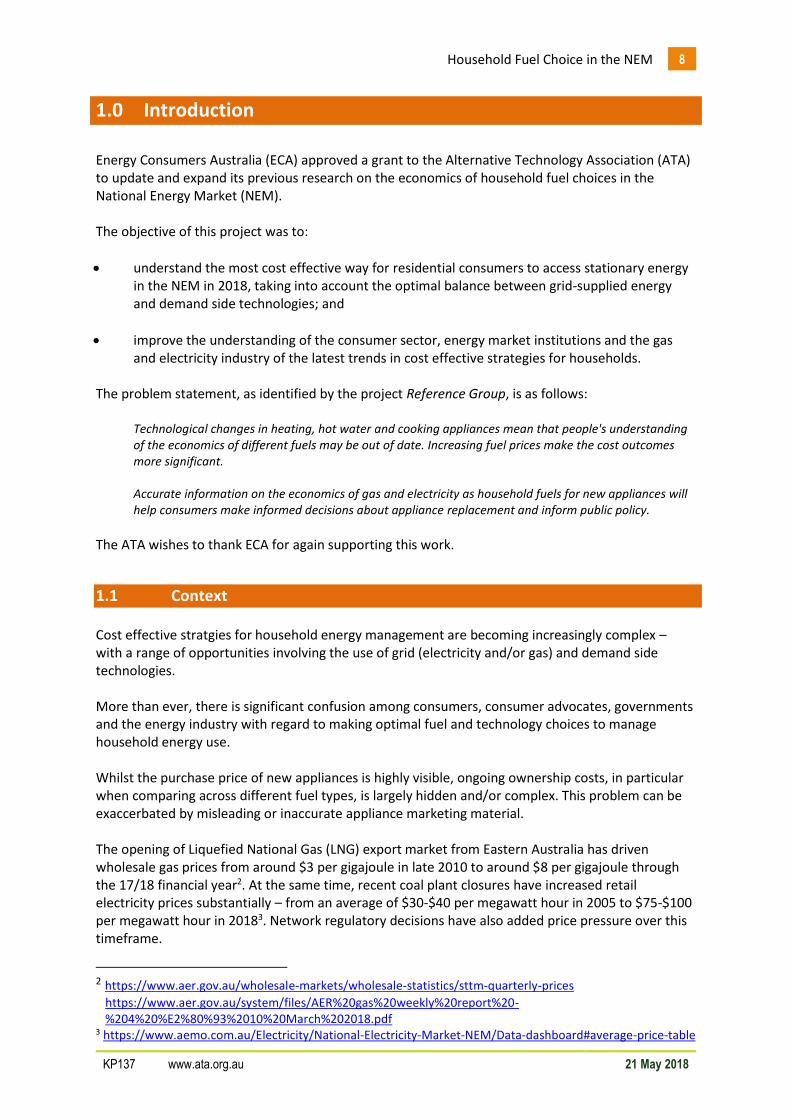
ATA were greatly assisted in this exercise by a project Reference Group. The Reference Group was made up of energy consumer advocates, technology speciaslists, gas and electricity businesses and other policy analysts, as per the table below. The Reference Group informed model development and In particular, were key in assisiting ATA to ensure that appliance choices were locationally appropriate. It should be noted that the findings and recommendations presented in this report are not necessarily the views of all Reference Group members. ATA wishes to sincerely thank all group members for their contributions throughout the project:
Table 2: Project Reference Group
Name Organisation Role/Representing
Alan Pears RMIT Technology specialist
Gavin Dufty St Vincent de Paul Tariffs, consumers
Tim Forcey Melbourne Energy Institute Technology specialist
Damian Sullivan Brotherhood of St Laurence Consumers, social welfare
David Blowers Grattan Institute Gas industry knowledge, modelling/research expertise
Danielle Beinart Jemena Gas Networks Gas industry
Jai McDermott Multinet Gas Gas industry
Ben Martin Hobbs CUAC Consumers, policy
Fiona Hawthorne QCOSS Consumers, social welfare
Consultants Frontier Economics Expert Modeller
1.2.2 Consultant Review
The project also benefited from independent peer review by energy market consulting firm Frontier Economics. Please refer to the separate report prepared by Frontier that has guided the early development of the ATA model.

Household Fuel Choice in the NEM 11
KP137 www.ata.org.au 21 May 2018
2.0 Methodology
The objective of this project is to capture as many household types, climate zones, appliance replacement cases and gas and electricity pricing zones as possible, in order that the results provide useful guidance for the widest number of residential consumers. The economics of gas and electric appliance choices is sensitive to a range of interrelated factors, which include:
• whether or not an appliance is at or near the end of its asset life;
• whether the decision incurs the cost of a new connection or new fixed charge;
• whether the decision avoids the cost of existing fixed charges;
• current gas and electricity tariffs and tariff structures;
• forecast prices for electricity and gas;
• whether the consumer can generate some of their own electricity with a solar PV system, avoiding paying the retail price for some of the household electricity consumed;
• consumer financial expectation, including the cost of capital and return on investment expectations for any individual consumer; and
• the annual input energy use of individual gas and/or electric appliances, which is itself influenced by:
o building type, size and thermal performance;
o the efficiency of that appliance;
o climate zone (with reference to space and water heading loads and the performance of electric systems).
2.1 Changes from the 2014 Project The 2018 project is a follow up to the original modelling undertaken by ATA in 2014. Conducted across 26 gas pricing zones, the 2014 project calculated the 10-year capital and operational costs of new gas appliances and electric alternatives for six different household types. Different replacement cases considered whether an existing gas appliance was near the end of its asset life. The 2018 project slightly reduces the number of household types and replacement cases, whilst increasing the complexity of the individual scenarios modelled. Specifically:
• The number of household types have been reduced from six to five, but with different load profiles representing different lifestyles. A household type is a dwelling size with a specific load profile:
o Given its extremely high fuel costs, the ‘LPG’ (i.e. bottled rather than mains gas)
dwelling type modelled in 2014 returned significantly positive 10-year NPVs in favour of the electric appliance alternative under every scenario modelled. ATA considers that the economic case in favour of the efficient electric alternative, as compared with the LPG home, has been proven and does not require revisiting in the 2018 project;

Household Fuel Choice in the NEM 12
KP137 www.ata.org.au 21 May 2018
o The ‘Public Housing’ dwelling type was modelled in 2014 based on the characteristics of a typical public housing dwelling. This was done to influence a long-standing Victorian Government policy that prevented the use of more efficient reverse cycle air conditioning for heating in public housing. This policy has since been revisited post the 2014 work; In addition, the fixed-price structure of energy concessions in the other jurisdictions meant that the difference in outcomes between ‘Public Housing’ and the equivalent standard dwelling type in that jurisdiction were insignificant. On this basis, ATA considers this scenario does not need revisiting in 2018;
o The four other household types modelled in the 2014 project – Small Existing, Medium Existing, Large Existing and New Home (Large) – have been retained with different load profiles for each and two load profiles for the medium existing home, for a total of five household types:
Table 3: Household Types, 2018
Household Type Occupants Energy Rating Notes
Small Home 1-2 Persons 3 Star Typical small detached/semi-detached
Stay at Home Family7 2-3 Persons 3 Star Moderate usage during working hours
Working Family 2-3 Persons 3 Star Low usage during working hours
Large Home 4-5 Persons 3 Star 10+ year old house, urban fringe
New Build 4-5 Persons 6 Star Different capex assumptions to above
o Feedback from Frontier Economics was to include a household type based on an
apartment. This is particularly due to the increasing prevalence of apartments as new build stock in Sydney and Melbourne.
ATA recognises the importance of analysing apartments in the model. Unfortunately, due to project budget constraints, ATA could not fit this household type in the model at this stage, however we will be seeking additional funding to include apartments in later project versions.
The 2014 replacement cases included replacing an existing gas appliance that was not within five years of the end of its asset life. The majority of 2014 results for this replacement case favoured retaining the existing gas appliance. Given this, and that it is generally un-wise to replace major appliances only a few years after they have been installed, ATA has discarded this replacement case in 2018. However it’s worth noting that in most cases we examined where replacing an end-of-life gas appliance with equivalent electrically-powered appliance(s) was economically beneficial, replacing other gas appliances at the same time and disconnecting entirely from gas improved the benefit.
7 Greater energy use during the day time

Household Fuel Choice in the NEM 13
KP137 www.ata.org.au 21 May 2018
• The number of locations has also been reduced from 26 to 17:
o The number of gas zones included in 2014 was a recognition of the potential variation in retail tariffs in Victoria and NSW. However, in practice the price differences across a number of these zones (particularly in Victoria) were non-material. In 2018 we have tried to avoid duplication of gas zones where price and climate are similar.
• The value of on-site solar photovoltaic (PV) generation has been included in the 2018 modelling:
o The purpose of the 2014 work was to understand grid and bottled gas versus grid
electricity costs and benefits at an appliance level. Given both its prevalence in the NEM and its ability to generate electricity significantly cheaper than peak or flat retail electricity tariffs in all jurisdictions, the value of solar PV has been included in the 10 year and 20 year NPV results in the 2018 modelling. Each scenario has been modelled three times: without solar PV, with an existing 2.5 kW solar PV system (thus excluding its capital cost), and with a new 5 kW solar PV system (including the capital cost).
Overall, this approach means around 7,040 separate scenarios have been modelled for the 2018 project.
2.2 Calculating Energy Usage The 2018 project also uses a different methodology for calculating space heating and hot water loads, and energy usage overall. In 2014, we used estimates of heating loads and hot water energy usage from several external sources8. This time, ATA developed two new models that calculate space heating and cooling and hot water loads using parameters such as ambient temperature, number of occupants, thermal performance and dwelling size, to determine granular energy requirements tailored to household characteristics and location:
• The Heating and Cooling model determines hourly heating and cooling requirements by location, building thermal performance and heating/cooling appliance type; whilst
• The Hot Water determines daily hot water usage by location and hot water appliance type. The energy output requirements calculated by these models are then used to determine half-hourly electricity consumption or daily gas consumption profiles for relevant appliances to meet those end use loads:
• Energy usage for cooling is added to baseline household electricity load profiles to reflect climatic differences;
• Usage for heating and hot water are added to electricity load profiles (as half-hourly consumption) or daily gas profiles as appropriate; and
8 For heating loads: modelling by Nationwide House Energy Rating Scheme (NatHERS) and Beyond Zero
Emissions (BZE); for hot water energy usage: research by EnergyConsult and Pitt & Sherry.

Household Fuel Choice in the NEM 14
KP137 www.ata.org.au 21 May 2018
• Cooking loads are still derived from third-party estimates but added in the same way on a half-hourly or daily basis depending on fuel.
Calculating energy loads in this way means the results are more tailored to household type and location. It also makes it possible to include the value of home solar PV generation in scenarios that include a shift to electric appliances. To understand the methodologies used for developing the space heating, hot water and cooking loads, the solar generation and current and future tariffs, please refer to Appendices A to E.
2.3 Appliance Choice The entire range of available new gas, electric and solar appliances available for space heating, water heating and cooking were considered for inclusion within the model. In narrowing these down to which appliances to analyse, and to a shorter list of models for detailed economic analysis, we have considered the following questions of each type:
• Is it common and generally accepted by consumers in a given location?
• Is it available on the mass market and supported by mature supply chain?
• Is it energy efficient, relative to other appliances of the same fuel type?
• Is the purchase price in a realistic range for mass-market consumers?
• Is it acceptable for mass-market consumers with respect to quality, convenience and amenity?
• How is it comparable with equivalent appliances of different fuel types with respect to quality, convenience and amenity? In keeping with the context and intent of this research, this analysis considers the consumer experience of gas appliances to be the benchmark against which any electric equivalents should be compared. Appliances considered inferior to gas are therefore excluded.
• Is it widely accepted as safe to use in normal use?
• With respect to cost and performance characteristics, is it materially dissimilar to other appliance types analysed, such that we can’t assume that the same conclusions can be drawn as for other appliances?
The model assumes that gas heating is ducted in Victoria, ACT and all newly-built homes regardless of location. In existing homes in Tasmania, South Australia, New South Wales and Toowoomba, the model assumes that heating is via a gas wall furnace with supplementary portable gas heaters (one to three, depending on dwelling size). ATA did not model gas heating in Brisbane due to its low incidence. In addition, as there is little mains gas in Tasmania, the Hobart results apply to very few people. For electric heating, the model uses reverse-cycle air conditioners, with a large unit in the main living area and smaller units elsewhere (one to three, depending on dwelling size). For hot water, the model assumes gas hot water is instantaneous for small and medium dwellings, and storage for large ones. Electric hot water is heat pump storage for all dwellings, timed to heat during the day when solar generation is available.

Household Fuel Choice in the NEM 15
KP137 www.ata.org.au 21 May 2018
For cooking we’ve assumed that gas stoves comprise gas cooktop with gas oven, and electric stoves comprise induction cooktop with resistive electric oven. We recognise that the gas cooktop/electric oven combination has become more popular, but this would add more complexity to the modelling for no additional value, since cooking loads are so small that they don’t in themselves materially affect the outcomes. The following tables outlines the specific appliances chosen for each replacement case by household type:
Table 4: Appliance Replacement Selections by Household Type, Space Heating
Gas Gas (Vic & ACT) Electric
Working Family 1 Wall Furnace
2 Portable Units Ducted
(80MJ burner) 1x7kW RCAC 2x3kW RCACs
Stay Home Family 1 Wall Furnace
2 Portable Units Ducted
(80MJ burner) 1x7kW RCAC 2x3kW RCACs
Small House 1 Wall Furnace 1 Portable Unit
Ducted (50MJ burner)
1x7kW RCAC 1x3kW RCACs
Large House 1 Wall Furnace
3 Portable Units Ducted
(120MJ burner) 1x7kW RCAC 3x3kW RCACs
New Build Ducted
(120MJ burner) Ducted
(120MJ burner) 1x7kW RCAC 2x3kW RCACs
Table 5: Appliance Replacement Selections by Household Type, Water Heating & Cooking
Water Heating
Gas
Water Heating
Electric
Cooking
Gas
Cooking
Electric
Working Family Instantaneous Heat Pump (150L tank)
Gas oven & cooktop
Electric oven Induction cooktop
Stay Home Family Instantaneous Heat Pump (270L tank)
Gas oven & cooktop
Electric oven Induction cooktop
Small House Instantaneous Heat Pump (270L tank)
Gas oven & cooktop
Electric oven Induction cooktop
Large House Gas Storage Heat Pump (340L tank)
Gas oven & cooktop
Electric oven Induction cooktop
New Build Gas Storage Heat Pump (340L tank)
Gas oven & cooktop
Electric oven Induction cooktop

Household Fuel Choice in the NEM 16
KP137 www.ata.org.au 21 May 2018
2.4 Model Structure For residential consumers, the primary use of reticulated (mains) gas occurs for any combination of the following end-use energy services:
• space heating (warming rooms and buildings);
• water heating; and
• cooking. Each of these end uses can be supplied by either gas or electric appliances. Regarding consumer decision making, an individual consumer may be considering:
• switching one or two gas appliances with electric appliances (or vice versa), and retaining an existing mains gas connection;
• a complete switch from gas to electric appliances, with subsequent disconnection from the mains gas network; or
• establishing a new connection to the mains gas network, and purchase of new gas appliances, for:
o an existing home without mains gas; or
o a newly built home.
2.4.1 Replacing Gas Appliances in Existing Homes
Household types 1 to 4 consider scenarios where a decision to replace one or more existing gas appliances is made at the point where it has failed or is highly likely to require replacement within five years. The options are either to: 1. replace the gas appliance/s with a new, efficient gas appliance (this is considered the Business
as Usual – BAU case); or
2. replace the gas appliance/s with an efficient electric appliance/s. Under option 2, there is also the case where all gas appliances are replaced with efficient electric alternatives, avoiding the need for an existing mains gas connection. In this case, the consumer:
• avoids the ongoing fixed charge incurred by maintaining the gas connection; and
• may incur a charge for temporary or permanent isolation of the gas supply to their home. (This is applied in the modelling according to the location and the specific costs of the local gas network.)
2.4.2 Choosing Appliances for New Homes
Household Type 5: New build considers the scenario where a new home is built and installs efficient electric appliance/s and does not connect to the gas network. Under this option, the consumer also avoids any ongoing fixed charge incurred by maintaining a gas connection.

Household Fuel Choice in the NEM 17
KP137 www.ata.org.au 21 May 2018
3.0 Results
This chapter presents the results of the scenarios modelled. Each scenario is presented in terms of the 10-year value of choosing a new efficient electric appliance, instead of a new gas appliance. For new homes, this decision occurs during the planning stage for the new home build. No appliances (gas or electric) exist to this point. For existing homes, this decision occurs at the point at which the existing appliance has (or is near) failed and requires replacement. The model compares the total cost of ownership (i.e. purchase, installation and running cost) using a 10-year net present value (NPV) framework (see box for further explanation of NPV). All future cash flows/benefits projected in the model have been discounted by 2.5% real, to reflect typical household mortgage costs (net of inflation). The results are structured under four main sub-headings: 1. New homes – with and without solar PV;
2. Existing homes with one gas appliance;
3. Existing homes with multiple gas appliances; and
4. The value of existing solar.
Net Present Value (NPV) Costs and benefits are expressed as net present value (NPV) over 10 years. This expresses the value in today’s dollars, accounting for inflation, with a higher NPV being better. For example, where a large home replaces a gas storage HWS with a heat pump HWS (which is more expensive than replacing it with a new gas storage HWS), an NPV of +$2000 means that the household has saved enough from the cheaper running costs of the heat pump to pay off the higher upfront cost, and then save an additional $2000 over the 10 years. Where the 10-year NPV is between –$1000 and +$1000, we consider it ‘marginal’ because a small variance in household behaviour or purchase or installation price could make a positive NPV negative, or vice versa. This makes it an ‘either/or’ case, where the economics mean it doesn’t make much difference which fuel is chosen.

Household Fuel Choice in the NEM 18
KP137 www.ata.org.au 21 May 2018
3.1 New Homes
Finding: Go All-Electric with Solar For new homes, the best choice is clear: go all-electric and install solar PV (see Figure 1). In every location around Australia, the model found significant value (between $9k and $18k over 10 years) from establishing a solar / all-electric home instead of a dual fuel home (i.e. gas and electric) with no solar. The worst return was in Melbourne, largely due to its relatively lower value of solar PV and relatively low gas tariffs. But even in Melbourne, a new home owner will be almost $10k in front after 10 years.
Figure 1: New homes choosing all-electric over gas, with/without solar, 10-year NPV
The reasons for this differ depending on location. In Hobart, it’s the savings from choosing to heat via efficient electric rather than gas. In Adelaide, the householder benefits from better solar conditions and the avoidance of high electricity costs. But, in every case, for a new home the best option is all-electric with solar PV. The modelling is only relevant to detached or semi-detached homes (i.e. Class 1 dwellings under the Building Code of Australia). Most of these types of homes can install solar PV:
• With solar panels becoming more efficient, a 5kW system now requires significantly fewer panels (approximately 15, or less than 30 m2 of roof space). This trend will continue, with the latest laboratory-proven solar cells now 70% more efficient9 than the current commercially available modules;
• Where roof size may be an issue, new home owners will still achieve significant benefit from smaller systems (3kW-4kW);
9 https://newsroom.unsw.edu.au/news/science-tech/milestone-solar-cell-efficiency-unsw-engineers

Household Fuel Choice in the NEM 19
KP137 www.ata.org.au 21 May 2018
• Where orientation may be an issue, east/west facing panels typically deliver above 80% of the benefit of a true north facing array. With the cost of solar panels so low, a minor trend is emerging in the market to install panels south-facing, which still achieves around 70% of maximum yield; and
• Where multiple roof planes or minor shading may be an issue, a range of technologies exist to overcome these impacts on generation (e.g. micro-inverters, optimisers).
On this basis, it is unlikely that more than 1 in 10 new Class 1 dwellings around Australia would be unable to install solar PV. In the relatively small number of cases where a new home is unable to install solar, going all-electric was still the best option in almost all locations. However, the level of benefit varies much more. The value is highest in Hobart, Toowoomba, and Canberra; while in Adelaide and Sydney, it’s marginal.
3.2 Existing Homes – One Gas Appliance
Finding: Always Replace with Efficient Electric The model found that when a home only has one gas appliance, it is always better to replace it (when it is due for replacement) with an efficient electric one, in all circumstances and locations. Even in places where the running cost of gas is lower than for electric appliances, it is outweighed by the value of abolishing the fixed charge of the gas connection. The smallest benefit is when replacing a gas hot water system with a heat pump for a small house in Hobart, but even in this case, the 10-year NPV is greater than $1,000. Figure 2 illustrates outcomes in 11 locations when the last gas appliance is hot water:
Figure 2: Existing homes replacing gas hot water with heat pump and leaving gas, 10-year NPV
The additional value of an existing solar PV system (2.5 kW) to the gas hot water with heat pump replacement scenario is demonstrated below:
Household Fuel Choice in the NEM 20
KP137 www.ata.org.au 21 May 2018
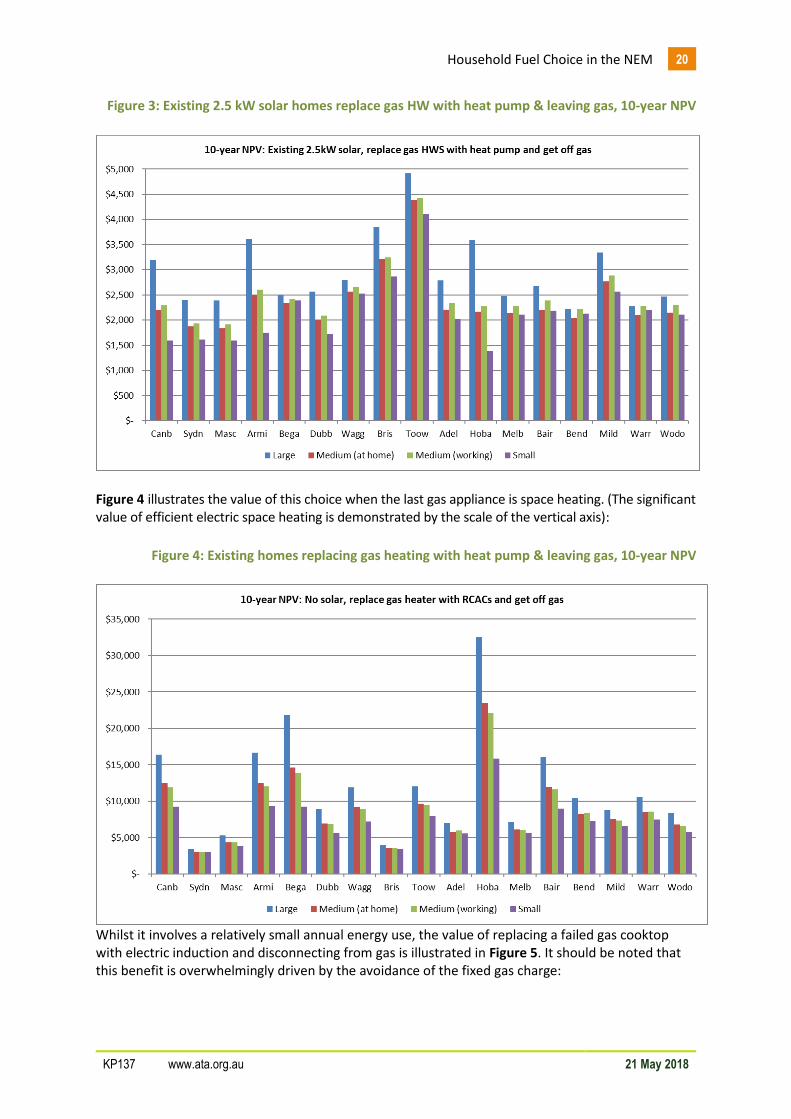
Figure 3: Existing 2.5 kW solar homes replace gas HW with heat pump & leaving gas, 10-year NPV
Figure 4 illustrates the value of this choice when the last gas appliance is space heating. (The significant value of efficient electric space heating is demonstrated by the scale of the vertical axis):
Figure 4: Existing homes replacing gas heating with heat pump & leaving gas, 10-year NPV
Whilst it involves a relatively small annual energy use, the value of replacing a failed gas cooktop with electric induction and disconnecting from gas is illustrated in Figure 5. It should be noted that this benefit is overwhelmingly driven by the avoidance of the fixed gas charge:

Household Fuel Choice in the NEM 21
KP137 www.ata.org.au 21 May 2018
Figure 5: Existing homes replacing gas cooktop with induction and leaving gas, 10-year NPV

Household Fuel Choice in the NEM 22
KP137 www.ata.org.au 21 May 2018
3.3 Existing Homes – Multiple Gas Appliances The situation is more nuanced if an existing home has more than one gas appliance and one of them fails.
3.3.1 Gas Space Heater Replacement
Finding: Replace with Efficient Electric
If a gas space heater fails, the model suggests it will be cheaper overall in all locations if you replace it with electric reverse-cycle air conditioners (Figure 6). However, in inner Sydney the benefits are relatively marginal, where it will cost roughly the same as sticking with gas. (This is one example of the impact of even small variations of climate. The ‘Sydn[ey]’ location is a distinct climate zone covering the CBD and environs; while ‘Masc[ot]’ is more representative of Sydney in general. The difference is enough to make this replacement case positive for most of Sydney but neutral for central Sydney.)
Figure 6: Existing homes replacing failing gas heater with RCACS and keep gas stove, 10-year NPV
A key question as part of this scenario is whether to replace other gas appliances at the same time. If the existing home also has a gas stove, switching a working stove to electric at the same time as the heater gives a financial benefit in all locations (Figure 7).

Household Fuel Choice in the NEM 23
KP137 www.ata.org.au 21 May 2018
Figure 7: Existing homes replacing failing gas heater & working gas stove with efficient electric, 10-year NPV
This is further improved for households with solar. If the existing home has both a gas stove and gas hot water, there’s still a financial benefit in most places (and marginal benefit in a few) from switching them to electric at the same time, except for Sydney (Figure 8). However, it should be noted that the three locations where there is marginal or no benefit in fuel-switching three gas appliances when the heating fails (Melbourne, Adelaide, and Sydney) comprise almost half the population of Australia. Again, this benefit is further improved if the household has solar on site. This gives all locations a solid benefit of the all-electric switch, except in Sydney where gas is still favoured (though only marginally for large households).

Household Fuel Choice in the NEM 24
KP137 www.ata.org.au 21 May 2018
Figure 8: Existing homes replacing failing gas heater, working gas hot water & stove with efficient electric, 10-year NPV
In the gas heater-switching scenarios, if the existing home already has a reasonably efficient reverse-cycle air conditioner in the living area, this can be used, requiring one less new appliance to purchase/install when switching to electric. The saving from this is enough to make a marginal benefit positive and to turn a marginal loss into a marginal benefit. Over one third of Australian households (38%) use electricity as the main source of energy for heating, with NSW, QLD, SA, TAS and the ACT all represented significantly (between 40% and 65%)10. Obviously, a significant proportion of these would have an existing RCAC (or multiple), in homes where gas space heating is also in place. The chart below demonstrates the annual value of using an existing RCAC, instead of an existing gas wall furnace, to heat 50 m2 of living space. The analysis considers the tariffs used in the modelling for each location, an existing home of 3 Star energy rating, and assumes that both the wall furnace and RCAC are around 10 years old, with the following CoPs:
• 0.7 for the gas wall furnace11; and
• 3.5 for the RCAC12.
10 http://www.abs.gov.au/ausstats/[email protected]/mf/4602.0.55.001 11 http://media.bze.org.au/bp/bp_appendix_9.pdf 12 http://www.airandwater.com.au/blog/replace-repair-air-conditioner/

Household Fuel Choice in the NEM 25
KP137 www.ata.org.au 21 May 2018
Figure 9: Annual saving - RCAC v gas wall furnace, heating 50 m2
As can be seen, in all locations, space heating with the RCAC is cheaper, with Adelaide and Sydney offering relatively less value due to higher electricity tariffs and relatively lower heating loads; whilst Melbourne has relatively low gas tariffs. Further analysis on the case for existing RCACs versus gas heaters should be undertaken, including where homes have multiple existing RCACs and gas heaters in place.
3.3.2 Gas Hot Water Replacement
Finding: It Depends
If a hot water system fails and it’s not the only gas appliance, the model suggests replacing it with either another gas hot water system or a heat pump system, depending on:
• the location;
• what other appliances are also on gas; and
• whether other gas appliances are replaced even though they are not at end-of-life (to save on the fixed cost of a gas connection by leaving the network).
When only replacing the hot water system, in many cases the outcomes are not very different: the 10-year NPVs are relatively marginal across most scenarios and locations. Of the 44 scenarios in Figure 10, more than half (28) suggest either:
• a 10-year benefit from choosing gas of less than $1,000 (25 scenarios); or
• a 10-year benefit of between $400 and $1,200 of choosing the electric heat pump (three scenarios).

Household Fuel Choice in the NEM 26
KP137 www.ata.org.au 21 May 2018
The energy usage of modern, efficient gas hot water systems (in particular, gas instantaneous units) is nearly always low enough that the greater efficiency of heat pumps can’t outweigh their additional capital cost over 10 years. The relatively lower gas prices in many areas also favour gas hot water systems in those locations:
Figure 10: Existing homes replacing failing gas hot water with heat pump & keep gas stove, 10-year NPV
The value of this choice to an existing home with 2.5 kW of solar PV is moderately improved, making most cases marginal – the value of gas materially exceeds $1,000 over ten years only in Bega, Wagga, Bendigo, Mildura, and small households in Canberra (Figure 11)
Figure 11: Existing 2.5 kW solar homes replacing failing gas hot water with heat pump & keep gas stove, 10-year NPV

Household Fuel Choice in the NEM 27
KP137 www.ata.org.au 21 May 2018
Where the householder replaces the existing gas unit with a heat pump, as a first step towards an all-electric home, results may be more favourable when the other replacements are done – but not in all locations. If a hot water system fails and the existing home has a working gas stove, switching both to electric at the same time is a financial benefit for large households in many locations (though often marginal), and all households in Queensland. (Figure 12)
Figure 12: Existing homes replacing failing gas hot water & working gas stove with electric, leave gas, 10-year NPV
For small and medium households, sticking with gas is a marginal financial benefit in some places (e.g. Melbourne, Sydney, Adelaide and Canberra) and a marginal cost elsewhere (e.g. Wagga, Mildura). Having 2.5 kW solar increases the benefit of efficient electric enough for most medium and large households outside of Queensland to make switching to all-electric a neutral or (marginally) positive choice (Figure 13). If a home with a failed gas hot water system also has both gas heating and cooking, the value of heating with RCACs rather than gas combined with the value of avoiding the gas fixed charge is such that switching the remaining gas appliances to electric and leaving the gas network is a substantial benefit in most locations (Figure 14). However, it has negative value in Sydney and Adelaide, and marginal value in some other locations (such as Melbourne, Wodonga, and Dubbo), meaning that this switch may not be a good choice for the approximately half of Australian households in those locations.

Household Fuel Choice in the NEM 28
KP137 www.ata.org.au 21 May 2018
Figure 13: Existing 2.5 kW solar homes replace failing gas hot water & working gas stove with electric, leave gas, 10-year NPV
Figure 14: Existing homes replacing failing gas hot water, working gas heater & stove with electric, leave gas, 10-year NPV

Household Fuel Choice in the NEM 29
KP137 www.ata.org.au 21 May 2018
If these homes have existing 2.5 kW solar PV systems, the value of switching completely off gas is improved across the board. However, it’s still a negative outcome in Sydney and Adelaide (though only marginally so for small Adelaide households) and a marginal benefit in Melbourne and Dubbo (though large households in Dubbo get a solid benefit).
Figure 15 Existing 2.5 kW solar homes replacing failing gas hot water, working gas heater and stove with electric, leave gas, 10-year NPV
3.4 Value of Existing Solar Whilst adding some strength to the electric case, the model demonstrates that an existing 2.5 kW solar PV system rarely makes an otherwise negative financial outcome (for an electric appliance purchase decision) into a strong positive outcome (i.e. significantly greater than $1,000 benefit over 10 years). This is particularly the case when replacing gas hot water systems with heat pump hot water systems. For example, in places like Canberra, Armidale and Mildura, having an existing solar PV system turns a heat pump hot water appliance choice from a marginal benefit into a strong benefit and, in places like Adelaide, Melbourne and Bairnsdale, it turns a marginal loss into a marginal benefit (Figure 16). A key reason why an existing solar PV system doesn’t overwhelmingly increase the economic attractiveness of replacing gas with electric appliances is that even where a new gas appliance is selected, the existing home will still benefit from the feed-in tariff available in that location. As such, the real value of the existing solar is the difference between the feed-in value and the value of reduced imports from the electricity grid by powering more electrical appliances directly on-site.

Household Fuel Choice in the NEM 30
KP137 www.ata.org.au 21 May 2018
Figure 16: Existing large homes replacing failing gas hot water and working stove with electric, leave gas, 10-year NPV
However, with the price of solar PV having fallen so significantly over the past decade, installing solar onto a roof with good solar access is almost always a good economic decision. Thus, installing new solar at the same time as replacing a failed gas appliance with a new efficient electric one tended to skew the results. Even for a household that chooses to purchase new gas appliances, solar is a good investment.
3.5 Comparison Against 2014 Results The 2014 study demonstrated that, in general, the higher the consumption, the better the economic value in choosing efficient electric appliances. This was since in most cases, the running costs of efficient electric appliances were lower, while the capital costs were higher. Once the lower running cost offset the higher purchase/installation cost, the savings grew. The main exception to this finding in the 2014 model involved cold climates with low gas prices. In the 2018 study, while this still largely holds true, in some areas electricity price increases have outpaced gas price increases, diminishing the volume benefit. In addition, in a small number of places, new gas tariffs have very steep declining blocks, making high gas usage relatively cheaper (Adelaide being the best example). Conversely, much higher fixed charges in many (not all) areas have amplified the benefits of cutting the gas connection, because fixed charges make up a higher proportion of the fuel bill.

Household Fuel Choice in the NEM 31
KP137 www.ata.org.au 21 May 2018
4.0 Findings & Recommendations
4.1 Findings Overall, as compared with the 2014 modelling, some of the 2018 results were different and others stayed the same. The differences were largely due to:
• improvements made to the model and general approach (e.g. the ability to calculate more accurate hot water and space heating loads); or
• changes in tariff rates and structures. Increased electricity prices and gas tariff structures that reward high gas usage have made a big difference in some locations.
Overall, 7,040 individual scenarios have been modelled in 2018. Of these:
• 1,760 calculated the “base case” gas appliance replacement costs; and
• 5280 considered the value of choosing the electric alternative – either with or without existing or new solar PV13;
Looking at the electric replacement case scenarios, the following breakdown can be categorised by economic attractiveness:
Table 6: Overall Results Categorisation, Electric Replacement Cases14
Replacement Case Positive Marginal Positive Marginal Negative Negative
Electric 52% 8% 18% 22%
Existing Solar 55% 10% 18% 17%
New Solar 98% 0% 1% 0%
Total 3624 322 641 693
Overall, the results show that:
• 60% favour the electric replacement case without solar;
• 65% favour the electric replacement case with existing solar; and
• 98% favour the electric replacement case with new solar. This summary comes with an important caveat: these results are not weighted by population. Strong cases for gas were disproportionately in Sydney and, to a lesser extent, Adelaide; while marginal cases for both electricity and gas were often in Melbourne and Adelaide. Between them, Melbourne, Sydney, and Adelaide comprise almost half the population of Australia. Future modelling should also weight results by population to give a more comprehensive picture of the implications of the relative economics of gas and electricity as household fuels. Considering the range of results, ATA proposes the following consumer principles regarding the economics of fuel choice decisions at an appliance level:
13 i.e. 1,760 electric no solar; 1,760 electric with existing solar; 1,760 electric with new solar. 14 Positive = 10yr NPV >$1k. Negative = 10yr NPV <-$1k. Marginal Cases are within $1k to -$1k.

Household Fuel Choice in the NEM 32
KP137 www.ata.org.au 21 May 2018
Table 7: General Consumer Fuel Choice Decisions
No. of gas appliances
Appliance needing
replacement Solar? Best economic decision
NEW HOMES
N/A N/A Yes Go all-electric
No Go all-electric (neutral in Sydney and Adelaide)
EXISTING HOMES
One Any Yes Switch to electric
No Switch to electric
Two
Heating Yes Switch both to electric
No Switch both to electric
Hot water
Yes
HOT WATER AND HEATING
Sydney
Stay on gas (neutral outside CBD)
Elsewhere
Switch both to electric
HOT WATER AND COOKING
Queensland
Switch both to electric
Elsewhere
Neutral (better for large households)
No
HOT WATER AND HEATING
Sydney
Stay on gas
Adelaide
Neutral
Elsewhere
Switch both to electric
HOT WATER AND COOKING
Queensland
Switch both to electric
Elsewhere
Neutral (better for large households)
Three
Heating
Yes Switch all to electric (neutral in Sydney)
No
Sydney
Stick with gas (neutral outside
CBD)
Elsewhere
Switch all to electric (neutral in Adelaide and for small and
medium households in Melbourne)
Hot water
Yes
Sydney, Adelaide, Brisbane
Stick with gas
Elsewhere
Switch all to electric (neutral: Melb., small/med in
Dubbo and Wodonga)
No
Sydney, Adelaide, Brisbane
Stick with gas
Elsewhere
Switch all to electric (neutral: Melb., small/med in
Dubbo and Wodonga)
Note: a ‘neutral’ result means the outcome is marginal – the value of switching from gas-powered to electricity-powered appliance(s) being between -$1,000 and +$1,000 over ten years. This means the actual outcome could be either positive or negative, because feasible variations in purchase and installation costs and/or appliance usage could reduce or increase costs by this magnitude. Where a result is neutral:
• The household should undertake a site-specific assessment to determine which choice is more economic; or
• The economics of the fuel choice may be considered negligible, so other factors would more heavily weight the choice.
Household Fuel Choice in the NEM 33
KP137 www.ata.org.au 21 May 2018
4.2 Recommendations ATA’s general recommendations from this study are as follows: Recommendation 1: Educate the building and energy industries, along with new home buyers, of the substantial value of solar-based, all-electric homes.
The major finding of this study, is that by choosing an all-electric home with solar PV, a new home buyer will be in the order of $9k to $18k better off over 10 years, as compared with establishing that home as dual fuel (i.e. electricity and gas) without solar.
This finding applies to the majority of Class 1 dwellings that will be built across Australia over the coming decade. According to the RBA15, Class 1 dwelling approvals total approximately 150,000 in 2015, having been relatively consistent for the preceding 20 years.
At this pace, new Class 1 dwelling approvals would total almost two million by 2030. Very few of these would be unable to install solar PV for technical reasons.
Given the rate of connection to the reticulated gas grid of new homes in the major Australian cities, it is imperative that consumers understand the significant cost impact of choosing to establish a new home as dual fuel versus all-electric with solar. Recommendation 2: Review of policy and programs that subsidise/support the expansion of gas networks.
Given the clear finding of this study regarding the economics of solar all-electric Class 1 new dwellings, it is critical that all governments and regulators with an interest in energy infrastructure review policies that seek to promote the expansion of reticulated gas networks to greenfields sites.
To continue to promote reticulated gas to new Class 1 dwellings is to lock most of those new home buyers into significantly higher energy costs for the medium to longer term.
The National Gas Objective states:
"promote efficient investment in, and efficient operation and use of, natural gas services for the long-term interest of consumers of natural gas with respect to price, quality, safety, reliability and security of supply of natural gas."
Continued expansion of reticulated gas to most greenfield developments across the NEM fails this objective on at least two important counts:
• The infrastructure delivered could not, by any credible measure, be considered ’efficient investment’; and as such
• such programs are clearly no longer in the ‘long term interests of consumers’, with particular reference to price.
Since the capital cost implications for existing all-electric households considering connecting to a new gas network are similar to or higher than they are for new homes, and gas prices in new areas of the network are usually higher than elsewhere, expansion of gas networks to existing residential is also likely to offer no financial benefit to households and thus may similarly fails the National Gas Objective. This needs to be verified by additional modelling.
15 https://www.rba.gov.au/publications/bulletin/2016/jun/3.html

Household Fuel Choice in the NEM 34
KP137 www.ata.org.au 21 May 2018
Recommendation 3: Provide better information for consumers regarding the cost of owning and operating gas and electric appliances.
This analysis further strengthens the 2014 results that gas is no longer the cheapest fuel source for some residential activities in many locations.
As such, consumers need to be better informed of the real cost of purchasing and operating both gas and electric appliances in order that they can confidently make better decisions regarding those appliance choices that are in their long-term interest.
The role of governments and industry here is to assist in the provision of accurate, targeted information and advice, that is easy to understand, and that assists consumers in making these choices over the medium-to longer term. Recommendation 4: Strengthen the regulatory oversight of the marketing of gas as cheaper and more efficient than electricity.
Questionable, and in some cases deceptive, claims about the affordability of gas continue to be communicated by gas appliance sellers, gas retailers and gas networks – often with very little detail as to how individual appliance loads and running costs are calculated, and little regard for appropriate alternatives.
ATA recommend that the ACCC and/or relevant jurisdictional departments of consumer affairs dedicate focus and resources to monitoring relevant marketing material in this area. Recommendation 5: Provide support to landlords, and disadvantaged owner-occupiers, to replace less efficient and expensive-to-run appliances with more efficient appliances.
Assistance measures – such as and low/no interest loans, rebates, energy efficiency schemes – should be provided to disadvantaged consumers, considering the findings of this report with respect to distributional impacts.
These policies should be technology agnostic and designed in a way that achieves the reduction of the capital cost for the most cost-effective technologies for those consumers who face the strongest capital-cost barriers. Recommendation 6: Consider the impact of fuel switching when making energy consumption and demand forecasts.
Energy market institutions and energy businesses use short- and long-range consumption and demand forecasts in planning and decision-making. Since the end result of households basing appliance replacement fuel choice on economic benefit is ultimately for most households to switch away from gas (whether all at once, or one at a time), this trajectory should be considered (along with other observable and predictable trends) when developing such forecasts.

Household Fuel Choice in the NEM 35
KP137 www.ata.org.au 21 May 2018
4.3 Limitations & Further Work With any modelling exercise of this magnitude, there are always limits to the model’s capability and therefore interpretation of findings. Specific limitations to the current version of the ATA model, and therefore suggested further work, is outlined below:
• Tariffs: ATA understands that over 4,000 retail tariffs currently exist for residential consumers across the NEM. Given budget and time constraints for this specific project, ATA was only able to capture the most basic electricity and gas tariff structures that currently affect the widest number of consumers within each pricing zone (see Appendix 9.0 for the detailed methodology). It should be noted that the impact of inclining and declining blocks is captured in the current version of the model. However, regarding electricity, tariff structures are becoming more complex – with three-part time of use (peak, shoulder and off-peak) having been in existence in some jurisdictions for a few years; whilst demand (i.e. kilowatt-based) tariffs beginning to enter the residential market. These more complex tariff structures may change the costs and benefits from any particular fuel choice/appliance decision and more work is required to understand their impact.
• Apartments: The household types used in both the 2014 and 2018 version of the model only pertain to detached or semi-detached (i.e. Class 1) dwellings. With increasing density in Australia’s major cities, apartments are fast becoming a major component of all new dwelling approvals (some 35% in 201616). As such, accurate consumer advice for apartment dwellers is becomingly increasingly important. Apartments function very differently from detached and semi-detached dwellings in their energy loads, typical appliance mix and constraints and opportunities regarding specific appliances and solar. The ATA model needs to be expanded to include the ability to develop appliance-level loads for different apartment types and capture potential value from solar PV. This was a key finding from the Frontier Economics review of the model and something that ATA strongly supports.
• 10 Year NPV: Calculating value over this timeframe is limited regarding the longer-term value of the solar-based households. Solar photovoltaic technology lasts over 20 years with little maintenance requirement and typically only a small “Repex” (replacement Capex) cost to change the inverter sometime between years 10 and 15. Understanding the longer-term value to residential consumers (e.g. over 20 years) would be beneficial in this context. The ATA model currently has the capability to generate 20-year operational costs, longer term Repex and NPVs, with just additional time required for set up and model simulation, along with results analysis and write up.
16 https://www.rba.gov.au/publications/bulletin/2017/jun/pdf/bu-0617-1-houses-and-apartments-in-
australia.pdf

Household Fuel Choice in the NEM 36
KP137 www.ata.org.au 21 May 2018
• Solar value versus fuel switch value: Including solar PV in the 2018 version of the model has allowed ATA to better understand the value of the range of fuel choice options available to residential consumer in the NEM. With such significant value associated with many of the solar-based scenarios, a key question has arisen – What is the value of the solar PV system as distinct from the value of the fuel switch between electricity and gas? The new ATA model has the capability to separate out that part of the 10-year NPV associated with the new or existing solar PV system, from the value of the fuel choice at the appliance level. This simply requires additional time to set up and run additional scenarios that include the value of the solar in the base case.
• Existing RCACs: Following on from the initial analysis undertaken in Section 3.3.1, further work needs to be done to understand the economic case for space heating for those households that have existing RCACs and existing gas ducted or wall furnace systems. Whilst most of the space heating analysis for this project compares RCACs with gas heaters and takes account of the capital cost of both appliances, the reality for a significant proportion of NEM households is that where gas space heaters exist, one or more RCACs are also in existence and can be used for space heating as well as cooling. Over one third of Australian households (38%) use electricity as the main source of energy for heating, with NSW, QLD, SA, TAS and the ACT all represented significantly (between 40% and 65%)17. In considering a transition from an existing dual fuel home to all-electric, where RCACs exist and can serve part of the heating load, this obviously has significant implications for reduced capital cost impacts of this transition.
• Connecting existing all-electric homes to gas: A key scenario modelled as part of the 2014 project considered the case of existing all-electric homes (i.e. without current mains gas connection) choosing to connect to mains gas. This scenario was important at the time in the context of a Victorian Government program to subsidise gas network expansion18. New funding for this program has since been discontinued. However, gas networks continue to be expanded to regional areas in several jurisdictions. A critical decision for energy consumers in these areas is whether they will be better off connecting to mains gas and installing new gas appliances; as compared with remaining all-electric and installing efficient electric appliances and solar PV. Given the strength of the results for the solar / all-electric new home cases presented in this study, connecting existing all-electric to mains gas is unlikely to be the best economic decision for many households across many locations. To understand the economics in detail however, this case needs to be properly analysed using the ATA model.
17 http://www.abs.gov.au/ausstats/[email protected]/mf/4602.0.55.001 18 The Energy for the Regions Program

Household Fuel Choice in the NEM 37
KP137 www.ata.org.au 21 May 2018
• Electric storage hot water: According to the ABS, almost two thirds of existing NSW homes, over 80% of QLD homes and over 40% of South Australian homes use electricity for water heating – with most of these systems comprising electric storage (resistance) water tanks19. Whilst electric storage hot water has long been the scourge of energy efficiency advocates, with the falling cost of solar PV, there now exists the economic opportunity to run electric storage systems directly from solar as opposed to replacing them with more efficient gas or electric hot water systems. The economics of this hot water scenario needs exploration to develop accurate consumer advice, considering the costs of solar electricity, electricity and gas tariffs and annual electric storage hot water loads.
• NEM focus: As with the 2014 project, funding was restricted to the development of the model within the NEM. This means the jurisdictions of Western Australia and the Northern Territory are not included in the results. As in 2014, ATA will again attempt to provide modelling results for Perth after the completion of this project, to understand the current WA context. Given its lack of reticulated gas infrastructure, the NT will not be a focus for the model. However, in future years, it would be desirable to expand the model to include WA locations as part of the base results.
• Emissions: As in 2014, the current model seeks to understand fuel and appliance choice from an economic perspective only. Given the broader debate regarding the environmental impact of different stationery energy sources, it will be important to understand the emissions intensity of each fuel choice and appliance decision. Post the 2014 work, ATA was able to secure some RMIT University funding to analyse the results from an emissions perspective. This showed that in almost all cases, switching from gas to efficient electric appliances reduced greenhouse gas emissions. Since 2014, the closure of coal-fired power stations like Hazelwood combined with the increased rollout of renewable energy has seen the emissions intensity of the NEM decrease. This, coupled with the inclusion of roof-top solar in the current version, means the environmental impact of the 2018 model may be vastly different and requires fresh analysis.
19 http://www.abs.gov.au/ausstats/[email protected]/mf/4602.0.55.001

Household Fuel Choice in the NEM 38
KP137 www.ata.org.au 21 May 2018
5.0 Appendix A: Methodology – Heating & Cooling
The overall aim of the heating and cooling model is to produce plausible daily heating/cooling loads that are sensitive to ambient temperature, household size and occupant behaviour, and are reasonable at the annual aggregate level. Ultimately the same heating and cooling loads (on an annual megajoule basis) are applied whether the scenario involves gas or electric heating appliances. Relevant gas and electric appliances are then selected to serve that heating load (the cooling load is only supplied by reverse cycle air conditioning). The ATA heating model does not do a full “energy balance” (as compared with heating/cooling software such as FirstRate, AccuRate etc), but mimics that behaviour and reconciles back to NatHERS’ annual MJ/m2 results by climate zone. Appropriate specifications for the size and efficiency of relevant gas and electric appliances are then applied and determine the resultant import fuel requirement from the gas or electricity grid (or solar, in the latter case).
5.1 Approach The heating and cooling load (by household type, by location) is generated by the application of specifically sized reverse cycle air conditioners (RCACs) to keep the target indoor temperature within a comfort band, as defined below. Once generated, the heating load as served by the RCACs is then applied to gas space heaters (ducted, wall furnace or portable), considering gas space heater performance, in order to generate an annual gas load (and subsequently operational cost).
5.1.1 Setup
Multiple reverse cycle air conditioners (RCACs) are selected, each defined separately for thermostat and timer settings. It is assumed the multiple RCACs serve heating and cooling loads in different parts of the home. The model also allows for standby power of the RCACs (e.g. the crank-case heater). This is allocated to either the cooling or heating load, whichever is dominant for any scenario.
5.1.2 Analyse Climate
The heating model begins with a Bureau of Meteorology (BoM) dataset of the 30-minute ambient indoor air temperature (over 12 months) for a home without mechanical heating/cooling in that location. A moving average of the ambient temperature is then defined, which includes more intervals for higher building star rating, giving greater smoothing. This results in the "natural" indoor temperature.
Household Fuel Choice in the NEM 39
KP137 www.ata.org.au 21 May 2018
A target indoor air temperature is then set based on user inputs regarding their acclimatised ideal temperature and adjusted for building star rating20.
5.1.3 Calculation by Interval
For each 30-minute interval, the ambient temperature and the simulated indoor air temperature is tracked. The simulated indoor temperature is different to the "natural" indoor temp when the heating is affecting it. The difference between the ambient and simulated indoor temp is used to calculate operating co-efficients of performance of the heat pump units. The divergence between the current indoor temperature and the ideal temperature is calculated, allowing for a tolerance range:
• The tolerance range is +3/-3 from the ideal acclimatised ideal temperature;
• The tolerance range is different during sleeping hours (+1/-2.5). The air conditioner is then turned on if the model is within the timer settings and the indoor temperature is outside the target, considering the tolerance range. While on, the RCAC aims to bring the internal temperature to the target temperature. The RCAC is turned off if the natural temperature reaches target. The model assumes it takes 2 hours to reach the target temperature. After that:
• the RCAC will stay on for 2 hours, maintaining the temperature; and then
• the RCAC will turn off, and the inside temperature will ramp down to the "natural" indoor temperature, taking 1.5 hours.
The RCAC output power level varies during the heating / cooling cycle. The model assumes that during the "maintenance" phase, it only has to run at "steady state" power:
• this is assumed to be 13% of its rated maximum power level for a 5-star home and 5-degree temp diff inside-outside;
• the power level required varies by star rating and temperature differential. The model assumes that for the first interval when the heater turns on, it runs close to maximum power. It then ramps down to "steady state" power during the temperature ramp-up. The input power required by the heater is then multiplied by its co-efficient of performance (CoP) and efficiency. The new indoor temperature is then estimated at the end of the interval.
20 Well-insulated buildings have milder surface temperatures - reduced radiant heat allowing for less
conditioning of air temperature.

Household Fuel Choice in the NEM 40
KP137 www.ata.org.au 21 May 2018
5.1.4 Co-efficient of Performance Calculation
The CoP varies by ambient temperature. To allow for this, the ATA model refers back to the standard test conditions used to state heating/cooling appliance CoPs (i.e. inside 20 degrees, outside 7 degrees). The maximum theoretical heat pump CoP was calculated at standard test conditions. This maximum theoretical CoP was compared against the rated CoP at standard test conditions to derive a ratio. A theoretical heat pump CoP under current conditions of ambient and indoor temperature predicted by the model was then calculated and multiplied by the ratio, to estimate the CoP under current conditions. This varies by partial loading on the air conditioner. The model assumes a 30% improved CoP at 50% loading of the heat pump, with the maximum CoP restricted to 8.0.
5.2 Calibration The annual heating and cooling loads predicted by the ATA model are then calibrated back to the NatHERS star rating bands. The NatHERS bands quantify an annual megajoule per square metre (MJ/m2) heating and cooling load, by building star rating, for 66 locations around Australia21. To calibrate, ATA set up Sunulator to mimic the same occupant behaviour as assumed by NatHERS. Sunulator simulations were run for star ratings 0.5, 3.0, 6.0 and 10.0 in 62 NatHERS locations. Sunulator’s results for heating and cooling energy delivery were then compared against the NatHERS star band table, with the ratio set as a calibration factor. Each of Sunulator's 177 locations was assigned one of these 62 locations as a reference. When running Sunulator, in each interval, the heating/cooling energy delivered was then adjusted by multiplying it by this calibration factor. For buildings with star ratings other than 0.5, 3.0, 6.0 and 10.0, the calibration factor is interpolated. The methodology above calculated the following annual heating & cooling loads by household type, by location, for this project:
21 http://www.nathers.gov.au/files/publications/NatHERS%20Star%20bands.pdf

Household Fuel Choice in the NEM 41
KP137 www.ata.org.au 21 May 2018
Table 8: Annual Gas Consumption for Space Heating by Location by Household Type (MJ p.a.)
Location Stay-Home
Family Large House New Build Small House
Working Family
Adelaide 32,321 44,702 17,466 20,861 30,196
Armidale 63,484 87,331 33,047 40,754 59,041
Bairnsdale 64,300 88,165 33,896 41,144 60,039
Bega 37,371 51,670 20,398 24,113 35,312
Bendigo 75,780 103,964 43,047 48,517 70,560
Brisbane 7,786 10,758 3,905 5,020 7,651
Canberra 60,308 82,049 32,369 38,289 55,671
Dubbo 34,331 46,774 19,039 21,828 32,141
Hobart 74,630 103,387 40,448 48,247 69,478
Melbourne 50,196 69,271 26,837 32,326 46,753
Mildura 34,689 47,352 19,249 22,098 32,241
Sydney 13,204 17,983 7,227 8,392 12,221
Toowoomba 26,698 36,781 17,136 17,165 25,120
Wagga Wagga 49,688 67,709 26,857 31,598 45,998
Warrnambool 73,550 102,657 39,797 47,906 69,115
Wodonga 52,632 71,510 28,726 33,371 48,526
Table 9: Annual RCAC Electricity Consumption by Location by Household Type (kWh p.a.)
Location Large House New Build Small House Stay Home
Family Working Family
Adelaide 1798 1424 899 1437 1295
Armidale 2963 1968 1482 2352 2121
Bairnsdale 3064 2154 1532 2460 2177
Bega 2000 1552 1000 1617 1447
Bendigo 3424 2518 1712 2785 2442
Canberra 2908 2005 1454 2323 2077
Dubbo 1905 1481 953 1562 1380
Hobart 3362 2325 1681 2633 2379
Melbourne 2465 1824 1232 1944 1758
Mildura 1950 1533 975 1548 1404
Sydney 1121 984 561 897 824
Toowoomba 1605 1383 802 1309 1171
Wagga Wagga 2474 1767 1237 1991 1781
Warrnambool 3328 2358 1664 2609 2351
Wodonga 2573 1850 1286 2062 1848

Household Fuel Choice in the NEM 42
KP137 www.ata.org.au 21 May 2018
6.0 Appendix B: Methodology – Water Heating
A “bottom-up” model of hot water consumption for each home type at each location was developed. This represents a more flexible approach than used in ATA’s 2014 analysis and lends itself to producing heat pump electricity consumption data for the solar analysis.
6.1 Mains Water Temperature A key variable is the temperature of water as it arrives at the home. When this temperature is very cold, hot water energy consumption rises due to several factors, for example:
• When mixing hot and cold water in a shower, a higher volume of hot water is required to achieve a comfortable temperature; and
• It takes more energy to produce hot water, as its temperature must be raised further. Mains water temperature is related to ambient air temperature. In general, on an average annual basis, both temperatures are the same. However, unlike the air, mains water does not vary in temperature on a day-to-day basis; instead it changes slowly throughout the year, with a lag effect. Using a methodology documented by the National Renewable Energy Laboratory in the USA22, we modelled mains water temperature for 23 locations around Australia. We used air temperature data previously purchased from the Bureau of Meteorology for use in Sunulator23 and already organised into a Typical Meteorological Year (TMY) for each location. The model’s results were validated against measurements of mains water temperature data by the University of Queensland for Melbourne24. Some discrepancies were found, but they are expected to be caused by the location and methods by which mains water was sampled. For ease of use, the mains water temperature results were summarised into monthly figures for each location. The following chart summarises the results, showing only capital cities:
22 Towards development of an algorithm for mains water temperature, NREL, http://citeseerx.ist.psu.edu/viewdoc/download?doi=10.1.1.515.6885&rep=rep1&type=pdf 23 http://www.ata.org.au/ata-research/sunulator 24 Cold Water Temperature in Melbourne 1994-2013, preliminary statistical analysis. University of Queensland, https://www.clearwater.asn.au/user-data/research-projects/swf-files/9tr1---001-grace-2014-cold-water-temperature-in-melbourne-1994-2013-final.pdf

Household Fuel Choice in the NEM 43
KP137 www.ata.org.au 21 May 2018
Figure 17: Mains Water Temperature in Australian Capital Cities
6.2 Hot Water Consumption & Energy For each home type in each location, the household’s hot water consumption is estimated in litres per day for four different areas:
• Showers;
• Hand basins;
• Dish washing;
• Clothes washing. The energy required to heat water is estimated in megajoules per day for each of these four areas and then summed. Energy consumption is also added for the following items:
• Energy losses in the water heater (e.g. heat escaping up the flue);
• Heat escaping from the hot water tank (if any). Water coming from the water heater is assumed to be at 65 degrees Celsius, as 60 degrees is the minimum to kill Legionella bacteria, and anecdotally some systems are set to 70 degrees.

Household Fuel Choice in the NEM 44
KP137 www.ata.org.au 21 May 2018
6.2.1 Showers
The volume of hot water used per day in showering is estimated, based on the ratio of hot to cold water required to reach a typical showering temperature. The energy to heat this water is then calculated based on the specific heat of water (4.187 kJ/kg K). The key assumptions include:
• Number of showers per day: Large home & New Build: 4, Stay-at-home Family & Small Home: 3, Working Couple: 2
• Duration: 6 minutes Oct-March, 7 minutes Apr-Sept25
• Shower flowrate (mixed water): 9 litres per minute for New Build, 12 litres per minute for all other household types26
• Mixed shower temperature: 40 degrees27
6.2.2 Hand Basins
Energy calculations are as for showers. Other key assumptions include:
• 20 hand basin uses for each shower28
• Mixed volume per basin use: 1.3 litres
• If the mains water temperature is above 10 degrees, mains water is used. If it’s below 10 degrees, hot water is mixed to achieve 20 degrees.
6.2.3 Dish Washing
While dishwashers use hot water, modern dishwashers are made with a built-in heating element and might not use any hot water from the household’s hot water system. Some modern dishwashing machines can be connected to the household’s hot water system, however even in these cases the machine may require a tempering valve to lower the temperature of the input hot water. For this study we have assumed that all households use a dishwashing machine that only uses cold water input. Hot water is still likely to be required for hand-washing some dishes in the sink. Hot water consumption for washing dishes in the sink was modelled based on the following assumptions:
• A load of dishes requires 4L water heated to 40°C with a mixture of unheated mains water and hot water from the hot water system;
25 http://www.news.com.au/lifestyle/home/interiors/eggtimer-showers-a-distant-memory-for-queenslanders/news-story/00d4bef8b7b2cdda6577481cea59073c https://www.clearwater.asn.au/user-data/research-projects/swf-files/10tr5---001-melbourne-residential-water-use_brochure.pdf http://www.bbc.com/news/science-environment-15836433 26 http://www.waterrating.gov.au/consumers/water-efficiency 27 https://forums.whirlpool.net.au/archive/1952143 https://www.reference.com/home-garden/average-shower-water-temperature-e5d7e7ee9f9eef37 28 https://www.clearwater.asn.au/user-data/research-projects/swf-files/10tr5---001-melbourne-residential-water-use_brochure.pdf, page 21

Household Fuel Choice in the NEM 45
KP137 www.ata.org.au 21 May 2018
• One load of dishes per day for each household other than the working couple, where it was assumed a load of dishes were hand-washed every second day.
To understand the impact that a dishwasher using hot water from the household’s hot water system would have on the household bills, ATA conducted sensitivity analysis for each capital city based on the following household assumptions:
• One load of dishes per day for each household other than the working couple, where it was assumed the dishwasher was run every second day;
• That the input hot water for the dishwasher is at 65°C; and
• The dishwasher requires 20L of hot water per wash.
6.2.4 Clothes Washing
While clothes washing machines may use hot water, modern machines also come with a built-in heating element and may not use any hot water from the household’s hot water system. Some modern clothes washing machines can be connected to the household’s hot water system, however even in these cases the machine may require a tempering valve to lower the temperature of the input hot water. For the purpose of this study we have assumed that all households use a clothes washing machine that only uses cold water input. To understand the impact that a clothes washing machine using hot water from the household’s hot water system would have on the household bills, ATA conducted sensitivity analysis for each capital city based on the following household assumptions:
• The washing machine is run daily in every household type other than Working Couple, where the washing machine is run every second day;
• The temperature of the input hot water is 65°C; and
• Each load requires 20L of hot water.
6.2.5 Energy Losses by Hot Water Appliance
Based upon the hot water consumption outlined above, we have determined the volume of hot water needed for each household type, in each location. If it takes 4.187 kilojoules of energy to heat one kilogram of water (one litre) by one degree Celsius, we then calculated the amount of energy required to heat the relevant volume of water from the temperature of the mains water to 65°C.
To calculate the required amount of input energy requires the efficiency of the hot water system in transferring heat into the water. This allows for heat escaping through the flue, and other inefficiencies in the appliance. Heat losses from the tank in storage systems are covered in section 1.2.6. The efficiencies of each type of hot water system were used as follows:

Household Fuel Choice in the NEM 46
KP137 www.ata.org.au 21 May 2018
Table 10: Efficiencies of Different Technology Hot Water Systems
Hot Water System Type Heating Efficiency Has Tank?
Gas Storage 70% Y
Gas Instant 86% N
Electric Storage 98% Y
Electric Instant 100% N
Heat Pump 98%29 Y
6.2.6 Tank Heat Losses
For gas storage, electric resistance, and electric heat pump hot water systems, we also considered the energy losses from the hot water as it sits in the tank waiting to be used.
The amount of heat lost from the tank is dependent upon several variables:
• The tank height and diameter, which gives the total internal surface area of the tank;
• The insulation value of the tank walls; and
• The ambient temperature for the location and time of year. From these variables we calculate the continuous power radiated from the heater surface, in Watts per degree of temperature difference between the hot water and the outside air.
29 This efficiency does not consider the COP of the heat pump, which is considered later

Household Fuel Choice in the NEM 47
KP137 www.ata.org.au 21 May 2018
6.3 Annual Energy Use: Gas Systems
Taking all of the above into consideration, we calculated the total annual energy use for water heating for each household type in each location. For gas instantaneous hot water systems, the amount of electricity required for the ignition is also included (this affects every household type other than Large House): Table 11: Annual Energy Consumption from Gas Hot Water System, by Location and Household Type
Location Large House
New Build Stay-at-home
Family Small House Working Couple
MJ pa MJ pa kWh pa MJ pa kWh pa MJ pa kWh pa MJ pa kWh pa
Adelaide 16,281 9,509 71 9,509 71 9,509 71 6,313 67
Alice Springs 13,601 7,845 71 7,845 71 7,845 71 5,208 67
Armidale 20,321 12,272 71 12,056 71 12,056 71 8,005 67
Bairnsdale 19,234 11,483 71 11,363 71 11,363 71 7,545 67
Ballarat 18,957 11,322 71 11,194 71 11,194 71 7,433 67
Bega 18,448 10,947 71 10,869 71 10,869 71 7,216 67
Bendigo 18,384 10,953 71 10,836 71 10,836 71 7,195 67
Brisbane 14,239 8,238 71 8,238 71 8,238 71 5,469 67
Bruny Island 20,294 12,141 71 12,020 71 12,020 71 7,981 67
Canberra 18,060 10,767 71 10,638 71 10,638 71 7,064 67
Darwin 9,429 5,248 71 5,248 71 5,248 71 3,484 67
Dubbo 16,693 9,767 71 9,767 71 9,767 71 6,484 67
Falls Creek 26,705 16,628 71 16,078 71 16,078 71 10,678 67
Hobart 19,746 11,800 71 11,680 71 11,680 71 7,755 67
Melbourne 18,280 10,795 71 10,757 71 10,757 71 7,141 67
Mildura 16,357 9,558 71 9,558 71 9,558 71 6,345 67
Perth 15,290 8,894 71 8,894 71 8,894 71 5,905 67
Sydney 15,646 9,114 71 9,114 71 9,114 71 6,050 67
Thursday Is. 9,724 5,430 71 5,430 71 5,430 71 3,605 67
Toowoomba 16,352 9,552 71 9,552 71 9,552 71 6,342 67
Wagga Wagga 17,897 10,656 71 10,535 71 10,535 71 6,995 67
Warrnambool 19,333 11,448 71 11,410 71 11,410 71 7,575 67
Wodonga 18,374 10,955 71 10,831 71 10,831 71 7,192 67

Household Fuel Choice in the NEM 48
KP137 www.ata.org.au 21 May 2018
6.4 Annual Energy Use: Electric Systems For electric systems, the amount of input energy was converted from megajoules to kilowatt hours, and the COP of the heat pump was then applied to calculate the total annual energy consumption. The COP for the heat pump is dependent on the ambient temperature.
Figure 18: Impact of Ambient Air Temperature on Heat Pump COP
Considering the heat pump COP based on the ambient air temperature for each location, we then calculated the total annual energy consumption for electric heat pumps as follows: Table 12: Annual Electricity Consumption, Heat Pump HW, by Location/Household Type (kWh p.a.)
Location Large House New Build Small House Stay Home
Family Working Family
Adelaide 717 717 479 559 559
Armidale 992 992 596 714 714
Bairnsdale 919 919 565 673 673
Bega 820 820 525 620 620
Bendigo 886 886 550 652 652
Brisbane 637 637 444 508 508
Canberra 879 879 548 648 648
Dubbo 732 732 486 568 568
Hobart 948 948 578 691 691
Melbourne 828 828 527 624 624
Mildura 724 724 483 564 564
Sydney 693 693 469 544 544
Toowoomba 718 718 480 559 559
Wagga Wagga 870 870 544 642 642
Warrnambool 871 871 546 651 651
Wodonga 891 891 553 656 656

Household Fuel Choice in the NEM 49
KP137 www.ata.org.au 21 May 2018
7.0 Appendix C: Methodology – Cooking
While different in a number of ways, gas and electric induction cook tops are considered to be of similar enough quality to be interchangeable for the purposes of this research. Gas cook tops remain the appliance of choice for consumers over electric resistance (non-induction) cook tops. Electric induction cook tops are increasingly preferred by consumers who are familiar with both gas and induction.
7.1 Energy Use ATA found very little useful information available on the typical energy consumption of gas or induction cook tops. Of the literature that does exist, it does generally agree that gas use for cooking is a very small proportionate part of a household’s overall annual gas bill. According to the NSW Independent Pricing and Regulatory Tribunal (IPART)30, household use of gas for cooking is around 500 MJ per quarter. This estimate agreed closely with the findings of ClimateWorks Australia in their 'Low Carbon Lifestyles’ reports (2012) that assumed 1552 MJ per annum throughout Australia. Taking the figure of 2,000 MJ per annum, ATA apportioned this between gas cook top use and gas oven use (60/40) and considered high- and low-usage levels for sensitivity (high: 3,000 MJ pa; low: 1,000 MJ pa). ATA converted the MJ/pa figure into electricity (kWh/pa) for induction and ceramic-based cook tops and ovens, and applied an efficiency factor at the point of use for each appliance:
Table 13: Energy Use & Efficiency of Gas and Electric Cooking Appliances
Type Energy input
Energy input
Efficiency at point of use
Energy output
Cook top MJ/pa kWh/pa % MJ/pa
Natural Gas 1,200 333 40% 480
Induction 600 167 80% 480
Ceramic 667 185 72% 480
LPG 691 192 70% 480
Oven
Natural Gas 800 222 7% 56
Electric 400 111 14% 56
LPG 560 156 10% 56
Total
Natural Gas 2,000 556
Electric Induction 1,000 278
Electric Ceramic 1,067 296
30 http://www.ipart.nsw.gov.au/Home/For_Consumers/Compare_Energy_Offers/Typical_household_energy_use

Household Fuel Choice in the NEM 50
KP137 www.ata.org.au 21 May 2018
The efficiency factors were referenced from a variety of sources as per the table below:
Table 14: Point of Use Efficiency Factors of Gas and Electric Cooking Appliances
Type Power Source % Reference
Oven Elec 14% BZE 2013
Oven Natural gas 7% BZE 2013
Oven Natural gas 5.2-5.3% US DoC
Oven Elec 9.3-9.6% US DoC
Oven LPG 21% Ehow
Oven LPG 10% Gas company (www.alliantgas.com)
Cook top Natural gas 40-45% Choice 2013
Cook top Elec - Ceramic Radiant 65-85% Choice 2013
Cook top Elec - Induction 85-90% Choice 2013
Cook top Elec - Ceramic Radiant 79% BZE 2013
Cook top Natural gas 40% UBC students citing US DoE
Cook top Elec - Radiant 71% UBC students citing US DoE
Cook top Elec - Induction 84% UBC students citing US DoE
Cook top Elec - Radiant 57% Wuppertal 2013
Cook top Elec - Induction 80% Wuppertal 2013
Cook top LPG - kitchen - cold start 76% Aprovecho (test results)
Cook top LPG - kitchen - simmer 63% Aprovecho (test results)
Cook top ‘Trad electric’ 60% Alan Pears
Cook top LPG standard cook tops 40% Gas company (www.alliantgas.com)
Cook top Natural gas Approx. 30% US DoC
Cook top Elec 77-82% US DoC

Household Fuel Choice in the NEM 51
KP137 www.ata.org.au 21 May 2018
7.2 Capital Costs As with RCACs and heat pumps, ATA reviewed an online sample31 of 23 gas cook tops and ovens; and 27 electric cook tops and ovens, to understand appropriate capital and installation costs for the modelling. As a result of this analysis, the following capital and installations costs were chosen as model inputs:
Table 15: Capital & Installation Cost Assumptions, Gas & Induction Cooking
Purchase Price ($) Installation Cost ($)
Gas:
Cook Top 350 170
Oven 1,000 230
Electric:
Oven 500 150
Induction Cook Top 500 250
7.3 Asset Life The US benchmarking study (National Association of Home Builders/ Bank of America) indicates that gas ovens and cook tops are among the longest-lived of home appliances. It reports that gas ovens typically last 10-18 years and gas (cooking) ranges 15-17 years. The same source reports the lifespan of electric ranges at 13 years. As a relatively new technology, the lifespan of induction is somewhat unknown; however, some models (such as LG32) come with a 10-year warranty, suggesting manufacturer confidence in similar lifespans to gas equivalents.
31 Current retail price and installation cost estimates were taken from:
http://www.ikea.com/au/en/catalog/products/ https://www.wholesalesdirect.com.au/ https://www.bunnings.com.au/ https://www.powerland.com.au/ https://www.thegoodguys.com.au/ https://www.appliancesonline.com.au/ http://www.productreview.com.au/ https://onestepoffthegrid.com.au/ http://www.handycrew.com.au/cooking/ https://streamaster.com.au/ http://www.2ndsworld.com.au/ http://www.handycrew.com.au/cooking/ http://forums.whirlpool.net.au/archive/1781669 http://acuraelectrical.com.au/oven-installation-perth http://www.whitfordshomeappliances.com.au/ http://www.harveynorman.com.au/ https://www.kambos.com.au/ https://www.binglee.com.au/ http://www.homeimprovementpages.com.au/ http://www.handycrew.com.au/cooking/ http://forums.whirlpool.net.au/archive/2485868 http://www.wyz.com.au/Install.aspx
32 http://www.lg.com/au/built-in-appliances/lg-KA68030F-cooktop
Household Fuel Choice in the NEM 52
KP137 www.ata.org.au 21 May 2018
8.0 Appendix D: Methodology – Solar PV
Each scenario was modelled three separate times for three different solar photovoltaic (PV) system sizes, as follows: 1. No solar PV; 2. An existing 2.5 kW system; and 3. A new 5 kW system. Grid-connected residential energy storage was not modelled in this project as:
• based on several detailed modelling projects recently undertaken by ATA33, lithium, flow and other modern storage chemistries are not yet able to pay for themselves within a typically accepted battery asset life (i.e. 10 years); and
• this project does not seek to understand the economic case of each scenario in future years – only in 2018.
8.1 System Size & Prices Obviously, a range of different solar PV system sizes could be included in the modelling. ATA selected a 5kW system only as:
• 5kW is reflective of the average solar PV system size currently being installed in Australia34;
• 5kW is as close to the optimal economic choice of system size as any other system size, given the now significant economies of scale in solar PV pricing35;
• 5kW single phase is typically the pre-approval limit for grid connection or residential solar across a range of distribution network businesses in the NEM;
• The modelling will assume that at least some of the electricity required to power one of the three end uses (i.e. space heating, hot water, cooking) will come from solar, in addition to the remaining daytime electrical load for each household type. For this, a reasonable solar system size is required; and
• Using only one system size reduces the complexity and number of the modelled scenarios. For the new 5 kW solar scenarios, installed prices will be taken from Solar Choice monthly Solar PV Price Index36. Feed-in tariff assumptions will be chosen based on minimum benchmarks as defined by legislation in each jurisdiction, or (where legislation does not set a minimum benchmark), a brief review of retail market FiT prices.
33 https://www.ata.org.au/news/grid-connected-batteries-economically-attractive-by-2020-ata-report 34 http://reneweconomy.com.au/graph-of-the-day-australias-average-solar-pv-system-size-hits-5 kW-47293/ 35 http://www.solarchoice.net.au/blog/news/residential-solar-pv-system-prices-january-2017 36 http://www.solarchoice.net.au/blog/news/residential-solar-pv-system-prices-january-2017

Household Fuel Choice in the NEM 53
KP137 www.ata.org.au 21 May 2018
8.2 Solar-Powered Loads Specific electrical and gas hot water loads have been individually constructed using a “first principles” model that builds up an hourly MJ load based on:
• Bureau of Meteorology (BoM) ambient temperature by location data;
• hot water demand from various uses within the home (i.e. showering, kitchen, bathroom) and the efficiency of hot water delivery;
• the required water storage (as relevant) and delivery temperature;
• standing losses (as relevant); and
• the hot water appliance selected to heat, store (as relevant) and deliver the output hot water, including the efficiency of that hot water appliance37.
For the electric hot water loads, the hourly MJ load profile has been converted to a 30-minute electrical (kWh) load profile. For the scenarios with solar PV, this 30-minute hot water load profile is added to the underlying electrical load profile for that household type. The combined profile is then modelled on a 30-minute basis to understand exactly how much of the total electrical load the solar system will serve over the course of a year.
8.3 The Value of Solar The modelling to calculate the value of solar PV for each relevant scenario takes place in ATA’s in-house built “Sunulator” model. Sunulator is currently the most detailed modelling tool for grid-connected solar and solar-battery systems publicly available in Australia. The key characteristics of the model are:
• To accurately inform generation, ATA integrated 19 years (1994-2013) of solar insolation data from the Bureau of Meteorology (BoM) into Sunulator. The data exists across five-kilometre grids for all of Australia and is the basis for the generation calculations within the model.
• Regarding consumption, Sunulator has the capability to:
o directly accommodate interval data files of any time period (as Sunulator averages both generation & consumption back to a typical meteorological year and typical consumption year). For most accurate results, at least 12 months of data is preferable;
o alternatively, a detailed consumption profile can be built based on relevant input
assumptions regarding load patterns, including daily, weekly and seasonal variations; and other variables such as public and private holidays, weekends and standby loads.
Economic and energy results are based on netting off generation versus consumption data, specific to that location and user profile, for each 30-minute interval over a full year.
37 The hot water model includes gas storage, gas instantaneous, electric storage and heat pump water heaters.

Household Fuel Choice in the NEM 54
KP137 www.ata.org.au 21 May 2018
This takes account of climate variability and gives the most accurate picture of how much solar generation will be consumed on-site (and when) versus exported to the grid. System design and configuration can then be optimised to maximise the value of solar generation and minimise the cost of consumption from the grid. Sunulator calculates economic impacts (e.g. electricity bill, economic returns) annually and projects the results over a 30-year time frame. Financial results include simple and discounted payback, net present value and internal rate of return). The carbon impact of the project is also automatically calculated.
8.3.1 Total Household Load
The total economic value of solar PV for any household is in part a function of that solar system’s asset life. It is generally accepted in the industry that solar PV systems have an asset life of a minimum 25 years (indeed performance guarantees on panels can be obtained for this time period). Within this asset life, inverters typically require replacement once (and currently approximately 20-25% of overall system capital cost). The modelling undertaken to understand the costs and benefits of grid gas versus grid electricity use was originally undertaken only for the three end uses that can be serviced by either fuel type – i.e. space heating, water heating and cooking. Ten-year NPVs were calculated to compare the relative value of each appliance and fuel choice for these three end uses. To understand the full value to households of selecting an electric appliance (or “all-electric”) strategy and part-powering their electrical loads from solar PV, the full costs and benefits of any solar PV modelled must be fully captured. In practice this means two things:
• Applying the same residual electrical load to both the dual fuel and all electric home types (i.e. for all other end uses besides the three that can be serviced by either fuel type), so that total annual and future energy bills can be calculated; and
• Calculating longer term values. The model calculates both 10 and 20-year NPVs in this regard.

Household Fuel Choice in the NEM 55
KP137 www.ata.org.au 21 May 2018
9.0 Appendix E: Methodology – Energy Prices
The ATA model includes 17 locations within the NEM – with location-specific tariffs used to calculate the annual running costs of each appliance. In 2014, ATA was greatly assisted by St Vincent de Paul (StVdP) in the review and selection of relevant gas and electricity tariffs for the modelling. StVdP has developed and manages the ongoing Tariff Tracker project38, which provides analysis and monitoring of retail gas and electricity prices across a range of de-regulated price jurisdictions. Obtaining representative gas and electricity prices is a significant task – within any one jurisdiction, there can be many gas and electricity pricing zones (e.g. Victoria has 17). And within those zones there exist both standing offers39 and market offers40 – some of which are not transparent through retail comparator websites. On the advice of StVdP, ATA tried to simplify the pricing analysis where possible by using only standard offers, or an average of the ‘big three’ (i.e. Origin, AGL and Energy Australia) – representative of what most energy consumers are likely to be paying in each location. ATA used the cheapest of the big three for the selection of gas and electricity tariffs. These were taken from energy retailer fact sheets acquired during the second half of 2017. Again, for the purposes of simplicity, the modelling considers flat tariffs only – including inclining and declining blocks, where they exist. Project budget constraints prevented the inclusion of time-of-use and demand-based electricity tariffs, and both have been noted as a key focus for future work.
38 http://www.vinnies.org.au/page/Our_Impact/Incomes_Support_Cost_of_Living/Energy/ 39 Standing offer contracts are basic electricity and gas contracts with terms and conditions that are prescribed
by law and designed to protect your rights. In some states and territories, the government remains responsible for control of the energy prices customers see on their bills. For example, in QLD, ACT & TAS, you can ask for a contract with a regulated electricity price where the price is set by government. Regulated prices for gas are only available in NSW. In VIC & SA, there are no regulated offers or tariffs (for electricity or gas), which means that energy retailers set all of their own prices: http://www.aer.gov.au/retail-markets
40 Market offers are electricity and gas contracts that include minimum terms and conditions prescribed by law. The terms and conditions of market retail contracts generally vary from standing offer contracts.

Household Fuel Choice in the NEM 56
KP137 www.ata.org.au 21 May 2018
9.1 Gas Prices The methodology above led to the following gas tariffs being used for each location:
Table 16: Gas Tariffs Used in the ATA Model, Flat, by Location
Location Retailer Gas Network Supply
($/day)
Usage
(c/MJ)
Bairnsdale Origin AGN Bairnsdale $0.77 2.6279
Hobart Aurora Tasmania $0.52 3.5377
Wagga Wagga AGL AGN Wagga Wagga $0.96 2.228
Table 17: Gas Tariffs Used in the ATA Model, Declining Block, by Location
Location Retailer Gas
Network
Supply
($/day)
Daily Block Limit (MJ/day)
Usage Charge/Block (c/MJ)
Remaining Usage (c/MJ)
1 2 3 1 2 3
Adelaide AGL AGN $0.72 27.5 22 4.236 3.295 1.714
Armidale AGL Jemena $0.60 20.7 20.4 49.32 3.886 2.591 2.396 2.375
Bega ActewAGL ActewAGL $0.70 41.1 442 1489 2.712 2.284 2.247 2.242
Bendigo AGL Ausnet $0.86 100 100 1200 2.148 2.062 1.717 1.539
Brisbane AGL AGN $0.75 8.2 19.2 5.591 4.172 3.673
Canberra ActewAGL ActewAGL $0.73 41.1 2704 1096 2.954 2.732 2.672 2.446
Dubbo AGL Jemena $0.60 20.7 20.4 49.32 3.886 2.591 2.396 2.375
Melbourne AGL AGN $0.79 27.4 21.9 2.641 2.522 1.706
Mildura AGL AGN $0.82 49.3 3.693 2.398
Sydney AGL Jemena $0.60 20.7 20.4 49.32 3.886 2.591 2.396 2.375
Toowoomba AGL Allgas $1.12 8.5 17 4.584 3.325 3.097
Warnambool AGL Ausnet $0.86 100 100 1200 2.148 2.062 1.717 1.539
Wodonga AGL AGN $0.79 27.4 21.9 2.559 2.325 1.940
9.1.1 Price Forecasts: Gas
Energy price forecasting is an inherently complex exercise and not one that ATA sought to conduct any primary research upon as part of this project. Instead, ATA drew on existing price forecasts available in the public domain. For gas, AEMO projections predict modest growth in wholesale gas prices post-201741. On this basis, ATA used a conservative 3% p.a. retail price growth in the modelling for this project.
41 https://www.aemo.com.au/-/media/Files/Gas/National_Planning_and_Forecasting/NGFR/2016/NGFR-Gas-
Price-Review-Final-Report-October-2016.pdf

Household Fuel Choice in the NEM 57
KP137 www.ata.org.au 21 May 2018
9.2 Electricity Prices The methodology above led to the following electricity tariffs being used for each location:
Table 18: Electricity Tariffs Used in the ATA Model, Flat, by Location
Location Retailer Distribution
Network
Supply ($/day)
Usage (c/kWh)
Bendigo AGL Powercor $1.49 27.31
Brisbane Origin Energex $1.28 25.59
Canberra ActewAGL ActewAGL $0.80 18.28
Hobart Aurora Aurora $0.92 26.07
Melbourne Origin Citipower $1.13 25.92
Mildura AGL Powercor $1.49 27.31
Toowoomba Ergon Energy Ergon $0.99 27.07
Warrnambool AGL Powercor $1.49 27.31
Table 19: Electricity Tariffs Used in the ATA Model, Declining Block, by Location
Location Retailer Distribution
Network
Supply ($/day)
Block 1 Block 2 Remaining
(c/kWh)
(kWh/day) (c/kWh) (kWh/day) (c/kWh) (c/kWh)
Armidale Origin Essential Energy
$1.50 10.96 26.62 8.22 26.19 25.77
Bega ActewAGL Essential Energy
$1.50 10.96 26.62 8.22 26.19 25.77
Dubbo Origin Essential Energy
$1.50 10.96 26.62 8.22 26.19 25.77
Sydney Energy
Australia Ausgrid $0.84 10.96 26.73 10.96 26.12 25.53
Wagga Wagga
Origin Essential Energy
$1.50 10.96 26.62 8.22 26.19 25.77
Table 20: Electricity Tariffs Used in the ATA Model, Inclining Block, by Location
Location Retailer Distribution
Network
Supply ($/day)
Block 1
All Remaining Usage
(c/kWh)
(kWh/day) (c/kWh)
Adelaide Origin SA Power Networks
$0.78 10.96 34.45 38.73
Bairnsdale Origin SP AusNet - SPI $1.29 11.18 30.94 34.09
Wodonga AGL SP AusNet - SPI $1.52 11.21 29.07 33.04

Household Fuel Choice in the NEM 58
KP137 www.ata.org.au 21 May 2018
9.2.1 Price Forecasts: Electricity
ATA utilised the latest electricity price projections compiled by AEMO42 as part of their most recent Planning and Forecasting report. ATA used the neutral trajectory, which sees a significant increase in retail prices during the period 2017-2020, and then small annual reductions (or price stability) across NEM jurisdictions post 2020. These forecasts are outlined in Figure 19 below:
Figure 19: Residential Retail Price Trends, AEMO 2017
42 https://www.aemo.com.au/-/media/Files/Electricity/NEM/Planning_and_Forecasting/EFI/Jacobs-Retail-
electricity-price-history-and-projections_Final-Public-Report-June-2017.pdf