Embed Size (px)
Citation preview

* * * * l**- . * , ... . _*'..,- . . .... -.. -• •• • J M • •p .•••
U.S. DEPARTMENT OF COMMERCENational Technical Information Service
AD-A030 885
DYNAMIC ANALYSES OF MAGAZINE HEADWALLS
IN THE ESKIMO TESTS
AGBABIAN AssocIATES,
EL SEGUNDO, CALIFORNIA
MAY 1976
iNOON

!•/i c •-23 24 2:;i!! O0::.37
Go°
D AM -CA &LYS wxOu4517N*A 45Ei: 4 ____ ____._-______. ___.__
DEPARTE"OF DEESE E (PLOSIVESSAErBOR i :
58 5ý ~ 56 ar fo519 OR
•/_4 75_7__-_-~i6ntonD. 66314 678 6I NNW58" 59 m 61 6 "2 61
67 170 784 E,,__-3 , 86 Final R3p
76 DISTRIBU~t'tO 1M1iOC1i
Approvecd fnr uDi:_'i,Distn~biillv( T,;Y F
94 95Damoder P.
REPRODUCED BY
o NATIONAL TECHNICALo8 5) 80 INFORMATION SERVICE 3 8 985 86k.S. DEPARTMENT OF COMMERCE 38
SPRINGFIELD, VA. 22151
AGBABIAN AS OCIATES104 105 1Q§0 North Nalf(afreet .08 109
I Segundo, Calift rnia 90245
C,, q R .qp RC7 qR

R-755,-1"4182
DYNAMIC ANALYSES OFMAGAZINE HEADWALLSIN THE ESKIMO TESTS
Prepared for
ADEPARTMENT OF UEFENSE EXPLOSIVES SAFETY BOARD
Wat.hington, D.C. 20314
Iq:S White pectloe [
e•:' Iloll Sn~l• [
.• . ...,. • . .. . . . .. .. . . . . . Final Report
... ... May 1976
Damoder P. Reddy i
AGBABIAN ASSOCIATES2.50 North Nash Street 4.110 o• . ,
El Segundo, California 90245 Approw:,-. ! i

UNCLASSIFIEDSCCUIMITY CLASSIFICATION Or ?l.IS PAME (r7hon netsa Pne.,eE)
READ INSTRUCTIONSREPORT DOCUMENTATION PAGE BEF'ORE COMIPLETING FOR%1 1
1.04PN UMI(N1 a.OVT ACCISSION NO.l 3. *CIPItmNi CATA600 HUMSCA
R-7556-i-4i82 yEO IO?4PA0CvNOJ
4. TITlt (and Saabfl IS.)TYEO C Q &P iO og
Dynamic Analyses of Magazine Hleadwalls FINALin the ESKIMO Tests May 1975 to may 19764
_________________________________________ R-7556-1 -4182-7. AUTHOft(o) S. CONTRACT OR GRANT 4MSPa
1'amoder P. Reddy DAABO9-75-C-0025
*. PERFORMNING ORGOANIZATION NAME AND ADDRESS 10. PROGRAM ElEMENT. PR0JE , T ASK
Agbabian Associates AE OKUI U61
250 N. Nash Street RDT&E 4A765702M857ElSegundo,_California 90245 _____________
It. CONVTROLLNG OPFICE NA#AE ANO ADDRESS 12. REPORT DATE
Dtpartment of Defense Explosives Safety Board My17Washington, D.C. 20314 .NUERFAS
-14. -MONO TORINO A44ENCY NAME AOORCSS(ti different (0101 ContralIind Office) IS. SECURITY CLASS. tat thle report)
Unclassified
IS*. 041CLASSIFICATION. 0OWN4GMAOlNG
"Apoe :f::or:public r:lease; distribution unlimited. L
17. IST41111UTON SATC CNT at A* astrct ntered in Stock 20.itdise ra Rpo)
r ~~~18 SuPPI.SMIENTANY NOTESr int Eemn
It. KCY WORDS (Continue en lowers@ stdo It necessary and Identify by black number)
Magazine HeadwallRepneNnierFitElmtDynamic Finite Element ESKIMO TestNonlinear Slabs Igloo Storage MagazineExplosive Blast NnierSoils
20. AISTRACT (Continuo on reveeae side It nocoearyE and Identify by bloCk Rumbet)
This report describes the results of dynamic response analyses of magazineheadwalls in three tests, namely, ESKIMO 1, 11, and '4V. The finite elementmodels of the headwalls were subjected to blast loadings selected on the basisof measured data and theoretical investigations. The responses of the headw.allswere obtained using the INSLAB code, a nonlinear, dynamic finite element computerprogram. The behavior of the headwall material was described by a bilinear
(continued on other side)
D JA~~ 47 NV~IOSLT UNCLASSIFIED
'PAGE 7) I SECUORiTY CLASSIVICATi'_1 ýýC 'r, * 4Z# E n 4r '
.- u',"WM'"M-
UNCLASSIFIED%gCURITY CLA-SIPICATION OF THIS PA*e(Wh" OData Ird), ..
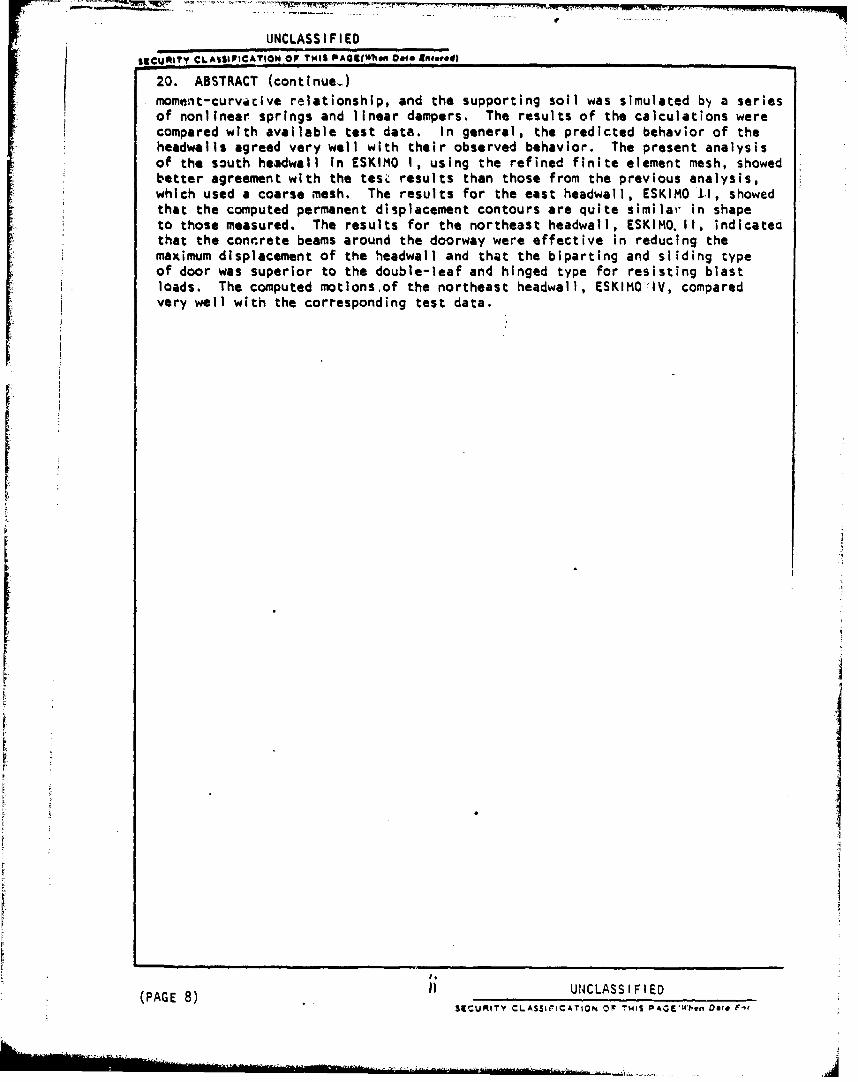
20. ABSTRACT (continue-)moment-curvative relationship, and the supporting soil was simulated b', a seriesof nonlinear springs and linear dampers. The results of the calculations werecompared with available test data. In general, the predicted behavior of theheadwalls agreed very well with their observed behavior. The present analysisof the south headwall In ESKIMO I, using the refined finite element mesh, showedbetter agreement with the tesZ results than those from the previous analysis,which used a coarse mesh. The results for the east headwall, ESKIMO 'tI, showedthat the computed permanent displacement contours are quite similar in shapeto those measured. The results for the northeast headwall, ESKIMO. Ii, indicatedthat the concrete beams around the doorway were effective in reducing themaximum displacement of the headwall and that the biparting and sliding typeof door was superior to the double-leaf and hinged type for resisting blastloads. The computed motionsof the northeast headwall, ESKIMOAiV, comparedvery well with the corresponding test data.
(PAGE8) tlUNCLASSIFIED
SIEUMIITY CLA$,sfiriATION Olt THIS PA&GE'Wlht~ Date 1"t

R-7556-1 -4182!
PREFACE
F: This technical report is submitted by Agbabian Associates as part
of the work required under Contract No. DAAB09-75-C-0025 with the Department
Sof Defense Explosives Safety Board. Project Manager for Agbabian Associates
and Principal Investigator for the preparation of this report is D. P. Reddy.
i' Major contributions to the study have been made by D. Van Dillon, H. S. Ts'ao,
B. Barclay, and J. W. Workman of the Agbabian Associates staff. Technical
ý- monitor of the contract for the Department of Defense Explosives Safety Boardis Dr. T. A. Zaker.
i21
ii

i 7A k R-7556- 1-4182
SUMMARY
This report describes the retults of dynamic response analyses ofmagazine headwalls in Zhree tests, namely, ESKIMO I, II, and IV. The finiteelement models of the headwalls were subjected to blast loadings selected onthe basis of measured data and theoretical Investigations. The responses of
the headwalls were obtained using the INSLAB code, a nonlinear, dynamicfinite element computer program. The behavior of the headwall material wasdescribed by a bilinmar moment-curvature relationship, and the supporting soil
was simulated by a series of nonlinear springs and linear dampers. The resultsof the calculations were compared with available test data. In general, thepredicted behavior of the headwalls agreed very well with their observedbehavior. The present analysis of the south headwall in ESKIMO I, using the
refined finite element r".h, showed better a6ý-eement with the test resultsthan those from the previous analysis, which used a coarse mesh. The results
for the east headwall, ESKIMO II, showed that the computed permanent displau.-ment contours are quite similar in shape to those measured. The result4 forthe northeast headwall, ESKIMO II, indicated that the concrete beams aroundthe doorway were effect:ive in reducing the maxin'tm dtplacement of the headwall
' and that the biparting arid sliding type of door w)s superior to the double-leafand hinged type for resisting blast loads. The computea motions of the north-east headwall, ESKIMO IV, compared very well with the corresponding test data.
v-i"V

CONTENTS
Section Pg
I INTRODUCTION AND BACKGROUND .. .. ... ....... . .
1.1 Description of ESKIMO. I Test. .. ........ I
1.2 Description of ESKIMO It Test... . . . . 71.3 Description of ESKIMO III Test .. .. ........10
1.4. Description of ESKIMO IV Test .. .. .. . .12
1.5 Objectives and Scope .. .. .... .......... 16]
2 PRESSURE LOADING ON HEADWALLS . . . . . . . . . . 17
2.1 Pressure Histories for ESKIMO I Test ... 172.2 Pressure Histo~ries for ESKIMO 11 Test ... 20
2.3 Pressure Loading History for ESKIMO IV Test 22
3 STRURUCTURAL MODEL OF HEADWALL AND DOOR SYSTEM 31
3.1 Structural Model, ESKIMO I Test........31
3.2 Structural Models of Headwalls In ESKIMO 11 583.3 Structural Model of Igloo B (Northeast)
k. Headwall, ESKIMO IV. .. .. .... ............. 64
4 INSTRUMENTATION FOR ESKIMO IV............71
4.1 Pressure Gages ... ....... ................. 71 I4.2 Accelerometers. .. ....... . ...... ......... 75
4.3 Linear Motion Transducers .. .. ..... .......75
5 DYNAMIC RESPONSE OF HEADWALLS IN ESKIMO TESTS .79
5.1 Introduction. .. ....... ..... ............. 79
5.2 Response of South Heatiwall, ESKIMO 1 795.3 Response of East Headwall, ESKIMO 11 895.4 Response of Northeast Headwall, ESKIMO 11 935.5 Response of Northeast Headwall, ESKIMO IV 99
Vii

i k R-7556-1-4182
CONTENTS (CONTINUED)
Section Page
6 CONCLUSIONS AND RECOMMENDATIONS ........... ... 181
6.1 Conclusions ...... ................ .... 181
6.2 Recommendations ..... .............. .... 183
7 REFERENCES ........ ................... .... 185
Appendix
A INCLUSION OF NONLINEAR SPRINGS IN INSLAB CODE . . 137
B PROCEDURE FOR CALCULATING YIELD MOMENTS FOR AREINFORCED-CONCRETE SECTION ... ........... .... 195
C PROCEDURE FOR COMPUTING EQUIVALENT MODULI FORA REINFORCED CONCRETE SECTION ... .......... ... 199
ILLUSTRATIONS
Figure
1-1 Layout of Test Structures for ESKIMO I ..... 3
1-2 Steel-Arch, Earth-Mounded Igloo Storage ..... 4
1-3 Layout of Test Structures for ESKIMt II MagazineSeparation Test ........... ................. 8
1-4 Layout of Test Structures for ESKIMO III MagazineSeparation Test . . . . . . . . . . . . . . . . . 13
1-5 Layout of Test Structures for ESKIMO IV MagazineSeparation Test ..... ................. .... 15
2-1 Reflected Overpressure on South Igloo, ESKIMO I 18
2-2 Headwall Blest-Pressure Loading Zones,ESKIMO I . . . . . . . . . . . . . . . . . . . . 19
2-3 Proposed Pressure Pistories for Nor:heast andEast Igloos, ESKIMu !I .... ............. ... 21
viii
'I

R-7556-1 -4l82r
CONTENTS (CONTINUED)
Fiur
2-4 Placement of Pressure Gages, Igloo B (NortheastIgloo) of ESKIMO iV ................ 23
2-5 Comparison of Pressure Histories for a VerticalArray of Gages, Igloo B of ESKIMO IV ..... ... 25
S2-6 Comparison of Pressure Histories to Test!z Uniformity of Pressure tLoading across Widcth of
SHeadwall, Igloo B of ESKIMO :V ......... . 26
2-7 Free-F!e*d Ground Level and Reflected H(ouvi.jlPressure Pulses for Analysis of Igloo B,F"IMO IV ........... ..... ....... ......... 27
2-8 Comparison of Pressure Histories for a VerticalArray of Gages with the Proposed Loading Pulsefor Response Analysis of Igloo B, ESKIMO IV . . . 28
2-9 Comparison of Headwall Pressure Pulse forAnalysis of Igloo B (ESKIMO IV) with EstimatedReflected Pulse and Measured Free-Field GroundLevel Pulse ...... ................... .... 29
3-I Coarse Finite Element tlode, of South Headwall,ESKIMO I ..... ......... ................... . 32
3-2 Refined Finite Element Model of South Headwall,ESKIMO I ................. .................... 33
3-3 Door Details for South igloo, ESKIMO I 36
3-4 Details of Headwall Construction for South Igloc.ESKIMO I ......... .................... .... 37
3-5 Dynamic Stiffness of Soil ...... ............ 41
3-6 Test Problems to Determine a Suitable Model toRepresent Soil ............. ................. 44
3-7 Case A: Displacement-Time Histories of theHeadwall ......... .................... . .... 45
3-8 Case B: Displacement-Time Histories of theHeadwall ............... .................... 46
ix

k R-7556-1 -4182
CONTENTS (CON, INUED)
Fi gure Pg
3-9 Cse B: Velocity-Time Histories of the Headwall 47
3-10 Case C: Displacement-Time Histories of theHeadwall ........ .................... .... 48
3-11 Case C: Velocity-Time Histories of the Headwall 49
.3-12 AxijI Stiffness of Steel Arch ............. .... 53
3-13 Movement of Headwall of North Acceptor Igloo,ESKIMO I ........... ................... .... 56
3-14 Headwall of North Igloo, ESKIMO I ......... 57
3-15 Igloo C (Northeast) Hea%!wall, ESKIMO II ...... 59
3-16 Finite Element Mesh of Igloo B (Northeast)
Headwall, ESKIMO II1 ................... .... 61
3-17 Configuration of Steel Door for Igloo B
(Northeast), ESKIMO It .. ............ 63
;-18 Finite Element Model of Northeast Headwall,ESKIMO IV ............... .................... 65
3-19 Configuration of Steel Door for Igloo B(Northeast) Headwall, ESKIMO IV ........... ... 67
.- 20 Regions of Different Material Properties forIgloo 8 (Northeast) Headwall, FSKIMO IV . .. 68
4-1 Placement of Pressure Gages onNortheast (B) Igloo, ESKIMO IV .. ......... ... 73
4-2 Placement of Pressure Gages c. Ea-t (D) andWest (E) Igloos, ESKIMO IV ... ........... ... 74
4-3 Pl3cement of Accelerometers on Headwallof Northeast Igloo, ESKIMO IV ........... 76
4-4 Placement of LVDT Transducers on Headwallof Northeast Igloo, ESKIMO IV ... .......... ... 78
x

R-7556- 1-4182
CONTENTS (CONTINUED)
Figure Pg
5-1 Computed Motion of South and West Igloos atNode 1 .......... ..................... .... 107
5-2 Computed Motion of South and West Igloos atNode 19 ....... ..................... .... 108
5-3 Computed Motion of South and West Igloos atNode 46 .... . ... ... ...... ..... .......... 109
5-4 Computed Motion of South and West Igloos atNode 49 . . . .......... . . .... . . ................. 110
5-5 Computed Motion of Scuth and West Igloos atNode 50 ....... .............................. 1 1
5-6 Computed Motion of South and Wnst Igloos atNode 73 ....... ... ....... ... ..................... 1,2
5-7 Computed Motion of South and Wost Igloos atNode 76 .. ... . . . . . . . . . . . . . . . . . 113
5-8 Computed Motion of South and West Igloos atNode 77 ....... ..................... .... 114
I 5-9 Computed Motion of South and West Igloos atNode 100 ........ .................... .... 115
5-10 Computed Displacemeits along Edges of Headwallsof South and West Igloos .... ............ .... 116
5-11 Computed Displacements along ' .h Line ofHeadwalls of South and West Igloos ........ .... 117
5-12 Computed Displacement at Ground Level of SeveralLocations on South and West Igloos ....... .... 118
5-13 Computed Motion from Prior CalculationCorresponding to Node 1 .... ............. .... 119
5-1h Computed Motion from Prior CalculationCorresponding to Node 19 .... ............ ... 120
S5-15 Computed Motion from Prior Calculation
Corresponding to Node 77 ..... ............ .121j
xI
A k R-7556-1 -4182
CONTENTS (CONTINUED)
Figure Pag~e
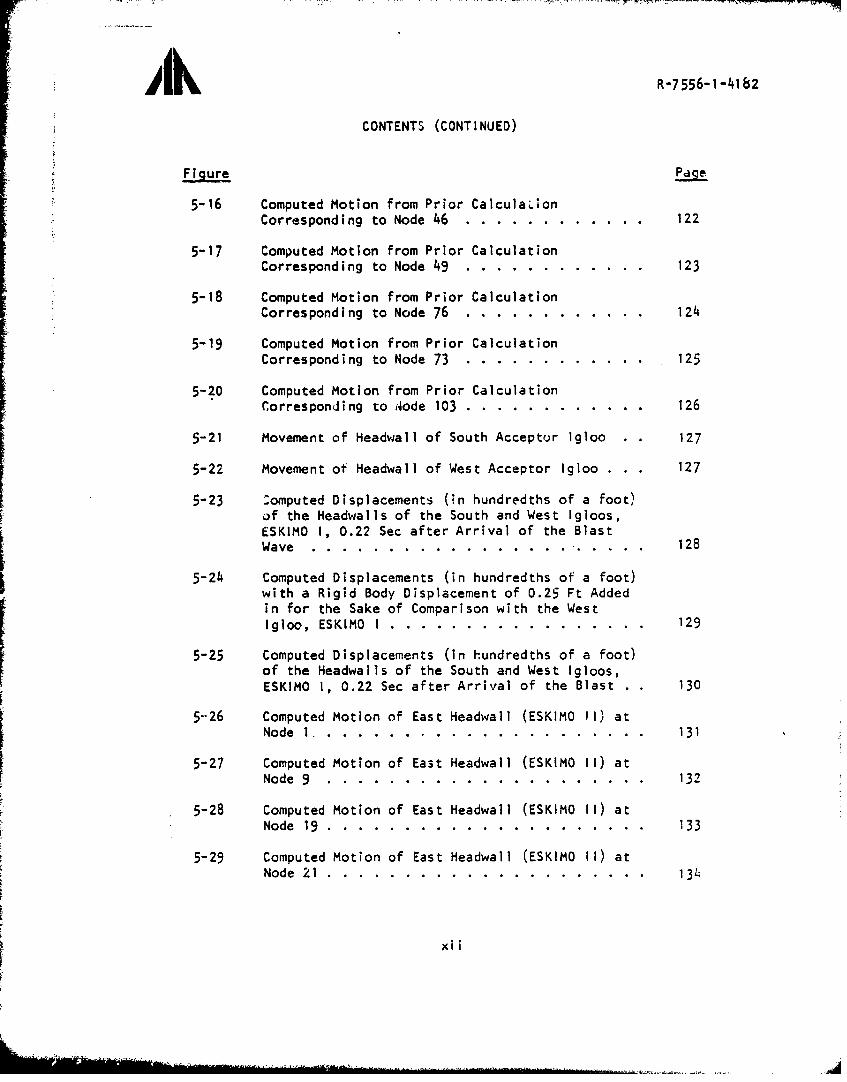
5-16 Computed Motion from Prior CalculalionCorresponding to Node 46. .. .. ....... .......... 122
5-17 Computed Motion from Prior CalculationCorresponding to Node 49. .. .. ....... . ......... 123
5-18 Computed Motion from Prior CalculationCorresponding to Node 76. .. ............ ......... 124
5-19 Computed Motion from Prior CalculationCorresponding to Node 73. .. ..... ... ........... 125
5-20 Computed Motion from Prior CalculationCorresponding to Node 103 .. .. ............ ....... 126
5-21 Movement of Headwall of South Acceptor Igloo .. 127
5-22 Movement of Headwall of West Acceptor Igloo . . . 127
5-23 :omputed Displacements (in hundredths of a foot)
ESKIMO I, 0.22 Sec after Arrival of the BlastWave .. ........... . .................... .. ..... 128
5-24 Computed Displacements (in hundredths of a foot)with a Rigid Body Displacement of 0.25 Ft Added
in for the Sake of Comparison with the WestIgloo, ESKIMO I .. .. ............ ................. 129
5-25 Computed Displacements (in hundredths of a foot)
of the Headwalls of the South and West Igloos,ESKIMO 1, 0.22 Sec after Arrival of the Blast .. 130
5-26 Computed Motion of East Headwall (ESKIMO 11' atINode 1 .. .. ............. ................. ....... 131
5-27 Computed Motion of East Headwall (ESKIMO 11) atNode 9 .. ... . .... ....... . ...... ..... . ....... 132
5-28 Computed Motion of East Headwall (ESKIMO 11) atNode 19. .. ......... . ................ ........... 133
5-29 Computed Motion of East Headwall (ESKIMO 11) atNode 21. .. ............. . ................ ....... 134
xii

Ak~ R-7556-1 -4182
CONTENTS (CONTINUEDJ'
Figure Page
5-30 Computed Motion of East Headwall (ESKIMO il) atNode 46 .. .. ............ ......................... 135
5-31 Computed Motion of East Headwall (ESKIMO 1H) atNode 49. .. .. .. ..... ... ... ..... ..... ...... 136
5-32. Computed Motion of East Headwall (ESKIMO 11) atNode 50 .. .. ............ ......................... 137
5-33 Computed Motion of East Headwall (ESKIMO 11) atNode 73. .. .. .. ..... ... ..... ... ..... ...... 138
5 -34 Computed Motion of East Headwall (ESKIMO 11) atNode 76 .. .. .......... ..... *.............. . ......139
5-35 Computed Motion of East Headwall (ESKIMO 11) atINode 77 .. .. .......... ................... .......140
5-36 Computed Motion of East Headwall (ESKIMO 11) atNode 103. ...... .. ...... ......................... 141
5-37 Permanent Displacement Contours of East Headwall,ESKIMO 11I.. .. ................ ................... 142
5-38 Computed Displacement Contours of East Headwall
at t -145 msec. .. .......... ................... 143
5-39. Comr. .d Displacement Contours of East HeadwallIat t - 157 msec...................................144
5-40 Computed Motion~ of Northeast Igloo (ESKIMO 11) atNode 9 .. .. .... ... ..... ... ..... ... .........45
5-41 Computed Motion of Northeast Igloo (ESKIMO 11) atNode16 .. .. .......... ................... .......146
5-42 Computed Motion of Northeast Igloo (ESKIMO 11) atNODE 22 .. .. .......... ................... .......147
5-43 Computed Motion of Northeast Igloo (ESKIMO 11) atNode 39. .. .. .. ........ .. ... ... ..... ...... 148
5-44 Computed Motion of Northeast Igloo (ESKIMO 11) atNode 42 .. .. .......... ...................... 149
x~ii

ilk R-7 556-1-4182
CONTENTrS (CONTINUED)
FLIuES page
5-45 C;3mputed Motion of Fortheast Igloo (ESKIMO 11) atNode 45 .. ..... . .... ....... . ...... ........... 150
5-46 Computed Motion of Northeast Igloo (ESKIMO 11) atNode 60. .. .. ............ ....................... 151
5-47 Computed Motion of Northeast Igloo (ESKIMO 11) atNode 72. .. .. .......... ......................... 152
5-48 Computed Motion of Northeast Igloo (ESKIMO 11) atNode 75 .. .. ... . .... ....... . ...... ........... 153
5-49 Computed Motion of Northeast Igloo (ESKIMO 11) atNode 77.. .. ... . .... ....... . ...... .......... 154
5-50 Computed Mo-zion of Northeast Igloo (E!ýKIMO 11) at
Node 79 .. .. ... . .... ....... . ...... ........... 155I5-51 Computed Motion of Northeast Igloo (ESKIMO 1)a
5-52 Compted otio of orthast gloo(ES IMO1) atNode 801. ... . ................ ................... 156
5-52 Computed Motion of Northeast Igloo (ESKIMO I1) atNode 101 ... .. ............... . ..................157
5-53 Computed Motion of Northeast Igloo (ESKIMO 11) atI
rNod0 108 .. .. ............ ....................... 159r5-55 Computed Motion of Northeast Igloo (ESKIMO 11) atNode 115 .. .. .............. ..................... 160
5-56 Permanent Movements of Northeast Headwall ofESKIMO 11 as Measured (in hundredths of feet) . 161
5-57 Computed Permanent Displacements of NortheastHeadwall of ESKIMO III (in hundredths of feet' ~ 162
5-58 Computed Motion of Northeast Igloo (ESKIMO IV) atNode 21 .. .. ... . ...... ..... . ...... ........... 163
5-59 Computed Motion of Northeast Igloo (ESKIMO IV) atNode 24. .. .. ............ ....................... 164
xiv
6L1

A k R-7556-1 -4182
CCNTENTS (CONTINUED)
Figure
5-6o Computed Motion of Northeast Igloo (ESKIMO IV) atNode 61.. ............ ...........................165
5-61 Computed Motion of Northeast Igloo (ESKIMO IV) atNode 64 .. ........ ...............................166
5-62 Computed Motion of Northeast Igloo (ESKIMO IV) atNode 69 .. .. .............. ............ ....... 167
5-63 Computed Motion of Northeast Igloo (ESKIMO IV) atNode 91.. ............ ....... ...................168
5-6b Computed Motka of Northeast Igloo (ESKIMO IV) atNode 94 .. ........ ...............................169
5-65 Computed Motion of Northeast Igloo (ESKIMO IV) atNode 97 .. ........ ...............................170
5-66 Computed Motion of Northeast Igloo (ESKIMO IV) atNode 99. .. .... ........ ........ ............171
5-67 Computed Motion of Northeast Igloo (ESKIMO IV) atNode 119. .......... .............................172
5-68 Computed motion of Northeast Igloo (ESKIMO IV) atNode 12'. .............. .........................173
5-69 Computed Motion of Northeast Igloo (ESKIMO IV) atNode 124. .......... .............................174
5-70 Measured Permanent Displacement Contours ofNortheast Headwall of ESKIMO IV (in hundredthsof feet) .. .............................. . . . 175
5-71 Computed Displacement Contours of NortheastHeadwall of ESKIMO IV at 158 msec (in hundredthsof feet). ............ ...........................176
5-72 Measured Acceleration Time Histories of NortheastHeadwall of ESKIMO IV .. ........ ................. 177
5-73 Measured Displacement Time Histories of NortheastHeadwall in ESKIMO IV .. .......... ............... 179
xv

A k R-7556-1 -4182
CONTENTS (CONTINUED)
TABLES
Table Page
1-1 Details of Igloos in ESKIMO ItI.. .................. 9
1-2 Details of Igloos in ESKIMO III .. .. ..............11
3-1 Comparison of Coarse and Refined Finite ElementMeshes. .. ........ ................. ............. 34
3-2 Soil Stiffness from Test in North Igloo........40
3-3 Properties of Headwall and Wingwall Sections ofIgloo B (Northeast), ESKIMO 11. .. ................64
3-4- Material Properties for Igloo B (Northeast)Headwall, ESKIMO IV. .. ......... . ................69
4-1 Schedule of Gages for measurement of Air Blast,
ESKIMO IV .. .. ........ ................. . ........72
4-2 Schedule of Accelerometers for Northeasi Igloo,ESKIMO IV .. .. ...... ................... . ........77
5-1 Motion of South Headwall (ESKIMO 1) above Centerof Door .. .. ...... ................. . ............ 83
II5-2 Peak Velocities of Upper Corner of 'oor .. .. ......83
5-3 Peak Deflection of Center of Doorway. .. ..........84
5-4 Peak Acceleration of Base of Headwall .. .. ........85
5-5 Motion of East Headwall (ESKIMO 11) above Centerof Doorway. .. ...... ................... . ........92
5-6 Computed Maximum and Permanent Displacement ofNortheast Headwall, ESKIMn 1 I.. .. ................95
5-7 Comparison of Computed Maximum Displacements forESKIMO 11I.. .. .......... ................. .......96
5-8 Motion of Northeast Headwall, ESKIMO 11, aboveCenter of Doorway. .. ......... . ..................98
xvi

A kR- 7556 -1 -4 18 2 14
CONTENTS (CONCLUDED)
Table Page
5-9 Comparison of Maximum Displacements of NortheastHeadwalls of ESKIMO 11 and ESKIMO IV Igloos ... 101
5-1-O Comparison of Maximum and Permanent Displacementsof No~rtheast Igloo, ESKIMO IV. .. .. ..... .......104
II5-11 Comparison of Maximum Acceleration of Northeast
Igloo, ESKIMO IV .. .. ..... ....... ............. 106
xvi

R-7556-1 -4182
SECTION 1
INTRODUCTION AND BACKGROUND
This report covers a part of a general program sponsored by the
Department of Defense Explosives Safety Board (DDESB) to determine safe inter-.
magazine separation distances for various orientations of magazines for storing
chemical explosives. The main objective of the program is to determine the
minimum intermagazine separation distances so that an explosion in one magazine
(donor) will not cause an explosion in an adjacent magazine (acceptor). This
report describes a study to predict analytically the behavior of magazine
headwalls and to compare analytical and test data.
Preliminary tests had indicated that specifications'for minimumseparation distances betwveen magrzines were excessively conservative for some
orientations. Increasing land costs and siting problems made it desirable to
justify reducing the rear-to-front separation distance. Ea. ier tests had
Sindicated that earth-covered, steel-arch igloo magazines can be safely spaced
side by side at a distance in feet of 1.25 W in which W is the weight in
pounds of the high explosives in storage. On the other hand, very few test
data had been developed for determining the minimum safe distances for other
magazine orientations.
Starting in 1971, the DDESB sponsored a series of large-scale maga-
zinc explosion experiments, called the ESKIMtO series, for the purpose of estab-
j lishing minimum separation distances for earth-covered, steel-arch magazines.
To date, four tests designated as ESKIMO I, ESKIMO II, ESKIMO III, AND
ESKIMO IV have been conducted. These tests are described briefly in the
following sections.
1.1 DESCRIPTION OF ESKIMO I TEST
ESKIMO I was a large-scale magazine explosion experiment conducted
on 8 December 1971 at the Randsburg Wash Test Range of the Naval Weapons Center,
China Lake, California. Four earth-covered, steel-arch magazines were exposed
to the explosion of the contents of a similar magazine. The donor magazine

R-7556-1 -4182
contained 200,000 lb of high explosives. The four acceptor igloos faced the
donor and were located at various distancei ranging from 73 ft to 161 ft, asshown in F'gure 1-1. The distances 73 ft and 161 ft correspond to 1.25 W1/
1/3~and 2.75 W, respectively, whete W is the weight in pounds of the explo-sive in the donor magazine. Two concrete block structures simulating one
particular type of Air Force aboveground mAgazine were also placed in the
area at distances of 117 ft (2 W1 / 3 ) from the donor igloo, as shown inFigure 1-1.
t The four acceptor steel-arch Igloos were built in accordance with
the standard drawing shown in Figure 1-2. Each of the igloos was 25 ft wide
by 14 ft high, with the length limited to 20 ft. Steel wing walls were used
in the test in lieu of concrete. The igloos were covered by a 90*-compacted
r earth surchargp to a depth of 2 ft at the top of the arch.
The primary objective of this test was to establish a safe, practi-
cable minimum-separation distance between steel-arch magazines for face-on
exposures. Another major objective of the test was to determine the fraqmentand debris hazard from mass detonatioo of explosive-filled projectiles in an
earth-covered magazine.
The damage to structures varied from minor headwall damage at the
south igloo to complete destruction of the concrete block structures. The Istatus of the acceptor charges after the test indicated a range from no
explosion or burning in the south igloo to complete explosion or detonation
of all charges in the east igloo.
Permanent deflections of the order of several inches, accompanied
by yield-line formation, have been noted in some of the surviving headwalls.
On the other hand, photographic evidence indicates that the steel plate doors
in r.'_ igloos were driven in with considerable velocity before coming to rest,
while remaining partially attached to frames. In the forward exposure, com-
plete failure of the hinges occurred, and the doors were driven violently
against the rear wall of that magazine (20-ft depth, wall to wall).
2
j

IT.
0 .
(1171)
CS7 W COCET LCKSRUTR
V "

3-1;•-.• Jt t .'i:• ' .... •R- 7556 " t -• 18
INp
da I
' 2of f
I'l,,. ii' ..
fill?
• - - ! . l i i• '
""titi '" +
Crpy
N "
I., --..... -
-_V I.J illilT 1.' I

permit 4ally&Cgib)1e do--LUt1Ont f-7556- 1-4i 82
-~
.m
P-41Ju o
I p;
1%'6
INi
7/
c4i.TIM

copy oavakzblo toD,' R-7556-1-4182permit fully Iegibl0 v.
~~l 'A 1ti
I ii a~~ :11116
4.I
Ih
&fil
414
Ii4 all6COPY II.dlbl to__ w o
k" _fII legb Uerlýto

R-7556-1 -4•U2
Refarence 1 includes a detailed description and the conclusions of
the E!,KIMC I test. Test results indicated that formerly applicable separation
distences could be significantly reduced.
Agbabian Associates (AA) performed dynamic response analyses of theheadwalls in the ESKIMO I test, using a finite element model of the headwall!(Ref. 2). The analyses were performed with the INSLAB code, a nonlinear firite
element computer program (Ref. 3). The objective of the analyses was to
understand the behavior of the reinforced concrete headwalls subjected to
blast loading and to use this knowledge in reducing reliance on full-scale
proof testing.
1.2 DESCRIPTION OF ESKIMO II TEST
.The ESKIMO II test was coinducted on 22 May 1973 at the RandsburgWash Test Range of the Naval Weapons Center, China Lake, California. Five
earth-covered, steel-arch magazines were exposed face-on all at the same
distance from the explosion source, as shown In Figure 1-3. The igloos to the
north, south, and west were those remaining from the ESKIMO I test. However,S the igloos to the south and west were fitted with'new door designs. All the
Smagazine structures were earth-covered, semicircular corrugated steel arches
I except the northeast igloo, which was constructed with a new type of noncir-
Scular steel arch. Table 1-1 shows details of all igloos in the ESKIMO II test.
The explosion source consisted of 72 tritonal-filled, 750-lb bombs
in two triangular stacks, in base-to-base contact. This source, containing
- 27,000 lb of explosives, had an expected TNT equivalent weight of approximately
S24,000 lb. The source was designed to produce an impulse load of 1100 psi msec
S on the headwalls of the test magazines located at 147 ft from the source. ThisS was the value of impulse estimated to art on the lowest third of an acceptor
. igloo from explosion of an earth-covered magazine filled to capacity (i.e.,
S500,000 lb net explosive weight permitted in one igloo by the current standards)Sw1/3
at a rear-to-front separation distance of 2.0 W , or 159 ft, where W is
the weight (lb) of charge in the magazine filled to capacity. Subsequently,
however, free-field measurements made to the rear of the ESKIMO III donor
magazine, and loadings observed in ESKIMO IV, have indicated an impulse load
7

R-7556-1 -4182
rn147'
20 20NO ESIM
147] 341ý.DEMOLISHED
20'' DO
72 M117 BOMBS IGLOO
147' - k - 147'
]STRUCTURES FROMV®ROMESKIMO I
------------- ---_--. NEW STRUCTURES
FIGURE 1-3. LAYOUT OF TEST STRUCTURES FOR ESKIMO IIMAGAZINE SEPARATION TEST
8 ,I!I

.' -C 4
@4 A m
uO a t , 'n.
Im zAA c
LU -Z cW CL
at 0 0
U 3
U- em ~ '- cc-4a C -4
Ku 0 '~ 4 9

k R-7556-1-4182
of about 1200 psi msec from only 350,000 lb detonated in an igloo at this
scaled distance. In ESKIMO IV, this level of loading was produced 147 ft
from a bare TNT hemisphere weighing 37,000 lb.
Piezoelectric and strain-gage pressure transducers were positioned
in and near the headwalls of the test magazines. Accelerometers and linear
motion transducers were mounted on the doors and headwalls of the structures.
Self-recording mechanical pressure gages were placed at distant stations.
Door motions were observed by a high-speed camera in the interior of each
of the magazines.
Because the near-field blast loading exceeded that planned, the
igloo structures were subjected to an overtest. Despite this overtest, the
large, single-leaf sliding door on Igloo D (south) withstood the blast loading
without breakup or severe distortions. Likewise, the Stradley-type headwall
used for Igloo B (northeast) incurred only an acceptable degree of damage.
The test reaffirmed the need for achieving a balance in the strength of
headwalls and doors.
Reference 4 includes a detailed description of the ESKI•0 II test.
1.3 DESCRIPTION OF ESKIMO III TEST
The ESKIMO III test was conducted on 12 June-.1-574 at the Randsburg
Wash Test Range of the Naval Weapons Center, China Lake, California. Five
earth-covered, steel-arch magazines were exposed in the test to the explosion
of the contents of a similar magazine, as shown in Figure 1-4. Igloos B,
D, and E were those remaining from the ESKIMO II test. Igloo A and the donor
magazine were new structures. Igloo A structure substituted a less expensive,
;ight-gage, deep-corrugated arch in place of heavy structural plate; other-
wise, it was identical to the standard steel-arch igloo. This igloo would
furnish % test of the opinion that the earth cover is the most important
factor in preventing explosion communication. In addition, this igloo was
intended to provide a direct qualification test of thr lightweight igloo.
The donor magazine was built to the same specifications as Igloo A. Table 1-2
shows details of all igloos in the ESKIMO III test.
10

R-7556-1-4182
V _ _V_ _V_ _ _
c j
c"M
C J,
3. I- 0U *
UOC4 1- 6.
LL.4 c' I §a§ 'U - - - -Z9
1 - T U .f
-L U, ' ' U.
i 2 2 66 t I 6 c-'u 60 0 u' " %- L z- C. -IOU I
'a I IAA wl wl 4 -
I~lez dX v31
(AaA l
z UA j "i
'C c

R-7556 -1 -4182
The explosion source consisted of 350,000 lb of tritonal in
750-lb bcmbs in the donor igloo shown in Figure 1-4.
Incident peak pressure was measured at the ground surface in front
of each acceptor igloo. Reflected peak pressure was measured from face-on
blast gages set in each headwall. A row of surface gages measured the
incident peak pressure over the earth on the oval arch igloo and on the light-
gage circular arch magazine. Acceleration and displacement measurements were
made on the arches of these igloos so that should they fail, the rapidity of
failure could be used to estimate whether there would have been a risk of
explosion communication to the contents. Detailed damage surveys and permanent
displacement measurements were made after the test.
The main objective of the ESKIMO III test was to expose an earth-
covered, noncircular, corrugated steel arch magazine (Igloo B) and a new
circular, light-gage, deep-corrugated steel arch magazine (Igloo A) to explo-
sion of an adjacent magazine at the minimum side-to-side spacing now permitted
by standards. In addition, magazine headwall and door structures were tested
at several other distances and orientations of interest.
A preliminary inspection of the structures after the test snowed
that the doors of Igloos A, B, D, and E were all blown open. The headwall of
Igloo E experienced the most severe damage, and permanent inward displacements
were as much as 1.5 ft. Except for local damage near one edge of the door
opening, the headwall of Igloo D experienced generally slight damage. The
remaining headwalls showed only minor damage. Additional details on the test
are provided in Reference 5.
1.4 DESCRIPTION OF ESKIMO IV TEST
The ESKIMO IV test was conducted on 10 Septembe' 1975, also at the
Randsburg Wash Test Range, Naval Weapons Center, China Lake, Cal.ifornia. Its
principal objective was to demonstrate the resistance of a newly designed
headwall-and-door combination to explosive blast loading from detonation of
the contents of another magazine.
12

J:1
R-7556-1 -4182
"-IZ
A (NEW) \.
114,
260 i 4,R (NEW)
EEXISTING
E! LD
FIGURE 1-4. LAYOUT OF TEST STRUCTURES FOR ESKIMO IIIMAGAZINE SEPARATION TEST
13

A k R-7556-1-4182
The ESKIMO IV test array consisted of three magazine structures
each facing the explosion source 147 ft away, as shown in Figure 1-5. The
primary target structure was Igloo B to the northeast, consisting of a single-
leaf s~iding door, horizontally spanned, mounted on a modified headwall of the
standard Stradlay magazine.
Igloo D (east) was rebuilt with the two-leaf, hinged, steel-plate
door and the headwall of the standard circular steel arch magazine. Exposed
to the same level of loading as the primary target, it served as a controlstructure to demonstrate directly the relative strength of the primary target
(Igloo B).
Igloo E to the west was rebuilt with the headwall if the standardcircular steel arch magazine, but fitted with a single-leaf sliding door.This combination was r-5ted inconclusively in ESKIMO II, but the test had
Indicated a serious Imbalance in strength between the door and headwall.
The test utilized a nearly ideal explosion source to generate blast
loadings. It afforded the opportunity for more extensive source diagnostics
and dynamic response measurements on the target structures than in previous
tests of the ESKIMO series. This in turn would enable an extensive correla-
tion between measured and calculated responses.
The explosion source consisted of 8-ib rectangular blocks of TNT
stacked in the form of a hemisphere, containing a total of 37,000 lb of TNT.
The explosives were left exposed, rather than surrounded by an earth cover
or barriers.
Pressure gages were installed in the headwalls and in the ground
nearby to measure blast pressure3 on the'headwalls. Accelerometers and jinear
displacement transducers (LVDTs) were used to measure structure-response time
histories of the headwalls. Self-recording pressure gages were installed tomeasure pressure loading at the far-field stations. Deta'ls on the locations
of the pressure gages, accelerometers, and LVDTs are discussed in Section 4.
14

R-7556-1-41 82
H\00
EXPLOSIVE
SOURCE C
[.E ._-_.. . .._ _
L J
I F
NOTE: IGLOOS A, C, AND F WERE
OLD STRUCTURES FROM THE PREVIOUS
ESKIMO TESTS THAT WERE NOT
CONSIDERED IN ESKIMO IV.
FIGURE 1-5. LAYOUT OF TEST STRUCTURES FOR ESKIMO IV MAGAZINE SEPARATION TEST
15

R-7556-1 -4182
Preliminary results (Ref. 6) showed that the doors of Igloos D
and E were blown in. The headwall of Igloo E sustained extensive damage.
The headwalls cof Igloos 8 and D and the door of Igloo B sustained little or
no damage.
1.5 OBJECTIVES AND SCOPE
The overall objective of the present study was to develop confi-
dence in analytical techniques for predicting the dynamic response of concrete
headwalls and steel-door structures to air-blast overpressures rerulting
from explosion of the contents of an adjacent magazine. To achieve the objec-
tive, the analytically predicted responses of the headwalls were compared
with experimental data from thm ESKIMO tests. The following tasks were
defined;
Task I
Calculate the response of the headwall and door of the south igloo
in the ESKIMO I test, using a finite element model win improved resolution.
I Task 2Calculate the response of the headwalls and doors of the east (C) and
northeast (B) igloos in the ESKIMO 11 test.
Task 3
Predict response of the strengthened Stradley-type headwall and
single-leaf sliding door of the northeast (B) igloo in the ESKIMO IV test.*
*Because of tight schedules, this task could not be completed before the test.Nevertheless, the analysis was performed before any results from the testbecame available.
16

A kR-7556-1 -4182
SECTION 2J
PRESSURE LOADING ON HEADWALLS
This section presents air-blast pressure histories used in the
dynamic response calculations of headwall and door systems. Provisions
for measurino air-blast overpressure data on headwalls were made in the plans
for all shots in the ESKIMO test series. However, the measured data were
generally meager and of low quality. Therefore, data from other tests and from
theoretical considerations were used to design the pressure histories for
the analytical calculations of the ESKIMO tests.
2.1 PRESSURE HISTORIES FOR ESKIMO I TEST
The pressure time histories for the south igloo in ESKIMO I used in
the present study were the same as the corresponding histories calculated in
the previous study (Ref. 2). These histories are shown in Figure 2-1. The
three pressure histories represent loading for the three zones of the headwall,
as shown in Figure 2-2, and differ only during the unloading phase of the
pressure history. The differences reflect the influence of unloading signals
propagating downward from the top of the headwall. The use of just threeI
different zones was considered adequate for the finite element calculations.All the pressure histories incorporate a mill'second (msec) rise-time rampfront for compatibility with the integration time step.
Additional discussions on the calculation of the pressure histories
for ESKIMO I may be found in Reference 2.
17

A R-7556-i -4182
V4
oft4
ata0j
oa
isa -3ns3d
Aihk R-7556-1 -4182
MIN
/0 0
C4
I II
I W i .
19

R-7556-1-4182
2.2 PRESSURE HISTORIES FOR ESKIMO II TEST.
Although redundant air-blast instrumentation was provided at allfive of the test igloos In ESKIMO II, obtaining reliable detailed descriptions
of the blast loads applied to the magazine headwalls was difficult. Records
from most of the gages were reported to be "difficult to read and consideredunreliable." Peak-incident (side-on) and reflected overpressures measured
at the east and northeast igloos were consistent with other experimental data
and with the thsory of gas dynamics for shock reflection. On the basis of
the measured values and this consistency, a peak-loading pulse pressure of260 psi was selected for the ESKIMO 11 calculations.
For the five test igloos the measured impulse varied by a factor of
.wo from the lowest to the highest value. The nearly twofold variation in
measured inpulse may, in part, oe due to the lack of rotational symmetry of
the charge and surrounding revetment. The impulse for the east and westigloos is well below that for the other igloos. However, significant (20%
to 30%) north-south and east-west variations in impulse are present. Theimpulse selected for the headwall loading pulse (1720 psi msec) is considered
representative for the east and northeast igloos.
No positive-phase duration data were reported for the pressure
histories measured at the headwalls. Pressure histories were not available
for examination to establish durations. Scaling of previous magazine-safety
test data, general high-explosives and nuclear-test data, and computationaldata suggested durations of 15 to 35 msec. Consideration of typical pressure
history pulse shapes, the selected peak pressure, and the desired impulse led
to the selection of a 30-msec duration. The resulting pulse developed for
loading the east and northeast igloos of ESKIMO II is shown in Figure 2-3.
The three-zone description of the pressure loading of the headwall
was retained for ESKIMO II. The pressure histories for Zones I and 2, which
experience earlier unloading, are shown in Figure 2-3 superimposed on the
pressure history for Zone 3 derived from measured peak pressure and impulse.
20

'AkR-7556-1l.41182
300C
250-
+ +i
I I
p max p
200-ZONE 3 30 MSEC 260 PSI 1720 PSI MSEC
ZONE 2 30 MSfUC 260 PSI 1432 PSI MSEC
ZONE 1 30 MSEC 260 PSI 1100 PSI MSEC
1150
F 100
ONE 3
ZONE 2
50
010 20 30TIME, NSEC AA 7580
FIGURE 2-3. PROPOSED PRESSURE HISTORIES FOR NORTHEAST ANDEAST IGLOOS, ESKIMIO HI
21

A k R-7556-1 -4182
Adjustments in the pressure load history proposed for calculating -
response of the ESKIMO 11 east and northeast igloos may be made if more reliable
estimates of positive-phase duration are obtained or if more accurate estimates
of the impulse are obtained.
2.3 PRESSURE LOADING 41ISTORY FOR ESKIMO IV TEST
Eight pressure gages were placed, as shown in Figure 2-4, on the
headwall of Igloo 8 (northeast igloo) in ESKIMO IV. This concentration of
instrumentation was intended to measure the variation of pressure over the
height of the headwall and to determine the uniformity of the pressure across
the face. In addition, side-on pressure at ground lev,-l was measured at
three ranges to establish the free-foeld blast pressure corresponding to the
reflected overpressure loading on the headwall. Review of the "quick-look"
data indicated that useful records were obtained from seven of the eightI
stations on th~e headwall and from all the free-field ground levei stations.
At the 147-ft range, the free-field ground level station recordeda peak pressure of 62 psi. Empirical data for high-explosive detonations in
air indicate that the peak reflected overpressure at the same range shouldbe 290 psi (Ref. 7), whereas classical estimates of reflected shock strength
for ideal gases indicate a peak reflected pressure of 265 psi. Raw reflectedIr pressure peaks taken from the "quick-look" records range from 195 to 295 psi.
Pressure histories from Stations P16, P48, and P513 appeared to be
influenced by movement or leakage of the door. The record from Station P48
suggests failure of the gage about 5 msec after blast arrival. The record
from Station P7B shows a prominent oscillatory signal of about a 3-msec period,
which distorts the early portion of the record. Development of pressure
loading for the headwall of Igloo B (northeast) was therefore based primarily
on the records from Stations P28, P38, P6B, and P88, and on the classical
treatment and empirical data for chemical explosions and shock waves in air.
22

Ak R-7556-1--J4 182
I
L~~C __ _ __ _
1
CLC
QD CA
CL
go
I.
0
i °
t <
4c a
uj0* I..-
k4z
23.

R-7556-1-4182
Comoarison of traces from Stations P23, P68, and P88, as shown in
Figure 2-5, fails to support the assumption of systematic variation of the
pressure history over the height of the headwall. Duration of the meaningful
pressure loading on the headwall appears to be 14 msec. This is the duration
adopted for pulses to be used in computing headwall response.
Precursors are apparent in all three pulses. The delay between
eailest arrival and what is considered the main blast-pressure signal is
approximately 1 msec. C=Iarison of signals frown Stations P3B and P68 is
show'n in Figure 2-6. Although differences in peak pressure and precursor
timing and amplitude are apparent, the signals show good agreement. Pressuredifferences durinq the decay phase are of the same order as the differences
between signals from the lower, middle, and upper stations shown in Figure 2-5.
On the basis of the ccmp.irisons of "quick-look" data for Stations P2B,
P36, P6B, and P88, and the analytical and empirical data for chemical explo-I
sions in air, a single pressure history was developed for the headwall response
calculation. The pulse is shown in Figure 2-7 with a smoothed version of the
frea-field ground level (side-on) pressure history measured at the same range.
The peak pressure, 280 psi, is consistent with the analytical, empirical, and!
experimental data. The duration, 14 msec, is congistent with the ESKIMO IVdata, but is considerably shorter than that predicted from the analytical andempirical data. The impulse, 1180 psi msec, is consistent with both the
ESKIMO IV data as shown in Figure 2-8 and with empirical data. The scaled
empirical data (Ref. 7) indicate that the reflected pressure pulse correspond-
ing to a 62-psi incident overpressure pulse from a 37,000-lb hemispherical
TNT charge should have a peak pressure of 290 psi, a positive-nhase duration
of 34 msec, and an impulse of 1160 psi msec. Pulses closely resembling the
represent3tive reflected pulse shown in Figure 2-7 can be made to satisfy
these requirements by adding a low amplitude tail. For example, the pulseshown in Figure 2-9 has a peak pressure of 290 psi, a duration of 31.7 msec,
and an impulse of 1170 psi msec. Its close tesemblance to the proposed short-
duration pulse is obvious. The use of the short-duration pulse is considered
satisfactory and may be preferred for reasons of economy in calculating
headwall response.
24

tI R-7556-1-4182
R
P8B
P28
"P2B
300 P68
..200-
CII
0 0 P28
La P8B
00
-2 0 2 8 10 12 14 16 18 20
TIME, MSEC
FIGURE 2-5. COMPARISON OF PRESSURE HISTORIES FOR A VERTICALARRAY OF GAGES, IGLOO B OF ESKIMO IV
25

A k R-7556- 1-4182
P38 _P68
300- P68
200-
• 100-'A , P38
-10•
-2 0 2 4 6 8 10 12 14 16 18 'TIME, MSEC
FIGURE 2-6. COMPARISON OF PRESSURE HISTORIES TO TEST UNIFORMITY OF PRESSURELOADING ACROSS WIDTH OF ilEADWALL, IGLOO 8 OF ESKIMO IV
26
T + + i I + I . . . . . . . . ' I - i + ,` , . . . . . . .. .. . . . . . . " , , , ... . . .. . . . . . . . . .. . . . . . .

R-7556-1 -4182
.6
I U4
IL IL I -
WI
Iit
27I

A R-7556-1-4182
P86
P68H P213
P2B
300 P68
v 200- PROPOSED LOADING PULSE
S100-
C,. 0 P8B
-100 f-2 0 2 4 6 8 10 12 14 16 18 20
TIME, MSEC
FIGURE 2-8. COMPARISON OF PRESSURE HISTORIES FOR A VERTICAL ARRAY OF GAGES WiTH TH!PROPOSED LOADING PULSE FOR RESPONSE ANALYSIS OF IGLOO u, LSKIMO IV
28

R-7556-1-4182
QI
LLA
.I
°- 1
-- IN
0_
LN- L.J
LU
U I
PA 0
I Sd ' 311I1 LU
291
6j W
aa
-j -
6" 06aU
Si. I.'-CL
00 W
LU LUCD
I.- U ' /SSV~~29

Aik R-7556-1 - 4 182
SECTION 3
STRUCTURAL MODEL OF HEADWALLAND DOOR SY'OTEM
This section describes the finite element models of the headwalls
in ESKIMO tests to be used in performing the dynamic analyses described in
Section 5. The models are to be used in conjunction with the INSLAB computer
program. Section 3.1 describes the finite element model of the south headwall
in the ESKIMO I test. Also included in this section are the modeling tech-
* niques for considering the effects of soil supporting the headwall, concrete
floor slab, and steel arch on the response of the headwall. Section 3.2presents the finite element models for the east and northeast headwalls in the
ESKIMO II test. Section 3.3 discusses the finite element of the northeast
headwall in the ESKIMO IV test.
3.1 STRUCTURAL MODEL, ESKIMO I TEST
3.1.1 :INITE ELEMENT MESH
Fig. 3-1 shows a coarse finite element mesh of the south headwall
ir, :.heESKIMO I test which was used in the previous study to compute analyti-
cally the dynamic response of the headwall (Ref. 2). A refined finite element
model of the same headwall used in the present study is shown in Figure 3-2.
The previous model was necessarily coarse because the existing INSLAB code
(Ref. 8) placed severe limits on the size of the model. To refine the model,the INSLAB code was modified to solve larger problems (Ref. 2). Table 3-1presents a cofmTt'nson , he coarse and refined finite element meshes of the
south headwa i in ESai MO I.
The face of the magazine consists of a concrete headwall and two
steel wingwalls. As di', ;ed in Reference 2, the finite element model did not
include the wingwalls, )se effect on the headwalls it considered negligible.
Preceding page blank
31

A k R-7556-1-41b2
y NODE NUMBER
I ELEMENT NUMBER
z6
i1
133
i 2142= 1._ 16/ 3 17 23 35 3
S/52/ 2. 7 2 8 29
.. __.. /
D3IST AN CE I
3F 38 39 40 49 SI
3,2
44 45 46 47 48 511
-ISO- -ISO. -120. -0-0.-30. -0.
DISTANCE, IN.
FIGURE 3-1. COARSE FINITE ELEMENT MODEL OF SOUTH HEADWALL, ESKIMO I
32

-~n 7 - . - .7
iNODE NUMBER R-7556-1-4182
I 2 4 5 6 1,1LOI 1 9 1 A. nit •t• , 18•
4 1 0 53 54 i1
t p P57 5s 59 20 6 2 63 64
2i 5 Its 27 6 9 70 71 72
73 74 75 76 77 71 7 9 40
41 32 43 44 47 48
3 0 50 1 2 53 64 9 6s
57 so so2 so Cg 8 63 64
I..m L4..u IN..ut...7. I., * I I
RA 6~ |4? lit IQ ' e •
"73 74 73 "76 77 78 7g Ila
U - LL In -a s s 07 Beg
1 33
I8t 0t 83 14 as as 0"7 asLAL I-I Ia I RI Anqf 0
a 90 aO 22 9 •3 94 9iS 96
S?n1 ta I11 n1 H_ I7 It 1 15--4
S~DISTANCE, IN.
S~~FIGURE 3-2. REFINEC) FINITE ELEMqENT MODEL OF SOUTH HEADWALL, ESKIMO I
233

R-7556-1 -4182
TABLE 3-1. COMPARISON OF COARSE AND REFINEDFINITE ELEMENT MESHES
Coarse Mesh Used Refined Model of Change,item to Be Compared in Previous Study Present Study
1. Total nodes 66 120 + 80
2. Total elements 51 96 + 90
3. Half bandwidth ofstiffness matrix 33 33 0
4. Total elementsrepresentingthe door 8 18 +125
5. Total discreteelements representingsoil 43 71 + 65
6. fotal discreteelements representingconcrete floor 0 18
7. Nodes for whichresponse histories tobe obtained 10 19 + 90
8. Estimated fundamentalfrequency of thelargest element 1000 Hz 2250 Hz +125
34
h6j

R-7556-1-4182
3.1.1.1 Properties of Door
The south-igloo headwall in ESKIMO I was fitted with double-leaf
hinged steel doors. The door was constructed from a 31o-in. plate supportedby 3-in. channels and 3/8-in. plate stiffeners, as shown in Figure 3-3. A
No. 16-gage steel plate was spot-welded on the inside of the door. The doorI is modeled as an orthotropic plate of un;form thickness possessing the charac-
terisLics of the real door. The equivalent properties of the steel door as
computed in Reference 2 are summarized below:
Property Symbol Numerical Value
Equivalent plate thickness h 2.04 in.
Modulus of elasticity E 32.4 x 10⁶ pi
Modulus of elasticity E 27.8 x 10 psi
Equivalent density 1 0.0812 lb/in. 3
Yield moment M 10.52 kip-in./in.xx
Yield moment M 12.83 kip-in./in.yy
Plastic modulus E 0.1 of elastic modulusp
3.1.2.2 Properties of Headwall Section
A typical section of the headwall, showing the details of the rein-
forcement, is shown in Figure 3-4. To account for the rapid application of
loading, the dynamic yield stress, f, for the reinforcing steel is taken
as 52 ksi, as suggested in Reference 9. Similarly, the dynamic strength of
concrete in compression, f, is taken as 3900 psi, a 30% increase from the
static strength of 3000 psi. Young's moduli for steel and concretp are
S assumed to be 30 x 106 psi and 3 x 10⁶ psi, respectively.
35

yI
3/8- 1II
13" X 3/8" BAR
NO. 16 Ga-- j
3C 6
-w x
(a) Elevation of the door (c) Cross-section B-Balong y-axis
3 " 6 /NO. 16 Ga
3 E6
3/8" V'0' \3 X 318" BAR
(b) Cross-section A-A along x-axis
FIGURE 3-3. DOOR DETAILS FOR SOUTH IGLOO, ESKIMO I
36 I

R-7556- 1-4182
!x
N.4NO.6 T* 12"1
- j-y-z 1.75" 4.375"
1- *T SOIL1"
ARCH1 L (b) Section AA: cross-section SF" - 4-- perpendicular to y-axls Y
15I NO. 4 AT 12" y
PtNO. 6 AT 12" .12
L' NO. 4 NO. 40 * 12"
(a) Reinforced concrete section
2.2 5•"- - 5-1---
(c) Section BB: cross-section Sperpendicular to x axis
FIGURE 3-4. SKETCHES OF HEADWJALL SECTIONS TO COMPUTE MATERIAL
PROPERTIES (SOUTH IGLOO, ESKIMO I)
37

ilk R-7556-1 -4182
Based on Figure 3-4 and the assumed material properties of
reinforced concrete, the yield moments for ooth cross sections S and Sx yaire calculated. It is found that both cross sections are underreinforced;
therefore, the yield moments are governed by the tensile strength of steel.
The procedures for computing these moments are presented in Appendix B.
For Section Sx
M+ - 121.2 kip-in./ft when the headwall is concave inwardyyM - 159.0 kip-in./ft when the headwall is concave outwardYY
For Section Sy
M+ = 110.7 kip-in./ft when the headwall is concave inwardxx
M" - 69.2 kip-in./ft when the headwall is concave outwardxx
The headwall section is modeled as a homogeneous, orthotropic plate
of uniform thickness possessing the same dynamic characteristics as the actual
reinforced concrete headwall. The equivalent properties of the headwall
sectiorn are given below:
Property Symbol Numerical Value
Equivalent plate thickness h 12 in.
Modulus of elasticity E 3 x 10⁵ psi
Modulus of elasticity E 2 x 10⁵ psiy
3Equivalent density 150 lb/ft
The values of E and E are obtained using the procedure described inx y
Appendix C.
38

ii~iL R-7556-1 -4182
3.- 2 STIFFNESS OF SOIL
The ESKIMO tests (Refs. 1, 4, 5) showed that the compacted soils
behind the headwall and covering the steel arch influence the behavior of the
headwall significantly because of the interaction of soil and headwall. In
the longitudinal direction, the earth cover merges smoothly with the ground
behind the rear wall. Therefore, any support provided by the soil per unit
area of the headwall is similar to an infinitely long compressible column.
The response of the soil is expected to be highly nonlinear because the
permanent displacements of the headwall are of the order of several inches
(Refs. 1, 4, 5).
Actual test data regarding the strength of the compacted soil over
the north igloo of the ESKIMO I test array are available (Ref. 10). In the
test, two opposing rams were driven by a hydraulic jack horizontally outward
against the earth fill through circuiar openings cut in the right and left
sides of the corrugated steel arch. Load deflection curves were rlotted for
the soil over the igloo at the initial stage of the loading and the final
stage (5 min after the application of lobds). The spring constants of the
soil based on these curves are shown in Table 3-2. It is noted that in the
testing, the soil was allowed to settle for one minute before additional
loading was applied. For the quantities of explosives normally stored in
magazines, blast-pulse durations at distances of interest are of the order
of tens of milliseconds. As a consequence, the corresponding stiffness isvery hiah. To arrive at a reasonable dynamic stiffness of the soil, a
column of soil subjected to step loading of magnitude P was investigated.
The deflection S at ti-e t is
PLAE
39

R-7556-1 -4182
TABLE 3-2. SOIL STIFFNESS FROM TEST IN NORTH IGLOO
___ ___ ___ ___ K, lbin.3
Stage Location P -0 to 60 psil P -60 to 270 Psii P - 270 Psi
Iiil Right 700 350 230
Left 666 245 133
Right 600 330 190Final
Left 580 235 133
The stiffness is defined as
K P FAE
whereI A - The cross-sectional area of the soil columnw
E - PC
C - Wave velocity in the soil medium, 4000 ft/sec
p- Mass density of the soil, 0.00018 lb-sec 2 /n.4
L - Ct
Because of the reflections of the pre~ssure wave a3t the ends of the
soil column, different expressions for the deflections were derived and are
illustrated in Figures 3-5a to 3-5c. The resulting stiffness withi respect to
time is shown in Figure 3-5d.
The dynamic stiffness calculations are based on a one-dimensional
wave propagation model. Neither soil friction nor wave dispersion was con-
sidered; therefore, the true valups should be a little higher than the test data.
In addition, there was ample tir'e during the test for soil to settle; whereas
in the dynamic stiffness calculation, there is very little time for soil to
40

A ~R-7556-1 -4182
K L
AA- t
A
- L/C < t < 2L/C
S6 "•÷LT"
(b)
P
SPL PL PL'
W E + WE A
L' " E+P(L + L'')Si ---IAE
(c)
3000
2000 -
1728 ) 1723 \1728zi7z
.J
U,,
S1000 - 864 8ý4
U,-
0 I I0 5 10 15 20 Z5 30
TIME. MSEC
(d)
FIGURE 3-5. DYNAMIC STIFFNESS OF SOIL
41

R-7556-1-4182
settle. The mroulus of elasticity for soil under high pressure conditicns
is much smaller tnan that under low pressure conditions, as can be seen in
Table 3-2, which shows lower static stiffnesses at hiqh pressure levels.
It is doubtful that the effect of loading magnitude is important, especially
when the peak pressure occurs for only a 3-msec duration.
The lowest dynamic stiffness, otcurring at 10 msec, 30 msec,50 msec, etc., is 864 lb/in. 3 (Fig. 3-5d), which is slightly higner than the
static stiffness shown in Table 3-2 (700 and 666 lb/in.3 for right and leftlocations, respectively) in the initial stage. Since the major exolosive
loadings used in this study were applied to the headwall within the first
few milliseconds, the stiffness is subject to rapid change during this
period. A value of 1300 lb/in.3 is considered to be the best estimate on
the soil stiffness.
3.1.3 MODEL REPRESENTATION FOR SOIL AND HEADWALL INTERACTIONI
In most analyses involving structures supported on soil, a common
practice is to represent the soil by spring-mass or spring-dashpot systems
(Ref. 11). This approach is valid if the motions are small so that the soil
response is linearly elastic. Since the soil behind the headwall behaves io
a highly nonlinear fashion, the conventional approach of representing soil
by spring-mass or spring-dashpot systems may not be useful. In addition,the presence of springs would not allow the headwall to undergo permanent
deflection. For this reason, viscous damping elements, or dashpots, wereused in the previous study (Ref. 2). Massless dashpots with damping
coefficient equal to -C per unit area of headwall were used, where is
the mass density and C is the wave velocity of the soil. The computeddisplacements from the study generally exceeded the measured values from th3test. The use of dashpots alone was considered to be a factor in producing
excessie ddisplacements.
42

R-7556-1 -4i182
In order t3 determine the best possible model to represent the soil,
the three test cases shown in Figure 3-6 were considered. A section of the
headwall was sliced along the vertical plane. The base of the headmall was
embedded in the ground. The top of the arch line var;nIs from 13 ft at the
center tr zero at the ends of the headwall. A value of 5 ft was arbitrarily
selectt6 •;e rear of the wall, from the top of the steel arch ro the top
of the :-_adwal 1, was supported by earth fill.
In Case A, the earth fill was represented by a series cf elestic
springs attached to the nodes on the headwall, as shown in Figure 3-6.
A certain percentage of the mass of soil was concentrated at each of these
rnodes, as discussed in Reference 2. The stiffness of the springs was equal to
1300 lb/in. per unit area of the headwall section. In Case B, the earth
fill was modeled by a series of linear dampers attached to the nodes on the
headwall section. Tho coefficient of the dampers was taken equal to -C.
In Case C, t:he soil medium behindl the headwall was modeled by lineardampers and nonlinear springs in series attached to the nodes on the headwall
section. The coefficients of the linear dampers were equal to -C. The
nonlinear springs were one-way springs that can resist notion only in one
diiection. i.e., in compression. The stiffness of the springs in cor'pression
was equal to 1300 Wb/in. per unit area of the headwall section.
All three models were subjected to the same blast-pressure loading
experienced by the south igloo in ESKIMO I. Dynamic responses of the models
in three cases were obtained using TRI/SAC code (Ref. 12), a general finite-
element computer program capable of solving linear and nonlinear problems.
Cases A and B were solved with the linear step-by-step option of TRI/SAC
(Ref. 12), whereas Case C was solved with the nonlinear step-by-step option.
The response time histories at selected locations are shown in
Figures 3-7 through 3-11. In Case A, displacement responses oscillate at high
frequencies and eventually attenuate to zero (Fig. 3-7). This type of behavior
of the headwall is in contrast to the observed behavior in the ESKIMO I test,
43

R-7556- 1-4182
4c
- En
4L-z
a 0i
ujT-
34, r i
-TI
T7
1
~zII
I" a
inuz
CM .1 %SM I I
T :-I
LijJ
4',c
ft% PO 0 I1~:TE~ : 4-;
44 4

R-7556-1 -4182
so SO*
j IA
CA
u1
T to
1! 34 L6J~
_ _ _ _ _ _ _ _ _ _ _* 31 I
45~

R-7556-1-4182
do
IL
; 0
L!I
03 a
a C-4
i1 \ (A
500~~ ~ 500 '0 0 ai0 Io
~, I
• .•
L ZLi
46.
SJ E
/ I
a. ,3' ZfliO PZ8" E; 61 r 01 OT"?L c•a .N3I];3'•,S :
: 146

R-7556-I-41 82
I.
1 7
I L'
F;t4
!
r
-i vi
L 0 3,
CIO
AL!-G"3A -
_ _ __I_"_ _ _ _ _ __"_ _ _ _ _ '• I' tl \" ! -
in , U 0il
Si ,!I
' I47
4•7

Ak R-7556-1-41 82
i L
0 , . . (al r
tot. 3313 0 2-
a.!
UO
I =Z
,i a t' Oi" O t ieO s o s 1 " O" O~ o o • ' • a
LjA
ttv
a I,,.,
/ -
L a?
48

A-= R-7556-t-4182
!gig
I
Go, alI! *
a
La
,1 .2•
IF I
U Inni-
,. O: ll 0 G
49. •
I, i . ,..Il•"3 '• C'.
urg li ~ 00'- I
"• • 00 II •0"I~t O0"I 0 " i O0Jo 0'
•136•h

R-7556- 1-4182
where largo permanent displacements of headwalls were noted. The headwall in
Case S (Fig. 3-8) does not exhibit any oscillations initially aiid then
stabilizes at a displacement level slightly smaller, than the maximum value.
The displacement and velocity time histories for Case C are shown in
Figures 3-10 and 3-11, respectively. The behavior of the headwall in
Case C is similar to Case 8 except that the final displacements in Case C
are well below the maximum values.
In the ESKIMO I test, a gap of several inches between the headwall
and the earth fill was noted (Ref. 1). This indicated that the permanent
displacements of the headwalls were significantly smaller than the maximum
values reached during the test. The soil model of Case C (Fig. 3-6) appears
to best represent the qualitative behavior of the earth fill in the
ESK(IMO tests. Howevir, the magnitude of the displacements obtained in
Case C indicates that reduced numerical values of coefficients for the springs
and dampers must be used. In the absence of any relevant measurements, the
only guidelines for choosing these coefficients is their performance in small
test problems. It was found that, in such a test problem, a spring constant
of 40 lbin, per unit area and a damping coefficient of 0.75 lb-sec/in, per
unit area produced headwall displacements that were of the order of magnitudeI
This combination of linear damper and nonlinear one-.',ay spring was
used to represent the interaction of soil with the finite element mesh of
the south headwall (Fig. 3-2). The constants for the spring and dashpot at
a node were based on the total tributary area of soil to be concentrated at
that node. The existing INSLAS code did not provide for nonlinear springs.
Therefore, the program was modified to accept nonlinear one-way springs.
Theoretical details on the incorporation of these springs, along with som~e
test cases, are presented in Appendix A.
50

ilk~ R-7556-1 -4182
3.1.4 E7FECTS OF CONCRETE FLOOR SLAB
The floor of the south igloo in ESKIMO I is a concrete slab 6-in.
thick, which thickens to 12 in. near the headwall. The reinforcement consists
of No. 4 ba;% spaced 12 in. apart, 3 in. below the top surface of the slab.
Linear spring elements and concentrated masses are used to model the effects
of the floor. The spring constant per unit area of the floor slab, determined
in response to a static-compressive stress, is
a 12,500 lb/in. 3zL
This value was obtained assuming Young's modulus of concrete to be
Eu 3 x 10⁶ lb/in.2
c
and the length of the igloo to be 20 ft. The stiffness of the floor in
response to a dynamic load would be larger than the value given above.
However, the fact that the rear wall of the igloo is not anchored perfectly
would result in a slightly lower stiffness value. Assuming that the -,arious
unknowns compensate for each other, the static stiffness was used in modeling
the effect of the floor.
The value of the mass of the floor slab participating in the mass/
spring representation was chosen to preserve the fundamental frequency of
longitudinal vibration of the floor. The resultirg value is equal to the
mass of a strip of floor slab 8.2-ft wide.
II
511
R-7556-l -4182
3.1.5 EFFECTS OF STEEL ARCH
The main function of the steel arch in a magazine is to protect the
contents of the magazine from t;.e weather and from the earth fill over the
magazine. The only structural requirement for the arch is to support the
earth fill around the arch. The material used in the arch for the south
;gloo headwall (ESKIMO I) is No. 1-gage corrugated steel. The corrugation
increases the bending and circumferential stiffness of the arch, but reduces
its longitudinal, or axial, stiffness.
To study the longitudinal stiffness of the arch, one corrucation of
the arch is considered. Since this is symmetrical at the centerline of the
folý only one half of the fv-hd is necessary. The curved fold is approximated
by a straight segment AB, as ,.hown in Figure 3-12. Uoider the action of a
horizontal load P at end A of the segment, the horizontal displacement of
A results due to bending and axial compression of the member AB. The
component of deflection due to bending can be calculatcd as
PL 3 sin 2 eIb Ib 12EI cos3 e
and the component due to axia: compression is given by
PL cos 6a AE
where El and AE are, respectively, the bending and axial stiffnesses of
the arch. Therefore the total horizontal displacement of A is
PL 3 sin2 e PL cos e
12EI cos 3L AE
52

R-7556-1-4182
LINE OF APPLICATIONOF AXIAL LOAD
E0
L L
P
m 2
I--D
PD
A
FIGURE 3-12. AXIAL STIFFNESS OF STEEL ARCH
53

R-7556-1-4182
For a unit width of the arch, the following values are used to
compute
2A - 0.2758 in.
E - 30 x 106 psi
I - 0.001743 in. 4
L - 3 in.
h - 0.2758 in.
9 - 33.70
The horizontal displacement 5 is computed as
6 - (2.32 x 10⁻⁵ in./lb) P
If the corrugated arch were to be treated as if it were constricted
of an equivalent uncorrugated material, the relation between load and deflec-
tion would be
PLAE
e
where Ee is the equivalent elastic modulus of the uncorrugated -ateria:.
This relation can be used to determine the ec.-valent moculis. -aking .se
of the above relation between load and ae=lec:ion. The resil! 's
E - 4.60 x 10⁵ psie
The buckling stress of tne e•jivalent unccrruqa:ez arc- is ::-:.:ez
forn the relation
Ehe
a !3ý1 -
54

R-7556-1 -4182
where a is the radius of the arch (a -156 in.), h is the thickness of the
arch, and is Poisson's ratio of the arch material (assumed v - 0.25).
The buckling stress is computed to be 495 psi. Although this is the theo-
retical buckling stress for the equivalent uncorrugated arch, buckling
experiments on cylindrical shells show that the stress at which the shells
buckle is seldom better than 30% of the theoretical value (Ref. 13). Thus,
the buckling stress of the arch is estimated to be 150 psi.
Nodal point 31 of the finite element grid of Figure 3-2 is a
typical nodal point located on the arch. The length of the arch that is
attributed to tnis node is about 24 in. Therefore, the force acting on this
n-de due to buckling of the arch is 990 lb. At no time can the fo.'ce of the
arch on Node 31 exceed this value. This node is also influenced by in area
of about 143 in.2 of soil backfill. Using Node 28 (see Fig. 3-1) of the
previous calculation of ESKIMO 1, south igloo, as a guide, the expected
peak displacement and velocity of Node 31 are 5 in. and 150 in./sec',
respectively. The soil is represented with springs having a stiffness of
40 lbin, per unit area, and dampers having a viscosity of 0.75 lb-sec/in.
per unit area. These values result in a peak force of 28,600 lb due to
elasticity of the soil, and an additional peak force of 16,100 lb due todamping. By comparison, the contribution of the arch is expected to be
negligible.
A study of the permanent deformations and damage patterns of headwalls
in the ESKIMO tests indicate that the steel arch appears to strongly influence
the behavior of the headwalls during the tests. As an example, Figure 3-13
is a contour diagram of the deformation of a headwall after the ESK~IMO I
test. The deformation contours generally approximate the shape of the steel
arch, which was semicircular. Figure 3-14 shows a front photographic view
of the same headwall after the test. The crack pattern experienced by the
headwall again approximates the shape of the steel arch. It is believed
that this phenomenon occurs because the arch separates the supported and
unsupoorted areas of the headwall. in particular, the unsupported area of
55

-3' -31 -Z2 -32 .4
- 36
-
0
-11 4
FIGURE ~ ~ ~~~+3 31. MVMN1FHAWL FNOT CETRILO SIOi
A plsvleshw0oeen1wy,~r h oo
mAgzn;amnsvuesosmvmn tor.04-e unit ar in hunreth offeet
+1356

A'ICD d R-7556-1-41 62C'P available to DDC dn•.s nf',t
P" !Ofl legiblo ea o'
i
FIUR 3-. "EAWAL OFNRT.GOO SKM. Noecrc
:~* ,'*.. I
*.1
SFIGURE 3-14. HEADW4ALL OF NORTH IGLOO, ESKIIIO I. Note crack
pattern approximating shape of steel arch.
57
Copy avcilable to DDC does not
pen]. fI. ly legible o•pxoducn b.

R-7556- 1-4182
the headwall is semicircular, and hence it is not surprising that the permanent
deformation and damage patterns of the headwall resemble the shape of the arch.
In addition, the sharpness of the steel arch causes high stresses in the head-Iwall, causing local failure along the arch line.
3.2 STRUCTURAL MODELS OF HEADWALLS IN ESKIMO II
Two different headwalls in the ESKIMO II test have been analyzed.
These are the Igloo C (east) and Igloo B (northeast) headwalls. The structural
models of these headwalls are described in the following subsections.
3.2.1 IGLOO C (EAST) HEADWALLAs described in Section 1.2, the east headwall in the ESKIMO II test
is identical in every respect to the igloos used in ESKIMO I. Therefore, the
finite element model of the east headwall in ESKIMO II is identical to the
model of the south headwall in ESKIMO I (Fig. 3-2) described in Section 3.1.
3.2.2 IGLOO B (NORTHEAST) HEADWALL
Figure 3-15 shows -. plan and an elevation of the Igloo B (northeast)
headwall in the ESKIMO II test. The wingwalls are of reinforced concrete
construction and are monolithic with the headwall. Therefore, the finite
element model of the headwall shown in Figure 3-16 includes the portion of
the wingwall up to the counterfort in order to consider the effect of thewingwall on the response of the headwall. As Jescribed before, an oval-shaped
steel arch is used behind the headwall to support the soil. The opening in
the headwall for the door is strengthened with concrete beams, as shown in
Figure 3-15. On top of the horizontal beam, there is an overhang that extends3 ft from the headwall. Since there is very little reinforcement provided
along the vertical direction, the overhang is not considered to function as a
structural member. Therefore, although the mass of the overhang is includedin the finite element model, the stiffness is not. In designing the finite
element mesh shown in Figure 3-16, the beams are represented by separatte
53

R-7556-1 -4182
I IL % C-W Ai9M1L
ine f lO V31VUI±3WAS I
cia
Oj~/Jo -L J
LI 71 CL
C11C
_ 0
-6- .
05

R-7556-1 -416~2
inpa ArV3WA
- -) ±osv v~I~.3wws I-IA :1
L-a
WIW
_Ij
~?liC.

R-7556-1-4.182
9 it Iwole
10 0
p.0to,
u.J
LLZ
Cc:C
Sr
14 0 x 49cc U- -- ----- - ----- -- ---
400
61.

i iAkilk R-7556-1-4182
elements so that the actual beam properties can be assigned to only the
elements representing the beams. This avoids the averaging of properties
that becomes necessary when the same element represents the beam and a
portion of headwall. The arch line is placed as closely as possible on the
edges of the finite elements. In order to minimize the use of triangular
elements, the arch line Is permitted to run across the Elements 11, 12, 22,
33, and 44, as shown in Figure 3-16. The finite element shown in Figure 3-16
consists of a total of 107 plate elements and 127 nodes.
The biparting and sliding steel door of the northeast igloo consi5s
of a 5/8-in. plate and a 1/ 4 -in. plate sandwiching five 5110 steel sections
arranged vertically as shown in Figure 3-17. Following the procedures
described in Reference 2, the mnterial properties of the elements representing
the steel door are computed. These values are summarized below:
IProperty Symbol Numerical Value
Equivalent plate thickness h 4.14 in
Modulus of elasticity E 30 x 10 ksi
Equivalent density 0 0.0773 1b/in.3
Yield moment M 68.6 kip-in./in.xx
Yield moment Myy 9Z.9 kip-in./in.
Plastic modulus E 0.1 of elastic modulus
Poisson's ratio V 0.25
The headwall and wingwall are modeled as homogeneous plates of
uniform thickness possessing the same dynamic characteristics as the actual
reinforced-concrete sections. The yield moments for these plates are cor-puted
using the procedures described in Appendix B. The yield moments and equivalent
properties of the headwall and wingwall sections are sho-in in Table 3-3.
6Z
R-7556- 1-4182
1/4" P,
5/8" It
IJ
II
(a) Elevation (b) Longstudina! section
51-05/8" It j e
-" 51-3" -1
(c) Cross section
FIGURE 3-17. CONFIGURATION OF STEEL DCOR FOR IGLOO B (NORTHEAST . ESBimC 1i
63

R-7556-1-4182
TABLE 3-3. PROPERTIES OF HEADWALL AND WINGWALL SECTIONSOF IGLOO B (NORTHEAST), ESKIMO 1I
Value for Value forProperty Hiiadwall Section Wingwall Section
Equivalent plate thickness, h 12 In. 12 in.
Modulus of elasticity. E 4.6 X 10⁵ psi 2"67 x 105 psi
Equivalent density, a 150 lb/ft3 150 lb/ft 3
Yield moment, M 290 kip-in./ft 101 kip-in./ft
Yield moment, MXX -231 kin-in./ft -79 kip-in./ft
Yield moment, M- 196 kip-in./ft 1-2 kip-in./ft
Yield moment, M -160 kip-in./ft -81 kip-in./ft
AA8012
The supporting system of the headwall consists of the backfill on
top of the steel arch, the concrete floor slab, and the soil below the 'loor
slab. These supports are represented in the form of sarings and darrpers as
described in Sections 3.1.3 ano 3.1.4.
3.3 STRUCTURAL MODEL OF IGLOO B (NORTHEAST) HEADWALL, ESKIMO IV
Figure 3-18 shcxvs the finite element model of the heaz.ali of t:e
northeast igloo in the ESKIMO IV test. An oval-shaped steel arch su:cor.s
the soil for this igloo. The door opening in tle heac..all is s.ren:t.e-ez
with concrete beams. The vertical oeam extends to tne to o0f tne neao..aV.
As in the case of the northeast nead.-all in tre ESKIMO II "es:. --e -'oce' :.
this headwall represented the bea.-s by separate ele'ents. An el"ort ..as -aze,
as far aw possiole. to place :ne arch line on the edges cf t-e 4;-ýte e'e-e-:s.
4owever, in order to -rini-.:e the use of tr;angular eie-en:s. t"e a-:- *'-e
was pernitted to run across Ele-ents 22. 33. 43. and 53. as sn.-r in
F;gure 3-IS. The finite ele-ent -tv-sh 4or t;s nea,..a1i s :. .t- i "-a:

Ak?
1 2 3 4 S 6 7 a g
II to L-toISi•
to It 13 14 is t6 17 16
to 20 21 "3 24 26 27
229 30 3 3t 33 34 35 36it to L9 t A &a .So0
37 30 33 40 41 42 43. 44 45
43 47 46 49 so 51 52 54
55 7 6 57 57 59 60 6t 62 63
w 54 65 66 67 65 69 70 71 72
73 74 75 75 77 70 79 00. 6tA...,..1.
52 03 64 as *6 87 so a9 90inj m, L02 - •OR tO I ne o? hM nit no It
21 92 93 94 Us g6 97 gO 9 g
lO00 ot t - 103 104 105 106 107 /100
tog Ito 1i1 112 113 114 115 it6 11'
its L 19 tL• t '21 122 123 124 125 126
FIGURE 3-13. FINITE ELEMENT MODEL OF NORTHEAST HEADWALL, ESKIMO IV
65

R-7556-1-40 82
the locations of the accelerometers and the LVDT transducers (see Sec. 4) gen-
erally correspond to sc.ne nodes in the mesh. This facilitates a direct compari-
son of the test and calculated results. The finite element mesh of the head-
wall shown in Figure 3-18 consists of a total of 126 elements and 150 nodes.
The single-leaf sliding steel door of this headwall consists of a3/8-in, plate and a 1/4-in. plate, strengthened by four 6WF25 wide flange
sections and two 6 C 13 channels, all running horizontally. Two 6 C 13 channels
also run vertically along the two ends. This arrangement is shown in Figure 3-19.
Fo;lowing the procedures described in Reference 2, the material properties of
the elements representing the steel door were computed. These vadues are
summarized below:
Property Symbol Numerical VaIue
Equivalent plate thickness h 4.49 in.
Modulus of elasticity E 30 x 103 ksi
Equivalent density 9 0.05>• lb/in. 3
Yield ,momen t M 107.0 kip-in./in.
Yield moment M 14.07. kip-in./in.
Plastic modulus E 0.1 of elastic modulusP
Poisson's ratio v 0.25
To account for the variation of section )roperties, a total of nine
different materials is used to describe the model, as shown in Figure 3-20.Material No. 1 refers to the pruperties of the steel door, as discussed above.
Due to the different ar.angtmnenL of the reinforcing steel, the headwall section
is assigned four dilfferent materials with Nos. 2, 3, 8, and 9, as shown in
Figure 3-20. Material Nos. 5, 6, and 7 are used to represent the beams.
Material , is assigned t- the footing of the headwafl. The materialproperties assignedi to each material number is shown in Table 3-4. The yielc
moments of all soncrtte sections are computed using the procedures described
in 4ppendix B.
I' JtI

P-"556- 1-4182
P ~6[•
10'
3/8" P, 6 WF25
I_ _ _ _ _ U----'(a)~~~~~ ~~~ Clvto (b og Udi eto
(a) Elevation (b) Longitudinal section
1/4, It\
6 E133/8"•i
(c) Cross section
FiGURE 3-19. .ONFjGURATION OF STEEL DOOR FOR IGLOO B (NORTHEAST) HEADWALL,ESKIMO IV
E7

A _A75-1-.8
5'0"m
- - - -- -8
6£
4=4a -BEE - -
FIUR 3-7=.0 REIN-FDFEETMAEILPOETE O
-A-" (OTEAT EDWLESIOI
8-6
// -u~7=:
a-7ss6- 3-141o2
s* -r d* r
ACA
o4C 8 - W% C, o,
Vr' -. 10
a~a _ '
'CL
LA - .- - Id. 0 . -
£ U a~ C$ 0~ 0
- 0. W 0- 0. a U
CC
t4 -
-7 I-M %D w C
z '..'n69

The supporting system of the headwall consists of the ackfJi l on
top of the steel arcn, the concrete floor Slab, ano the soil beow t"e floor
slab. The representation of these supports in the form of springs and
dampers is described in Sections 3.1.3 and 3.1.4.
70

iS R-7556-1-l 182
SECTION 4
INSTRUMENTATION FOR ESKIMO IV
This section describes Agbabian Associates' recormendations on tte
instrumentation.of the igloos in the ESKIMO IV test: types of transducers :nat
were to be used. their locations on the headwalls and doors. and t.e rarces 04
variables over which the transducers were to be calibrated. The recommenda-
tions reflected a desire to obtain sufficient measurements of the northeast
,ieadwalI, since this is the only headwall of ESKIMO IV that was anairzea
using the INSLAB code.
4.1 PRESSURE GAGES
The Kistler gages were used to measiira pressure-time histories on
headwalls in the ESKIMO IV test. These quartz crystal piezoelectric trans-
ducers were selected because of their excellent past performance in similar
events. Table 4-1 shows estimated peak pressures and the ratings of
pressure gages that were scheduled to be used in ESKIMO IV. Table 4-1 also
shows similar information for the Ballistic Research Laboratory (BRL) self-
recording mechanical gages, placed in pairs, to measure far-field pressures
along radial lines in th": northwest, west, and south directions.
Figure 4-I shows the recommended arrangement of pressure gages on
the northeast ioloo (Igloo B). The primary objective of this recommendation
was to determine the variation of pressure loading on the wall in vertical and
horizontal directions. Because of the symmetry of the loading with respect to
the centerline of the headwall, all gages except one were placed on the right
half of the headwall. The gage on the left half of the headwall was intended
to detect any significant deviations in the symmetry of the loading. The
arrangement shown in the figure commits 8 pressure gages for the northeast
igloo. Figure 4-2 shows the recommended arrangement of the pressure gages
on the remaining two igloos.
71
Ak R-
Is 20
39- .r A LA L A L
- %- %- ý. q0 q C - m V
=~ 0
6 %a06 C
imJ
vii
U.,
'A. -- -- -
I- - -T lA-N%
C.,~~ __ _30 t
04 3).I
0 00 ___________
zn -W EUr 0 e 0 (0LAJ-
0~ EU0O
-I CA 4cc
w .~72

SKR-7556-1-4182
_._ 1.1•
•,--------------
6-
VtV)
0.•
CLj
73
d I uI

PRESSURE GAGE 3
0 2
9,
0PRESSURE GAGE
FIGURE 4-2. PLACEMENT OF PRESSURE GAGES ON EAST (D)AND WEST (E) IGLOOS, ESKIMO IV
74

u k R-7556-i-41 82
4.2 ACCELEROMETERS
Accelerometers (Model 114 by Setra Systems Inc.) were used to
measure acceleration-time histories at various locations on headwalls in
the ESKi(IO IV test. These gages yield good response from zero hertz to
several hundred hertz, and the damping of the seismic eiement is essentially
independent of the changes in ambient temperature. Table 4-2 shows estimated
peak accelerations and ratings of the accelerometers used in ESKIMO IV.
Recoemmnded placement of the accelerometers on the headwall of the
northeast (B) igloo is shown in Figure 4-3. Because of the assumed sym•setry of
the loading and the structure, the transducers were placed only on one side
of the centerline of the igloo. The recommended locations for the gages
generally coincided with the nodes of the finite element mesh that was
used to analyze the headwall. As shown in the figure, a total of 12 acceler-
ometers was placed on this headwall and no accelerometers were placed on the
headwalls of the east (D) and west (E) igloos.
The impulse response of the accelerometers was checked ou• prior to
the test with a drop-table calibration device. This portable device was
carried to the site for one-the-spot checkout of the accelerometers.
4.3 LINEAR MOTION TRANSDUCERS
Long-stroke displacement transducers of the LVDT type were used in
ESKIMO IV to measure movement of the concrete headwall. The female part of
the transducer was attached to a universal joint mounted on a rail section
(mass) that was suspended from the corrugated metal roof of the igloo by
chains. The male or rod portion was supported by universal joints, with one
universal joint securely attached to the headwall at the desired point of
measurement. An effort was made to reference as many transducers as practical
to the same mass.
75

A kR-7556-1-4182
CENTER~~AU LIEINE'3* t31 a10
f DOOR FRMEACCELEROMETER NO.
10,3 4 5
S'S
AA 7501
0 ACCELEROMETER
FIGURE 4-3. PLACEMENT OF ACCELEROMETERS ON HEADWALL OF NORTHEAST
IGLOO, ESKIMO IV
76

R-7556-1-4182
TA9LE .-2. SCHEDULE OF ACCELEROMETERS FORNORTHEAST IGLOO, ESKIMO IV
Estimated Desiredmex i mwM Accelerometer
Acceleration, Rating,Position _ 9g
Door 630 1000
Headwall -- away from door 150 300
Headwall -- near door 200 300
Figure 4-4 shows reconmended placement of the displacement trans-
ducers (LVDT) on the headwall of the northeast igloo. Again, the locations
shown for LVDiTs generailly coincided with the nodes of the finite element mesh.
Nine LVDTs were placed on the northeast igloo, as shown in the figure, and
6 LVOTs were placed or, the remaining two igloos.
77

A k R-7556-1-4182
CuNTkI LINI OF IGLOO
I
ARCH LIN I
7
SI * -6'
3m-ge' DOOR FRMIE
2 3
5,
AA 7500
0 LVOT
FIGURE 4-4. PLACEMENT OF LVDT TRANSDUCERS ON HEADWALL OF NORTHEAST
IGLOO, ESKIMO IV
78

R-7556-1- 4 82
SECTION 5
DYNAMIC RESPONSE OF HEADWALLS IN ESKIMO TESTS
5.1 INTRODUCTION
This section describes the results of dynamic analyses of fourdifferent headwalls in t ne ESKIOO tests. T e he eadwalls considered arethe south (and west) headwall In the ESKIMO I test, the east and northeast
headwalls in the ESKIMO II test, and the northeast headwall in the ESKIMO IV
K test. The analyses were performed subjecting the finite element model of the
headwall and door systems to blast loads. The finite element models are
discussed in Section 3 and the pressure loadings applicable to each model
are given in Section 2. The dynamic response of the models was obtained
with the modified INSLAB code (Ref. 3), a nonlinear, dynamic finite element
program. The results of these analyses are compared with the available test
resilts from the ESKIMO tests.
Because Section 5 requires some 70 figures to present the anelysisresults, they have been grouped at the end of the section text. Figure 5-1
et seq. begins on page 106.
5.2 RESPONSE OF SOUTH HEADWALL, ESKIMO I
The results of the ESKIMO I calculation using the refined fiiite
element model of the south headwall (Fig. 3-2, Sec. 3) are presented in
this section. The finite element model of the headwall was subjected to
the pressure loadings shown in Figure 2-1 (Sec. 2). The results of the
calculation are also applicable to the west headwall, since the south and
west headwalls have identical geometries and were exposed to the same loading.
These results are shown as time-history plots of the headwall motion and
contour plots of the displacement of the headwall. Coý,iparisons are made
between these results and the results of the prior calculation of Reference 2.
In addition, where experimental measurements are available, comparisons are
made between the calculation and the actual response of the south and west
igloos of ESKIMO I.
79

R-7556-1-4182
5.2.1 TIME-HISTORY DATA
Figures 5-1 through 5-9 show displacement, velocity, and accelera-
tion histories computed at several locations on the south and west headwalls
and doors of the ESKIMO I event. In addition, Figures 5-10 through 5-12 show
displacement histories at several other locations. Typically, these response
histories exhibit a steady climb to peak displacement, followed by a recovery
of displacement such that the magnitude of the final displacement is less
than half the magnitude of the peak displacement. Furthermore, the frequency
content of the displacement histories is extremely low compared to the input
pressure histories. The rise times of the displacement histiries are often
30 or 40 nisec, whereas the rise time of the input pressure history is I msec.
This is because the fundamental frequency of the headwall is very low
compared tc the predominant frequencies in the input loading.
The tendency for final displacements to be smaller than the peak
displacements is due primarily to the use of nonlinear spring elements In
modeling the soil backfill behind the headwall. A second factor is the use
of linear springu to model the concrete floor slab. In contrast, the
calculations of Refarenc3 2 used only damping elements to model both the
backfill and the founiation. This latter formulation resulted in final
displacements that were nearly equal to the peak d~splacements.
Figure 5-1 shows the motion of Node 1, wh;ch corresponds to the
top center of the headwalls of the south and west Igloos of ESKIMO I. The
peak positive displacementit Is 0.3 In., whereas the final displacement is
negative and Is equal' to 0.7 in. This indicates the presence of a gap about
fln this 'tpcrt the positive displacement of a headwall represents movementaway from the source, or into the igloo; and the negative displacementrepresents movement towards the source, or out of the igloo.
80
i: ~ ~

ji~~hJLR-7556-1-MI182.I-in. wide between the headwall and the compressed backfill after the shock.
Figure 5-13 (from Ref. 2), which shows the motion of the corresponding point
of the prior calculation, predicts no such gap. However, gaps between the
headwall and the soil have been observed during posttest inspection of tie
acceptor magazines. This indicates that the present method of modeling the
soil is a step in the right direction. The displacement histories of other
nodes on the backfill portions of the headwalls are shown in Figure 5-10.
Figure 5-2 shows the response history of Node 19, located on thetop of the arch line of the south and west headwalls. The response of the
corresponding point of the prior calculation is shown i.i Figure 5-14 (from
Ref. 2). The displacement histories begin in very similar fashion, reaching
displacements of several inches after 40 msec. At that time the present Y A
calculation begins to recover displacement, whereas the prior calculation
continues to show increased displacement. A gap of about 2.75 in. develops
in the current calculation. A large difference in final position of the
headwall Is shown in the two calculations. The current calculation shows
a final displacement of about 0.3 in., whereas the prior calculation shows
a 6-in. final dLkplacement. A similar situation exists with Figure 5-1. :
Figure 5-li shows the displacement histories of several other locations,
alor~g the arch line.
Figures 5-5 and 5-8 show the responses of points located within
the arch line on the south and west headwalls. While less strongly influenced
by the soil backfill than points located on or outside the arch line, these
points also show considerable recovery from peek displacement, However,
the ratios of final displacement to peak displacement are greater in these
cases than in those more directly dependenZ -in soil behavior. Figure 5-15
(from Ref. 2) shows the response for the prior calculation of the po t -
corresponding to that of Figure 5-8. The displzcement histories bet.. a1
the two c~ases disagrie in the ratio of final d!splacement to peak displace-
ment, and in the magnitude of the pePk displacement. The two cases are in
good agreement on the peak velocity and the peak acceleration, although the
A durations are dlifferenc.
81
. ...
- .- ,-f-.-,¶r'~-.~ TIC'Y
A k R-7 556-1-4182
Figures 5-3, 5-4, and 5-7 show the responses .)f points on the
boundary between the headwall and the steel door. In the present calculation,
the door Is connected to the headwall only along its top and side edges. It
is free along Its bottom and center edges. As a result, the door exerts aAIi great deal of influence on the headwall along the contact boundary. Sincethe connection along this boundary is accomplished by hinges, all of thisinfluence is transmitted to the headwall in the form of shear force. The
resultIng displacements are considerably larger, therefore, than displace-
ments of the headviall not along the boundary. For example, the displacement
of Node 49 (Fig. 5-4) exceeds that of the adjacent point, Node 50 (Fig. 5-5).Similarly, the displacement of Node 76 (Fig. 5-7) exceeds that of Node 77(Fig. 5-8). Figures 5-16, 5-17, and 5-18 (from Ref. 2) show points of the
prior calculation that correspond, respectively, to Figures 5-3, 5-4, and5-7 of the current calculation. In the previous calculation, the door was
modeled as having shear support along the bottom boundary as well as along
the top and side. As a result, the door played a slightly less important
*role In the displacements of the prior r~alculat ion. The peak displacements
of the present calculation are comparable to those of the prior calculation;
and, in the case of Niode 46 (F*-g- 5-3), the peak displacement greatly
exceeds that of the corresponding point in the prior calculation. However,
Experimental data from the south iiloo, for a location corresponding
to Node 46, is availaile. A comparison between the measured data and the
computed response is given in Table 5-1. Although the average acceleration
is in good agreement, the duration and the velocities are not. The trend of
the comparison sug~ests that, locally, the door may have broken free of its
support during loading. Had this been able to occur in the finite element
model, the unloading of Node 46 would have been initiated much earlier,
resulting in lower velocities. This would have been accomplished without
significantly altering the iverage acceleration. It would be desirable in
future calculations to possess the capability of modeling breakable hinges.
82

R-7556- 1-4182
TABLE 5-1. MOTION OF SOUTH HEADWALL (ESKIMO 1)
ABOVE CENTER OF DOOR
Measured Value Present CaIc. Prior Calc.Item for South Igloo (Node 46) (Node 33)
Maximum Velocity, fps 27.9 44.2 20
Average Velocity frominitial Motion to PeakDisplacement, fps 13.3 29.0 11.7
Tim. Interval fromInitial Motion CoPeak Velocity, msec 14.4 25.6 11.2
Average Acceleration *from Initial Motionto Peak Velocity, g 60 53.6 64.8
In addition to the gage data for the south headwall above thi center
of the door, experimental data exist also in the form of motion picture film.
From these films it was possible to estimate, although not with great -
precision, the velocity of the upper corners of the doorways of the south
and west igloos. Although it was also possible to measure displacements,
flying debris in the igloos obscured the view of the door prior to maximum
displacement. The peak velocities of the corner points are presented in
Table 5-2.
TABLE 5-2. PEAK VELOCITIES OF UPPER CORNER OF DOOR
Source Peak Velocity, fps
South Igloo (Measured) 33
West Igloo (Measured) 19
Current Calculation (Node 49) 19.2
tPrior Calculation (Node 31) 16.6
83

A k R-7556-i -4182
Figures 5-6 and 5-9 shov, che motion of points on the interior of
the steel door. The displacements are very large. However, the displacement
values shown in the figures are probably typical of the order of magnitude
of the actual door displacements. Figure 5-19 (from Ref. 2) shows the motion
of the point in the prior calculation corresponding to that of Figure 5-6.
Actual measu.rements from the motion picture film of the west igloo are
available, although visibilit~y was obscured prior to maximum displacement.
The maximum deflections of the center of the door, as determined by the
three independent means, are listed in Table 5-3.
TABLE 5-3. PEAK DEFLECTION OF CENTER OF DOORWAY
Sourc~e .Displacement, in.
West lglo (Measured) 30*
Present Calculation (Node 73) 20.6
Prior Calculation (Node 49) 10.1.
*The motion picture record terminated prior to maximumdisplacement. The value shown is the largest observedIdisplacement prior to termination of the record.
Figure 5-12 shows the displacement histories of several points at
ground level on the headwall. Figure 5-20 (fromt Ref. 2) is comparable to
Figure 5-12a. From this comparison it is evident that there is a great
difference between the two calculations in modeling the foundation. The
foundation of the present calculation is much more rigid than the founda-
tion of the prior calculation. Accelerometers located on the floors of both
the south and the west igloos provide experimental base motion data. The
results are presented in Table 5-4.
84

ilk R-7556-1-4182
TABLE 5-4. PEAK ACCELERATION OF BASE OF HEADWALL
Source Peak Acceleration, gSouth Igloo (Measured) 6.3
West Igloo (Measured) 5.5Present Calculation (Node 104) 19.8t Present Calculation (Node 108) 12.9
Prior Calculation (Node 52) 66.2
5.2.2 STATIC HEADWALL MEASUREMENT
The static headwall measurements involved setting up survey monuments
3 ft in front of the igloo headwalls. The distances from the monuments to
the headwal!s were measured at selected points before the test. These dis-
tances were again measured after the test. The net changes in position
represented the permanent displacement of the headwalls. A gap of approxi-
mately 0.2 ft was found between the back of the south headwall and the earth
cover at the top left corner, and a similar space 0.1-ft wide was found atthe top right corner. Thl.. demonstrates that the static measurements are not
the maximum displacements but are the permanent movements of the headwall.
These permanent displacements of the headwalls are shown in Figures 5-21
and 5-22 (Ref. 1). All the measurements are subject to +0.05 ft of error
becausa pretest measurements showed that the walls deviated from a true
vertical plane by that amount. The measured displacement patterns indicate
that the headwalls appear to have responded in different ways. More pronounced
yielding on the steel arch was found in tnie south igloo. In the west igloo,
there was clear indication that the steel arch acted as a reaction line
resisting headwall movement. The difference in the observed data, therefore,
implies that material properties in the two igloos are not the same. As was
mentioned before, the fin'te element models used to predict the -esponses of
the south and west igloos are identical. The assumed material properties of
the model would therefore seem to represent characteristics that are a
compromise between the actual properties of the south iglco and those of
the west igloo.
85

R-7556-l-- 4182#4
Fig.re 5-23 shows a contour plot of the computed displacements at A
0.22 sec of the current ESKIMO I calculation. As can be seen from theresponse curves (Fis. '-I through 5-12), motion of the headwall has
essentially stopped by that time. This figure can be interpreted, therefore,
as a P;ot ef the computed permanent displacements. The deformed shape of
the hiadwall appears to be very similar to that of the west igloo, although
the ,magnitudes of the displacements differ considerably. It appears as ifthe west igloo experienced a rigid body displacement not experienced in the
calculation. The backfill and the foundation of the finite element modelwere too stiff to permit substantial deformation. If a rigid body displace-
ment of 0.15 ft is added to every point of Figure 5-23, the contour plot
of Figure 5-24 results. This plot is in much better agreement with Figure 5-22
than is Figure 5-23. The rigid body displacement does not change the stress
field in the headwall. The largest discrepancy between Figures 5-24 and 5-22
is the magnitude of the displacements above the door. The calculation shows
them to be substantially higher than the measured values. This may be due
to the inability of hinges to fail in the finite element model.
There seems to be no means of adjusting Figure 5-23 such that itcompares well with the deformat~ion of the south headwall, shown in Figulre 5-21.
It is surprising that the south and the west igloos, being of essentially the
,.ame construction and subject to similar load conditions, should exhibit such
dissimilar deformation. Figure 5-21 indicates that the most pronounced
feature of the deformation of the south headwall seems to be the folding
about a vertical axis. In the case of the west headwall, there seems to
have been a tendency toward folding about a horizontal axis. The difference
between the computed deformations of the finite element analysis and those
of the vest headwall appears to be smaller than the difference between the
deformations of the south and west headwalls. This implies that the stiffness
properties of the igloos, particularly of the soil backfill, are variable.
Furthermore, these variable properties exert considerable influence on the
deformaition of the headwalls.
86

ilk R-7556-1-4182
The final displacements of the current calculation are considerably
smaller than the peik displacements. It has already been noted that strong
evidence exists to indicate that the same is true of the actual head -lls.
For the sake of comparison with the final deformations, Figure 5-25 shows
the displacement contours of the headwall of the finite element model at
F 0.042 see, a time at which much of the headwall was in the vicinity of peak
iisplacement. The comparison indicates that the final displacement contours
do not provide an accurate measure of the severity of loading that occL.'red
during the blast. Time-dependent measurements are essential for determining
peak stresses during such an experiment.
"5.2.3 CONCLUSIONS
The finite element caTculation dis. -sed in this section is a
modification of a previous calculation of the response of the south and
west heaowalls of the ESKIMZ I event. The modifications included increasing
the number of elements, representing the soil backfill and the foundation by
different models, changing the boundary condition along the bottom edye of
the door, and increasing the flexibility of the concrete. Several differencesbetween the present calculation and the earlier calculation have been pointedout. The most notable difference is the tendency, in the present calculation,
for final displacements to be significantly smaller than peak displacements.The differences between the calculations appear to result primarily fromthe changes in the type of model (for example, using nonlinear springG for
the backfill) rather than from the increase in the number of elements. It
appears that the finite element grids are fine enouq.h, i.)d that further
improvements in correlation between calculation and experiment are to be
obtained thre-ugh improving the means of modeling the influence of the vf.rious
components.
87
I ... . .i ° . . • ' .. . ' : . .r : • - .. .•. .. . .. : - .., •• * • • ... .•... . . . .... . ..
-g W TF
ilk -R-7556-1-4182
Comparison of the calculated results with the experimental results
indicates that improved correlation might be obtainable by modeling breakable
hinges along the top and side boundaries of the door. This would limit the
influence of the door on the headwall, and perhaps lower the headwall dis-
placements adjacent to the doorway. In order to kncoi-porate such a hinge
element into future calculations, ;t will be necessary to know the ultimate
strength of the doo-/headwall connection.
A second area of modification of the finite element model is the
stiffness of the soil backfill and the foundation. The permanent displace-
ments of the headwalls indicate that these components should be modeled as
softer. As pointed out in Section 4, assignind values to the soil parameters
wms largely a matter of intuition, plus trial and error. Experimental
measurements establishing the nature of participation of the soil in the
response of the headwall are needed. This oarticipation is evidently quite
complex, thus rendering static laboratory tests of soil properties inadequate.
In fact, the only experimental means of determining che participation of the
hackfill seems to be the ESKIMO series itself. It must be noted that further
reduction of the stiffness of the backfill will result in the steel arch
applying a significant influence on the headwall. Thus future calculations
may have to include the effects of the arch.
The comparison of final di~placements of the south and west headwalls
indicated a variability in the stiffness of various components of the igloos.
This variability increases the confusion over the role of the backfill, the
ach, .. d the foundation in the headwall response. It suggests that there
may always be a significant degree of uncertainty conc..rning the parameters
used in modeling a headwall test.
88

R-7556-1-4182
5.3 RESPONSE OF EAST HEADWALL, ESKIMhO II
The finite element model for the east headwall of ESKIMO II is the
same as that used for the south headwall of ESKIMO I, since the two headwalls
are of identical construction. Ther,*fore, the model shown in Figure 3-2
(Sec. 3) was subjected to the pressure loading applicable to the ESKIMO II
test. The pressure loading histories are shoin in Figure 2-3 (Sec. 2). The
results from the dynamic response calculation are presented as time-history
plots of the headwall motion and contour plots of the displacement of the
headwall. Comparisons are made between the calculation and the available
experimental measurements on the east headwall in ESKIMO If.
5.3.1 RESPONSE TIME HISTORIES
Since the model used in this study is the same as the one used for
the south headwall of ESKIMO I except for the pressure loading, the responsetime histories are shown at the same nodes as in Section 5.2 in order tocompare the results due to different loading environments. These responses
are plotted in Figures 5-16 through 5-36.
The geoeral shapes of these tihne histories are similar to the
corresoonding ones for.the south headwall in ESKIMO I except that the
magnitudes of the present time histories are, in most cases, greater. It
is seen from Figure 5-26, for example, that the displacement of Node 1 risesinitially to a positive peak of 0.8 in., then reverses the motion to reach
a negative peak of 2.5 in. The positive peak is 25% greater than the corre-
sponding peak at the same node for the south headwall ,n ESKIM0 I, whereas
L the negative peak is 40% greater.
The motions at nodes located outside the steel .arch, where the
headwaul is supported by soil, are only slightly greater than those in
ESKIMO I. However, the peak pressure in ESKIMO Ii is roughly three times
greater :han that in ESKIMO I. Within the arch, the headwall motions in the
present case are much greater. For example, at Node 50 th- rsximum dis-
placement is about two and a half times greater than the corresponding value
89

SR-7556- 1-4182
in ESKIMO I; and at the center of the door (Node 73), the maximum displacement
is about three timus greater. This phenomenon may be due to the fact that the
headwall and the door within the arch are unsupported and yield sooner than
the region outside the arch. After yielding, additional loading causes
disproportionately large displacements.
Figure 5-33a shows that the maximum displacement of the center of
the door is about 86 in., which is greater than the width of the door (60 in.).
Since the INSLAB computer program is based on the theory of small displacements,
the above displacement value may be subjected to significant error. However,
the large displacements predicted by the program simply reinforce the fact that
the door would be bent out of shape under the loading experienced by the headwall.
As noted above, the response calculation of the east headwall showed
that the steel door would be blown open under the pressure loading assumed
for the ESKIMO II test. After the door is blown open, a redistribution of
the pressure on the headwall will take place, resulting in a net reduction
of the total load on the headwall. However, the calculation assumed that
the pressure was acting uniformly on the headwall and the door throughout
the calculation. Therefore, the calculation considered higher loading than
was the actual case and the computed headwall motions woilfd be significantly
different after the door is blown open. The computation for the response of
the east headwall, ESKIMO II, was terminated at about 165 msec; whereas for
the ESKIMO I calculation this ,,nt was at abnut 240 msec. Because of this,
the permanent displacements of the headwall are not clearly identified formost nodes in Figures 5-26 through 5-36. In any event, for the reason
mentioned above, the computed permanent displacements are expected to be
in significant error.
90
F Jl~j1 R-7556 -1 -4182
5.3.2 COMPARISON OF COMPUTED RESULTS WITH TEST DATA
In the ESKIMO 11 test, linear motion transducers were positioned
above the center of the doorways of the five igloos. For the east igloo,
this location corresponds to Node 46 of the finite element model (Fig. 3-2).
A comparison between the test data and the computed motions for this loca-
tion is shown in Table 5-5. The computed duration and velocities are much
higher than the measured values. However, as in the case of the south igloo
Fin ESKIMO 1, the average acceleration is in good agreement. As suggested in
Reference 4, the measured data at this location are very sensitive to thetype of doorstop devices used for In~hibiting the movement of the door top,
relative to the headwall. Also, as discussed before, the computed motions
may be greater because the separation of the door from the headwall was not
considered in the analysis.
Two accelerometers, one on each door leaf, were mounted on the
east igloo (ESKIMO 11). However, these gages failed to perform properly
and therefore no useful data were obtained, as observed in Reference 4.
The static measurements intended to record the permanent headwall
deformations were perforried as described in Reference 4. Figure 5-37 shows
these deformations on one half of the headwall and door system for the east
igloo, ESKIMO 11.
Since the measurements are made on the whole headwall but only
one half of the headwall is used in the finite element model, there are two
measured values for each node of the model except those at the centerline
of the headwall. The contours in Figure 5-37 are based on the average of
the two measured values where applicable. All the values are in hundredths
of a foot, and the positive value indicates deformation into the igloo.
91

R-7556-I -4182
TABLE 5-5. MOTION OF EAST HEADWALL (ESKIMO II)ABOVE CENTER OF DOORWAY
ComputedMeasured Value
Item Value (Node 46)
Maximum velocity,ft/sec 33.3 102
Average velocityfrom initial motionto peak, ft/sec' 31.5 72
Time from initiationof motion to maximum
velocity, msec 6.75 20
Average accelerationfrom initial motion tomaximum velocity, g 153 155
92
............. ,

R-7556-1 -4182
As was discussed in Section 5.3, the east headwall, ESKIMO II, hadnot reached steady state at the end of the calculation. Therefore, it isdifficult to compare quantitatively the calculated results with measuredresults. However, all the nodes indicate that the accelerations and velocities
become siwl1 near the end of the computation. The displacement contours at
two instants of time late in the calculat!,n (t - 145 msec and t - 157.5 msec)
are shown in Figures 5-30 and 5-39. In both figures the maximum displacementsare at the top center of the door, with an order of magnitude of 1.3 ft.
Although this is much higher than the measured value, the general deformedpatterns are quite similar to the measurements (Fig. 5-37). In addition,
the contours in Figure 5-37 do not extend to the doorway, because the doorwas blown off during the test. The computed displacement contours, however,extend routinely Into the doorway.
5.4 RESPONSE OF NORTHEAST HEADWALL, ESKIMO II
This section presents the results from the dynamic analysis of
the northeast headwal! In ESKIMO I. The results from the dynamic responseS calculation are preserted as time-history piots of the headwall motion and
contour plots of the displacement of the headwall. Also presented arecomparisons of experimental data with the results from the calculation. The
finite element model of the headwall is shown in Figure 3-16 (Sec. 3). Thismodel Is subjected to the blast pressure loadings shown in Figure 2-3(Sec. 2). These same loadings are applicable to the east headwall, since 4the two headwalls were at the same distance from the source. j
5.4.1 RESPONSE TIME HISTORIES
Figures 5-40 through 5-55 show d;splacement, velocity, and accelera-
tion time histories computed at several nodes in the finite element modelof the northeast headwall and door system of ESKIMO 1! As in the case ofthe south headwall, ESKIMO I, the displacement histories for this caseexhibit lower frequencies compared to the input loading. The rise times of
93

R-7556-1 -4182
the displacement h1stories are longer than 20 msec, whereas the rise time of ýthe input pressure history is I msec. As observed in Section 5.2.1, this
phenonenon is attributed to the low fundamental frequency of the headwall andI, door sys zem.
Table 5-6 2hows tne computed maximum and permanent displacements at
several nodes. It is clear from this table that the maximum displacements of
the nodes inside the arch line are much greater than the corresponding values
of the nodes outside the archline. However, no such correlation exists for
the permanent displacements. The observation implies that the soil behindthe headwall is very effective in resisting the dynamic forces on the wall,
but does not greatly influence the residual displacements of the wall.
Although the cast headwall is subjected to the same loading as the
northeast headwall, the geometries of these two headwalls are different.
Therefore, the relative responses of the headwalls will be compared in order
to get an irsight into their relative strengths and their performances in
the test. Because of the differences in the finite element models of the
headwalls, a node in one model may not correspond exactly to a node in the
other. Each comparison is therefore made between two nodes located in the
samte general area. .
For the northeast headwall, Node 9 Is located at the crown of the
sponding node for the east headwall, Node 19, has the maximum displacement
of 8.2 in. Similar comparison Is seen in Table 5-7 for other locations on
or inside the arch. Although the area of the northeast headwall supported
by the backfill soil is much smaller than that of the east headwall, the
additional stiffness due to the presence of the concrete beams around the
doorway of the northeast headwall appears to have reduced the maximum
displacements of the headwall significantly.
94 I;

4 di~ALR-7556-i -4182
TABLE 5-6. COMPUTED MAXIMUM AND PERMANENT DISPLACEMFrNTOF NORTHEAST HEADWALL, ESKIMO 11
Maximum PermanentDisplacement, Displacement, Location
Node No. in. in. _ _ _ _
9 4.7 0.3 On the arch line
16 1.9 -0.4 Outside th* arch
22 4.1 0.2 On the arch lime
39 7.3 1.5 Inside tne arch,I on door frame42 6.0 1.1 Inside the arch,
on door frame45 2.6 0.7 On the arch line:I6o 1.4 0.8 Outside the arch72 17.0 7.5 Inside the arch,
on center of door
75 4,7 1.3 Inside the arch,on door frame
7'4.o 1.1 Inside the arch
79 2.8 1.1 On the arch line81 1.3 0'8 Outside the &arch
101 0.9 0.3 On the arch line105 16.5 8.0 Inside the arch,
on door frame108 0.4 0.1 Inside the arch,
on door frame
150.1 0.0 Outside the arch
95

(~. II~hR-7556-1 -4182
TABLE 5-7. COMPARISON OF COMPUTED MAXIMUMDISPLACEMENTS FOR ESKIMO 11
East Headwall Northeast Headwall
Mtaximum Maximum
Noe Displacement, Noe Displacement, GnrlLctoNoein. Noein. Gnr)Lcto
19 8.2 9 4.7 Crown of the arch]
46 45.0 9 . Top center of door
49 20.0 42 6.0 Top corner of door
73 86.o 72 17.0 Center of door
76 21.0 75 . 4.7 Center edge of door77 15.0 .77 4.0 Insi~de arch, alongI
horiz~ontal centerl ine
of door
103 0.3 108 0.4 jBottom corner of door
96

R-7556-1 -4182
Perhaps the most obvious difference between the two headwall
responses is seen in the steel door area. The maximum displacements in
the door area for the northeast headwall are much smaller than those for
the east headwall (Table 5-7). At the center of the door, for example, the
maximum displacement for the northeast igloo is 17 in. as against 86 in.for the east headwall. As described in Section 1, the door system for the
northeast igloo is of the biparting and sliding type, whereas the door
system for the east igloo is of the double leaf and hinged type. The results
of the calculations, therefore, suggest that the biparting and sliding type
is superior to the double leaf and hinged type for resisting the blast loads.
r 5.4.2 COMPARISON OF COMPUTED RESULTS WITH TEST DATA
As explained in Section 5.3.2, linear motion transducers were
rplaced above the center of the doorways of all the igloos in the ESKIMO 11
test. For the northeast igloo this position corresponds to Node 39 of the
finite element model (Fig. 3-16, Sec. 3). A comparison betw~een the test
data and the computed motions for this location is shown in Table 5-3.Among the four items compared, the times from initiation of motion to maximum4
velocity are in good agreement between the computed and measured values. The
remaining items show that the computed values are abouc two times greater.( As mentioned before, the motion of this point is very sensitive to the type
of door-stop device used for inhibiting the movement of the door relative
to the headwall. Also, the computed motions may be greater because the
separation of the door from the headwall was not considered in the analysis.
Two accelerometers were mounted, one on each door leaf. The gage
on the left door leaf failed to perform, while the gage on the right door
leaf recorded a peak acceleration value of 1200g. The computed value at
the corresponding location (Node 72) is seen from Figure 5-47 to be 1300g.r
97

R-7556-1-4182
TABLE 5-8. MOTION OF NORTHEAST HEADWALL, ESKIMO 11,ABOVE CENTER OF DOORWAY
ComputedMeasured Value
Item Value (Node 39)
Maximum veiocity,ft/sec 14.3 32
Average velocityfrom initial motiontc peak, ft/sec 10.4 21
Time from initiationof motion to maximum
I
velocity, msec 17 19
Average accelerationfrom initial motion tomaximum velocity, g 26 52
98

~-77
A k R-75156-1 -4182
The permanent deformations of the northeast headwall are given in
Reference 4, and are shown plotted in Figure 5-56. The contours in the
figure are based on the average of the twc1 measurements at symmiietrical
Ipoints on the headwall. Figure 5-57 shows the computed displacementcontours of the headwall at 109 msec. Since the motions become essentially
- steady state at this time, the displacements of the headwall at this instant
are equal to the permanent displacements of the headwall.
Figures 5-56 and 5-57 show that the maximum deformations occur
around the doorway. The contours seem to follow the patterns of the steel
arch and the floor slab. In general, the measured values are slightly
higher than the computed values. In both figures, the movements tend to be
S smaller toward the top and the bottom of the headwall. At the top of the
I shoaw all, the computeddisplacementns are negative, whereas the measurements
sho smll osiivevales. Ingeneral, tewingwall experiences smaller
t displacements. At the far end of the wingwall, some displacements are4
negaive Ths my b du tothefact that the headwall is supported by
the soil outside the arch and is subject to rotation about the support.
S 5.5 RESPONSE OF NORTHEAST HEADWALL, ESKIMO IV
The response calculation of the northeast headwall, ESKIMO IV, was
S to have been performed before the test was conducted on 10 September 1975,
E so that the analytical results could be used to predict the behavior of the
S headwall and door system in the test. Because of tight schedules, the above
calculation could not be completed before the test; but the calculation was
S performed before any results from the test were available. This assured
that the calculation was performed independently of the test and was not
subject to any bias that could have resulted from reviewing the test results
before performing the calculation.
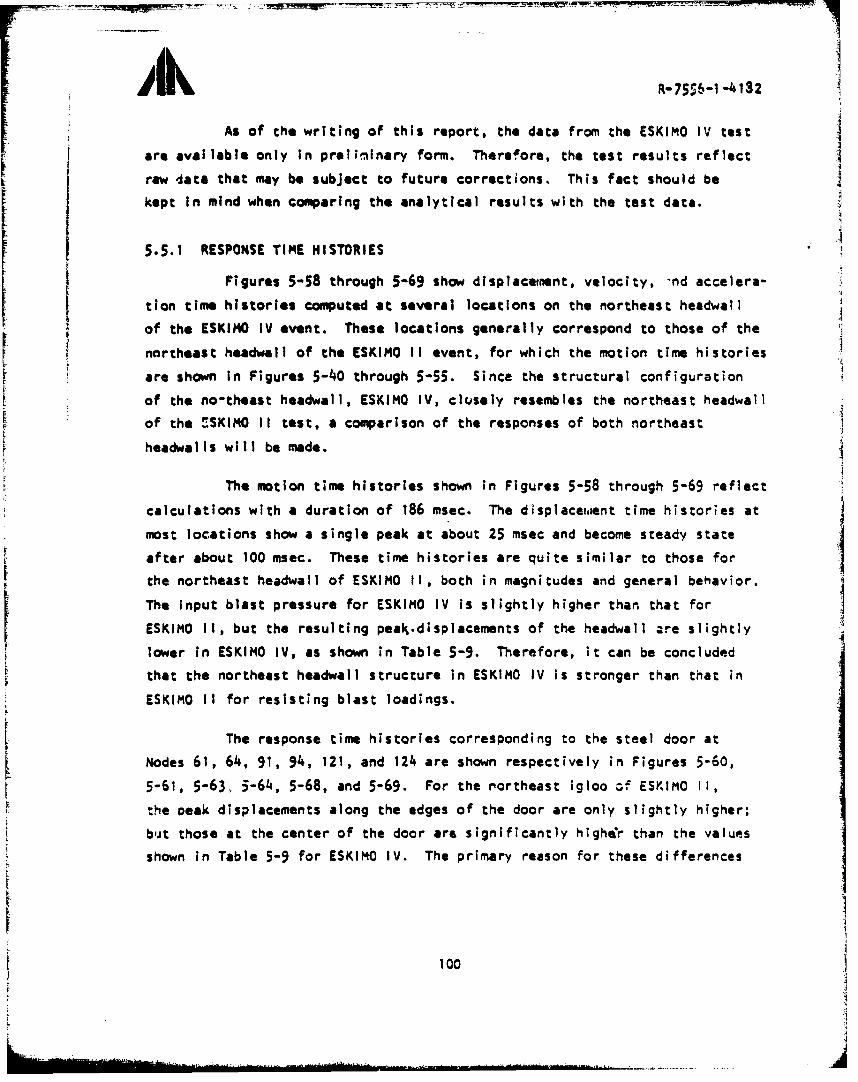
R-75.56-1 -4132
As of the writing of this report, the data fromt the ESKIMO IV test
are available only in prelininary form. Therefore, the test results reflect
raw data that may be subject to future corrections. This fact should be
j kept in mind when comparing the analytical results with the test data.
5.5.1 RESPONSE TIME HISTORIES
Figures 5-58 through 5-69 show displacemnent. velocity, -nd accelera-
tion time histories computed at several locations on the northeast headwall
norheat hadwll f te EKIM 11event, for which the motion time historiesare shown in Figures 5-40 through 5-55. Since the structural configurationof the no-theast headwall, ESKIMO IV, clusely resembles the northeast headwallof the SSKlMO 11 test, a comparison of the responses of both northeast
Themoton imehistories shown in Figures 5-58 through 5-69 reflect
calulaion wih adurtio of186 msec. The displacem~ent time histories at
most locations show a single peak at about 25 msec and become steady state
after about 100 miec. These time histories are quite similar to those for
The input blast pressure for ESKIMO IV is slightly higher than that for
ESKIMO 11, but the resulting peak-displacements of the headwall are slightly
lower in ESKIMO IV, as shown in Table 5-9. Therefore, it can be concluded
that the northeast headwall structure in ESKIMO IV is stronger than that in
ESKIMO 11 for resisting blast loadings.
The response time histories corresponding to the steel door at
Nodes 61, 64, 91, 94, 121, and 124 are shown respectively in Figures 5-060,
5-61, 5-63,, 5-64, 5-68, and 5-69. For the r'ortheast igloo -ý ESKIMO 11,
the ocak displacements along the edges of the door are only slightly higher;
but those at the center of the door are significantly higher than the values
shown in Table 5-9 for ESKIMO IV. The primary reason for these differences
100

R-7556-i -4182
TABLE 5-9. COMPARISON OF tIAXIMUM DISPLACEMENTS OF NORTHEASTHEADWALLS OF ESKIMO II AND ESKIMO IV IGLOOS
ESKIMO II ESKIMO IV
- Maximum MaximumDisplacement, Displacement,
Node in. Mode in. General Location
9 4.7 21 3.1 Crown of the arch
22 4.1 24 3.6 On the arch line nearthe crown
39 7.3 61 6.0 Top center of the door
42 6.0 64 5.4 Top corner of the door
45 2.7 69 2.7 On the arch line, at thelevel of the door top
72 17.0 91 5.2 Center of the door
75 4.7 94 3.7 Right center edge of thedoor
• 77 4.0 97 3.3 Inside thc arch, at the
level of the door center
79 2.8 93 2.6 On the arch line, at thelevel of the door center
105 16.5 121 5.- Bottom center of the door
108 0.4 124 0.3 Bottom corner of the door
101

_____ ____ _____ - - - ~ . -. ........ '
R-7556-1 -4182
is the c*oor configurations. In ESKIMO IV, the door is of a single-leaf
sliding type, wheruas the door in ESKIMO II is of a biparting sliding type.
The sirngle-leaf type has a much greater stiffness to resist deflection at thecancer of the door than dos the double-leaf type. Therefore, other things
being equal, the double-leaf door experiences higher deflectior than the
single-leaf one.
5.5.2 COMPARISON OF COMPUTED RESULTS WITH TEST DATA
As In the case of the other Eskimo tests, posttsst measurem~ents
were made on the headwalls of the ESKIMO IV test (Ref. 6), in order to
obtain permanent displacements of the headwalls. Figure 5-70 shows the
permanent displacement contour lines of the northeast headwall based on the
average of -wo measured values due to the symmetry of the headwall at the
vertical centerline. The computed displacement contours at time t a 158 msec
are shown in Figure 5-71. As noted before, the computed displacements becomne
steady state after about 100 msec and therefore the displacements of the
headwall at 158 msec represent the permanent disp!acements. A comparison
of the computed and measured contours shows that the computed displacementsgenerally are smaller than those measured. However, the differences are notgreat and are not significant because the magnitudes of the pern-anent displace-
ments are small. The contours do not indicate any strong influence of the
arch on the headwall responte.
Figures 4-3 and 4-4 (Sec. 4) show the locations of the accelero-
meters and the linear motion transducers mounted on the northeast headwall
and door for ESKIMO IV. The measwred acceleration and displacement thie
historits for the northeast headwall are shown respectively in Figures 5-72and 5-73. These records are reproduced from the preliminary report (Ref. 6)
on the ESKIMO IV test. As such, these records have not been corrected for
drifts and other random errors. This fact should be kept in mind in the
following aiscussion involving the ineasured time histories.
102
!*
• - --

E R-7556-1 -4182
The me.asured displacement time histories at several locations on
the headwall aný door are shown in Figure 5-73. The displacements shown are
in inch units and Pre plotted as functions of tlme expressed in mse¢ units.
Next to each time history the node in the finite element mesh of the headwall
(Fig. 3-18, Sec. 3) to which the time history corresponds, is ,shown. Of the
eight measured displacement time histories, direct comparison with the
calculated histories is possible at only four locations. These are at Nodes 21,
64, 94, and 97 and the corresponding time histories are shown respectively in
Figures 5-58, 5-61, 5-64, and 5-65. A comparison of the calculated andS measured d~splacement at the four locations shows that shapes of the pulses
S are in good agreement. Table 5-10 shows a comparison of the maximum displace-
ments and permanent displacements. The agreement between the computed and
measured permanent displacements is very good. The computed maximum dis-
placements are somewhat higher than those measured. Nevertheless, the
differences between the computed and measured values are small in comparison
with those found for the headwalls in the ESKIMO I and II tests.
The measured acceleration time histories at several locations on
the headwall and door are shown in Figure 5-72. The accelerations are given
in the units of g (gravity constv.it) and the time is expressed in msec units.
Next to each record the corresponding node in the finite elemeýit mesh
(Fig. 3-18, Sec. 3) is shown. Out of a total of eleven records, the computed
pulses are available only at seven locations. These are at Nodes 21, 61, 64,
91, 94, 97, and 99 and the corresponding acceleration pulses are given
respectively ir Figures 5-S8. 5-60, 5-61, and 5-63 through 5-66. The
measured pulses are shown up to a maximum of 50 msec, while the duration
of the computed time histories is 186 msec. The general shapes of the
computed pulses are different from those measured. The measured records
show small motions after about 25 msec. In contrast, the computed accelera-
tion records show strong motions even after 150 msec. This is attributed
to the fact that in the actual test, cracking and crushing of concrete
dissipates large amounts of energy. Although the INSLA8 code accounts for
103

, k R-7556-1 -4182
TABLE 5-10. COMPARISON OF MAXIMUM ANO PERMANENT DISPLACEMENTSOF NORTHEAST IGLOO, ESKIMO IV
Max'imum Permanent
Displacements, Displacements,Locv,1 i on in. in.
Nods Gage 1.0. Measured Computed Measured Computed
94 L-1-B 3.0 3.7 0.8 0.9
97 L-2-B 3.2 3.3 i.0 1.0
64 L-5-B 3.6 5.3 1.0 0.8
21 L-9-B 1.9 3.1 0.3
*The transducer seemed to have failed after recording about 50 msec
of mot.ion.
104
R-7556-1 -4182
the energy dissipation tnrtugh the yielding of concrete, it is not intended
to consider the crushing of concrete. Therefore, th6 energy dissipation
model in the calculation may underestimate the acttual energy loss. A
comparison of the crwmputed and measured maximum accelerations at various
locations on the headwall and door is shown In Table 5-11. The agreement
between the measured and computed values is good and the differences *e
small in comparison with similar differences in the ESKIMO I and II tes1-.
In ESKIMO IV, unlike In the previous ESKIMO tests, the headwalls
were heavily Instrumented to measure pressure, accelerat!on, and displacement
time histories on the headwall and door systems. As described in Section 4,
the northeast headwall was instrumented with seven pressure gages, twelve
accelerometers, end nine linear motion transducers. This provided for theS first time an ,.9portunity to compare the computed and measured time histories
of accelerationis and displacements at several locations on the headwall.
The information contairied in the measured records can be used to adjust the
parameters of scil models in any future calculations to improve the
analytical prediction capabilities.
105

7W .k -_ .
R-7556-1 -4182
TABLE 5-11. COMPARISON OF MAXIMUM ACCELERATION OFNORTHEAST IGLOO, ESKIMO IV
Location Maximum Accelerations, g
Node Gage I.D. Computed Meas,'red
21 A-IO-B 258 225
61 A-6-B 280 208
64 A-7-B 196 238
91 A-1-B 1550 1250*
94 A-2-B 236 395
97 A-3-B 272 151
99 A-5-B 264 241
*Estimated value, since the gage exceedel the rating limit
106

ýF v
R- 7556 -1-4182 ~
_____________(a) Displacement
3~
US (b) Velocity
Iis
0.g0 0.04 0.03 0.12 0.1 0.20 0.04 0.11 0 J2
.10

R-7556-1-4182
(a) Displacement
I4
U' :(b) Velocity
-
fo. . 0 7 080 C.12 0.6 0.40 0. -20.6 0
T! (c) Acceleration
W64AAAA
-'V
?to . .C
FIGURE 5-2. COMPUTED MOTION OF SOUTH AND WEST IGLOOS AT NODE 19(Refined ESKIMO-I calculation)
108
SiI j

R-7556-1 -4182
(a) Displacement-
I.!
I 6
.0.(b) Velocity
(c) Acceleration
!' ~~~ -V v , V v -
11-"
a. c 00 3.01 •.•t U 0.0 3•Z4 J. 2 3 12L; [,,. 'rT,. U411
FIGURE 5-3. COMPUTED MOTION OF SOUTH AND WEST IGLOOS AT NODE 46(Refined ESKIMO-I calculation)
l0g

A k R-7556-1 -4182
L (a) Displacement
,. 0 0 .0 4 a. 0 6 0 .1 t 0 . 1 6 0, 1 0 0 4 Z 4 1 0 i .s l o .- 3tM. tic
U
II-
(b) Velocity
4• i
iii
-.00 0.04 O .t 0.10 0.•14 0 ".0 0.24 2- .O l 0.30
'111 ....A Ilt••' (c) Acceleration
01 ' 0 0 .0 4 0 .3 6 0 .4 l 0 .! S 0 .2 0 0 .0 6 2 . • 1 0 .0 0FIGURE 5-4. COMPUTED MOTION OF SOUTH AND WEST IGLOOS AT NODE 49(Refined ESKIMO-I calculation)110

R-7556-1 -4182 I
If
;1 *131
(a) Displacement
I!!
I.o. 6.04 .0. 0.12 .0.4 0 a .a 4 0 0 J2
"F I
I (b) Velocityio
Tt.g sic-
ii
V. I
(Reine "-(c) Acceleration
L Ii1k .A_____I , ¢
ji30a O 3i.4 0~ll 46 l 0 l. tl 3 .?6 l 0 2 .44 31 46l 3 1
?ll, Mc
FIGURE 5-5. COMPUTED MOTION OF SOUTH AND WEST IGLOOS AT NODE 50I(Refined ESKIMO-I calculation)
ill

A k R-7556-1 -4182
z
(a) Displacement
.f 71 -5 01"e o 3f I!
aJ
( (c) Ac c i t .tion
?IN. sIc
! ,
(RfndEKM- (c)lAccatiotn)
i.
I:
I! t
'.G 0.0l~4 0.06 0.0• O.dIe lO O'.aa az . l az, ,
?Ilq. SIC
(Re(ne) SKIM-Ilercuttion
11
Ij

R-7556-1 -4182
U (a) Displacement
'i' -S 4 - -t 01 - 8 .1 93I!.
W.0 04 0.66 6.19 0. 40 6 0.2 1 Is 0
fine. 66 A
- (b) Velocityio
0.0 0.04 0.0 V.:2 .16 0,20 0.7a4 a i. a.3vtq. 1J
",I
'1 (C) Acceleration
FIGURE 5-7. COMPUTED MOTION OF SOUTH AND WEST IGLOOS AT NODE 76(Refined ESKIMO-I calculation) j
113
I 4 A .... . . .."
!i .. I' IM1- A:-=iV . ... .

R-7556-1 -4182
'-'--' (a) Displacement
I!,I
1." se .0 eta if-to Ca s 0.31
(b) Velocity
Lf I.lif
(c) Acceleration
'I.06 C.o4 0.6 CS12 0.14 cf.4" 0.24 3." 4.32
FIGURE 5-8. COMPUTED MOTION OF SOUTH AND WEST IGLOOS AT NODE 77(Reftned ESKIMO-I calculation)
114
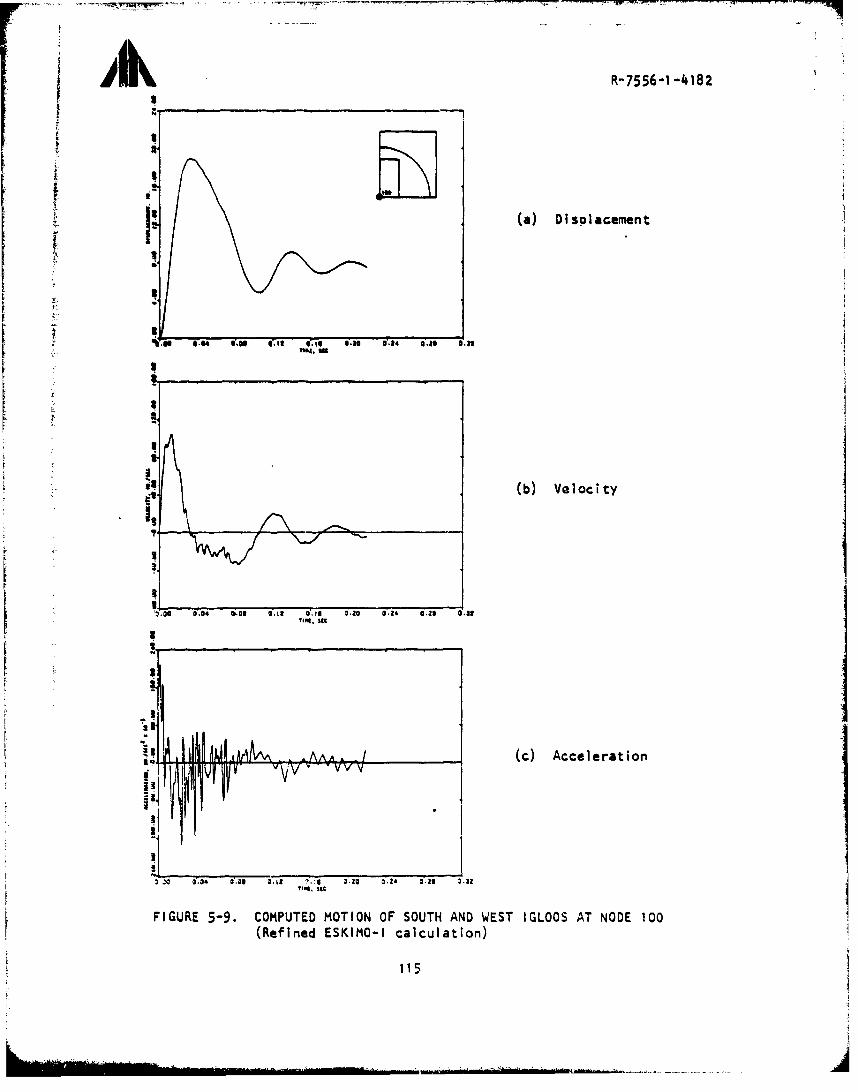
R-7556-1 -4182
•*• l• ~(a) Displacement "'
a ( A
115
I* UL!
U•.0 'O ,O .1 O.il Ol .Z .1 01
I L iP a iplcmn
U
lRefne ESIM -I acu ton
I _______
i3
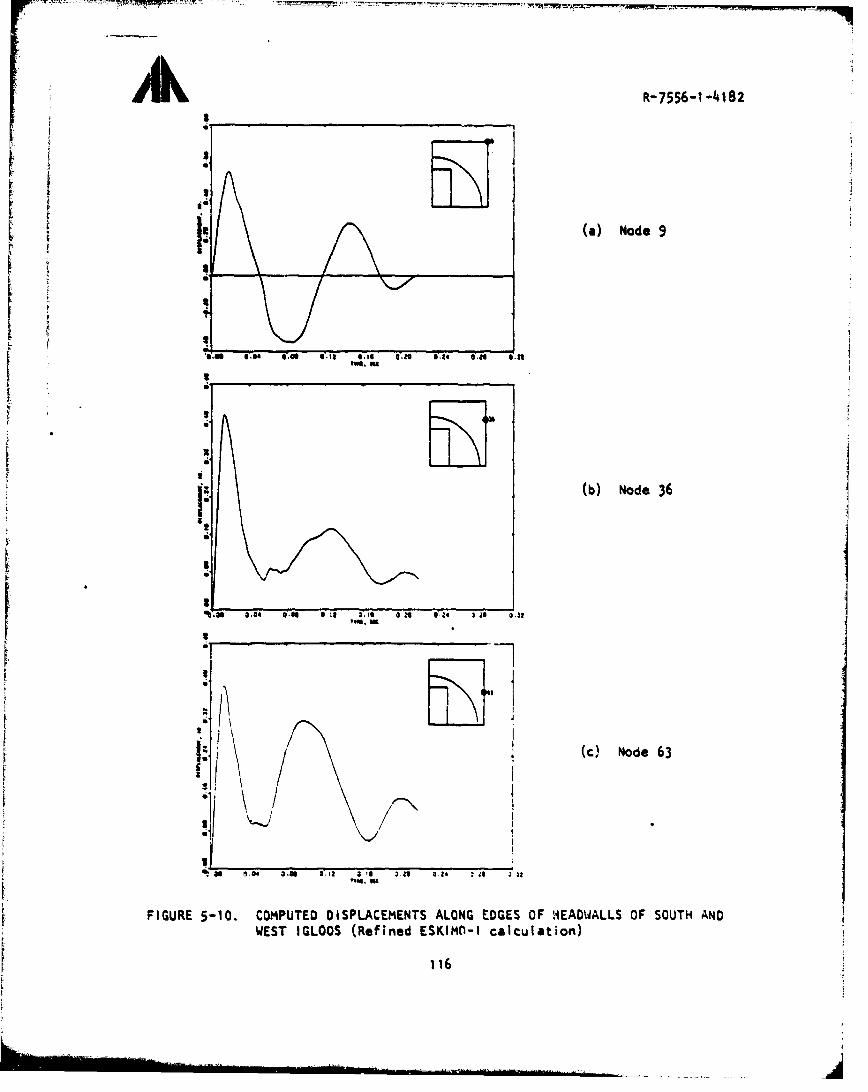
R-7556-1 -4182S
4ii
St
(a) Node 9
Si i
S/
'W4. v
4• 01(C Node 63
m0.
FIGURE 5-10. COMPUTED DISPLACEMENTS ALONG EDGES OF S'EADW/ALLS OF SOUTH ANDWEST IGLOOS (Refined ESKII\I calculation)
116
* LJWg1
(b) Nde 3
&

AkJ-R-7556-1-4182
1'(a) Node 21
U ___ __ __ __
ETB,.o . ., .... oo i I. , I
LUi
(b) Node 32
,Two.ISo
h; FIGURE 5-11. COMPUTED DISPLACEMENTS ALONG ARC" LINE OF HEADW/ALLS OF SOUTHA-ND WEST IGLOOS (Refined ESKIO-I calculation)
[ 117
r A -• ----.. .. . . . .. .. .

A R-7556-1 -4182
L,
/1 (b) Node 104
U
6. 0 04 .0 0 1 S E 6.14 3.23 0 3 4 4 3 a .t a i
I: * (c) Node 108
a
L *
sF1
00 2-24 als a , .2 6 3 .3 3.,36 ,j .9 3 it
FIGURE 5-12. COMPUTED DISPLACEMENT AT GROUND LEVEL OF SEVERAL LOCATIONSON SOUTH AND WEST IGLO3S (Refined ESKIMO-I calculation)
118

R-7556-1 -4182
3A
•,_- _ NI!
iI (a) Displacement
0.114 Cgs O.0 1 e 0.10 t 0.1 'k4 Q011
Ii(b) Velocity
a 4IXI
(c) Acceleration
0,O1 0'.01 0.04 @0, I .05 " .IO 1,1 0 lt 0.14 0.1t1
FIGURE 5-13. CJMPUTE-J MOTION FROM PRIOR CALCULATION CORRESPONDING TO NODE I
119

R-7556-1 -4182
I, (a) Displacement
0 il', 0 1 1 0 .a
!Y1111.,W
I _____(b) AVelcityo
"0-60 a,-. 0,04 !6 l ,1 it] 0.t V.1 1,14
410 las all #
120
23
I A A
0.0 0.10 010 f lo a.12 0.:4 9.141
i4~t- .c Aceliaco
FIGURE 5-14. COMPUTED MOTION FROM PRIOR CALCUJLATION CORRESPONDING TO NODE 19
120
I ,.. .. ..- '. ." '.i. ; •'L." -L. •.ii

ilk__ _ _ _ R- 7556- -14182
il! 1(a) Displacement -
010 0.2 a.1 Q1
I, / !
/ /
I' /
3/
S:I(b) Velocity
0, i. 11504 O. ON0 0 0.a 0Vi2 0,14 0.!
4;-L (c) AccelerationJ I•
S.00 0,41l 0",04 a-as Fas af. a O a 77,1 37Y *.to
i FIGURE 5-15. COMPUTED MOTION FROM PRIOR CALCULATION CORRESPONDING TO NODE 77
121

R-7556-1-418201
isiii (a) Displacement
(b ;2I cit111
"fne
' I/
+ I I
iI N 0.02 0.04. 0.06 0.02 0.20 0.t2 0.t4 0.16
I 5,b. V otIy
122
6O.00 6.02 0.04 " .0 0. 021 0. 26 0.lO 0 " .t 4 0.l 26.1?rai. UL
022

A k0-- 1R -7556-1-4182
I' I
iii I I (a) Displacement
-1IL
r ~ ~ ~ ~ ~ I /3 .9ao
-o-o0o aJ!a 0.04 C* iso* ~ t
FIUR 5-17. COPTDMTO RMPR ACLTO OREPNIGT OE4'123

ilk R-7556-1-L4182
(a) Displacement
0.at 0.04 0.06 a.0" 2.12 0.12 13.14 0'.16
1 '67
ii (b) Velocity
(c) Acceleration
FIGURE 5-18. COMPUTED MOTION FROM PRIOR CALCULATION CORRESPONDING TO NODE 76
124.

jlkR-7556-1-018241
4.
IL
. (a) Displacement
i.•o
20 • f= 2 2,,2Z 0 0 4 0 .0 3.0 6 0 .0 ,.50 0 . t4 0 .16
(b) Velocity
!iUI
t 1
m•Sl~l'i' i, /k J~v . ,•l'g /,.(c) Acceleration
*i ! .,9
0 .02 0.04 a-06s 3.0 0 2.10 '2 a !&4 70.
3 1t41. ic
FIGURE 5-19. COMPUTED MOTION FROM PRIOR CALCULATION COR•RESPONDING TO NODE 73
125
S2

ilk_ _ _ _ _ R-7556-1-41 82
• • /"
I1. (a) Displacement
-iig ti
I. (b) Velocity
tI
s. T fine[, S"•
"-" \41' (c) Acceleration
SV
'a-ccl I',0 0.04 a."I 3 N .1 0 2.:z 0.1 6 0-:6l;q
FIGURE 5-20. COMPUTED MOTION FROM PRIOR CALCULATION CORRESPONDING TO NODE 103
12
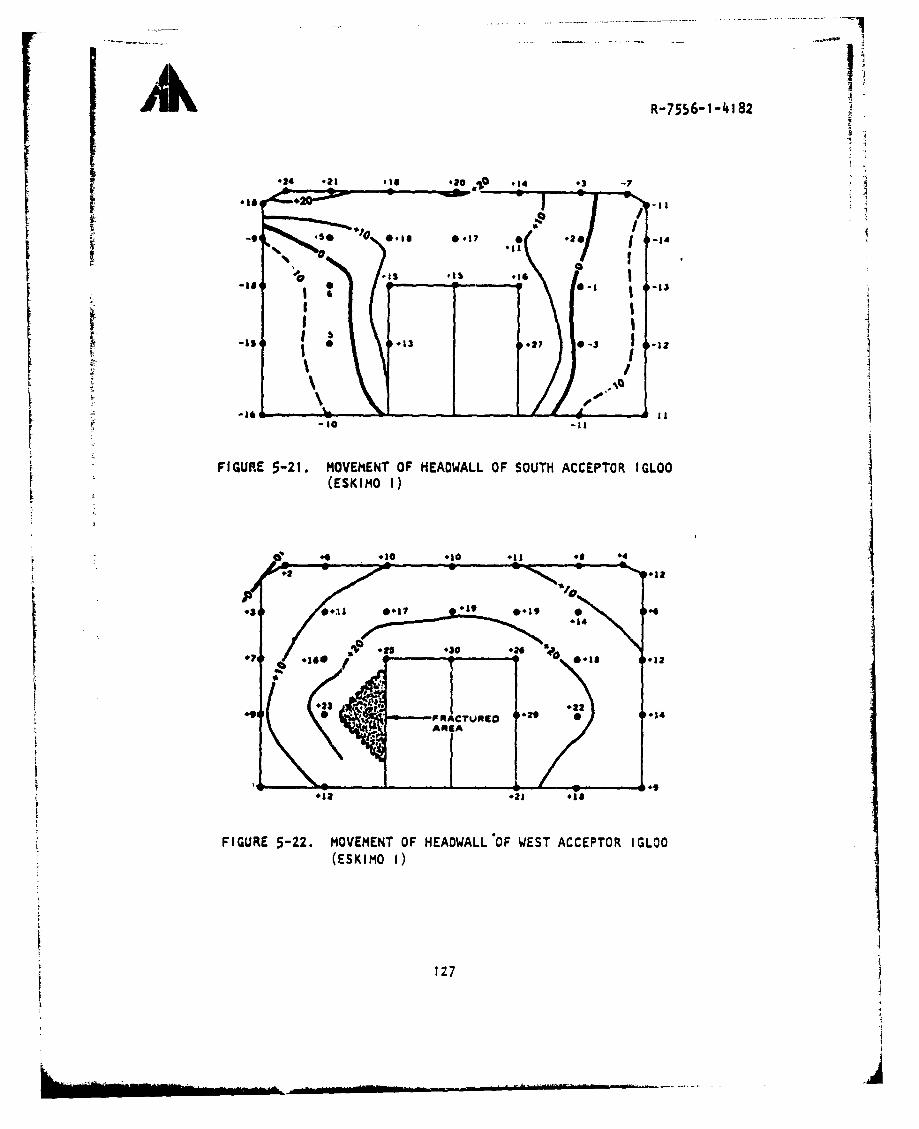
R-7556-1 -4182
024 *23 11 .0 14 .2 -p
Nof
, 110
010 oil .14
-181
03 - p -ost-01
92 #3 I#160 0#1#23 .? 03 I#to IRCU10 0
FIGURE 5-22. MOVEMENT OF HEADWALL OF WSOTH ACCEPTOR IGLOO(ESKIMO 1)
1274

101
AkR-7556- -41 82
-o5. -4.2 -22 0.8
7 -i
92.4 *.
-0.1 0-~ .
40.5 202, , , 0.8, A E RI
L I
____________0.1 0.-0.1 0.0
FIGURE 5-23. COMPUTED DISPLACEMENTS (IN HUNDREDTHS OF A FOOT) OF THE HEADWALLSOF THE SOUTH AND WEST IGLOOS, ESKIMO I, 0.22 SEC AFTER ARRIVAL
OF THE BLAST WAVE
128

9.'.28 5010 ~10.8 1.
17415413.9 15.4
II0 N 19 .015.81
-1\ 16.04
FIGURE 5-24. COMPUTED DISPLACEMENTS (IN HUNDREDTHS OF A FOOT) WITH A RIGIDBODY DISPLACEMENT OF 0.15 FT ADDED IN FOR THE SAKE OFCOMPARISON WITH THE WEST IGLOO, ESKIMO I
129

10.
00.
10.5 -0.1-01
FIGURE 5-25. COMPUTED DISPLACEMENTS (IN HUNDREDTHS OF A FOOT) OF THE HEADWALLSOF THE SOUTH AND WEST 16,.OOS, ESKIMO 1. 0.042 SEC AFTER ARRIVALOF THE BLAST
130

R-7556-l-4182
(a) Displacement
1" W-. 1 g to Wn Te, C" 1SI I
-: •(b) Veloci ty
31 j
em( eg) Acceleration
it
Irlo. sic
FIGURE 5-z6. COMPUTED MOTION OF EAST HEADWALL (ESKIMO 11) AT NOCE 1
131

1t ,-7556- 1-182
S3 I
(a) Displacement
1' 3
? Tom. IK
a ..
3A
I (b) Velocity
(c) Acceleration
V._ V^
11
TIo$. sac
FIGURE 5-27. COMPUITED MOTION OF EAST HEADVIALL (ESKIMO 1I) AT NODE 9
132
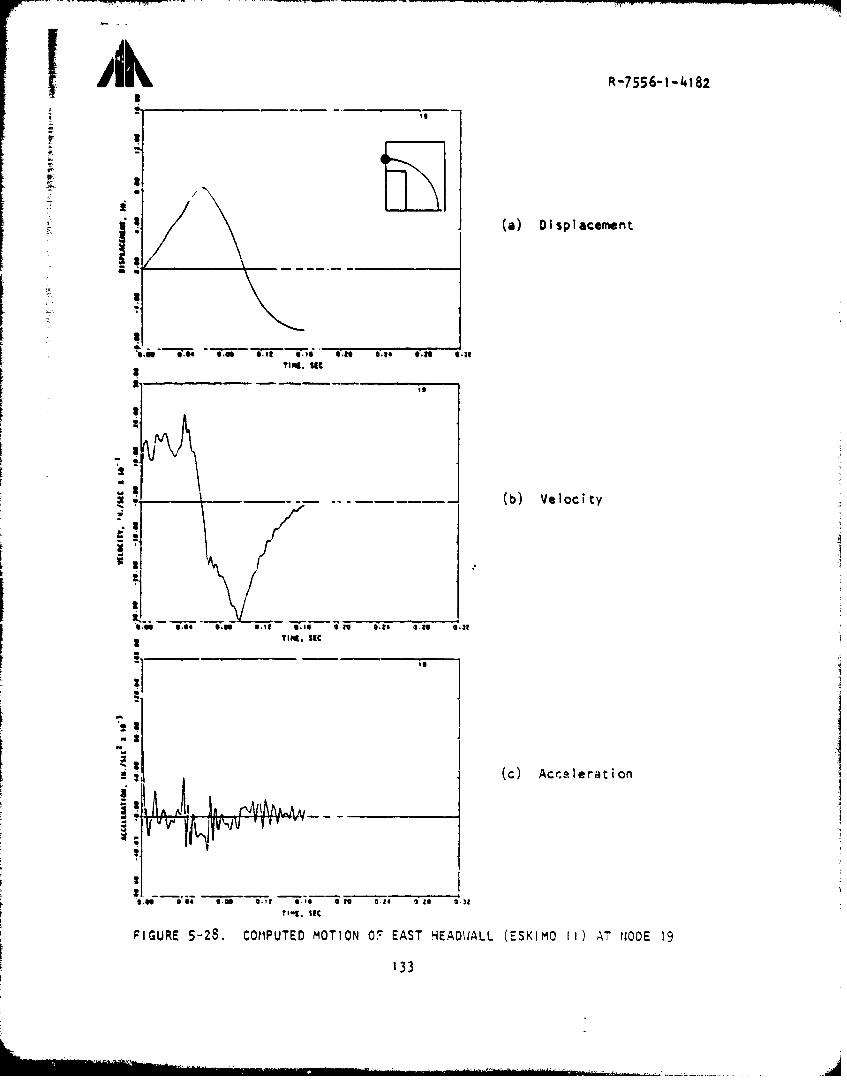
-,i ,.,,,.,,,,ilk R-7556-1 -4182
(a) Displacement
1: IL _ _
a." F0.4 " .m o.1 .6 6.- 1 Zito ,, . C to 6.3
Ting. KIC
(b) Velocity
03
3 ,lil. slC
-133
..
_. S (c) Acer.1erat ion
I
I"oI.O me. 04 o, t m.iP gi.O o i aO O ZO 0.3Z
?tII, SEC
FIGURE 5-28. COMAPUTED MOTION O," EAST HEADWALL (ESKIMO It) AT N+OD:E 19
133

. .. ... 7 7
R-7556- 1-4182
I;I
" " i
" .. * (a) Displacement
S.o " gag. If.1 8. 8.14 a.23" 0.ns llIl9, 59C
I' __(b) Velocity
W' .46 C4.3 UN f.or gl 3.100 6.24 0.11 j-j•3.
To$..i
(c) Accelerat ion
FiGURE 5-29. COMPUTED MOTION OF EAST HEADWALL (ESKIMO 11) AT NODE 21
134

R-7556-1-4182
S"/-i4i
X* (a) Displacement
Ss o. ,.
(b) Velocity
T1ii __ _ _ _ __ _ _ _ _ __ _ _ _ __ _ _ _ _ __ _ _ _ _
0.60 0.44 0.0 5.62 6.46 0.n 0.84 90*0 4.1
. ,im, mc
00
TIM•. SiC
FIGURE 5-30. COMPUTED MOTIO1014O EAST HEADWALL (ESKIMO 11) AT nODE 46
135

R-7556-1-4182
; 3;
| ~(a) Di splacement
* ~/\Tim. C
iFi'
S'i N e e• mN eJa' Vie0 i.29o r84 41.81 o-M
"(c) Acceleration
3 I
FIGURE 5-31. COMPUTED MOTION OF EAST HEADW•ALL (ESKIMO 11) AT NODE 49
136
0.66 3W I? ge 6.8 644 6.33 0.3ThU SI

R-7556-1-4182
i __(a) Displacement
!I
9 ,or .. ... Zo V I I i e . 68 C" 11,11
(b) Veiocity
S• Tif. UC
(c) Acceleration
t.t.St
?Ia6, UCt
FhIURE 5-32. COMPUTED MOTIOtN OF EAST HEADWALL (ESKIMO II) AT NODE 50
137
...... ...

R-7556-1-41 82
3
(a) Displacement
Told. wII.I
•.n (b) Velocity
of CO I*hOON I11| TIRE. "C
ij
13
-.,
! L _ .,.• .^..,,IA •o ,oo ,,,•,oN. . -v7*'
U
(b)Velcit
0 fo I10 o.l ~ tl f~l II 1 .
_____________________________________________
FGURE -3g .g OaPUTED gOTIO OFg EAST gHE AgWL EKM I rOE7
y~g* 1a8

R-7356-1-4182
(a) Displacement
[1.04 C.t 6. 6. nl 6 86 6 r.1 6 .16
TINS. SIC
(b) Velocity
S: (c) Acceleration
I.,
1 16
(c) Acclertio
fill VT v . $1
TINI. SIC
FIGURE 5-34. COMPUTED MOTION OF EAST HEADWALL (ESKIMO II) AT NODE 76
139

R-7 556-1-4182
14(a) Displacement
. • 1119. SIC
a..;..S|
S:i (b) Velocity
TIM. SIC
:•" ="t<'='=.,••,•(c) Acceleration
Till[ SIC
FIGURE 5-35. COMPUTED MOTION OF EAST HEADWJALL (ESKIMO 11) AT NODE 77
140

I AR-7556-1-4182
- (a) Displacement
+
'@.a M's Cuoi of-it 0e.o 6 6 C24 a.8 64nTIMg. sgc
t61
3
(b) Velocity
IrITINg. S9C
." .
L 2
w vv VYv-Y(c) Acceleration
.6 0.04 0-.0 W.1 i .16 0*0 0.24 0TINS. SIC
FIGURE 5-36. COMPUTED MOTION OF EAST HEADW.IALL (ESKIMO II) AT NODE 103
141

R-7556-.1-4182
y
4 3 9 0 5 15\574
1425
-20 1 1 i 13 1ý4 I

R-7556-1-4182
lit 000O OO O 0S 0OS 0ooo0 9
* li lt It5
0 o9ooo .
31 3 al l i t31 333 3 1 I late OI
5 oao e0 4 10 0Sit333 go1 0O
S• It! / 33 OOO O3e
333333a a 0
: Well ll l 06 I
*_98appealare I
S"li lt It31111fai l 0
0 3]5 in I
* !121 I 10
* Inns jlI I 0o~*o 1a . * I
• 32•1 0
a0
I JII-DOOR OPENINGO lti ll lt t t t t
l -33 J 0w* 00 I 0
it 000S
11 111 0 S* 1111 O I3 :0.w
FIGURE : O F S
0 1 0i 0 14300 0 OI 0
* . 1 oo0
9 0 O I 0 S
•ooI o =.'.
FIGURE 5-38. COMPUTED DISPLACEMENT CONTOURS OF EAST HEADWALL AT t * 145 MSEC

+•k R-7 556-1-4o182
tilo133 vva•e7 tt
e O03 1 00 a* 60000
O*ltttOt O
to 3
* *iuia 111+ e
313333 ill 67 t eo3* si$ss aiP 1
0 3333 II$* a~s 100 1 O S
333 3 3 3 3 .all
-11311 ll 1 0 5
* 0 f3 'a i 0 f* 33 q 1t 0 a* 3333 ti1•I 0 5
111l 11 fll l f tillit t I
* 1 00 0
* DOOR OPENING 0
ItS3 3 0 v
* O I 0 •
as goa I 0
' *0 0 i 0
SI 0o•
0 0: ," I SoSi, 0.6 0 i I
I S0 •
*0 0 0 |0
0o 0 0 IO
I O0000OO0SSSS008@Oee O oOgOOOO 0oOOOOOOOOOOOOO OOeOOOOOOOOOOSOOSee SSeees•
FIGURE 5-39. COMPUTED DISPLACEMENT CONTOURS OF EAST HEADWALL AT t = 157 MSEC
144

-1 R-7556-1-4182
"$1 Ot\" 0-
(a) AIscleraeent
vFGR540 Com 1.ED em TIeN OF ýýORTZS I-,OO (ESK.m 11) At'.
•14 • ij.t tt 04 d
_______ (c) Actlleratiy
I!
SI
FIGURE 5-4O. COMIPUTED) MOTION OF NORTHEAST IGLOO (ESKIMO II) AT •iOOE
14,5
SmaA

R-75561-l -182
I!i ~(a) Displacement
I,
is (b) VeIoci ty
(c). Acclertio
21
on of a S " S." .S S I I I I
FIGURE 5-41. COMPUTED MOTION OF %ORTHEAST IGLOC (ESKI!ý 11) AlT !iODE 1
146

IS~~R-7556-i-0, 82
3- U
II
SI1 (a) Displacement
aw so c $-a em 04 si s01n Z aIt si . mi
I-
II
I:
. S.(b) Velocity
a: ______
If
E. M (E) Accelert ion
!,4
'4
III
sit 34 S W I t 2 3 ~ 3 '4 2 .

R-7556-1-41 82
I! (a) Displacement
?z
I
(b) Velocity
0.06 0.02 0.04 0.06 0.as 0.10 0.12 0-14 *.16
IIU
-q Cc) Acceleration
.. 0.1 0.14
FIGURE 5-43. COMPUTE.- MOTION OF NORTHEAST IGLOO (ESKIMO 1I) AT NODE 39
148

-,7 , 7 m7- 7
ii k R-7556-1 -4182
I! (a)Displacement
ii.
•iTomI. Im
:; •Ig"==x (b) Vel oc i ty
•I! '•(c) Acceleration
• !
I!I
!FIGURE 5-44. COMPUTED ,"OTION , " ORTHEAST IGLOO (ESKI"1O !1I ATr %ODE£ 42
.149

R-7556-1-4182
3
#-a- re. eu i .". 0 .10 C to eii[ ~(b) Vesloceiety"
z
ItI
I...*I~g (b) Aceleratio
IISI
"em: (e. sA ce.lig lt-.i,*
I 150

.............
I A _ _ _ _R-7556-1 -4 182
(a) Displacement
8.4 90-W I
x a
7 U__ _ _ _ _ _Q__ _ _ _ _ _ _1_%.W . 6.4 SW 6.66 gig ig e Mi
FI'4,,RE 5-46. CmPUTED MO~~~TION. OFNRHAT IGOUEKC 1)A OE6
15
Lan.

R-7556-1-4182
1' (a) Displacement
•U 6 66 63 6.56 6.11 6~| .14 8.56
Tue. me
II
.3 _______________(c) Acceleration
a," a of as# on an * . . 1 oil 0 1.
FIGURE 5-47. COMPUTED MOTION OF NORTHEAST IGLOO (ESKIMO 11) AT NODE 72
152
vie4, j
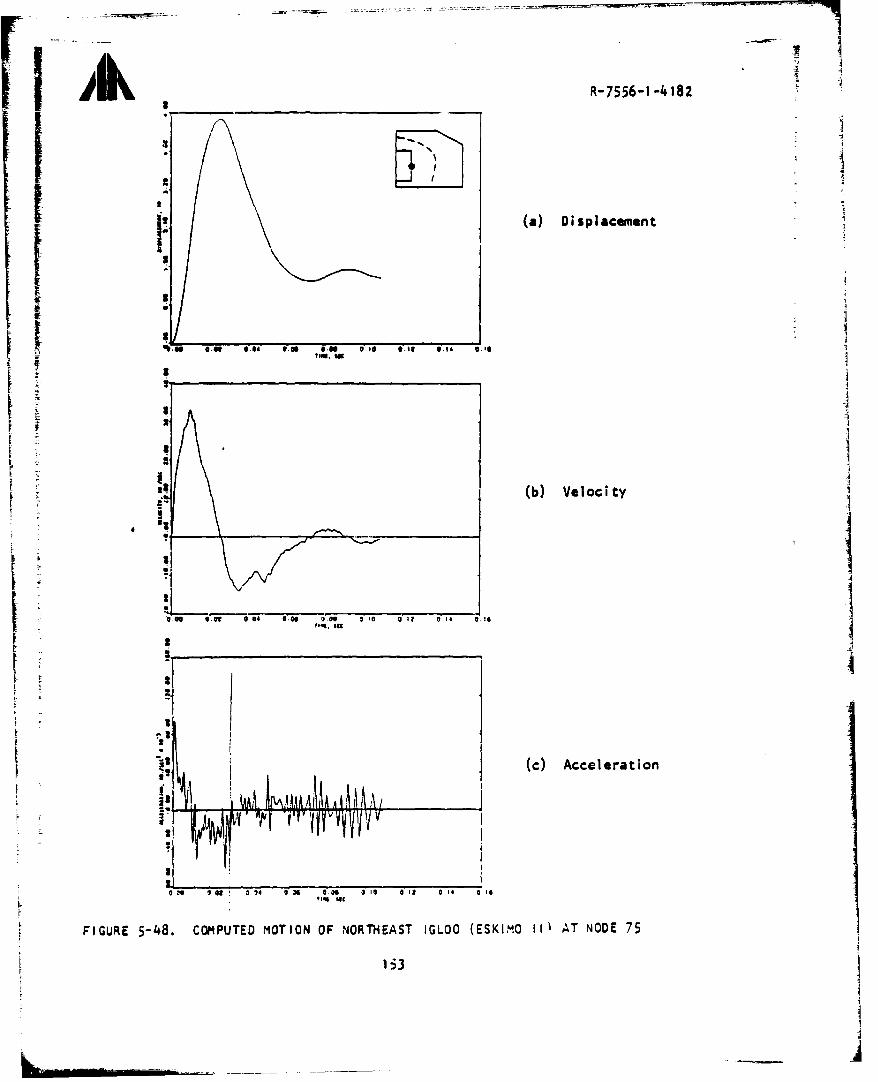
R-7556-1-4182
II(a) Displacement
I
toI 14
FIUR 5e8 ED m OF NR e LOO (K14 0.ND
- ti.
I 4
(b) Velocity
33
I r
SUts I • 00 ' J 02 ;4 1 0 .,3 I @3 n10 SO CI 4 01n5
FIGURE 5-4•8. COM•PUTED NOTION OF NORTHEAST IGLOO (ESKIMO I1• AT NODE 75
1 ~3

R-7556-1 -4182
(a) Displacement
S1
wie weJ
i•i(b) Velocity
0.09 0.02 0 d Se06 0.00 6 .1 i 0.14 0
tim1. 1t
U
•[ (c) Accelerat ion
I
!N
I V
) Ve o cit
SFIGURE 5-49. COMPUTED MOTION OF NORTHEAST IGLOO (ESKIMO 11) AT NODE 77/
F 15
J . . .. . .. .I 1 . . . . l i , , . . . . . . . .. . . . .. . .. . . . . ..

ilk R-7556-1-4182
2J2i
S(a) Displacement
2 .
148 i"1fTI SIC
(b) Velocity
'e I
(c) Acceleration
L . Et
S?• • V vvVW- v
FIGURE 5-50. COMPUTED MOTIONJ OF NJORTHEAST IGLOO S,.IMO I AT :,CCE "
155

Ji~%hhR-7556-1 -4.182
2
()Dsp acemfen t
'km.(c Ace em I~ eeg St t1 oan
... g.si
FIIUE 551.COnPUTED MOT1014 OF ?IJOqREAST IGLOO JESKIMO II Ar 'iOE 3'

R-7556-1 -4182
S( a) D i sp lacemen t
II,1
TIM9o No:
1•=(b) VelocityIt
C-M Woo IQ ei ,4 4 o-oe,
aq
IiI
,.o
(c) Acceleration
vv• v - V v." L, ,i€
FIGURE 5-52. COMPUTED MOTIOn OF NORTHEAST IGLOO (ESKIMO I1) AT NODE 101
157
,.. IJ

Ak__________R-7556-1 -4182
a(a) Displacement
i-3I.6 4M ifs i s1 t
%.u~~~~~b Velocityes e*e i ** i
N23
-3(c) Vceloc aity
hi 7
I2 _ _ _ _ _V
W~ ~ ~~~1M a ,4 wm sI a aisC.
FIUE55. CMUE3OINO OTES GO SIGl"A ID C
15

R-7556-1 -4182
(a) Displacement
if"oS.. 3Ff - 4 4,t , 4b
a3 _ _ _ _ _ ?,IN.__W_
k b) Velocity
do a
- UEm em 00 e 0 0.6 j

Ak R-7556-1 -4.182
94
(a) Displacement
(b*eo il
-4"tie.S
g~~~~(c Accee g~m em em atOs. 6.
F i VRE -55. COWUED "TI-Cts~ Or!X-mA
3: , ' i
a6

R-.7556-1-4182
_kA 0-
-wj
FL.
VIA
000,
u.j
I . ' -_ _ _ _ _ _ _ _ _
Z
~~2AJ

R-7556-1-4182
I= LLI
* * - *
-~ L.6
a , L ' I Ij
p. p. p.fI. * p. 0
SO SO 1
- 2 2fj
162-
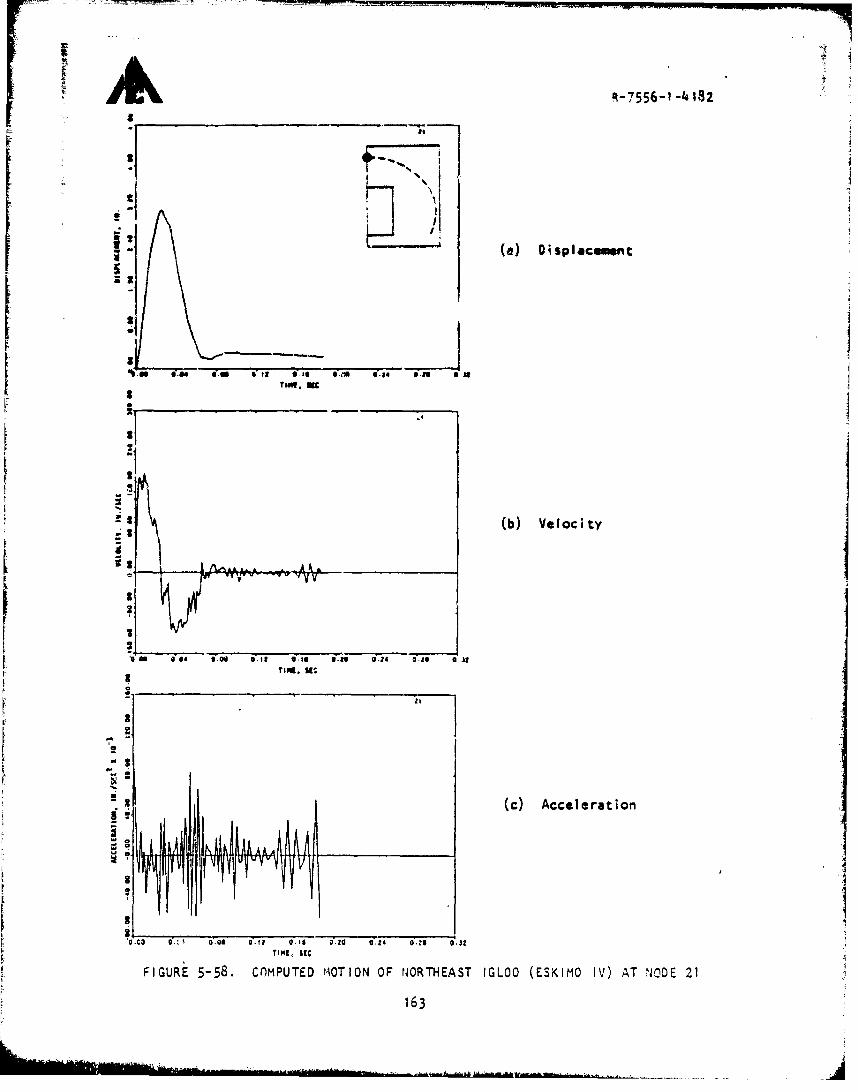
_ -7556-1 -4 182
'~II
I '(a) Di splaceument
-• (b)Velocity
E z ATIRE. ul.
AZC
7Ti0 0, S .
S 3 00 00 0 O-I @ '11 3 0 ".24 0".*1 0 UI
p. 2 IM[. SI€
FIGURe" 5-58. COMPUTED MO0TION OF NORTHEAST IGLOO (ESKIMO IV) AT ,"10DE 2.1
163

-=.-.. ..~-,r--,--'.. . . . ,• ,., • ... 9¶T Y :•:• •+, +:. .. " .. !•••W,,
R-7556-1 -4182
* '1xI
(a) Displacement
a!
IN.-w 41f I." if-it l oe 0f." 9-4d $"A a wTi. e. SEC
(b) Velocity
S
-3 -'- - --- -----------r..•• -4'50 0.6 4I. 08 @al if-it If f-oi.I . 1-t 933it
S
- _ _ _(c) Ac.celeration
0,.1;4 a.as 0.22 0'.16 0'.2 0o.21 0.20 0.32TingSECC
FIGURE 5-59. COMPUTED MOTION OF NORTHEAST IGLOO (ESKIMO IV) AT NODE 24
164

R-7556-l -4182
Tud Set
a i I* | - )ipa••n
Go 0 4 0.09 0.1 Is 6 o -20 a.24 0'2 U' •32
STIME. SEC
2
s
"F (b) Velocity
S 0I-54 s , a 1 - I.g |--' @6
a (c) Acceleration
TIM, S,
FIGURE 5-60. COMPUTED MOTION OF NORTHEAST IGLOO (ESKIM.O IV) AT N'ODE 61
• • 165

|7
Ak A-7SS6- -4182
i "" (a)e Displacement
2
(c)I ( A)- I era t on
-In
V. 0 d0 0. 8 u .1 d.1 0. 4 04 0(3t
Tilg, SIC
S 5A616
• | (b) Vceloc aty oi"I
166

R-77556-1 -4 1,82
F wI2
2
tI g
"* I
2
jam * a(b) Veloci t*y
1Tim 3 a
I
U.1 ~ ~ (b) ve'ciy
3 I
*.M9 sic J 24 63
S.3 (c) Accel era tion
U8
O .00 00 .6 .* 01 0 .20 0.4 0.32
FIGURE: 5-62. COMPUTED MOTION OF NORTHEAST IGLOO (ESKIMO IV) AT NODE 69
167
L 4

11-7556-1 -14182
iIt() ODisplacementi-
~. *~ *~ (b)velocity
vii
STile. ac
(c) Acceleration
0.o0 .o 0 " 0.0 .60e 02 7424 a.3T
Sisic
FIGURE 5-63. COMPUTED MOTION OF NORTHEAST IGLOO (ESKIMO IV) AT NODE 91
168

A
, 1 04 *411 9-1 41t 9 1
(c _____ _ era__io
169 .
'1 1
(c cclrao
| TrlM. StC
-16
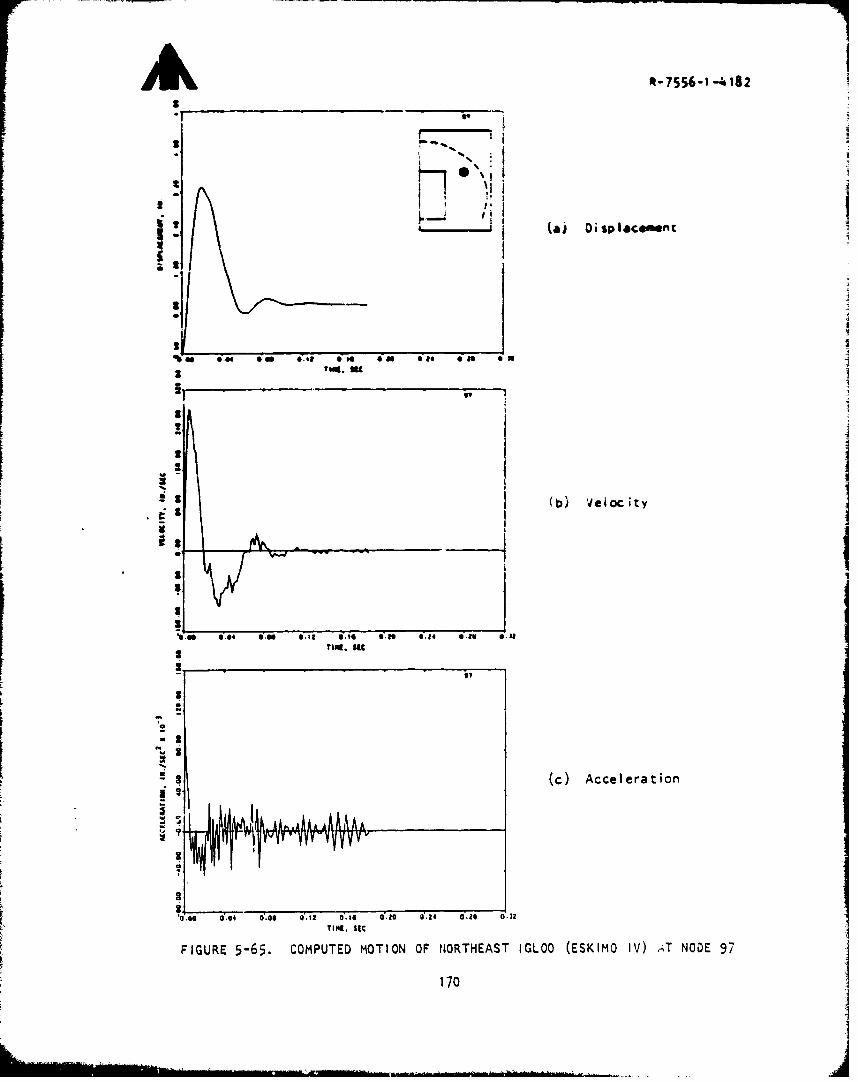
It -7556-1 -, 182
S,, I
'-'II! '- (ai ISplacenment
| ~Tue. we=
g~~~~eb Veiotciieg tc :2
CI I (b eleraion
Si
II
000 0'.04 0.00 gig2 e*.ig . 0 , g a. e
k 1
-D IG ( IV) JeNoDE9
.170
-~I
I
S
0.0,.0 00 0.1* :1 0.30 0.24 0.,6 0.3
T ISIC
FIGURE 5-65. COMPUTED MOTION OF NORTHEAST IGLOO (ESKIMO IV) AT NODE 57
170

I k q-7556-1 -4182
2 17"
I I
il
IV as N t oo $as *1# 4 0 oN a o I 01• e
I ii
.- sA.
WT IV, tyy & W
a 00 0.04 ieo 0.1 d~ o'.20 e -*• 4 " o 0'.32 )
12171
Ij
"V I£3,
." 3 (c) Acceleratkon
S0.00 "0 " O s O 0, 0,4 OO *]
FIGURE 5-66. COMPUTED MOTION OF NORTHEAST IGLOO (ESKIM•O IV) AT NODE 99

A ik R- 7556-14 t82
(b velcit
I k A
3 TOM. m'
:V,.. . . I
-l
Ac --( e I A eration
,I 0.04 0'.04 0'.11 Sl I I . .0
TIIA, stc
FýGURE 5-6o7. COMPUTED MOTION OF NORTHEAST IGLOO (ESKIMO IV) AT NODE 119172
0]
muI
.

[A L___ .-"556-1T -•,18
01 T
is -' = * m
E I ,,-.------
. sic ot
(C) ?M I
I
'-g
1F
" 'IU FI A-8 OPTD/lTONO OTES GO (ES) M Acc )l ATi;On E1
"Ii
S173?.a

Ak 7556-' -b 182II
Va Iipacmn
3v2
10 ft *as * 040 1 as 6 me 40 a as 0w
Tom. -u
0.0 1.ili0 iI .1 .0 02 0 4.29 0
T14. i
FIUE56. cmUE OINO OTES GO EKM V TND 2
17
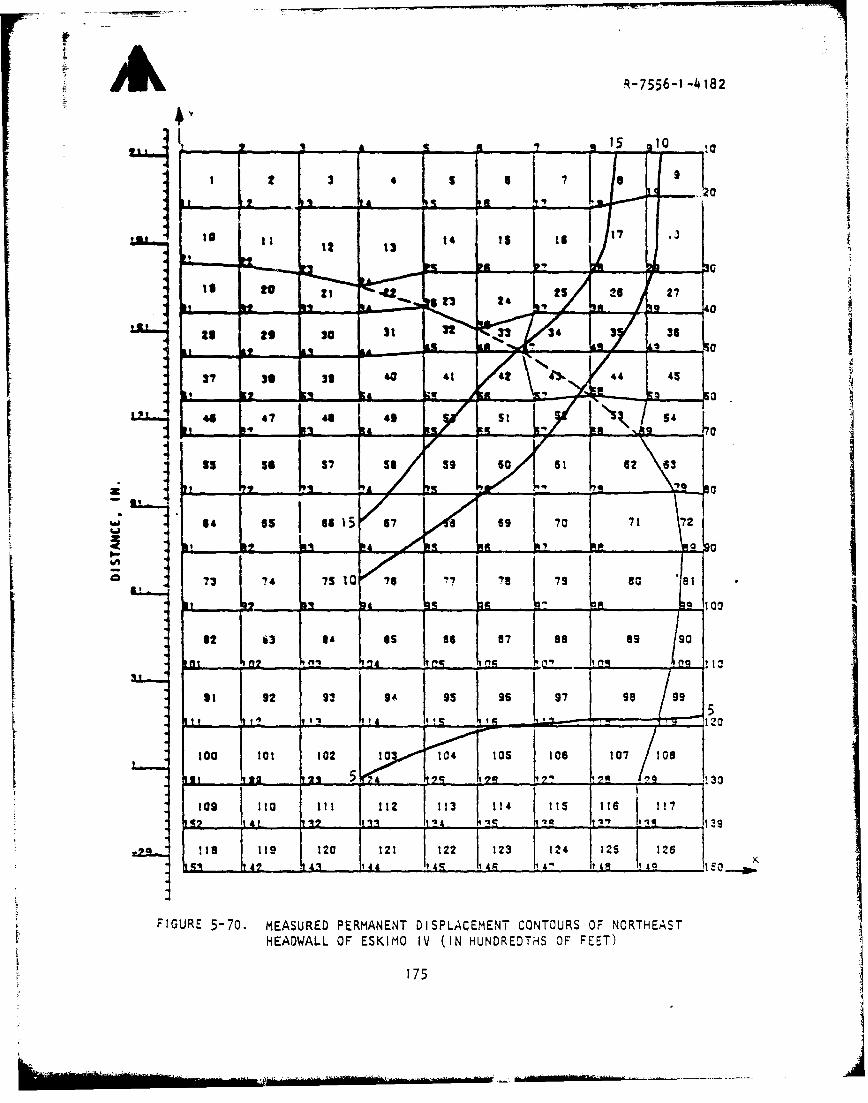
4I• R-7556-1 -4182
LLL1 161 51 3[50 St
IS7 • 4 9t 79
too tot t�oS 10 t014 is
to Is 2
-te toe 10 31 2 11 3 433
|•I L 39 4c st V7 i's 44 89
1 13 /f. ,0 S
17
FIR 0
73 17 l 11 123 104 I-1< I6 Ila e
-.. 9, 18 19 12 0 21 922 9 3 16 97 o 9
S175
e..ý
//I Ic fAC19

R-7556-1 -4182
011 4- a-i
IAI
00
3 24
573 2 .3 34 35 36
&do It
46 47 46 49 so 51 52 5
55 s6 57 511 59 50 61 62 6
73 74 75 76 77 is 79 600 8
10 10 02 103 104 105 11790
1213
FIGURE 5-71. COMPUTED DISPLACEMENT CONTOURS OF NORTHEAST HEADWALL CF ESKIMO IV
AT 158 MSEC (IN HUNDREDTHS OF FEET)
176

7_T
R-7556- 1-4182
A-01-5 ______ ______
I CORRESPONDS TO NODE 91"-300F (FIGURE 5-63)
1. 3as so
M~ CQARESPONOS TO NODE 94
I __________ _________ __________ __________ CORRESPONDS TO NODE 97(FIGURE 5-65)
UAU
___________ __________ ___________CORRESPONDS TO NODE,99
TIE VIEC AA800
~~~~~~~~~~~~~~(FIGURE 5-7266SRDACEEAINT) HSOISO ORHATH L
OF ESKIMO IV (Ref. 6
ý'.The motions at this gage exceeded its rating. Therefore, the recornot quite reliable.
17.7

R-7556-1-4182
00.•
- A __. ...- CORRESPONDS TO NODE 61(FIGURE 5-60)
•J
IIts
_____ I " I CORRESPONDS TO NODE 64, '- (FIGURE 5-61)
a. ,4Il • _ _______ _____|______ CORRESPONDS TO NODE. 35
e&qw
k.!...... CORRESPONDS TO NODE 21
_ __.CORRESPONDS TO NODE j1MI 8
"s' CORRESPONDS TC NODE 21(FIGURE 5-58)
t ORRESPONDS TO NODE 28
TIME, MSECAA8004
FIGURE 5-72. (CONTINUED)
1
t 178
t:~....................................... .

.- - - - - - - - -.-• - - - _ -' _ _ - 7-
R-7 556-1-41 82
ilkl
I.-Of
CORRESPONDS TO NODE 94
S•--• Im • -- -(FIGURE 5.64)
aCORRESPONDS TO NODE 97ho (FIGURE 5-65)
-______ ... CORRESPONDS TO NODE 98
-. .CORRESPONDS TO NODE 64(FIGURE 5-61)
S• .CORRESPONDS TO NODE 76
•' ~L-1,41.
t . I(j ____CORRESPONDS TO NODE 55
{CORRESPONDS TO NODE 31
I..-We
1+0 CORRESPONDS TO NODE .21(FIGURE 5-58)
TIME, NSECAA8002
FIGURE 5-73. MEASURED DISPLACEMENT TIME HISTORIES OF NORTHEAST HEADWALLIN ESKIMO IV (Ref. 6)
179
....

R-7556-1-4.182
SECTION 6
CONCLUSIONS AND RECO~MMENDATIONS
6.1 CONCLUSIONS
The present study consisted of dynamic analyses of magazine head-
walls subjected to blast loadings in the ESKIMC tests. All the analyses
were performed using the INSLAB code, a nonlinear finite element computer
program. The computed results were compared with available test data. The
following is a summary of conclusions of the study.
a. The modified INSLAB computer program is capable of analytically
predicting the behavior of the magazine headwalls used in the
ESKIMO tests.
b. The proposed nonlinear material model to represent the soil
behind the headwalls appears to be satisfactory.
C. The general behavior of the hea~iwalls predicted by the calcula-
tions agreed well with the actual behavior of the headwalls
In the tests.
d. The results from the present analysis of the south and west
headwalls in ESKIMO 1, using the refined finite element mesh,
show better agreement with the test results than those from
the previous analysis.
e. The analysis of the east headwall in thý2 ESKIMO 11 test shows
that (1) the computed maximum motions are much higher than
those measured, and (2) the computed permanent displacement
contours are similar in shape to those measured.
Preceding pape blankt 181

R-7556-1 -4182
Sf. The results of the analysis of the northeast headwall inthe ESKIMO II te.t show that:
1. The computed maximum velocity above the doorway is muchhigher than that measured using the linear motion
transducers.
2. The computed maximum acceleration of the door is in goodI agreement with that measured using the accelerometers.
3. The presence of the concrete beams around the doorway iseffective In reducing the maximum displacements of the
headwal l.
4. The biparting and sliding type of door is superior to thedouble-leaf and hinged type, for resisting the blast
loads.
g. The results of the aialysis of the northeast headwall in theESKIMO IV test indicated that:
1. The corrugated steel arch doesn't seem to. provide anysignificant resistance to the motion of the headwall.
2. The magnitudes.and general shapes of the computed dis-placement time histories are in good agrcement withthose measured by the linear motion transducers.
3. The computed acceleration time histories look somewhatdifferent from those measured using the accelerometers;however, the computed maximum accelerations are in good
agreement with those measured.
182
____________________________________A

i k R-7556-1 -4182
6.2 RECOMMENDATIONS
The analycical prediction capabilities exhibited by the presen:
study have been satisfactory. However, there are certain aspects to the
modeling of the headwall and door system that can improve the analyticalprediction capabilities. The following is a summary of recommendations for
improving the analytical prediction capabilities in order to reduce the
dependence on the expensive, full-scale testing program.
a. The present techniques for analyzing the headwcll systems are
not satisfactory when the doors are blown open. Therefore,the analytical methods should be improved to include the
concept of breakable hinges. This would per;ait the calaula-
k tion of true response of the headwall even after the doors
are blow open.
b. The parameters in the nonlinear soil models should be adjusted Ibased on the test date avi.,lable for the ESKIMO IV test. 7he
resulting models are expected to better represent the backfill
soils for improved analytical predictions.
c. Detailed anilysis of the test data for ESKIMO IV and comparison
of the data with the results of the present analysis should
be undertaken. This may include corrections to the data for
drifts, etc., and also statistical analyses of the test data.
d. Future tests should include a sufficient amount of instrumenta-tion to produce data necessary to study the stress distributionin the headwall sections. This would include placing strain
v'ages on reinforcing bars.
183

R-7556-1 -4182
SECTION 7
REFERENCES
1. Weals, F.H. rSwyTMO r Magazine Separation :e8e, NWC TP 5430. China Lake,
CA: Naval Weapons Center, April 1973.
2. Ts'ao, H.S., et a). Magazine HeadwacZi Response to Explosive BZ-aa:,R-7336-3284. El Segundo, CA: Agbablan Associates, January 1974.
3. User's Guide for INSLA4B Code, U-7556-1-4001. El Segundo, CA: Agbabian
Assrociates. September 1975.
4. Weals, F.H. ESY.TiMO I Magazine Separation Tet• t WC TP 5557. China Lake,CA: Naval Weapons Center, September 1974.
5. Weals, F.H. ESKIMO XII Magazine Sep.zation 2e',•, NWC TP 5771. China Lake,CA: Naval Weapons Center, February 1976.
6. Weals, F.H., and Wilson, C.H. RrelZimina, Rypepert, Z7SKMC i:. China Lake,
CA: Naval Weapons Center, 1976.
7. Baker, W.E. E'rý.Zo.iona in Air. Austin, TX: University of Texas Press,1973.
S. User,' Guide for .NSLAB Code, R-6820-1580. Los Angeles: Agbabian-Jacobsen
Associates, September 1970.
9. Strength of MAateriaZs and StruoturaZ EZ•,ente, Manual for Design ofStructures to Resist the Effects of Ato'nic Weapons, EM1110-345-414.U.S. Amy, Corps -;f Engineers, tMarch 1957.
S 10. "IGLOO Door Test -- Modulus of Soil Reaction," unpublikhed memorandum,.Washington, D.C.: Naval Weapons Center, Code 7036, October 1972.
_ 11. Richert, F.E., Jr., et al. V-,'rtion o.f Soils and Fo ur.=ion. EnglewoodCliffs, NJ: Prentice-Hall, 1970.
12. Uear'a Guide for "TRI/SAC Code, r'-7128-4-2314. El Segundo, CA: AgbabianAssociates, May 1972.
13. Wang, C.T. Applied EZaatim ty. New York: McGraw-Hill, 1953.
Preceding pap blank185

R-7556-1 -4182
APPENDIX A
INCLUSION OF NONLINEAR SPRINGS IN INSLAB CODE
The response of tht magazine headwall to blast loading is greatly
influenced by the earth fill behind the headwall. The effect of the soil can
best be Incorporated In the two-dimensional headwall model by using a com-
bination of damping elements and nonlinear (one-way) springs. Linear springs,
which are already present in the existing INSLAB code, are inadequate for
k modeling the influence of the soil because they exert both pressures and
tensile forces on the headwall and they tend toward a final displacement ofzero. The properties of the nonlinear springs and the details -' their incor-
poration in INSLAB are discussed herein.
SFigure A-1 shows the load/deflection characteristics of the non-
linear springs. Two different spring constants, kL and ku, appropriate
in the virgin loading zone (Zone 2) and the unloading/reloading zone (Zone 1)respectively, have been incorporated in such a way that after loading, equi-
librium corresponds to a nonvanishing displacement, 6 . This equilibrium
displacement Is a function of 6max' the largest compressive displacement of
the prior load history. Tensile spring forces are eliminated by using aspring constant of zero in "Zone 0,' in which the displacement is on the
tensile side of the equilibrium displacement.
Th. '?arying status of the nonlinear spring Latween Zones 0, 1,
and 2 requires reformulation of the global stiffness matrix Jiuring transitionfrom one zone to another. Furthermore, as shown in Table A-1, transition
between zones usually requires an adjustment to the load vector. This isbecause the stiffness matrix ;s capable of accomodatiný, only that portion ýf
= the incremental spring force that is proportional to the incremental displace-ment, A6. Note that for a linear spring in which there Is never any
transition between zones, there is no need for a load vector adjustment.
Preceding pate blank
[ 187

R-7556-1 -4182
_i1
NOTE: kt - SPRING CONSTANT IN LOADING
ku a AN ARBITRARY STIFFNESS VALUE IN UNLOADING(CONTROLS THE PERMANENT DISPLACEMENT OFTHE SPRING)
F(COMPRESSION)
IIFI ku L
k 1
(COMPRESSION)6 6o max
' - "- - ZONE 0- ZONE 1 - "-,, -' -- - -ZONE 2 -
FIGURE A-i. LOAD/DEFLECTION CHARACTERISTICS OF NONLINEAR SPRINGS
188
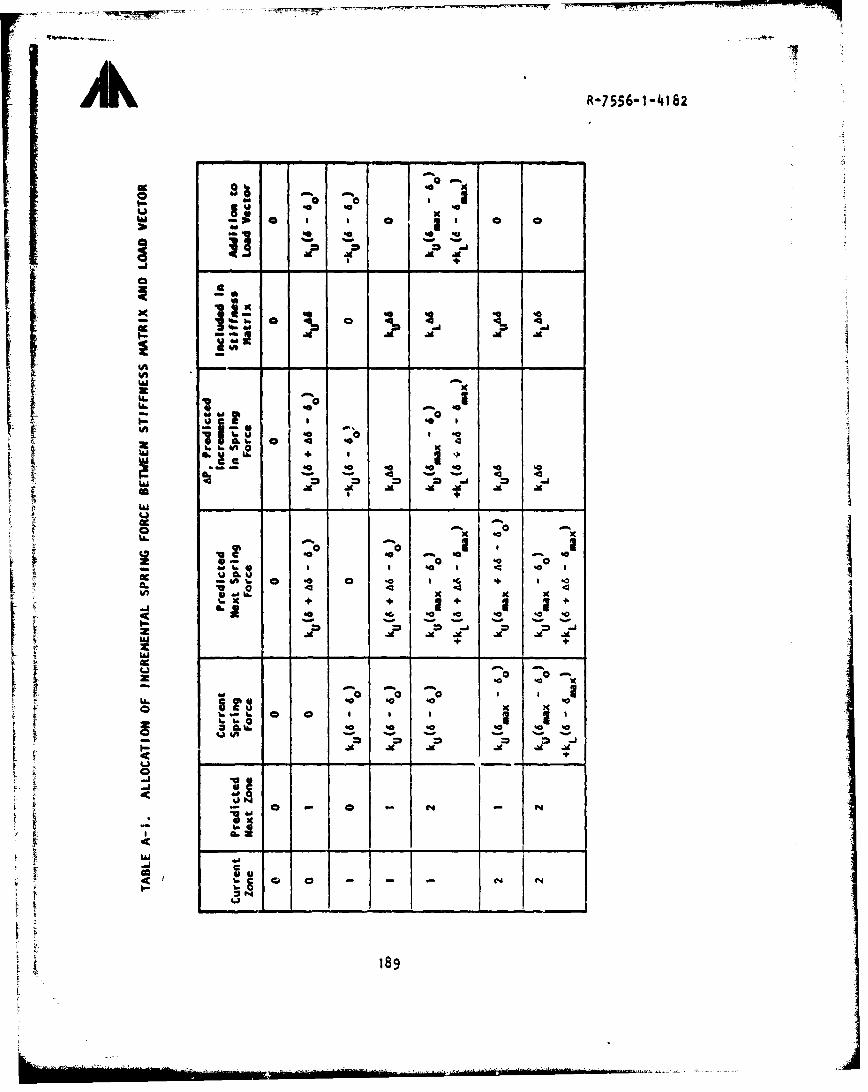
R-7556-1-4182
o - o ,,
II?AO
a"4, i a , t 4
r 0 -0 -S• -0 -0 a
LU-
t..
'0 -0
.u IL
I0 .0 : ... 1 0
40 '0 4• 4 0
-. 4 44 .
UAU
189
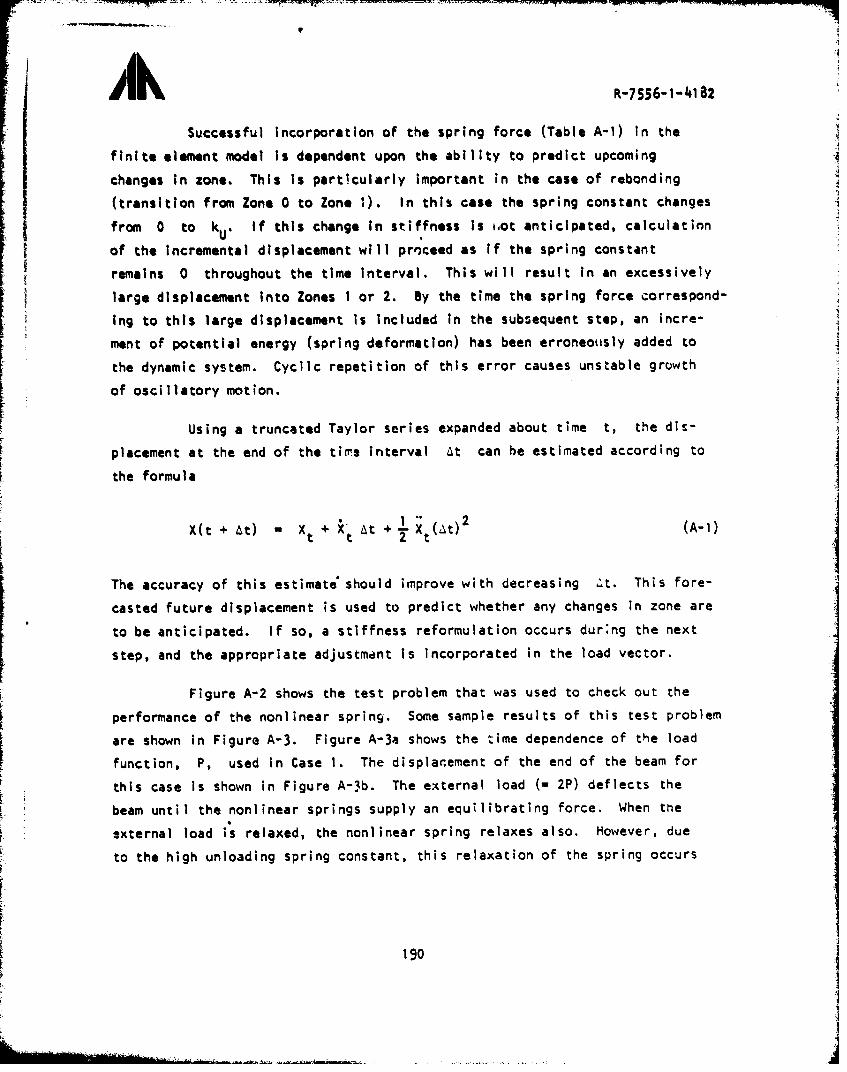
R-7556-l-0182
Successful incorporation of the spring force (Table A-1) in the
finite element model is dependent upon the ability to predict upcoming
changes in zone. This is particularly important in the case of rebonding
(transition from Zone 0 to Zone 1). In this case the spring constant changes
from 0 to k If this change in stiffness is iot anticipated, calculatinnU.
of the incremental displacement will proceed as if the spring constant
remains 0 throughout the time Interval. This will result in an excessivelylarge displacement into Zones 1 or 2. By the time the spring force correspond-Ing to this large displacement is included in the subsequent step, an incre-
ment of potential energy (spring deformation) has been erroneoutsly added to
the dynamic system. Cyclic repetition of this error causes unstable growth
of oscillatory motion.
Using a truncated Taylor series expanded about time t, the dis-
placement at the end of the tirre interval at can he estimated according to
the formula
x(t + at) X + Xat +X(at) 2 (A-1)
The accuracy of this estimate should improve with decreasing It. This fore-
casted future displacement is used to predict whether any changes in zone are
to be anticipated. If so, a stiffness reformulation occurs during the next
step, and the appropriate adjustment is incorporated in the load vector.
Figure A-2 shows the test problem that was used to check out the
performance of the nonlinear spring. Some sample results of this test problem
are shown in Figure A-3. Figure A-3a shows the time dependence of the load
function, P, used in Case 1. The displacement of the end of the beam for
this case is shown in Figure A-3b. The external load (- 2P) deflects the
beam until the nonlinear springs supply an equilibrating force. When the
external load is relaxed, the nonlinear spring relaxes also. However, due
to the high unloading spring constant, this relaxation of the spring occurs
190

R-7556-1-41 82 7
iiP
Iy
IizUx
LENGTH a 10 IN.WIDTH - 1 IN.DEPTH - 0.2 IN. SRN OSATE - 30 x 106 PSI SRN OSAT
7.4x1-4 LB-SEC2 600 LB/IN.
7.IN.4 ku -6000 LB/IN.
FIGURE A-2. TEST PROOLEfI USED TO CHECK OUT NONLINEAR SPRINGS
191

- - -7',-w flx~.v~y-wvv V
R-7556-1-4182
fA0 C
*0 71C
C
aha
*NI ~ ~ ~ V *I33VdSQ*I'N33V4~
C C,
.0 cm
oi 0
0 0.
192
- - - --- --- - --- --

Iilk R-7 556-1- 41821
with only a small recovery of displacement. When the external load has
relaxed to the extent that the elasticity of the beam overcomes it, the beam
debonds from the nonlinear spring and undergoes free vibration.
Figure A-La shows the time dependence of the load function used inCase 2, which waes designed to test ,'ebonding. The results are shown in
Figure A-4b. Debonding occurs at about 30 msec in this case, after which
free vibration begins. The free vibration continues until the reapplication
of external load at 45 msec. This external load and the inertia of thevibrating beam cause the beam to slam violently into the relaxed spring at
the displacement o (see Fig. A-1). Tcmporary equilibrium is found in thevicinity of this displacement until the external load grows large enough to
force the beam into Zone 2 of Figure A-1. At this point the stiffnessreduces to the virgin loading value, allowing further displacement until a
new equilibrium is reached.
The results of these two test cases indicated that the nonlinearspring is performing as intended. Both debonding and rebonding appear to be
working correctly. Furthermore, the nonzero equilibrium displacement follow-
ing a load cycle has been checked and found satisfactory. It is anticipatedI that these'properties, when used in conjunction with dampers and/or concen-trated masses, will prove satisfactory in modeling the effects of the soil
behind the headwall.
193

R-7556- ,• 182
S! IAPPENDIX 8
PROCEDURE FOR CALCULATING YIELD MOMENTSFOR A REINFORCED-CONCRETE SECTION
The yield moment of a reonforced-concrete cross section is defined a
as the moment that makes the steel in tension or the concrete in compressionreach its yle~d limit. The reinforcement .rovided in the headwall section
is governed by the former cese; therefore, only the derivation for the under-reinforcement case (steel-in-tension yield) is described below.
A typical cross section of a reinforced-concrete sec.:tion is shownin Figure B-1, and the strain diagram is shown in Figure 5-2, where A and ]A; are the areas of the steel reinforcemnnt in tension and compression,respectively. The strain level in tension steel is ct, in concrete is - c'
and in compression steel is c'. The strains are related by the following
formula:
t d -Kd I - K
C K
e' d' - Kd dE Kd •Kc
The stresses in steel are as follows:
a no 1- K stress in tension steels c K
t n stress in compression steel (B-2)
Es
where m E -, the ratio of modulus of elasticity of steel to concrete.c
4.cdg page hnk•, 195

R-7556-1 -J.182
z #cc
z a
UA ýcc
4.' qnj
"L6
196U~

R-7556- 1 -4182
Denoting th- area of steel as a fraction of the area of the concretesection, i.e. ,
A 5,sP"bd
Spl As$
S" b"•'-(8-3)bd
the equation of equilibrium becomes
a A +;A' + 4 cc Kbd - 0 (8-4)
This can be rewritten after some arrangement into the form
K2 d'K + 2(np + np') K - (2np + 2np' 0
Therefore the solution of K becomes
2np+ 2npd' L +(np + np')2 -(np + np') (8-5)
The yield moment for the underreinforcement case is
M "Cs As (d"') + A; (d' Kd
or
M - A jda (0-6)S 7
197j

i R-7556-1 -4182 -
whe re
Kd ' d' 3)•
p 'K (-7)
If the solution of Equation B-5 is such that K >- then the
stress in compression steel is
d' d'-K '- K*" = 2na d - 2 -- K (8-8)
s € K 1 --K as
The equation of equilibrium for this case becomes
1
a A + a' A' + aKbd - E el A' - (8-9)5 S 5 5 25
After some rearrangement, and the use of Equation B-3, K becomes
K np + (2n - 1)p' !-.-] + (np + (2n - 1)p'] 2
- [np + (2n - 1)p'] (8-10)
The form of Equation B-6 remains the same except that for this case, j is
defined as
(2n - 1) K - 2.,- d'
j d- I -) d ('- K (B-Pf)3 W1- K) p d 3)
1 98

R-7556-1 -4182
APPENDIX C
PROCEDURE FOR COMPUTING EQUIVALENT MDL-TOR A REINFORCED CONCRETE SECTION
to
yoIhI
xu
RE INFORCED CONCRETE STRUCTURE AA82L.0
Assume that the displacements in the reinforced concrete structure shown
S above are in the following form:
U(xIYIz) -- wx) z -- W'(x)z
v(X,y,z) *0j
w(x,yZ) -W(X)
and the strains:
* -- z W'l(x)zxx ax
zz eyy Exz Exy a ryz a
199
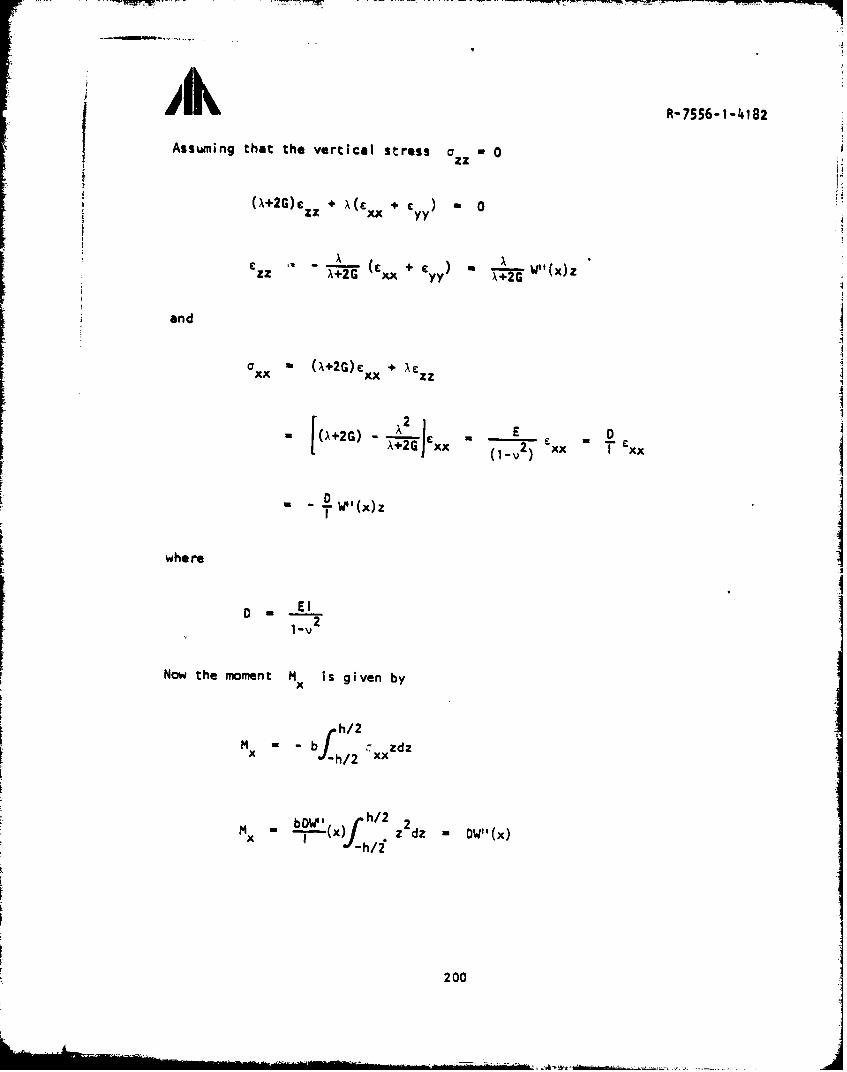
SiElk R-7556- 1-4182
Assuming that the vertical stress a 0
(X42G)c + x(C Ec ) 0zz xx yy
a n d - ~ c . ~ + G W (~
a U (X+2G)c xx+ Ez
M JX2 ) - X E Dý(x4(G ~xx (-2) CXX I 'xx
where
Now he omet M is given by
h/2M - bf xxzdz
-bOW" ,h/22
200
A--

R-7556-1-4182
kd :
d!
of ~ ~ ~ ~ ~ ~ -i (x) tai ltlbtoS
t(1-k)d
Ct" (1-k)dW'(x)
[ioment of the section is then given by
M A Asids AsjdE st
AJEA .(1,-k)d2W"(x) W '(x)
Also
D - A jE (1-k)d 2(1-v2)
Therefore the effective E for the concrete section is given by
2 2AsJE (1-k)d (1-v
201