Embed Size (px)
Citation preview

blank

IN THE BALANCE
The future of Australia’s primary schools
Max Angus
Edith Cowan University
Harriet Olney
Edith Cowan University
John Ainley
Australian Council for Educational Research
AUSTRALIAN PRIMARY PRINCIPALS ASSOCIATION

AUSTRALIAN PRIMARY PRINCIPALS ASSOCIATIONPO Box 7189, Kaleen ACT 2617 Tel (02) 6262 4420 Fax (02) 6262 4401 e-mail: [email protected] Web: www.appa.asn.au
First published 2007
© Australian Primary Principals Association 2007
This project was supported by funding from the Australian Government Department of Education, Science and Training under the Quality Outcomes Programme. The views expressed here are those of the authors and do not necessarily represent the views of the Australian Government.
Reproduction of this work in whole or part for educational purposes within Australia is permitted. The prior written permission of the publisher is required for any other use apart from that permitted under the Copyright Act 1968 as amended.
Printed in Australia by Pilpel Print.
National Library of Australia Cataloguing-in-Publication entry
Angus, M. J. (Max J.)In the balance: the future of Australia’s primary schools.
1st ed.ISBN 9781921407000 (pbk)
1. Primary schools - Australia. 2. Education, Primary - Australia - Curricula. 3. Education, Primary - Economic aspects - Australia. 4. Socio-economic status. I. Olney, Harriet. II. Ainley, John. III. Title.
372.994

In the Balance is the report of an investigation into the state of Australian primary schooling, based mainly on evidence provided by staff from a random sample of 160 primary schools.
In 2005, the Commonwealth Department of Education, Science and Training (DEST) funded the Australian Primary Principals Association (APPA) to initiate the investigation. APPA in turn commissioned a research team from Edith Cowan University and the Australian Council for Educational Research to undertake the study.
Generally, participating principals and teachers were grateful for the opportunity to ‘have their say’. In their view, too little account is taken in the arena of national and State policy making of the views of the professionals who actually do the work of primary education.
Primary schools should be places full of life, energy, excitement and fun: places where young children discover the joy of learning and experience the satisfaction of success.
The quality of education that the public has come to expect from Australian primary schools is at risk unless the States and Territories and the Commonwealth consider more fully the totality of the school rather than narrow aspects of it.
The title, In the Balance, suggests that primary schooling has reached a critical moment.
A significant number of schools cannot meet the expectations set by governments under the conditions in which they now operate.
The scale of the challenges they are facing seems likely to grow rather than to diminish.
Tremendous commitment and goodwill continue to be found among the staffs of Australian primary schools.
I hope that all Australian governments are able to help us to sustain these qualities.
Foreword
LEONIE TRIMPER, PRESIDENT, APPA
13 AUGUST 2007
iii

ACER Australian Council for Educational Research
ADHD Attention deficit hyperactivity disorder
APPA Australian Primary Principals Association
ASD Autism spectrum disorder: a general term used to describe the range of disorders (which may be very severe or relatively mild) on the autism spectrum, including Asperger’s Syndrome
CLaSS Children’s Literacy Success Strategy. Used in Victorian Catholic schools
COAG Council of Australian Governments
DEST Department of Education, Science and Training
FTE Full-time equivalent
HPE Health and Physical Education
ICT Information and Communications Technologies. Involves the use of computers, networks, the Internet and related technologies such as digital photography and sound
IEW Indigenous Education Worker
ITAS Indigenous Tutorial Assistance Scheme
KLA Key Learning Area. One of eight ‘subjects’ identified in the National Goals for Schooling
LOTE Languages other than English. One of eight Key Learning Areas. Formerly known as ‘Foreign Languages’
MCEETYA Ministerial Council for Employment, Education, Training and Youth Affairs
n Number of cases in calculation from sample
N Number of cases in population
OECD Organisation for Economic Co-operation and Development
PISA Program for International Student Assessment. Survey of reading, mathematics and science skills among 15-year-olds
RAISE Raising Achievement in Schools. Used in WA Catholic schools
SAISO Strategic Assistance for Increasing Student Outcomes. Source of grants from the Australian Government
sd Standard deviation. A measure of variation from the mean or average. A small sd indicates that most individual scores were similar to the mean while a large sd indicates that the individual scores were dispersed widely
SES Socioeconomic status is explained on page 120
SOSE Studies of Society and Environment. One of eight Key Learning Areas. Replaced social studies
SWD Student with disabilities. Classification based on a formal medical or psychological assessment that enables the student to obtain resources additional to those available to all students
S# School identification number
TIMSS Trends in International Mathematics and Science Study
T# Teacher identification number
Abbreviations
Authors’ note
The study was conducted independently by the research team, with a high level of cooperation from school staff members and officers in government and non-government agencies. The views expressed in the study report are those of the authors and are not necessarily supported by DEST, APPA or other agencies. The report has sought to describe the problems faced by those who work at ‘ground level’ in primary schooling – mainly principals and teachers. Throughout this report, the term ‘The States’ is used to refer collectively to the six States, the Australian Capital Territory and the Northern Territory.
iv

Foreword iii
Abbreviations iv
Authors’ note iv
Tables and figures vi
Acknowledgements viii
Executive summary ix
Chapters
1 The challenges 1
2 The purpose of primary schools 7
3 The primary curriculum 13
4 Assessment and accountability 27
5 Students 37
6 Teachers 51
7 Schools 61
8 Resources 75
9 Sufficiency 85
10 Getting the balance right 95
11 Recommendations 105
Appendix 115
Notes 123
References 127
Contents
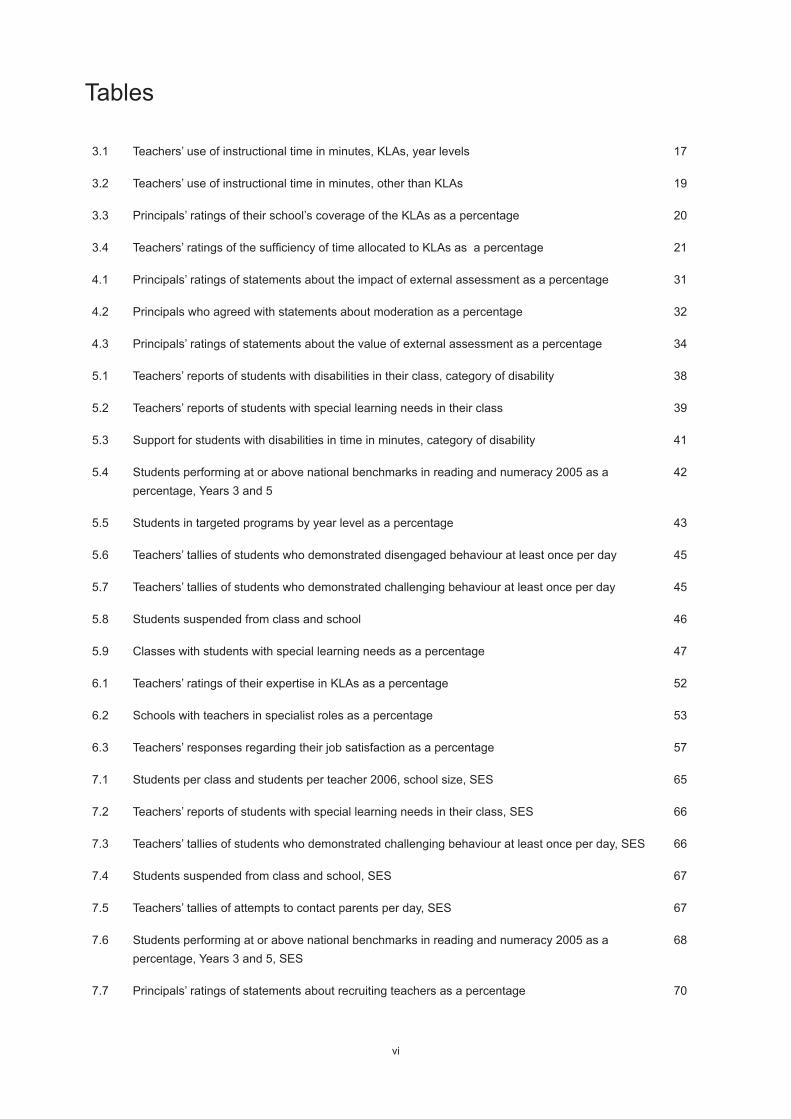
3.1 Teachers’ use of instructional time in minutes, KLAs, year levels 17
3.2 Teachers’ use of instructional time in minutes, other than KLAs 19
3.3 Principals’ ratings of their school’s coverage of the KLAs as a percentage 20
3.4 Teachers’ ratings of the sufficiency of time allocated to KLAs as a percentage 21
4.1 Principals’ ratings of statements about the impact of external assessment as a percentage 31
4.2 Principals who agreed with statements about moderation as a percentage 32
4.3 Principals’ ratings of statements about the value of external assessment as a percentage 34
5.1 Teachers’ reports of students with disabilities in their class, category of disability 38
5.2 Teachers’ reports of students with special learning needs in their class 39
5.3 Support for students with disabilities in time in minutes, category of disability 41
5.4 Students performing at or above national benchmarks in reading and numeracy 2005 as a
percentage, Years 3 and 5
42
5.5 Students in targeted programs by year level as a percentage 43
5.6 Teachers’ tallies of students who demonstrated disengaged behaviour at least once per day 45
5.7 Teachers’ tallies of students who demonstrated challenging behaviour at least once per day 45
5.8 Students suspended from class and school 46
5.9 Classes with students with special learning needs as a percentage 47
6.1 Teachers’ ratings of their expertise in KLAs as a percentage 52
6.2 Schools with teachers in specialist roles as a percentage 53
6.3 Teachers’ responses regarding their job satisfaction as a percentage 57
7.1 Students per class and students per teacher 2006, school size, SES 65
7.2 Teachers’ reports of students with special learning needs in their class, SES 66
7.3 Teachers’ tallies of students who demonstrated challenging behaviour at least once per day, SES 66
7.4 Students suspended from class and school, SES 67
7.5 Teachers’ tallies of attempts to contact parents per day, SES 67
7.6 Students performing at or above national benchmarks in reading and numeracy 2005 as a
percentage, Years 3 and 5, SES
68
7.7 Principals’ ratings of statements about recruiting teachers as a percentage 70
Tables
vi
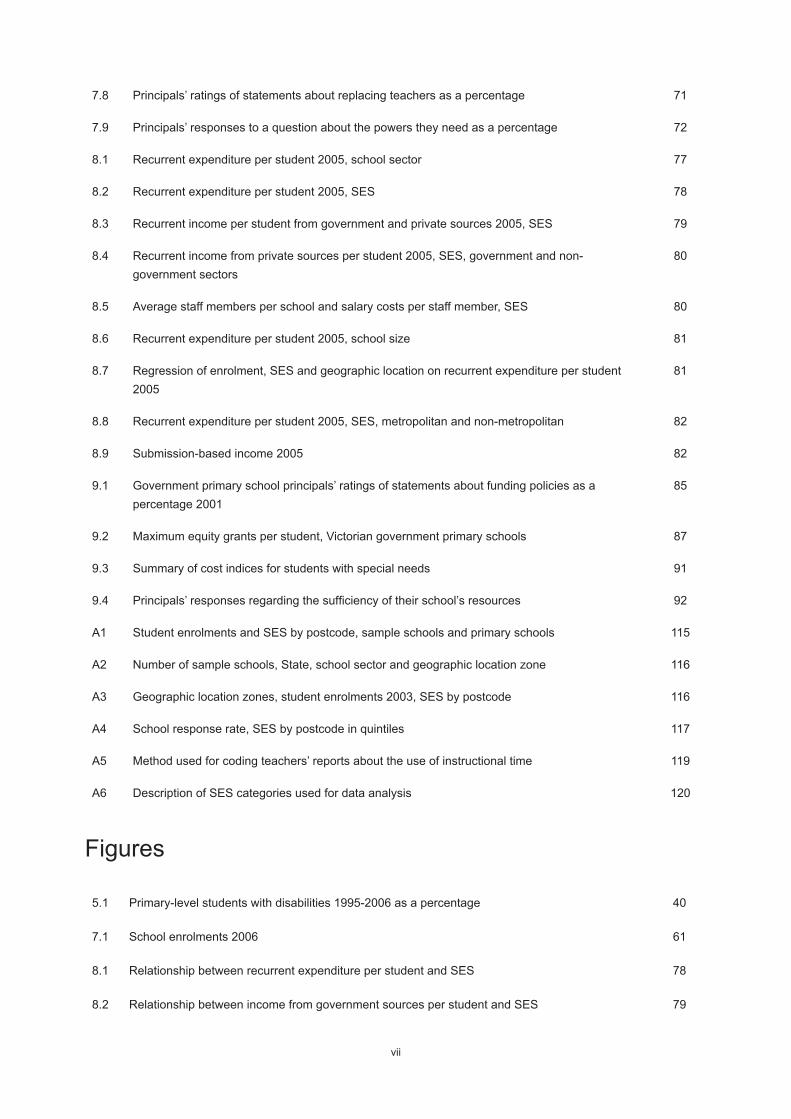
7.8 Principals’ ratings of statements about replacing teachers as a percentage 71
7.9 Principals’ responses to a question about the powers they need as a percentage 72
8.1 Recurrent expenditure per student 2005, school sector 77
8.2 Recurrent expenditure per student 2005, SES 78
8.3 Recurrent income per student from government and private sources 2005, SES 79
8.4 Recurrent income from private sources per student 2005, SES, government and non-
government sectors
80
8.5 Average staff members per school and salary costs per staff member, SES 80
8.6 Recurrent expenditure per student 2005, school size 81
8.7 Regression of enrolment, SES and geographic location on recurrent expenditure per student
2005
81
8.8 Recurrent expenditure per student 2005, SES, metropolitan and non-metropolitan 82
8.9 Submission-based income 2005 82
9.1 Government primary school principals’ ratings of statements about funding policies as a
percentage 2001
85
9.2 Maximum equity grants per student, Victorian government primary schools 87
9.3 Summary of cost indices for students with special needs 91
9.4 Principals’ responses regarding the sufficiency of their school’s resources 92
A1 Student enrolments and SES by postcode, sample schools and primary schools 115
A2 Number of sample schools, State, school sector and geographic location zone 116
A3 Geographic location zones, student enrolments 2003, SES by postcode 116
A4 School response rate, SES by postcode in quintiles 117
A5 Method used for coding teachers’ reports about the use of instructional time 119
A6 Description of SES categories used for data analysis 120
5.1 Primary-level students with disabilities 1995-2006 as a percentage 40
7.1 School enrolments 2006 61
8.1 Relationship between recurrent expenditure per student and SES 78
8.2 Relationship between income from government sources per student and SES 79
Figures
vii
viii
AcknowledgementsThis study has relied on the generous support of many people.
The contribution from APPA and its members at all levels was, of course, essential.
Many principals, teachers and non-teaching staff members have provided assistance on a confidential basis and so cannot be identified.
Others in APPA have made contributions unrelated to specific schools and so can be named.
Leonie Trimper was national president of APPA throughout the study and project director, while Colin Pettit was deputy project director, an APPA executive member and president of Australian Government Primary Principals Association.
Brian Lacey, the national president of the Australian Catholic Primary Principals Association, was supported by Patrick McGrath on the APPA executive.
Michael Dunn, the national president of the Junior School Heads Association of Australia, was succeeded by Craig Wheatley during the study.
Expert support was provided by Stephen Farish at the University of Melbourne, who devised the SES indices; Martin Murphy at ACER, who drew the sample; Adrian Fordham, who drafted the sections on Indigenous students; and Bronte Parkin who advised on the funding of non-government schools.
Members of APPA’s National Executive Committee assisted at all stages. Colin Pettit, Tom Croker, Carmel Guerin, Roderick Crouch and Louise Thake facilitated the recruitment of pilot schools.
The following members of the National Executive Committee and their associates liaised with the sample schools:
New South Wales: Roger Pryor, Sue Ingram, Geoff Scott, Brian Lacey, Jennifer Fraser, Michael Dunn and Narelle Barker; Victoria: Fred Ackerman, Michael Soltys, Marianne O’Rourke and Vivienne Wearne; Queensland: Tony McGruther, Grace Cochrane, John Coxon, Col O’Brien, Roderick Crouch and Rick Hodgson; South Australia: Glyn O’Brien, Carmel
Guerin, Bruno Benci, Deb Dalwood and Robert Hoff;Western Australia: Colin Pettit, Megan Phillips, Craig Wheatley and Janet Wilmot; Tasmania: Rob Banfield, Sean Gill, Ellie McGuiness and Rob Direen; Australian Capital Territory: Louise Thake and Chris Hamilton ; and Northern Territory: Barry Griffin, Marcus Dixon, Kathy Neely and David Cannon.
Rudy Rybarczyk made contacts with schools.
School visits were undertaken by Barbara Anderson, Max Angus, Joan Brown, Ray Finn, Adrian Fordham, George Halleen, Caron Little, Graeme Lock, Howard Looney, Angus Lucas, Catriona McComish, Harriet Olney, Rudy Rybarczyk and David Stephens.
DEST liaison was provided by Scott Lambert, Kris Erwood, Clare Wynter, Leanne Guymers, Anne Curtin, Peter Matheson and Carole Nomarhas.
The APPA representatives on the Advisory Committee were Leonie Trimper, Colin Pettit, Patrick McGrath, Janet Willmot and Fred Ackerman.
Ian Fraser represented the Secondary Principals Association and Louise Bywaters the Australian College of Education.
The government school systems were represented by Rita Logan and Allan Pickering, the National Catholic Education Commission by Geoff Joy and Ron Dullard, and the National Council of Independent Schools by Ray Whitfield.
Data collation and coding were supported by Caron Little and Thomas Quigley.
The study Website was hosted by Webfirm.
Comments on the preliminary draft were made by Joan Brown, Adrian Fordham, Howard Looney, Angus Lucas, Greg Robson and DEST officers.
WordWays edited the final draft and Marian Scholten designed the cover.

Background
This is the fourth in a series of studies investigating the resourcing of Australian primary schools. The first surveyed the views of principals; the second examined the relative levels of funding of primary and secondary schools from the nineteenth century to the present; and the third presented intensive case studies of the level and use of resources in 30 primary schools. This study builds on the earlier studies and examines the capacity of Australian primary schools to meet the challenges facing them.
The sample and method
Researchers from the Australian Council for Educational Research drew a random sample of 160 primary schools structured so that schools from each State and sector were included. All government and non-government education authorities gave permission for the schools in their jurisdictions to take part. It was agreed that there would be no reporting of differences among States or school systems and that individual schools would not be identified. The conclusions reached in the study therefore apply to Australian primary schools generally.
The information about the participating schools was collected through two detailed questionnaires. The aim of the first questionnaire, to be completed by principals, was to obtain a picture of schools as a whole, particularly their income and expenditure, curriculum, student intake, staff profile and links with the community. The second questionnaire was completed in each school by a teacher selected from the lower, middle and upper year levels. Both questionnaires contained structured sections as well as inviting general comment about matters of concern.
Every school was visited by a member of the research team at least once. During their visits, the researchers validated aspects of the questionnaire responses that were exceptional or ambiguous. Interviews were held with principals, some of them lasting for several hours. Researchers met with participating teachers to clarify
ambiguous responses and to invite them to amplify matters they had raised in the questionnaire. In many cases, principals and teachers submitted documents that they thought were relevant to the investigation.
The findings
Australian primary schools do not have sufficient resources to achieve fully the goals set for them by governments; in many of the schools serving low socioeconomic communities, the shortage is acute. However, some of the challenges facing primary schools are not due to a resource insufficiency.
Sense of purpose
Since the 1980s, school systems have tended to adopt organisational and curriculum frameworks that have blurred the old divisions between the primary and secondary levels of schooling. The new organisational structures and ‘seamless’ K-12 frameworks were meant not only to emphasise the continuity of schooling but also to submerge traditional divisional loyalties under stronger, corporate identities. Government policies now refer to ‘the early years’, ‘the middle years’ and ‘senior secondary’ as though the institution of the primary school was of minor consequence.
In the systems that have emerged, there are no authoritative leadership positions filled by people steeped in the ethos of primary education and able to promote the work of primary teachers and principals.
Curriculum balance
Literacy and numeracy dominate the curriculum. Teachers spend 38 per cent of their instructional time teaching English and 18 per cent teaching Mathematics – more than half of the total. The other six key learning areas share the rest. Next in order of allocated time is Health and Physical Education with 11 per cent, followed by The Arts (8 per cent), Studies of Society and the Environment (4 per cent), Science (3 per cent), LOTE (2 per cent) and Technology with 1 per cent of the total instructional time. The remaining 15 per cent was allocated to a range of activities, with school
Executive summary
ix

assemblies (4 per cent) and religious education (4 per cent) occupying the most time.
Over recent decades there has been a subtle shift in emphasis. Although English and Mathematics have retained their share of allocated time, Social Studies has declined sharply, as have the subjects constituting The Arts. Science has remained relatively constant. On the other hand, Health and Physical Education has acquired additional time. LOTE and Technology are relatively new subjects and their incorporation into the primary curriculum has squeezed other areas.
Most principals reported that their schools were able to cover the expected outcomes for English and Mathematics. LOTE, however, was a different story. More than a quarter of the schools did not offer LOTE and only 14 per cent reported that they were able to cover the expected outcomes comprehensively. Few principals were satisfied with their coverage of The Arts and 40 per cent of teachers reported that not enough time was allocated to this area.
It is clear that schools find it practically impossible to cover all of the outcomes contained in the primary curriculum. Yet the pressure to include more continues to build. Although English and Mathematics command the lion’s share of the allocated time, the continuing criticisms of standards in literacy and numeracy exert pressure on schools to allocate more – hence little consideration is given to cutting back to make way for other subjects.
At the same time, interest groups associated with the other subjects want a larger allocation in the primary curriculum. That more time for a particular subject means less time for others appears to be overlooked. Primary school leaders feel removed from these discussions though the outcomes of any shift in emphasis by governments or education authorities can have a huge impact on their schools.
Specialists and specialisation
Primary teachers are trained as generalists and are expected to teach across all the subjects competently. In addition, some primary schools appoint teachers as subject specialists.
The most common specialist positions were teacher librarian (63 per cent of schools), LOTE teacher (58 per cent), literacy specialist (51 per cent), music specialist
(47 per cent) and physical education specialist (46 per cent). Numeracy and science specialists were reported in 10 per cent and 8 per cent of schools respectively. Many of these positions were part-time.
The frequency of specialist positions should be considered in the light of teachers’ own self-assessments of their expertise to teach the key learning areas. Only 7 per cent reported that they had the expertise to teach LOTE and 13 per cent to teach The Arts (including music, drama, dance and the visual arts).
The frank self-assessments of teachers and the profiles of specialist teachers draw attention to the conundrum that primary schools face. They do not have the resources to staff each KLA with a specialist. Nearly half of all principals reported that they had difficulty in recruiting suitable teachers in specialist learning areas. Hence, most schools will have areas of strength and relative weakness. Their capacity to respond to mandated curriculum priorities beyond literacy and numeracy is therefore variable.
Literacy and numeracy programs
The highest level of special support for literacy was allocated to Year 1 students. Twenty-three per cent of students participated in targeted programs in Year 1, compared with 12 per cent in Year 6.
In the case of numeracy, fewer than half the number of students participated in targeted programs than for literacy – 8 per cent in Year 1 and 5 per cent in Year 6.
The percentage of students performing at or below the benchmarks for literacy and numeracy is nearly identical for each subject and increases slightly from Year 3 to Year 5.
These results support two important conclusions.
Firstly, the difficulties that students face when struggling to read, write and complete numerical operations are not fixed once and for all in the first year or two of school. Continuing assistance is needed.
Secondly, schools are more likely to mount special programs for literacy than numeracy, even though the same proportions of children struggle to reach benchmark standards.
x

Students with special learning needs
The proportion of Australian primary school children with disabilities has more than doubled since 1995. In this study, 5.5 per cent of students had medically diagnosed disabilities. Intellectual disabilities accounted for over half of the disabilities that received funding support. Most of these students are now routinely included in regular classrooms. Principals reported many cases of schools bearing the major costs of supporting these students because the level of special funding for students with disabilities was grossly insufficient.
Teachers were able to identify a larger number of students who had special learning needs but who did not qualify for disability funding, reporting that 16.2 per cent of students had needs of this kind.
In all, 21.7 per cent of students in the participating schools had either medically diagnosed disabilities or teacher-identified needs. The number of such students in individual classes varied considerably. Five per cent of teachers had none, while half had five or more such students in their classes.
Clearly the support required by schools varies according to the concentrations of these students in their enrolments. Many of these students are likely to be among those failing to reach benchmark standards in literacy and numeracy. In Year 3 classrooms in the study, 12 per cent performed at or below the benchmarks and in Year 5 the percentages were 14 and 13 per cent respectively for literacy and numeracy.
Staffing
Most principals find it is difficult to recruit the kinds of teachers they want. An inability to hold onto good teachers compounds the staffing problem. Over 40 per cent of principals reported that recruiting and keeping good teachers was one of the biggest challenges they faced. Nearly a third reported that they had had to accept a teacher whom they considered less than satisfactory because the person was the best available candidate.
More than half of the principals indicated that they had difficulty in finding suitable relief teachers. A quarter were sometimes forced to place students in other teachers’ classes because relief teachers were unavailable.
Schools serving low-SES communities
Schools serving low-SES communities have more students who are difficult to teach than do other schools. Classroom behaviour is part of the problem. Low-SES schools have higher proportions of students who are disruptive; teachers are more likely to suspend students; and there are more than twice as many students who perform at or below the benchmarks in reading and numeracy than in high-SES schools.
Funding arrangements
The formulas used by education authorities to fund schools vary considerably among States, sectors and systems. In addition, within each jurisdiction, schools receive government income from a number of Commonwealth and State programs, some of which have precise eligibility criteria while others are provided on competitive or submission bases. Schools complement this income to varying degrees with income from private sources. For these reasons, it is difficult to acquire nationally consistent figures on individual school incomes and expenditures.
Because of the variability and complexity of funding arrangements, and because of the political sensitivity of school funding issues, education authorities do not disclose the total amounts of income and expenditure for individual schools in their jurisdictions. Hence, there is no database from which a member of the public can compare the total level of funding for one school with another.
In the absence of individual school data, policy analyses are reliant on average income and expenditure data that have been computed by dividing the income and expenditure of schools by the number of schools. Reliance on averages reached in this way precludes an examination of whether the schools with the greatest need actually receive the most government support.
Principals’ estimates of sufficiency
Only 6 per cent of principals reported that they had sufficient resources to meet expectations; at the other end of the scale, only 3 per cent reported that their school’s resources were grossly insufficient. Overall, the responses could be divided approximately into thirds: nearly a third felt they needed considerably more; a third had identifiable, fundamental unmet needs; and a third felt they had sufficient—or nearly sufficient—resources.
xi

Support for low-SES schools
Primary school principals have a strong sense of social justice. They favour overwhelmingly funding policies that give schools serving disadvantaged communities extra support. They also believe that low-SES schools need more resources than they are getting now.
At present, education authorities provide additional funding for schools enrolling students with low-SES backgrounds. However, they do not report the quantum set aside for that purpose in their budgets nor publish the amounts allocated to individual schools.
This study found that the average per-student recurrent expenditure for the third of schools with the lowest SES scores was $7,609 and for schools in the third with the highest SES scores was $7,386. The difference of less than $300 per student in favour of the low-SES schools is of marginal practical significance. The correlation between the SES score of a school and its per-student recurrent expenditure is almost zero.
The correlation between a school’s per-student government income and the school’s SES score is not much stronger.
These findings are of concern, as they suggest that the intentions of governments of supporting schools serving low-SES communities are not being realised systematically.
Funding threshold
Researchers have estimated the additional resources that would be required to raise the level of performance of children from low-SES backgrounds to acceptable levels of proficiency. The extra support that is needed by a school will depend on the severity of the socioeconomic disadvantage of the community it serves and the level of proficiency expected of students.
The estimates produced by the various studies range from an increase of more than 40 per cent above the average per student level of funding to more than twice that level. The researchers concluded that the additional funding now provided in school finance formulas was so small as to make little difference to the educational prospects of low-income children.
In Australian low-SES primary schools, the level of resourcing falls well below the threshold reported by studies that have linked school costs with student academic performance.
Size, location and funding
Differences between school income and expenditure are related strongly to school size. The average recurrent expenditure per student of the smallest third of the schools in the study was $3,500 more than the average for the largest third of schools in the study. This is partly because economies of scale can be achieved in larger schools. It is also the case that small schools are more often located in rural and remote locations, where the provision of services is more costly.
The additional resources that the smaller schools received meant that they could establish smaller classes. For the third of schools with the lowest enrolments, there were, on average, nearly eight fewer students per class than the third of schools with the highest enrolments.
It is clear that school size is a much more powerful factor than socioeconomic status when it comes to the staffing of primary schools.
Managing resources
Principals want maximum flexibility to deploy their funds to achieve their schools’ overall purpose. Tight restrictions on the use of funds and time-consuming accountability requirements are considered unnecessary and unhelpful.
On average, each school received $32,863 in submission-based income and principals committed 26 hours to preparing submissions and acquitting the funds.
Principals argued that submission-based funding should be wound back. This form of funding suits central bureaucrats but primary schools are not staffed in ways that enable them to compete fairly for the funds. Primary schools are not set up like small businesses and increasing pressure on them to operate as though they were but without the infrastructure diverts them from their core purpose.
The state of the primary teaching profession
Teachers reported high levels of satisfaction with their role. Ninety-two per cent claimed to both enjoy their work and feel they were making a difference. Even teachers in the most challenging schools with the greatest shortfalls in resources maintained a positive
xii
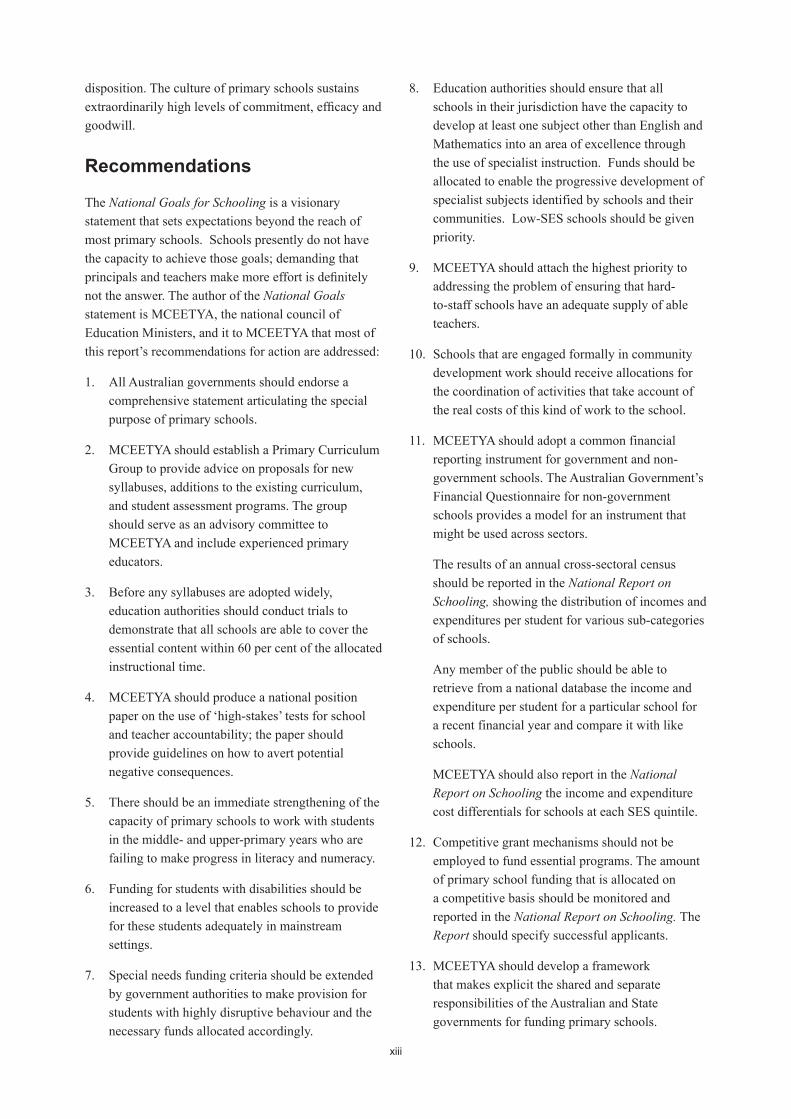
disposition. The culture of primary schools sustains extraordinarily high levels of commitment, efficacy and goodwill.
Recommendations
The National Goals for Schooling is a visionary statement that sets expectations beyond the reach of most primary schools. Schools presently do not have the capacity to achieve those goals; demanding that principals and teachers make more effort is definitely not the answer. The author of the National Goals statement is MCEETYA, the national council of Education Ministers, and it to MCEETYA that most of this report’s recommendations for action are addressed:
1. All Australian governments should endorse a comprehensive statement articulating the special purpose of primary schools.
2. MCEETYA should establish a Primary Curriculum Group to provide advice on proposals for new syllabuses, additions to the existing curriculum, and student assessment programs. The group should serve as an advisory committee to MCEETYA and include experienced primary educators.
3. Before any syllabuses are adopted widely, education authorities should conduct trials to demonstrate that all schools are able to cover the essential content within 60 per cent of the allocated instructional time.
4. MCEETYA should produce a national position paper on the use of ‘high-stakes’ tests for school and teacher accountability; the paper should provide guidelines on how to avert potential negative consequences.
5. There should be an immediate strengthening of the capacity of primary schools to work with students in the middle- and upper-primary years who are failing to make progress in literacy and numeracy.
6. Funding for students with disabilities should be increased to a level that enables schools to provide for these students adequately in mainstream settings.
7. Special needs funding criteria should be extended by government authorities to make provision for students with highly disruptive behaviour and the necessary funds allocated accordingly.
8. Education authorities should ensure that all schools in their jurisdiction have the capacity to develop at least one subject other than English and Mathematics into an area of excellence through the use of specialist instruction. Funds should be allocated to enable the progressive development of specialist subjects identified by schools and their communities. Low-SES schools should be given priority.
9. MCEETYA should attach the highest priority to addressing the problem of ensuring that hard-to-staff schools have an adequate supply of able teachers.
10. Schools that are engaged formally in community development work should receive allocations for the coordination of activities that take account of the real costs of this kind of work to the school.
11. MCEETYA should adopt a common financial reporting instrument for government and non-government schools. The Australian Government’s Financial Questionnaire for non-government schools provides a model for an instrument that might be used across sectors.
The results of an annual cross-sectoral census should be reported in the National Report on Schooling, showing the distribution of incomes and expenditures per student for various sub-categories of schools.
Any member of the public should be able to retrieve from a national database the income and expenditure per student for a particular school for a recent financial year and compare it with like schools.
MCEETYA should also report in the National Report on Schooling the income and expenditure cost differentials for schools at each SES quintile.
12. Competitive grant mechanisms should not be employed to fund essential programs. The amount of primary school funding that is allocated on a competitive basis should be monitored and reported in the National Report on Schooling. The Report should specify successful applicants.
13. MCEETYA should develop a framework that makes explicit the shared and separate responsibilities of the Australian and State governments for funding primary schools.
xiii
14. Governments should adopt funding targets to increase differentially allocations to the primary schools in the greatest need. Recurrent grants should be scaled according to individual school SES indices such that schools with the greatest need are assisted by a factor of 1.5.
15. Provision should be made for the national school finance database to be accessed by independent researchers, subject to appropriate safeguards.
The Australian Government should fund a program of research into the cost effectiveness of interventions that have a prospect of enabling low-performing students to achieve the National Goals of Schooling.
Further, MCEETYA should undertake research on the efficacy of existing SES funding mechanisms. The research should examine the feasibility of adopting a common national framework so that stakeholders can be assured that the intentions of Australian governments to alleviate educational disadvantage have the prospect of being achieved.
16. A network is proposed of approximately 200 representative primary schools to assist governments to improve policies that impinge on the educational work of primary schools. The schools should be drawn from all sectors and States and include a broad range of school and community profiles.
The Primary School Project should be managed and funded jointly by the Australian and State governments in such a way that all findings are released without prejudice: that is, determinations of responsibilities for funding primary schools will not be implied through the conduct of this work.
xiv

Introduction
This study examines the capacity of Australian primary schools to meet the challenges facing them. It is the fourth in a series of studies prompted by concerns among primary principals that the resources allocated by governments have not kept pace with rising expectations.
Background
The initial study began in 2000 with a survey of nearly 2,500 Australian government school primary principals.1 That survey revealed considerable disquiet about the level of resources available in primary schools and the ways in which they were allocated. It was also evident that the circumstances of schools varied considerably— particularly with regard to the socioeconomic profiles of the student intakes— and that the schools with the greatest needs were not being recognised adequately in resource allocation policies.
Principals from the non-government sectors felt that the findings also applied to their sectors and supported a program of further research under the auspices of APPA.
The survey of principals was followed in 2001 by a study of the history of the funding of primary schools.2 Primary principals were keenly aware that the recurrent expenditure for primary students fell well short of that for secondary students. The achievement of parity, the primary principals contended, would address the pressures their schools faced.
The findings from the second study showed that, from the earliest days of public funding for schools,
secondary schools had been funded at a higher rate per student than primary schools. One of the main reasons for the difference was that secondary schools provided subject choice for students, particularly in Years 11 and 12, so that they could meet the entry requirements of universities. Primary schools offered a common curriculum that could be provided at lower cost than the specialist secondary school curriculum. The historical study showed the disparity had narrowed progressively during the 1990s, although a discrepancy had continued. In 2005, for every dollar expended on each secondary student in the government sector, 80 cents were expended on each primary student. In the non-government sector, the ratio was $1: 66c.3
The third study, begun in 2002, was designed to complement the second. The historical study had been helpful in demonstrating the relative difference in per capita funding between primary schools and secondary schools. However, another way of approaching the concerns of primary principals was to investigate whether there was currently a sufficiency of resources.4 It was recognised that appeals to governments for additional funding were unlikely to succeed if they were based on an argument about correcting the historical imbalance without referring to the needs of schools.
The evidence collected for the third study was based on intensive case studies of 30 primary schools from all sectors and States. For the first time in Australia, data were collected on individual school resources, student intakes, staffing and curriculum and the interrelationships among them were examined.
A number of important findings emerged from the study, including those relating to inconsistencies in
1
The challenges
1

the distribution of funding, the overcrowding of the curriculum, the difficulties of providing for children with disabilities or severe behavioural problems, and the lack of resources for the intensive instruction of children struggling to make adequate progress. With regard to the overarching question of whether primary schools had sufficient resources to achieve the goals set for them by Australian governments, the evidence indicated that the answer was ‘no’. Only one principal was of the view that his school was funded sufficiently well to enable all of its students to meet the National Goals for Schooling. Others felt that they could claim to be meeting somewhat watered-down versions of the National Goals. The majority felt that the Goals were too ambitious, given their schools’ circumstances.
Despite the seriousness of its findings, the report of the third study did not produce additional resources for primary schools. However, the Commonwealth Minister for Education did commit to providing the means for APPA to conduct a further study on a larger scale. The terms of reference were to be broader than those for the third study, although they did encompass its core questions, making it effectively a pilot study. In particular, it was considered imperative to have a random sample of schools of a sufficient size to produce findings that could be applied generally to primary schools across Australia
Changing context
The second study had reported that governments had increased their per capita funding of primary schools in real terms throughout the twentieth century. In fact, since 1960, per capita allocations had doubled, allowing progressively smaller class sizes, enhanced designs for new schools, specialist programs and other benefits.5
Even so, most primary principals believe that managing primary schools and teaching in them have become more demanding. How can this be so? Feedback from principals collected during the first three studies pointed to a number of factors that appeared to have changed the working environment in primary schools significantly during the 1990s.
There was a strongly held belief among principals and teachers that there were increasing numbers of children beginning school who lacked the necessary social and language skills and the ability to concentrate. These
children rejected adult authority and lacked interest in the routines of the classroom.6
There are several plausible theories suggesting why this is likely to be the case. One is that societal changes have contributed to a breakdown of traditional family structures, the net effect of which is that children have less time with caring adults. Families are now more likely to have single parents or both parents in full-time work.
Another theory is that a significant number of these ‘difficult’ children have been habituated to a pattern of stimulation that is more immediate, and whose life outside school moves much faster and more erratically, than the life of the classroom.
There is no agreement about what precisely is producing the change, but the principals are confident that among the current generation of children starting school there are growing numbers who are disengaged from school and society.
There is another factor that has changed the profile of children starting school. Until the 1980s, it was thought that children with severe physical, mental or psychosocial disabilities were best educated and cared for in separate ‘special’ schools. These were staffed intensively and were costly to operate. Later, under pressure from the parents of these children, governments adopted policies that enabled children with disabilities to be integrated into regular classrooms.
Primary principals and teachers endorse strongly the inclusion of disabled children in their schools on both moral and educational grounds. However, governments ration carefully the support that is available to the classroom teachers of these students: much too carefully, according to those closest to the children concerned.
It is also the case that there are many students in schools whose learning is restricted because of some form of disability which is thought to be too mild to warrant additional resource entitlements. Principals believe that the criteria for special support are determined to a large extent on economic rather than educational grounds.
The adoption of new assessment and reporting policies by governments during the 1990s is having an impact
2
on schools that was not necessarily intended. The amount of testing required by authorities seems to be increasing. Teachers feel that although this enables them to measure their students against State and national standards (and is therefore of some value), the work involves additional tasks that distract them from teaching.
Accountability and compliance regimes have changed and may explain partly why many principals feel overburdened. A school’s performance on external tests is now on the public record in some jurisdictions. Test scores and the so-called ‘benchmarks’ are being used to calibrate the performance of principals and teachers as well as students. Public policies proclaim that all children can and should succeed at school, implying that it is up to the school to make sure that this happens.
The performance of exceptional schools, outstanding principals and excellent teachers—often measured by their students’ relative test performance—is celebrated by authorities with awards and public recognition, implying ‘if they can do it, so can you’. It is as though the eradication of ‘failure’ can be produced by government fiat and additional effort from teachers. Not every teacher takes this hyperbole seriously but its pervasiveness—and the infrequency with which it is challenged publicly—sends the message (as intended) that schools with below-average results have under-performing staff.
The crowded curriculum is not a new phenomenon: there has never been enough time to cover all the topics that young people ought to know about. This was true even when syllabuses were relatively succinct documents.
However, it does appear that the determination of what must be taught in the primary curriculum is more removed from principals than in the past. Ironically, the curriculum frameworks that replaced the syllabuses in the 1990s were based around eight broadly defined ‘key learning areas’, with the intention of giving teachers room to adapt the content to suit their local circumstances. Unfortunately, the gaps have been filled by mandates and assessments, with the result that the broad frameworks have become something of a trap: they are prone to the inclusion of new topics rather than the exclusion of those that are no longer relevant.
Instead of providing solutions to overcrowding, the broad curriculum frameworks now appear to be part
of the problem. Teachers and principals recognise that the school day is of finite length and, in order to squeeze new subject matter into the curriculum, something else must be squeezed out. It needs to be a zero-sum exchange, otherwise the curriculum becomes unworkable.
Higher expectations of what schools should be able to do, more children who are difficult to teach, more curriculum material to cover, and more assessment, reporting and public accountability are already evident. If this formulation is correct, then it is not surprising that primary school principals want more help. But what kind of help would enable principals and their staff to solve these problems?
What are ‘resources’?
The term ‘resources’ requires definition for the purposes of this study, since school resources can be conceived in various ways. In their most basic form, school resources can be equated with school finances. Thus, the resource level of a school can be quantified by aggregating the value of the school’s facilities, its savings, investments and borrowings, its voluntary contributions in cash and kind, and its income from government and non-government resources. In theory, the total accumulated wealth allows the school to acquire what it needs to support its teaching and learning activities.
A second way of construing resources is to list all the ‘things’ that the school uses to enable teaching and learning to occur: teachers and ancillary staff (human resources), buildings, books and so on. These can be listed on an item-by-item basis to produce a catalogue of the resources available.
These two approaches—aggregating dollars or things that dollars can buy—omit factors that are vitally important in enabling schools to achieve their objectives. For example, the capacity of the school community to contribute to the work of the school makes a big difference to its effectiveness. Parents can volunteer their time as ancillary staff, show moral support for the norms of the school, attend its functions and encourage the development of positive study habits.
Students are a resource, too. They can set the norms for behaviour and achievement for the whole class.
3

Good students are motivated, have the prerequisite language and social skills, show respect to teachers and are supported at home. They can make teaching look easy. The converse is also true. The nature of the student body shapes what the school is able to do with its ‘conventional’ resources and defines what is possible and not possible in the classroom.
Considering resources in terms of dollars and things implies that resources are concrete and inert. However, it is the way resources are used (or under-used) that determines their effect. This is why the level of resources in schools (as measured by indicators such as recurrent expenditure per student or average class size) has been shown in numerous research studies to have a weak or inconsistent relationship with student learning.7 To put it succinctly, extra resources can make a big difference to student learning outcomes, but only if they are used wisely. Transforming ‘inert’ resources into productive agents for improvement requires additional, less-tangible resources, such as leadership skills, high staff morale, community capacity and goodwill, and access to specialist support and advice. These qualities are hard to buy, tend to be ephemeral, and are often slow to develop.
Schools can nominally have the resources they need (defined narrowly) but not the capacity to meet expectations.
Resources and problem solving
Some problems faced by schools can be fixed simply with more funding. If a physical education program must be suspended during periods of extreme weather, building a suitable facility should solve the problem. If tests identify spelling as an area of weakness, then the staff can seek advice about professional development and learning programs to improve spelling. If students are coming to school hungry, then a breakfast program and emergency lunches are likely to be immediate responses. The majority of problems faced by primary principals, however, are not so straightforward.
Some are complex and a multitude of interacting factors need to be taken into account. The pressures on schools with concentrations of children who are difficult to teach are a case in point. Do these schools need more resources? The earlier APPA studies suggest that they do. However, it is improbable that a small increment in funding will turn things around; many
factors come into play. The solution may also lie in the hands of officers who are located a long way from the school and set the regulatory, curriculum and staffing parameters for the system or the State. In fact, in some cases, there may be no immediate solutions because money cannot buy what is needed.
It is also the case that some problems could be solved by changing the policy frameworks surrounding schools rather than by adding new resources. Very often it is the policies that have precipitated the problem. One way to attempt to alleviate the pressure might be to allocate more resources to schools: for example, better software, more teacher aide time, earlier school starting ages, parenting programs and more suitable curriculum materials.
These additional resources may help address a specific problem but they also add to the complexity of the teachers’ work and extend its scope. Furthermore, critics would argue that the additional resources are seldom sufficient to solve the original problem completely so teachers are obliged to overload or cut back on some other activity.
Another way to solve these problems might be to recast the burgeoning expectations.
Conclusion
The quantity and kind of resources needed by primary schools is a function of what they are expected to do.
If the expectations expand and the scope is broadened then, other things being equal, more resources will be required. However, the converse is also likely to be true. There is the option of doing less in such a way that it is done well. If this is successful, it may also avert some of the demand for more resources. To quote an early twentieth century Australian educator: ‘Children might learn less but understand more’.8 This would require a change of approach by governments. The breadth of the curriculum and its sensitivity to interest groups for augmentation is a major driver of costs and source of pressure.
It is also the case that if governments are serious about achieving the stated goal of all children achieving high standards in the core areas of the curriculum (this reflects their current stated position), then they need to be prepared to escalate substantially their funding for
4

students struggling to make progress. Such students are ‘resource intensive’, because they require programs tailored to their needs. This would necessitate the greater concentration of resources in those schools with greater numbers of these students. If governments mean most students, not all students, then they ought clarify this point. Not to do so is to allow primary schools to continue to be subjected to an unfair burden of responsibility.
The argument presented in this opening chapter, which is based on the earlier APPA studies, can be represented
5
in the form of a simple equation in which the resources needed by a school (setting aside the number of students) are a function of three factors:
Resources needed = f (performance expectations × curriculum breadth and depth × student prior cognitive skills and disposition to learning)
In this study, these three factors, together with the available resources, have been investigated in a random sample of 160 Australian primary schools.

6

Introduction
There is no firm agreement among stakeholders about the core purpose of primary schools. Hence, important policy decisions are made routinely without reference to a clear and authoritative public position regarding purpose. The consequence of this is that there is a tendency for primary schools to acquire new responsibilities without shedding old ones.
The confusion about the purpose of primary schools makes it difficult to determine what resources they need. If their goals are defined narrowly, then the resources required are far less than if they are defined broadly.
This chapter considers historical, contextual and political events that have shaped primary schools. All of these are important in considering their purpose.
Children
The place of the child
The advent of the kindergarten movement and the establishment of infant schools around the turn of the nineteenth century provided an intellectual fillip to primary education in general. Infant schools were sometimes independent of middle- and upper-primary schools, while in other cases they were subjected to the authority of primary principals.
The infant schools drew their inspiration from eighteenth and nineteenth century thinkers—in particular, Rousseau, Pestalozzi, Froebel, and, later, Montessori—and the American philosopher, John Dewey. They argued that schools should become child-centred: that is, the starting point for formulating the
aims of primary education should be the wellbeing of the child. Their ‘progressive’ thinking was a reaction against highly formalised and authoritarian schools that valued rote learning and harsh discipline, and influenced senior public educators in Australia.
In practice, what does it mean to be ‘child-centred’?
Rousseau proposed that the curriculum be organised on the basis of what a child was capable of learning rather than on what authorities deemed he or she ought to know. This view was later to be given a scientific foundation by the work of developmental psychologists.
Pestalozzi developed the theme that the purpose of education was the development of the whole child: ‘hand, heart and mind’. This view implied that the social and moral development of the child deserved a prominent place in the primary curriculum, together with cognitive development.
Froebel saw education as an unfolding (developmental) process that occurred through play and art and crafts. However, the view that play had an important place in school was an anathema to some critics, who saw it as simply a waste of time. Montessori regarded play as ‘children’s work’: that is, not as an end in itself but as a step toward more structured learning experiences.
Dewey argued that the aim of education was to teach people to solve everyday problems in a practical and socially responsible way. He rejected the structured, teacher-centred formalism of traditional classrooms, contending that learning should be active and there should be opportunities for children to choose what they wanted to do.
2
The purpose of primary schools
7

Generally, these educators and their followers were dismissive of the idea that the purpose of schools should be to transmit ‘inert’ bodies of knowledge organised into ‘subjects’.
A good example of how they shaped educational thinking can be found in New South Wales over a century ago. On becoming the Director of Education in 1905, Peter Board launched a revised primary syllabus and Percival Cole, a noted educationist of the 1920s, remarked later:
The ‘New Syllabus’ included a number of radical reforms – that the principle of the correlation of subjects should be practically applied, that the self-activity of the pupil should become the basis of school instruction, that the teacher should come into closer touch with the pupils’ homes and surroundings, and that the school should be made a powerful agent in the intellectual, moral and social development of the pupil.9
The merit of the reforms, according to Cole, lay in ‘their obedience to the laws of child psychology’, because ‘the child was placed in the centre’ allowing the school to become ‘a happy and congenial paradise of childhood’.
Attachment to these ideas has waxed and waned over the decades in primary schools. Echoes can be heard today, even though teachers may be hard pressed to identify their origins. They are more likely to be familiar with the work of the developmental psychologists, who found considerable common ground with the philosophers and were able to give many of their theories a scientific basis.
Developmentalism
The developmental psychologist, Jean Piaget, has had an extraordinary influence on primary education. Although his theories were developed fifty years ago and some of the ideas have been shown to be flawed in certain respects, his notion of developmental stages continues to be applied widely among primary school educators.
Piaget advanced the theory that children passed through four developmental stages:
• a sensori-motor stage between birth and approximately two years of age;
• a pre-operational stage from two to six years;
• a concrete operations stage from seven to eleven years; and
• a stage he called ‘formal operations’ through adolescence and adulthood.
The theory implied that the capacity of children to understand phenomena was tied to their developmental stages, so it was unhelpful to assign tasks to them that they were not yet ready to accomplish. As most primary children were at the stage of concrete operations, their school learning should be organised around the manipulation of concrete objects and first-hand experience. More ‘formal’ (that is, abstract) learning should be deferred to a later stage.
From the work of Piaget, the concept of ‘readiness’ gained wide support. It held that teachers should begin instruction in reading and other comparable cognitive tasks only after children had demonstrated that they had reached an appropriate level of intellectual development: that is, they were ready to learn. To begin instruction too early could confuse the child and damage his or her self-esteem.
The influence of developmental psychology is evident in official statements of the aims of primary education published by education authorities during the 1970s.
Those from New South Wales and Tasmania provide good examples.10 The Director of Primary Education in NSW wrote in 1977 in the foreword to a departmental document on the aims of primary education:
The child is the focus of the educational enterprise. Therefore a statement of aims is concerned essentially with child development. Aims provide criteria for the determination of priorities and principles for implementation.11
These statements urged primary teachers to embrace Piagetian theory. The thinking is also evident in the literacy and numeracy programs used widely in Australian schools: for example, First Steps in WA and the Early Years Literacy Program in Victoria. Developmental psychology provided the early childhood educators with a scientific foundation for their beliefs and has been a cornerstone of teacher education.
From the perspective of developmental psychology, the challenge for the teacher is to establish the best possible fit between the child’s level of intellectual
8
development and the curriculum: teachers need to work from developmentally appropriate curriculums.
The developmental perspective continues to have wide support among primary teachers, particularly those who teach in the early years. Most are familiar with key ideas associated with Piaget and, for example, Lev Vygotsky, Jerome Bruner, David Elkind and Howard Gardner, even if they do not recognise the names of the scholars who first developed them.
Developmental approaches are now being challenged by educational improvement models driven by assessment and accountability regimes. Teachers are under increasing pressure to teach to improve test scores rather than to take account of children’s stages of development and readiness to learn.12 This tension illustrates the problems that arise when purposes are contradictory.
Society
Economics
Most governments see the quality of their education systems as a key to economic growth and prosperity. Schooling is considered to be a way of ‘building human capital’: that is, generating a workforce that is highly skilled and innovative, so that the State and nation can compete successfully in the global marketplace. Economists encourage governments to invest in education (or human capital) because to do so will lead to a more productive economy.
Viewing educational funding as an economic investment encourages schooling to be framed in the terms used by economists. The complex process of schooling is reduced to a series of variables (inputs) that yield outputs and outcomes. Economists are interested in calculating the mixture of inputs that will maximise the desired outcomes. This equation is referred to as a production function.
Modelling schooling as a process of turning inputs into outcomes simplifies hugely the work of schools. The unmeasurable complexity is left out of the equation, telling only part of the story. The higher moral purpose of education appears to teachers to be overridden by economic concerns.
Most primary educators recognise that governments need to know whether schools are performing
effectively and whether funds are being put to good use. They also accept that schools should be helping students acquire foundational skills so that they can complete their education successfully and become productive citizens.
Further, they cite the work of economists, pointing out that failure to invest in the early years can have costly consequences, causing many young people to later drop out of school.
National Goals of Schooling
The official statement of purpose for Australian schools is the National Goals of Schooling for the Twenty-first Century, a two-page statement endorsed by all Australian governments in 1999.13 It listed eighteen goals that should be reached by all students by the time they completed their secondary schooling. These goals spanned personal and moral development, academic learning and equity and social justice.
The National Goals statement assumed that although schools functioned under diverse circumstances, they should aim to achieve common goals that had been endorsed by governments. The National Goals were expressed in broad and inclusive terms so all governments and education authorities could comfortably become signatories. While the National Goals statement specified the ends of schooling, it was silent on the matter of the means. Questions of pedagogy, for example, were thought to be professional matters that were better left to education authorities and teachers.
The National Goals statement did not attempt to differentiate the purposes of primary and secondary schools: they were assumed to be the same. All schools were expected to work towards the same broad outcomes. The learning targets were so encompassing that it is hard to imagine any that might have been excluded. Users were not invited to choose from among them nor to include others.
It is noteworthy that the National Goals statement did not explain why these particular goals had been chosen. The statement was not designed to prompt debate. There was no suggestion that articulating the purpose of primary schools was a challenging, problematic process. The virtue of the National Goals statement lies in its brevity.
9

The assessment of a sub-set of the National Goals—in particular, those related to literacy and numeracy—has driven the national debate on the quality of schooling.
Priorities versus purposes
While endorsing the National Goals, the States, which have administrative responsibility for schooling, have their own methods for steering school education.
These methods are consistent with the National Goals as they have emerged from the same administrative origin: a belief that clear statements of outcomes coupled to a robust student assessment regime is the best way of ensuring that schools are doing what they are supposed to do.
Systems produce strategic plans, from which schools are expected to derive their own operational plans that take account of their individual circumstances. These strategic plans respond to government priorities, which may be modified from year to year. It is also common practice to provide performance targets that schools are expected to build into their own plans. In theory, schools have considerable latitude to decide how to reallocate the resources available to them but they are expected to align them in ways that maximise their prospects of achieving the designated outcomes.
Thus schools are tied to the priorities of the governments of the day. Non-systemic schools have more latitude to function in the ways they choose, but they must operate within the regulatory frameworks set by governments and must comply with government priorities if they want access to funds allocated for designated purposes. In such circumstances, there is little opportunity for philosophising about the purpose of primary schools.
The primary school
Broadening the scope
It could be argued that, today, the purpose of primary schools is to achieve the priorities set for them by governments. Primary schools are being asked to assume responsibility for not only the academic growth of students but also for solving problems such as rising levels of childhood obesity and anti-social behaviour.
The public expects governments to deal with complex social problems. Governments in turn expect schools to help with the solutions. This situation makes primary
schools vulnerable to an expansion of purpose and constantly shifting political agendas for action.
Primary schools are also vulnerable because they are exceptionally convenient ‘collection points’ for children: they lend themselves to becoming sites for the delivery of medical and social services. According to this perspective, to confine the schools’ activities to an unduly narrow purpose would be to waste the opportunities they provide.
This kind of pressure is not new. A Victorian education department report of 1970 observed:
All things educative are considered desirable by most people, but this does not imply that all things desirable automatically become the task of the school. Problems created by public acceptance of a broadened definition of education are not to be solved simply by broadening the task of the school. A fair share of responsibility must continue to be borne by the family and by other social institutions.14
This view is well understood by primary school principals and teachers.
Seamless transitions
The beginning and end of primary school are now more blurred than in the recent past.
Younger children are being brought onto primary school sites with the co-location of childcare facilities. These are needed to assist working mothers, particularly those whose families span the pre-school to primary years. Schools are under pressure to make such services available because, if they do not, families with working mothers will go elsewhere. Over time, this will undermine enrolments and change the profile of the schools’ enrolments.
In the senior-primary years, increasing numbers of middle schools have blurred the transition to secondary education. Middle schools are justified by arguments that early adolescence should be seen as a separate stage of development and claims that puberty is starting earlier than in the past. The grouping of upper-primary and lower-secondary students in the one school (or sub-school) causes stand-alone primary schools to lose enrolments and the contributions of their senior students.
10
Child health policy is also influencing the starting point for primary education. There is a powerful medical constituency lobbying for health, social and educational support for mothers of children aged up to three years. The role of child health in early childhood education has increased, leading to intervention programs involving parents and young children, sometimes provided through primary schools. Primary principals are aware of the value of early intervention and so find themselves allowing these children to fall within the ambit of their responsibilities.
It is ironic that the developmental theories that shaped the distinctive character of the primary school are now providing justification for structures and policies that undermine its unique identity. This is not surprising, as the continuum of human development stretches from birth to adulthood. However, it is important that the institutional identity of the primary school is neither lost nor miscast because of government interventions elsewhere in the developmental continuum.
Leadership
State departments of education were once organised along divisional lines. Primary divisions were led by directors who administered with the assistance of teams of inspectors, usually senior primary school principals. Decisions about curriculum, assessment, pedagogy, staffing, school design and standards of performance, for example, fell under the aegis of the primary directors, who principals saw as the most senior advocates for their cause.
During the 1980s, State governments began to restructure their departments of education along functional lines, abolishing the positions held by their divisional directors and inspectors. The divisions were replaced by directorates with generic responsibilities across primary and secondary schools for curriculum, finance, human resources, accountability and other core functions. It was thought that the new structures would improve efficiency and enable schools to respond more effectively to government priorities by replacing divisional loyalties with a commitment to ‘the corporate good’.
Some primary school principals regarded the break with tradition, if it was accompanied by delegated powers, as being liberating, reporting that they had more capacity under the new arrangements to improve their schools.
Others argued that the net effect had been to underplay the positive and distinctive features of primary education.
Conclusion
There is no basis, other than government mandate, for deciding whether any particular activity belongs properly in the primary school. As a result, many primary school principals feel that, without an emblematic statement of purpose, the identity of the primary school and its traditions, built up over the past two centuries, are being eroded, with a consequential effect on morale and effectiveness.15 This concern explains some of the gloomy responses of primary principals to the survey conducted in 2001. The lack of clarity has meant that it is hard for school principals to rebuff demands made of them, demands that so often appear to arise adventitiously.
The question of whether primary schools have sufficient resources to get the job done begs the prior question: What exactly is the job? Until the purpose is made clear, then it is impossible to conclude whether primary schools are resourced adequately or not. Without a clear rationale, resources are allocated arbitrarily or on bases that are related only tangentially to what schools ought to be doing.
Recommendation
1. All Australian governments should endorse a comprehensive statement articulating the special purpose of primary schools.
11

12
3
The primary curriculum
Introduction
The curriculum is the pivotal consideration around which resource issues are resolved. Therefore the question of what is taught is central to a discussion about primary school resourcing.
Over recent decades, the tendency has been to add new subjects and broaden the scope of some of the existing subjects without taking account of what is humanly possible in a finite period of time. As a result, principals and teachers have expressed serious concerns about the continuing expansion of the primary school curriculum.
This chapter begins with an outline of the historical context from which today’s primary school curriculum has evolved. Next, data are presented on the use of instructional time provided by primary school teachers, together with principals’ and teachers’ reflections on their capacity to meet the expectations placed on them.
Discussion of the overcrowding of the curriculum (and strategies for addressing this problem) follows. The final section explains the relationship between the primary curriculum and school funding.
Historical context
Departmental syllabuses
The concept of the common primary curriculum prevailed during the twentieth century in public school systems. State departments of education issued syllabuses for subject areas and provided clear guidelines on a year level-by-year level basis on how schools were expected to apportion their instructional time. Inspectors ensured compliance. For example, the revised 1955 Western Australian Education Department
syllabus in arithmetic detailed in two-and-a-half pages the subject matter required for each grade (year level): the entire syllabus ran to only 16 pages.16 The progression of arithmetical operations that students were expected to accomplish from year to year was made clear.
A small amount of variation was allowed: teachers were urged to adapt their instructional methods to suit the abilities and backgrounds of students. In these departmental syllabuses, every effort was made to ensure that all students, irrespective of their family circumstances or where they lived, had access to a comparable quality of education. It was common for departments to augment the syllabuses with documents suggesting how schools might be organised and teachers might teach the content of the syllabuses. The documents also reminded teachers of the aims of primary schools, the scientific basis for good school organisation and teaching, and the broader context in which the subject matter was to be interpreted and taught. Authorities warned of the negative consequences of allowing subject matter considerations to dominate instruction in primary schools ahead of the developmental and social needs of the children.
Directors-general controlled the process of curriculum development. By today’s standards, the process was relatively slow moving and uncomplicated. There was no national level of activity of any consequence until the 1970s. Changes to the curriculum tended to be introduced on an incremental basis. It took considerable time and effort to complete the deliberations and then publish and disseminate the documents.
Non-government schools were not required to adopt the government school syllabuses, although many used them as bases for planning their own curriculums.
13

A few independent schools operated outside the departmental frameworks and elected to adopt curriculums based on the distinctive philosophies of educators such as Maria Montessori, Rudolf Steiner and A. S. Neil.
Since the 1970s, there have been three main changes to decision making about what is taught in primary schools:
• there is stronger control by governments of school education matters, including the form and content of the curriculum;
• the emergence of national agendas, agencies and funding sources has added a layer of complexity; and
• the curriculum and standards frameworks are more comprehensive and sophisticated than the syllabuses they replaced.
Ministerial control
The restructuring of the State education departments during the 1980s and 1990s was designed to place them under more direct ministerial control. The position of Director-General was symbolically retitled ‘Chief Executive Officer’ in some jurisdictions; the job was defined in managerial terms and it was not uncommon for the head of a department of education to be appointed without previous teaching or school administration experience. Ministers announced major decisions about the curriculum and their offices were open to advocates for change. While ministers still sought advice from their departmental officers, control no longer lay in the hands of education bureaucrats.17
One of the consequences of increased government control has been the opening of curriculum policy to wider public debate and, as a result, making it more sensitive to public opinion. Since curriculum developments reflect community values, these developments are now more likely to be disputed publicly and this disputation resolved through political processes. As a result, coherence and predictability have been harder to attain.
National activity
The changes within the State systems were accompanied by changes at the national level. The massive injection of Commonwealth funding, following the establishment of the Schools Commission, provided
a powerful stimulus for curriculum development. Although the Commonwealth did not have constitutional responsibility for administering schools and setting the curriculum, it was able to introduce curriculum change through the power of its purse. The Schools Commission did not seek to control the syllabuses, but from time to time it identified national priorities to which resources were allocated through special programs: these programs often influenced curriculum decision making. Another national body, the Curriculum Development Centre, also shaped the school curriculum by providing leadership in that field.
After the abolition of the Schools Commission in 1987, the Commonwealth continued to identify priority areas and direct funding to them.
The States also extended their use of this practice. The coupling of government priorities and targeted funding increased the complexity of the curriculum, even though the process brought additional resources into schools.
The active role of the Commonwealth in setting educational policy elevated the importance of the annual meetings of all ministers for education (the Ministerial Council on Education, Employment, Training and Youth Affairs, which superseded the Australian Education Council). MCEETYA, which has a secretariat and working parties supported by State and Commonwealth officers, is very active in many areas of the curriculum.
Curriculum frameworks
Using planning concepts borrowed from the business community, the developers of new curriculum statements sought to shift the emphasis from teachers’ instructional inputs to students’ achievement of specified standards of performance. In 1991, the State and Commonwealth Education Ministers agreed to produce national curriculum statements for primary and secondary schools based on eight ‘key learning areas’. These statements represented a radical shift in curriculum documentation from traditional syllabuses to declarations of the educational outcomes sought. The responsibility for developing the frameworks remained with State curriculum bodies.
During the early 1990s, State frameworks were developed through a process of collaboration that allowed individual jurisdictions to adapt the national
14
prototype to suit their own constituencies. The result of the collaboration and the processes employed meant there were as many similarities as differences in the statements produced by the States.18
The change in most States from a reliance on syllabuses to an outcomes-based curriculum framework was intended to free teachers from unreasonable expectations of content coverage and enable them to draw only on material needed to achieve explicit outcomes. It was expected that this approach would reduce the pressure on teachers and provide them with more professional discretion.
The net result of all these developments was stronger government control, funding tied to curriculum change, the alignment of the curriculum in the government and non-government sectors, a much greater degree of national activity, and the establishment of cross-sectoral boards of studies. The capacity of central authorities to reshape, resource and supervise the primary curriculum was enlarged greatly. The bureaucracies that now work at the State and national levels have a much greater capacity to generate curriculum ‘output’ than the departments of education of several decades ago; and, what is more, they are highly sensitive to political and interest group agendas.
Subject emphases
With the exception of the kindergarten years, the amount of instructional time per week has been constant for over a century: depending whether recesses are counted or not, there are about 1,500 minutes (25 hours) in the school week. One of the most robust findings in research on teaching is that students’ learning of concepts and skills is tied directly to the amount of time allocated: the more time the better the performance.19 Hence, the amount of time allocated for a particular learning area is indicative of its importance in the totality of the curriculum.
English and Mathematics
Up to the twentieth century, the elementary school curriculum was truly elementary: over three-quarters of the time was spent on literacy and numeracy. This emphasis declined during the early twentieth century to make more room for other curriculum areas, such as History, Geography and Health and Physical Education. The savings were found by reducing the time allocations for Transcription and Penmanship and by trimming the syllabus for Arithmetic. By the
1920s, the recommended allocations for English and Arithmetic amounted to slightly more than half the total instructional time.20
In the 1960s, there was a further significant revision of the curriculum. The subject Arithmetic was transformed into Mathematics with the object of reducing the emphasis on rote learning and enabling students to develop an understanding of mathematical concepts such as number, space and measurement. Unlike Arithmetic, Mathematics consisted of much more than the mastery of computational techniques and the solving of standard problems. The net effect was to extend the scope of what children had to understand and do, although the time allocated remained the same.
Social Studies
By the 1960s, a synthesis of History, Geography and, to some extent, other social sciences, such as Economics and Political Science, which was known as ‘Social Studies’ (the predecessor of Studies of Society and Environment), occupied a much more significant status in the primary curriculum than is the case today. The 1961 policy statement on the New South Wales primary curriculum recommended that, while there might be some re-balancing among the other subjects, the time allocated to English, Mathematics and Social Studies should not be reduced. The time allocation recommended for Social Studies was the same as that recommended for Mathematics and about four times the amount allocated for Science.21
In the foreword to the 1962 revised edition of the Western Australian Curriculum for Primary Schools, it was stated that in view of the economic growth occurring in the State, it was important to reconsider the appropriateness of the aims and values that should underpin the revised syllabuses:
The emphasis is on character building, for the need in this country in the years to come will be for citizenship in the highest sense of the term. In the fundamental skills, the emphasis is on ‘thoroughness’ not only as a means of training character, but also as a foundation for technical competence which will also be needed greatly in our progress.22
Through Social Studies, teachers were urged to develop awareness of others, social responsibilities and high moral principles. They were also advised to encourage students to practise these traits in all their school experiences.
15
In the 1962 WA syllabus, ‘Social and Moral Education’ incorporated six subjects: Scripture, Social Studies, Current Events, Citizenship, Safety First and Morning Talks. The sub-set of Social Studies units—Current Events and Citizenship—was allocated 255 minutes (17 per cent of the school week) by Grade 6.
Science
Historically, ‘Elementary Science’ was not given as much time as Social Studies.
Science in the primary curriculum had a strong ‘nature study’ orientation: the life cycles of frogs, the growth of plants, changes in the weather. Primary schools explored the immediate world of children and sought to promote their curiosity, not to lay any foundation for the secondary curriculum. Formal Science instruction by specialist teachers began only in the first year of secondary schooling.
In 2002, the Commonwealth undertook a review of the teaching of Science, Mathematics and Technology in Australian schools, prompted by concerns that these learning areas needed to be strengthened in order to keep pace with demands for qualified graduates.23
The report of that inquiry observed that in primary schools, Science was ‘often either not taught or not taught systematically’. One of the issues referred to the committee of inquiry was the uncertainty among primary teachers about how best to teach Science and the teachers’ relatively low levels of interest and academic attainment in both Science and Mathematics. The report did not recommend increasing the time allotted to Science in the primary curriculum, recognising that, before this could happen, there would need to be a higher level of scientific competence among primary teachers and improved infrastructure for science teaching.
Technology
Until the 1960s, technologies such as Needlework and Manual Arts were taught to girls and boys respectively.
The introduction of ICT to the primary curriculum is a relatively recent initiative and it now constitutes an additional subject.
The use of the term ‘Technology’ as a subject name has proved to be a problem in this study. In some States, ‘Technology’ is the name used to describe ICT. In others, the subject Technology requires students to
design something: for example, a model or a tool, make the object they have designed, and then appraise this work. This process may involve ICT but often does not. Cooking, for example, is classified as part of the subject Technology.
Languages other than English
Foreign languages used to be seen as an area of study only for academically able students. In the 1990s, this view changed when most States introduced Languages other than English (LOTE) into primary schools as part of their commitment to the National Goals for Schooling. In 2005, a national taskforce found that half of all students were learning a language in mainstream schools and that of the 146 languages being taught, six (Japanese, Italian, Indonesian, French, German and Chinese) were being studied by more than 90 per cent of students.24
In an APPA review of LOTE provisions in a sample of 665 primary schools in 2002, 10 per cent of respondents stated that they did not offer LOTE programs. A third of the principals of schools that taught a LOTE said they would prefer not to offer the subject because they were unable to provide a high-quality, coherent program. Some principals reported that LOTE was of lesser importance than other subjects. In the majority of schools, principals indicated that LOTE was supported strongly and running successfully.25
The Arts
The Arts is an integral part of the primary school curriculum. In its most basic form, it is likely to consist of drawing or painting, singing and presentations for parents at school events. Some schools extend their participation in The Arts to include full-scale performances involving instrumental music and the dramatic arts. The Arts can transform a school into an ebullient and creative environment that infuses enthusiasm into the rest of the curriculum.
The configuration of subjects constituting The Arts changed during the twentieth century. Historically, art and music were separate subjects and drama was not included. Craft was often associated with art. During the 1930s, the NSW Education Department recommended 180 minutes per week be allocated to art and music at all year levels.26 This was increased during the 1960s, with 375 minutes being recommended for
16
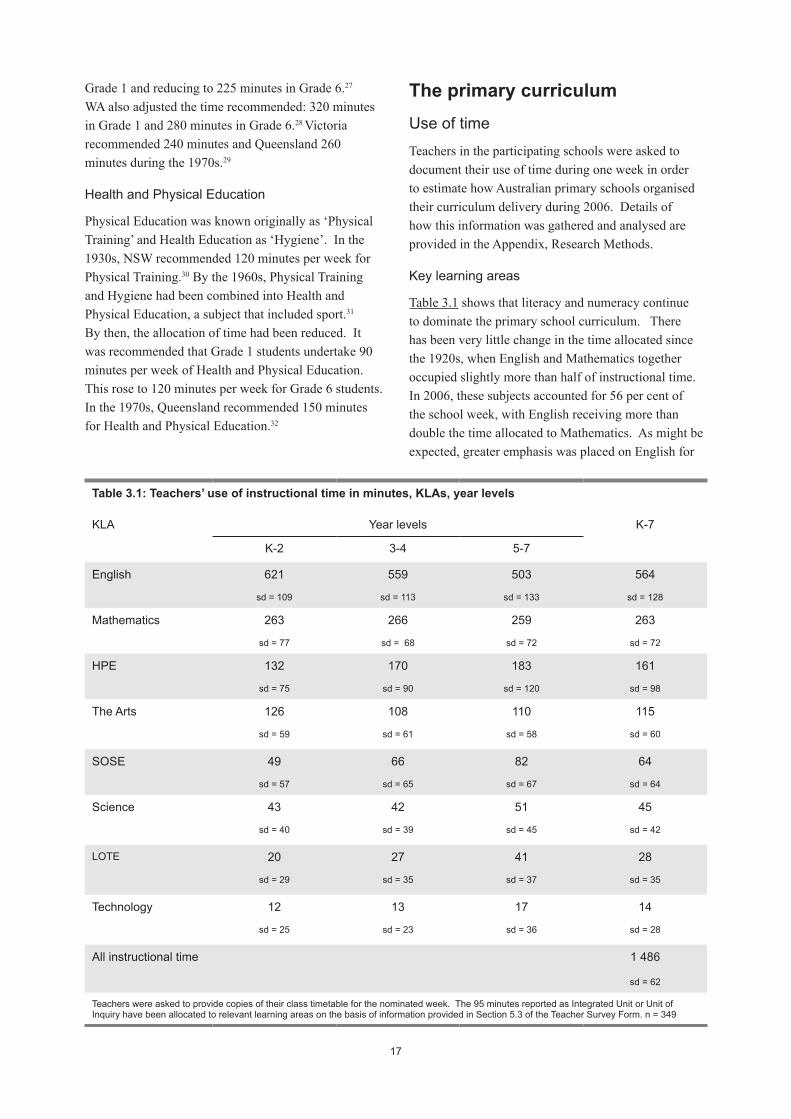
Table 3.1: Teachers’ use of instructional time in minutes, KLAs, year levels
KLA Year levels K-7
K-2 3-4 5-7
English 621 559 503 564
sd = 109 sd = 113 sd = 133 sd = 128
Mathematics 263 266 259 263
sd = 77 sd = 68 sd = 72 sd = 72
HPE 132 170 183 161
sd = 75 sd = 90 sd = 120 sd = 98
The Arts 126 108 110 115
sd = 59 sd = 61 sd = 58 sd = 60
SOSE 49 66 82 64
sd = 57 sd = 65 sd = 67 sd = 64
Science 43 42 51 45
sd = 40 sd = 39 sd = 45 sd = 42
LOTE 20 27 41 28
sd = 29 sd = 35 sd = 37 sd = 35
Technology 12 13 17 14
sd = 25 sd = 23 sd = 36 sd = 28
All instructional time 1 486
sd = 62
Teachers were asked to provide copies of their class timetable for the nominated week. The 95 minutes reported as Integrated Unit or Unit of Inquiry have been allocated to relevant learning areas on the basis of information provided in Section 5.3 of the Teacher Survey Form. n = 349
Grade 1 and reducing to 225 minutes in Grade 6.27
WA also adjusted the time recommended: 320 minutes in Grade 1 and 280 minutes in Grade 6.28 Victoria recommended 240 minutes and Queensland 260 minutes during the 1970s.29
Health and Physical Education
Physical Education was known originally as ‘Physical Training’ and Health Education as ‘Hygiene’. In the 1930s, NSW recommended 120 minutes per week for Physical Training.30 By the 1960s, Physical Training and Hygiene had been combined into Health and Physical Education, a subject that included sport.31 By then, the allocation of time had been reduced. It was recommended that Grade 1 students undertake 90 minutes per week of Health and Physical Education. This rose to 120 minutes per week for Grade 6 students. In the 1970s, Queensland recommended 150 minutes for Health and Physical Education.32
The primary curriculum
Use of time
Teachers in the participating schools were asked to document their use of time during one week in order to estimate how Australian primary schools organised their curriculum delivery during 2006. Details of how this information was gathered and analysed are provided in the Appendix, Research Methods.
Key learning areas
Table 3.1 shows that literacy and numeracy continue to dominate the primary school curriculum. There has been very little change in the time allocated since the 1920s, when English and Mathematics together occupied slightly more than half of instructional time. In 2006, these subjects accounted for 56 per cent of the school week, with English receiving more than double the time allocated to Mathematics. As might be expected, greater emphasis was placed on English for
17
young children. The time allocated to Mathematics, however, was fairly constant across the year levels.
The time allocated to Science also proved relatively constant, at 45 minutes per week.
The subject that showed the most dramatic reduction in time relative to its precursor—Social Studies—was Studies of Society and the Environment. This is evidence that priorities change, possibly unintentionally. It seems likely that this reduction is a result of competition from other subjects, rather than a plan to reduce its importance. The time allocated to Health and Physical Education was consistent with the time recommended for related subjects during most of the twentieth century. The majority of this time was allocated to Physical Education (68 minutes) and Sport (65 minutes). Health Education incorporated a wide range of topics influenced by health promotions initiatives.
The allocation of time to The Arts was a little less than 120 minutes. The mean time reported for the visual arts, a category that included craft, was 56 minutes. The mean time reported for music taught as a class group (including choir taught during class time) was 33 minutes. Most of these lessons were taught by class teachers, as less than half the schools in the study (47 per cent) reported having specialist music teachers. Performing arts were allocated 21 minutes per week and instrumental music taught to whole classes (as distinct from lessons taught to individual students withdrawn from classes) five minutes per week.
The high standard deviation for LOTE relative to the average time allocated suggests that the problems described by APPA in 2002 have continued. While many primary schools had successful LOTE programs, Table 3.1 indicates that not all primary schools were able to offer courses in LOTE. This is supported by information provided by principals about specialist teachers; as only 58 per cent of the schools reported having LOTE specialist teachers, it is likely that 42 per cent were unable to offer a LOTE to their students. This indicates a decline in provision since 2002.
In addition to the time allocated to the eight key learning areas, teachers were asked to report whether they taught any Integrated Studies units. If so, they were asked to provide sufficient information to enable the time allocated for Integrated Studies to
be reallocated to relevant KLAs. The average time allocated to Integrated Studies was 95 minutes per week.
While three-quarters of teachers reported using at least one Integrated Studies topic, many did so by linking work in defined subjects. Time allocated to a particular subject would be used to make a contribution to a topic from the perspective of that subject: for example, a topic such as Antarctica would cover the climate and wildlife during Science while SOSE lessons investigated human exploration. Teachers also reported using relevant texts in English if suitable material was readily available. Another approach was to select a topic or, in the case of the International Baccalaureate, a Unit of Inquiry, and develop it holistically without allocating time to specific subjects.
A third of the time allocated to Integrated Studies was apportioned to English, despite the fact that many of the topics were similar to those previously taught as Social Studies or Science. Examples of these topics included Antarctica, animals, Korea, Japan, Indonesia and the solar system. The preference for classifying such topics as Integrated Studies is likely to be a result of the pressure teachers feel to teach everything: to allocate time to just SOSE or Science is no longer considered adequate. Many text-based subjects had a portion of the time allocated to literacy.
Other time allocations
The eight KLAs contained in the National Goals for Schooling were chosen as the curriculum framework for the study. While the framework had some shortcomings, it enabled the allocation of instructional time to be summarised across jurisdictions. The eight KLAs did not account for the whole school week, however.
Not every minute of the 349 teachers’ weekly timetables that were submitted has been categorised. On average, 25 minutes per week were not explained.
Usually this was because the teacher reported that a planned activity did not go ahead but did not explain what was substituted for it. It is likely that some of this time would have been used for finishing work and private study. This was a common use of time when a sub-group from the class was absent for another activity (for example, choir, band or sport) and the teacher was reluctant to present new work.
18

Table 3.2: Teachers’ use of instructional time in minutes, other than KLAs
Subject Time in minutes
Integrated studies 95
sd = 120
School assemblies 56
sd = 47
Religious education 53
sd = 71
ICT 39
sd = 41
Classroom activities 22
sd = 33
Homework 19
sd = 29
See Table 3.1 for explanatory notes. n = 349
Another 39 minutes were classified as ‘Other’. In this case, the classes’ activities were explained but did not fit readily into particular KLAs: for example, chess, senior students visiting local secondary schools for orientation, talks by local fire brigades, quizzes, team building, thinking skills and so on.
In addition to time classified as ‘Unknown’ and ‘Other’, there were some activities that occurred frequently enough to warrant a category of their own. These are reported in Table 3.2.
Religious education was allocated the most time outside the KLAs and more time than Science, LOTE and Technology. Teachers in Catholic schools allocated 158 minutes to religious education and independent schools 119 minutes.
Government schools allocated an average of 18 minutes per week to scripture. Although 39 per cent of government schools reported that they did not make scripture available, the remaining 61 per cent provided between 30 and 45 minutes. Scripture in government schools is usually taught by volunteers and is not always available on a weekly basis, with teachers reporting that the volunteers often missed sessions. In some schools, scripture included instruction in non-Christian faiths.
Much of the time allocated to ICT also involved the eight KLAs. The timetables submitted by teachers
suggested that ICT is an integral part of many school programs. The amount of time allocated to ICT varied according to the year level, increasing from 33 minutes in Years K-2 to 41 minutes in Years 3, 4 and 5, and 46 minutes in Years 6 and 7.
It is clear that school assemblies continue to be an important part of the primary school curriculum. In the 1960s, this time was classified as Social Studies because it was seen as an important method of developing among students a sense of belonging to the school community.
Assemblies also provide opportunities for class groups to perform in front of their peers and families.
The time classified as ‘classroom activities’ included morning routines such as recording attendance and ordering lunches, and afternoon routines associated with packing up for the end of the day.
Extracurricular activities
A range of extracurricular activities involving students was reported as occurring out of school hours during the nominated week, including choir, band, chess, sports such as netball and football, and the Active Schools Program.
Homework classes were also provided (although usually only for Indigenous students) and breakfast clubs were available before school for students who were not being fed regularly at home.
Only 8 per cent of teachers reported that students were involved in out-of-hours activities at their schools. The average period of time involved was 107 minutes and the longest allocation was 180 minutes.
Adequacy of allocations
Principals’ views
During interviews, principals were asked to rate the extent to which their schools were able to meet the curriculum expectations they faced.
Thirty-nine per cent said their schools could meet curriculum expectations and 26 per cent were neutral, while 29 per cent reported that some expectations could not be met.
The implications of this result were explored further, principals being asked to rate their school’s ability to
19

‘cover the expected outcomes’ in each of the eight KLAs.
Table 3.3 shows that principals reported English and Mathematics as the KLAs in which their schools were best able to meet expectations. They were least able to meet expectations in LOTE.
The 40 per cent of principals reporting that their schools’ curriculum coverage in LOTE was less than adequate is consistent with reports that 42 per cent of schools lacked specialist LOTE teachers.
Teachers’ views
It is interesting to interpret Table 3.4 in the light of the time allocations shown in Table 3.1. Generally, teachers felt most satisfied with the time allocated to English, the subject that consumed the greatest proportion of the nominated week. About a fifth of the teachers reported not having sufficient time for Mathematics. Like English, Mathematics is assessed externally and given priority status but allocated less than half the time.
Health and Physical Education has a substantial time allocation: only English and Mathematics are given more. Despite this emphasis, nearly a quarter of teachers reported that they had insufficient time. Such reports may have come from schools without
indoor spaces suitable for physical activity. Teachers expressed concern that they were not able to meet requirements for 120 minutes physical activity during extended rainy periods. Also, much of the time allocated to sport involved absences for interschool sports carnivals, often necessitating the splitting of classes. Although a whole day of school was often missed, it can be assumed that students were not physically active all day, as they travelled by bus, had to change their clothes and wait for their events to take place.
It is worth contrasting teachers’ views on SOSE and The Arts. While the time allocated to the former has diminished considerably since the 1960s, teachers have not shown a great deal of concern. This suggests they are not under pressure to do more in this area.
On the other hand, The Arts, although allocated more time than SOSE, seems to be causing more anxiety.
Forty per cent of teachers reported they had insufficient time available for The Arts. Clearly, teachers feel they should be doing more in this very broad area. While the content included in The Arts has expanded to include music, the visual arts, craft, the performing arts and dance, the time allocations have been reduced drastically.
Table 3.3: Principals’ ratings of their school’s coverage of the KLAs as a percentage
KLA KLA covered
Not at all Adequately Comprehensively
% % % % %
English 0 1 13 26 61
Mathematics 0 2 12 25 61
HPE 0 2 33 30 35
The Arts 0 17 52 28 3
SOSE 0 0 30 31 39
Science 0 13 39 22 26
LOTE 26 14 26 19 14
Technology 1 10 31 32 26
Principals were asked in Section 5.1 of the School Survey Form: ‘Please indicate with a cross (X) the extent to which the school is able to cover the expected outcomes in the learning areas listed below’. The total responses in each KLA may not add up to 100 per cent because of rounding. n = 157
20
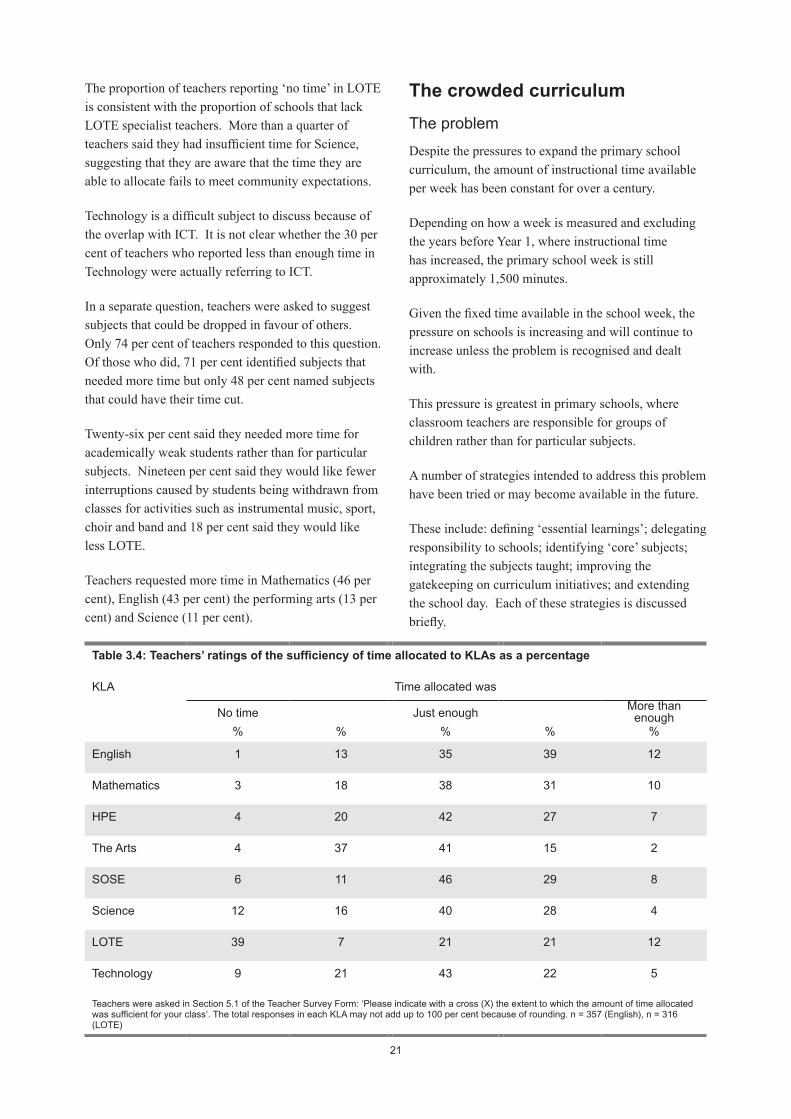
The proportion of teachers reporting ‘no time’ in LOTE is consistent with the proportion of schools that lack LOTE specialist teachers. More than a quarter of teachers said they had insufficient time for Science, suggesting that they are aware that the time they are able to allocate fails to meet community expectations.
Technology is a difficult subject to discuss because of the overlap with ICT. It is not clear whether the 30 per cent of teachers who reported less than enough time in Technology were actually referring to ICT.
In a separate question, teachers were asked to suggest subjects that could be dropped in favour of others. Only 74 per cent of teachers responded to this question. Of those who did, 71 per cent identified subjects that needed more time but only 48 per cent named subjects that could have their time cut.
Twenty-six per cent said they needed more time for academically weak students rather than for particular subjects. Nineteen per cent said they would like fewer interruptions caused by students being withdrawn from classes for activities such as instrumental music, sport, choir and band and 18 per cent said they would like less LOTE.
Teachers requested more time in Mathematics (46 per cent), English (43 per cent) the performing arts (13 per cent) and Science (11 per cent).
The crowded curriculum
The problem
Despite the pressures to expand the primary school curriculum, the amount of instructional time available per week has been constant for over a century.
Depending on how a week is measured and excluding the years before Year 1, where instructional time has increased, the primary school week is still approximately 1,500 minutes.
Given the fixed time available in the school week, the pressure on schools is increasing and will continue to increase unless the problem is recognised and dealt with.
This pressure is greatest in primary schools, where classroom teachers are responsible for groups of children rather than for particular subjects.
A number of strategies intended to address this problem have been tried or may become available in the future.
These include: defining ‘essential learnings’; delegating responsibility to schools; identifying ‘core’ subjects; integrating the subjects taught; improving the gatekeeping on curriculum initiatives; and extending the school day. Each of these strategies is discussed briefly.
Table 3.4: Teachers’ ratings of the sufficiency of time allocated to KLAs as a percentage
KLA Time allocated was
No time Just enoughMore than
enough% % % % %
English 1 13 35 39 12
Mathematics 3 18 38 31 10
HPE 4 20 42 27 7
The Arts 4 37 41 15 2
SOSE 6 11 46 29 8
Science 12 16 40 28 4
LOTE 39 7 21 21 12
Technology 9 21 43 22 5
Teachers were asked in Section 5.1 of the Teacher Survey Form: ‘Please indicate with a cross (X) the extent to which the amount of time allocated was sufficient for your class’. The total responses in each KLA may not add up to 100 per cent because of rounding. n = 357 (English), n = 316 (LOTE)
21
Essential learnings
Problems emerged even during the early stages of the implementation of the curriculum frameworks. It became apparent that initiatives intended— benevolently-to clarify learning outcomes for teachers had in fact overwhelmed them with atomistic detail and unintended fragmentation. There was a growing consensus that the new curriculum and standards frameworks were contributing to a crowded curriculum and encouraging a broad coverage of outcomes at the expense of depth of understanding.
States responded in different ways to the concerns they identified. Education authorities in Queensland, Tasmania, South Australia, the Northern Territory and Victoria developed essential learning frameworks to be considered in conjunction with the curriculums already in place. Other States sought to clarify the core or foundational learning in their curriculums by modifying their existing frameworks.33
It is important to note that the curriculum writers chose to define ‘essential learnings’ in terms of overarching goals or outcomes rather than the core knowledge and skills that children should acquire at different year levels. This gave the appearance of reducing the scope of the curriculum, because there were fewer categories or headings. However, this approach left unresolved the question of whether some content was essential and some was not. If the only changes have been changes to the rubrics (or curriculum organisers, to use the term preferred by authors of these curriculum documents) then the adoption of the essential learnings may actually have broadened the curriculum.
Delegating to schools
In 1982, the South Australian Education Department acknowledged that its schools were faced with a crowded curriculum and made recommendations about how to manage it.34 The department provided examples of how teachers could tailor the curriculum and reorganise schools while retaining an emphasis on Language Arts (English) and Mathematics.
A few years later, the Committee Reviewing the Quality of Education in Australia suggested a similar approach to the problem of overcrowding:
Even increases in the lengths of the school day and year and the average duration of schooling may not provide sufficient time to permit schools to cover
the extensive range of knowledge, skills, values and attitudes which are from time to time proposed as school responsibilities. Where these limits are coupled with those of resource availability and human frailty, schools and school authorities must of necessity select the objectives they pursue and the vigour with which they pursue them.35
The Committee warned that ‘without a positive narrowing of the focus of the curriculum schools will attempt so much that they will be unable to do any of it well’.
The problem with delegating this responsibility is that it places an additional and unfair responsibility on teachers while there are no specified limits on the extent of their discretion.
‘Core’ versus ‘non-core’
To some extent, the problem of defining what is ‘core’ for primary schools has been resolved. There is no campaign to displace either English or Mathematics from the top tier or to reduce their time allocations.
The problem is that advocates of other subjects are not willing to accept non-core status. Because of this, curriculum theorists have tended to shy away from developing frameworks that designate some subjects as being more important than others. This was not always the case. In secondary schools, it was common practice to divide the subjects into core subjects and electives. The curriculum consisted of a core (English, Mathematics, Science and Social Studies) which all students studied, and elective units from which students could select according to their interests.
The curriculum frameworks developed during the 1990s did not maintain any differentiation in importance among subjects. Instead, the eight KLAs were defined in such a way that they appeared to be of equal status, an outcome that did not reflect the circumstances of primary schools, where English and Mathematics have always had a higher priority than other subjects. Furthermore, the frameworks provided no guidance as to the relative importance of other subjects in the primary curriculum.
The answer to questions such as whether The Arts is more important in primary schools than, say, Social Studies, depends ultimately on values and beliefs. Education authorities have preferred to avoid establishing any explicit hierarchy of subjects, since to
22

do so would ignite a fierce debate in which there would be winners and losers. Instead, the curriculum has been allowed to change in an ad hoc way, by shifting gradually the time allocations for subjects.
It could be argued that, in effect, Health and Physical Education has been elevated to core subject status following introduction of the requirement for 120 minutes of physical activity per week. Teachers reported this subject had the greatest time allocation after English and Mathematics.
Other subjects that have laid claims to core status are Social Studies and Science.
There have been vigorous debates in the press about the need for young Australians to understand the past, recognise where Australia fits in the wider world, participate in democratic processes, and develop a moral compass. Historically, primary schools were seen as making a substantial contribution to the development of social responsibility among children.
Science has not traditionally been seen as a core part of primary education in Australia, although in England and Wales it has joined English and Mathematics on the top tier, occupying 10 per cent of the primary school week (more than three times the Australian allocation).36
Core subjects need to be differentiated from essential learnings. Essential learnings have tended to avoid questions about what subject matter or content is an essential part of the curriculum.
Integrated curriculum
There are a number of methods by which subjects can be connected, integrated or both. While the merits of this approach can be argued on educational grounds, it is also put forward as a means of dealing with an impossibly crowded curriculum.
An example of this is evident in the NSW Board of Studies’ response to the Eltis Report, Time to teach: time to learn. 37 Among other initiatives, the Board of Studies introduced Connected Outcomes Groups (COGs), a curriculum planning framework with programming support that presented teachers with ready-made connections across subjects. The documentation states that ‘COGs allow the curriculum to be taught more efficiently’.
It is a matter for concern if the purpose of grouping subjects is to enable a wider range of subjects to be ‘ticked off’ as having been covered. SOSE and Science are the two KLAs most commonly taught through integration with other subjects.38 There should be merit and logic in any integration of subjects or topics and sufficient time available to enable them to be taught well.
Gatekeeping
In view of the length of time that the problem of overcrowding has existed, surprisingly little attention has been given to improving the process of ‘gatekeeping’, whereby changes in emphasis or additional activities are measured against the totality of the curriculum. There is no agreed mechanism for deciding how to adjudicate requests for inclusions.
It is easier to add than to subtract and to invoke the principle that it is up to schools to adapt the curriculum to suit their circumstances. Why is the current gatekeeping so ineffectual?
One reason is that there is no single entry point. As indicated earlier, the process of curriculum policy making has become more complex because it has become more political and because there is a continuing stream of initiatives arising from various national and State bodies. Governments have created machinery for adding to the curriculum but none for subtracting from it.
Much of the pressure for change in the primary school curriculum trickles down from secondary schools. Interest groups pushing particular subjects are usually prestigious bodies acting out of perceived national interest: for example, the Australian Academy of Sciences, arts bodies, university deans and professional associations. Advocates of stronger emphases on their own discipline areas seldom suggest how other subjects can be reduced as a consequence.
The curriculum in secondary schools is, to a considerable extent, driven by market forces. In recent years, students have been able to choose from an extended range of courses, leading to a decline in some of the courses developed around traditional discipline areas. Advocates of these declining areas lobby ministers and reviews of the areas are undertaken. One of the strategies for restoring secondary enrolments is to obtain a stronger foothold in the primary curriculum.
23
Extending the school day
Providing opportunities for students to participate in activities before and after school is one of the few strategies available for extending the total amount of instructional time available. It would be particularly useful for subjects that are optional extras, involving relatively small numbers of students but limiting the instructional time available to the rest of the class. These subjects commonly include sport, band, choir and instrumental music, but others could be added.
Private after-hours tutoring is becoming increasingly common. However, because it is provided on a fee-for-service basis, it is unclear whether the children who would benefit most from this form of assistance are gaining access to it. The Reading Assistance Voucher Programme introduced by the Commonwealth is designed to address this concern by providing tuition payments to families of children failing to reach benchmarks on literacy and numeracy tests.39
There has also been increased interest in the United States and United Kingdom in extending the school day in disadvantaged communities. The interventions have taken various forms, including homework classes, basic childcare and clubs, as well as formal tutoring in literacy and numeracy. Evaluations of the efficacy of these initiatives have yielded mixed results.40
Resourcing the curriculum
Typically, primary schools are staffed on the assumption that teachers will assume responsibility for a class of students and teach most (if not all) of the curriculum.
On this basis, it could be argued that the particularities of the primary curriculum should not be a significant factor in claims for additional resources, since the salaries of the teachers will be much the same whatever the content of the curriculum. However, this protean view overlooks the costs schools face in both maintaining and changing the form and content of the curriculum.
The body of resources required to maintain a quality curriculum includes the backup needed to support the generalist classroom teachers. As a minimum, they need suitable buildings and related facilities, time for planning and preparation, contemporary curriculum resource materials and professional development. These
are real costs that should be factored into the resources that all schools need.
The focus on student performance standards also affects the cost of the curriculum at the school level. Teachers need time and expertise to administer and interpret tests. Judgements then need to be made about suitable strategies to address identified weaknesses. An additional cost that has recently been added to primary schools results from the need to moderate student work samples. While this may be desirable, it is a substantial and additional cost.
Costs escalate when changes are made to the curriculum.
Changes to the primary school curriculum that have occurred in recent years include the adoption of new subjects (LOTE, ICT), major revisions to existing subjects (English and Mathematics) and the introduction of new pedagogies (Reading Recovery, outcomes approaches, productive pedagogies) and assessment practices (DEST requirements for the ‘A’ to ‘E’ report format). Depending on the extent of the changes, schools may need specialist expertise, professional development and new curriculum resource materials, including equipment and capital works. Comprehensive proposals for change are an expensive proposition if they are to be undertaken in earnest.
An expanding curriculum’s capacity to demand an increasing share of limited school resources has often been overlooked by both curriculum officers and those responsible for allocating school resources.
Education bureaucrats generally have expertise in either the curriculum or school funding, but not both. However, the curriculum drives the need for and decisions about the distribution of resources: the relationship needs to be made clear.
Conclusion
One of the realities of primary schools is that more than half the instructional time is spent on English and Mathematics. In the absence of a proposal to reduce this allocation, all other subjects must fit into the remainder.
Mandates to increase the time allocated to subjects other than English and Mathematics must ‘steal’ time from other second-tier subjects, some of which (for
24

example, The Arts and Social Studies) have already experienced reductions during the twentieth century.
The failure of the National Goals for Schooling to address this reality makes that document appear rhetorical.
Teachers faced with this situation are subjected to the debilitating effects of intensifying work responsibilities. The alternative of reducing their aspirations for their students is not acceptable to many teachers. They also suffer during public debates about curriculum initiatives when they interpret public criticism of the curriculum frameworks they have implemented faithfully as criticism of themselves.
Principals and teachers are keenly aware of the problem: they ask why more is not being done to alleviate the situation, why governments struggle to exercise restraint.
Principals observe that the peak education councils in the nation appear to have a pipeline that pumps new policies, new documents and new expectations into schools. They keep the curriculum and assessment industries humming along but take little account of schools’ capacity to respond.
25
Governments and education authorities are also faced with a dilemma. If they limit the scope of the frameworks, critics can be expected to attack them for dropping their standards, claiming that the curriculum is being watered down. Some teachers will also be critical, claiming that they have not been provided with sufficient structure and direction. The current no-win situation encourages inertia.
Recommendations
2. MCEETYA should establish a Primary Curriculum Group to provide advice on proposals for new syllabuses, additions to the existing curriculum, and student assessment programs. The group should serve as an advisory committee to MCEETYA and include experienced primary educators.
3. Before any syllabuses are adopted widely, education authorities should conduct trials to demonstrate that all schools are able to cover the essential content within 60 per cent of the allocated instructional time.

26

Introduction
Since the 1980s, there has been heightened public interest in student performance levels, combined with a quantum shift in the sophistication of student assessment practices. Teachers have to attend not only to the new forms of assessment associated with the curriculum and standards frameworks but also to the national and State testing programs that feed results into a constantly evolving system of accountability.
Whatever their merit, the adoption of new assessment practices has contributed to teachers’ beliefs that the time available for teaching is being eroded.
This chapter begins by outlining the traditional approaches to testing in primary schools. It then describes how governments have become involved in the development and use of assessment results and the consequences of this heightened interest for schools. Finally, the merit of current trends is considered in the context of experience in the United States and United Kingdom.
Background
In the past, teachers managed their classroom assessment programs for their own purposes. Tests were diagnostic tools to find out whether students had understood what had been taught. End-of-week tests were common, as were half- and end-of-term tests. Teachers could adjust their programs according to the feedback they received from questions and tasks they had set themselves. Results were collected in ‘marks books’, which were used for preparing reports to principals and parents.
The scales for measuring achievement were based on simple, universally understood arithmetic: on a scale of 1 to 10, 10/10 was always the highest mark and 5/10 the pass mark. If necessary, scores could be converted to percentages: 100 per cent was the highest level of performance and 49 per cent indicated that a student’s performance was unsatisfactory.
Some standardised tests were available, particularly in reading and spelling. These tests were norm referenced: that is, they gave average scores for larger populations of children in the same year level or age group. Hence, a student’s reading achievement might be reported as a ‘reading age’. Sometimes the reference populations had been tested decades beforehand or were British or American.
Another method in common use was that of rank ordering the students in a class. The problem with this approach was that standards varied considerably from class to class. The highest-ranked students in poorly performing classes might have had proud parents but there was a good chance their achievement was a long way behind that of the lowest-ranked students in high-performing classes.
The considerable advances in the methods used to assess student performance have been prompted in large part by interest in international and national comparisons.
The context
International comparisons
Cross-national comparisons of student achievement, which began as research studies for limited audiences, have now acquired a life of their own. The fascination
4
Assessment and accountability
27

with ‘league tables’ has caused student performance data to arouse international competitiveness to a level comparable with a world championship sporting contest.
The best known assessment programs are the OECD Programme for International Student Assessment (PISA) and the Trends in International Mathematics and Science Study (TIMSS).
Every three years, PISA surveys reading, mathematical and scientific literacy among 15-year-olds. The extent to which these results reflect the quality of the students’ primary schooling is arguable, although the results are often reported in the media as if they apply to the condition of schooling in general.
TIMSS surveys student achievement in mathematics and science at Years 4 and 8 every four years. The Year 4 results are therefore an indicator of the relative performance of Australian students on the outcomes measured.
Each of the assessment programs allows students’ performance to be compared across countries and over time. Nations are ranked in terms of their relative performance at various proficiency levels and any improvement or decline between tests is noted.
Of the 25 countries participating in the TIMSS 2002 mathematics survey, Australian Year 4 students were mid-ranked: their performance was not statistically different from the international average. Australian students fared relatively better on the science test, achieving a result significantly higher than the international average.
However, for the Australian Year 4 cohort, there were no major improvements in either mathematics or science since the previous tests in 1994, whereas students from some other countries had made significant gains.
Countries that perform below the top rank are exhorted to do better and urged to copy the practices of the top performers. For example, Finland was suddenly thrust into the spotlight after its exceptional performance on the PISA tests. Experts travelled to see at first hand what educators in that country were doing to produce such outstanding results, but failed to agree on the Finnish formula for success.41 In the case of the TIMSS results, it has been suggested that education authorities
should adopt the curriculums of Singapore, the country with highest test results.42
The implications of these international comparisons for primary schools are not entirely clear. Australian Year 4 students have been only moderately successful on the TIMSS tests. Other countries have made more progress.
Therefore the results can be interpreted to mean that more attention must be paid to primary mathematics and science. However, precisely what would need to be done to lift the Australian Year 4s into the top rank remains mostly speculative. These large-scale surveys are not designed to investigate the pedagogies used by teachers. Without knowing the causes of the differences between nations, an excessive emphasis on mathematics and science might not only have a limited effect but could also divert attention from other important areas of the curriculum. The PISA studies revealed that while Australian 15-year-old students performed above the international average, their results in reading literacy were spread more widely than in many other countries. It is unclear whether this dispersion begins in the primary years and widens progressively until the early secondary years. Again, as with TIMSS, education policy makers need to be cautious in drawing on PISA test results to shape policy.
Assessment and productivity
The peak federal body in Australia is the Council of Australian Governments. Its members are the heads of the State and Federal governments and its overarching aim is to improve the productivity of the Australian economy. COAG’s position is that education plays a fundamental role in fostering human capital. A key objective is therefore to raise the levels of achievement of young people across the curriculum and, in particular, to increase the proportion meeting benchmark standards in literacy and numeracy. COAG is therefore a major driver of benchmark testing.
The Productivity Commission, which is an advisory body of COAG, compiles an annual report on expenditure on key services, such as education and health, and describes their outcomes using a common reporting framework.
In 2006, the State and Australian governments provided almost $31 billion for school education; the Commission’s job is to review the performance of
28

providers of school education services in terms of the equity, effectiveness and efficient use of this substantial allocation of resources. It promotes the use by school education authorities of student performance data, particularly in relation to the extent to which students are achieving the National Goals.
MCEETYA is responsible for providing the Productivity Commission with performance data about primary and secondary schooling. To enable it to do this, it has established the Performance Measurement and Reporting Taskforce and the Benchmarking and Educational Measurement Unit. It has set in train the National Assessment Program, which undertakes triennial sample assessments in Years 6 and 10 of scientific literacy, civics and citizenship, and ICT.43 It provides the Productivity Commission with detailed analyses of the literacy and numeracy surveys.
There are several observations that can be drawn from this brief account:
• there has been an economic imperative behind the national assessment of student performance;
• the statement of the National Goals has served as the baseline document from which decisions are made about what needs to be assessed; and
• the national assessment agenda is still unfolding.
Benchmark assessments
In 1997, the State and Commonwealth Ministers for Education initiated the National Literacy and Numeracy Plan. This included the development of national benchmarks and the national reporting of benchmark data for Years 3, 5 and 7. Most of the States already had in place assessment programs that they used to monitor performance in literacy and numeracy and were able to agree on procedures to equate these tests. In 2004, the Australian government legislated for the adoption by school authorities of common national tests in literacy and numeracy and work is under way to put that decision into effect.
In 2005, performance targets were set for Years 3, 5 and 7. These required each child’s performance relative to the national benchmarks to be reported to parents. The Commonwealth introduced the Reading Assistance Voucher Programme, which offered up to $700 for reading tuition for children who failed to reach the Year 3 literacy benchmark. This initiative has since been extended to apply to a wider group of students.
There is considerable uncertainty among principals and teachers over where the national assessment work is heading in the long run. The deliberations are occurring without reference to them. The Commonwealth Minister for Education has proposed the linking of student assessments to performance payments to teachers and principals and of tying government grants to school performance. However, there are important differences between the Commonwealth and the States over the uses to which the test results will be put.
Assessment methods
The traditional methods of testing primary students did not allow for accurate comparisons across jurisdictions or sound estimates of the growth of student performance.
More sophisticated techniques now enable student performance to be represented on a developmental continuum, a major departure from traditional assessment methods. The new methods attempt to reference student performance levels against defined standards.
A developmental continuum is defined as ‘the path a typical student progresses through in an area of learning’.44 Assessment items are arranged in hierarchical levels, from simple to complex.45 Academic progress is measured by how many stages or levels a student has completed or, if learning potential is construed as a continuous scale from simple to complex, how far along the continuum the student has progressed.
This conceptual framework for learning and measuring learning—sometimes referred to as a ‘levels’ approach— is now used widely in Australian school systems and national assessment programs are derived from it. It is also used in many other countries and by agencies responsible for conducting international surveys of student achievement.
Further, the view that learning progresses along a developmental continuum is one of the core ideas underpinning today’s curriculum frameworks and is consistent with the principles of developmental psychology that shaped the primary curriculum in the twentieth century. It lends itself particularly well to the primary curriculum, where it is clear that students start with the simple and concrete in the early years and move toward the complex and abstract as their knowledge and skills develop.
29

Teachers who adopt this approach assess students through work samples placed at the appropriate points on the developmental continuum, giving each work sample a level. With experience, teachers are able to make reliable judgements. Teachers develop their skills through participating in a process of moderation. They meet with other teachers to compare their students’ work samples, discuss variations in standards and relate the agreed standards to the relevant curriculum frameworks and progress maps.
The use of levels was a deliberate attempt to disrupt the orthodox pattern of assessment. The performance reference point is progress along the continuum, not how a student performs compared to the average in the class or year level across the State.
There is still some controversy over the application of developmental assessment in schools. Some teachers have recognised that this approach has sound educational and psychological underpinnings and have embraced it. Others have not been persuaded that the effort required to master the new practices is justified.
Plain-language reporting
Many members of the public, including parents, have been mystified by the reporting of student performance on developmental continua or according to standards-based levels. This has created a dilemma. Teachers have an obligation to report student progress in terms that parents understand. However, it is also unreasonable to deny teachers the use of a technical language only because it is beyond the capacity of a lay person to understand it.
This dilemma has been resolved by edict: for the 2005-2008 funding quadrennium, school providers have agreed that as a condition of receiving Commonwealth grants, all schools must adopt a system of reporting to parents based on a nominal scale from ‘A’ to ‘E’. The standards against which the grades are awarded are the responsibility of education authorities and schools. For example, one system has sought to assist teachers by establishing a simple hierarchy of performance levels defined by key descriptors: ‘limited’ (E), ‘basic’ (D), ‘sound’ (C), ‘high’ (B) and ‘outstanding’ (A).46
The adoption of letter grades tends to be problematic in primary schools, where teachers are committed strongly to monitoring and assessing student learning
in developmental terms. Teachers have to make dual assessments that are based on quite different assumptions.
Faced with this seemingly impossible task, education authorities have adopted a variety of solutions.
Some have provided reports based on both kinds of assessment. Some have used an algorithm to merge two different measures into one. Others have retained the standards form of reporting and used software to translate it into a score of ‘A’ to ‘E’ by relating students’ performance levels to their ages or year levels.
There is some evidence that the use of ‘plain language’ does not necessarily help to communicate subtle, complex and technical information. APPA- commissioned surveys of parents and school principals by an independent research organisation before the introduction of the new grading scheme found a sample of 1,200 parents to be split in their preferences: a third supported the rankings from ‘A’ to ‘E’, while 45 per cent did not. The remainder were uncommitted. 47
Impact on schools
Shaping instruction
Annual testing of all students in Years 3, 5 and 7 in literacy and numeracy has led to a significant increase in the ability of principals and teachers to use data to improve teaching and learning. Often, data are reported in terms of confidence intervals and trend lines. They have learned to examine trends over time, investigate differences within and between groups and identify curriculum areas in which students are performing poorly.
Data are available to schools, with appropriate caveats. Most principals graph the data for their school, comparing it with systemic or State norms and previous performance. They also publish student performance data on benchmark tests in school newsletters and annual reports. Access to these data provides an evidence base for the work of principals and teachers.
In some subjects, assessment has been embedded in ‘instructional systems’: that is, programs of instruction in which the intended outcomes, pedagogy and assessment are linked together to provide a coherent
30
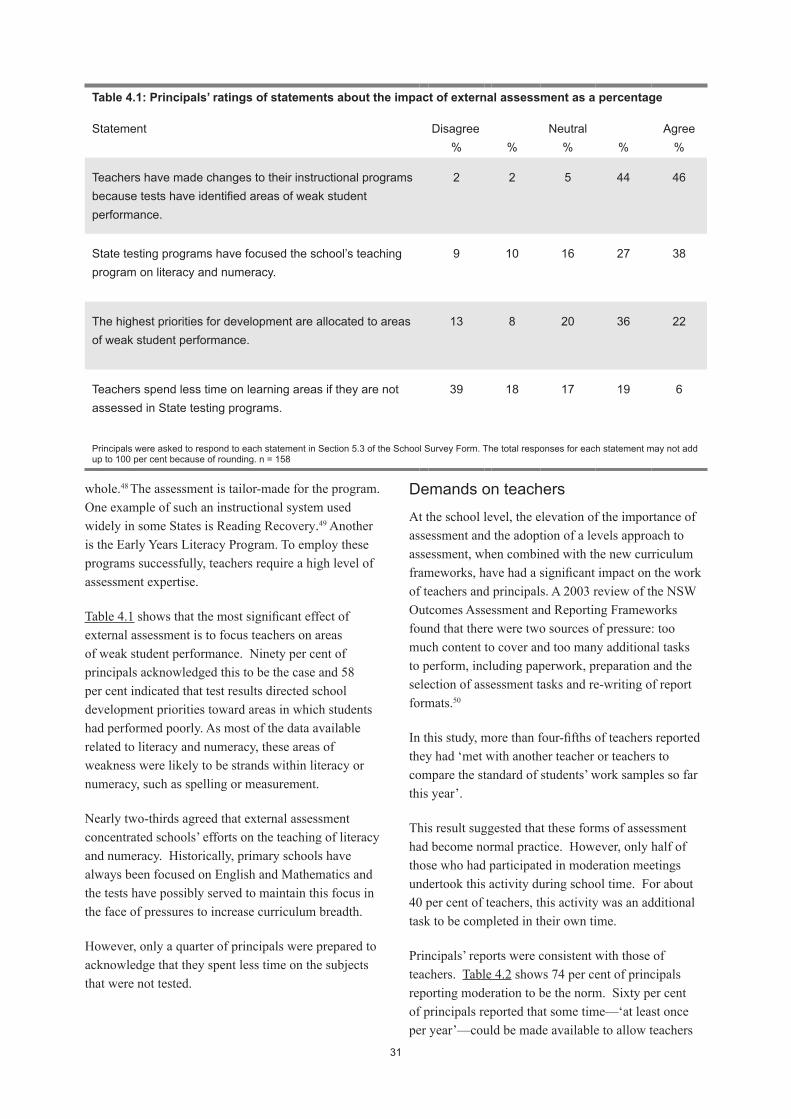
whole.48 The assessment is tailor-made for the program. One example of such an instructional system used widely in some States is Reading Recovery.49 Another is the Early Years Literacy Program. To employ these programs successfully, teachers require a high level of assessment expertise.
Table 4.1 shows that the most significant effect of external assessment is to focus teachers on areas of weak student performance. Ninety per cent of principals acknowledged this to be the case and 58 per cent indicated that test results directed school development priorities toward areas in which students had performed poorly. As most of the data available related to literacy and numeracy, these areas of weakness were likely to be strands within literacy or numeracy, such as spelling or measurement.
Nearly two-thirds agreed that external assessment concentrated schools’ efforts on the teaching of literacy and numeracy. Historically, primary schools have always been focused on English and Mathematics and the tests have possibly served to maintain this focus in the face of pressures to increase curriculum breadth.
However, only a quarter of principals were prepared to acknowledge that they spent less time on the subjects that were not tested.
Demands on teachers
At the school level, the elevation of the importance of assessment and the adoption of a levels approach to assessment, when combined with the new curriculum frameworks, have had a significant impact on the work of teachers and principals. A 2003 review of the NSW Outcomes Assessment and Reporting Frameworks found that there were two sources of pressure: too much content to cover and too many additional tasks to perform, including paperwork, preparation and the selection of assessment tasks and re-writing of report formats.50
In this study, more than four-fifths of teachers reported they had ‘met with another teacher or teachers to compare the standard of students’ work samples so far this year’.
This result suggested that these forms of assessment had become normal practice. However, only half of those who had participated in moderation meetings undertook this activity during school time. For about 40 per cent of teachers, this activity was an additional task to be completed in their own time.
Principals’ reports were consistent with those of teachers. Table 4.2 shows 74 per cent of principals reporting moderation to be the norm. Sixty per cent of principals reported that some time—‘at least once per year’—could be made available to allow teachers
Table 4.1: Principals’ ratings of statements about the impact of external assessment as a percentage
Statement Disagree Neutral Agree
% % % % %
Teachers have made changes to their instructional programs
because tests have identified areas of weak student
performance.
2 2 5 44 46
State testing programs have focused the school’s teaching
program on literacy and numeracy.
9 10 16 27 38
The highest priorities for development are allocated to areas
of weak student performance.
13 8 20 36 22
Teachers spend less time on learning areas if they are not
assessed in State testing programs.
39 18 17 19 6
Principals were asked to respond to each statement in Section 5.3 of the School Survey Form. The total responses for each statement may not add up to 100 per cent because of rounding. n = 158
31

Table 4.2: Principals who agreed with statements about moderation as a percentage
Statement Agree%
Teachers are required to moderate
student work samples as a normal part of
the assessment process.
75
Teachers must meet out of school hours
in order to find time to moderate student
work samples.
72
The school has been able to give
teachers time to moderate student work
samples at least once each year.
61
Teachers have not been able to moderate
student work samples to any great
extent.
27
Teachers can find time to moderate
student work samples during the school
day on a regular basis.
18
Principals were asked to mark with a cross (X) which of the statements they agreed with in Section 5.5 of the School Survey Form. Percentages were calculated from the total number of responses to the statement. n = 158
to participate in moderation activities. However, such time was not available on a regular basis: 71 per cent reported that teachers were expected to undertake moderation activities out of school hours. Given the constraints this imposes, it is not surprising that over a quarter of principals said that ‘teachers have not been able to moderate student work samples to any great extent’.
From an economic point of view, the additional work required of teachers to employ the new assessment practices can be regarded as an opportunity cost. The time and effort taken is a key resource that could be invested elsewhere. Moderation will, of necessity, compete with the other activities that need to be completed out of school hours: for example, lesson preparation, meetings and telephone conversations with parents and extracurricular activities, such as school sports training.
This is not to suggest that moderation of standards is ‘busy’ work. It is an important part of the process of
ensuring that teachers are operating from comparable standards. It is, however, further evidence of how school improvement initiatives can lead to an accumulation of additional tasks. This is a particular problem when changes are layered on top of each other with inadequate time for implementation:
At present all staff are under a great deal of pressure due to the introduction of the A to E reports. Reports are due May 31 but staff still haven’t been in-serviced on use of the software. We have been on a very tight timeline since mid Feb. [T# 306]
This teacher made her comments during the week before the week of the deadline. A number of schools had problems in acquiring and using the software they needed. This was a particular problem in Victoria, where a new curriculum package was introduced simultaneously with the ‘A’ to ‘E’ reporting format.
Marking student work according to performance standards cannot be done fairly without teachers moderating or validating these standards among their peers. Finding time to do this is problematic when it is only one of the additional tasks requiring their urgent attention.
Balanced assessment
High-stakes assessments
Important consequences arise from exceptional performance in ‘high-stakes’ assessments. A common example is the use of Year 12 examinations to determine university entrance: for students, the results can have enormous implications for their future.
The administration of literacy and numeracy tests to whole cohorts of students in Years 3, 5 and 7 is another example of high-stakes testing; in this case, the test results can have serious implications for schools and teachers, since their performance is inferred from the results of their students. The stakes can be raised when the outstanding results are rewarded and poor performances sanctioned. When the results are published on a school-by-school basis, the sanctioning is, to some extent, taken out of the hands of the education authorities because the public interprets the results at face value and attributes kudos to the successful schools and blame to those who do poorly.
However, education authorities can amplify the stakes by attaching more tangible rewards and penalties.
32
The stakes are much lower for tests administered to random samples of students (for example, the Science, Civics and Citizenship and ICT assessments in Year 6), because schools are not identified. These tests can have positive consequences, since the results can lead education authorities to rethink the curriculum and school resourcing.
TIMSS and PISA tests are also restricted to samples of students and do not have direct effects on schools. Given the national kudos gained from exceptional performance, the results from these tests can have significant positive effects if they promote an informed discussion of teaching and learning.
The use and misuse of high-stakes tests
The American and British experience
Proponents of high-stakes testing argue that if the rewards and sanctions are weighted properly, the assessment will drive school improvement. However, there is conflicting evidence as to whether the approach works as intended.
Much of it comes from the United States, where the No Child Left Behind (NCLB) federal legislation enacted in early 2002 demanded that all schools test students annually in reading and mathematics. The states are required to analyse the results by ethnic, racial and income groups. Schools in which too few students reach performance targets face penalties ranging from paying for private tutoring to being closed and reopened under new management. This legislation has generated a huge increase in assessment by the states, which must comply with the legislation in order to acquire federal funding.
The legislation has also generated extensive research into its efficacy.
One body of research indicates that in school systems where this strategy has been employed there has been an overall improvement in test scores. Another suggests that although there may be an initial improvement, after a few years the gradient plateaus, indicating that the improvement is due to explicit preparation for the testing.
There is also some evidence that there may be a negative effect whereby performance on the monitoring tests may be increasing but ‘actual’ performance, as measured by more valid and comprehensive tests, may be declining.
The New York Times reported that, in many states, students judged to be proficient on state tests were not considered proficient on the National Assessment of Educational Progress. In Mississippi, for example, the state test found that 87 per cent of fourth graders were proficient in reading, but according to the national test, only 18 per cent were proficient.51
A study conducted by the RAND Corporation compared the results of an intensive testing program in Texas with results obtained from the National Assessment of Educational Progress. The RAND study found that the comparative gain in national test scores of the Texas students in reading and mathematics over time was much less than that implied by the state test scores. The researchers concluded that the concentration on preparation for the Texas state test could be hindering the all-round development of reading and mathematics skills, particularly for minority students.52
British studies have reported a similar phenomenon. Gains in the level of performance on the Key Stage English, Mathematics and Science tests may have been due to changes in the standards of the tests; further, they were much larger than the results recorded in 1994 and 2002 on the TIMSS mathematics and science tests.53
These kinds of caveats do not appear to have dampened the commitment of federal and state governments in the United States, where massive testing programs are being implemented and sanctions for poor performance toughened. Most of the studies that have been conducted into achievement trends have been unable to explain why there have been improvements or falling off in performance and many analysts are prepared to throw caution to the wind and back their hunches. In the United Kingdom, there has been a widening discussion of the possibility that there is too much testing: less whole-cohort and more sample testing might provide education authorities with the information they need.54
The ambiguity of the results arises in part from technical disputes over what should be inferred from the test data and from the claims and counter-claims of critics who are ideologically supportive of or opposed to the use of assessment for accountability purposes.
33

How do schools respond to the pressure?
There is general agreement that it is possible to raise national test scores by narrowing the curriculum to the kinds of activities found in pencil-and-paper tests and by extensive practice on these tests. The issue is whether such practices are educationally sound.
The New York City school district recently took high- stakes testing to a new level. The chief executive officer announced that students in Grades 3 through 8 would be tested five times per year.55 The teachers union reported that many teachers were already spending up to a day a week preparing for the tests.
Test coaching in this environment is seen by advocates as a positive activity. Principals and school officers are encouraged to use computer analyses of previous tests, practise testing and make constant curriculum adjustments to ensure that all the instructional effort is directed to what is likely to be in the tests. Teaching to the test is regarded as a virtue.56
Opponents argue that such practices prompt a shallow form of learning. Schools become ‘results factories’ that fail to give a rounded education.57 After several years, the results will plateau. When the students sit for a test based on more general content that they are unlikely to have practised specifically and which requires more independent thinking and less memorisation, their performances will show a deterioration.
As well, teaching to the test dodges the really important question of what is impeding the learning of students who are not achieving at satisfactory standards.
Further, as high-stakes tests have been designed for accountability purposes, they tend to be of limited
value for providing feedback about an individual student’s attainments. Experts would normally not recommend that classroom teachers use the results to devise instructional plans at the classroom or school level but enthusiastic school officials are inclined to override this cautionary advice.58
In Australia, the penalties for poor test performance have not been as severe as in the US and UK, so the response of schools is unlikely to have been as radical. What is at stake for schools that do well or poorly on such tests?
Those that do well claim kudos. Reputation can count in all sorts of ways, particularly when government policies promote parental choice of schooling and enable mobility across sectors and between schools. Kudos is likely to translate into enrolments.
Table 4.3 shows that most principals accept State testing programs, although 30 per cent complained about the time involved in assessment programs and 18 per cent reported that the tests were not relevant to their students.
There was evidence in one of the schools in the study that assessment was driving instruction:
Over the last few years there is an increasing/excessive time spent on providing departmental systems data which is meaningless and unreadable. I have concerns about the increasing amount of time devoted to studying state and national tests so that teachers at this school are teaching to pass these tests. Sadly we are devoting less time to the creative and expressive arts. [T# 196]
This teacher’s view was supported by a colleague in his school. The second teacher had had 29 years
Table 4.3: Principals’ ratings of statements about the value of external assessment as a percentage
Statement Disagree Neutral Agree
% % % % %
Teachers and students are required to
spend too much time on assessment.
20 23 27 22 8
State testing programs are not relevant to
the students in this school.
36 29 17 11 7
Principals were asked to respond to the statements in Section 5.3 of the School Survey Form. The total responses to each statement add up to 100 per cent. n = 156
34

experience and expressed her concerns about testing in the context of the crowded curriculum and resource constraints she faced:
I have 30 children in my class with a high percentage of children needing 1:1 attention. I need to prepare the program then train the teacher aide. It is very difficult to follow programs due to the continual changes and interruptions to the class timetables. Getting resources for lessons often takes longer than the lesson. The crowded curriculum means too many outcomes are expected to be achieved in a year. There is no time for consolidation. There is an increasing amount of paperwork related to testing for data and data recording takes time from our teaching. I have concerns about the time spent teaching to tests rather than sound methodologies to benefit children’s developmental learning. Enjoyment is being lost. [T# 197]
These teachers worked in a large school with a low socioeconomic student intake that more than satisfied the expectations created by the national benchmarks in 2005.
The teachers questioned the value of this substantial achievement, claiming it had been at the cost of student enjoyment and a narrowed curriculum.
Conclusion
There are two agendas driving assessment in primary schools. The first is to improve the capacity of teachers to make judgements about the academic progress of students, by linking the assessments to standards frameworks. The second is to use test results to hold systems, schools and teachers more accountable for the public funds they receive.
In Chapter 3 the point was made that the contemporary curriculum frameworks are conceptually more complex than the rudimentary syllabus frameworks of previous years. The assessment frameworks are also more challenging for teachers. Current approaches require teachers to internalise standards frameworks so that student work can be assessed in levels.
The net result of these changes has been to add to the pressures on principals and teachers. There is more collaborative work required to plan joint assessment tasks, moderate standards and record results. This intrudes into the time normally committed to face-to-
face teaching. Time is a critically important commodity in primary schools. Some teachers therefore see the new forms of assessment as drawing them away from teaching. On the other hand, others have adapted and now prefer them.
COAG regards education as a cornerstone of economic prosperity and wants assurance that the education sector is attaining the goals set for it. On the one hand, educators should be pleased with this recognition of the national importance of their work but on the other it is obvious that the members of COAG are approaching education like other government services and want evidence of a return on the nation’s $31 billion investment. Hence there is an expanding range of assessments of the National Goals under the auspices of MCEETYA. These assessments, based on samples of students, are not intended to be intrusive, but they contribute to a heightened assessment climate when considered alongside the results of international surveys in which Australia has participated and in conjunction with full-cohort national literacy and numeracy assessments in Years 3, 5, 7 and 9. There is a lot of testing and more in the offing.
At the national and State levels, governments continue to support a standards and assessment approach to school improvement. There is a belief that regular testing, public reporting of individual school results, providing parents with options to choose and change schools, and reporting of individual student results to parents, will ‘drive’ school improvement if aligned with a program of carrots and sticks: kudos and financial rewards for the high achievers and the threat of penalties for the low achievers. When assessment is used in this way for these purposes, it can have unintended consequences. It would be an unfortunate outcome if teachers were forced to spend increasingly large slabs of instructional time in test preparation. Worse, it would be a travesty of primary education if schools were rewarded publicly because they had narrowed their curriculum to that which could be measured. The belief that more testing is the answer to school improvement is anathema to many teachers, who worry that the whole purpose of primary education is at risk of being reduced to performance on literacy and numeracy tests.
Australian governments should examine carefully events in the United States and United Kingdom before allowing assessment to be extended further into
35

primary schools. There is accumulating evidence from these countries that intensive testing programs can have negative consequences. The ‘gains’ may be little more than a chimera of political spin. There are not sufficient grounds to emulate the American or British assessment systems. Primary schools that are overdosed on assessment are at risk of losing the excitement and joy of teaching and learning. The challenge is to achieve a proper balance between accounting for performance and encouraging good primary school teaching.
Recommendation
4. MCEETYA should produce a national position paper on the use of high-stakes tests for school and teacher accountability; the paper should provide guidelines on how to avert potential negative consequences.
36

Introduction
The characteristics of students enrolled in a school have a huge bearing on the resources that are needed by it. This chapter is about the students who struggle to succeed in primary school, the numbers of such students, the factors that hold them back and the resources needed to give them the prospect of success.
Most of the information about students has been provided by their classroom teachers. The teachers have described the students who have special learning needs and provided tallies of students whose classroom behaviour has been a problem. These two groups are often described as ‘resource-intensive’ or ‘high-cost’ students.
This chapter also considers the students who have been unable to perform up to national benchmark standards in literacy and numeracy.
Context
In Chapter 1, it was explained that in some circumstances students might be regarded as a resource. Classes composed of motivated students, who work independently or with their peers, accept direction from their teachers and are supported by parents or carers at home, can make remarkable progress on their own initiative, with their teachers structuring and facilitating their learning.
Even if all students in a class do not have these qualities to begin with, the good behaviour and positive attitudes of a core group can rub off on others and set norms conducive to academic success for the whole class. There is research evidence of ‘peer effects’,
whereby students who are placed in the company of high-achieving and motivated students lift their own performance to a considerable degree.59 The ‘resources’ that explain this improvement in performance are mainly the company that the students keep in and out of school and, to a lesser extent, the funding allocated to the school.
On the other hand, there are students who are ‘resource intensive’: that is, they demand considerably more of the teachers’ attention than do other students, or require special provisions beyond that provided to students in general. Some of these children may have medical disabilities but many have arrived at school under-socialised: that is, they are unable to sit still, refuse to take turns, have not learned to persevere with tasks, find schoolwork boring and lose their tempers easily.
Because of the differences in the backgrounds of the students, it is possible to observe stark differences among classrooms in the calmness, sense of engagement and purposefulness of the teaching and learning. There are also differences in the academic performances of students. While the variation may be explained to some extent by the experience and skill of the teachers, the backgrounds of the students also have an effect on how a class operates.
Although there have always been challenging primary students, with higher concentrations in some classrooms and schools than in others, the situation is changing.
Teachers are now more likely to have children with serious medical disabilities in their classrooms than twenty years ago, as a result of government policies of
5
Students
37

inclusion and also because there appears to be a higher incidence of such children in the population at large.60
In addition, teachers report that there are more children who begin school unable to behave in ways that promote academic success.61
Primary schools receive additional resources for the students with serious medical disabilities they enrol—for example, the provision of wheelchair ramps and additional teaching and aide time—although not usually at the same level as when these students were taught in segregated settings. However, many children who are difficult to teach attract no additional support. The classroom teacher is expected to be skilled enough to manage a class with large numbers of such children.
The pressure on schools with concentrations of difficult-to-teach students has built up as a result of the benchmark testing programs. It has been assumed that such schools have received the extra help they require, so below-average performance can therefore be attributed to some deficiency in the way in which the school operates: perhaps the quality of the teaching.
This is the context in which an analysis of the teachers’ reports of students with disabilities, special needs and/or low attainments is now presented.
Students with special learning needs
Definitions
For the purposes of this report, the term ‘students with special learning needs’ is applied generally to students experiencing some physical, intellectual or psychological characteristic that is considered by a teacher or some other professional to be impeding their learning.
Within this broad category, there are two sub-categories.
The term ‘students with disabilities’ refers to those who have medically diagnosed physical, intellectual or mental health disabilities. However, there are students in schools who have cognitive or behavioural problems that are either not severe enough to warrant clinical diagnosis or are not considered to fall within the ambit of health services. Teachers can recognise such students who, for the purposes of this report, are referred to as ‘teacher-identified students with special needs’.
Students with disabilities
The integration of children with serious physical, intellectual and/or psychological disabilities into
Table 5.1: Teachers’ reports of students with disabilities in their class, category of disability
Category of disability Students
Number Percentage
Intellectually disabled 123 1.4
Language/communication disorders 86 1.0
Autism spectrum disorders 73 0.9
Attention deficit disorders 58 0.7
Physically disabled 38 0.4
Psychological, social, emotional and behavioural disorders 34 0.4
Sensory disorders 28 0.3
Chromosomal disorders 15 0.2
All 432 5.0
Teachers provided information in Section 3.2.2 of the Teacher Survey Form. The percentages have been calculated for the whole population of students in all classes of the participating teachers (n = 353). The total number of students with disabilities includes four who were placed more than half of the week in special education units but returned to their home classes for part of the day or part of the week. The total number of students in the 353 teachers’ classes was 8,544.
38
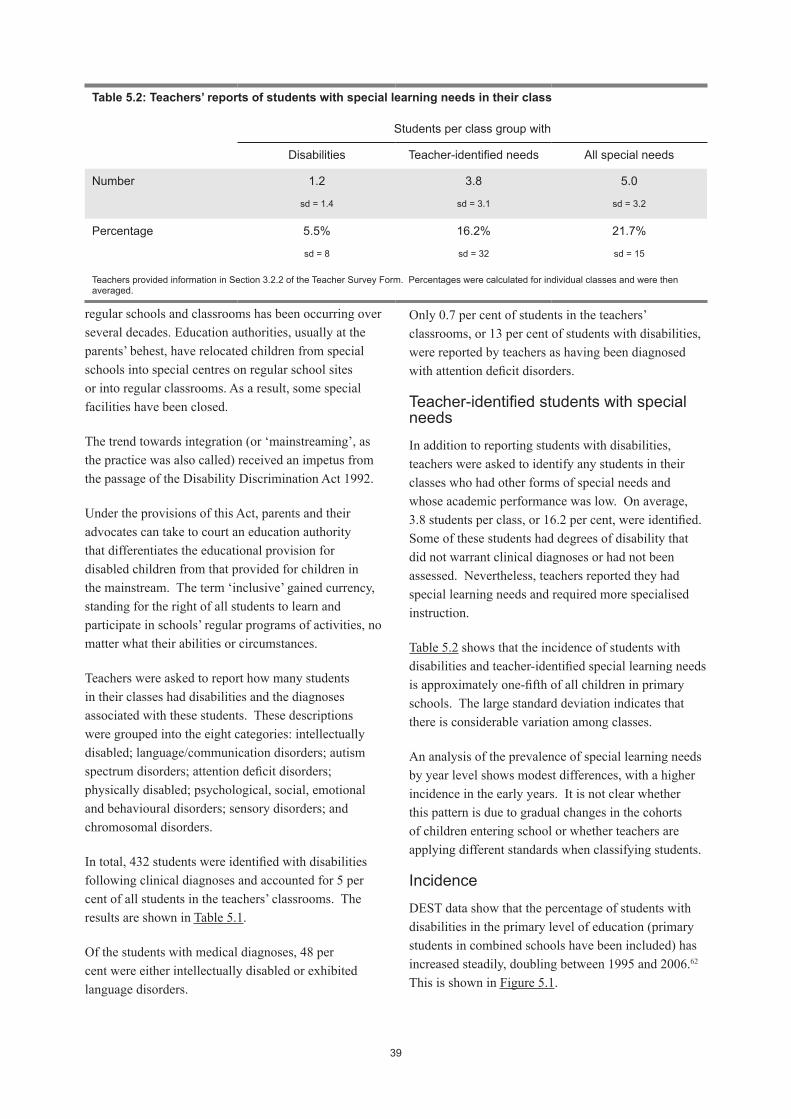
regular schools and classrooms has been occurring over several decades. Education authorities, usually at the parents’ behest, have relocated children from special schools into special centres on regular school sites or into regular classrooms. As a result, some special facilities have been closed.
The trend towards integration (or ‘mainstreaming’, as the practice was also called) received an impetus from the passage of the Disability Discrimination Act 1992.
Under the provisions of this Act, parents and their advocates can take to court an education authority that differentiates the educational provision for disabled children from that provided for children in the mainstream. The term ‘inclusive’ gained currency, standing for the right of all students to learn and participate in schools’ regular programs of activities, no matter what their abilities or circumstances.
Teachers were asked to report how many students in their classes had disabilities and the diagnoses associated with these students. These descriptions were grouped into the eight categories: intellectually disabled; language/communication disorders; autism spectrum disorders; attention deficit disorders; physically disabled; psychological, social, emotional and behavioural disorders; sensory disorders; and chromosomal disorders.
In total, 432 students were identified with disabilities following clinical diagnoses and accounted for 5 per cent of all students in the teachers’ classrooms. The results are shown in Table 5.1.
Of the students with medical diagnoses, 48 per cent were either intellectually disabled or exhibited language disorders.
Only 0.7 per cent of students in the teachers’ classrooms, or 13 per cent of students with disabilities, were reported by teachers as having been diagnosed with attention deficit disorders.
Teacher-identified students with special needs
In addition to reporting students with disabilities, teachers were asked to identify any students in their classes who had other forms of special needs and whose academic performance was low. On average, 3.8 students per class, or 16.2 per cent, were identified. Some of these students had degrees of disability that did not warrant clinical diagnoses or had not been assessed. Nevertheless, teachers reported they had special learning needs and required more specialised instruction.
Table 5.2 shows that the incidence of students with disabilities and teacher-identified special learning needs is approximately one-fifth of all children in primary schools. The large standard deviation indicates that there is considerable variation among classes.
An analysis of the prevalence of special learning needs by year level shows modest differences, with a higher incidence in the early years. It is not clear whether this pattern is due to gradual changes in the cohorts of children entering school or whether teachers are applying different standards when classifying students.
Incidence
DEST data show that the percentage of students with disabilities in the primary level of education (primary students in combined schools have been included) has increased steadily, doubling between 1995 and 2006.62
This is shown in Figure 5.1.
Table 5.2: Teachers’ reports of students with special learning needs in their class
Students per class group with
Disabilities Teacher-identified needs All special needs
Number 1.2 3.8 5.0
sd = 1.4 sd = 3.1 sd = 3.2
Percentage 5.5% 16.2% 21.7%
sd = 8 sd = 32 sd = 15
Teachers provided information in Section 3.2.2 of the Teacher Survey Form. Percentages were calculated for individual classes and were then averaged.
39

This trend is based on classifications that have excluded children diagnosed with ADHD, some forms of autism (such as Asperger’s Syndrome) and learning disabilities.
Intellectual disabilities account for over half the disabilities that receive funding. Students with vision and hearing impairments, intellectual disabilities, physical disabilities, socioemotional disorders and multiple disabilities comprise the remainder.
Other evidence suggests that the number of children with disabilities is much larger than indicated by the DEST data. This is possibly because the statistics cited refer to medically diagnosed disabilities: there may be a significant number of others who are disabled but not severely enough to warrant funding.
Each education authority employs its own system of categorisation, which has among its purposes the need to cap expenditure in this area. More recently, the diagnosis and subsequent labelling of ADHD and Asperger’s Syndrome has increased the number of
students competing for resources. A national study estimated the prevalence of ADHD among 6-17 year olds as 11 per cent, making it the most commonly diagnosed disorder among Australian children.63
In some cases, the statistics used to estimate the incidence of students with disabilities in schools are indicators of eligibility for government-funded support rather than the incidence of the disability per se. The criteria are stringent and the decisions to provide financial support do not always correspond with teachers’ judgements.
The system of classification often seems illogical to teachers, who focus mainly on how best to provide for the needs of students in their classes. They are concerned about whether students can work independently or take advantage of the support available to them. The students’ levels of cooperation and the impact they have on their peers are also important issues for teachers. These factors are less relevant to the medical specialists and psychologists who classify them:
Figure 5.1: Primary-level students with disabilities 1995-2006 as a percentage
Data provided by DEST. Calculations are based on a head count of full-time and part-time primary students with disabilities. Total primary enrolments are based on ABS data published in Catalogue 4221.0. All figures include primary students in combined schools.
40

Table 5.3: Support for students with disabilities in time in minutes, category of disability
Category of disability Time in minutes
Teacher Non-teaching staff member
Intellectually disabled 25 171
sd = 68 sd = 282
Language/communication disorders 38 104
sd = 80 sd = 145
Autism spectrum disorders 32 242
sd = 185 sd = 374
Attention deficit disorders 8 46
sd = 24 sd = 126
Physically disabled 12 348
sd = 45 sd = 344
Psychological, social, emotional and behavioural disorders
14 178
sd = 53 sd = 264
Sensory disorders 54 182
sd = 76 sd = 286
Chromosomal disorders 80 332
sd = 155 sd = 442
All 28 171
sd = 72 sd = 305
Teachers provided information in Section 3.2.2 of the Teacher Survey Form. Support time for all students in each category has been averaged.
I am constantly questioning the process of identifying the children with special needs. This year the child with a ‘mild’ intellectual disability is by far much more demanding, in terms of academic needs, than the child with a ‘moderate’ disability. [T#31]
Table 5.3 shows that about 86 per cent of the support provided to students with disabilities is in the form of non-teaching staff members. While some students with extremely high levels of need have access to teacher aides for the full week, this is the exception rather than the rule.
For most students, the support is more likely to be a matter of hours rather than a school day and certainly much less than a week. Because these allocations are tied to individual students’ classifications, the staff are employed part-time and on contracts: a job ceases if a student moves to another school. As a result, individual non-teaching staff members may work with a number of students. Their availability is then subject to their timetables rather than the convenience of the students and class teachers:
A lot of time is given to teacher aide time – if it was one person it would be good; sometimes there are four people in your room. Too many cooks spoil the broth! Some aides’ skills are very poor. [T#161]
While many teachers said they wished they had more aide time, others complained about the quality of the support they were able to obtain and found the support too ad hoc to be of use.
Low-performing students
Using benchmarks
The current emphasis on benchmark testing has drawn attention to the children failing to make academic progress in literacy and numeracy. Given that over half the school week is devoted to English and Mathematics, and that extra funding and support has been allocated to the early years of primary schooling, policy makers are faced with the problem of what to do next.
41
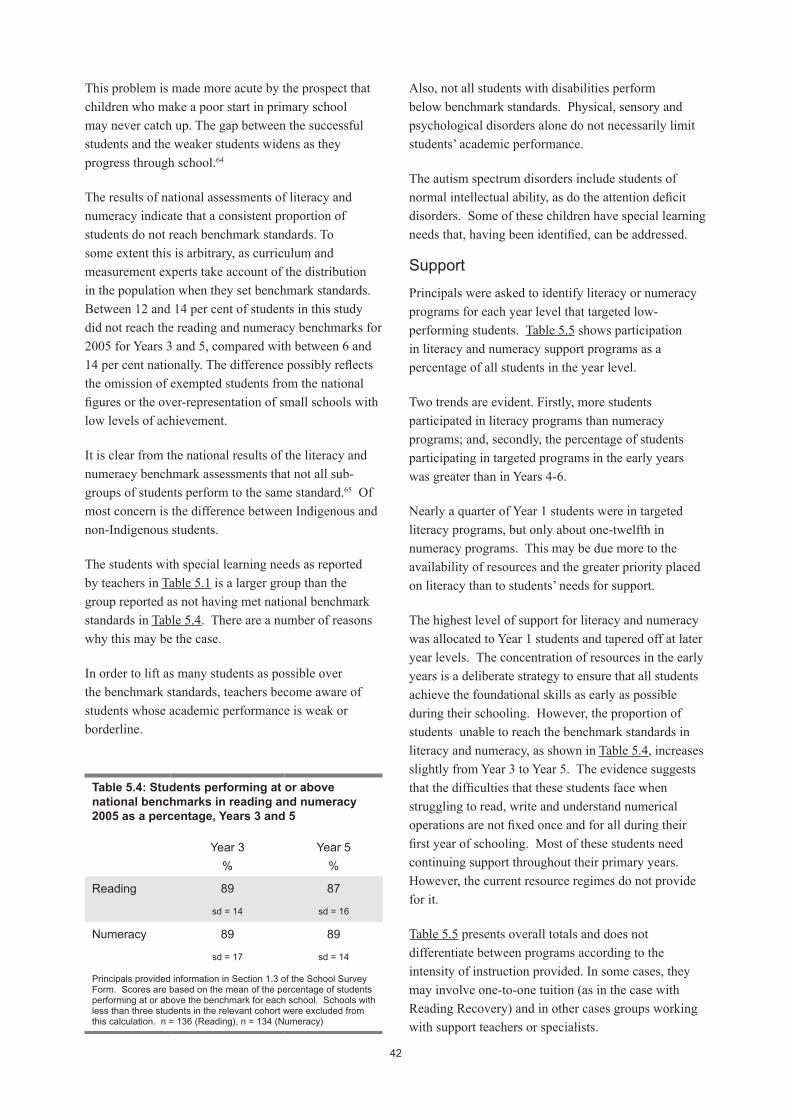
This problem is made more acute by the prospect that children who make a poor start in primary school may never catch up. The gap between the successful students and the weaker students widens as they progress through school.64
The results of national assessments of literacy and numeracy indicate that a consistent proportion of students do not reach benchmark standards. To some extent this is arbitrary, as curriculum and measurement experts take account of the distribution in the population when they set benchmark standards. Between 12 and 14 per cent of students in this study did not reach the reading and numeracy benchmarks for 2005 for Years 3 and 5, compared with between 6 and 14 per cent nationally. The difference possibly reflects the omission of exempted students from the national figures or the over-representation of small schools with low levels of achievement.
It is clear from the national results of the literacy and numeracy benchmark assessments that not all sub-groups of students perform to the same standard.65 Of most concern is the difference between Indigenous and non-Indigenous students.
The students with special learning needs as reported by teachers in Table 5.1 is a larger group than the group reported as not having met national benchmark standards in Table 5.4. There are a number of reasons why this may be the case.
In order to lift as many students as possible over the benchmark standards, teachers become aware of students whose academic performance is weak or borderline.
Also, not all students with disabilities perform below benchmark standards. Physical, sensory and psychological disorders alone do not necessarily limit students’ academic performance.
The autism spectrum disorders include students of normal intellectual ability, as do the attention deficit disorders. Some of these children have special learning needs that, having been identified, can be addressed.
Support
Principals were asked to identify literacy or numeracy programs for each year level that targeted low- performing students. Table 5.5 shows participation in literacy and numeracy support programs as a percentage of all students in the year level.
Two trends are evident. Firstly, more students participated in literacy programs than numeracy programs; and, secondly, the percentage of students participating in targeted programs in the early years was greater than in Years 4-6.
Nearly a quarter of Year 1 students were in targeted literacy programs, but only about one-twelfth in numeracy programs. This may be due more to the availability of resources and the greater priority placed on literacy than to students’ needs for support.
The highest level of support for literacy and numeracy was allocated to Year 1 students and tapered off at later year levels. The concentration of resources in the early years is a deliberate strategy to ensure that all students achieve the foundational skills as early as possible during their schooling. However, the proportion of students unable to reach the benchmark standards in literacy and numeracy, as shown in Table 5.4, increases slightly from Year 3 to Year 5. The evidence suggests that the difficulties that these students face when struggling to read, write and understand numerical operations are not fixed once and for all during their first year of schooling. Most of these students need continuing support throughout their primary years. However, the current resource regimes do not provide for it.
Table 5.5 presents overall totals and does not differentiate between programs according to the intensity of instruction provided. In some cases, they may involve one-to-one tuition (as in the case with Reading Recovery) and in other cases groups working with support teachers or specialists.
Table 5.4: Students performing at or above national benchmarks in reading and numeracy 2005 as a percentage, Years 3 and 5
Year 3 Year 5
% %
Reading 89 87
sd = 14 sd = 16
Numeracy 89 89
sd = 17 sd = 14
Principals provided information in Section 1.3 of the School Survey Form. Scores are based on the mean of the percentage of students performing at or above the benchmark for each school. Schools with less than three students in the relevant cohort were excluded from this calculation. n = 136 (Reading), n = 134 (Numeracy)
42
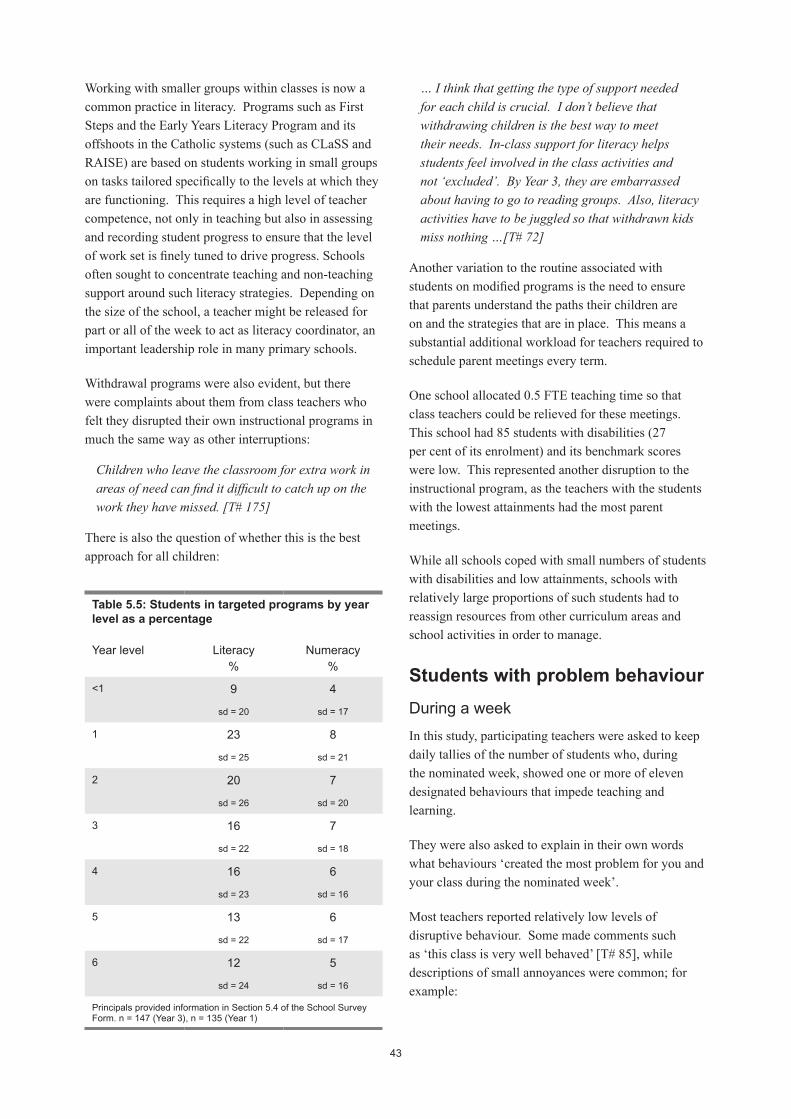
Table 5.5: Students in targeted programs by year level as a percentage
Year level Literacy Numeracy% %
<1 9 4
sd = 20 sd = 17
1 23 8
sd = 25 sd = 21
2 20 7
sd = 26 sd = 20
3 16 7
sd = 22 sd = 18
4 16 6
sd = 23 sd = 16
5 13 6
sd = 22 sd = 17
6 12 5
sd = 24 sd = 16
Principals provided information in Section 5.4 of the School Survey Form. n = 147 (Year 3), n = 135 (Year 1)
Working with smaller groups within classes is now a common practice in literacy. Programs such as First Steps and the Early Years Literacy Program and its offshoots in the Catholic systems (such as CLaSS and RAISE) are based on students working in small groups on tasks tailored specifically to the levels at which they are functioning. This requires a high level of teacher competence, not only in teaching but also in assessing and recording student progress to ensure that the level of work set is finely tuned to drive progress. Schools often sought to concentrate teaching and non-teaching support around such literacy strategies. Depending on the size of the school, a teacher might be released for part or all of the week to act as literacy coordinator, an important leadership role in many primary schools.
Withdrawal programs were also evident, but there were complaints about them from class teachers who felt they disrupted their own instructional programs in much the same way as other interruptions:
Children who leave the classroom for extra work in areas of need can find it difficult to catch up on the work they have missed. [T# 175]
There is also the question of whether this is the best approach for all children:
… I think that getting the type of support needed for each child is crucial. I don’t believe that withdrawing children is the best way to meet their needs. In-class support for literacy helps students feel involved in the class activities and not ‘excluded’. By Year 3, they are embarrassed about having to go to reading groups. Also, literacy activities have to be juggled so that withdrawn kids miss nothing …[T# 72]
Another variation to the routine associated with students on modified programs is the need to ensure that parents understand the paths their children are on and the strategies that are in place. This means a substantial additional workload for teachers required to schedule parent meetings every term.
One school allocated 0.5 FTE teaching time so that class teachers could be relieved for these meetings. This school had 85 students with disabilities (27 per cent of its enrolment) and its benchmark scores were low. This represented another disruption to the instructional program, as the teachers with the students with the lowest attainments had the most parent meetings.
While all schools coped with small numbers of students with disabilities and low attainments, schools with relatively large proportions of such students had to reassign resources from other curriculum areas and school activities in order to manage.
Students with problem behaviour
During a week
In this study, participating teachers were asked to keep daily tallies of the number of students who, during the nominated week, showed one or more of eleven designated behaviours that impede teaching and learning.
They were also asked to explain in their own words what behaviours ‘created the most problem for you and your class during the nominated week’.
Most teachers reported relatively low levels of disruptive behaviour. Some made comments such as ‘this class is very well behaved’ [T# 85], while descriptions of small annoyances were common; for example:
43

Disruptive behaviour was at a low level, however, continual talking is a problem, getting out of seats to avoid tasks and small ‘niggly’ problems between students at desks, for example, ‘His stuff is on my side’. [T# 91]
The annoyances came in a wide range of forms and were generally considered a problem because they distracted other students. Some representative examples include:
Silly noises, calling out, talking [T# 16]
Teasing, arguing, aggravating and annoying, saying something that has upset someone else [T# 70]
Poor organisation between home and school (left work at school and left work at home) [T# 86]
Inability to wait turn [T# 311]
Whining and having tantrums [T# 336]
Bad manners [T# 356]
The standard of work from a lot of students lacks care [T# 358].
Teachers seemed to take most of these sorts of behaviours in their stride, recognising that teaching students how to listen, take turns and apply themselves is part of the instructional program.
Some teachers who complained about ongoing disruption attributed this to high proportions of boys in their classes.
Although most classes were orderly, the full range was evident across the schools. The extent to which teachers felt able to manage was related to the number of problem students and their influence on the rest of the class.
Problems increase when a student’s behaviour influences the rest of the class in a negative way:
One disruptive student has poor listening skills and most often refuses to follow directions. This causes some copycat behaviour and distraction for others. [T# 138]
The extent of the problem increases as more students participate in the disruption. A sub-group of students who are difficult to manage can affect the dynamics of a whole class. As this teacher explained, well-behaved students can help to restore order:
The Domino Effect is ever present in my classroom. There are many students who ‘spark’ the others into some kind of reaction that continually requires controlling whether it be a negative or positive response. Fortunately, I have a core of students who function continually at a cooperative level so I can control the group as a whole. [T# 256]
At the far end of the continuum of student behaviour was a small number of classes in which it was difficult to establish the order and routine needed to present effective lessons. This teacher has listed problems he found difficult to address:
Failure to follow instructions, failure to listen attentively, failure to attempt tasks, constant banter and teasing, lack of respect for teacher, disrespect of resources, failure to adhere to routines, continual avoidance of basic responsibilities as a class member and blaming of others. [T# 125]
While many of the items on the list are similar to the chronic annoyances teachers often describe, in this case there were more of them and their cumulative effect on the learning environment was more serious. For this teacher, the behaviour of students was a major problem. However, such situations are not common and are often associated with communities in which teachers are unable to secure support from parents and carers.
Engagement with the curriculum
Table 5.6 reports the frequency of behaviours associated with engagement in the learning process. All these behaviours have direct impacts on the learning of the students exhibiting them.
Students with short attention spans were identified most frequently. This behaviour had a high standard deviation relative to the other behaviours associated with engagement, indicating a wide variation in levels across different class groups.
The incidence of these behaviours was highest on Mondays. This issue was raised by a comment from one of the teachers:
Monday is usually a ‘slow’ day. The children are sleepy, tired, recovering from the weekend. … I have a class of 35 Year 1-2 children who are easy to work with – excellent behaviour. The study made me realise … how sleepy and off task they can be on Mondays so I have decided to change my
44

Table 5.6: Teachers’ tallies of students who demonstrated disengaged behaviour at least once per day
Behaviour Students per day
Were absent from school 1.8
sd = 1.4
Arrived late at the beginning of the school day
0.9
sd =- 1.0
Showed signs of sleepiness during the school day
0.9
sd = 0.9
Had a short attention span 2.5
sd = 1.8
Were unable to follow instructions even when prompted
1.3
sd = 1.3
Failed to comprehend simple concepts
1.2
sd = 1.4
Showed a general lack of interest in what you were teaching
1.0
sd = 1.3
Teachers were asked, in Section 3.3 of the Teacher Survey Form, to report ‘behaviour you personally observed while teaching. Start each day fresh, reporting the number of students who showed the particular behaviour described at least once during that particular day. If you teach more than one class, restrict your report to the class you taught for most time during the nominated week’. n = 349
Monday program to accommodate the transition from weekend home environments back to school and learning. Academic lessons will begin after recess on Monday. [T# 201]
The higher incidence of these behaviours on Mondays is supported by other teachers’ comments: for example, ‘Monday is often not very productive’ [T# 350]. It is fairly clear that today’s generation of primary school students is not going to bed at 7.30 pm as was the case a generation ago:
When children have had a late night … they are very tired and irritable the next day. They are more likely to argue with each other and in some cases cry. [T# 332]
This is a problem over which teachers have relatively little influence but which erodes teaching time.
Students who exhibit these behaviours consistently are at serious risk of underachievement and failure. Teachers with students who are chronic absentees
carry a major burden. It can be demoralising to begin the teaching of a new concept knowing that a group of students is absent and will require individual tutoring on its return. This demoralisation is exacerbated when it is apparent the children have no valid reason and there is inadequate pressure for them to attend. Persistent absenteeism almost certainly leads to failure.
Challenging behaviour
Table 5.7 reports four behaviours described as ‘challenging’. ‘Disruptive during class’ involved more students than any of the other challenging behaviours and the majority of the measures of student engagement. The high standard deviation indicates that the problem of disruptive students is not shared evenly among classes. For many, disruptive behaviour may never be a problem; for others, it is a serious impediment to instruction.
Although challenging behaviours were reported relatively infrequently, they can be serious and have wide repercussions. There were no reports from teachers of violence directed toward them during the nominated week, but one teacher told of being struck by a student during the previous week. The consequences of that event were still evident during the nominated week:
The week prior to the nominated week I was struck forcibly by a student across my arm causing significant bruising, had a chair thrown at me and a door attempted to be pushed into my head. An extreme case, I acknowledge. [T# 268]
Table 5.7: Teachers’ tallies of students who demonstrated challenging behaviour at least once per day
Behaviour Students per day
Were disruptive during class 1.8
sd = 2.2
Were disrespectful towards you 0.4
sd = 0.8
Were verbally aggressive
towards another student
0.4
sd = 0.9
Were physically aggressive
towards another student
0.2
sd = 0.5
See notes to Table 5.6. n = 349
45

Understandably, this teacher was concerned about the support she received after the event:
Generally the parents in the school are supportive of teachers but not in this case. I think this kind of attack from children is going to get worse and I don’t believe there is enough support from superiors. Everybody is so worried about litigation or bad publicity that these incidents are not dealt with well enough to make us feel valued, protected and supported. [T# 268]
While aggressive behaviour is infrequent, a single incident can have a lasting impact on teachers’ confidence in themselves and the systems in which they work. Such incidents need to be dealt with effectively.
Managing student behaviour
Most of the problem behaviours identified are demonstrated across the year levels. There are some behaviours for which improvement was seen as children developed: for example, attendance increased and fewer students were identified with short attention spans as they grew older. Disruptive behaviour and disrespect for teachers peaked in Years 3-5. Generally, though, the differences between year levels were moderate and there were no clear trends evident.
Managing problem behaviour is an issue for most teachers, regardless of the age of their students. The majority of teachers see student behaviour in the classroom as their responsibility, but acknowledge their reliance on others in the school when they experience difficulties. Of the participating teachers, 99 per cent agreed that they could manage disruptive behaviour in their own classes.
Eighty-three per cent said that their schools’ climates were orderly and calm and 77 per cent reported that others in their schools were available to assist when they experienced difficulties and that the policies for managing difficult students were in place. These results suggest that most primary schools are safe environments, with high levels of cooperation between students and teachers.
However, a minority of teachers reported problems in managing student behaviour. Sixteen per cent spoke of difficulties in managing students in the playground, 10 per cent were negative about the effectiveness of whole-school policies and 6 per cent said that school climate was a problem. While these reports are
from a minority of teachers, if ‘Neutral’ responses are included, the proportion of teachers who report difficulties with student behaviour rises to 16-18 per cent.
One of the most common policies in place for managing student behaviour involves isolating students from their peers. The incidence of students withdrawn from class is reported in Table 5.8. Suspension from school was also reported. This is used much more sparingly than suspension from class. The average length of a suspension from class was three and a half hours while the average suspension from class lasted a week.
Suspending students from class can be used as a sanction but also as a means of providing respite from an immediate problem. It is often implemented in a low-key way:
We have a buddy class in the lower school. When students are disruptive and not on task they are sent out of the room to the buddy class for time out for a session. Students often come back relaxed and ready to try again. [T# 171]
The use of buddy classes was common, although some schools used designated teachers with responsibility for groups of classes or specialist teachers with dedicated rooms to undertake a similar role. The principals or other senior staff in schools often became involved if problems could not be resolved. Establishing contact with parents was also a common step if procedures were specified:
Table 5.8: Students suspended from class and school
From class From school
Number per class 1.7 0.3
sd = 4.3 sd = 0.9
Percentage of class 7.6% 1.4%
sd = 20 sd = 5
Minutes per student 199 1 520
sd = 829 sd = 2 478
Teachers were asked in Section 3.5 of the Teacher Survey Form: ‘Have any students been removed from your class or the school because their behaviour was a problem so far this year? How many students were removed to another area of the school/suspended from school? What was the total time of all students removed during this period?’ n = 352 (from class) and n = 353 (from school).
46

Table 5.9: Classes with students with special learning needs as a percentage
Number per class Classes with students with
Disabilities Teacher-identified needs All special needs
% % %
0 36 18 5
1 31 9 7
2 17 10 9
3 10 16 13
4 3 12 16
5> 3 36 50
The percentages represent the proportion of class groups that have 0 - 5+ students with special learning needs in each class. The total figures in each column may not add up to 100 per cent because of rounding.
Students are sent out of the classroom environment after two warnings are given. It would not be uncommon to send two students out for a short period of time in any one session. However, if behaviour is ongoing a meeting is held with the family. One student is on a constant communication book. Daily incidents and attitude are recorded and sent home. No formal suspensions or transfers have taken place. [T# 274]
Every effort was made to focus on improving student behaviours, although a small number of dangerous or harmful behaviours resulted in mandatory suspension. There was evidence of students in the classes of the participating teachers being suspended during the nominated week, usually for periods of two to four days.
Concentrations of difficult-to-teach students
The incidence of students with disabilities, other special needs and problem behaviours is not uniform across schools or classes.
Among the teachers participating in this study, slightly more than one-third reported that they did not have any students with disabilities in their classes. A further third reported having single students with disabilities and about one-sixth had three or more such students.
Table 5.9 shows the percentages of students with disabilities and those with teacher-identified learning problems in each class. When these figures are
combined, as shown in the right-hand column, there were very few classes with no such students whereas half the class had five or more.
Given the high incidence of students with special learning needs in the primary school population over all, the 5 per cent of class groups that have no students with disabilities are likely to be in schools that are streamed according to academic performance.
There was no relationship between class sizes and the numbers of students with special learning needs. This is counter intuitive: it might be expected that the classes with the greatest concentrations of students with high needs would be smaller. A likely explanation is that once a class gains additional resources (for example, non-teaching time allocated to a student with disabilities) that class is assigned additional students who are ineligible for such resources so that the benefits can be shared around.
There was also evidence that some teachers are seen to be very effective with difficult students so principals assign such students to their classes.
Some teachers must also deal with students with disabilities whose behaviour is problematic. A principal reported this as an ongoing issue:
This school ‘integrates’ approximately 30 special education students with autism and intellectual impairment. This integration is very complex and demanding – these students are behaviourally challenging. Lessons are frequently interrupted because of tantrums, etc. [P, S# 82]
47
A teacher at another school described events during the nominated week:
Three times this week a student with Asperger’s Syndrome was physically removed by senior staff or the Special Education Unit teacher for disruptive and violent behaviours. When this behaviour occurs, I spend time away from teaching, radioing or calling for assistance. Often the child will leave the room without permission. I stand in the doorway watching for his and others safety until help arrives. This opens a window of opportunity for the other students to misbehave. Thankfully, I work in an open plan classroom so I have another teacher to keep an eye on my class while I am occupied. This however, is highly frustrating as neither of us can effectively run a lesson. [T# 148]
While most teachers are willing to accept their responsibilities toward very difficult students, there is a limit to what can be achieved if they have more than a critical mass in the one class:
A special needs student is constantly disruptive – out of seat, fails to engage in learning, disrupts other students. Is verbally and physically aggressive towards peers. Constant attention seeking behaviour. Constantly provokes student with Asperger’s Syndrome who gets very emotional and cries. [T# 106]
The high concentration of some very resource-intensive students into normal-sized classes suggests that schools do not have sufficient resources to cater for these students.
Indigenous students
During the interviews, principals were asked to comment on the provision their schools made for Indigenous students achieving below the national benchmarks.
Although this study did not collect information on the percentage of Indigenous students achieving national benchmarks in sample schools, the National Report on Schooling reported that in 2005 between 20 and 37 per cent of all Indigenous students did not reach the literacy and numeracy benchmarks.
In schools with very few Indigenous students, principals often indicated that they were achieving satisfactorily or that Indigenous students not achieving
the benchmarks received intensive instruction in the same way as did other academically weak students. In these schools, intervention was not associated with the students’ Indigenous backgrounds.
In schools with significant numbers or high proportions of Indigenous students, principals were more likely to report that intervention strategies had been developed to address the low levels of literacy and numeracy—particularly literacy—among the Indigenous students. These strategies made use of specialist teachers, ITAS tutors and IEWs to support teachers in the classroom, to allow the withdrawal of students for intensive instruction or to assist in homework centres. Several schools also used reading materials they had developed themselves to suit Indigenous students in the senior-primary years who were still requiring intensive instruction in literacy.
Principals identified an extensive range of factors influencing literacy and numeracy skills among Indigenous students. Early childhood students were generally not ‘school ready’ and had not been prepared at home for learning to read. Some Indigenous students had difficulty in ‘code switching’, particularly after weekends or periods of absence when they had not been exposed to Standard Australian English for some time. Low education levels among parents and carers limited the extent to which they could support their children’s learning. This was exacerbated by overcrowding and a lack of learning materials at home. Chronic absenteeism among a small proportion of Indigenous students and irregular attendance or lateness by others, were additional factors that disrupted the learning of basic skills.
The value of a whole-school approach was illustrated by the efforts of a large metropolitan school [S# 50].
A quarter of its students were Indigenous and its strategies had led to improvements in attendance and in the proportion of students reaching national benchmarks. These strategies involved the allocation of teaching staff to intensive instruction in basic literacy skills, the development of teaching and assessment tools that were applied consistently across the whole school, a collegial approach among the staff, an emphasis on culturally sensitive teaching styles and engagement with the local community. The principal attributed the school’s progress to the combination of these strategies. The strategies adopted by schools are discussed further in Chapter 7.
48

It is difficult for primary schools faced with large numbers or high proportions of Indigenous students with poor academic performance to provide adequate programs. The concentration of resources in the early years has merit if it enables students to acquire the basic skills they need for their remaining years at school.
However, there were many Indigenous students who had not achieved the modest standard of the national benchmark by Year 3 and so required additional support to address their very high levels of need.
Conclusion
The evidence supports the view of principals that there are increasing numbers of children in regular primary classrooms who require special intensive instruction in order to make satisfactory progress with their learning. The trend appears to be the consequence of a complex array of medical and societal factors, coupled with government policies that promote the inclusion of such children in regular classrooms.
Reports by classroom teachers suggest the incidence of these students is higher than the numbers of funded students with disabilities and the proportions of students failing to meet national benchmarks. Teachers’ awareness of such students has been heightened as a result of in-school monitoring and the increased emphasis now being placed on reporting poor performance, particularly in literacy and numeracy.
Teaching a class in which half the children have special needs of the kind described in this chapter is a very different proposition from teaching a class with none. Yet in both cases teachers are expected to ensure that all their children achieve the National Goals.
In addition to the challenges of teaching students with low attainments, some teachers are also faced with student behaviour problems in their classrooms. Some of the most difficult of these problems were evident in classes with students with disabilities, but this was not necessarily the case.
Recommendations
5. There should be an immediate strengthening of the capacity of primary schools to work with students in the middle- and upper-primary years who are failing to make progress in literacy and numeracy.
6. Funding for students with disabilities should be increased to a level that enables schools to provide for these students adequately in mainstream settings.
7. Special needs funding criteria should be extended by government authorities to make provision for students with highly disruptive behaviour and the necessary funds allocated accordingly.
49

50
Introduction
This chapter examines the implications for teachers of the social and educational changes affecting primary schools. Comments from participating teachers illustrate the complexity of the issues they are required to address.
The chapter demonstrates a paradox. On one hand, the pressure on primary schools to ensure that instruction is of a high standard is leading them to make specialist appointments to the extent they are able to do so. On the other, classroom teachers are increasingly being expected to assume the wider responsibilities of childcare worker, medical orderly, social worker and community leader. This chapter describes how schools are grappling with pressures pulling them in different directions.
A case study of one teacher’s experience during the nominated week is used to illustrate the complexity of classroom life.
Finally, the chapter reports that most primary teachers experience high levels of job satisfaction, even though many feel under pressure.
Demographics
Given the relatively low profile of primary education issues in the media, it might be expected that primary teachers were a minority in their profession. In fact, they comprise approximately half the teaching workforce and teach a greater proportion of school-aged students than their secondary counterparts. In 2006, according to the ABS, primary school teachers
comprised 50.6 per cent of all teachers employed in Australian schools and taught 57.5 per cent of the students.66
The proportion of women in primary education has been increasing over time. In 1986, 71 per cent of primary teachers were women. Ten years later, the proportion had increased to 76 per cent. In 2006, 80 per cent of primary school teachers (calculated as full-time equivalents) were women. This compares with 68 per cent of the teaching workforce across all levels of school education.
In this study, 84 per cent of the teacher respondents were women. Participating teachers had taught in their current schools for an average of seven years and at their present year levels for five years. Ninety per cent reported they had permanent appointments and two per cent were new graduates. A quarter had specialist qualifications and a third had taught previously in specialist roles.
They had taught for an average of 16 years, but the distribution of years of experience was bi-modal: there was an unexpectedly high concentration of participants with 25-30 years’ experience. A large number of teachers were nearing the ends of their careers.
Curriculum expertise
Schools are under pressure to offer a strong instructional program across the eight KLAs, yet they are not staffed with specialists in each area. Primary school teachers are trained to be generalists: teachers who are expected to teach competently all of the KLAs.
6
Teachers
51

This poses a dilemma. The development of outstanding school curriculum programs that extend across year levels usually requires the drive and enthusiasm of expert teachers. However, the energy of most primary classroom teachers is directed toward a class of students with whom they spend most of the school year. The classroom teacher is the basic building block in the structure of primary schools. There is little interest among primary educators in adopting the highly specialised teaching practices of secondary schools.
In practice, large primary schools reach a compromise. They develop staffing profiles that consist mainly of generalist classroom teachers with a small number of specialists. There are usually insufficient numbers to cover every KLA, so principals use their specialists in areas that have been identified as curriculum priorities for the school or in areas where the school staff members feel there is a lack of expertise. It is not uncommon for regular classroom teachers to provide specialist teaching in other classes and year levels for part of the week, by swapping with their colleagues. However, in smaller schools, there is a smaller pool of expertise and fewer opportunities to assign teachers to specialist duties. Teachers were asked to indicate on a five-point scale whether they had the expertise to teach the KLAs. The results are shown in Table 6.1. Over 90 per cent felt they had the expertise needed to teach English and Mathematics. These areas are the bread-
and-butter of primary education and from the teachers’ point of view they are confident they can do the job, although a small number expressed doubts about their expertise to teach Mathematics.
At the other end of the scale, only 7 per cent said they felt they had all—or nearly all—the expertise they needed to teach LOTE. This places the majority of schools in a position where they employ specialist teachers or community members, drop LOTE, or teach it as a form of SOSE, in which there is little foreign language development.
Somewhat surprisingly, a large proportion of teachers reported they lacked the expertise to teach The Arts. Very few felt that they had all the expertise they needed. The Arts includes the fields of music, drama, dance and the various forms of visual arts. To some extent this result may be explained by the lack of confidence or ability of teachers to demonstrate a high level of personal performance in all these fields and their responses were based on candid self-assessments of their natural abilities.
It is also possible that expectations of what primary schools should be able to provide have grown. Teachers without the personal interest or skill may not want to take responsibility for producing exhibitions or performances.
Table 6.1: Teachers’ ratings of their expertise in KLAs as a percentage
KLA I don’t have the expertise
needed
Neutral I have all the expertise needed
% % % % %
English 0 0 5 55 39
Mathematics 0 2 7 56 35
HPE 0 7 29 46 18
The Arts 5 38 44 12 1
SOSE 0 1 12 55 32
Science 0 8 22 51 18
LOTE 77 10 6 3 4
Technology 2 12 29 44 13
Teachers were asked in Section 6.1 of the Teacher Survey Form: ‘Please indicate with a cross (X) the extent to which you have the expertise needed to teach in each of the learning areas listed below’. The total responses for each KLA may not add up to 100 per cent because of rounding. n = 357
52
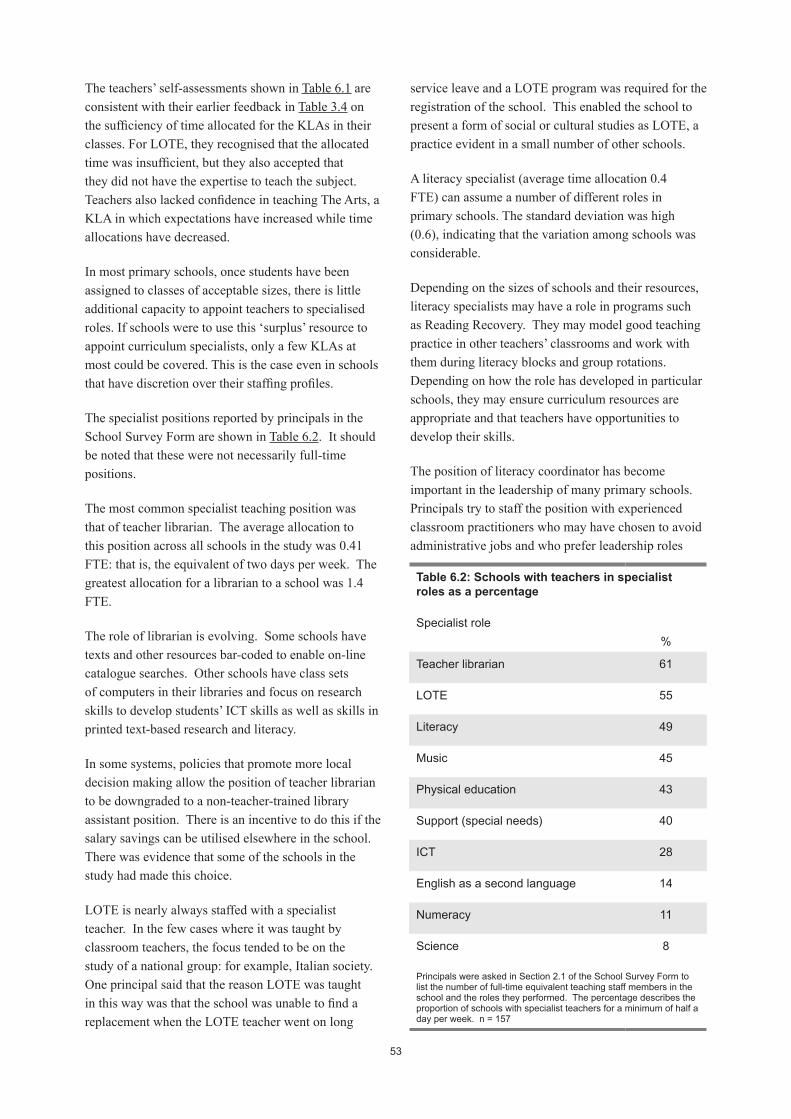
Table 6.2: Schools with teachers in specialist roles as a percentage
Specialist role
%
Teacher librarian 61
LOTE 55
Literacy 49
Music 45
Physical education 43
Support (special needs) 40
ICT 28
English as a second language 14
Numeracy 11
Science 8
Principals were asked in Section 2.1 of the School Survey Form to list the number of full-time equivalent teaching staff members in the school and the roles they performed. The percentage describes the proportion of schools with specialist teachers for a minimum of half a day per week. n = 157
The teachers’ self-assessments shown in Table 6.1 are consistent with their earlier feedback in Table 3.4 on the sufficiency of time allocated for the KLAs in their classes. For LOTE, they recognised that the allocated time was insufficient, but they also accepted that they did not have the expertise to teach the subject. Teachers also lacked confidence in teaching The Arts, a KLA in which expectations have increased while time allocations have decreased.
In most primary schools, once students have been assigned to classes of acceptable sizes, there is little additional capacity to appoint teachers to specialised roles. If schools were to use this ‘surplus’ resource to appoint curriculum specialists, only a few KLAs at most could be covered. This is the case even in schools that have discretion over their staffing profiles.
The specialist positions reported by principals in the School Survey Form are shown in Table 6.2. It should be noted that these were not necessarily full-time positions.
The most common specialist teaching position was that of teacher librarian. The average allocation to this position across all schools in the study was 0.41 FTE: that is, the equivalent of two days per week. The greatest allocation for a librarian to a school was 1.4 FTE.
The role of librarian is evolving. Some schools have texts and other resources bar-coded to enable on-line catalogue searches. Other schools have class sets of computers in their libraries and focus on research skills to develop students’ ICT skills as well as skills in printed text-based research and literacy.
In some systems, policies that promote more local decision making allow the position of teacher librarian to be downgraded to a non-teacher-trained library assistant position. There is an incentive to do this if the salary savings can be utilised elsewhere in the school. There was evidence that some of the schools in the study had made this choice.
LOTE is nearly always staffed with a specialist teacher. In the few cases where it was taught by classroom teachers, the focus tended to be on the study of a national group: for example, Italian society. One principal said that the reason LOTE was taught in this way was that the school was unable to find a replacement when the LOTE teacher went on long
service leave and a LOTE program was required for the registration of the school. This enabled the school to present a form of social or cultural studies as LOTE, a practice evident in a small number of other schools.
A literacy specialist (average time allocation 0.4 FTE) can assume a number of different roles in primary schools. The standard deviation was high (0.6), indicating that the variation among schools was considerable.
Depending on the sizes of schools and their resources, literacy specialists may have a role in programs such as Reading Recovery. They may model good teaching practice in other teachers’ classrooms and work with them during literacy blocks and group rotations. Depending on how the role has developed in particular schools, they may ensure curriculum resources are appropriate and that teachers have opportunities to develop their skills.
The position of literacy coordinator has become important in the leadership of many primary schools. Principals try to staff the position with experienced classroom practitioners who may have chosen to avoid administrative jobs and who prefer leadership roles
53
connected closely to classroom instruction. The role of the literacy coordinator has emerged from needs identified within individual schools. Appointments tend to be shaped by local circumstances rather than by centralised promotional structures.
Positions are designed to reward teachers recognised for their ability to bring out the best in their colleagues and selections are more likely to be made from among staff already working in a school, with input from teachers in that school. These positions are relatively recent innovations: primary schools have traditionally had little or no professional leadership other than through the role of the principal.
In some respects, music instruction is like LOTE teaching. If one has not mastered a musical instrument or foreign language, then it is very difficult to teach these subjects. Many schools of necessity either employ specialists in these areas or assign them a low priority while promoting other curriculum areas in which staff members have the requisite expertise. A noteworthy feature of Table 6.2 is the small proportion of specialist appointments in Numeracy and Science.
The broadening role
Hardly a week goes by without a story in the media about a societal problem that needs the attention of teachers and schools. The worse the problem, the earlier the intervention recommended. These proclamations about how various problems might be solved by ‘education’ take no account of the capacity of the schools to address them. There is almost no limit to the kinds of problems that schools ‘should’ help fix: financial literacy, animal welfare, civic pride – the list goes on. Teachers would argue that some of the problems have nothing to do with primary schools. However, problems involving the health and wellbeing of children are harder to disregard.
During school visits by researchers, there was considerable evidence that teachers were being expected to manage students’ health problems. Staffroom notice boards showed photographs of students with allergies, diabetes, epilepsy and other conditions for which an immediate response might be life saving. Descriptions of medical procedures were aligned with photographs and student names so that any teacher on duty could administer first aid in an emergency.
Teachers have always had a duty of care to their students.
This is a broad responsibility that is often defined in terms of the teacher being in loco parentis, meaning that, in the absence of a child’s parents, a teacher must exercise a comparable level of responsibility for the wellbeing of the child: hence the training courses on administering drugs in an emergency through an epi-pen and the need to attend first aid courses. It has become part of the job and participating teachers did not complain about these expectations in particular. A teacher with 34 years experience, 29 of them in the same school, referred to the increasing numbers of students on medication but only in the context of a number of other changes:
In my final year of teaching I’ve noticed the increased workload and accountability of teachers. Managing the behaviour of students is much more difficult and there are more poorly behaved students and lots of children on medication. There is less enjoyment in teaching and much more stress. Paper work has increased dramatically (e.g. risk assessments, documentation of poor behaviour) and schools are doing more of what parents and the community used to do. [T# 60]
Of greater concern to most teachers are the increasing pressures to relieve parents of their responsibilities to socialise their children. A principal commented:
Education is often not the main item on the agenda. Sometimes we feel more like Social Workers. Three staff members now have a Post-graduate Diploma in Student Wellbeing. [P, S# 138]
It is fair and reasonable for educators to argue that other agencies should provide social services to students and their families. However, the reality is that teachers cannot ignore the day-to-day needs of young children. If children do not have food or money, then ‘emergency’ breakfasts or lunches are required. If there is a significant demand for such services, arrangements are likely to be made at the school level, taking the pressure off individual classroom teachers.
Teachers only tended to complain about the provision of food for hungry children by schools when they felt parents had interpreted these programs to mean that they need not worry about feeding their children. This applies to a relatively small proportion of the primary school population but it is a fundamental problem
54
that cannot be ignored in communities where parental neglect has become normalised and may affect small numbers of families in a wider group of schools. Teachers who perceive that the ‘tail is wagging the dog’ (that is, that the school cannot fulfil its educational purpose) feel great stress. This kind of work drains vital energy away from the educational priorities of literacy and numeracy.
More common are the day-to-day home-school tensions: homework that hasn’t been done, parents who haven’t signed permission forms or sent money for excursions, or the need to inform parents about problems that have arisen at school. Anti-social behaviour is not always the root of the problem:
A student was in some emotional distress due to problems at home. Time was spent in consoling this student and liaising with parents. [T# 302]
The expectation that parents should be involved in the resolution of issues that arise at school has increased, although not all parents feel comfortable about participating. With the broadening of their role, teachers look to parents for their support and feel let down when it is not forthcoming.
One principal said she consciously placed a photograph of herself on the banner of the newsletter looking directly at the camera with a severe expression. [S#1] She came into a school, sometimes referred to as a ‘principal crusher’, during a school year because the previous principal was unable to cope with the pressure. She had to make a decision about her own wellbeing after going on medication for a stress-related illness. As she felt that the parents were being unreasonable, she decided to fight back. The stern photograph was a strategy to discourage affluent, well-educated parents from taking time off their own jobs to come to the school to make trivial complaints. By the time the school participated in the study, she had turned the situation around and was able to direct the staff’s attention to the curriculum.
Schools are encouraged to work with their communities and, for most primary schools, parents are an important resource. However, acquiring support is becoming more difficult as increasing numbers of families have both parents in paid employment. This teacher had 27 years experience and felt he wasn’t able to get the practical support he was looking for:
At this school, parents are very critical but believe they are supportive of the school. They expect and take a lot but really don’t give anything back in terms of real support. [T# 204]
The lack of cooperation from parents is a constant issue in some schools. Overstretched teachers are drawn away from their teaching. Parents become a burden rather than a source of support.
The robotics week
It would be a mistake to picture the primary school day as a predictable and smooth-flowing experience in which every moment is spent in some form of academic pursuit.
There are many intrusions and unforeseen events that teachers have to manage. The hectic nature of classroom life is well encapsulated in the example provided by Teacher ‘A’.
‘A’ has taught for 26 years, 15 of them in the large metropolitan school where she worked when she participated in the study. She has a Year 6 class of 29 students. The nominated week coincided with one week per year allocated to the class to study robotics, which in this school was a component of the Technology KLA.
During the nominated week, a student was suspended on Monday; the class had two pre-service teachers who each taught two lessons per day; the dental clinic called individual students out for treatment; a guest speaker became available at short notice to give a talk to the class on their previous topic, Antarctica; family planning staff provided input to the class; and half the class went to an interschool sports meeting. The school’s behaviour management committee, which ‘A’ chairs, was in the process of reviewing its policies and procedures.
To teach the robotics module, the class was broken into two groups and required the use of five computers. The lesson was facilitated by the school’s ICT support officer, who was not a teacher. Therefore, A’s class swapped rooms with the other Year 6 class to allow access to the computers. ‘A’ had to supervise both groups.
The suspended student had been diagnosed as having a severe autism spectrum disorder. There were two
55
other students with disabilities in the class: a hearing-impaired girl and a boy with speech and language problems.
These students were constantly aggressive toward one another. All three of the students with disabilities had low attainments, as did a further three students. One of these students had recently arrived from New Zealand and was being assessed during the nominated week.
‘A’ described the ASD boy and the events surrounding his suspension:
This student is paranoid about people knowing he has special needs. He will not leave the classroom to receive assistance and refuses to allow the support teacher or aides to work with him in class. Support staff still come to the room so I use them to be an extra set of eyes in some activities or to work with other students while I work with this student. Academically, he needs assistance as there are many gaps in his learning, but behaviour and the safety of others are the main issues. He is erratic and impulsive and needs to be watched constantly.
On Monday morning, this student was threatening towards the other students and the robotics equipment, physically aggressive towards another student and verbally aggressive towards me, saying: ‘I’ve had enough of your s___, you f___ing b____.’ As a result he was suspended.
This student’s absence for the rest of the week allowed us to experience a much more relaxed and comfortable teaching and learning experience. It was so different!!!
On Tuesday afternoon, I spoke to the principal and deputy principal about the student’s re-entry. The situation is of considerable concern to me as the student is angry with me. I have asked for a meeting with his mother and feel I need to re-establish a relationship with him prior to his re-entry. A meeting was organised for Friday but the mother cancelled early on Friday morning.
The incident which caused the suspension and concerns about the student’s state of mind on re-entry have caused me personal stress during this week but his absence from class has had a very positive effect. [T# 177]
Most of the activities referred to in this very brief summary of a week in a Year 6 class had flow-on effects.
‘A’ had to document the events leading to the suspension on Monday, a task she was not able to complete until Monday evening. She met with the pre-service teachers after school on Monday, Tuesday, Thursday and Friday and prepared interim reports on their progress on Tuesday after school. The presentations from guest speakers required the teacher to organise a data projector and rearrange furniture. A parent meeting with the new student being assessed was required before school on Monday. There was an incident with a Year 7 student and ‘A’ was involved in debriefing after the incident with the staff member concerned and the deputy principal. Lesson preparation was also required.
‘A’ replied ‘Yes, strongly’ to the three questions about her job satisfaction: she enjoyed her work, she felt supported and she felt she was able to make a difference to her students. She reflected on the week she described as ‘Not at all typical’ on the back page of the Teacher Survey Form:
I feel I must take this opportunity to ‘tell it like it is’ even though I have personally experienced many positive outcomes from inclusion and acknowledge the right of all children and their parents to choose their place of education.
Many of the special needs students impede the teaching and learning of other students as they demand a comparatively large part of a teacher’s time and effort. This occurs during class time because they need a completely separate academic program. I have spent so much time creating learning experiences that are appropriate for one child out of 29 or 30. Behaviour problems range from constant distractions, noises, actions and frequent foul language to actions that are a real threat to the personal safety of other students. In addition to the stress created, the learning experiences have to be limited as a result. … Parents of the other students rarely complain, possibly because of an attitude of ‘it could be my child’ and teachers work very hard to shield the other students and defuse situations so as to reduce the effects. And parents don’t realise how disruptive other children can be to their child’s learning. [T# 177]
This teacher’s description of the nominated week provides an illustration of the breadth of expectations placed on teachers and the juggling act required to meet the needs of all students in a large class with a wide range of needs.
56
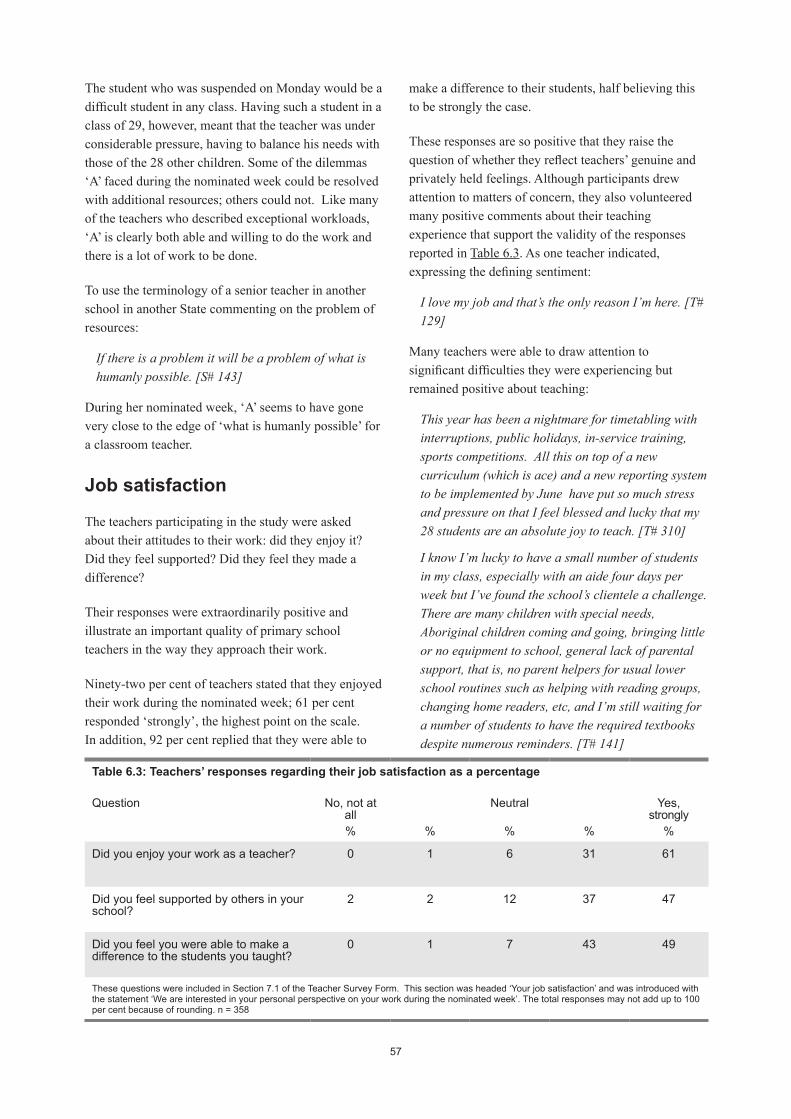
The student who was suspended on Monday would be a difficult student in any class. Having such a student in a class of 29, however, meant that the teacher was under considerable pressure, having to balance his needs with those of the 28 other children. Some of the dilemmas ‘A’ faced during the nominated week could be resolved with additional resources; others could not. Like many of the teachers who described exceptional workloads, ‘A’ is clearly both able and willing to do the work and there is a lot of work to be done.
To use the terminology of a senior teacher in another school in another State commenting on the problem of resources:
If there is a problem it will be a problem of what is humanly possible. [S# 143]
During her nominated week, ‘A’ seems to have gone very close to the edge of ‘what is humanly possible’ for a classroom teacher.
Job satisfaction
The teachers participating in the study were asked about their attitudes to their work: did they enjoy it? Did they feel supported? Did they feel they made a difference?
Their responses were extraordinarily positive and illustrate an important quality of primary school teachers in the way they approach their work.
Ninety-two per cent of teachers stated that they enjoyed their work during the nominated week; 61 per cent responded ‘strongly’, the highest point on the scale. In addition, 92 per cent replied that they were able to
make a difference to their students, half believing this to be strongly the case.
These responses are so positive that they raise the question of whether they reflect teachers’ genuine and privately held feelings. Although participants drew attention to matters of concern, they also volunteered many positive comments about their teaching experience that support the validity of the responses reported in Table 6.3. As one teacher indicated, expressing the defining sentiment:
I love my job and that’s the only reason I’m here. [T# 129]
Many teachers were able to draw attention to significant difficulties they were experiencing but remained positive about teaching:
This year has been a nightmare for timetabling with interruptions, public holidays, in-service training, sports competitions. All this on top of a new curriculum (which is ace) and a new reporting system to be implemented by June have put so much stress and pressure on that I feel blessed and lucky that my 28 students are an absolute joy to teach. [T# 310]
I know I’m lucky to have a small number of students in my class, especially with an aide four days per week but I’ve found the school’s clientele a challenge. There are many children with special needs, Aboriginal children coming and going, bringing little or no equipment to school, general lack of parental support, that is, no parent helpers for usual lower school routines such as helping with reading groups, changing home readers, etc, and I’m still waiting for a number of students to have the required textbooks despite numerous reminders. [T# 141]
Table 6.3: Teachers’ responses regarding their job satisfaction as a percentage
Question No, not at all
Neutral Yes, strongly
% % % % %
Did you enjoy your work as a teacher? 0 1 6 31 61
Did you feel supported by others in your school?
2 2 12 37 47
Did you feel you were able to make a difference to the students you taught?
0 1 7 43 49
These questions were included in Section 7.1 of the Teacher Survey Form. This section was headed ‘Your job satisfaction’ and was introduced with the statement ‘We are interested in your personal perspective on your work during the nominated week’. The total responses may not add up to 100 per cent because of rounding. n = 358
57

These comments illustrate how primary teachers can remain positive about being a teacher, even when they are teaching in challenging or stressful contexts. For many, an important part of the role is their relationship with their students, about whom they have a strong sense of responsibility and commitment. This is not surprising, given the dependence of primary school-age students on the adults who care for them.
Teachers’ responses to the question about support were not as unreservedly positive, however. Sixteen per cent were either negative or neutral about this question. While the vast majority (84 per cent) were positive, a sizeable minority of teachers were looking for more support from their colleagues than was available.
Although many teachers complain about the lack of time both in and out of school hours, they feel that huge benefits can result when professional sharing is productive:
I work with a Years 5-6 team that is highly motivated, plans every week thoroughly in both content and delivery of curriculum so that all children receive equal opportunities. The team is very experienced and planning meetings are often highlighted with lively debates on curriculum and implementation strategies. [T# 265]
An expectation of collegial support is now so well established that its absence can be discouraging. A male new graduate teacher explained problems he had faced getting the level of professional support he felt he needed as a beginning teacher:
I was under the impression, perhaps mistaken, that by communicating as a team we would be able to solve and work out issues revolving around programming, planning and assessment. With a few exceptions, my team is in disarray with our leader and assistant principal preoccupied with another project rather than leading us. There is a climate of everything being done on the run and consequently little, if any, discussion as to the real needs of a new teacher with little experience in programming. This has seriously impacted on my job satisfaction and has almost driven me to resign. [T# 97]
The final example provides an insight into how primary teachers think about their work. A participating teacher indicated that she did not enjoy her work and was not given adequate support. Her response on her Teacher Survey Form rang alarm bells for the researcher
visiting her school, who asked her why she felt this way. Afterwards, the researcher added the following comments to her Teacher Survey Form to explain the situation:
This teacher’s response to the question: ‘Did you enjoy your work as a teacher?’ is unusually negative but needs to be seen in the light of her circumstances. I visited the class twice during my time at the school, once with the principal as part of the school tour and once when I arrived early to discuss her comments during the morning break. On both occasions, the teacher was working productively and was well in control; the class had positive vibes. The children left for the morning break in an orderly and calm way and the children were smiling and happy.
If one examines the class, it is obvious that this ‘good’ teacher is carrying a heavy load of children with special learning needs. One boy, a behaviour management problem, has been ‘moved’ from other schools and has one-on-one counselling support weekly. In addition, she has two students with disabilities, a student who is hearing impaired but not classified as having a disability and another eight students with low attainments. The teacher is also doing four hours’ tutoring out of school hours because there was no one else available to teach a student eligible for a Reading Assistance Voucher.
I didn’t see the teacher as ‘negative’ in any respect – merely exhausted. It is interesting that the principal’s daughter has been placed in this class and I’d place my daughter in it too! [Researcher’s comments relate to [T# 161]
Although support was provided for the boy placed in the school following behaviour management problems elsewhere, the teacher felt the school’s discipline policies were not working and that the school’s senior staff were not available to help her.
This example also illustrates the risks associated with overloading ‘good’ teachers. The extraordinary emphasis placed on ‘being positive’ may mask warning signs that an overload threshold is about to be reached. If being negative is not seen to be normal or accepted among primary teachers, or is interpreted to mean that a teacher is not competent or effective, the ‘good’ teachers may see resignation as the only way out.
58
Conclusion
Teachers form an ageing workforce and there will be a considerable turnover during the next decade.
Whether the culture of primary education, with its focus on children and its valuing of collegial professional service, can be sustained or whether it is replaced by a more individualistic culture, remains to be seen.
There are practical limits to the breadth of specialised curriculum knowledge and expertise that regular classroom teachers should be expected to demonstrate.
Most feel confident about teaching English and Mathematics but some recognise their lack of expertise in other areas. Unlike secondary teachers, who are expected to be specialists in two learning areas, there is a perception that primary teachers should be specialists in all eight. When public debates about school standards fail to differentiate between the circumstances of primary and secondary schools, primary teachers feel—justifiably— that expectations of them have escalated.
Currently, most primary schools have a limited number of specialist staff. Often specialists are part-time appointments. Some take on responsibility for teaching subjects in which the school has set a priority or in which colleagues lack confidence. Others fill curriculum leadership roles or manage library and information services. There is no standard pattern. To extend the amount of specialist teaching would require school resource levels to be augmented.
In earlier chapters, the case has been made that there has been an intensification of the work of teachers. The positive attitudes of teachers towards their work,
described in Table 6.3, is not necessarily inconsistent with the intensification claims. Most accept that teaching is hard work but they want more recognition of the effort they are making and are distressed by what they perceive to be unfair, unrelenting and unanswered media criticism of standards in primary schools. It would be hard to cost the goodwill of primary teachers and it is a resource that should not be put at risk.
For the time being, however, most teachers in primary schools feel positive about their work, even though the going is tough for many of them. They are not inclined to complain publicly. Their professional commitment to the children whom they teach enables them to weather tough times. Even teachers in the most challenging schools with the greatest shortfalls in resources maintain a positive disposition.
It is crucial that government and education authorities preserve the culture of primary schools, a culture that sustains extraordinarily high levels of commitment, efficacy and goodwill.
Recommendation
8. Education authorities should ensure that all schools in their jurisdiction have the capacity to develop at least one subject other than English and Mathematics into an area of excellence through the use of specialist instruction. Funds should be allocated to enable the progressive development of specialist subjects identified by schools and their communities. Low-SES schools should be given priority.
59

60

Introduction
The aphorism that the whole is more than the sum of its parts applies to schools: they are much more than aggregations of classes of students. The norms that govern the academic aspirations of children and standards of behaviour are formed by the whole school community as well as by negotiations between classroom teachers and their students.
However, the school itself is a part of the larger whole: that is, the wider community from which it draws its students.
The main focus of this chapter is on the variations among schools and, in particular, the extent to which some schools have a harder job than others because of their locations, the nature of their student intakes and the absence of community support.
There is considerable diversity among Australia’s 6,500 stand-alone primary schools. However, before examining differences among schools a summary of some of the common features of primary schools is provided.
The ‘average’ primary school
Staff and student numbers
A century ago the one-teacher school was the most common type; these days there are only a few, as they are much more costly to operate than larger schools 67.
At the other end of the scale, there are primary schools of over a thousand students. The cost per student is reduced greatly because of the economies of scale. The distribution of schools in this study is shown in Figure 7.1.
The average enrolment in 2006 in the primary schools in the study was 270 students. The average number of teaching staff members allocated non-contact roles was 1.3 FTE. This included the principal and teachers in leadership roles. There were 15.9 FTE classroom teachers, who were supported by 2.6 FTE non-teaching staff members. In addition to the classroom teachers, schools of average size employed 2.4 FTE teachers in specialist and support roles.
Schools employed an average of 1.6 FTE clerical staff to undertake the various administrative tasks under the direction of the principal and teachers in leadership roles. It should be evident from these figures that primary schools have a very lean management structure, consisting on average of a team of fewer than 3.0 FTEs – principal, deputies and clerical officers.
It is difficult to report the average time allocations for grounds, maintenance and cleaning, as these services are often contracted out.
7
Schools
Figure 7.1: School enrolments 2006
n =157, sd = 208.
61

In centralised systems, allocations for teaching and non-teaching staff are usually made by the system on the basis of student enrolments or a resource formula tied to it. In devolved systems and independent schools, the principals determine the staff profiles.
Generally, it is up to school principals to decide the configuration of class groupings based on matching the teaching staff available, the age of the students enrolled and the classrooms available. In this study, participating teachers reported an average of 22.2 students in Years K-2. Teachers in Years 5-7 had the largest classes, with 26.0 students, while those in Years 3-4 reported 25.3 students per class.
Principals reported that parents preferred ‘straight grades’: that is, class groupings with students from the one year level. This is not possible in a small school. Even in a large school it can be hard to avoid classes with a mixture of year levels. The surest way of avoiding multi-level classes is to fill the classes in each year level and then cap further enrolments. In practice, few principals are able to manage enrolments in this way, either because their schools are under-enrolled or because they are obliged to enrol students who live in their catchment areas.
Facilities
The facilities available in primary schools can vary considerably, due to a range of factors. Schools that were larger and newer tended to have more specialist facilities. Older schools and schools with low enrolments were usually engaged in a game of ‘catch up’, petitioning authorities for upgrades or new building programs.
There is a link between the capacity of schools to develop good programs and the quality and scale of their facilities. It is much harder for a school to promote all of the KLAs if it consists of little more than regular classrooms, a set of offices for the principal and clerical staff and a reception area. Most primary schools were not designed to achieve the National Goals.
Schools with declining enrolments had surplus classrooms that could have been a bonus but were often a liability. Such classrooms were often too small, badly built and poorly maintained. In a context of falling enrolments, schools were unlikely to have the resources to remedy such problems but many used these classrooms anyway.
Schools with growing enrolments were well placed to add new purpose-built infrastructure, particularly if growth had been planned so that they could add a class group each year until a new stream had been formed. If growth was unplanned (that is, it was an aberration rather than a trend) or the schools lacked adequate resources for capital works, then they generally needed to rely on portable classrooms or convert specialist learning areas back into classrooms.
Primary schools tend to be too small to acquire the funds (or, in the case of non-government schools, have sufficient income to service debts) needed for capital works. Being small also works against their political interests, as they are more likely to be invisible to capital grants administrators. Sadly, capital works have been done on the cheap. Old and sub-standard structures place a huge pressure on primary schools. This has become increasingly challenging as safety requirements have become more rigorous. Limited funds must be diverted to urgent works, such as replacing asbestos materials or removing trees that have died as a result of the drought. Many of these requirements are very expensive.
The most common specialist learning facility in primary schools is the library. Ninety-nine per cent of schools in the study said they had libraries of some kind.
The next most common facilities were withdrawal rooms for working with small groups of children, computer laboratories and hall or gymnasiums. Each of these was found in approximately half the schools in the study (54, 52 and 52 per cent respectively).
Other specialist learning areas (such as music rooms or art rooms) were created when classrooms became available following declining enrolments. Thirty-seven per cent of schools had learning areas used for specialist programs. Such facilities are converted back to classrooms if enrolments increase.
Governance
Government schools are accountable through district officers to a director-general or chief executive officer. Most government school systems have maintained centralised control over staffing. There have been some delegations—allowing, for example, selection of staff by schools—but these usually involve constraints. Experienced principals had learned to
62
manoeuvre artfully around the power relationships in bureaucracies. While many systems had programs designed to increase decision making at the school level, principals complained that workload had been devolved more successfully than the decision-making authority.
The Catholic system also exercises strong central control, usually through a Catholic education office or a similar structure in a diocese. Catholic education offices perform the same functions as government school systems: for example, administering payroll services. The bishop in each diocese determines the roles of parish priests under canon law. In dioceses where priests have roles in school governance, they are involved in decision making about enrolments, building programs and financial management as well as in pastoral matters.
Systemic schools in both the government and Catholic sectors are encouraged to form school councils, but these bodies function mainly in an advisory role. Independent schools, on the other hand, are corporate entities that require formally constituted school councils. This creates a relationship between principals and councils that parallels that of a general manager and the board of directors in a company.
One of the reasons why school councils in systemic schools play a marginal role in school governance is that not all communities can locate competent representatives and persuade them to serve on the councils.
Other services
Primary schools also vary in terms of their functions.
There has been a growing tendency to extend their services into early childhood education and out-of-school care. One of the drivers for this development is competition among schools. Families that select a school because it has early childhood programs or day care are likely to continue in that school. The loss of a child in one age group may mean that the whole family moves. From the school’s point of view, these extensions, when provided on a fee-for-service basis, can be profitable and thereby augment the school’s income.
In this study, 37 per cent of schools reported having out-of-school care centres on site. This is particularly important in communities in which both parents work.
A quarter of schools reported recreation facilities on site. Co-located health services and community libraries were far less common (7 per cent and 5 per cent respectively).
The school community
A cost or a benefit?
The term ‘school community’ can have a number of different meanings. In one sense it means the people who live in geographic proximity to the school: that is, in the school’s neighbourhood. The members of the community include children, parents and other people on whom the school can draw to assist it with its work.
The extension of parental choice of schooling has somewhat undermined this definition based on geographic proximity. Some primary schools serve families whose children live at considerable distances from the schools and travel on school buses or public transport or are taken to and from school by parents.
These are mainly non-government schools but government schools are increasingly enrolling students from outside their local areas. This may be the result of active recruitment on the part of the school or a perception among parents that the local school is undesirable.
When a school’s students are drawn from a particular neighbourhood, the school community will reflect the characteristics of that neighbourhood. If the community is prosperous and motivated to support the school, it will be an asset. If not, the staff in the school will have to work harder to develop trust and establish a harmonious relationship. In such cases, the community is more likely to be drawing resources away from the school than directing resources to it.
The benefits from having a strongly supportive community can be huge. Parent representatives can be strong lobbyists with governments and education officials; school councils can become effective sounding boards; considerable resources can be acquired by fundraising (some schools in this study acquired new buildings by this means); community leaders can provide promotional support that builds the schools’ reputations; teachers can be assisted by competent parent helpers – the list could easily be extended. The net effect is that with this support, the school is able to concentrate on its core business: the education of the students.
63

Disadvantaged schools
In general, the circumstances of children from poor communities are different from those with families on adequate incomes. For example, the mother is more likely to have finished school before completing Year 12; the child is more likely to live in a single-parent household where the carer is unemployed or in a low-prestige job; the neighbourhood has fewer amenities; the child has more siblings; and there are fewer books in the household.68
However, it is not parental income per se that counts.This is because the parental characteristics that enable people to get good jobs (such as communication skills, diligence, honesty, good health, dependability and hard work) also improve their children’s life chances. Children of parents with these attributes do well even when their parents do not have high incomes.69 On the other hand, without outside help, parents who are deficient in these characteristics find it hard to create environments that are conducive to their children’s success.
It is also the case that the educational levels of the parents may affect their expectations for student performance. Other factors include the portion of the family income that is available to support student learning, parenting styles, whether parents restrict television watching and read to their children, and family cultural values (for example, the assumptions parents make about occupational goals, whether they intend their children to go on to university).
Australian research suggests that many children enter the formal education system with significant speech and developmental problems. Children arrive at pre-school who can barely speak, have never seen books and paper and pencils, cannot identify their own gender.70 Hence there are huge differences in the cohort of children starting school because of their prior experiences at home. Researchers in the United States found that parents with professional jobs spoke about 2,100 words per hour to toddlers. For working-class parents, it was 1,300 and for those on welfare only 600.71
Sociologists have mapped the geographic distribution of social disadvantage. The incidence of poverty, violence, poor mental and physical health and family dysfunction is much higher in some suburbs and towns than in others. It is possible to identify a relatively
small number of postcodes that contain a massively disproportionate disadvantage.72
In locations where there is a strong community dynamic, there is likely to be greater access to adult supervision, peer groups that can set norms for academic effort and success, and resources to organise after-school activities. Children form attitudes toward adult authority not only from parents but also from the peer groups in which they participate after school and over weekends. These experiences shape how they respond to the behavioural expectations of the school.
Schools in socially disadvantaged locations face an uphill battle. Those parents who have the means to leave or select another school for their children are more often the parents with the qualities that are most desirable from a school’s point of view: positive expectations and an interest in their children’s educational progress.
Measuring disadvantage
In this study, schools have been grouped into SES categories based on two measures.
The first applies to non-government schools. The measure was developed by DEST for allocating recurrent grants to the non-government sectors. Each school’s index is on the public record.
The second measure applies to the government sector. Enrolment figures for each of the schools in the sample were used to select ABS collection districts proximate to the school. The higher the school enrolment, the more collection districts used. The education, occupation and income of the residents of the selected area were then used to create a SES index for each of the government schools.
Both measures are reported as a quotient for which 100 is the average and the standard deviation is 15.
Although the two measures are not identical, they are sufficiently similar to enable schools in the sample to be grouped into three SES categories for the purpose of making comparisons among categories of schools. Further information about this combined scale is reported in Table A6 in the Appendix.
64

School differences and SES
Enrolment growth
Over the period 2003-2006, the schools in the sample increased their enrolments by nearly 3 per cent. Enrolments in the government sector increased by 1 per cent, while those in both non-government sectors grew by 8 per cent.
During the same period, according to the ABS, the enrolments of all primary level students were static.73
Enrolments in the government sector decreased by 1 per cent while those in the Catholic sector increased by 2 per cent and in the independent sector by 10 per cent.
There were some differences among the SES categories. The schools in the middle- and high-SES categories grew by 4 per cent while there was no growth in the low-SES category.
Staffing and enrolment
Table 7.1 shows the ratio of students to the number of teachers on the staff according to the SES of the school intake and the enrolment of the school. It can be seen that low-SES schools had slightly fewer students per teacher and smaller class sizes but the differences were
small: 1.6 fewer students per class and 1.6 students per teacher than the high-SES schools. This difference is neither statistically significant nor of practical significance.
Given the link between student behaviour and SES, the challenge of enabling a whole class of low-SES students to reach benchmark standards is unlikely to be achieved with such a small class size reduction.
The difference between the students per teacher and the students per class is an indication of how many qualified teachers were engaged during school hours in exercising responsibilities other than teaching their own class groups.
As shown in Table 7.1, the difference averaged around six students per teacher. It is from this ‘surplus’ that time can be allocated for the principal and anyone else on the staff qualified as a teacher. The principal must draw on the available staff to relieve classroom teachers for preparation, assign people to specialist roles such as Reading Recovery teachers and other such duties. In deploying teachers, principals must balance pressures to reduce class size, eliminate classes with mixed year levels, provide specialist support and keep their schools running effectively.
Table 7.1: Students per class and students per teacher 2006, school size, SES
SES School size All schools
Small Medium Large
STUDENTS PER CLASS
Low 17.7 23.1 23.9 21.3
Middle 17.5 24.5 25.9 21.9
High 16.4 23.6 25.4 23.0
All categories 17.4 23.7 25.1 22.1
STUDENTS PER TEACHER
Low 13.0 16.65 16.9 15.4
Middle 12.4 17.6 18.4 15.7
High 13.7 16.7 18.9 17.1
All categories 12.8 16.9 18.1 16.0
‘Students per class’ was calculated for each school by dividing the total 2006 enrolments by the number of class teachers in the school. Class groups included special classes and units operating within the sample schools. ‘Students per teacher’ was calculated for each school by dividing the total 2006 enrolments by all teaching staff in the school, including principals, deputy or assistant principals and all specialist teaching staff members. Small schools had 16-128 students (n = 52); medium-sized schools had 129-353 students (n = 52); and large schools had 354-940 students (n = 52).
65

Table 7.1 shows that the category of schools with the lowest third of enrolments on average has nearly eight fewer students per class than the third of schools with the highest enrolments. This is a statistically significant difference. The smaller class sizes provide an important advantage because they help teachers to ensure that their students are engaged productively in class work. However, teachers in smaller schools need to be versatile, since there are fewer specialists on staff to call on for assistance.
The cross-tabulations in Table 7.1 show clearly that the staffing differences among categories of school size were much larger than the differences among categories of SES. In other words, school size is a much more powerful factor than SES when it comes to the staffing of primary schools. This matter is examined further in Chapter 8.
Students with special learning needs
The incidence of students with special learning needs was highest in the low-SES schools and lowest in the high-SES schools. Table 7.2 shows this is the case for both the formally diagnosed students with disabilities and the students that teachers identified as having special learning needs.
Teachers reported students with special learning needs as a major pressure point for primary schools. They claimed that eligibility criteria for funds for these students had become more stringent at the same time that expectations that they be included in mainstream educational settings had increased. The low-SES schools are accepting a greater proportion of this burden.
Classroom behaviour
Given the importance of students engaging in the instructional program, classroom behaviour can be a serious impediment to academic progress, not only for disruptive students but also for the other students in the class and, potentially, for the school if the disruption is of a serious nature.
Teachers’ accounts of some of the difficulties they face are discussed in Chapter 5 under the heading ‘Students with problem behaviour’. This section is mainly concerned with the incidence of classroom behaviour problems that are more often found in low-SES schools.
Students with challenging behaviour
The incidence of children with challenging behaviour was higher in the low-SES group of schools. Table 7.3
Table 7.2: Teachers’ reports of students with special learning needs in their class, SES
SES Students per class with
Disabilities Teacher-identified needs All special needs
Low 1.6 4.2 5.8
Middle 1.1 3.6 4.7
High 1.0 3.4 4.4
Total figures and notes are reported in Table 5.2.
Table 7.3: Teachers’ tallies of students who demonstrated challenging behaviour at least once per day, SES
SES Students who were
Disruptive during class Disrespectful towards the teacher
Verbally aggressive towards another
student
Physically aggressive towards another
student
Low 2.20 0.64 0.60 0.29
Middle 1.59 0.34 0.36 0.19
High 1.55 0.25 0.31 0.20
Total figures and notes are provided in Table 5.7.
66

shows that teachers reported that during the nominated week children in their classes in the low-SES schools were more likely to be disruptive during class, be disrespectful to their teacher and be verbally or physically aggressive toward another student.
On three of these measures, the children in the high-SES schools showed the lowest incidence of challenging behaviours.
Cooperative classroom behaviour has an important role in creating a good learning environment. Disruptive classroom and anti-social behaviour limits opportunities for misbehaving students and, if it is severe or frequent, for other children as well.
Suspensions
As explained in Chapter 5, removing a disruptive student to a ‘buddy class’ or the school office is usually the most serious sanction a teacher can impose. This may be a routine event but it has the potential to disrupt two classes. Suspension from school altogether is an intervention reserved for only the most serious cases and such decisions were usually made by principals in conjunction with the schools’ behaviour management committees.
Table 7.4 shows that teachers in low-SES schools reported imposing sanctions related to behaviour management at more than three times the rate of teachers in high-SES schools.
While these results show a clear trend, teachers’ comments suggest that the actual levels of disruptive behaviour in low-SES schools have been under-reported. Because it was expected that there would be a low frequency of suspensions, teachers were asked to report the number for the year rather than the
number ‘during the nominated week’. It was clear from teachers’ comments that the teachers in schools in which behaviour management was a problem could not always recall the occurrence and did not refer to records when answering this question. They also tended to have different ideas about what was worth reporting. One teacher annotated the margin to say:
I have only entered the times students were sent to the office. I have not included time spent in the buddy room. [T# 190]
Sending students to the buddy room was such a routine event in some classrooms it was not documented as an ‘incident’.
Another teacher explained that the behaviour of one of her students was so difficult to manage that the child had been sent home daily at 11.00 am for the previous four weeks. She said she had not counted this as a suspension because it had been arranged with the parents as a behaviour management strategy rather than a sanction. [T# 185]
Teachers’ reports of contacting parents
As part of the section on student behaviour in the Teacher Survey Form, teachers were asked to keep a tally of the number of times they sought to make contact with a student’s parent because of a problem that occurred during the nominated week.
Table 7.5 shows that on average teachers attempted to make contact with a parent because of a problem every six days. The need for this increased with the class
Table 7.4: Students suspended from class and school, SES
SES From class From school
Low 3.6 0.53
sd = 7.0 sd = 1.5
Middle 0.8 0.32
sd = 1.1 sd = 0.6
High 0.8 0.09
sd = 1.5 sd = 0.3
Total figures and notes are reported in Table 5.8.
Table 7.5: Teachers’ tallies of attempts to contact parents per day, SES
SES
Low 0.25
sd = 0.4
Middle 0.18
sd = 0.3
High 0.11
sd = 0.2
Total 0.17
sd = 0.3
Teachers provided this information in Section 3.3 of the Teacher Survey Form. They were asked: ‘Please show a tally of students in your class who prompted you to make contact with a parent or carer because of a problem’. n = 348.
67

groups in the low-SES schools: teachers reported that they sought to make contact on one in four days.
The attempted contact rate was more than halved for the high classes in the high-SES group of schools, where teacher sought to make contact on one out of nine school days.
In all categories there were teachers who reported they had no need to contact parents during the nominated week. The maxima show that for some schools contacting parents about problems with their children occurs on a routine basis. This practice is time consuming and not always productive.
Benchmark results
Table 7.6 shows that academically successful students were concentrated in the high-SES schools and that the average performance of the middle-SES group of schools was between the performance of the high- and low-SES schools. On average, SES influenced the performance of schools in this study.
As might be expected from this finding, there were some differences in time allocations to the KLAs related to SES. Teachers in high-SES schools spent 30 minutes per week less on English than teachers in the other two SES categories (545 minutes compared to 575 minutes).
A variation of 19 minutes per week was evident in Mathematics instruction time between the low-SES schools (273 minutes) and the middle-SES schools (254 minutes).
Some other variations in time were evident, but, given the shorter periods available to the other KLAs, these differences were a relatively small proportion of the week.
Schools with high proportions of Indigenous students
The average Indigenous enrolment, calculated as a percentage of total enrolment in the sample, was 4.9 per cent. This compares with 4.7 per cent at the primary level of education reported by ABS for 2006.
When calculated per school, the average Indigenous enrolment was 7.3 per cent. This reflects the concentrations of Indigenous students in small schools and low-SES schools. The average proportion of Indigenous enrolments in each of these categories was 12 per cent.
There were exceptions to this general pattern of Indigenous enrolments. The highest Indigenous enrolment in a school was 249 students: almost all of the students in the school were Indigenous. The school with the second-highest Indigenous enrolment was relatively large: 38 per cent of its 624 students were Indigenous.
Although Indigenous students generally lived in suburbs or towns near the schools they attended, principals also reported small but significant numbers of students who either lived in town camps or were transient. These students were likely to be connected to kinship groups in the local area and were visiting so families could obtain access to local services or because they had moved away from problems elsewhere. Principals reported difficulties in contacting and engaging the parents of transient students, yet their children were frequently absent and had other problems with schooling. It was because of these problems that school staff felt obliged to spend the time and resources required to make contact.
Table 7.6: Students performing at or above national benchmarks in reading and numeracy 2005 as a percentage, Years 3 and 5, SES
SES Reading Numeracy
Year 3 Year 5 Year 3 Year 5
% % % %
Low 82.5 83.4 81.1 84.4
Middle 92.1 87.7 92.2 91.7
High 94.4 91.0 94.0 92.2
Total figures and notes are reported in Table 5.4.
68
There were also schools in which principals reported cases of students living in families where there were significant domestic issues, serious health and nutrition problems and where there was a lack of parental supervision at night. The extent to which this occurred varied widely, with some principals indicating that the frequency was no greater than in non-Indigenous families.
Nevertheless, for some schools this introduced a welfare role and the need to liaise with other agencies.
Principals in schools experiencing challenges associated with Indigenous students reported that the strategies they had put into place were very resource intensive. Two of these strategies are discussed. The first relates to absenteeism and the second to school-community relationships.
In almost all of the schools with high proportions of Indigenous students, absenteeism or regular lateness was (or had recently been) of concern. Teachers explained the difficulties they had in maintaining an effective teaching program in such classes. Some found it demoralising to prepare lessons for students who did not attend.
A teacher in a remote Indigenous school [T# 125] reported that of 29 school-age children in the community who could have attended the teacher's class, 19 were enrolled formally and on average 12 students came for at least part of the day. The number of students who ‘attended regularly’ (that is, attended for at least half each day on most days) was nine. Even among these students absences for a day were not uncommon.
Strategies to improve attendance included a principal who drove to the town camp to pick up students in the morning [S# 65], as did a community elder at another school [S# 58].
A third school monitored attendance closely and when a student was absent, an IEW immediately contacted or visited the parents or carers [S# 55]. A fourth enforced a strict interpretation of the legislative requirements regarding attendance and contacted relevant agencies to report repeated or long-term absences [S# 23]. In a fifth school, a breakfast and lunch club was organised to encourage school attendance and to address health and nutrition needs [S# 85]. These strategies continue to be needed to maintain improvements.
Investing in school-community relationships is one of the strategies used to improve attendance but is also seen as a valuable school development strategy in its own right.
Some schools sought to involve community elders while others restricted participation to special occasions. Elders had important roles in some schools, including responsibility for a cultural program and community liaison [S# 57]. A deputy principal said that participation by elders had declined in recent years, a situation the school had found difficult to address as the problem related to conflict associated with kinship issues in the local community [S# 69].
The amount of time spent by principals in strengthening school-community relationships should not be underestimated. It is substantial and, in several schools, it had resulted in limited tangible benefits to the school.
IEWs were seen as valuable resources in schools with high proportions of Indigenous students. They undertook a broad range of duties, including assisting with literacy programs; promoting Indigenous cultural activities; performing community and family liaison; assisting with behaviour management; and promoting cultural awareness among the school staff. Most importantly, they were strong role models for Indigenous students.
The role of IEW was not without difficulties, however, and some principals and teachers questioned the usefulness of some appointments.
The availability of suitable applicants for the role was an issue, particularly in some small communities where there were few adults with sufficient literacy skills to assist the classroom teachers. IEWs were often recruited through informal methods and relied on family connections, particularly if a family member was already working in a school. Principals cited employment conditions as a disincentive.
The combination of the shortage of suitable applicants, informal recruitment methods and insufficient training led to situations in which some non-teaching staff members were unable to provide as direct a benefit to the schools’ programs as might have been expected.
One school [S# 65] had ceased employing local Indigenous people in non-teaching roles and used
69
these resources to strengthen its teaching program. It was, however, involved in training a local Indigenous community member as a teacher. The school had a well-developed program of competitive sport, which was considered vital in encouraging Indigenous student participation and bringing the Indigenous community into the school. It had also developed ICT as a priority, as this was valued by both Indigenous and non-Indigenous students. These strategies were not isolated but were part of a comprehensive package of strategies. For example, an induction program that included a visit to the local town camp was provided to teachers when they were appointed to one school.
A number of principals felt that too much attention was focused on the problems experienced in the education of Indigenous students and not on the opportunities such students brought to their schools. Despite this, the problems described were serious and, in some schools, far from isolated.
Staffing schools
Difficult-to-staff schools
Historically, the appointment of teachers in large, centralised staffing systems to less-preferred schools was managed through mechanisms that rewarded service in the least-preferred schools with service in the most-preferred schools. Teachers who were in the profession for the long haul generally accepted these trade-offs and older teachers are still able to recount how they and their families spent many years in regional Australia, as they moved along a seniority-
based career path. It was a system that favoured men and rewarded uninterrupted service.
Because this method served the systems’ need to staff the hard-to-staff schools, there was a reluctance to devolve recruitment and selection of teaching staff to schools.
It was clear that, without a strong, centralised bureaucracy to place teachers, market forces would favour schools in desirable locations with highly motivated students and supportive local communities.
These are the kinds of areas in which teachers seek to educate their own children. In fact, schools in areas where teachers choose to live have an advantage, regardless of whether teacher selection occurs centrally or not.
To maintain an equitable system, authorities provide incentives for service in schools that are difficult to staff. These include increased salaries and other payments such as district allowances, and conditions that take account of the hardship (for example, travel costs and substantially greater leave entitlements). Catholic school principals also have additional leave entitlements so they can travel or study to ensure continuing renewal. Even these sorts of payments and conditions were insufficient to attract teachers to the schools that were hardest to staff when primary school teachers were in over-supply. As the labour market shrinks, inducements of this kind may need to be increased.
Table 7.7: Principals’ ratings of statements about recruiting teachers as a percentage
Statement Disagree Neutral Agree
% % % % %
We have had problems recruiting suitable teachers in specialist learning areas.
21 7 26 13 32
Recruiting and holding suitable teachers is one of the biggest challenges we face.
25 10 24 12 29
Many teachers want to work here, so we have a good supply of high quality teacher applicants to choose from.
18 12 25 19 25
I have accepted a teacher I consider less than satisfactory because he or she was the best available candidate.
53 6 12 12 17
Principals were asked to respond to each statement in Section 2.2 of the School Survey Form. The total responses to each statement may not add up to 100 per cent because of rounding. n = 156.
70

Recruiting teachers
Principals were asked to rate a series of statements about their capacity to recruit teachers. Table 7.7 shows that more than a third of schools found it difficult to recruit and hold suitable teachers, particularly in specialist areas. About a quarter of principals had found themselves having to make an appointment with reservations about the likely quality of the teacher selected.
In 2006, nearly one-third of schools had problems in finding and holding suitable staff. It is likely that the situation has worsened since then. During periods of reduced teacher supply, there are risks associated with policies that provide teachers with opportunities to desert these schools.
Following a program of class size reduction in California, there was a migration of teachers away from the state’s poorest schools to schools in affluent areas with better working conditions. The schools that ought to have benefited the most actually benefited the least.75
This was a case of policy makers not having enough knowledge of the challenges that low-SES schools face. Similar outcomes can be expected in Australia if across-the-board resource increases are made without full consideration of the particular circumstances of the most-needy schools.
Problems associated with recruitment were not recognised at the time the survey items were developed, so systematic data about vacancies were not requested. There was some evidence, however, that this issue was
a serious problem for a small number of the sample schools during 2006.
A small Indigenous community school [S # 144] was unable to fill a vacancy created during the school year when one of the classroom teachers resigned. The principal kept the school going by increasing his own teaching load. The situation became evident to the research team because there was no-one in the school available to answer the telephone. A problem like this remains invisible as long as there is someone willing to step into the breach.
Another hidden example was reported when a school declined to participate in the study. At the time the two-teacher school was approached, because of a vacancy one teacher was managing by teaching one class in the morning and the other in the afternoon. Needless to say, she was not well placed to further increase her workload by participating in a survey about school resourcing.
Replacing teachers
It is normal for teachers to be absent for various reasons. It is so common that some of the best-resourced schools appointed replacement teachers on a permanent basis to ensure that programs did not suffer when teachers were absent or were required to attend to duties outside their classroom.
Table 7.8 shows that finding suitable replacement teachers is more difficult than recruiting either classroom or specialist teachers and that while the cost of replacing teachers constrained about one-third
Table 7.8: Principals’ ratings of statements about replacing teachers as a percentage
Statement Disagree Neutral Agree
% % % % %
The school has had difficulty finding suitable relief teachers.
18 13 6 18 45
Releasing teachers for professional development has been made difficult because of a shortage of relief teachers.
36 13 12 18 21
The school is more constrained by the cost of relief teachers than their availability.
41 14 10 11 24
When a class teacher is absent the students are placed in other classes because a relief teacher is unavailable.
48 21 9 14 8
Principals were asked to respond to each statement in Section 2.3 of the School Survey Form. The total responses to each statement add up to 100 per cent. n = 157
71

of schools, a greater proportion were inhibited by the availability of suitable replacement teachers.
The severity of the shortage is emphasised by reports from about one-fifth of principals that classes were split and shared around the other classes in the school when replacement teachers could not be found.
It should be noted that there were a number of instances of participating teachers reporting having extra students in their classrooms because relief teachers could not be found but their principals asserting that this practice was not in use in their schools. It is possible principals completed their forms before the need for splitting classes arose or that they were not aware the practice was in use in their schools. It is also possible that they sought to hide the practice, believing it to be a sign that the school was under pressure and, by implication, not good for business.
A remote community school with a high proportion of Indigenous students [S # 56] reported that there were no relief teachers available at all. There was provision for a travelling relief teacher who rotated among schools, but no appointment had been made when the school was visited in May 2006. When there had been someone in the position, the person had spent a week in the school once a month to give the teachers their allocated non-contact time in a block. However, such a use of non-contact time was highly disruptive to student learning, and therefore the class teacher continued teaching with the support of the visitor. Furthermore, without a readily available relief teacher, the two classes had to be amalgamated if one of the teachers needed to be absent. This disrupted the programs of both classes. In general, the study found schools in remote areas experienced difficulties in both recruiting teachers and employing relief teachers.
If there is a reliable supply of relief teachers, or staff members are appointed to a school for the express
purpose of providing relief, they can be used across the school so that the students get to know them. One of the problems of not having a reliable supply is that relief teachers come in cold for short periods of time and behaviour management becomes an issue. A number of teachers reported that students had not been disruptive when they were in the classroom but there had been problems for relief teachers. With ad hoc allocations of non-teaching time made necessary by the overall shortage of time, this kind of disruption is not infrequent.
Leadership
This study did not set out to investigate leadership. However, during interviews, many principals reported that they were under enormous pressure.
Accountability arrangements make it clear that the buck stops with the principal. However, principals were motivated mainly by concern for the welfare of their students and their staff, whom they held in high regard. They also expressed dismay at the quality of their personal lives and the transmission of these pressures onto their families.
Principals in well-resourced schools with supportive parents and well-behaved students worked hard, too. However, researchers visited many primary schools in which order and success were finely balanced and there was no slack to be taken up. Some principals doubted if they would continue in the job, even though they were not yet of retirement age. They wondered who would take their places when the current generation decided to step down. Many reported that the senior teachers in their schools were not attracted to the role.
When principals were asked whether they had sufficient power to manage their schools, only 24 per cent said they needed more. As Table 7.9 shows, 56 per cent said they had sufficient power to manage their schools. This
Table 7.9: Principals’ responses to a question about the powers they need as a percentage
Question I need a lot more
Neutral I have the powers I
need% % % % %
Are there additional powers you need to
manage your school effectively?
4 20 20 36 20
Principals were asked to respond to this statement when interviewed during the school visit. The total responses to the question add up to 100 per cent. n = 143
72
response was stronger in the non-government sectors (80 per cent) than the government sector, in which only 49 per cent reported having sufficient power.
During interviews, many principals reported negative experiences with what had been sold as increased decision making but which they often saw as increased workload. Various degrees of devolution had been introduced during the same period that governments had increased their expectations regarding compliance and accountability.
A deputy principal in a large independent school that reported to a school council said that the school was considering appointing a compliance officer because the workload associated with satisfying all the legislative requirements that affected the work of the school had become so great. These demands were in addition to the requirements for professional accountability that are the responsibility of the teaching staff.
Conclusion
The evidence provided by this study is consistent with a large body of research findings. There were considerable differences among schools in terms of their enrolment of resource-intensive students, the academic performance of students, the richness of the curriculum offered, the level of community support and the availability of suitable teachers. These differences are related to the SES of the school, a conclusion that is consistent with a large body of research evidence.
Low-SES schools are much more likely than high-SES schools to enrol larger numbers of students who are difficult to teach, who are not well behaved or interested in school work, who are not encouraged and supported at home to do well at school, and who struggle to reach the benchmark standards in literacy and numeracy. The challenges for these schools arise partly because of geographic location and partly because teaching in them is so demanding and principals find it difficult to attract the kinds of staff members who are needed.
Although it is difficult to estimate how many schools are struggling to meet the National Goals, the evidence suggests that as many as a third are facing extraordinary challenges.
Recommendations
9. MCEETYA should attach the highest priority to addressing the problem of ensuring that hard-to-staff schools have an adequate supply of able teachers.
10. Schools that are engaged formally in community development work should receive allocations for the coordination activities that take account of the real costs of this kind of work to the school.
73

74
Introduction
This chapter addresses three main issues. The first is the quality and accessibility of the financial information on which primary school funding policies are based. The second is whether governments are directing funding in sufficient amounts to the primary schools that have the greatest needs. The third is whether the mechanisms that are used to allocate and acquit the funding are helpful to schools.
Because of separate Commonwealth and State responsibilities, varying sectoral funding arrangements and differing policies and practices within systems, it is difficult to acquire data about individual school incomes and expenditure and impossible to acquire data sets that are comparable across systems, sectors and States. There is no national database containing actual income and expenditure data for individual schools except that held by DEST for the non-government sectors.
However, with the assistance of school system finance officers and school principals, it has been possible to acquire aggregates of income and expenditure from nearly all of the 160 schools taking part in the study. As far as possible, the financial data from schools have been validated, enabling an investigation to be undertaken into the variation in funding among categories of schools.
Quality and accessibility of data
Sectoral variations in funding arrangements
Nationwide generalisations about how primary schools are funded are possible only in broad terms. The way
in which the recurrent funding is allocated depends on whether the school is government or non-government, independent or systemic, and in which State it is located. Further variations arise because within jurisdictions the calculation of all the resources that are acquired by each school is based on multiple criteria and various formulas.
Government school systems receive most of their funds from State government sources. However, there are significant variations among government systems, so it is difficult to make direct comparisons. The most common resourcing framework in the government school sector provides a staffing entitlement, a budget to meet non-salary costs, and supplementary Commonwealth and State funding for special programs and for students with recognised special needs.
The Commonwealth provides grants for government schools to State systems as a flat amount per student. These funds are then disbursed to schools at the discretion of the system, so they may not be identified at the school level as having originated from the Commonwealth. Commonwealth targeted programs are additional.
In Victoria, a government school’s funding is provided as a global budget. The amount allocated to each school is computed according to a multiplicity of factors, including core operational costs and variable costs arising from, for example, the nature of the student intake and the school’s location. The global budget allows considerable school-level discretion about disbursement of most of the funds.
In other States, there is less discretion: the funds that meet the bulk of the operating costs of the school (staff salaries) are retained centrally.
8
Resources
75
In the case of Catholic systemic schools, governments fund Catholic education offices through block grants that the offices disburse to schools. In the large States, there are several offices, associated with archdiocesan or diocesan boundaries. Elsewhere, a single office serves the entire State.
Except in Victoria, Catholic schools received a staffing entitlement and did not receive funding for salaries; the payroll was generally managed by Catholic education offices in much the same way that government systems manage the payroll for schools.
There are three significant differences in the funding of Catholic and government schools, however.
Firstly, in the Catholic sector, the Commonwealth is the major funding source. Secondly, Catholic schools are more reliant on fees and voluntary contributions than are government schools. Thirdly, Commonwealth recurrent funding is allocated to Catholic education offices as block grants based on the DEST SES index of individual schools and their enrolments. A Catholic education office may then reallocate resources among the schools to which it disburses funds.
Systems in the independent sector are funded in a similar fashion to the Catholic sector, with block grants being disbursed to schools by a system. How this is managed varies according to the history and circumstances of each system.
The government funding of non-systemic independent schools is the least complex and the most transparent, since funds are paid directly to schools. Commonwealth recurrent grants to independent schools are based on each school’s DEST SES index and its enrolments. Commonwealth funding to independent schools is also available for special purposes (for example, literacy, numeracy and LOTE) or for schools in exceptional circumstances (for example, an independent school that is the only provider in a town). The Commonwealth also provides grants for capital works. Government grants are supplemented by fees and voluntary contributions.
In addition, Catholic and independent schools receive State funds, although the level of funding varies considerably among the States. They are generally provided through some variation of a per capita funding model, usually with some needs-based differential resourcing. Non-government schools may also receive
some form of assistance from their State governments for capital works.
This is a very simplified account of how schools in government and non-government sectors are funded.
Out-of-school costs
In this study, the starting point for calculating the schools’ income and expenditure has been their audited statements of accounts. These statements show the income and expenditure authorised by schools and held in school accounts. However, they do not usually show funding allocated and spent on the schools’ behalf by other agencies. Some of these funds may have been spent on behalf of individual schools (such as staff salaries) but some may have been shared across numbers of schools.
Some additional costs and services may be essential to the operation of a school even though they do not appear in the school’s budget. Teacher housing and student transport are examples. In rural and remote areas, schools would close if bus services were discontinued or if it were not possible to house staff members in satisfactory accommodation within a reasonable distance of the schools.
In some cases, independent schools may use public infrastructure or share services: for example, from State curriculum authorities. In others, access to services is restricted to systemic schools, as the costs are met from State education budgets.
The complexities of accounting for shared service and infrastructure costs, when added to the problems arising from the multitude of income streams, the differences among systems and the highly detailed guidelines, make it almost impossible to track all the funding from governments to individual school sites and calculate schools’ total recurrent costs. This is the case even after detailed analysis of school accounts and access to central funding records.
For this reason, the analyses that follow exclude out-of-school costs.
The reliance on average statistics
The most comprehensive picture of primary school funding is to be found in the statistical annex to the annual National Report on Schooling in Australia.75
76
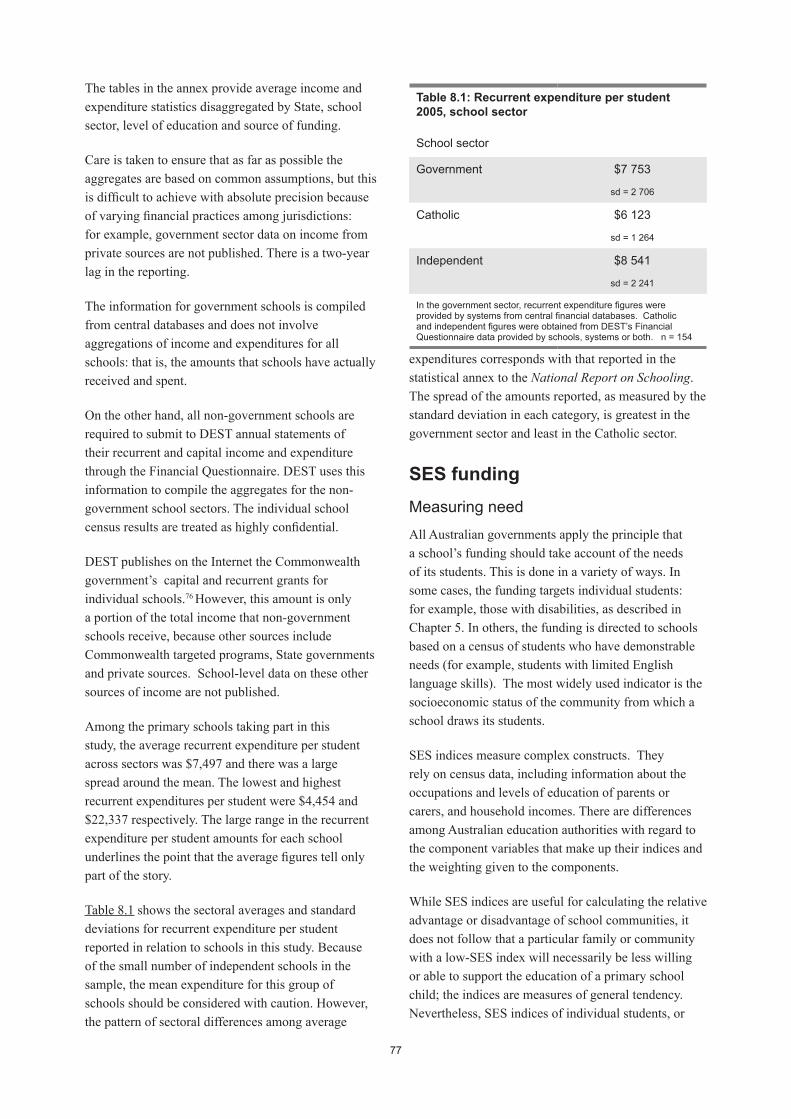
The tables in the annex provide average income and expenditure statistics disaggregated by State, school sector, level of education and source of funding.
Care is taken to ensure that as far as possible the aggregates are based on common assumptions, but this is difficult to achieve with absolute precision because of varying financial practices among jurisdictions: for example, government sector data on income from private sources are not published. There is a two-year lag in the reporting.
The information for government schools is compiled from central databases and does not involve aggregations of income and expenditures for all schools: that is, the amounts that schools have actually received and spent.
On the other hand, all non-government schools are required to submit to DEST annual statements of their recurrent and capital income and expenditure through the Financial Questionnaire. DEST uses this information to compile the aggregates for the non-government school sectors. The individual school census results are treated as highly confidential.
DEST publishes on the Internet the Commonwealth government’s capital and recurrent grants for individual schools.76 However, this amount is only a portion of the total income that non-government schools receive, because other sources include Commonwealth targeted programs, State governments and private sources. School-level data on these other sources of income are not published.
Among the primary schools taking part in this study, the average recurrent expenditure per student across sectors was $7,497 and there was a large spread around the mean. The lowest and highest recurrent expenditures per student were $4,454 and $22,337 respectively. The large range in the recurrent expenditure per student amounts for each school underlines the point that the average figures tell only part of the story.
Table 8.1 shows the sectoral averages and standard deviations for recurrent expenditure per student reported in relation to schools in this study. Because of the small number of independent schools in the sample, the mean expenditure for this group of schools should be considered with caution. However, the pattern of sectoral differences among average
expenditures corresponds with that reported in the statistical annex to the National Report on Schooling. The spread of the amounts reported, as measured by the standard deviation in each category, is greatest in the government sector and least in the Catholic sector.
SES funding
Measuring need
All Australian governments apply the principle that a school’s funding should take account of the needs of its students. This is done in a variety of ways. In some cases, the funding targets individual students: for example, those with disabilities, as described in Chapter 5. In others, the funding is directed to schools based on a census of students who have demonstrable needs (for example, students with limited English language skills). The most widely used indicator is the socioeconomic status of the community from which a school draws its students.
SES indices measure complex constructs. They rely on census data, including information about the occupations and levels of education of parents or carers, and household incomes. There are differences among Australian education authorities with regard to the component variables that make up their indices and the weighting given to the components.
While SES indices are useful for calculating the relative advantage or disadvantage of school communities, it does not follow that a particular family or community with a low-SES index will necessarily be less willing or able to support the education of a primary school child; the indices are measures of general tendency. Nevertheless, SES indices of individual students, or
Table 8.1: Recurrent expenditure per student 2005, school sector
School sector
Government $7 753
sd = 2 706
Catholic $6 123
sd = 1 264
Independent $8 541
sd = 2 241
In the government sector, recurrent expenditure figures were provided by systems from central financial databases. Catholic and independent figures were obtained from DEST’s Financial Questionnaire data provided by schools, systems or both. n = 154
77
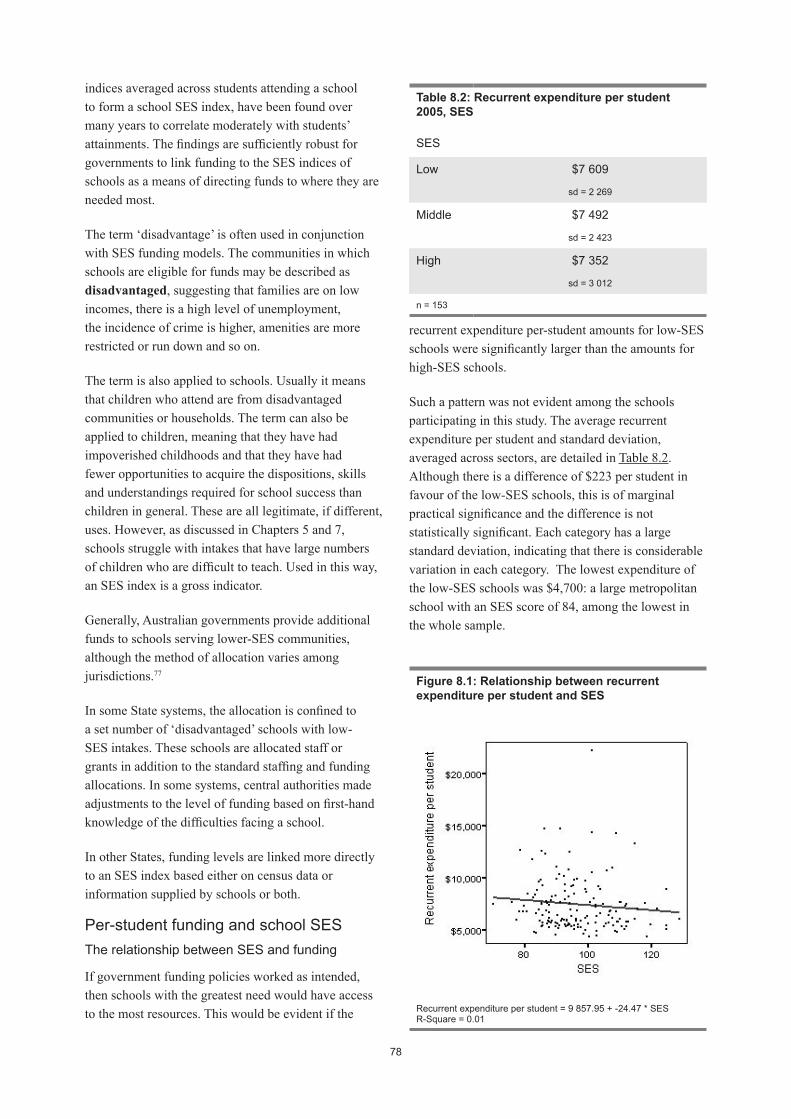
indices averaged across students attending a school to form a school SES index, have been found over many years to correlate moderately with students’ attainments. The findings are sufficiently robust for governments to link funding to the SES indices of schools as a means of directing funds to where they are needed most.
The term ‘disadvantage’ is often used in conjunction with SES funding models. The communities in which schools are eligible for funds may be described as disadvantaged, suggesting that families are on low incomes, there is a high level of unemployment, the incidence of crime is higher, amenities are more restricted or run down and so on.
The term is also applied to schools. Usually it means that children who attend are from disadvantaged communities or households. The term can also be applied to children, meaning that they have had impoverished childhoods and that they have had fewer opportunities to acquire the dispositions, skills and understandings required for school success than children in general. These are all legitimate, if different, uses. However, as discussed in Chapters 5 and 7, schools struggle with intakes that have large numbers of children who are difficult to teach. Used in this way, an SES index is a gross indicator.
Generally, Australian governments provide additional funds to schools serving lower-SES communities, although the method of allocation varies among jurisdictions.77
In some State systems, the allocation is confined to a set number of ‘disadvantaged’ schools with low-SES intakes. These schools are allocated staff or grants in addition to the standard staffing and funding allocations. In some systems, central authorities made adjustments to the level of funding based on first-hand knowledge of the difficulties facing a school.
In other States, funding levels are linked more directly to an SES index based either on census data or information supplied by schools or both.
Per-student funding and school SES
The relationship between SES and funding
If government funding policies worked as intended, then schools with the greatest need would have access to the most resources. This would be evident if the
recurrent expenditure per-student amounts for low-SES schools were significantly larger than the amounts for high-SES schools.
Such a pattern was not evident among the schools participating in this study. The average recurrent expenditure per student and standard deviation, averaged across sectors, are detailed in Table 8.2. Although there is a difference of $223 per student in favour of the low-SES schools, this is of marginal practical significance and the difference is not statistically significant. Each category has a large standard deviation, indicating that there is considerable variation in each category. The lowest expenditure of the low-SES schools was $4,700: a large metropolitan school with an SES score of 84, among the lowest in the whole sample.
Table 8.2: Recurrent expenditure per student 2005, SES
SES
Low $7 609
sd = 2 269
Middle $7 492
sd = 2 423
High $7 352
sd = 3 012
n = 153
Figure 8.1: Relationship between recurrent expenditure per student and SES
Recurrent expenditure per student = 9 857.95 + -24.47 * SES R-Square = 0.01
78

In order to look at the extremes in the distribution, the recurrent expenditures per student for schools in the highest and lowest SES deciles were averaged. The average per capita allocation for the lowest-decile SES schools was $7,811 and for the highest-decile SES schools $6,886, a difference of $925.
The relationship between school SES and recurrent expenditure per student is illustrated graphically in a scatter plot in Figure 8.1. Among the 152 schools in this study that supplied complete financial records, if funding were allocated and expended according to SES there should be an inverse correlation between the SES index of a school and the recurrent expenditure per student: the lower the SES the more that a school is able to spend per student.
The scatter plot shows the SES of schools on the horizontal axis and the recurrent expenditure per student on the vertical axis. The oblique line is the line of best fit and shows that there is an almost zero relationship between SES and level of recurrent expenditure per student. The product moment correlation is -0.11, which is too small to be statistically significant.
SES and recurrent income
The school’s total expenditure is the result of government grants and private sources of income. It is possible that low-SES schools may acquire more government funding but that this advantage is offset by the extra income received by high-SES schools from higher fees and other forms of fundraising. This could account for the near-zero correlation.
The relationship between the school income from government sources per student and the SES index of each school was slightly stronger and statistically significant. The product moment correlation coefficient was -0.21. Figure 8.2 shows the scatter plot.
Table 8.3 shows total income per student and its component parts. The average income from government sources per student for low-SES schools exceeded that of high-SES schools by $856, but the latter raised on average $721 more than the low-SES schools from private sources.
It should be emphasised that the differences described are average amounts. There are large standard deviations for each SES category, and considerably larger standard deviations for the high-SES group of schools.
Figure 8.2: Relationship between income from government sources per student and SES
Income from govt sources per student = 11 637.22 + -50.20 * SES R-Square = 0.05
79
Table 8.3: Recurrent income per student from government and private sources 2005, SES
SES Recurrent income source Total
Government Private
Low $7 219 $425 $7 644
sd = 2 283 sd = 375 sd = 2 242
Middle $6 781 $685 $7 493
sd = 2 422 sd = 591 sd = 2 441
High $6 303 $1 170 $7 513
sd = 3 096 sd = 1 682 sd = 3 062
n = 136

Most non-government schools rely on school fees and other private sources of income. Nationally, these accounted for 42 per cent of the income of non-government primary and secondary schools.78
Government schools also acquire income from private sources but are much less dependent on it.
Table 8.4 shows the amount of private income per student received by SES category and sector.
For the government schools, the amount acquired from private sources varied only marginally according to SES. However, for the non-government sector the variation was much greater: a factor of almost three between high- and low-SES schools. The product moment correlation coefficient between the school SES index and the amount of private income received is 0.31, a statistically significant result supporting the contention that private income enabled the high-SES schools to make up for the lower levels of government funding that they received.
The data from this study suggest that even though in most systems there was extra support for the most- disadvantaged schools, other schools were able to make up the difference through income from private sources.
Variations in staffing costs
In the majority of systemic schools, the central agencies appoint staff members and their costs are met from a central budget. In these cases, schools are staffed according to formulas based mainly on enrolments. The staffing formulas do not take full account of the salary levels of regular classroom teachers. Schools with identical numbers of staff members can have quite
different salary costs if the staff members differ in experience and continuity of service.
To investigate this, the total staff working in each school was calculated by adding together the executive staff, classroom teachers, specialist teachers, office staff and teacher aides reported. Building, maintenance and cleaning staff were not included, because these groups are often employed on a fee-for-service basis and so are not necessarily counted as staff members. This total was then divided by the 2006 enrolment to calculate the number of students per staff member.
Table 8.5 shows that the low-SES schools had lower student-staff member ratios. On this measure, the low-SES schools had more resources than the high-SES schools.
The total number of staff in a school was then divided into the total school expenditure on salaries to estimate the cost of each staff member. Table 8.5 shows that the average cost of a staff member employed was greater in the high-SES schools than in the middle-SES and low-SES schools. The difference between the high- and low-SES categories was $5,310. Although low-SES schools had more staff members, on average they had lower salaries.
This pattern of staff costs can be explained by a number of factors. For example, low-SES schools are more likely to have staff at earlier stages of their careers and to have unfilled positions for longer periods. Factors such as these reduce the cost of a school’s human resources.
Table 8.4: Recurrent income from private sources per student 2005, SES, government and non-government sectors
SES Recurrent income
Government Non-government
Low $301 $936
sd = 154 sd = 564
Middle $428 $1 279
sd =221 sd = 746
High $490 $2 819
sd = 310 sd = 2 419
n = 101 (government sector), n = 36 (non-government sectors)
Table 8.5: Average staff members per school and salary costs per staff member, SES
SES Staff members per school
Salary costs per staff member
Low 11.5 $64 221
sd = 3.1 sd = 10 672
Middle 11.8 $63 849
sd = 3.3 sd = 8 181
High 13.6 $69 531
sd = 2.9 sd = 14 172
Principals reported teaching and non-teaching staff numbers for 2006 in Sections 2.1 and 2.4 of the School Survey Form. Salary costs were obtained from school systems for the government sector and the Financial Questionnaire for the non-government sectors. n = 148 (staff members per school), n = 140 (salary costs per staff member).
80
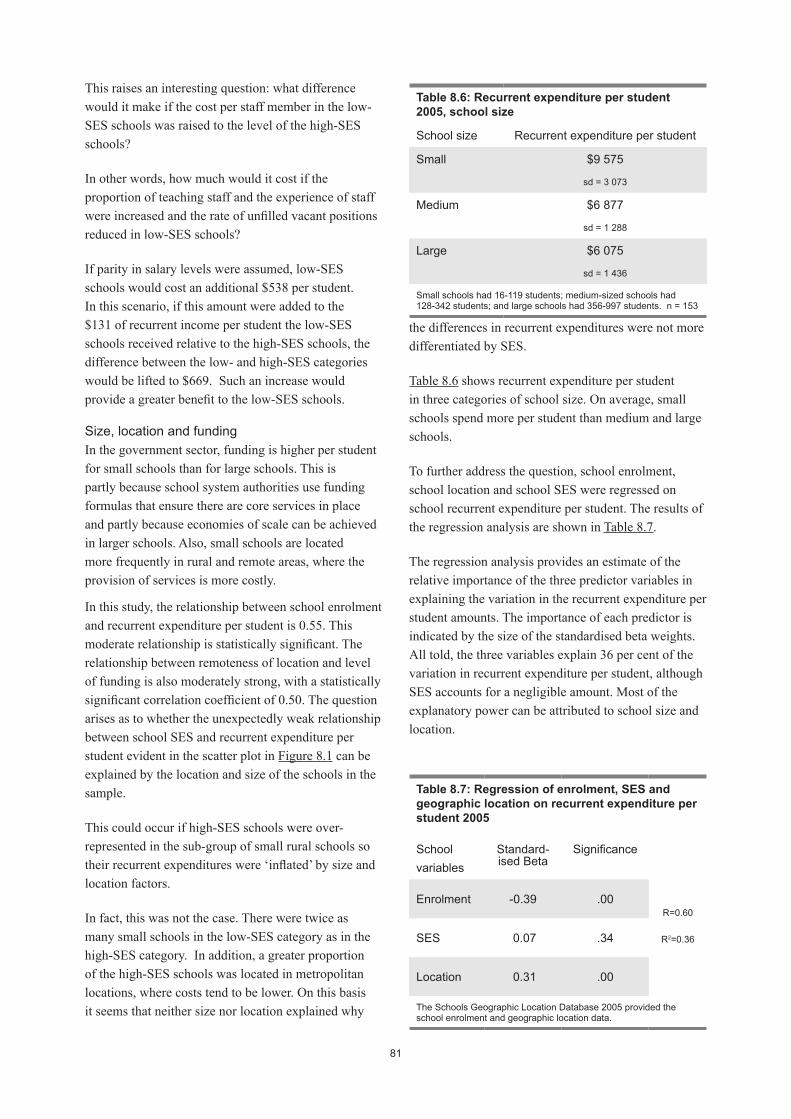
This raises an interesting question: what difference would it make if the cost per staff member in the low-SES schools was raised to the level of the high-SES schools?
In other words, how much would it cost if the proportion of teaching staff and the experience of staff were increased and the rate of unfilled vacant positions reduced in low-SES schools?
If parity in salary levels were assumed, low-SES schools would cost an additional $538 per student. In this scenario, if this amount were added to the $131 of recurrent income per student the low-SES schools received relative to the high-SES schools, the difference between the low- and high-SES categories would be lifted to $669. Such an increase would provide a greater benefit to the low-SES schools.
Size, location and funding In the government sector, funding is higher per student for small schools than for large schools. This is partly because school system authorities use funding formulas that ensure there are core services in place and partly because economies of scale can be achieved in larger schools. Also, small schools are located more frequently in rural and remote areas, where the provision of services is more costly.
In this study, the relationship between school enrolment and recurrent expenditure per student is 0.55. This moderate relationship is statistically significant. The relationship between remoteness of location and level of funding is also moderately strong, with a statistically significant correlation coefficient of 0.50. The question arises as to whether the unexpectedly weak relationship between school SES and recurrent expenditure per student evident in the scatter plot in Figure 8.1 can be explained by the location and size of the schools in the sample.
This could occur if high-SES schools were over-represented in the sub-group of small rural schools so their recurrent expenditures were ‘inflated’ by size and location factors.
In fact, this was not the case. There were twice as many small schools in the low-SES category as in the high-SES category. In addition, a greater proportion of the high-SES schools was located in metropolitan locations, where costs tend to be lower. On this basis it seems that neither size nor location explained why
the differences in recurrent expenditures were not more differentiated by SES.
Table 8.6 shows recurrent expenditure per student in three categories of school size. On average, small schools spend more per student than medium and large schools.
To further address the question, school enrolment, school location and school SES were regressed on school recurrent expenditure per student. The results of the regression analysis are shown in Table 8.7.
The regression analysis provides an estimate of the relative importance of the three predictor variables in explaining the variation in the recurrent expenditure per student amounts. The importance of each predictor is indicated by the size of the standardised beta weights. All told, the three variables explain 36 per cent of the variation in recurrent expenditure per student, although SES accounts for a negligible amount. Most of the explanatory power can be attributed to school size and location.
Table 8.6: Recurrent expenditure per student 2005, school size
School size Recurrent expenditure per student
Small $9 575
sd = 3 073
Medium $6 877
sd = 1 288
Large $6 075
sd = 1 436
Small schools had 16-119 students; medium-sized schools had 128-342 students; and large schools had 356-997 students. n = 153
Table 8.7: Regression of enrolment, SES and geographic location on recurrent expenditure per student 2005
School
variables
Standard-ised Beta
Significance
R=0.60
R2=0.36
Enrolment -0.39 .00
SES 0.07 .34
Location 0.31 .00
The Schools Geographic Location Database 2005 provided the school enrolment and geographic location data.
81

This is supported by the comparisons between metropolitan and non-metropolitan locations shown in Table 8.8.
In the metropolitan areas, the mean recurrent expenditure per student was relatively constant across SES categories. However, for the schools outside the metropolitan areas, the expenditure increased systematically from low- to high-SES, contrary to what might be expected from a funding method intended to redress socioeconomic disadvantage.
Capital funding
Of the 160 schools in the study, 109 reported capital expenditures. The average per student was $316. Details of capital income and expenditure are reported in the Financial Questionnaire for non-government schools, so the figures are likely to be accurate in these sectors.
In the government sector, however, capital works are more likely to be administered centrally, making school-level data more problematic. The small number of schools providing information illustrates this situation.
The funding mechanisms
Competitive funding
Principals reported a growing tendency for governments to earmark funding amounts for special purposes and to invite principals to make competitive submissions for these amounts. There appear to be several reasons for this approach. There are often insufficient central funds to address all needs, so
competitions adjudicated by independent panels are seen as the fairest way of distributing the funds. Some principals believe this approach is attractive to funding providers as it provides media opportunities when announcing programs and, in due course, commending successful applicants. There is also the view that governments use this mechanism to reward some schools over others.
Principals were asked to identify funding they received during 2005 as a result of making successful submissions. Two-thirds received income by this means, with an average of nearly $33,000 per school. This amounts to slightly less than $130 per student, or less than 2 per cent of the schools’ average recurrent income per student.
Principals reported that, on average, whether they were successful or not, they spent about 26 hours per year working on submissions. The longer the reported time spent in preparation, the greater the amount. The results are summarised in Table 8.9.
Of the schools reporting successes with their applications, there was a slight bias in favour of low-SES schools. This may have been because they had greater incentives; it may also have been because of the criteria set for the competitions in which they were successful.
The question might well be raised as to whether the investment of so much time in submission writing is the best use of the principals’ time. During interviews, some principals were scathing in their criticism of competitive, submission-based funding as a way of redressing the disadvantage faced by their schools. At the same time, they felt they were under pressure from their parent bodies, local politicians and employers to make applications, even when the likely return on the investment of their time was low.
Table 8.8: Recurrent expenditure per student 2005, SES, metropolitan and non-metropolitan
SES Recurrent expenditure per student
Metropolitan Non-metropolitan
Low $6 894 $8 079
sd = 1 683 sd = 2 496
Middle $6 255 $8 730
sd = 1 245 sd = 2 692
High $6 582 $10 431
sd = 1 719 sd = 4 839
The non-metropolitan location category has been created by aggregating the regions in the provincial and remote location zones. n = 86 (metropolitan), n = 67 (non-metropolitan).
Table 8.9: Submission-based income 2005
Average per school $32 863
Average per student $323
Time to prepare and acquit 27 hours
Schools reporting $0 35%
Principals were asked to report submission-based funds they requested and received and the time involved during 2005 in Section 4.3 of the School Survey Form. n = 143
82

Discretionary funding
There are conflicting policy currents running in primary school funding. There is an inclination by governments and education authorities to give school principals more autonomy in exchange for greater accountability. This policy had greater traction in the 1990s and some system authorities appear to have retreated from it, preferring to maintain close oversight of schools’ financial decision making. In most government and Catholic systems, schools receive grants to manage a small portion of their total costs.
There is a wide range of opinion among principals over the amount of managerial discretion that they require or prefer. Most of those who already exercised considerable discretion (notably in independent schools and Victorian systemic schools) did not want to surrender their autonomy. They appeared to gain considerable satisfaction from exercising their broad responsibilities. Many saw managing budgets, expanding enrolments, looking for new income streams or negotiating the funding of new programs or facilities with government or private sector agencies as professionally challenging.
However, there were others who were wary of devolution and decentralisation policies, reporting that paperwork and red tape were escalating without any real benefits to schools or the principalship. They saw the entrepreneurial work as someone else’s business that would otherwise deflect them from their core responsibilities.
The most important example of principals’ discretion over expenditure relates to the management of the staffing budget. As indicated earlier, the most common practice is for central agencies to appoint and pay staff: they manage the major costs of schooling.
However, in a small number of cases, principals were responsible for this function and therefore sought to produce a mix of high- and low-cost appointments in order to balance their budgets. In practice, this meant that sometimes there were opportunities to find savings from the staff budget that could be invested elsewhere in the school; alternatively, they risked overspending and incurring debts if they failed to balance the books.
Principals who were using such a system were likely to favour it while those whose staffing was being managed centrally tended to feel that they had enough
on their plates and were not inclined to support the devolution of this responsibility.
One point of agreement was the need for school resourcing arrangements to be flexible enough for principals to operate discretionary funds of some kind to initiate change and reward staff members for extra responsibility and effort. Relatively small amounts could produce extraordinary results in terms of staff morale and the building of a collaborative school ethos.
Conclusion
Financial information
Many of the important policy decisions that have funding implications—particularly at the national level—are based on the average government school student recurrent cost. This is calculated pro rata (that is, by dividing the recurrent expenditure for all government schools by the total number of students enrolled) so that information about the variations in costs among government schools is not available.
Policy decisions are therefore at risk of failing to take account of the range of school resources flowing to schools, because they are not informed by data showing the variation as well as the average.
In most government (and many non-government) schools, principals and parent councils do not know all the operating costs. Typically, the salaries are paid centrally and do not appear on the statement of accounts, even though they constitute most of the recurrent cost of schooling.
There is a need to make school funding more transparent. Comparisons between schools in different systems and vastly different circumstances will be unfair.
Also, governments will be subjected to constant (and, at times, vexatious) petitioning from stakeholders wanting something because they have become aware that another school has it.
Such problems have not constrained governments in reporting primary schools’ attainment test results. Given the insistence that primary schools disclose their students’ performance levels on literacy and numeracy tests, it seems reasonable that the resource base from which these performance levels are enabled also be
83

disclosed. In fact, to require the one without the other places an unfair onus of responsibility on staff in schools.
Relative needs
There is a widely held belief among primary educators that (in government systems at least ) low-SES schools are better resourced than high-SES schools. While low-SES schools may have more resources of some kinds, this study challenges the view that the low-SES schools have more financial resources available to them than the high-SES schools.
There is a negligible difference between the financial resources available to low-SES and high-SES schools. Hence, there is a need to re-examine the basis on which government funds are directed to the schools and students who need them most.
The failure to match consistently government grants to need raises two issues: firstly, the method by which SES is assessed; and, secondly, the quantum of resources required to enable the most disadvantaged schools to meet community expectations. Each of these issues is discussed further in Chapter 9.
Funding mechanisms
Central finance officers may see schools as collections of programs or funding targets. School principals take a holistic view. While funds may be streamed into schools through various programs to achieve various outcomes, once they have these funds, principals want maximum flexibility to deploy them to achieve the schools’ overall purpose. Excessive strictures on the use of funds and accountability requirements can be counterproductive.
There is a widespread feeling that submission-based funding should be wound back. It suits central bureaucrats but primary schools are not staffed in ways that enable them to compete fairly for the funds. Requiring principals to commit significant amounts of time to make applications for relatively small sums of money without any assurance of success is not a good use of their time.
Primary schools are not set up like small businesses and increasing pressure on them to operate as though they were can only divert them from their core purpose.
Furthermore, submission-based funding is usually ad hoc or for a calendar year at the most. While any assistance tends to be received gratefully, this method of disbursement does not encourage orderly planning or good financial management.
Recommendations
11. MCEETYA should adopt a common financial reporting instrument for government and non-government schools. The Australian Government’s Financial Questionnaire for non-government schools provides a model for an instrument that might be used across sectors.
The results of an annual cross-sectoral census should be reported in the National Report on Schooling, showing the distribution of incomes and expenditures per student for various sub-categories of schools.
Any member of the public should be able to retrieve from a national database the income and expenditure per student for a particular school for a recent financial year and compare it with like schools.
MCEETYA should also report in the National Report on Schooling the income and expenditure cost differentials for schools at each SES quintile.
12. Competitive grant mechanisms should not be employed to fund essential programs. The amount of primary school funding that is allocated on a competitive basis should be monitored and reported in the National Report on Schooling. The Report should specify successful applicants.
84

Introduction
In Chapters 5 and 6, evidence showed that there were many teachers who had significant numbers of children in their classes who were difficult to teach, yet these students attracted no additional assistance. There were schools in which principals found it difficult to find suitable staff members or to draw on the local community for support. Chapter 7 described how low-SES schools had more children who were difficult to teach than high-SES schools.
The analysis of school income and expenditure data in Chapter 8 demonstrated that there were only marginal differences between high- and low-SES schools; the differences in income and expenditure were not statistically significant.
This chapter examines whether more funding would make a difference to the prospects of children struggling to make adequate progress through the primary years and whether funding formulas should be weighted more heavily to support schools with a high incidence of students who are difficult to teach.
Differential funding
The attitudes of principals
Primary school principals have a strong sense of social justice. They favour funding policies that give schools serving disadvantaged communities extra support. They also believe that low-SES schools need more resources than they are currently getting. These beliefs were borne out by a survey conducted in 2001.79 Some 2,500 government primary school principals responded to a survey conducted on behalf of their principals association. As shown in Table 9.1, the idea of linking funding to SES factors was supported strongly and nearly half supported a redistribution of funding in order to make the system more equitable.
Targeting students or schools?
As explained in Chapter 8, all Australian governments provide additional funds to schools serving lower-SES communities, although the method of allocation varies among jurisdictions.
However, SES is not the only school or student characteristic that generates extra funding.
9
Sufficiency
Table 9.1: Government primary school principals’ ratings of statements about funding policies as a percentage 2001
Statement Disagree Unsure Agree% % %
Operating grants should be linked to the socioeconomic
status of the students in a government school
19.5 11.0 68.1
Funds should be shifted from wealthy government schools
to assist needy government schools
35.3 16.8 46.7
Principals’ responses to each of the statements do not add up to 100 per cent because of rounding and a non-response rate of slightly more than 1 per cent.
85

Education authorities allocate funds for students with disabilities, students who have arrived in Australia recently and are not proficient in English, students from Indigenous backgrounds, students with behaviour and discipline problems and students failing to make adequate progress in literacy and numeracy. These funds are usually managed through separate programs with specific conditions. Because many of the students whose circumstances attract these funds are in low-SES schools, the total amount of ‘targeted funding’ that is received by these schools will nearly always exceed the specific SES allocations. The fragmentation of targeted funding or equity funding makes it difficult to assess how much funding schools receive above their core, enrolment-based allocation and whether the amounts are being targeted effectively.
Generally, funding programs that target individual students with distinctive forms of educational disadvantage are able to achieve a high degree of precision. All primary schools have access to fixed amounts of government funding if they have students with diagnosed disabilities, non-English speaking backgrounds or Indigenous status.
For some categories of students (for example, those with learning disabilities) there are detailed parameters defining the level of funding to which schools enrolling them are entitled. While there is some discontent among teachers and principals with the process that is used and the high thresholds that have been adopted, the criteria for funding are explicit and the determination of whether a child has a disability of sufficient severity to warrant support is made by independent experts.
The same could be said of support for students who have Indigenous backgrounds or have arrived recently from non-English speaking countries and whose command of the English language is limited. Authentication of claims is relatively straightforward and funding can be targeted accurately to schools on a designated per-student basis after an examination of school census data.
Taking account of socioeconomic disadvantage is more difficult, for two reasons. Firstly, the funding is allocated to schools with a high density of students from lower-SES backgrounds rather than being tied to individual students from low-SES backgrounds. Secondly, the funding is based on indices derived from socioeconomic background factors that predict
academic performance imperfectly: some low-SES students do exceptionally well at school without additional support.
Governments and education authorities also target other forms of disadvantage: for example, isolation, school size (smallness) and significant enrolments of transient students.
Sometimes these factors are built into the base operating grant and in other instances they are funded via formulas that take account of students and thresholds of various kinds. A good example of how these arrangements work is found in the recent Victorian school resourcing framework for government schools.
A system example
DET Victoria has adopted a new funding framework with a high level of transparency known as the Student Resource Package.80 It has two main components: student-based funding and school-based funding. The bulk of the funding received by a school is allocated through the student-based funding component, of which there are two parts: one concerned with enrolments and the other with equity.
The SES funding is calculated by a mechanism known as the Student Family Occupation (SFO) Index, which measures occupational status, one of the core components of socioeconomic status. Information about the occupation of parents is collected each year as part of the August school census. Schools receive SFO funding if the density of low-SES students is greater than the Statewide median density. The level of support is scaled according to density of parents in low-status occupations: the maximum additional payment per student in primary schools is $1,290.
In addition, Victorian government schools receive funding for students with disabilities, and funding for students for whom English is a second language (scaled according to the recency of their arrival in Australia).
Additional per capita funding is allocated for rurality and isolation. Allowances are made for school size on a sliding scale that favours strongly very small schools.
A school could theoretically receive a composite equity grant of considerable magnitude to address issues of equity, depending on the numbers entitled to support
86

Table 9.2: Maximum equity grants per student, Victorian government primary schools
Equity component Maximum additional payments per student
Student family occupation (SES) $1 290 per enrolled student
Student mobility/transience $222 per transient student
Students with disabilities $38 295 per student for the most severely disabled category
ESL $2 117 per ESL student with less than two years residence in Australia
Victorian Department of Education and Training (2007). Guide to the Indicative Student Resource Package. (www.sofweb.vic.edu.au/SRP/). Accessed 19 March 2007.
and the severity of the need. The maximum allocations are shown in Table 9.2.
In the other systems, school funding is calculated from a mix of student-level and school-level characteristics, although the formulas and programs differ. This practice makes it hard to acquire an accurate picture of the total allocation of systemic funding to individual schools for students with special needs. Most school principals are unable to calculate the total targeted funding that ends up in their accounts or is spent centrally on their behalf.
One way of acquiring an approximate figure would be to accumulate central allocations to a school for its socioeconomic status, the teaching of English as a Second Language, students with special needs and other related purposes, and calculate these amounts as a proportion of the total recurrent funding to the school.
However, education authorities do not report these amounts. Informal advice from system finance officers suggests that the amount is about 10 per cent of the total school recurrent funding, but it has not been possible to authenticate this figure.
Setting resource standards
Differential school costs
The calculation of the amount of funding required by schools can be approached from several directions. The usual method has been to make per capita allocations on a pragmatic basis during the budgeting process by taking into account allocations in the previous budget and the appropriations for the coming year, and making judgements as to whether the previous allocations can be maintained or increased. A political judgement is
exercised rather than a technical decision made as to whether the amount is sufficient to make a practical difference to student outcomes.
Not all schools receive the same level of funding per student. The only way to provide satisfactorily for small schools in country locations has been to fund them at a higher rate. Government reports early in the last century reported expenditures on schools of various sizes that illustrated the much higher costs per student of providing education in small schools.81 However, there is no explicit ‘small school resource standard’. The level of funding has been whatever is required to keep such schools operating. Their capacity to achieve student outcomes at a specified standard does not come into the funding equation.
The difference in the costs of educating children in primary and secondary schools is also a well-documented phenomenon. The earlier report for APPA on the history of primary school funding mapped the difference throughout the twentieth century, a difference strongly in favour of secondary schools.
There are limited data available on the costs of educating children in other kinds of schools, even though it is well known that many specialist schools operate at higher-than-average costs per student.
However, differences in the costs per student of educating children in various categories of school were reported for the 1999-2000 financial year in a study using government schools data from the Western Australian Department of Education and Training.82
The highest cost per student ($21,062) was for students attending agricultural colleges, followed by distance education students ($17,149) and students at education
87

support schools ($16,904). In that year, the average cost for students attending primary schools was $5,319 per student.83
Estimating school needs
One way of standardising the differential to enable comparisons across school types and systems is to calculate what is known technically as a cost function estimate. This approach provides estimates of ‘base costs’ (that is, average student costs in a school with low numbers of students with special needs) and marginal costs (that is, additional costs associated with individual student characteristics, including impoverished home backgrounds, non-English speaking backgrounds and medically diagnosed disabilities). Importantly, the costs are defined as the minimum amount of funding that a school must spend in order to achieve a given educational outcome, such as reading above a benchmark level of performance. Using this approach, cost indices (that is, the full cost per student required to meet specified levels of proficiency divided by either the average recurrent cost or base cost per student) can be developed.
In this study, it was not practicable to produce cost function estimates and cost indices derived from the base and marginal costs. This would have required a major new research endeavour. However, it is possible to examine expenditures from the schools participating in the study and draw on other Australian data to estimate average expenditures for categories of schools or students with special needs. Because the average cost will be higher than the base cost (since it includes some students who incur marginal costs) the cost indices will be lower than if they were computed using base costs. Nevertheless, cost function estimates based on averages of actual expenditures provide an approximate basis for establishing the amounts likely to produce the educational outcomes sought by governments.
Using the costs per student cited above, the cost index for a student in a WA agricultural college for 1999-2000 was 3.96; that is, about four times the cost of educating a student in a regular school. For educating a child in a special school, the cost index was 3.18 (slightly more than three times the average cost of educating a child in a primary school). It is likely that special types of schools in other government and non-government systems function with comparable cost indices.
These examples illustrate an acceptance in the community that some kinds of schools require considerably more resources to operate successfully than others.84 They also provide an indication of the magnitude of cost indices that authorities consider necessary to provide an effective education for special groups of students.
MCEETYA resource standards
As described earlier in this chapter, there are explicit resource standards for students with medically diagnosed disabilities and students from non-English speaking backgrounds. The amounts of additional support are not derived directly from calculations of what would be required for students to achieve educational outcomes to a specified level. They are essentially the amounts that can be afforded.
An alternative approach would be to identify the kind of interventions that would fix the problem, cost their provision on a per capita basis and fund schools at that rate. For example, if ‘the problem’ was to find a way of reducing the proportion of students performing below the benchmark standard on the national reading test, analysts would look for an effective program or set of programs that could be provided for those students and cost the necessary provision for students in need of the extra support. The advantages of linking costs to student outcomes have been put in these terms:
Resource standards based on real evidence of the costs of schooling have the benefit of providing a defensible basis for schools funding, and for recognising the additional costs relating to those students with various forms of learning difficulties or disadvantages. Such standards are consistent with the principle of basing funding on the costs of achieving actual learning outcomes for students rather than on categorising the causes of learning deficits. This in no way denies that an understanding of the causes of learning problems may be critical to developing educational strategies for dealing with them. It is the cost of those responses that needs to be recognised in the setting of resource standards and in related funding programs.85
This approach was favoured by the MCEETYA Schools Resourcing Taskforce, which between 2001 and 2004 advised Education Ministers on the future amounts of resources required by the school sector to deliver the National Goals for Schooling effectively.86 The Taskforce had access to large amounts of school finance
88

data provided by education authorities. The general approach it adopted was to estimate the basic costs of primary and secondary schooling and then estimate the additional costs that had been incurred in schools with students at risk of failing to achieve the National Goals. The project examined the needs of Indigenous students, low-SES students and English as a Second Language students in the government sector.
The Taskforce estimated that 12 per cent of primary students were at risk of failing to meet the Year 5 literacy and numeracy benchmarks. It then sought to cost what would be needed to enable them to reach a satisfactory standard of performance. By costing various interventions being used by schools, the Taskforce concluded that an extra $5,905 per student above the base cost of primary schooling (which was calculated to be $6,467) would be required. Across all schools, the funding increase for this sub-set of the student population would be 91 per cent, yielding a cost ratio of 1.91. Given the conservative definition of the special needs population (students performing below the benchmarks in literacy and numeracy), the cost ratio was most likely an underestimate.
More recently, the Taskforce issued a discussion paper reviewing the funding available for instruction in English as a Second Language for new-arrival students.87 It surveyed the jurisdictions to find out the costs of providing educational support for these students, with a view to recommending increases in per capita assistance.
It costed separately provisions for students from refugee and non-refugee backgrounds. This was a complex analysis that took account of State differences in provision, hours of instruction received and performance assessment data reflecting the students’ levels of English. The average cost for refugee students was $10,946 and for non-refugee students it was $6,160 per student. However, the Taskforce estimated that the amounts required to achieve the desired level of proficiency were $18,730 and $7,745 respectively. Because the students are in primary and secondary schools and because they are attending government and non-government schools and intensive English language centres, it is not possible from the data provided to convert the per capita amounts to conventional cost indices. Nevertheless, for the refugee students, the indices would fall between 2.0 and 3.0.
The report is of interest for two reasons. Firstly, following on from the earlier Taskforce report, there would appear to be a willingness in MCEETYA to adopt a more rigorous approach to determining school resource needs. Secondly, the report attributes the main responsibility for meeting the funding gap to the Commonwealth, leading it to express reservations about the methodology of the study and the soundness of some of the conclusions.
SES resource standards
Targeted funding works relatively well in those cases in which the problems faced by students are explicit and amenable to specific interventions. However, the approach is less suitable for problems that are situated more diffusely in classrooms or schools: SES is such an example.
Children at the lower end of the SES scale may require a much higher level of support than other children who come from more advantaged backgrounds. However, there is no single form of intervention that can be used to estimate what it would cost to enable these children to succeed at school. Their educational ‘problem’ may be evident in a variety of ways: for example, disruptive classroom behaviour, poor attendance, failure to persist with tasks and underdeveloped social skills.
To deal with these issues schools may need to put in place a variety of strategies, each of which has resource implications.
It is also the case that students who display these behaviours are not confined to low-SES schools. However, the incidence is higher in low-SES schools and where numbers reach a critical threshold the school is put under immense pressure.
Several studies have examined funding for low-SES schools. In 2002, Professor Tony Vinson chaired an inquiry into public education in New South Wales. The Department of Education and Training provided the Vinson team with the financial data for 60 primary schools, divided into categories of high-, middle- and low-socioeconomic disadvantage.88 The low-SES schools were all included in the Priority Schools Funding Program. The financial data showed an average difference in expenditure between the middle- SES and low-SES categories of approximately $900 in favour of the latter schools. The cost differential was 1.20: most of the differential was explained by the additional salary costs.
89
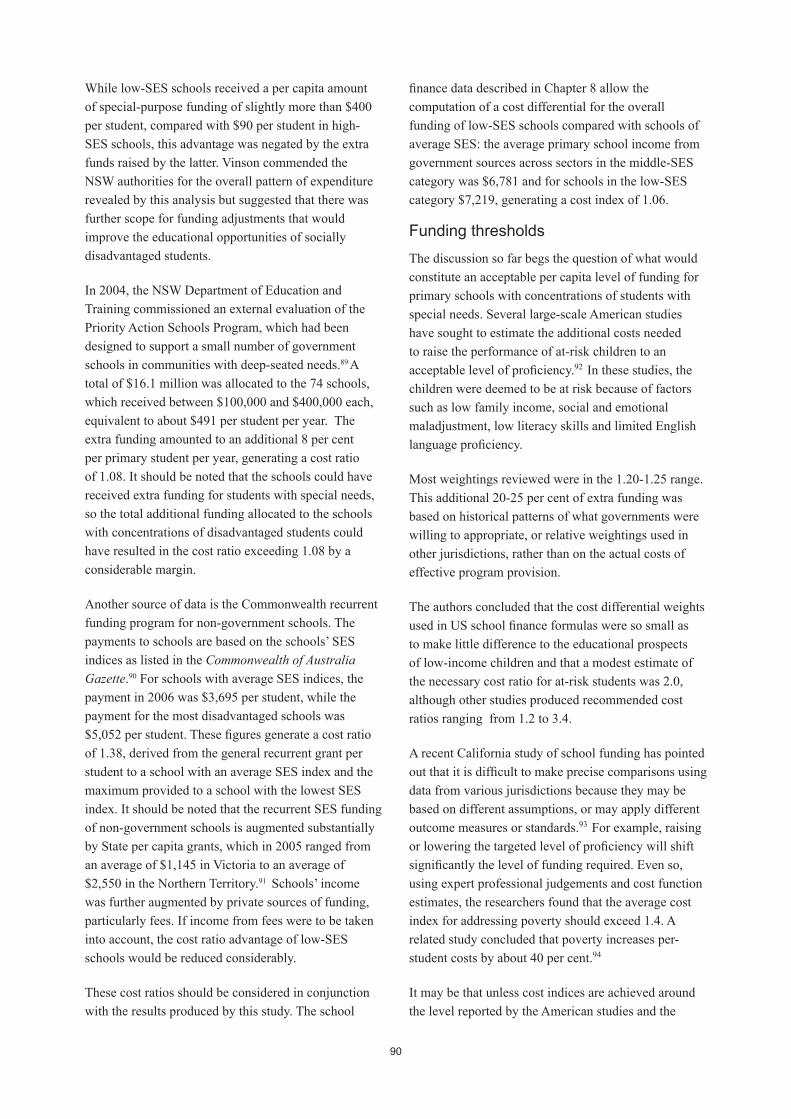
While low-SES schools received a per capita amount of special-purpose funding of slightly more than $400 per student, compared with $90 per student in high-SES schools, this advantage was negated by the extra funds raised by the latter. Vinson commended the NSW authorities for the overall pattern of expenditure revealed by this analysis but suggested that there was further scope for funding adjustments that would improve the educational opportunities of socially disadvantaged students.
In 2004, the NSW Department of Education and Training commissioned an external evaluation of the Priority Action Schools Program, which had been designed to support a small number of government schools in communities with deep-seated needs.89 A total of $16.1 million was allocated to the 74 schools, which received between $100,000 and $400,000 each, equivalent to about $491 per student per year. The extra funding amounted to an additional 8 per cent per primary student per year, generating a cost ratio of 1.08. It should be noted that the schools could have received extra funding for students with special needs, so the total additional funding allocated to the schools with concentrations of disadvantaged students could have resulted in the cost ratio exceeding 1.08 by a considerable margin.
Another source of data is the Commonwealth recurrent funding program for non-government schools. The payments to schools are based on the schools’ SES indices as listed in the Commonwealth of Australia Gazette.90 For schools with average SES indices, the payment in 2006 was $3,695 per student, while the payment for the most disadvantaged schools was $5,052 per student. These figures generate a cost ratio of 1.38, derived from the general recurrent grant per student to a school with an average SES index and the maximum provided to a school with the lowest SES index. It should be noted that the recurrent SES funding of non-government schools is augmented substantially by State per capita grants, which in 2005 ranged from an average of $1,145 in Victoria to an average of $2,550 in the Northern Territory.91 Schools’ income was further augmented by private sources of funding, particularly fees. If income from fees were to be taken into account, the cost ratio advantage of low-SES schools would be reduced considerably.
These cost ratios should be considered in conjunction with the results produced by this study. The school
finance data described in Chapter 8 allow the computation of a cost differential for the overall funding of low-SES schools compared with schools of average SES: the average primary school income from government sources across sectors in the middle-SES category was $6,781 and for schools in the low-SES category $7,219, generating a cost index of 1.06.
Funding thresholds
The discussion so far begs the question of what would constitute an acceptable per capita level of funding for primary schools with concentrations of students with special needs. Several large-scale American studies have sought to estimate the additional costs needed to raise the performance of at-risk children to an acceptable level of proficiency.92 In these studies, the children were deemed to be at risk because of factors such as low family income, social and emotional maladjustment, low literacy skills and limited English language proficiency.
Most weightings reviewed were in the 1.20-1.25 range. This additional 20-25 per cent of extra funding was based on historical patterns of what governments were willing to appropriate, or relative weightings used in other jurisdictions, rather than on the actual costs of effective program provision.
The authors concluded that the cost differential weights used in US school finance formulas were so small as to make little difference to the educational prospects of low-income children and that a modest estimate of the necessary cost ratio for at-risk students was 2.0, although other studies produced recommended cost ratios ranging from 1.2 to 3.4.
A recent California study of school funding has pointed out that it is difficult to make precise comparisons using data from various jurisdictions because they may be based on different assumptions, or may apply different outcome measures or standards.93 For example, raising or lowering the targeted level of proficiency will shift significantly the level of funding required. Even so, using expert professional judgements and cost function estimates, the researchers found that the average cost index for addressing poverty should exceed 1.4. A related study concluded that poverty increases per-student costs by about 40 per cent.94
It may be that unless cost indices are achieved around the level reported by the American studies and the
90
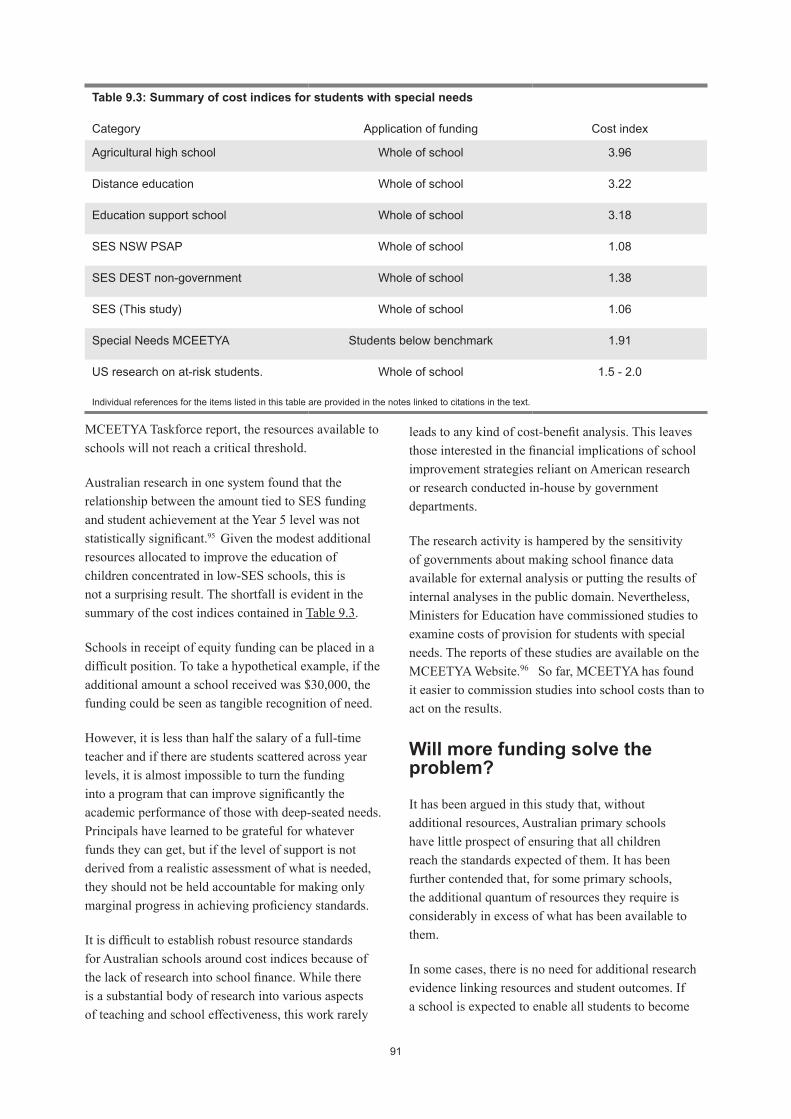
MCEETYA Taskforce report, the resources available to schools will not reach a critical threshold.
Australian research in one system found that the relationship between the amount tied to SES funding and student achievement at the Year 5 level was not statistically significant.95 Given the modest additional resources allocated to improve the education of children concentrated in low-SES schools, this is not a surprising result. The shortfall is evident in the summary of the cost indices contained in Table 9.3.
Schools in receipt of equity funding can be placed in a difficult position. To take a hypothetical example, if the additional amount a school received was $30,000, the funding could be seen as tangible recognition of need.
However, it is less than half the salary of a full-time teacher and if there are students scattered across year levels, it is almost impossible to turn the funding into a program that can improve significantly the academic performance of those with deep-seated needs. Principals have learned to be grateful for whatever funds they can get, but if the level of support is not derived from a realistic assessment of what is needed, they should not be held accountable for making only marginal progress in achieving proficiency standards.
It is difficult to establish robust resource standards for Australian schools around cost indices because of the lack of research into school finance. While there is a substantial body of research into various aspects of teaching and school effectiveness, this work rarely
leads to any kind of cost-benefit analysis. This leaves those interested in the financial implications of school improvement strategies reliant on American research or research conducted in-house by government departments.
The research activity is hampered by the sensitivity of governments about making school finance data available for external analysis or putting the results of internal analyses in the public domain. Nevertheless, Ministers for Education have commissioned studies to examine costs of provision for students with special needs. The reports of these studies are available on the MCEETYA Website.96 So far, MCEETYA has found it easier to commission studies into school costs than to act on the results.
Will more funding solve the problem?
It has been argued in this study that, without additional resources, Australian primary schools have little prospect of ensuring that all children reach the standards expected of them. It has been further contended that, for some primary schools, the additional quantum of resources they require is considerably in excess of what has been available to them.
In some cases, there is no need for additional research evidence linking resources and student outcomes. If a school is expected to enable all students to become
Table 9.3: Summary of cost indices for students with special needs
Category Application of funding Cost index
Agricultural high school Whole of school 3.96
Distance education Whole of school 3.22
Education support school Whole of school 3.18
SES NSW PSAP Whole of school 1.08
SES DEST non-government Whole of school 1.38
SES (This study) Whole of school 1.06
Special Needs MCEETYA Students below benchmark 1.91
US research on at-risk students. Whole of school 1.5 - 2.0
Individual references for the items listed in this table are provided in the notes linked to citations in the text.
91

proficient in a language other than English and it does not have a LOTE teacher, then it is self-evident that it needs the resource. Throughout this study, needs of this kind have been identified.
However, there is some debate about the best way to use extra resources to improve student academic performance in general. If additional resources are to have a significant effect, the way in which they are made available to schools is of crucial importance. It is now accepted widely in the research community that, of themselves, more resources will not make a decisive difference.97
In other words, across-the-board increases in school funding that are not aimed at changing practices or enabling specific new practices will not make much difference to student outcomes. Their effect depends on the use to which they are put.
For example, a US study examined 15 schools serving disadvantaged communities that were each allocated an extra $300,000 above normal spending for five years to improve learning outcomes. All of the schools reduced class sizes. Only two schools showed improvements in student assessment results; they were the only schools that used class size reduction as one of a number of integrated strategies to improve student learning.98
There is also some debate over what kinds of resources will have the most effect. Some researchers believe that the key to school success is the quality of teachers and that governments should be concentrating their efforts to improve teaching through better recruitment, training and remuneration. Others argue that this approach falls short of what is required: schools need the capacity to pursue an array of strategies that may include improving teacher quality among many others.
The reasons why students fail to reach benchmark standards are complex. This study has shown that the
needs of primary schools vary and there is no single form of intervention that will fix all of the problems they face.
Principals’ global perceptions of need
Some principals were adamant that they were badly under-resourced. Others felt they had sufficient to maintain the status quo. However, when interviewed, some who had reported initially they were satisfied with their funding levels changed their minds.
They felt that if governments seriously expected all children to reach appropriate standards and schools to cover all the important curriculum areas, they needed more help.
Six per cent of principals reported that they had sufficient resources; at the other end of the scale, 3 per cent reported that their resources were grossly insufficient. This is shown in Table 9.4.
Overall, the responses could be divided approximately into thirds: nearly a third felt they needed considerably more, a third felt they had identifiable unmet needs and a third felt they had sufficient, or nearly sufficient, resources.
The interviews with principals revealed a tendency for schools to reach accommodations between expectations and resource levels. In many cases, with collegial staffs and supportive parents, schools were able to get all (or nearly all) children to benchmark standards. For others, the task of ensuring that all children in their schools genuinely achieved the National Goals was considered virtually impossible. Such principals were not signalling that they had been defeated: rather, they felt expectations exceeded a realistic possibility of total success.
Table 9.4: Principals’ responses regarding the sufficiency of their school’s resources
Question Grossly
insufficient
Somewhat
insufficient
Sufficient
% % % % %
Does your school have sufficient resources to enable
all students to reach appropriate standards?
3 25 37 29 6
Principals were asked to respond to this statement when interviewed during the school visit. The total responses add up to 100 per cent. n = 153
92

Conclusion
The concept of differential funding has wide acceptance among principals. They believe that schools with relatively large numbers of students who require specialist support should be allocated higher levels of funding.
They know, usually from first-hand experience, that this is a fair outcome not only for their students but also for their teachers.
Some schools receive funding that is tied to individual student needs. Funding for children with disabilities or with ESL or Indigenous backgrounds is the most common. Principals have two criticisms of these funding programs.
Firstly, they are too restrictive; in Chapter 5 it was estimated that nearly 15 per cent of the school cohort have some special needs that are not funded additionally other than through SES funding sources.
Secondly, the eligibility threshold for funding is set too high and in many cases the amount received has to be supplemented from the school’s operating grant.
SES funding is even more problematic. It is difficult to set objective criteria for determining the scale of funding that ought be allocated to schools with high concentrations of low-SES students. Three statements can be made about this problem:
• this study has revealed that, overall, there is no consistent net benefit from government funding in meeting the needs of low-SES schools;
• international research suggests that the funding that is being allocated may be too little to expect any significant impact on student outcomes; and
• the MCEETYA Taskforce has provided data indicating that allocations are massively short of what is needed.
A serious campaign to address the SES funding problems identified by this study will require that appropriate school finance data is made available for analysis and public scrutiny. If this is to happen, Ministers will need to demonstrate a high level of statesmanship because Commonwealth-State tensions
and party politics have affected the whole area of school funding. Since the abolition of the Schools Commission in 1987, there has been no independent body at arm’s length from government that can lay out the facts in the public arena: the quality of school funding data and the openness with which they are made available have diminished significantly as a result.
Better policies—and better implementation of these policies—will come from a more open debate that is informed by evidence.
Recommendations
13. MCEETYA should develop a framework that makes explicit the shared and separate responsibilities of the Australian and State governments for funding primary schools.
14. Governments should adopt funding targets to increase differentially allocations to the primary schools in the greatest need. Recurrent grants should be scaled according to individual school SES indices such that schools with the greatest need are assisted by a factor of 1.5.
15. Provision should be made for the national school finance database to be accessed by independent researchers, subject to appropriate safeguards.
The Australian Government should fund a program of research into the cost effectiveness of interventions that have a prospect of enabling low-performing students to achieve the National Goals of Schooling.
Further, MCEETYA should undertake research on the efficacy of existing SES funding mechanisms. The research should examine the feasibility of adopting a common national framework so that stakeholders can be assured that the intentions of Australian governments to alleviate educational disadvantage have the prospect of being achieved.
93

94

Introduction
This report is based on data collected from a random sample of Australian primary schools. As such, it provides a picture of how primary schools are actually responding to the rising expectations of what they should be able to accomplish.
In this chapter, the findings from earlier chapters are synthesised. The study was initiated because of concerns over a perceived insufficiency of resources to get the job done. The analyses in earlier chapters indicate that some of the work that needs to be undertaken is dependent on additional and better-targeted resources. However, in addition to shortfalls in funding, these chapters have identified problems that primary schools face for other reasons.
The primary curriculum
The crowding problem
The school day is of finite length and the primary curriculum must be fitted into it. English and Mathematics consume more than half of the available time and the other subjects compete for the rest. Primary schools have been squeezed from all sides and it has been hard for them to achieve an appropriate balance.
The crowding has caused two problems.
Firstly, it has exerted pressure on schools to sacrifice depth of understanding for breadth of coverage. The more that is packed into the primary curriculum, the more difficult it becomes for teachers to provide students with opportunities to pursue subject matter deeply or to experience the satisfaction of discovering things for themselves.
Secondly, curriculum crowding has made it extremely difficult for many schools to achieve high standards in literacy and numeracy while ensuring that the other subjects receive a sufficient allocation of time. The concern over students performing below the literacy and numeracy benchmarks has driven schools to increase the time for English and Mathematics, while advocates for other subjects have demanded more time and higher profiles for their areas of interest. Something has to give.
The response of curriculum authorities has been to look for a ‘middle position’, by providing a curriculum with considerable breadth while limiting, as far as possible, the prescription of what must be taught. Teachers can elect to pursue some topics in depth within a single subject area or integrate subjects using various cross-disciplinary approaches. This strategy should, in theory, take the pressure off teachers, because it puts the responsibility for content coverage into their hands. However, teachers do not always see it that way, as in the end students must achieve measurable outcomes that are specified in curriculum statements. There is a general consensus among teachers that the scope of what they must teach within the available time has ballooned beyond an acceptable limit.
One way forward would be for governments to define the primary curriculum in practical terms as ‘the basics plus the rest’. This formulation would communicate to stakeholders that until primary schools can guarantee that all students are reaching adequate performance levels of reading, writing and numerical computation, they should not be expected to provide a broad, rich curriculum with specialisation in other areas such as Science, The Arts, Civics, and Health and Physical Education.
10
Getting the balance right
95

Another course of action would be to make more time available, by increasing the hours of formal instruction on a systematic basis: for example, by offering ‘non-essential’ subjects out of school hours on a voluntary basis, thereby freeing up time for the ‘core’ subjects, or, conversely, by providing extra tuition for those students who need it after the school day has finished.
In some respects, this strategy can be seen as an extension of what is already happening in Australian primary schools. There is a growing industry of private tutoring that is responding to parents’ anxiety over their children’s school performance and tutoring is becoming a normal after-hours activity for many children. Also, many schools offer special instruction before and after school in areas such as sport and music and some offer camps and workshops on weekends.
The system works well in communities in which parents actively support after-hours initiatives and are prepared to pay fees for the service. A weakness of providing after-hours instruction on a voluntary basis is that the children who most need extra help are often the least likely to attend the sessions, particularly if the instruction is provided on a fee-for-service basis. There is a further issue: if the focus of the extra hours instruction is on literacy and numeracy skills, offering more of the same may not be the answer.
The third option warrants serious consideration. It is possible that too much time is being allocated in primary school timetables to English and Mathematics. Primary schools do a good job for three-quarters or more of the students. The ‘literacy and numeracy problem’ relates only to those students whose performance is hovering around the benchmark standard or falling below it. It would be a mistake to impose a timetable and an instructional regime on all students because of the special needs of a minority.
Further, if schools had the resources to provide specialist support for this group of students that could be continued for as long as it was needed, then the number failing to make adequate progress would be diminished significantly. Some students with deep-seated learning problems require a form of case management on a year-by-year basis if they are to reach satisfactory levels of proficiency by the time they complete primary school.
Thus the third option would be to use the instructional time more effectively. Current allocations of time should be more than enough, provided schools are able to organise and provide specialist support for those who need it.
Of the three options that have been canvassed, the first requires education authorities to state more clearly the essential content that teachers must cover during the primary years. It is important that curriculum writers restrict the essential content so that it can be covered in most schools within 60 per cent of the allocated instructional time. This would give schools time to pursue topics of interest at some depth and to work more intensively with students struggling to make progress.
The second and third options require additional resources if they are to be put into effect. The extended day would necessitate the employment of additional tutors and teachers to work after hours, while the third option would require additional literacy and numeracy specialists to work intensively throughout the primary years with children who are on a trajectory of failure.
Managing the escalation
Cutting back on the essential material to be taught is one strategy for reducing the crowding of the primary curriculum. Instituting an effective form of gatekeeping is another. There is an urgent need for governments to reach agreement about how to manage the process of curriculum change, particularly as States move toward nationally consistent curriculums, and to make the process less politicised. A starting point would be an agreed set of protocols, specifying how proposals to change the curriculum ought to be considered by governments and stakeholders.
These protocols would require that:
1. proposals indicate the impact on the time allocations for the whole primary curriculum;
2. a full school year’s notice be provided so that the changes can be incorporated into the school’s planning cycle;
3. there has been thorough consultation with key stakeholders, particularly principals and teachers;
4. the proposals for curriculum change emerge from a holistic appreciation of the purpose of primary schools;
96

5. the resource implications have been analysed and the analysis is made available for public inspection;
6. Commonwealth and State governments accept a shared responsibility to ensure that the changes are successfully implemented; and
7. the changes contribute to a more nationally consistent primary curriculum.
New technologies have reduced significantly the time needed to produce and disseminate curriculum statements.
National meetings of curriculum officers and the sharing of ideas that is occurring under the aegis of MCEETYA increase greatly the prospect of continuous change. With the best of intentions and abundant resources, central bureaucracies tend to make curriculum documents labyrinthine.
While schools need to be responsive to changes in society, they also need to be protected from over-enthusiastic curriculum writers and zealous advocates of subject discipline areas.
Student assessment
Using assessment to improve teaching and learning
Assessment has always been a part of the classroom life, although in the past teachers were mainly left to their own devices to decide when and how to assess students.
They used assessment to establish whether their students had grasped what had been taught and to monitor progress. Over recent years, assessment for these purposes has assumed greater importance with the growing emphasis on making explicit the standards toward which students should strive and on determining whether students have achieved those standards.
Assessment is now integrated into the curriculum and standards frameworks that provide teachers with blueprints of what should be taught and assessed: the larger the number of outcomes specified the greater the amount of assessment required. This new approach to assessment has two important consequences.
Firstly, the shift in emphasis has meant that teachers need to pay more attention to new ways of measuring and analysing student performance. They must now be able to make judgements about student performance in relation to outcomes and standards.
Secondly, there has been confusion over how best to report student results to parents. Schools have been criticised for providing report cards that are incomprehensible to lay people. Results have been couched in the language of outcomes, levels and standards. Critics have sought a return to ‘plain English’ grading systems that indicated whether students had passed or failed.
From the teachers’ point of view, this public dispute is a good example of schools bearing the brunt of criticism for complying with central mandates on reporting.
Moreover, the reasons why teachers are careful about how they provide feedback—avoiding harsh and destructive grading systems in order to build the self-confidence of students—receive short shrift in the media. As teachers see it, the debate over this issue highlights how professional issues are being resolved in a political arena and their point of view is stifled or misrepresented.
Using benchmark testing results for accountability purposes
Principals and teachers accept the need to monitor standards in literacy and numeracy and to be accountable for their performance. However, some are uneasy about the use of test scores as the sole indicators of students’ progress or the main measures of the quality of their performance.
This study has been told of teachers being directed to teach to the benchmark tests, raising concerns about the consequences of allowing test results to become ‘high stakes’.
Australian governments and education authorities that argue for student assessment results to be used more extensively to make schools more accountable should proceed carefully. It would be helpful for MCEETYA to establish a public position on the use and misuse of test results for accountability purposes.
97

Students, teachers and schools
Schools with challenging students
This study has emphasised how the nature of the student intake can limit significantly what schools are able to achieve. Differences in the intakes of primary schools are not taken into account adequately when schools are resourced and evaluated.
Intakes vary in terms of the proportions of children with disabilities, behavioural problems and disengagement from the normal processes of schooling. Schools with high proportions of such children find it difficult to offer rich curriculums because of the need to concentrate on literacy and numeracy. Working in such schools is an exhausting occupation.
Principals report that there is now a higher incidence of difficult-to-teach children attending schools: children who, from their first year, find it hard to sit still, follow directions, get on with their peers or show interest in tasks set by their teachers.
About one-fifth of students in primary schools have been identified as needing special attention from their teachers.
In some communities, the school becomes an island, cut off from the neighbourhood in which the children live. It is not uncommon for schools to be surrounded by security fences and principals must go to extraordinary lengths to ensure the safety of children. Yet many children come from and later return to households in which the dysfunctional relationships between the members undo the efforts that have been invested in these children while at school.
Most teachers reported that they could manage classes containing difficult children and felt supported by principals and other staff. However, it does not take much to tip them over the edge. A single child can, to all intents and purposes, hold a school to ransom. If the school is lucky, it will have an aide to assist the teacher and principal and there may also be personnel from other agencies who can work with the school. However, there were cases in which only marginal support was provided and the schools were required to use their own resources to make the best of difficult situations.
It is clear from this study that the additional funding available to support children with behavioural problems
is too little and the criteria for attracting additional support are set too high.
Visionary expectations
The National Goals for Schooling is a visionary statement. The Goals will be achieved only if all students succeed in ways they currently do not and never have before in the history of Australian education.
It is assumed that by applying three levers—new curriculums, explicit standards linked to the curriculums and assessment tied to the standards—the vision will be realised. It is further assumed that it is only a matter of teachers attending professional development sessions at which the details of the frameworks are explained for the reforms to be transmitted to the classrooms.
This model ignores how teachers teach and students learn. Sub-benchmark results are presumed to indicate a deficit arising from poor professional practice. However, the model is unable to specify what it is that teachers are failing to do. This ‘gap’ is filled easily with speculation and half-truths. It invites further simplification and mandates about what teachers must do.
The truth of the matter is that there is no simple answer to the question of why some children fail to make progress. A complex array of factors may explain why they are not learning. The particular pedagogy employed by teachers may be one reason but it may not be the main contributing factor.
As in other fields, such as health, claims are often made on behalf of a particular intervention, only to be repudiated by a later research study. The growth of knowledge about teaching ‘difficult’ children in regular classroom settings has been a slow and exacting process. Fortunately, Australian education authorities have shied away from mandating methods of teaching and prescribing exactly what teachers must do and how they should spend their time.
There is no ‘silver bullet’ that will transform all the struggling students quickly into successful learners. More can and should be done for them, but progress is likely to be slow and to rely heavily on intensive support from experienced and expert teachers.
98

The next generation of primary teachers
Some primary schools find it difficult to fill vacancies. Those schools in greatest need of energetic, capable teachers are hit hardest. Principals in less-favoured locations cannot recruit suitable teachers easily or find short-term replacements. If the labour market for teachers tightens, there will be devastating consequences for some schools.
The problem has been aired widely in the media and there is no simple solution in sight. There are two parts to it: the first is to increase the pool of able people wanting to make a career in the roles that have been hard to fill. The second is to establish conditions that will lead teachers to apply for appointments to schools and positions that have been hard to staff.
A change in the kinds of people who opt for teaching careers could have a major impact on the quality of primary schooling. Most successful teachers in primary schools are there because they like working with children and because they find the work fulfilling professionally.
Any changes that limit their professional autonomy, undermine the moral purpose of what they do or expose them to constant public criticism without right of reply, are likely to make primary teaching a less- attractive job for precisely the kind of people who need to be attracted into the profession and retained in it.
Staffing schools that are in less-preferred locations and have large numbers of students with behavioural problems is also a major challenge. More school funding is unlikely to provide all the answers. In this study, a school was unable to spend its existing funds on appointing qualified staff because there was no-one who was prepared to teach under the conditions that applied at the school.
Providing salary bonuses may make a difference, but they may need to be of an unprecedented magnitude given that in the current labour market teachers can earn much more in other industries.
The future of primary education rests on strong school leadership and skilled teachers. In some respects, the problem of ensuring the quality of the next generation of leaders and teachers transcends all others in this report.
Funding frameworks
Cost differentials
The surest way of improving the academic results of schools is to change their student profiles by attracting able students from supportive families and excluding those who do not make a commitment to support the behavioural and academic norms established by the schools. Some schools have acquired reputations for the quality of their work and are placed in the advantageous position of choosing their students, whereas others work hard just to get the local students to attend at all.
This report has emphasised the need to see students as a resource and recognised that some schools are, in this sense, endowed richly. Others have large enrolments of students who have come from homes that do not value education, have parents or carers who have difficulty in managing their own lives and whose children have behavioural, emotional and social problems of various kinds. If children in both kinds of schools are to have equal opportunities to achieve academic success, the funding mechanisms used by governments should reflect adequately their differing resource needs.
The kinds of schools that are often under-funded include:
• those serving communities that are unable to provide the schools with practical or moral support;
• those that are unable to attract or retain core groups of qualified and experienced staff;
• those with significant numbers of students failing to reach the benchmarks, even after individualised support in the early years;
• those with disabled students that do not have the additional resources to supplement the special allocations to make integration work;
• those with students who are highly disruptive but for whom there are no additional resources to manage their behaviour;
• those with significant numbers of transient students for whom no special provision has been made;
• those attempting to provide instruction in a learning area (such as LOTE) for which they do not have a qualified teachers; and
99

• those where the facilities are so run down that they project a sense of school and community hopelessness.
Some schools can justifiably point to all eight instances as indicative of why they need extra support. Under normal circumstances, schools find ways of assisting students with special needs from within their standard resource allocations by ‘robbing Peter to pay Paul’. However, the concentration of these students in a single school poses a resource problem of such a scale and of such complexity that it will not be resolved by extra effort or token support.
Australian governments provide additional funding for schools enrolling students with diagnosed disabilities. But it is not enough and it is not targeted accurately enough.
Funding reaches schools through too many separate channels and without sufficient regard for the aggregate levels of resources acquired by the schools. The result is that the schools under the greatest pressure do not always get the most resources; it is a hit-and-miss process.
While the targeting is inadequate, there is strong evidence that the amounts of funding to redress the disadvantage faced by a significant number of schools are insufficient.
Precise details of government spending for this purpose are not disclosed in annual reports, but it would seem that it accounts for about 10 per cent of government primary school expenditure. This is far too small a differential to make a significant difference. To put the issue another way, Australia has a wide dispersion of academic achievement with a long tail of low achievers, but only a small amount of additional funding is allocated to the schools with the highest incidence of students who are difficult to teach.
Simply increasing funding to an arbitrary level is not a good idea. The quantum needs to be tied to the needs of students and what it would cost to enable the students to succeed at school. Education authorities are best placed to establish the numbers of such students and their locations. They should also be able to produce frameworks for costing the additional services that would lead to successful outcomes. Such frameworks should be open to public inspection. It is not enough
to publish the formulas that are used to allocate funds: given the importance attached by governments to student performance measures, there is an onus on governments to demonstrate that the amounts allocated are sufficient for all schools to produce the outcomes sought by them. Other than the MCEETYA Schools Resourcing Taskforce reports, there is a paucity of Australian evidence on which to draw.
Access to school finance data
At present, large systems find it difficult to report data in forms that enable analysts to link funding to professional practice. Hence, analyses of the cost of programs, the reticulation of allocations from the centre to schools, the links between resource use and performance and shifts in allocations from one target area to another, cannot be undertaken with any accuracy. This means that important policies are being made without adequate consideration of the costs and benefits.
Most large education systems are engaged in improving their central finance systems, attempting to make them more intelligible and useful. However, because school funding in Australia is such a complex process, the improvements are modest and are being achieved slowly. Moreover, some questions about school funding can only be addressed with the cooperation of the Commonwealth and the States, because the Commonwealth retains most of the funding information about non-government schools and the States hold most of the information about government schools: the data in each of these systems are not directly comparable across systems or States.
Most of the research on school finance in Australia is undertaken ‘in-house’ by education authorities and the results are not available to the public. Some of this research is about the internal working of systems and it is understandable that officers do not want to see it in the public arena. However, greater disclosure of government funding to schools is in the public interest. It can also be argued that systems should be expected to report not only on the total amount of funding but also the portion allocated to schools for students with special needs. It is paradoxical that schools are expected to disclose the performance of their students on national tests but have no means of disclosing the totality of resources at their disposal that can be used to produce those results.
100
Unfortunately, the level of distrust between Commonwealth and State governments militates against more open access to school finance data.
Complementarity of Commonwealth and State government funding
At present, there is no agreed framework between governments over what should be funded by whom.
In practice, the Commonwealth has become the major funding agency for non-government schools while State governments have major responsibility for government schools. However, it is a complicated situation because all schools are funded to some extent by both levels of government.
In the absence of an agreed funding framework, it becomes difficult to establish which level of government should bear responsibility for any under-funding of primary schools. Regular meetings of Ministers for Education throughout the last century failed to resolve this issue and the tensions between the two levels have become a fact of political life. Requests for additional funding tend to be referred from one level to the other.
This is a serious problem and one that sits well beyond the reach of primary principals to solve. Better information about needs and costs will not be of any practical use if there is no agreement on the basis for sharing the responsibility for resourcing Australian schools.
Primary school ‘voice’
The disconnection between schools and peak bodies
Primary schools are part of a complex system of educational governance. It is a hierarchical system in which primary school principals and teachers occupy a bottom rung. Nominally, those who occupy higher positions in central agencies are there to support what happens in schools, although central officers and teachers tend to see the world differently. From the school perspective, the national debates appear a long way removed from the issues they are dealing with.
In Chapter 2, it was explained that departmental structures and curriculum frameworks were reorganised along K-12 lines with the intention of blurring the old
divisions between the primary and secondary levels of schooling.
The new structures and frameworks were designed to submerge the traditional divisional loyalties toward primary or secondary schooling under a stronger corporate identity. The restructuring encouraged the leadership of primary education to shift from systemic authorities to professional associations of principals and teacher unions.
In this environment, primary school principals have felt that their perspective on how best to lead and manage their schools has been overshadowed by the concern for the 0-5 year olds (which has its basis in health and welfare) and the concern about secondary schooling (which is dominated by issues relating to tertiary education and the labour market).
There is no designated advocate for primary education at the apex of the Australian education system. Ministers and education authority executives speak for all schools.
Primary school principals are looking for leadership so that they can be confident that their interests have been pressed as strongly as possible in the peak policy-making forums.
A new narrative of primary schooling
Electronic and print media do not have sufficient time or space to explain or develop complex arguments about primary schooling. Journalists rely on the fact that their readers and listeners have been to school and know at first-hand how schools operate.
Ministers and officials, in order to press their points of view, recognise these constraints and play the game of simplifying the issues in order to get their messages across. From time to time abbreviated ‘stories’—part myth and part fact—emerge that frame discussions about current events in the media. This can be helpful but it can also be dangerous, depending on the ratio of fact to myth.
The dominant story or narrative of schooling today is formed around notions of international competitiveness, the comparative showing of young Australians on international tests, benchmarking, the need for all children to achieve success while at school, the importance of parents being able to choose
101
good schools, and finding ways of putting pressure on schools and teachers that fail to produce satisfactory test scores. The persuasiveness of such stories rests on the belief that the combination of rewards for success on tests and sanctions against those who have larger-than-average numbers of failing students, combined with the market force of school choice, will drive improvement.
Because there are seasonal releases of test scores and because the results of individual schools are increasingly accessible to the media, the story can be re-told time and again, with new test results and new examples of exceptional performance. In the re-telling, large sections can be omitted because ‘everybody knows what you are talking about’.
A different kind of story has been framed to promote the interests of children in their early years. The leaders of the early years constituency have been able to form powerful alliances with government, public and private sector agencies, and the child health research community. To develop their public profile, they have co-opted prominent professional and community figures as patrons, built on the work of Nobel Prize-winning economists, epidemiologists and neuroscientists, and constructed a storyline about the practical benefits of investing in the care and education of young children before they start school. The story explains how science is uncovering more and more evidence to support the claim that the earlier the intervention in the health and education of children the better. Virtually all breaking news in the field of neuroscience is good news since the more that is discovered about the way the young child develops and the brain functions the more often the public can be reminded that young children (especially those from disadvantaged backgrounds) need to make a good start and require the financial support of governments to do so.
What should be the basis of the ‘primary school story’?
This is a surprisingly tough question and is not answered here, but part of it must surely be about how children learn best during their primary school years. This topic has vanished from contemporary discourse about schools. In its place, the story has focused on narrow definitions of the subject matter that children need to know and to what standard. These are topics that do not require a special knowledge about
primary schools or learning theory. Without rejecting the commitment to enabling all young children to become competent readers and proficient users of number, primary education leaders need to foreground an alternative set of symbols around childhood, development and learning.
To help tell the story, primary educators should learn from the early years constituency and find their own advocates: scientists, eminent citizens, outstanding educators and people with a deep understanding of children (in particular, a knowledge of how they develop during their primary school years and how they learn in school settings).
Conclusion
The argument presented in the opening chapter, based on the earlier APPA studies, was simplified in the form of an equation in which the resources needed by a school (setting aside its enrolment and location), were a function of three factors: the performance expectations set for all students; the breadth and depth of the curriculum offerings; and the characteristics of the student intake.
The analysis undertaken in this study supports such a formulation. From a historical perspective, expectations have burgeoned. Governments have set schools ambitious goals and student performance targets that have never been met previously. There is no indication of any willingness to water them down. Nor is there any example of a nation that has achieved goals of this kind. Their realisation appears beyond the reach of every school while current resource configurations remain in place.
Schools must also contend with the expectation that they provide a curriculum of seemingly unlimited breadth and depth. More resources are likely to provide a partial solution to this problem insofar as they enable time to be used more efficiently in achieving literacy and numeracy outcomes. However, strong government leadership is also needed to halt the endless stream of new curriculum initiatives that originate from well-intentioned enthusiasts.
Finally, there is the issue of the student intake. This report has argued strongly that greater recognition of differences among schools needs to be reflected in school resourcing formulas. Students at the tail end in
102
benchmarking tests often experience multiple forms of disadvantage and small amounts of ‘top-up’ funding are unlikely to make much of a difference to student outcomes.
There have been several references to the need to strengthen the primary school ‘voice’. The institutional life of primary schools is seemingly being shaped by a policy-making process into which primary educators have no evident input. Yet there are nearly seven thousand stand-alone primary schools in Australia, ‘home’ to nearly 200,000 teachers and two million children for much of the year. These numbers increase when the junior sections of combined schools are included.
Teaching is becoming an endangered profession. The current generation of primary principals and teachers have made long-term commitments to a relatively low-paid job because teaching has a higher moral purpose than most other occupations: shaping the lives of children.
They feel responsible for the whole child, and therefore are apprehensive of policies that construe their purpose
103
in terms of a narrow set of outcomes and reduce the complex totality of the school to a few numbers. Primary schools are communities in which character is fashioned, values internalised and life courses set.
Recommendation
16. A network is proposed of approximately 200 representative primary schools to assist governments to improve policies that impinge on the educational work of primary schools. The schools should be drawn from all sectors and States and include a broad range of school and community profiles.
The Primary School Project should be managed and funded jointly by the Australian and State governments in such a way that all findings are released without prejudice: that is, determinations of responsibilities for funding primary schools will not be implied through the conduct of this work.

104
Resource needs
This study has shown that there are large variations among Australian primary schools in terms of almost every practical indicator, including their intakes, their funding and the levels of student academic performance. As a result, some schools are under much more pressure than others.
In broad terms, about one-third of schools appear able to achieve the expectations of governments and the wider public within their existing resource levels. However, they have no excess capacity that would allow them to respond to new challenges or undertake additional functions. Generally, these schools are striving to do more for their students and have plans for improvements that are being held in abeyance for lack of resources.
Another third are able to achieve satisfactory outcomes for most of their students within their existing resource levels, although principals felt they were ‘close to the edge’. For example, the loss of their best teachers or their most able students to other schools would tip the balance. In these schools there is no ‘fat’, so any additional tasks required of them can only be undertaken by skimming resources from other important parts of the schools’ operations.
The remaining third, located in both the government and non-government sectors, have to make serious compromises of one kind or another in order to keep going. The problems that these schools face are not all of the same kind, although location and intake are common factors. These schools need substantial increases in their human and financial resources if they are to solve their problems.
Responsibility for action
The study has not sought to quantify the amount of funding that would give all primary schools a fair chance of achieving the goals set for them by governments. A national data set is not publicly available in a form that would enable such a calculation to be made.
The study has explained how governments fund primary schools on a pragmatic basis without reference to resource standards. What is needed is a funding regime that allocates to each school the funds needed to give its students a fair chance of achieving the National Goals. Schools are expected to ensure that all students achieve benchmark standards and are being held accountable for the performance of their students even though the resources they receive may be inadequate for that purpose.
The methodology to make more precise calculations of the resources schools need is available. MCEETYA has made a commendable attempt at estimating the amount of funding that is needed. The stumbling block is the matter of who pays.
Sorting out ‘who funds what’ is a problem for the whole education sector, not just for primary education, although it could be argued that the lower level of funding in primary schools means there is a greater imperative attached to their case.
Matters of Commonwealth-State relations are dealt with by COAG, the council of Premiers and the Prime Minister. This body is concerned with increasing national productivity and finding efficiencies that could possibly arise from realigning the responsibilities of
11
Recommendations
105

the Commonwealth and States. It will be difficult to capture the attention of COAG unless the challenges facing primary education are couched in terms of productivity improvements: in other words, improvements in primary education are described as investments in national human capital. This argument has served the early years and high school constituencies well. Arguing that additional funding for primary schools is an investment in human capital goes against the grain for many primary educators but their leaders will have to learn to frame their concerns in these terms in order to make progress.
This report has focused on what government and education authorities should do to enhance primary schooling in Australia. The recommendations that follow are not meant to imply that teachers and principals have nothing to contribute or should be exempted from sharing the responsibility for solving the problem. It should be obvious that enhancing the quality of primary education requires a partnership: a shared commitment among stakeholders.
There is much said in the media about what schools need to do but many of the levers that would enable principals and teachers to do better are outside their reach.
Schools are accountable, as they should be. However, they share responsibility for the achievement of educational outcomes with education authorities and governments.
Agenda for action
Purpose and identity of primary schools
National policies on educational goals, the school curriculum and student assessment that are intended to apply to primary schools should be framed in terms that reflect the distinctive purpose of these schools. At present, the key policies that drive national decision making tend to span all levels of schooling and take little account of how children in their primary school years develop and best learn. National policy documents refer to the early years, the middle years and the senior secondary years. This blurring of primary school identity and purpose contributes to the downward thrust of the secondary curriculum into primary schools. The practice also disenfranchises the primary teaching profession in the policy-making process.
Recommendation 1All Australian governments should endorse a comprehensive statement articulating the special purpose of primary schools.
106
Participation in primary education policy making
Policies that affect primary schools are often made by peak government bodies without input from primary school leaders. There should be structures in place that enable primary principals and classroom teachers and their professional representatives to engage in national and State policy-making processes that are shaping the character of primary schools.
Approaches by stakeholders to change or supplement the primary curriculum frameworks should be filtered and managed so that the primary school curriculum remains balanced and unreasonable expectations are not imposed on schools. In particular, steps should be taken to ensure that curriculum changes appropriate for older students in secondary schools do not cascade into primary schools.
Although the structure and content of the primary curriculum is a matter for each State education authority to determine, the issues that arise in Australia’s primary schools are sufficiently common to warrant the establishment of a national advisory group of primary educators.
Recommendation 2MCEETYA should establish a Primary Curriculum Group to provide advice on proposals for new syllabuses, additions to the existing curriculum, and student assessment programs. The group should serve as an advisory committee to MCEETYA and include experienced primary educators.
Primary syllabuses
During the last decade, there has been a process of continuing primary curriculum development and change in all jurisdictions. Most are now engaged in a further round. The focus of the most recent developments is on making explicit the mandatory content of the curriculum. Education authorities should ensure that during this process the amount of material to be covered in the new syllabuses is limited so that schools retain time for innovative and local curriculum initiatives.
The history of curriculum development in Australia suggests that curriculum writers are rarely able to exercise such restraint.
Recommendation 3Before any syllabuses are adopted widely, education authorities should conduct trials to demonstrate that all schools are able to cover the essential content within 60 per cent of the allocated instructional time.
107
Assessment and accountability
It is important that education authorities have the capacity to monitor educational standards in their jurisdictions. The judicious use of assessment is an important instrument for determining trends in student performance over time. However, it is well established that where there are significant consequences attached to student test results, the resultant pressures can lead to aberrations in the responses of education authorities, schools and individual teachers.
The use of student assessment results to hold schools and teachers accountable should not be allowed to undermine sound educational practice, diminish the status of teachers or harm children.
Governments should establish policies on the appropriateness of various forms of ‘high-stakes’ student assessment in primary schools and set limits on the extent to which it is used.
Recommendation 4MCEETYA should produce a national position paper on the use of ‘high-stakes’ tests for school and teacher accountability; the paper should provide guidelines on how to avert potential negative consequences.
Literacy and numeracy under-performance
There is a small tail of students struggling to reach national benchmark standards for literacy and numeracy.
The capacity of primary schools to assist these students has been enhanced in the early years by reduced class sizes and the introduction of intensive instructional programs such as Reading Recovery. While these initiatives appear to have achieved some success, many of the students identified as struggling to read, write or complete mathematical operations fall behind in the later years of primary school.
Recommendation 5
There should be an immediate strengthening of the capacity of primary schools to work with students in the middle- and upper-primary years who are failing to make progress in literacy and numeracy.
Recommendation 6Funding for students with disabilities should be increased to a level that enables schools to provide for these students adequately in mainstream settings.
108

Managing extreme student behaviour
Some primary schools have a small number of students who behave in ways that endanger other children, threaten teachers, and have a disastrous effect on the smooth operation of the school. These highly disruptive students often do not have diagnosed mental health problems and are not eligible for special needs funding, yet they require constant supervision.
Principals are reluctant to exclude these students. Though the students may be referred to psychologists or other experts for assessment and advice, at the end of the referral process they return to their schools. Other government agencies are usually able to provide schools with support for only the most severe cases.
Recommendation 7Special needs funding criteria should be extended by government authorities to make provision for students with highly disruptive behaviour and the necessary funds allocated accordingly.
Specialist instruction
Primary principals and teachers recognise the importance of English and Mathematics and give these subjects a special priority by allocating more than half of the schools’ instructional time to them. Advocates for each of the other KLAs can mount a case for why one or another of them should receive greater prominence than at present.
However, it is clear from this study that there is considerable variation in curriculum expertise among the staff of any particular primary school. Therefore, it would be unwise to mandate specialist instruction in subjects other than English and Mathematics across all schools. A preferred approach would be to enable schools to teach to the strengths of their staff profiles.
Recommendation 8Education authorities should ensure that all schools in their jurisdiction have the capacity to develop at least one subject other than English and Mathematics into an area of excellence through the use of specialist instruction. Funds should be allocated to enable the progressive development of specialist subjects identified by schools and their communities. Low-SES schools should be given priority.
109
Staffing disadvantaged schools
Many people hold the view that in an ideal world the most able teachers should be appointed to the schools with the most challenging students. However, at the present time there are few tangible incentives to attract teachers to ‘difficult’ schools. The fact that so many outstanding teachers opt to work in such schools is a tribute to their professionalism.
It is crucial that any policies to reward teachers for their performance recognise the contribution made by teachers who work with difficult students. If school staffing is opened to market forces, then the wealthiest schools will be better positioned to recruit the most able teachers.
This is a complex problem and there is no simple solution in sight. Yet the supply of able teachers prepared to teach in challenging schools is perhaps the most important issue facing primary education. It cannot be solved by primary principals.
The extent of this problem varies among jurisdictions according to factors such as the geographic dispersion of schools and the teacher labour market. While the supply of primary school teachers may be adequate nationally, this does not alter the recruitment problems experienced by schools that most teachers prefer to avoid. The problem is sufficiently endemic to warrant the attention of MCEETYA.
Recommendation 9MCEETYA should attach the highest priority to addressing the problem of ensuring that hard-to-staff schools have an adequate supply of able teachers.
Support services
Cooperative relationships with other agencies should be developed in communities that lack the moral purpose and practical capacity needed to support a primary school.
Effective, inter-agency work is time consuming and should not be loaded on top of the other duties of principals and their leadership teams.
Recommendation 10Schools that are engaged formally in community development work should receive allocations for the coordination of activities that take account of the real costs of this kind of work to the school.
110
Transparent reporting of school income and expenditure
Financial reporting should itemise school-level data on income from government and private sources and recurrent and capital expenditure. This data should reflect the actual resources available in individual schools (that is, it should not be calculated on a pro rata basis). The data should be made available for the purposes of accountability, independent research and policy analysis.
Recommendation 11
MCEETYA should adopt a common financial reporting instrument for government and non-government schools. The Australian Government’s Financial Questionnaire for non-government schools provides a model for the instrument that might be used across sectors.
The results of an annual cross-sectoral census should be reported in the National Report on Schooling, showing the distribution of incomes and expenditures per student for various sub-categories of schools.
Any member of the public should be able to retrieve from a national database the income and expenditure per student for a particular school for a recent financial year and compare it with like schools.
MCEETYA should also report in the National Report on Schooling the income and expenditure cost differentials for schools at each SES quintile.
Competitive funding mechanisms
There has been a proliferation of programs in which relatively small amounts of funding are made available for core activities and facilities and for which schools must make submissions on a competitive basis.
Most primary schools do not have the managerial infrastructure to participate in such programs; schools that do so divert principals from core business. Governments should use competitive, submission-based funding mechanisms sparingly, taking account of the purpose of the program and the capacity of hard-pressed schools to compete.
Recommendation 12Competitive grant mechanisms should not be employed to fund essential programs. The amount of primary school funding that is allocated on a competitive basis should be monitored and reported in the National Report on Schooling. The Report should specify successful applicants.
111

Commonwealth-State framework for funding primary schools
There should be a cooperative working relationship among the Australian governments to promote the interests of primary schools and their students.
The history of Australian education shows that collaboration between the two levels of government has been elusive. If school education is truly a national priority for governments in the twenty-first century, then it is time for a settlement.
Recommendation 13MCEETYA should develop a framework that makes explicit the shared and separate responsibilities of the Australian and State governments for funding primary schools.
Resource differentials
Low-SES primary schools should be funded at a level that enables them to attract and retain staff, provide intensive instruction in English and Mathematics to students not meeting benchmark standards, and ensure that children have access to subjects on the same scale as schools in more affluent communities. This has not happened so far because there have not been agreed resource standards.
There is wide acceptance of the principle that schools serving disadvantaged communities should receive additional support but no agreement on the quantum. This study has shown that there is no guarantee that low-SES schools receive more income than high- or medium-SES schools and, further, where they do receive extra funding, the amount falls below the level needed to make a significant difference to student outcomes.
Development of a nationally agreed position on resource standards will take considerably more work. However, the needs of many schools are so acute that action is required immediately. Until there is an agreed primary school funding framework adopted by MCEETYA that incorporates evidence-based resource standards, governments should adopt the targets for the schools with the greatest need.
Recommendation 14Governments should adopt funding targets to increase differentially allocations to the primary schools in the greatest need. Recurrent grants should be scaled according to individual school SES indices so that schools with the greatest need are assisted by a factor of 1.5.
112

Research into school funding
At present, there is very little research into the effectiveness of the funding of Australian schools, notwithstanding investment by governments that exceeds $30 billion annually. One reason is Australian researchers find it difficult to access school finance data because of the complexity of the funding arrangements and the political sensitivity of the data.
As a result, claims about the resource needs of schools are based largely on incomplete evidence, supposition or overseas research findings.
Recommendation 15
Provision should be made for the national school finance database to be accessed by independent researchers, subject to appropriate safeguards.
The Australian Government should fund a program of research into the cost effectiveness of interventions that have a prospect of enabling low-performing students to achieve the National Goals of Schooling.
Further, MCEETYA should undertake research on the efficacy of existing SES funding mechanisms. The research should examine the feasibility of adopting a common national framework such that stakeholders can be assured that the intentions of Australian governments to alleviate educational disadvantage have the prospect of being achieved.
The Primary School Project
The recommendations that have been advanced are broad and challenging. They make connections between aspects of curriculum and assessment, school management and school funding, each of which is an area of government policy making that has become compartmentalised over recent decades.
Primary schools are dynamic institutions in which government policies must somehow be integrated if they are to have a positive effect. School reforms often yield positive outcomes but they can also produce unintended negative consequences because the authors of the reforms did not recognise the complexity of the environment in which their well-intentioned changes were to take root.
An approach is needed that would encourage vigorous and productive discussion about the best interests of Australia’s primary schools and allow for reforms in a range of areas to be developed. The schools participating in the Primary School Project would be asked to test-run both curriculum and financial reforms with a view to clarifying the appropriate boundaries of national policy frameworks that can be applied usefully to all schools. As these frameworks were developed to satisfactory standards, they could be extended to a wider group of schools prior to full-scale implementation in all schools.
Recommendation 16
A network is proposed of approximately 200 representative primary schools to assist governments to improve policies that impinge on the educational work of primary schools. The schools should be drawn from all sectors and States and include a broad range of school and community profiles.
The Primary School Project should be managed and funded jointly by the Australian and State governments in such a way that all findings are released without prejudice: that is, determinations of responsibilities for funding primary schools will not be implied through the conduct of this work.
113

114
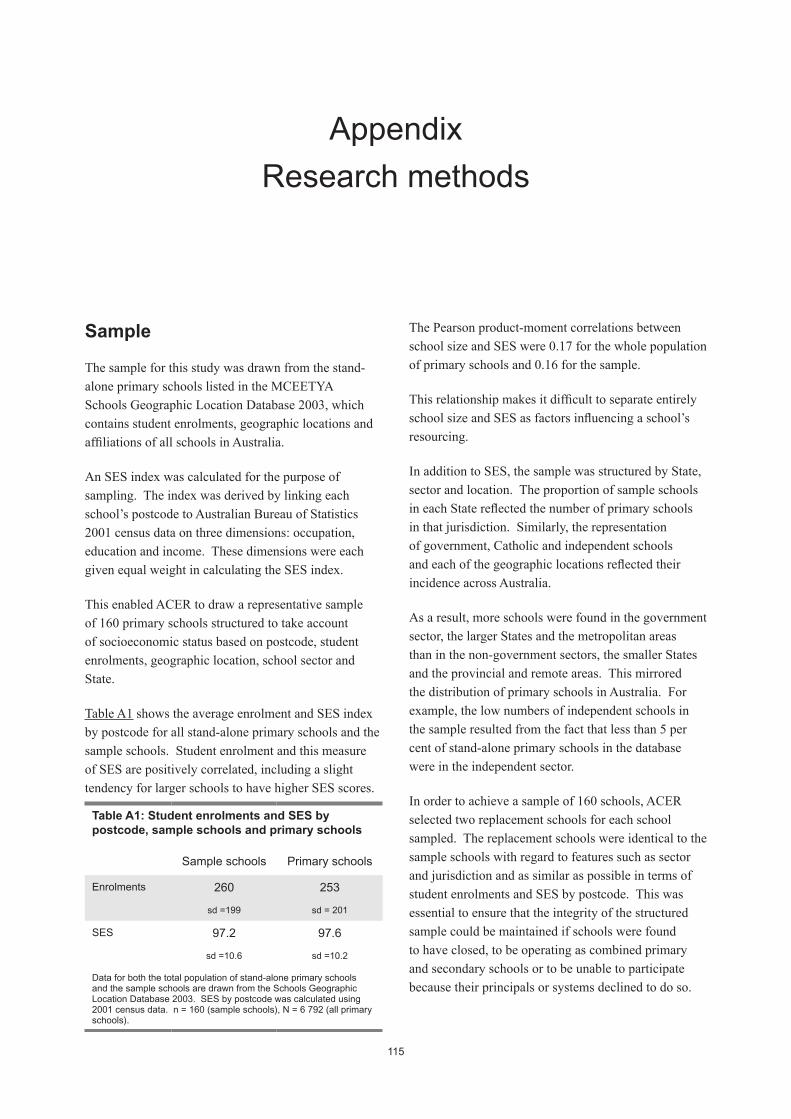
Sample
The sample for this study was drawn from the stand-alone primary schools listed in the MCEETYA Schools Geographic Location Database 2003, which contains student enrolments, geographic locations and affiliations of all schools in Australia.
An SES index was calculated for the purpose of sampling. The index was derived by linking each school’s postcode to Australian Bureau of Statistics 2001 census data on three dimensions: occupation, education and income. These dimensions were each given equal weight in calculating the SES index.
This enabled ACER to draw a representative sample of 160 primary schools structured to take account of socioeconomic status based on postcode, student enrolments, geographic location, school sector and State.
Table A1 shows the average enrolment and SES index by postcode for all stand-alone primary schools and the sample schools. Student enrolment and this measure of SES are positively correlated, including a slight tendency for larger schools to have higher SES scores.
The Pearson product-moment correlations between school size and SES were 0.17 for the whole population of primary schools and 0.16 for the sample.
This relationship makes it difficult to separate entirely school size and SES as factors influencing a school’s resourcing.
In addition to SES, the sample was structured by State, sector and location. The proportion of sample schools in each State reflected the number of primary schools in that jurisdiction. Similarly, the representation of government, Catholic and independent schools and each of the geographic locations reflected their incidence across Australia.
As a result, more schools were found in the government sector, the larger States and the metropolitan areas than in the non-government sectors, the smaller States and the provincial and remote areas. This mirrored the distribution of primary schools in Australia. For example, the low numbers of independent schools in the sample resulted from the fact that less than 5 per cent of stand-alone primary schools in the database were in the independent sector.
In order to achieve a sample of 160 schools, ACER selected two replacement schools for each school sampled. The replacement schools were identical to the sample schools with regard to features such as sector and jurisdiction and as similar as possible in terms of student enrolments and SES by postcode. This was essential to ensure that the integrity of the structured sample could be maintained if schools were found to have closed, to be operating as combined primary and secondary schools or to be unable to participate because their principals or systems declined to do so.
Appendix
Research methods
Table A1: Student enrolments and SES by postcode, sample schools and primary schools
Sample schools Primary schools
Enrolments 260 253
sd =199 sd = 201
SES 97.2 97.6
sd =10.6 sd =10.2
Data for both the total population of stand-alone primary schools and the sample schools are drawn from the Schools Geographic Location Database 2003. SES by postcode was calculated using 2001 census data. n = 160 (sample schools), N = 6 792 (all primary schools).
115

Table A2 shows the number of schools in each of the three sectors and geographic location zones for each State.
Table A3 shows that the metropolitan schools were larger and had higher SES scores than did the provincial and remote schools.
System approvals
Formal requests to undertake research in the schools drawn in the sample were made to all systems before contacts were made with schools. This was a lengthy process, as there are 57 school systems in Australia.
Not every Catholic diocese operates its own school system. While the smaller jurisdictions tend to have Catholic education offices that function as systems, New South Wales and Victoria have separate school systems in each diocese. Each had its own set of procedures to be followed before formal approval to undertake research in a school was given.
Some independent schools are also systemic, operating under the auspices of Statewide agencies of the Anglican Schools Commission, Lutheran Schools Australia and Adventist Schools Australia.
In one of the large government systems, formal approval was required from each of the regional directors, the central bureaucracy and each participating school. Some regions had different requirements for granting formal approval.
Twenty-seven school systems were represented in the 160 schools that participated in this study.
Approaching the schools
In most cases, principals were approached through their representatives on APPA’s National Executive Committee or project officers who had been appointed to assist with this task. This ensured that principals were aware that the research had been commissioned by APPA.
Table A2: Number of sample schools, State, school sector, geographic location zone
State Sector Location All
Gov Cath Ind Metro Prov Remote
NSW 39 10 3 30 21 1 52
VIC 29 9 1 23 16 – 39
QLD 23 5 1 13 12 4 29
SA 10 2 2 9 5 – 14
WA 13 2 2 10 5 2 17
TAS 3 1 – 2 2 – 4
NT 2 1 – – 2 1 3
ACT 1 1 – 2 – – 2
Totals 120 31 9 89 63 8 160
These figures describe the actual schools that participated in the study. The Schools Geographic Location Database has eight location regions: two metropolitan, four provincial and two remote. The sample was drawn using all eight regions.
Table A3: Geographic location zones, student enrolments 2003, SES by postcode
Location Student
enrolment
SES by
postcode
Metropolitan 345 101
sd = 180 sd = 11
Provincial 165 92
sd = 171 sd = 5
Remote 53 94
sd = 61 sd = 6
The eight geographic location regions used to draw the sample have been collapsed into three zones.
116
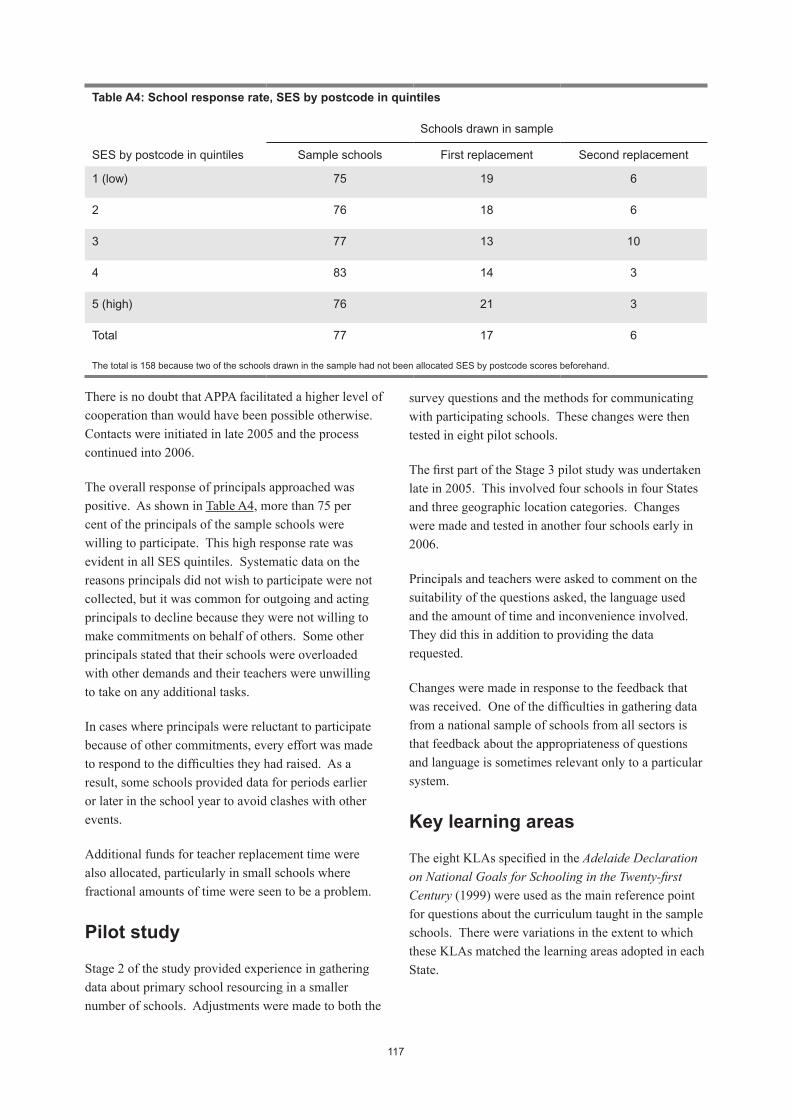
There is no doubt that APPA facilitated a higher level of cooperation than would have been possible otherwise. Contacts were initiated in late 2005 and the process continued into 2006.
The overall response of principals approached was positive. As shown in Table A4, more than 75 per cent of the principals of the sample schools were willing to participate. This high response rate was evident in all SES quintiles. Systematic data on the reasons principals did not wish to participate were not collected, but it was common for outgoing and acting principals to decline because they were not willing to make commitments on behalf of others. Some other principals stated that their schools were overloaded with other demands and their teachers were unwilling to take on any additional tasks.
In cases where principals were reluctant to participate because of other commitments, every effort was made to respond to the difficulties they had raised. As a result, some schools provided data for periods earlier or later in the school year to avoid clashes with other events.
Additional funds for teacher replacement time were also allocated, particularly in small schools where fractional amounts of time were seen to be a problem.
Pilot study
Stage 2 of the study provided experience in gathering data about primary school resourcing in a smaller number of schools. Adjustments were made to both the
survey questions and the methods for communicating with participating schools. These changes were then tested in eight pilot schools.
The first part of the Stage 3 pilot study was undertaken late in 2005. This involved four schools in four States and three geographic location categories. Changes were made and tested in another four schools early in 2006.
Principals and teachers were asked to comment on the suitability of the questions asked, the language used and the amount of time and inconvenience involved. They did this in addition to providing the data requested.
Changes were made in response to the feedback that was received. One of the difficulties in gathering data from a national sample of schools from all sectors is that feedback about the appropriateness of questions and language is sometimes relevant only to a particular system.
Key learning areas
The eight KLAs specified in the Adelaide Declaration on National Goals for Schooling in the Twenty-first Century (1999) were used as the main reference point for questions about the curriculum taught in the sample schools. There were variations in the extent to which these KLAs matched the learning areas adopted in each State.
Table A4: School response rate, SES by postcode in quintiles
Schools drawn in sample
SES by postcode in quintiles Sample schools First replacement Second replacement
1 (low) 75 19 6
2 76 18 6
3 77 13 10
4 83 14 3
5 (high) 76 21 3
Total 77 17 6
The total is 158 because two of the schools drawn in the sample had not been allocated SES by postcode scores beforehand.
117
Data sources
There were two main sources of data from each of the participating schools: the principal and classroom teachers.
Principals
Principals were asked to complete a School Survey Form, which asked questions about student enrolments and attainments, the profile of the local community, the teaching and non-teaching staff and anyone else working in the school, the school’s facilities, its income and expenditure for the 2005 school year, the curriculum, programs and assessment frameworks in place, professional support and the school timetable.
Principals were also invited to annotate any of the questions with supplementary information and to make any general comments they felt to be relevant.
Teachers
Principals were asked to select one, two or three teachers (depending on the size of the school) they considered to be representative of the teaching staff working in the school.
The teachers were to be drawn from Years 2, 4 and 6, to provide information about the junior-, middle- and upper-primary years and avoid overloading teachers in Years 3, 5 and 7, the years in which literacy and numeracy assessments are conducted. Because many classes in primary schools combine at least two or more year levels, this was not always possible.
The participating teachers were asked to complete the Class Log and Teacher Survey Form.
The Class Log requested teachers to describe their classes’ instructional and other activities over a nominated week. They were sent sets of highlighter pens and asked to code their time to show when they were teaching, when other teachers took their classes or provided support to them while they were teaching, and whether they had provided instruction to other classes.
The Teacher Survey Form asked questions about the nominated week, their experience, the students in their classes, specialist and support teachers working with their classes, the curriculum (including any integrated studies units they taught) and professional issues such as opportunities to moderate their students’ work samples.
Teachers were also invited to annotate any of the questions with supplementary information and to make any general comments they felt to be relevant.
The nominated week
A nominated week was used for reporting information that would have been been too difficult to recall over a longer period of time. A week was selected because it allowed for a range of activities to be described but was sufficiently finite for most teachers to answer questions without needing to refer to written records.
A nominated week was suggested for each school: during May for nearly half of the schools and a week in July-August for the remainder. There was some variation because of different term dates and because some schools requested changes to the week suggested.
It was hoped that the weeks selected would be relatively free of major disruptions, but this proved to be almost impossible.
Mailout and Website
Printed survey forms were mailed out to the schools about a month before their nominated weeks. Examples of completed forms drawn from the responses of the principals and teachers in the pilot study were also included, to illustrate the level of detail sought by the researchers.
A Website was set up so that principals and teachers who preferred to enter data electronically could download Microsoft Word® versions of the forms for this purpose.
Principals and teachers were asked to keep their completed survey forms until researchers visited the schools to collect them.
School visits
School visits were conducted by researchers as soon as possible after the nominated weeks. Advance arrangements were made to collect the completed survey forms from the school offices on arrival and allow the researchers about an hour to look through the information provided. The researchers were able to identify ambiguous or contradictory responses and ask for clarification. They met with the participating teachers wherever possible, interviewed principals and asked for staff members (usually the principals) to provide them with tours of the schools’ facilities.
118

Table A5: Method used for coding teachers’ reports about use of instructional time
Integrated studies Coded as component subjects if shown on log. If not shown, coded first as
Integrated Studies then disaggregated from information provided in the Teacher
Survey Form
English Library, News in lower primary, Reflections (Vic), Literacy assessment
Mathematics Numeracy assessment, Count Me In Too (NSW)
HPE Health Education included You Can Do It (Vic), Personal Development, Health
Relationships (Vic). Physical Education included Dance (Vic), Perceptual Motor
Program. Sport included cross-country running, long jump, rugby, house sports
carnival, interschool sports carnival.
The Arts Music coded as Class Music if no further details provided. Time for Choir or
Band split according to the proportion of the class that attended. The remainder
of the class’s time coded according to the activities of the students remaining in
class. Art and Art and Craft coded as Visual Arts if no further details available.
Dance (NSW) coded as Performing Arts. Performances at school assemblies
including the rehearsals coded 50 per cent Performing Arts and 50 per cent
school gatherings.
SOSE Human Society in its Environment (NSW), Humanities (Vic), foreign ‘language’
where no LOTE teacher (or instructor) employed, Behind the News (ABC
television program), current affairs.
Technology Cooking, Technology (NSW) coded as ICT if described as ‘Computers’, activities
involving design-make-appraise methods. Science and Technology (NSW) split
50:50 with Science.
Science Science and Technology (NSW) split 50:50 with Technology
LOTE Language taught by a specialist LOTE teacher or instructor
ICT Technology (NSW) coded as ICT if described as ‘Computers’, class time spent
in computer laboratories, time split with another subject if specified.
Religious education Scripture, Bible study, worship, prayer
School gatherings Whole-school assembly, assembly organised for a section of the school, e.g.
Years 4-6, performances at school assemblies including the rehearsals coded
50 per cent Performing Arts and 50 per cent school gatherings.
Class organisational activities Morning activities included recording attendance, ordering lunches, collecting
money. Afternoon activities included cleaning up classroom, packing up,
handing out school newsletters.
Homework or individual study Time split if a subject was specified.
Other Activity specified but did not fit into a particular subject: for example, visit from
Volunteer Fire Brigade.
Unknown Information about use of time not given: for example, when an activity was
scheduled but then cancelled or when half the class was involved in an activity
but no details were given about the activities of those not participating.
Out of school hours Sports training, homework classes, band, choir
Activities that involved an individual or small group of students were not coded: for example, individual instruction in Instrumental Music or a student being withdrawn to attend a dental appointment.
119

In order to enable all schools to be visited, additional researchers were employed. All had relevant primary school experience and all were briefed fully on the objectives and procedures for the study. Because of the costs associated with the school visits, as many schools as possible were assigned to the researchers with the nearest home bases: Sydney, Melbourne, Canberra, Adelaide, Perth, the Blue Mountains, Toowoomba and Warrnambool.
In addition, a proportion of schools was assigned to the principal researchers to provide experience of a range of different schools in different States and circumstances.
System-level data
After schools had submitted their data, system officers were asked to supply centrally held data on income and expenditure.
Of particular interest was 2005 financial information not available from schools: funds paid through central payroll systems and centrally managed services. In the case of government systems, this was generally provided in the form of spreadsheets. For most non-government schools, copies of their 2005 Financial Questionnaires were supplied.
Use of instructional time
The principal categories for aggregating teachers’ reports of their use of time during the nominated week were the eight KLAs in the National Goals. As a result of experience with Stage 2, two learning areas—Health and Physical Education and The Arts— were split into sub-groups.
The bases on which various instructional activities were coded are described in Table A5. Some categories were added to the eight KLAs in order to describe satisfactorily the range of activities teachers reported.
It was common for a particular block of time to be allocated to more than one learning area.
Classes might be split: for example, if half went to an interschool sports carnival or band practice and the rest remained. Classes could also be split for such activities as ICT and library: half would work with the librarian while the other half worked on computers and then the two groups would swap activities.
Teachers might also report that a block of time was used for teaching more than one KLA: for example, SOSE and Science.
In cases where more than one learning area was involved, the total minutes were divided by the number of KLAs reported in relation to the time or the proportion of the class participating in the activity. Activities that drew individual students out of classes (usually instrumental music or small-group instruction in literacy) were ignored in calculating their classes’ use of time.
Teachers’ reports of their use of time during the nominated weeks were coded twice. If the coders reached different conclusions, questions about the activities were referred back to the researchers, who visited the schools for clarification.
SES indices
After the sample was drawn and schools had provided further details about their enrolments, it was possible to devise a more accurate measure of a school’s SES.
In the case of the non-government schools, DEST’s SES index has been used. This is the most valid and reliable measure available for non-government schools.
This method is not followed by government school systems, which use a variety of measures.
For government schools, the index was composed by incorporating data from ABS collection districts that
Table A6: Description of SES categories used for data analysis
SES Mean
Low 85.5
sd = 4.2
Middle 95.7
sd = 2.8
High 109.9
sd = 6.9
Total 96.7
sd = 11.1
SES indices are based on DEST’s SES index for non-government schools and the education, occupation and income of residents in collection districts surrounding each primary school for the government schools. n = 159
120
were proximate to the schools and contained sufficient children of primary school age to match the enrolments of the schools. This method, which provides a greater degree of precision than the use of postcodes, assumes that students attend schools in their neighbourhoods; this tends to be the case for stand-alone government primary schools.
For the government sector, the index is based on the occupation, education and income of households in the ABS collection districts that are likely to provide the intakes for primary schools.
Table A6 provides details of the range of SES indices in each of the categories used to report data by SES.
In this report, the SES index based on postcode used to draw the sample has been described as ‘SES by postcode’. It has not been used in any analyses of data except those required to report on the method by which the sample was drawn. These are contained in this Appendix.
All other references to SES classifications of schools in this study refer to the DEST index for classifying non-government schools for funding purposes and, for the government sector, the method based on the occupation, education and income of households in proximity to the schools.
Data analysis
The results from the surveys were coded and entered into three databases: the first for characteristics of participating schools, the second for characteristics of
participating teachers and the third for characteristics of the students with disabilities. In the case of selected variables, data were merged from one database to another. The school database contained 160 cases and 208 variables. The teacher database contained 361 cases and 329 variables. The students with disabilities database contained 432 cases and 17 variables.
The analysis was completed using the Statistical Package for the Social Sciences (SPSS). Most tables contain means and standard deviations, although minimum and maximum scores have also been included when the range is of interest.
Tests of statistical significance were conducted for key comparisons. These tests indicated whether the differences in the sample were of sufficient magnitude to infer a difference in the population of primary schools from which the sample was drawn.
The number of cases varied depending on the particular analysis. Although 160 schools participated in the study, in a few cases it was not possible to acquire accurate responses for all variables. One of the most difficult areas of the school survey was the section on school finances. As explained in this report, many principals do not have access to all the school costs and in some systems the financial records do not record all the income for each school. Where it was not possible to obtain the data or reconcile the information provided by the school or central officers, the database entry for that variable was coded as ‘missing’.
121

122
1. Angus & Olney, 2001.
2. The Study into the Resourcing of Australian Primary Schools was funded in 2001 by the Commonwealth Department of Education, Science and Training after an approach by the Australian Primary Principals Association to the Commonwealth Minister for Education. The study was divided into two stages. The aim of the first stage was to explain when and how the disparity in funding between primary and secondary schools first emerged and the extent to which it had continued. The aim of the second stage of the study was to investigate whether Australian primary schools had sufficient resources to achieve the National Goals for Schooling.
3. These figures are derived from the statistical appendix to the National Report on Schooling (Ministerial Council on Education, Employment, Training and Youth Affairs, 2005a, pp. 23 and 28) and are based on the recurrent expenditure per student figures for primary and secondary schooling.
4. Angus et al., 2002.
5. Burke & Spaull, 2001.
6. Of the 2,452 government school principals who responded to the survey in 2001, 91 per cent expected that in the future their schools would have increasing numbers of students experiencing social problems.
7. Cohen, Raudenbush & Ball (2003) contend that much of the previous research on the effect of school resources on student learning has suffered from a reliance on crude conceptions of ‘resources’. They argue that it is not surprising that, of themselves, resources defined simply in terms of funding, school facilities or teacher qualifications appear to have only a weak or inconsistent impact on learning. Their full impact will only be realised when teachers and students know how to use them effectively.
8. The Chief Inspector of the NSW Department of Education, Mr James Dawson, observed in 1905 ‘But if they learn less they understand more and so the old mental torture and stultification of the child mind is avoided under the new methods’. Quoted in Cole (1927, p.35).
9. This thinking was not confined to New South Wales. Cole’s observations noted above are almost identical to a passage in the 1904 Preface to Syllabus of Instruction of the Queensland Department of Public Instruction (Queensland Department of Education, 1978).
10. NSW Department of Education, 1977; Education Department of Tasmania, 1980.
11. Vaughan, 1977.
12. Stipek, 2006.
13. Ministerial Council on Education, Employment, Training and Youth Affairs, 1999.
14. Education Department of Victoria, 1970.
15. Angus & Olney, 2001.
16. Education Department of Western Australia, 1962.
17. Connell, 1993.
18. Watt, 2000.
19. Fisher & Berliner, 1985.
20. McRae & Braithwaite, 1932.
21. New South Wales Department of Education, 1961.
22. Education Department of Western Australia, 1962.
23. Dow, 2003.
24. Ministerial Council on Education, Employment, Training and Youth Affairs, 2005c.
25. Australian Primary Principals Association, 2002.
26. McRae & Braithwaite, 1932.
27. New South Wales Department of Education, 1961.
28. Education Department of Western Australia, 1962.
29. Queensland Department of Education, 1978.
30. McRae & Braithwaite, 1932.
31. New South Wales Department of Education, 1961.
32. Queensland Department of Education, 1978.
33. Curriculum Corporation, 2003.
34. Education Department of South Australia, 1984.
35. Karmel, 1985.
36. Galton & Fogelman,1998.
37. Eltis, 2003.
38. This finding was corroborated by an early study by Hill et al., 1998.
39. In the 2007-2008 budget, the Commonwealth announced funding to the value of $700 for parents whose children in Years 3, 5 and 7 did not meet the national benchmarks for literacy or numeracy.
40. Chamberlain et al., 2006; Bodilly & Beckett, 2005.
41. Simola, 2005.
42. Donnelly, 2005.
43. The National Science Assessment for Years 6 and 10 was conducted for the first time in 2003 and reported in 2005. The National Civics and Citizenship Assessment for Years 6 and 10 was conducted in 2004 and reported in 2006. The National Information and Communications Technology Assessment for Years 6 and 10 was undertaken in 2005.
Notes
123

44. Masters & Forster, 1996, p. 9.
45. Wilson, 1999.
46. New South Wales Department of Education and Training, 2006.
47. Australian Primary Principals Association, 2006.
48. Cohen, Raudenbush & Ball, 2003.
49. Reading Recovery was developed in New Zealand during the 1970s by Marie Clay and has been implemented in many countries. See Clay, 1993.
50. Eltis, 2003, p.41.
51. Schemo, 2007. Tougher standards urged for Federal education laws. www.nytimes.com/2007/02/14/education/14child.html?ref=education). 14 February 2007. Similar results were found in a re-analysis of Tennessee test data by Grissmer et al., 2000, and Grissmer and Flanagan, 2006.
52. Goldstein, 2004.
53. Brooks & Tough, 2006.
54. Brooks & Tough, 2006.
55. Bosman, 2007.
56. Fessenden, 2007.
57. Blair, 2007.
58. Rupp & Lesaux, 2006.
59. Hanushek et al., 2001; Thrupp, 1999.
60. Stanley et al., 2005.
61. Angus et al., 2004.
62. The figures are derived from a database supplied by DEST for the purposes of this project. They show the percentage of school- age students eligible for funding under the Commonwealth’s Strategic Assistance for Increasing Student Outcomes (SAISO) program. Access requires a demonstration of eligibility under a State education department disability program.
63. Sawyer et al., 2002.
64. Burstall, 1978.
65. Steering Committee for the Review of Government Service Provision, 2007.
66. Australian Bureau of Statistics, 2006.
67. Angus et al., 2002.
68. Stanley et al., 2005; Duncan & Magnuson, 2005.
69. Mayer, 1997.
70. Vinson, 2007.
71. Hart & Risely, 1995.
72. Vinson, 2007; Moriarty, 1998.
73. Australian Bureau of Statistics, 2006.
74. Stecher & Bohrnstedt, 2002.
75. Ministerial Council on Education, Employment, Training and Youth Affairs, 2005a.
76. Department of Education, Science and Training, Financial assistance granted to each State in respect of 2005 under section 138 of the Schools Assistance (Learning Together - Achievement Through Choice and Opportunity) Act 2004. Actual per capita payments by DEST to non-government schools in 2005 were reported in response to a Question on Notice to the Senate Employment, Workplace Relations and Education Committee in May 2007. The file with the relevant data is e854-07.pdf and can be found at www.aph.gov.au/Senate/committee/eet/estimates_0607/dest/index.htm.
77. A useful recent summary of practices is found in Holmes-Smith (2006). In South Australia, data are collected at the individual student level (whether the student’s parent[s] hold a means-tested Commonwealth Health Card). In New South Wales, SES is based on a survey of households, from which are calculated percentages of sole parents, Indigenous students, parent educational qualifications, unemployment, hours in paid work, pensioners and occupations in each school’s community. In Queensland, the Disadvantaged Schools Index is based on Australian Bureau of Statistics SEIFA data aggregated up to the school level.
78. Ministerial Council on Education, Employment, Training and Youth Affairs, 2005a.
79. Angus & Olney, 2001.
80. Victorian Department of Education and Training, 2007.
81. Commonwealth Bureau of Census and Statistics, 1908.
82. Kelly et al., 2002.
83. These costs were correlated closely with the ratio of students to staff members: for example, 2.8 students for each staff member in an education support school, compared with 21.9 students for each staff member in a primary school.
84. The researchers also describe differences among recurrent per capita costs in administrative districts. The lowest per capita costs were in Mandurah, a fast-growing outer-metropolitan district, and in the regional centre of Kalgoorlie. These are relatively larger schools and the economies of scale and, in the case of Kalgoorlie, the lower salaries are explained by the employment of less-experienced staff members. The difference between average per capita costs for primary schools in the most and least costly regional centre was $1,427.
85. NSW Public Education Council, 2005, p.30.
86. Ministerial Council on Education, Employment, Training and Youth Affairs, 2005b.
124
87. Ministerial Council on Education, Employment, Training and Youth Affairs, 2006.
88. Vinson, 2002, p.18.
89. Groundwater-Smith & Kemmis, 2004.
90. See www.dest.gov.au/sectors/school_education/programmes_funding/general_funding/operating_grants/general_recurrent grants/default.htm#SES_Funding_Arrangements. The payments to individual schools are listed at https://schools.dest.gov.au/ssp/help/html/ses/documents/funding2003-2008.pdf.
91. Ministerial Council on Education, Employment, Training and Youth Affairs, 2005a.
92. Alexander & Wall, 2006.
93. Imazeki, 2006.
94. Sonstelie, 2006.
95. Lamb et al., 2004. A study of Victorian government schools that investigated the relationship between the various components of funding and Year 5 academic achievement. It was found that locally raised funds and rurality and isolation funding had a significant impact and were the major contributors to explaining variations in achievement. SES funding had an almost negligible impact.
96. Ministerial Council on Education, Employment, Training and Youth Affairs, 2005b.
97. See, for example, Odden & Picus, 2004; Ladd et al., 1999; Ladd & Hansen, 1999; Burtless, 1996.
98. Murnane & Levy, 1996.
125

126

Burke, G. & Spaull, S. (2001). Australian schools: participation and funding 1901 to 2000. In Australian Bureau of Statistics, Year Book Australia 2001. No. 83, Catalogue No. 1301. Canberra: Government Printer.
Burstall, C. (1978). The Matthew effect in the classroom. Educational Research, 21(1), 19-25.
Burtless, G. (ed.)(1996). Does money matter? The effect of school resources on student achievement and adult success. Washington, DC: Brookings Institution.
Chamberlain, T., Lewis, K. Teeman, D. & Kendall, L. (2006). What is happening on extended schools? Slough, UK: NFER.
Clay, M. (1993). Reading recovery: a guidebook for teachers in training. Auckland: Heinemann.
Cohen, D., Raudenbush, S. & Ball, D. (2003). Resources, instruction and research. Educational Evaluation and Policy Analysis, 25(2), 119-142.
Cole, P. R. (1927). New South Wales. In G. S. Browne (ed.). Education in Australia: a comparative study of the six Australian states. London: Macmillan.
Commonwealth Bureau of Census and Statistics (1908). Official yearbook of the Commonwealth of Australia, No. 1. Melbourne: McCarron, Bird & Co.
Commonwealth Schools Commission (1984). Commonwealth standards for Australian schools. Canberra: the Commission.
Connell, W.F. (1993). Reshaping Australia’s education 1960-1985. Melbourne: Australian Council for Educational Research.
Cooney, G. (2006). Review of statewide assessments in the context of national developments. Sydney: NSW Department of Education and Training.
Curriculum Corporation (2003). Curriculum provision in the Australian States and Territories. Research report for the Ministerial Council on Education, Employment, Training and Youth Affairs. Melbourne: Curriculum Corporation.
Department of Education, Science and Training (2006). General recurrent grants to non-government, non-systemic and systemic schools. Commonwealth of Australia Gazette, 7, 18 October.
Department of Education, Training and Youth Affairs (Steering Committee for the SES Simulation Project)(1998). Schools funding: SES simulation project report. Canberra: the Department.
Donnelly, K. (2005). Benchmarking Australian primary school curricula. Canberra: Department of Education, Science and Training.
References
Alexander, K & Wall, A. (2006). Adequate funding of education programs for at-risk children: an econometric application of research-based cost differentials. Journal of Education Finance, 31 (3), 297-319.
Angus, M. & Olney, H. (2001). Our future: report of a survey of Australian government primary school principals. Sunbury, Victoria: Australian Primary Principals Association.
Angus, M., Olney, H., Selleck, R., Ainley, J., Burke, G., Caldwell, B. & Spinks, J. (2002). Resourcing Australian primary schools: a historical perspective. Canberra: Department of Education, Science and Training.
Angus, M., Olney, H., Selleck, R., Ainley, J., Burke, G., Caldwell, B. & Spinks, J. (2004). The sufficiency of resources for Australian primary schools. Canberra: Department of Education, Science and Training.
Australian Primary Principals Association (2002). The place of languages other than English in the primary school: perspectives of Australian primary principals. (www.appa.asn.au).
Australian Primary Principals Association (2006). Reporting to parents – we know what parents and principals want. 2 February. (www.appa.asn.au/reports/?IntCatId=18).
Australian Bureau of Statistics (2006). Schools, Australia. Catalogue 4221.0. Canberra: the Bureau.
Australian Bureau of Statistics (2004). Census of population and housing: socioeconomic indexes for areas (SEIFA), Australia, 2001. Catalogue 2039.0.55.001. Canberra: the Bureau.
Australian Education Council (1989). Hobart declaration on schooling. Melbourne: Curriculum Corporation.
Blair, A. (2007). Targeting creating ‘results factories’. Times Online, 5 February. (www.timesonline.co.uk/tol/news/uk/education/article1728865.ece).
Bodilly, S. J. & Beckett, M. K. (2005). Making out-of-school-time matter: evidence for an action agenda. Santa Monica, CA: Rand.
Bosman. J. (2007). New York City expands test program in schools. New York Times Electronic Edition. 31 May. (www.nytimes.com/2007/05//31/education/31schools.html).
Brooks, R. & Tough, S. (2006). Assessment and testing: making space for teaching and learning. London: Institute for Public Policy Research.
127

Dow, K.L. (Chair) (2003). Australia’s teachers, Australia’s future: advancing innovation, science, technology and mathematics. Main report. Canberra: Department of Education, Science and Training.
Duncan, W. & Yinger, J. (1999). Performance standards and educational cost indexes: you can’t have one without the other. In H. Ladd, R. Chalk & J. Hansen (eds). Equity and adequacy in education finance: issues and perspectives. Washington, DC: National Academy Press, 260-297.
Duncan, G. J. & Magnuson, K. A. (2005). Can family socio-economic resources account for racial and ethnic test score gaps? The Future of Children, 15(1), 35-54.
Education Department of South Australia (1981). Into the 80s: our schools and their purposes. Adelaide: The Department.
Education Department of South Australia (1984). Time allocation and the curriculum. Our schools and their purposes resource papers. Adelaide: the Department.
Education Department of Victoria (1970). The primary school. Melbourne: the Department.
Education Department of Tasmania (1980). Primary education in Tasmania: report of the Committee on Primary Education (COPE). Hobart: the Department.
Education Department of Western Australia (1962). Introductory booklet to the curriculum for primary schools. Perth: the Department.
Elkind, D. (2001). The hurried child: growing up too fast too soon. 3rd edition. Cambridge, MA: De Capo Press.
Eltis, K. (2003). Time to teach – time to learn: report on the evaluation of outcomes assessment and reporting in NSW government schools. Sydney: NSW Department of Education and Training.
Fessenden, F. (2007). ‘Middle school syndrome’ undergoes a reversal. New York Times Electronic Edition. 29 May. (www.nytimes.com/2007/05/27/nyregion/nyregionspecial2/27mainwe.html?ex=1181275200&en=0aa3ba13e1bd).
Fisher, C. & Berliner, D. (1985). Perspectives on instructional time. New York: Longmans.
Galton, M. & Fogelman, K. (1998). The use of discretionary time in the primary school. Research Papers in Education, 13(2), 119-139.
Gandara, P., Rumberger, R., Maxwell-Jolly, J. & Callahan, R. (2003), October 7. English learners in California schools: unequal resources, unequal outcomes. Education Policy Analysis Archives, 11(36).(epaa.asu.edu/v11n36/). Accessed 15 October 2006.
Goldstein, H. (2004). Education for all: the globalization of learning targets. Comparative Education, 40(1), 7-14.
Grissmer, D. W., Flanagan, A. E., Kawata, J. H. & Williamson, S. (2000). Improving student achievement: what state NAEP scores tell us. Santa Monica, CA: RAND.
Grissmer, D. & Flanagan, A. (2006). Improving the achievement of Tennessee students: analysis of the National Assessment of Educational Progress. Santa Monica, CA: RAND.
Groundwater-Smith, S. & Kemmis, S. (2004). Knowing makes the difference: learnings from the NSW Priority Action Schools Program. Sydney: NSW Department of Education and Training.
Hanushek, E., Kain, J., Markman, J. & Rivkin, S. (2001). Does peer ability affect student achievement? NBER Working Paper 8502. Cambridge, MA: National Bureau of Economic Research.
Hart, B. & Risely, T. (1995). Meaningful differences. Baltimore: Paul H. Brookes.
Hill, P.W., Hurworth, R. & Rowe, K. J. (1998). The place of literacy and numeracy in the primary school curriculum: a national survey. Canberra: Department of Education, Training and Youth Affairs.
Holmes-Smith, P. (2006). School socio-economic density and its effect on school performance. Sydney: NSW Department of Education and Training.
Imazeki, J. (2006). Assessing the costs of K-12 education in California public schools. (irepp.stanford.edu/projects/cafinance-studies.htm).
Karmel, P. (Chair)(1985). Quality of education in Australia. Canberra: Australian Government Publishing Service.
Kelly, R., Mulvey, C. & Smart, D. (2002). Western Australian state government funding of non-government schools. Perth: Centre for Labour Market Research, University of Western Australia.
Ladd, H. & Hansen, J. (1999). Making money matter: financing America’s schools. Washington, DC: National Academy Press.
Ladd, H., Chalk, R. & Hansen, J. (eds)(1999). Equity and adequacy in education finance: issues and perspectives. Washington, DC: National Academy Press.
Lamb, S., Rumberger, R., Jesson, D. & Teese, R. (2004). School performance in Australia: results from analyses of school effectiveness. Melbourne: Centre for Post-compulsory Education and Lifelong Learning, University of Melbourne.
128
Levacic, R., Jenkins, A., Vignoles, A., Steele, F. & Allen, R. (2005). Estimating the relationship between school resources and pupil attainment at Key Stage 3. Research Report RR679. London: Department for Education and Skills.
Masters, G. & Forster, M. (1996). Developmental assessment. Melbourne: Australian Council for Educational Research.
Mayer, S. (1997). What money can’t buy: family income and children’s life chances. Cambridge, MA: Harvard University Press.
McRae, C. R. & Braithwaite, J.M. (1932). Questions of time and order. In P.R. Cole (ed.). The primary curriculum in Australia. Melbourne: Melbourne University Press, 188-216.
Ministerial Council on Education, Employment, Training and Youth Affairs (1999). National goals for schooling in the twenty-first century. Melbourne: Curriculum Corporation.
Ministerial Council on Education, Employment, Training and Youth Affairs (2005a). National report on schooling in Australia, 2005, appendix 1, statistical annex. (cms.curriculum.edu.au/anr2005/pdfs/2005_stats.pdf).
Ministerial Council on Education, Employment, Training and Youth Affairs, Schools Resourcing Taskforce (2005b). Resourcing the national goals for schooling. (www.mceetya.edu.auverve/_resources/Resourcing_the_National_Goals_May_05.pdf).
Ministerial Council on Education, Employment, Training and Youth Affairs (2005c). National statement for languages education in Australian schools: national plan for languages education in Australian schools 2005-2008. Adelaide: Department of Education and Children’s Services.
Ministerial Council on Education, Employment, Training and Youth Affairs Schools Resourcing Taskforce (2006). Discussion paper: funding for English as a second language new arrival students. (www.myceetya.edu.au/mceetya/default.asp?id=16413).
Moriarty, P. (1998). Inequality in Australian cities. Urban Policy and Research, 16(3), 211-218.
Murnane, R. & Levy, F. (1996). Evidence from fifteen schools in Austin, Texas. In G. Burtless (ed.), Does money matter? The effect of school resources on student achievement and adult success. Washington, DC: Brookings Institution, 93-96.
New South Wales Department of Education (1961). Curriculum for primary schools. Sydney: the Department.
New South Wales Department of Education (1977). Aims of primary education in New South Wales. Sydney: the Department.
New South Wales Department of Education and Training (2006). Consistent teacher judgement: key messages of reporting. (www.curriculumsupport.educaton.nsw.gov.au/consistent_teacher/reporting.htm).
New South Wales Public Education Council (2005). Building strong foundations. Sydney: the Council.
Odden, A. & Picus, L. (2004). School finance: a policy perspective. 4th edition. New York: McGraw-Hill.
Organisation for Economic Co-operation and Development (2003). Learning for tomorrow’s world – first results from PISA 2003. Paris: OECD.
Pascoe, R., Leong, S., MacCallum, J., Marsh, K., Smith, B., Church, T. & Winterton, A. (2005). National review of music education: augmenting the diminished. Canberra: Department of Education, Science and Training.
Queensland Department of Public Instruction (1904). Preface to syllabus of instruction, schedule x1v. Brisbane: Government Printer.
Queensland Department of Education (1978). Appropriate emphasis between basic and other activities in primary education. A background paper prepared for the Parliamentary Select Committee on Education in Queensland. Brisbane: the Department.
Rothstein, R. (2002). Out of balance: our understanding of how schools affect society and how society affects school. Spencer Foundation 30th anniversary conference. Chicago: the Foundation.
Rupp, A. A. & Lesaux, N. K. (2006). Meeting expectations? An empirical investigation of a standards-based assessment of reading comprehension. Educational Evaluation and Policy Analysis, 28(4), 315-333.
Sawyer, M., Arney, F., Baghurst, P., Clark, J., Graetz, B., Kosky, R. et al. (2002). The mental health of young people in Australia. Canberra: Commonwealth Department of Health and Aged Care.
Schemo, J. (2007). Tougher standards urged for Federal education laws. New York Times Electronic Edition. 14 February. (www.nytimes.com/2007/02/14/education/14child.html?ref=education).
Simola, H. (2005). The Finnish miracle of PISA: historical and sociological remarks on teaching and teacher education. Comparative Education, 41(4), 455-470.
Sonstelie, J. (2007). Aligning school finance with academic standards: a weighted-student formula based on a survey of practitioners. San Francisco, CA: Public Policy Institute of California.
Stanley, F., Richardson, S. & Prior, M. (2005). Children of the lucky country? How Australian society has turned its back on children and why children matter. Sydney: Macmillan.
129
Stecher, B. M. & Bohrnstedt, G. W. (eds)(2002). Class size reduction in California: findings from 1999-00 and 2000-01. Sacramento, CA: California Department of Education.
Steering Committee for the Review of Government Service Provision (2007). Report on government services. Canberra: Productivity Commission.
Stipek, D. (2006). No Child Left Behind comes to preschool. Elementary School Journal, 106 (5), 455-465.
Thomson, S. & Fleming, N. (2004). Summing it up: mathematics achievement in Australian schools in TIMSS 2002. Melbourne: Australian Council for Educational Research.
Thomson, S. & Fleming, N. (2004). Examining the evidence: science achievement in Australian schools in TIMSS 2002. Melbourne: Australian Council for Educational Research.
Thrupp. M. (1999). Schools making a difference: let’s be realistic!: school mix, school effectiveness and the social limits of reform. Buckingham, UK: Open University Press.
Vaughan, W. F. (1977). Foreword. A supplement to the aims of primary education in New South Wales. Sydney: NSW Department of Education.
Victorian Department of Education and Training (2007). Guide to the indicative student resource package. (www.sofweb.vic.edu.au/SRP/). Accessed 19 March 2007.
Vinson, A. (2002). Inquiry into the provision of public education in New South Wales (3 vols). Sydney: NSW Teachers Federation and NSW Federation of P & C Associations.
Vinson, A. (2007). Dropping off the edge: mapping the distribution of disadvantage in Australia. Richmond, Victoria: Jesuit Social Services.
Watt, M. G. (2000.) The national education agenda, 1996-2000: its impact on curriculum reform in the states and territories. Curriculum Perspectives, 20 (3), 37-47.
Wilson, M. (1999). Measurement of developmental levels. In G. N. Masters & J. P. Keeves (eds). Advances in measurement in educational research and assessment. Amsterdam: Pergamon,151-163.
130

blank