Embed Size (px)
Citation preview

in the australian transport and logistics industries
June 2013
Centre for the Economics of Educat ion and Tra iningFaculty of Educat ion, Monash Univers i t y

TLISCThe Transport and Logistics Industry Skills Council Ltd (TLISC) is an independent, government funded, not-for-profit organisation that works on behalf of the Transport and Logistics Industry to promote investment in skills and workforce development.
TLISC is chartered with driving the skills and workforce development agenda across the entire Transport and Logistics industry which encompasses activities in road transport, warehousing, rail, aviation, maritime, logistics and ports.
CEETCEET is the only centre for the economics of education and training in Australia. CEET focuses on the contribution of education and training to economic and social development, undertaking research training, consultancies and dissemination of the economics and finance of education and training. It has extensive experience and expertise in: the finance and economics of education and training; analysis of large data sets; policy development; supply and demand analysis; and working with government authorities in Australia and overseas.
Report prepared for TLISC by Michael Long & Chandra Shah, CEET

CONTENTSExecutive summary 1
Tables and figures 51
References 52
2Productivity 9
4 International 27comparisons
3Productivity 15growth in Australia
Introduction 3
13.1 Output 23
3.2 Hours of work 24
3.3 Capital services 25
3.4 Productivity growth 25
5 Industry 33comparisons
5.1 The TLISC and 35 the transport industry
5.2 The transport & 41 Industry, productivity and productivity growth
5.3 Transport, 47 productivity and productivity growth in other countries
Executive summary
Robert Adams
Chief Executive Officer
While policy-makers grapple with the dynamics of an australian economy in transition, there is unanimous agreement that increased productivity is a key factor in supporting the country’s future prosperity. the transport and logistics industry skills council (tlisc) recently commissioned Monash university’s centre for economics, education and training (ceet) to undertake an assessment of the productivity climate specifically in the transport and logistics industry.
the research report provides tlisc with a window into the current trends in productivity growth and assists in the targeting of training needs to meet future demand.Although productivity figures have been on the decline over the past 15 years, Transport and Logistics sectors are still out-performing other industries and are experiencing above average growth rates.
A great sign for the industry is its above-average gross value added hourly rate of $69. This means an hour’s work in the Transport and Logistics industry is 6.1 per cent more productive than the average hourly rate of the Australian economy at $65.
Assessing productivity has its challenges, as for many countries and industries productivity growth is cyclical. Hence different economies can be at different stages of the productivity cycle, making specific comparisons difficult.
Taking this into account, Australia’s Transport and Logistics industry has been a strong performer. Between 1983 and 2007, productivity growth in the Transport and Logistics sectors was generally higher than productivity growth in the whole economy for most countries for most periods.
When measuring productivity growth there are a number of factors that influence economic growth. Innovations in technology or technique and their diffusion and adoption are perhaps the most commonly perceived source of productivity growth. But it is important not to overlook other areas that offer real measures of improved productivity, like the quality of the workforce.
A more skilled workforce in many circumstances can produce more than a less skilled workforce allowing for the costs of training and possibly higher salaries.
Although it is clear our economy is in a state of transition, there is a bright future for the Transport and Logistics industry. As the economy shifts away from manufacturing towards service industries, the investment Transport and Logistics has placed in up-skilling its workforce will put the industry in a strong position to take full advantage of Australia’s ever-changing economy.

2
2.1% per yeartransport and logistics labour
productivity growth over the
last 25 years.
Key points
The Australian economy
® Growth in productivity of all types has declined recently to historically low and sometimes negative levels over about 15 years.
® Improvements in education and training play an important role in productivity, productivity growth and hence economic growth.
® Levels of absolute total factor productivity are comparable with the USA, Canada, Western Europe and Japan—productivity and productivity growth are not the same as international competitiveness.
® Labour productivity growth ranks a little below the middle of a group of 35 mostly OECD countries and has fallen only very slightly compared with other countries over the last two decades. The small relative decline in Australia’s labour productivity growth is partly because labour productivity growth has also declined in many other countries.
® Multifactor labour productivity growth is at the lower end of a group of 15 mostly OECD countries and has fallen compared with other countries over the last decade. Growth in multifactor productivity has also declined internationally over the last decade.
The Australian Transport & Industry
® While the TLISC training packages focus on jobs in the Transport Industry, the correspondence between TLISC-relevant occupations and the Transport, Postal and Warehousing industry category is only approximate.
® An hour’s work produced about $69 in gross value added in 2011, which places the industry just above the average for the Australian economy ($64 per hour).
® Over the last 25 years or so,
- labour productivity has grown only slightly slower than in the market economy (2.1 per cent compared with 2.3 per cent per year). Labour productivity growth has been slowing in recent productivity cycles—0.4 per cent per year in the most recent productivity cycle is the lowest of the five cycles from the mid-1980s.
- capital productivity growth has declined less in the Transport & Logistics industry than in the market economy overall.
- multifactor productivity has grown faster than in the overall market economy—1.2 per cent compared with 0.9 per cent per year. Nevertheless, absolute and relative multifactor productivity growth have declined sharply during the current productivity cycle, falling to minus 1.1 per cent per year, well below the long-term average of plus 1.2 per cent.
® Productivity changes contributed only slightly to the national decline in market MFP growth in the second half of the 2000s.
® Between 1983 and 2007 average productivity growth has been lower than the average productivity growth in the Transport & Logistics industries of a number of mostly OECD countries for which data were available.
eXecutiVe suMMarY


this report provides transport and logistics industry skills council (tlisc) with a discussion on various aspects of productivity growth in the transport and logistics industry in australia.

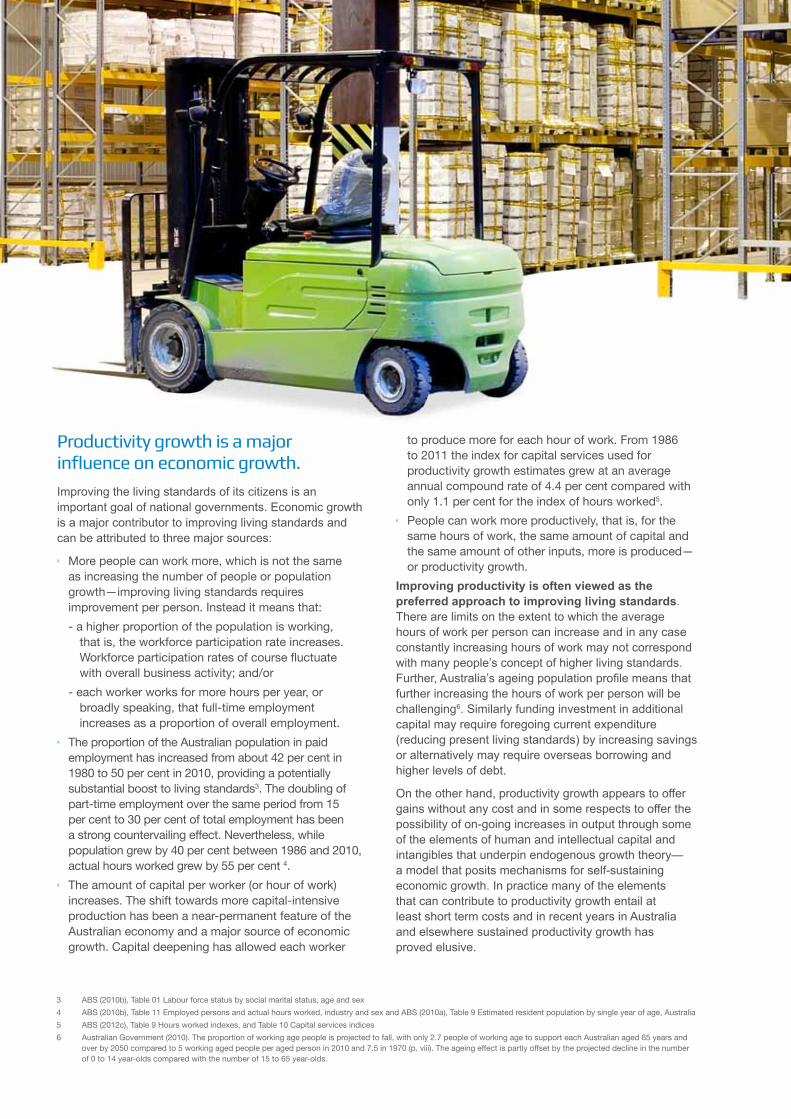
Productivity, productivity growth and the Transport & Logistics industryTLISC training packages focus on jobs in the Transport & Logistics industry, but the correspondence between TLISC occupations and the transport industry is less than perfect. Similarly, the training for some jobs in the transport industry is within the scope of other Industry Skills Councils (ISCs). Hence estimates of productivity and productivity growth for the ABS ANZSIC industry category of Transport, Postal and Warehousing have only an approximate correspondence to the scope of the TLISC.
An hour’s work in the Transport, Postal and Warehousing industry produced about $69 in gross value added in 2011, which places the industry just above the average for the Australian economy ($64 per hour). Over the last 25 years or so, in this industry:
® Gross value added has grown at about the same rate as the overall market economy—but over the last decade has grown more quickly.
® Hours of work have grown more than for the market economy overall, especially during the last decade.
® Productive capital has grown more slowly than the overall market economy, but again the recent rate of increase has been higher, increasing from 3.7 per cent, 2.4 per cent and 2.2 per cent per year for the first three productivity cycles to 1998-99 and then approximately doubling to 4.1 per cent, 6.3 per cent and 4.8 per cent for the more recent cycles to be close to the average for the market economy.
® Labour productivity has grown only slightly slower than in the market economy (2.1 per cent compared with 2.3 per cent per year). Labour productivity growth has been slowing in recent productivity cycles-0.4 per cent per year in the most recent productivity cycle is the lowest of the five cycles from the mid-1980s.
® Capital productivity growth has declined less than in the market economy. Only Agriculture and Finance, with growth of 2.8 per cent and 0.7 per cent per year respectively, had better performance in growth of capital productivity.
® Multifactor productivity has grown faster than in the overall market economy-1.2 per cent compared with 0.9 per cent per year. Nevertheless, absolute and relative MFP growth has declined sharply during the current productivity cycle, falling to minus 1.1 per cent per year, well below the long-term average of plus 1.2 per cent.
® Contributed only slightly to the overall decline in market MFP growth in the second half of the 2000s.
Despite the overall negative trend, some industries continue to improve their rate of MFP growth and/or experience positive growth—Agriculture, Retail, Rental, Hiring and Real Estate industry—while others are at least stable—Construction and Information Technology.
Comparing the productivity growth of Transport, Postal and Warehousing industries in Australia with the same sector in other countries is difficult. Countries have different mixes of modes of transport—road, rail, sea and air—which in turn reflect their different geographies, population distributions and densities and trade patterns, as well as the relative importance of Transport and Storage for the overall economy.
Between 1983 and 2007, in this industry:
® Average productivity growth was generally higher than productivity growth in the whole economy for most countries for most periods.
® Average productivity growth in Australia has been lower than in other mostly OECD countries for which data were available.
The paper is based on the Australian Bureau of Statistics (ABS) National Accounts collection, the associated publications and estimates of productivity growth and especially the estimates of industry productivity growth (ABS 2012b; 2012c). Other data sources, such as the OECD and KLEMS collections, also ultimately rely on information about Australia supplied by the ABS.
The paper begins with a brief discussion of the concept of productivity and productivity growth, before examining growth in output, inputs and productivity in Australia and productivity and productivity growth in other countries. It then examines the relationship between the scope of TLISC and the Transport, Postal and Warehousing industry division—the ABS industry category that most closely relates to the scope of TLISC and for which separate productivity growth estimates are available. The report then examines estimates of productivity and productivity growth in the Transport & Logistics industry in Australia and in other countries.

6
Productivity and Productivity growth in the australian transPort and logistics industries
What is productivity?Productivity is the relationship between real physical inputs and real physical output. Productivity increases if more outputs can be produced using the same physical inputs. Most of the discussion about productivity is about changes in productivity over time or productivity growth. It is less commonly about absolute levels of productivity.
Productivity growth is more often discussed in the context of whole economies or industries within economies. For firms, it should not be confused with profitability—the reward of productivity growth for firms can be simply survival.
Several types of productivity growth are commonly identified, including:
® labour productivity ® capital productivity ® multifactor productivity-gross value added (MFPgva) ® total factor productivity (TFP).
Measured productivity growth is the residual or what is left over after changes in inputs (labour, capital, and whatever else) have been used to explain changes in output. For instance, if labour and capital inputs both increase by 10 per cent but output increases by 12 per cent, then the difference is considered increase in productivity, assuming no other inputs have changed.
Influences on productivity growth include:
® innovations in technology or technique and their diffusion and adoption
® changes in the quality of the workforce ® changes in workforce strategies—policies designed
to motivate, better deploy and retain staff ® the availability of finance ® capacity utilisation ® economies of scale ® natural events ® government regulations—too little, too much or the
wrong type ® incentives for innovation ® social stability.
Disentangling the individual contributions to productivity growth of these various influences is difficult.
Productivity growth is cyclical—hence comparisons of productivity growth should be made between averages across productivity cycles and caveats should be placed on comparisons across industries and particularly countries. Estimates of productivity growth can vary substantially from year to year and therefore it is important not to emphasise an estimate for a single year.
PrOduCTIvITy aNd PrOduCTIvITy grOwTh IN ThE auSTraLIaN TraNSPOrT aNd LOgISTICS INduSTrIES
1 | introduction

Productivity growth in AustraliaIn Australia, productivity growth of all types has declined in recent years to historically low and sometimes negative levels and has been a cause of concern. The Australian economy, however, has continued to grow and growth of output has outpaced population growth.
There is only modest agreement about the causes of the decline in productivity growth. Some of the causes include:
® a natural decline from the high levels of growth during the 1990s
® the restructuring of the Australian economy: ® the long-term shift of production in advanced economies
such as Australia away from manufacturing and towards service industries
® disruptive economy-wide changes in the allocation of capital and labour associated with the record terms of trade
® the effect of particular industries, especially the decline in productivity growth in the mining industry
® shortages of suitably skilled labour ® inadequate (often transport-related) infrastructure ® lower levels of research and development and technical
innovation and adoption ® a slowdown in microeconomic reform.
The 2011-12 National Accounts contains indications that labour productivity growth (as measured by gross value added per hour of work) may have returned to levels not seen since 2004 and comparable with levels prevailing in the mid and late 1990s. The more detailed estimates used in this report were available only until 2010–11 and hence these indications, despite being for only one year, are a major caveat on some of the results and commentary presented here.
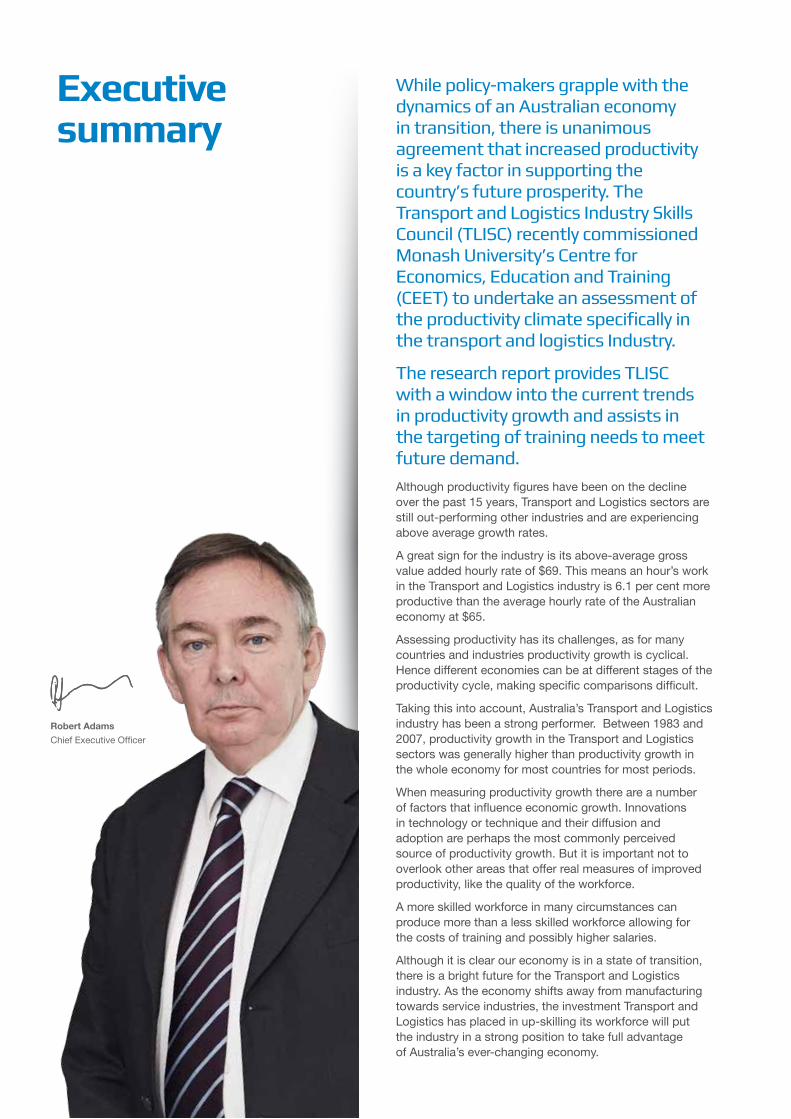
Productivity growth is a major influence on economic growth, along with:
® more people working more, including:
- a higher proportion of the population in the workforce
- each worker working more hours per year ® increases in the amount of capital per worker
(or hour of work) increases.
The contribution of productivity growth to output growth has been declining over the last decade and a half. The decline in the growth of multifactor productivity has had a substantial impact on output (and on living standards). High levels of investment and increasing the capital labour ratio have been important drivers of economic growth and improving living standards in Australia. The value of the productive capacity of capital, or capital services, has been increasing at a faster rate than labour (5.2 per cent compared with 1.5 per cent) over the period 1995 to 2011.
While population grew at an average of 1.3 per cent per annum from 1995, hours of work grew slightly more quickly at an average rate of 1.5 per cent. This reflects shifts in the age profile, increased workforce participation and the rise of part-time employment. Quality adjusted hours of work (2.0 per cent per year) has grown more strongly than unadjusted hours (1.5 per cent) since 1995, reflecting higher levels of investment in education.
Improvements in education and training play an important role in economic growth. Direct measures of the number of hours worked do not recognise changes in the skills composition of the workforce—an hour’s work from a brain surgeon is treated as equal to an hour’s work from a cleaner. The effect of skilling the workforce on growth in output is between 0.2 per cent and 0.3 per cent over the last two decades. If this positive effect is removed, the remaining component of multifactor productivity growth is smaller or more likely to be negative.
The very high terms of trade (the relative prices of exports and imports) over the last decade have contributed substantially to higher living standards quite apart from any growth in output—by one estimate, these changes were sufficient to lift national income by 12 per cent to 15 per cent beyond what it would otherwise have been. Productivity growth will become that much more important when other influences on living standards become less benign.

8
Productivity and Productivity growth in the australian transPort and logistics industries
International comparisonsIt is often difficult to make meaningful international comparisons of economic and other activities because of institutional and cultural differences between countries. Comparisons of productivity and productivity growth among countries are confounded by differences in prices as well as differences in the mixes of production and consumption among countries and differences in quality.
Australia has total factor productivity levels comparable with the USA, Canada, Western Europe and Japan. In terms of absolute productivity (not necessarily productivity growth), there is a close grouping of the USA, Canada, Western Europe, Japan and Oceania (dominated by Australia), with other parts of the world having substantially lower levels of productivity.
Just as for individual firms there is a substantial difference between productivity and profitability, productivity and international competitiveness are not the same for all countries.
Australia’s labour productivity growth ranks a little below the middle of a group of 35 mostly OECD countries and has fallen only very slightly compared with other countries over the last two decades. The small relative decline in Australia’s labour productivity growth is partly because labour productivity growth has declined in many other countries.
Australia’s multifactor labour productivity growth is at the lower end of a group of 15 mostly OECD countries and has fallen compared with other countries over the last decade. Over the last decade, growth in MFP has declined internationally.
1 | introduction
productiVitY and productiVitY groWth in the australian transport and logistics industries


Productivity and Productivity growth in the australian transPort and logistics industriesPrOduCTIvITy aNd PrOduCTIvITy grOwTh IN ThE auSTraLIaN TraNSPOrT aNd LOgISTICS INduSTrIES
productivity is the relationship between real physical inputs and real physical output. to the extent that more outputs can be produced using the same physical inputs, productivity is higher. The idea is closely related to notions of efficiency, using the same or fewer resources to produce more output.

Examples of changes in the Transport and Logistics industries that have improved productivity include:
® better fuel efficiency of cars, trucks, aircraft and ships
® containerisation of cargo which has reduced the time ships spend in port
® more rapid movement of containers between storage and transport or between modes of transport
® computerised tracking of deliveries, better communications between delivery vehicles and despatchers.
It is possible to calculate the savings associated with these and other innovations, compare them with the costs and determine whether goods and services can be (or have been) delivered at a lower cost. These calculations become more difficult when the estimates of productivity growth are for the whole economy or for many changes in a particular industry and prices change over time. Despite the emphasis on real physical inputs and outputs, many aggregate estimates of productivity require calculations that measure input and outputs in monetary terms as the only basis on which the different physical inputs and outputs can be equated.
2Productivity
Productivity (and efficiency) is more easily understood at the level of individual economic activities within particular firms and sometimes industries.

12
Productivity and Productivity growth in the australian transPort and logistics industries
1 The trends for value-added and gross output multifactor productivity are mostly similar. Although it is arguable that gross output measures are technically superior, industry-level value-added MFP measures are more closely aligned with, and easier to calculate from, national accounts. And, for the moment at least, estimates of MFPVA for a given year are available nearly 12 months earlier than the corresponding MFPGO estimates.
MFP becomes TFP. Some ABS estimates of MFP also remove the effect of changes in the quality of labour—its education and experience. The scope of aggregate productivity growth estimates can also range from the whole economy, to the market economy and to particular industries.
The elements that contribute to the ABS industry measures of productivity growth are based on data drawn from the ABS’s statistical survey program as well as government administrative collections—mostly the same as those that underpin the construction of the National Accounts, although industry estimates variously draw on additional ABS collections.
Labour productivity and (the less frequently used) capital productivity are partial measures of productivity growth that link changes to output to only one factor of production—labour or capital. For instance, labour productivity can increase due to either increases in the capital services used per hour of labour (capital deepening) or real improvements
These values are converted to constant basic prices using price indexes that correct for shifts in relative prices over time and these, in turn, generate indexes that attempt to measure volumes of inputs and outputs rather than their value. These considerations gradually move the meaning of productivity away from the concrete experience of producing goods and services to more abstract aggregates that seem unrelated to particular changes or innovation.
Most of the discussion about productivity is about changes in productivity over time or productivity growth. It is less commonly about absolute levels of productivity. Changes in productivity over time are relative changes and their discussion need not necessarily relate to absolute levels of productivity. If it were observed, for instance, that Transport, Postal and Warehousing in Australia had a higher rate of productivity growth than, say Mining, this says nothing about absolute levels of productivity in the two industries.
Productivity growth is not the same as growth in profitability. In a market economy, an early adopter of an efficient innovation might generate some short-term gain in profitability—and in some cases these short term advantages might be leveraged into market dominance and improved profitability, especially with the protection of patents and copyright. In general, however, the benefit to an organisation from adopting more efficient or productive practices is survival. In the absence of barriers to competition, an organisation that does not adopt more productive techniques will go out of business as they cannot compete against other organisations that do adopt them.
Economists routinely distinguish several types of productivity growth. The ABS’s Experimental estimates of multifactor productivity are for four of the more commonly used measures:
® labour productivity (LP)—the gross value added (GVA) (the difference between value of outputs and the value of inputs) per unit of labour (measured as total hours worked)
® capital productivity (CP)—the GVA per unit of capital (measured by capital services, which reflects the economic capacity of the capital stock of an industry or the economy)
® multifactor productivity-gross value added (MFPgva)—the GVA per unit of an index that combines the labour and capital indexes using their respective income shares
® multifactor productivity-gross output (MFPgo)—a measure similar to MFPgva, but in which the algebraic combination of the terms is different.
For brevity, this report focuses on only the first three1. Other sources refer to total factor productivity (TFP) where changes in output are related to changes in other factors as well as labour and capital. It is not always clear how many additional factors are required before
2 | productiVitY
Productivity growth is not the same as growth in profitability.

in the efficiency of labour. It is a widely used measure of productivity, partly because it is closely related to changes in living standards. Increases in labour productivity, given constant workforce participation and some other caveats discussed earlier, usually translates into increased GDP per capita.
Multifactor productivity measures the output relative to the inputs of both capital and labour. It is therefore a more complete measure than labour productivity and more closely related to economic growth. MFPgva can be expressed as (GO-I)/KL where (GO-I) is Outputs (O) minus Intermediate Inputs (I) or Gross Value Added (GVA) and KL is a combined measure of Capital and Labour inputs.
Productivity growth is a black box. Productivity growth is the residual—it is what is left over after changes in inputs (labour, capital, and whatever else) have been used to explain changes in output. For example, if labour and capital inputs both increase by 10 per cent but output increases by say 12 per cent, the difference between the expected increase in output (10 per cent) and the actual increase in output (12 per cent) is attributed to an improvement in productivity. In this sense, productivity is not measured directly.
Because productivity is a residual, or left over, term, it includes any errors in the measurement of changes in labour, capital and any other input. For instance, if labour and capital inputs are perfectly measured and perfectly explain changes in output, then productivity growth is zero. If, however, labour and capital inputs are not perfectly measured, then estimated productivity growth is no longer zero. And the complexity of measuring changes in output and labour and capital inputs means that there is almost certainly some measurement error.
The black box of productivity growth includes a large number of possible influences on economic growth. Innovations in technology or technique and their diffusion and adoption are perhaps the most commonly perceived source of productivity growth. Other possible sources of
productivity growth include:
® The quality of the workforce—a more skilled workforce in many circumstances can produce more than a less skilled workforce allowing for the costs of training and possibly higher salaries. Similarly a healthier population and workforce can be more productive.
® Workforce strategies—policies designed to motivate, better deploy and retain staff and can improve productivity.
® The availability of finance for investment—finance availability can be influenced by the savings ratio in the economy and the expected profitability of investment. It influences the rate at which innovations can be adopted and obsolete processes and equipment replaced.
® Capacity utilisation—if plant can be used for three shifts a day instead of two, the same semi-fixed capital and land can be used to produce more output. On the other hand, if shortages emerge due to productive resources being fully employed, productivity can also be negatively affected.
® Economies of scale—applying the same production processes and approaches can often be more effectively implemented on a larger scale if there are any fixed or partially fixed costs.
® Natural events—fires, floods, hurricanes and droughts can reduce output given the same relative inputs of labour, capital and intermediate goods. The effect is not restricted to agriculture. In recent years, output from the mining industry, for instance, has been severely affected by floods. Most inputs, however, need to be maintained. Productivity in the road, rail and possibly to a lesser extent, flight and shipping transport industries has been affected as infrastructure has been destroyed by flood and hurricanes.
® Government regulation—too little, too much or the wrong type of regulation can reduce productivity.
® Incentives for innovation—the level of competition in markets, patent and copyright protection, tax rates, and so on.
Labour Productivity
Capital Productivity
Multifactor Productivity

14
Productivity and Productivity growth in the australian transPort and logistics industries
DISEnTAngLIng ThE ConTRIbuTIonS of ThE MAny InfLuEnCES on PRoDuCTIvITy gRowTh IS DIffICuLTEconomists usually struggle to allocate output growth to three or four sources—changes in capital, changes in labour and changes in the quality of labour. Identifying the effects of narrower influences on productivity growth is challenging.
PRoDuCTIvITy gRowTh IS CyCLICALSome of these influences on productivity growth are related to the business cycle—economies of scale, capacity utilisation and shortages, savings ratios, for instance. Productivity growth itself can be cyclical, which makes estimating trends in productivity growth difficult. Hence the recommendation that comparison of productivity growth is made between averages across productivity cycles. If making comparisons of productivity growth over time within a country is difficult, making comparisons between industries or at a point in time between countries is even more fraught—countries may well be at different stages of their productivity cycle.
yEAR-on-yEAR ESTIMATES of PRoDuCTIvITy gRowTh ARE voLATILEGraphs of productivity growth over time often show considerable variation from year-to-year—trends in productivity growth are a long way from smooth and consistent. As with much economic data, it is common to average values across several years to provide a more stable picture of changes in productivity and it would be unadvisable to attach too much importance to a single estimate.
® Social stability—war, crime, corruption and other
forms of social disruption can reduce productivity. For
instance, to the extent that, say, Qantas directly pays
for additional security in response to terrorism threats,
its productivity is reduced because it costs more to fly
a person from A to B.
The considerable number of influences on productivity
is a feature that should reduce volatility—as an average
of all these effects, productivity growth should be
protected from undue volatility. While some of these
influences are very volatile—weather effects, for
instance—others are more dependent on institutional
and legal frameworks that are mostly little changed
from year-to year. The level of volatility of estimates of
productivity change may be a little surprising.
It is also important to distinguish between the more
systematic or planned influences on productivity
and productivity growth that have a once-off effect
and those that are more sustainable or on-going. For
instance, creating greater flexibility in labour relations,
zoning regulations and removing red tape might reduce
costs and stimulate productivity on a once-off basis.
It has been argued, for instance, that this was the
basis for the surge in productivity growth experienced
in Australia during the 1990s. Regulating for an open
competitive market economy in which it pays to
innovate (or to rapidly adopt innovations) and costs
not to innovate, however, is more likely to produce
on-going, sustainable innovation and productivity
growth (Ahn 2002). Similarly, it is argued that lifting the
level of human capital, mostly through higher levels of
education and training, can contribute to sustainable
economic growth through its effect on innovation.


16
productivity growth in australia has declined recently to historically low and sometimes negative levels.

The key features are:
® productivity growth of all types has been declining in australia over the last 15 years—MFpgva averaged 1.4 per cent, 0.7 per cent and -0.6 per cent for the five year periods 1997 -2001, 2002-2006 and 2007-2011 respectively.
® growth for multifactor productivity lies between the growth of labour and capital productivity.
® growth in labour productivity has been higher than growth in capital productivity throughout the period, a feature that is associated with capital deepening —relatively more capital than labour is being employed in the production process.
® growth in capital productivity has been negative throughout most of the last decade. this does not mean that it is not profitable to invest. Profitability (and expected profitability) of investment are reflected in the relatively high levels of investment.
® growth in multifactor productivity has been negative for much of the last decade. the additional resources used in production (more hours worked, more capital) have not produced the same level of increase in output. it undermines economic growth.
Productivity growth in australia
3 Figure 1 and table 1 show the annual growth in three types of productivity in australia for the years 1996 to 2011.

18
Based on data from ABS (2012c; 2012b). Table 15. Gross output based MFP indexes and ABS, Australian system of national accounts, 5204.0, Table 13, Productivity in the market sector. MFPgva is gross value added multifactor productivity.
Table 1 Annual productivity growth in the market economy, Australia, 1995-2011 (%)
Based on data from ABS (2012b), Table 13. MFPgva is gross value added multifactor productivity. Years are years ending in June. Values in columns with headings such as ‘96/’97 are the average of the values for 1996 and 1997.
year ending June
'96/'97 '98/'99 '00/'01 '02/'03 '04/'05 '06/'07 2008 2009 2010 2011 Mean
Labour 3.3 4.0 1.7 3.0 1.8 1.4 1.2 0.6 2.7 -0.3 2.1
Capital -0.1 0.2 -2.2 -0.4 -1.7 -2.7 -3.0 -4.9 -2.2 -2.5 -1.5
MFPgva 1.9 2.4 0.0 1.6 0.3 -0.4 -0.6 -1.9 0.4 -1.3 0.5
6
4
2
0
-2
-4
-6
‘96 ‘97 ‘98 ‘99 ‘00 ‘01 ‘02 ‘03 ‘04 ‘05 ‘06 ‘07 ‘08 ‘09 ‘10 ‘11
yEAR
Ann
ual p
rod
ucti
vity
gro
wth
(%)
figure 1 Annual productivity growth in the market economy, Australia, 1995-2011 (%)
Labour
Capital
MFPgva
3 | productiVitY groWth in australia

‘96 ‘98 ‘00 ‘02 ‘04 ‘06 ‘08 ‘12
the recent decline in the rate of productivity growth has been a cause of concern. For instance, the 2010 inquiry, Raising the Level of Productivity Growth in the Australian Economy, by the House of Representatives Standing Committee recommended that:
Achieving MFP growth rates above Australia’s long-term average of 1.1 per cent is a critical long-term national goal. The committee supports the adoption of a national productivity growth target for the market-sector. This will ensure productivity remains a key consideration in relevant policy development. (House of Representatives Standing Committee on Economics 2010, p. ix).
Even returning to trend levels appears challenging in the context of an average annual decline in MFP of 0.6 per cent per year over the five years 2007-11. Given a desire to improve productivity growth, identifying the causes of the poor performance is an important precursor to formulating a policy response.
There is only modest agreement about the causes of the decline in productivity, which is possibly a reflection of the sometimes equivocal evidence and the political implications. Several of the proposed explanations suggest the decline in the rate of productivity growth should not elicit as much concern as it has:
® Reversion to the mean. Productivity growth during the 1990s was at record levels. Hence it might be expected that productivity growth should decline from these levels. Related explanations raise issues of comparison and measurement including the influence of the business cycle—for instance, fluctuations in aggregate demand leaving fixed capital (trucks, rolling stock, planes, ships, docks) under-utilised—or failing to
take into account quality improvements. While these influences may be important, it is unlikely that they could explain more than a small part of the decline.
® The restructuring of the Australian economy. At least two forms of restructuring are identified:
- The long-term shift of production in advanced economies such as Australia away from manufacturing and towards service industries is sometimes assumed to provide a brake on productivity growth because some service industries are labour intensive with little apparent scope for improved methods of service delivery2. Some service industries, however, have shown reasonable productivity growth and in any case the rapid recent substantial decline in productivity exceeds anything that could be explained by the secular and somewhat glacial shift towards the service industries.
- The recent mining-related changes in Australia’s terms of trade, however, are substantial. The change in the relative prices for goods and services in the Australian economy has resulted in economy-wide changes in the allocation of capital and labour. Parham (2012) suggests that ‘a large part (perhaps between a half and three quarters) of the productivity growth slump (between the 1999-04 and 2004-08 business cycles) stemmed from adjustment pressures. These pressures have had negative effects on productivity growth that reflect an economy in transition to a new level of productivity.’ In particular, Parham points to the substantial growth in inputs in the Australian economy—from the point of view of productivity, the decline in MFP is a situation characterised by substantial growth in inputs without a commensurate increase in outputs.
® The effect of particular industries. It has been suggested that the decline in productivity is not an economy-wide phenomenon, but results from
figure 2 Annual changes in gross value added per paid hour of work in the market economy, Australia, 1995-96 to 2011-12 (%)
Based on data from ABS (2012a), Table 1. Key National Accounts Aggregates. Series ID A3606050F.
4.5
3.4
4.3
3.1
3.84.1
% g
row
th in
gvA
per
ho
ur
-0.30.2
2 The argument is sometimes known as Baumoi’s ‘cost disease’ (Baumoi 1967)’.

20
Productivity and Productivity growth in the australian transPort and logistics industries
‘96 ‘98 ‘00 ‘02 ‘04 ‘06 ‘08 ‘12 -0.7
(positive or negative) changes in only a few industries (mining and agriculture are frequently mentioned). These industry-level changes are associated with particular and unique causes that can be addressed by government, if at all, by targeted responses. Eslake and Walsh (2011), for instance, concluded that exclusion of particular industries from aggregate estimates made little difference to the decline in labour productivity.
® A shortage of suitably skilled labour, especially in the context of new mining developments in remote areas, although the shortages in these projects have flowed through to other industries. This explanation is related to explanations that relate to particular industries and economy-wide dislocation resulting from the expansion of the mining industry. The long-term policy response has been a raft of changes to schools through the Educational Revolution and policies to improve participation in VET and higher education and eventually to raise the qualifications and skills profile of the workforce. Changes to the level and nature of immigration programs have also attempted to address skill shortages.
® Inadequate (often transport-related) infrastructure. Perhaps the iconic illustration of infrastructure bottlenecks has been the picture of bulk carriers queued at Dalrymple Bay and Newcastle waiting to load because of inadequate port facilities. The adequacy of infrastructure applies more generally to road, rail and air transport—the costs of delays can be substantial. In the context of additional funding, part of the government response has been the creation of Infrastructure Australia to provide advice on the planning, funding and implementation of Australia’s future infrastructure needs.
® Lower research and development, as technological innovation in the early part of this century was
less rapid than it had been in the 1990s when the information and communication technologies were being implemented and having a significant impact.
® A slowdown in microeconomic reform, particularly once the competition payments that were being made to State governments for implementing reforms in line with the National Competition Policy ended in 2006.
Productivity may have improved in 2011-12. Economic activity is a constantly changing story and the narrative reflects the status of the currently published statistics. The estimates of industry productivity growth and of the particular types of productivity growth are, at the time of writing, available up to the financial year 2010-11. The first summaries of economic activity for the financial year 2011-12 are provided by the ABS in their National Accounts. Understandably it takes more time to publish detailed analyses such as productivity growth estimates.
There are, however, indications in some parts of the 2011-12 National Accounts that labour productivity growth (as measured by gross value added per hour of work) improved in 2011-12. The estimates in Figure 1 and Table 1 only go up to 2010-11. Figure 2, on the other hand, includes estimates for 2011-12 and highlights the strength of the apparent improvement—labour productivity growth appears to have returned to levels not seen since 2004 and comparable with levels prevailing in the mid and late 1990s. The values in Figure 2 bear directly on labour productivity, but there must be some expectation that this increase will also be reflected in estimates of changes in multi-factor productivity growth. Although earlier comments in this report drew attention to the dangers of attaching too much importance to estimates for single years, the apparent turnaround is impressive and is an important caveat on commentary in the rest of this report.
3.7
1.0
2.2 2.1
0.00.1
1.5
4.6
3 | productiVitY groWth in australia
productivity growth is a major influence on economic growth. Improving the living standards of its citizens is an important goal of national governments. Economic growth is a major contributor to improving living standards and can be attributed to three major sources:
® More people can work more, which is not the same as increasing the number of people or population growth—improving living standards requires improvement per person. Instead it means that:
- a higher proportion of the population is working, that is, the workforce participation rate increases. Workforce participation rates of course fluctuate with overall business activity; and/or
- each worker works for more hours per year, or broadly speaking, that full-time employment increases as a proportion of overall employment.
® The proportion of the Australian population in paid employment has increased from about 42 per cent in 1980 to 50 per cent in 2010, providing a potentially substantial boost to living standards3. The doubling of part-time employment over the same period from 15 per cent to 30 per cent of total employment has been a strong countervailing effect. Nevertheless, while population grew by 40 per cent between 1986 and 2010, actual hours worked grew by 55 per cent 4.
® The amount of capital per worker (or hour of work) increases. The shift towards more capital-intensive production has been a near-permanent feature of the Australian economy and a major source of economic growth. Capital deepening has allowed each worker
to produce more for each hour of work. From 1986 to 2011 the index for capital services used for productivity growth estimates grew at an average annual compound rate of 4.4 per cent compared with only 1.1 per cent for the index of hours worked5.
® People can work more productively, that is, for the same hours of work, the same amount of capital and the same amount of other inputs, more is produced—or productivity growth.
Improving productivity is often viewed as the preferred approach to improving living standards. There are limits on the extent to which the average hours of work per person can increase and in any case constantly increasing hours of work may not correspond with many people’s concept of higher living standards. Further, Australia’s ageing population profile means that further increasing the hours of work per person will be challenging6. Similarly funding investment in additional capital may require foregoing current expenditure (reducing present living standards) by increasing savings or alternatively may require overseas borrowing and higher levels of debt.
On the other hand, productivity growth appears to offer gains without any cost and in some respects to offer the possibility of on-going increases in output through some of the elements of human and intellectual capital and intangibles that underpin endogenous growth theory— a model that posits mechanisms for self-sustaining economic growth. In practice many of the elements that can contribute to productivity growth entail at least short term costs and in recent years in Australia and elsewhere sustained productivity growth has proved elusive.
3 ABS (2010b), Table 01 Labour force status by social marital status, age and sex
4 ABS (2010b), Table 11 Employed persons and actual hours worked, industry and sex and ABS (2010a), Table 9 Estimated resident population by single year of age, Australia
5 ABS (2012c), Table 9 Hours worked indexes, and Table 10 Capital services indices
6 Australian Government (2010). The proportion of working age people is projected to fall, with only 2.7 people of working age to support each Australian aged 65 years and over by 2050 compared to 5 working aged people per aged person in 2010 and 7.5 in 1970 (p. viii). The ageing effect is partly offset by the projected decline in the number of 0 to 14 year-olds compared with the number of 15 to 65 year-olds.

22
Productivity and Productivity growth in the australian transPort and logistics industries
The link between living standards and productivity is less direct than it may appear. Productivity growth is mostly concerned with changes in the physical volumes of goods or services independent of prices. Changes in living standards, however, can result from changes in relative prices. Higher prices of exports compared with imports (the terms of trade) can lead to increases in National Income for constant output. Improvement in the terms of trade has been an important feature of the Australian economy from about 2000 onwards and is associated with increases in China’s demand for minerals, metals and gas and petroleum.
The importance of the size of the recent change in the terms of trade should not be underestimated simply because of repetition— in the second half of the 20th century the terms of trade index averaged in the mid-60s, peaking in the low 80s in the early 1970s. Between 1999 and 2011 the index more than doubled from 60 to 129—high relative prices for Australian (mostly iron ore and coal) exports that are more than sufficient to generate considerable structural change in the Australian economy. And by one estimate at least, sufficient to lift national income by 12 per cent to 15 per cent beyond what it would otherwise have been (Stevens 2010). While declining productivity need not necessarily lead to declining living standards if there are sufficiently strong countervailing forces (more labour, more capital, better terms of trade), it still results in living standards that are lower than they would otherwise be if productivity growth was sustained—and productivity growth becomes that much more important when other influences on living standards become less benign.
The close link between measures of productivity and GDP means discussion of productivity growth is sometimes open to the broader criticisms of GDP as a measure of economic growth—that it is part of an accounting system that fails to include some (particularly environmental and social) benefits and costs (OECD 2005). For instance,
domestic labour (childcare, cooking) is transformed from being un-valued to valued when it enters the market economy as (mostly) women move from being unpaid domestic labour to paid labour and often consumers of domestic services. GDP growth generated by increased levels of employment and hours of work can be at the expense of voluntary work, family formation and leisure. While increases in participation in employment have limits, some aspects of productivity growth are sustainable and perhaps even self-sustaining.
Productivity growth is about measuring changes in the quantity of output. Changes in quality of that output may not be adequately captured in estimates of productivity growth, which may lead to underestimating productivity growth. These kinds of reservations mean estimates of productivity growth should not be taken at face value—as with many other measures, they are indicative rather than definitive.
Growth accounting based on the national accounts can be used to show the relative contributions to aggregate growth in output of improvements in productivity and increases in the amount of capital and the hours worked in the economy. Gross value added (GVA) is a measure of the value of output of production. It is the difference between the dollar amount of goods and services that have been produced, less the dollar cost of all intermediate (non-labour and non-capital) goods and services that were used in the production process7. Its calculation is restricted to the market sector of the economy where there are market-based prices for goods and services. GVA is closely related to the more widely used measure of Gross Domestic Product (GDP), but is expressed in terms of basic prices rather than purchaser prices, that is, it excludes taxes and subsidies in the prices of goods and services. Hence GVA seeks to measure value in terms more relevant to producers’ decision-making about inputs and outputs.
50%of the Australian population in paid employment in 2010 has increased from about 42 per cent in 1980.
55%of actual work hours grew in between 1986 and 2010 while population grew by 40 per cent.
7 More formally, value added is the weighted difference between growth in basic price gross output and intermediate inputs, with the current price shares of value added and intermediate inputs in gross output as weights.

Table 2 Sources of annual output growth, Australia 1995-96 to 2010-11(%)
Based on ABS (2012b), Table 13 Productivity in the market sector. GVA is gross value added, Capital is capital services, Labour hours is hours of paid work, Hours adj are hours of labour adjusted for labour composition, Labour comp. is labour composition (hours adjusted for labour quality), MFPgva (inc) is gross value added multifactor productivity including any labour composition effects, MFPgva (ex) is gross value added multifactor productivity excluding any labour composition effects. The cumulative contribution of Capital, labour and MFPgva do not sum to the cumulative growth in GVA because they have different bases. Years are years ending in June. Values for 16 market-based industries. Population values are adapted from ABS (2010a), Table 4 Estimated resident population, states and territories (number).
year ending June 1996 1998 2000 2002 2004 2006 2007 2008 2009 2010 2011 1995-11 pa
Output and population growth (%)GVA 4.7 5.0 4.2 3.9 4.7 3.2 4.1 4.3 0.7 2.4 2.4 75.9 3.6
Population 1.3 1.0 1.2 1.2 1.2 1.5 1.5 1.8 1.8 1.3 1.3 23.5 1.3
growth of inputs (%)
4.3 5.3 4.6 3.4 5.6 6.6 6.3 7.6 5.9 4.6 5.0 124.8 5.2
Labour hours 1.4 1.7 4.0 -0.9 1.5 1.5 3.1 3.1 0.1 -0.3 2.7 26.3 1.5
Hours adj. 2.3 2.3 4.6 -0.5 3.5 1.9 3.6 3.4 0.5 0.1 3.1 36.6 2.0
Cap/Lab ratio 3.4 3.8 0.3 3.7 4.0 5.4 2.5 4.2 5.0 5.7 2.7 170.0 3.6
Components of gvA growth (%)
Capital 1.8 2.2 1.9 1.4 2.4 2.8 2.7 3.2 2.5 2.1 2.2 --- 2.2
Labour hours 0.8 1.0 2.3 -0.5 0.9 0.9 1.7 1.7 0.1 -0.2 1.5 --- 0.9
MFPgva (inc) 2.0 1.8 -0.1 3.1 1.4 -0.4 -0.4 -0.6 -1.9 0.4 -1.3 --- 0.5
Components of gvA growth with adjustments for labour composition (%)
Capital 1.8 2.2 1.9 1.4 2.4 2.8 2.7 3.2 2.5 2.1 2.2 --- 2.2
Labour hours 0.8 1.0 2.3 -0.5 0.9 0.9 1.7 1.7 0.1 -0.2 1.5 --- 0.9
Labour comp. 0.4 0.3 0.3 0.3 0.3 0.2 0.2 0.2 0.2 0.2 0.2 --- 0.3
MFPgva (ex) 1.5 1.4 -0.4 2.8 1.2 -0.7 -0.6 -0.8 -2.1 0.2 -1.5 --- 0.3
Income share (%)Capital 0.42 0.41 0.41 0.42 0.42 0.43 0.43 0.43 0.44 0.46 0.46 --- 0.43Labour 0.58 0.59 0.59 0.58 0.58 0.57 0.57 0.57 0.56 0.54 0.54 --- 0.57
3.1 OutputThe Australian economy continues to grow. Table 2 shows growth in output as measured by GVA from the Australian economy from 1995 to 2011. Over that period growth in output averaged about 3.6 per cent per year. It has fluctuated with quite low growth in 2000-01 (2.0 per cent) and 2008-09 (0.7 per cent, corresponding to a mild economic downturn and the trough of the global financial crisis (GFC) respectively. Output growth was particularly strong during the second half of the 1990s as the economy recovered from a challenging period in the early 1990s, but was also strong in the two years preceding the GFC. Growth in output has been subdued since the GFC and has been well below the average for the period and about half the growth rate experienced during stronger years. The very strong terms of trade since the GFC have partly offset the slower rate of growth in output.
output growth has outpaced population growth. Output growth needs to be considered in the context of population growth, because it is output per person that
ultimately influences living standards. Growth in output has been consistently higher than population growth over the period, even when very high rates of net overseas migration and higher birth rates in the mid and late 2000s contributed to population growth rates that were historically quite high. The only exception was during the onset of the GFC when the rate of population growth (1.8 per cent exceeded output growth (0.7 per cent). Comparisons of growth in output between countries also need to take into account differences in population growth, especially when a country such as Australia, which has a reasonably high rate of population growth, is compared with European countries, many of which have stable or declining populations.
Capital has been growing faster than labour. Table 2 shows the rate of change for three sources of output growth:
® hours of work ® capital services ® multifactor productivity

24
Productivity and Productivity growth in the australian transPort and logistics industries
8 ABS (2010b), Table 01 Labour force status by social marital status, age and sex
9 ABS (2010b), Table 11 Employed persons and actual hours worked, industry and sex and ABS (2010a), Table 9 Estimated resident population by single year of age, Australia
3.2 Hours of workAll else equal, the more hours people work, the greater the output. Additional hours of work can be generated by population growth, higher workforce participation and each working person working more hours (or, put differently, more people in full-time work).
The proportion of the Australian population in paid employment has increased from about 42 per cent in 1980 to 50 per cent in 2010, providing a potentially substantial boost to living standards8. The doubling of part-time employment over the same period from 15 per cent to 30 per cent of total employment has been a strong countervailing effect. Nevertheless, while population grew by 40 per cent between 1986 and 2010, actual hours worked grew by 55 per cent 9.
while population grew at an average of 1.3 per cent per annum from 1995, hours of work grew slightly more quickly at an average rate of 1.5 per cent (Table 2). As might be expected, changes in hours of work
vary with the business cycle, albeit with a slight lag, declining in 2002 and 2010 as unemployment increased, which, together with 2009, were the only years in which population growth exceeded growth in hours of paid employment. Hours of paid work recovered strongly in 2011.
Quality adjusted hours of work (2.0 per cent per annum) has grown more strongly than unadjusted hours (1.5 per cent), reflecting the investment in education and, perhaps ironically, the ageing of the workforce. Table 2 also includes measures of hours of work adjusted for labour composition or the quality of the workforce—a measure based on the age profile of the workforce (which is taken to reflect the experience of the workforce) and the education of the workforce (which is measured by the proportion of the workforce with post school qualifications). The quality adjustment is based on the links of education and experience with earnings per hour, which is interpreted as an indicator of worker productivity.
figure 3 Annual growth in gross value added, labour and capital inputs and multifactor productivity in the market economy, Australia, 1995-2011 (%)
See notes to Table 2.
250
225
200
175
150
125
100
75
% g
row
th f
rom
199
5
‘95 97 ‘99 ‘01 ‘03 ‘05 ‘07 ‘09 ‘11
GVA
Popn
Hours
CapServ
MFP
3 | productiVitY groWth in australia

3.3 Capital servicesThe amount of capital (assets such as equipment, etc.) used in production is more challenging to measure than simply counting the hours of paid work. For estimates of productivity the amount of capital is measured by capital services, which is an attempt to gauge the productive efficiency or capacity of the capital stock of the economy. It is similar to the assets of a firm, except on a larger scale. Each year new capital is added to the stock of capital and each previous year’s capital is depreciated. For a firm, however, depreciation initially reduces the value of assets quickly and then more slowly to reflect the economic value of those assets. With capital services, however, the productive capacity is assumed to decline initially only slowly, and then progressively more quickly. As with the capital stock of a firm, estimates of capital services are based on a number of broad categories of asset type, which are assumed to reduce in productive capacity at varying rates.
The value of the productive capacity of capital, or capital services, has been increasing at a faster rate than labour (5.2 per cent compared with 1.5 per cent) over the period 1995-2011 and growth peaked at 3.2per cent per annum in 2008. The more rapid growth of capital services means the ratio of capital to labour has increased, which is shown in Table 2. If each hour of labour is employing more capital services, then, all else equal, labour productivity should be increasing—a situation that typically contributes to improved living standards. On the other hand, each additional amount of capital services is being matched with less labour and hence its productivity might be expected to decline, as in Figure 3.
The annual growth in capital services appears (and is) more stable than growth in labour. On the other hand, new investment is more volatile from year-to-year than suggested by the values in Table 2. Current investment in capital services is only a fraction of total capital services. In this sense, the majority of capital services are fixed—the investment has already been made. Any adjustment to current or expected changes in economic activity can only be made in the current year, by deferring, abandoning or bringing forward investment. Large investment decisions, however, are unlikely to affect only one year and their costs are often time-sensitive. There may be little choice for enterprises other than to proceed regardless of any short-term downturn in economic activity.
Given the fixed nature of a significant proportion of capital services, a decline in economic activity might be expected to reduce the productivity of capital. Instead of running two or three shifts a day, for instance, a decline in demand for the output of a manufacturing plant may mean only one shift operates. The capital services are more or less unchanged, but the gross value added presumably declines.
3.4 Productivity growthThe contribution of productivity growth to output growth has been declining. The growth in output as measured by GVA can be decomposed into the contributions of changes in capital services, hours of paid work and multifactor productivity. It is possible to estimate the extent to which GVA should increase given any measured increases in labour and capital. Any discrepancy is attributed to, or simply labelled, a change in multifactor productivity. Hence measured multifactor productivity growth is a residual in growth accounting—it is what is left over of changes in GVA after any changes in GVA that can be attributed to changes in labour and capital are taken into account.
The first row in Table 2 shows output grew at an average rate of 3.6 per cent per annum between 1995 and 2011. The panel labelled Components of GVA growth breaks this down into three components—on average across the period 2.2 percentage points of this growth was due to increased investment in capital and 0.9 percentage points was due to the increase in hours of paid work. The additional growth in GVA that cannot be explained by the extra capital and labour is 0.5 percentage points. This residual growth in GVA is attributed to changes in the way in which labour and capital are used in the production process and is labelled multifactor productivity (MFP).
high levels of investment and increasing the capital labour ratio have been important drivers of economic growth and improving living standards in Australia. Growth in capital services has accounted for more than half of Australia’s economic growth over the last decade and a half. High levels of employment have also been important, contributing about a quarter of the economic growth during that period (Table 2). Much of the growth in hours of work, however, appears to be associated with population growth and therefore may not contribute substantially to higher living standards. The sustainability of growth associated with ever higher levels of labour force participation and more hours of work per worker is doubtful, particularly in the context of an ageing population profile.
The 0.5 percentage points of GVA growth attributable to productivity growth are more important than it might appear. It is just under 15 per cent of the total growth in GVA. More importantly, MFP is a pure source of improving living standards—it underpins growth in output per person. The contribution of productivity growth to growth in output has declined in recent years. For the four years 1996-99 it averaged 2.1 per cent per year, while for the five years 2006-11 it actually fell by an average of 0.4 per cent per year. Part of this decline may be associated with the business cycle and the global financial crisis—MFP growth was also quite low in 2000 (-0.1 per cent) and 2001 (0.7 per cent), but after a strong rise in 2002 (3.1 per cent), it averaged only -0.1 per cent growth between 2003 and 2008 while the Australian economy was growing quite strongly.

26
Productivity and Productivity growth in the australian transPort and logistics industries
The decline in the growth of multifactor productivity has had a substantial impact on output (and on living standards). From 1999 to 2011 cumulative growth in GVA was 46 per cent. If the growth in MFP had been maintained at 2.1 per cent per year across this period, all else equal, the cumulative growth in GVA would have been 86 per cent—almost twice as high.
The decline in MFP comes in the context of policy concerns about the changing age-profile of the population—the number of people over the age of 65 is increasing as a proportion of the total population Australian Government (2010)10. While this does not necessarily affect estimates of future growth in labour inputs (the 15 to 64 year-old population is still growing), it does influence living standards because proportionately more people who are making no measured contribution to GVA need to be supported from that GVA. Clearly policies to improve MFP growth, in combination with policies designed to increase the proportion in the workforce and the average of hours of employment, are part of the response to this demographic change. Changes to pension and superannuation age eligibility criteria are elements of this strategy.
Improvements in education and training play an important role in economic growth. Over time, national and state governments in Australia have recognised the importance of the skill levels of the workforce to the productivity of the economy. Accordingly they have sought to improve both the level of school attainment—measured variously by years of schooling completed, age at leaving school, and more recently and more directly, by performance on state and national standardised tests—and the level of post school qualifications in the workforce. In recent years, at the national level the Rudd and Gillard Labor governments have introduced policies designed to improve the skills of the workforce, mostly in association with state and territory governments through the Council of Australian Governments (COAG).
10 The ageing effect is partly offset by the projected decline in the number of 0 to 14 year-olds compared with the number of 15 to 65 year-olds.
Direct measures of the number of hours worked do not recognise changes in the skills composition of the workforce. As Reilly, Milne and Zhao (2005) put it, under the assumption of homogenous labour inputs, an hour’s work from a brain surgeon is treated as equal to an hour’s work from a cleaner. The long-term trend towards a more skilled and experienced workforce is reflected in the values for adjusted hours of work and labour composition in Table 2.
If labour is assumed to be all the same, then the shift towards a more skilled workforce is included as part of the estimate of growth in multifactor productivity. If quality-adjusted labour inputs are used instead, then the effect of skilling the workforce on GVA growth can be identified separately from growth in MFP. Table 2 provides these estimates in a separate panel. The contributions to GVA growth of changes in capital services and hours are unchanged, but the original estimates of MFP growth from the first panel are now split into two effects—up-skilling the workforce and MFP growth excluding that up-skilling. The effect on growth in gross value added of skilling the workforce is positive and reasonably uniform across the period—between 0.2 per cent and 0.3 per cent across the period, tending towards 0.2 per cent in recent years. Taking out this positive effect, means that the remaining component of MFP is either smaller or more negative across the period.
These estimates of the impact of a more skilled workforce point to the value of the additional private and public investment in education over the period. Although the percentage point values are small—0.2 per cent to 0.3 per cent—they are based on very large base values—the GVA of the Australian economy. Additionally, under this model at least, the additional skills continue to deliver GVA over many years.
46%was the cumulative growth in GVA from 1999 to 2011.
3 | productiVitY groWth in australia
productiVitY and productiVitY groWth in the australian transport and logistics industries


comparisons of productivity growth over time provide a basis for making judgements about whether a particular country’s productivity growth at a given time is relatively high or low.

International comparisons
4
Comparisons of productivity growth among countries provide another basis for forming judgements about whether a particular country’s productivity growth is relatively high or low and whether recent trends reflect broader global changes or country-specific changes.
International comparisons in this section draw on data from the OECD and result from a recent study of international measurement of total factor productivity growth. Further cross-country comparisons are provided in the next section in the context of a discussion of productivity growth in the Transport & Logistics industry.
It is often difficult to make meaningful international comparisons of economic and other activities because of institutional and cultural differences between countries. Comparisons of productivity and productivity growth among countries are confounded by differences in prices as well as differences in the mixes of production and consumption among countries and differences in quality. Because of their volatility, exchange rates are not particularly useful for converting prices to a common measure. Instead considerable effort goes into producing purchaser parity price (PPP) indexes which correspond more closely to the prices paid for common goods across countries11. Wages corrected for PPP differences can be used as a common indicator of labour productivity across countries.
In a recent paper, Ashenfelter (2012) provides estimates of total factor productivity (TFP) for a number of economic regions relative to the USA. These values are reproduced in Table 3. The first estimates of TFP are derived from a variant of a standard approach based on adjusted output per person (Hall and Jones 1999). The second uses the relative wages of workers at McDonald’s restaurants and the prices of Big Macs to estimate TFP— an alternative calculation of the real wage at purchasing-power parity informed by The Economist’s only somewhat frivolous Big Mac Index. Ashenfelter notes the broad similarities of the two sets of estimates, and attributes the greater discrepancies for Australian and New Zealand (Oceania) and for Western Europe to stronger minimum wage laws in those regions. In other results, Ashenfelter maps movement towards convergence in measures of absolute productivity between developed and developing countries and regions over the last two decades. Some results point to decline in absolute levels of productivity among developed countries.
v
the recent decline in australia’s productivity growth compared with earlier periods in its economic history is one of the bases for current policy concern.
11 The World Bank and OECD produce PPP indexes. The Economist’s Big Mac index is a very narrowly defined version of a PPP index that is based on the price of one standard good across countries.

30
Productivity and Productivity growth in the australian transPort and logistics industries
12 Business Council of Australia (2012), Figure 12, p. 29.
13 See http://mattcowgill.wordpress.com/2012/06/07/productivity-surged-but-were-becoming-a-low-productivity-nation/ 7 June 2012. The BCA report uses data from Turner & Townsend (2012).
Country TfP1 TfP2 Economic region TfP1 TfP2
USA 1.00 1.00 The rest of Asia 0.29 0.14
Canada 0.91 0.93 Eastern Europe 0.33 0.27
Russian Federation 0.37 0.32 Western Europe 1.00 1.29
South Africa 0.26 0.23 Middle East 0.29 0.13
China 0.21 0.11 Latin America 0.36 0.16
India 0.15 0.06 Oceania 0.95 1.50
Japan 0.90 1.01
Table 3 Measures of total factor productivity, selected countries, 2007
Based on Ashenfelter (2012), Table 4, p.37. TFP is total factor productivity. Estimate 1 is based on the Hall-Jones method of estimating output per person adjusted for differences in schooling levels of the work force but not capital/output ratios. Estimate 2 is a measure based on dividing the hourly wages of McDonald’s workers by the price of a Big Mac.
Australia has total factor productivity levels comparable with the uSA, Canada, western Europe, Japan. Focusing on the more orthodox measures of total factor productivity, Table 3 points to a reasonably close grouping of absolute levels of productivity in the USA, Canada, Western Europe, Japan and Oceania (dominated by Australia), with other parts of the world having substantially lower levels of productivity.
This conclusion stands in stark contrast to some commentary on productivity levels In Australia. Some of this commentary appears to confuse changes in productivity (productivity growth) with actual levels of productivity (referred to here as absolute productivity or which might be referred to as base productivity). Until recently, Australia has experienced a decline in productivity growth, but its absolute level of productivity is still comparable with that in most other advanced economies. Poor productivity growth would eventually change this situation.
Other commentary appears to confuse productivity with the more nebulous concept of international competitiveness—or the cost of doing business. For instance, a recent report from the Business Council of Australia focused on the costs of doing business and noted what it referred to as cost premiums in Australia—it reports, for instance, that compared with the USA, in Australia it costs 62 per cent more to build a hospital, 26 per cent more to build a school, 90 per cent more to build an airport, or 43 per cent more to build a shopping centre12. The discussion of these results frequently cites productivity differences as a major contributor.
Just as at the level of individual firms productivity is not the same as profitability, so at the level of countries, productivity is not the same as competitiveness. Commentary on this BCA report notes that the estimates are denominated in US dollars and reflect changes in currency exchange rates. While this may be appropriate for a paper examining incentives for international investment, it has little to do with productivity changes, despite the interpretation.
Using the same source as that cited in the BCA report, and making the comparisons in each country’s own currency, it appears the cost of building all these forms of infrastructure declined in Australia between 2008 and 2011 and in fact declined by as much or more than in the USA13. These values, with some caveats, more closely reflect relative productivity changes in Australia and the USA than the values in the BCA report.
Table 4 draws on OECD data to show labour productivity growth in the total economy averaged across three years for 1990-92, 1999-01 and 2009-11. The averaging removes some of the year-to-year variation in estimates of productivity growth and the values span about two decades. Countries are sorted in descending order by productivity growth, with the values for Australia highlighted.
Australia’s rate of labour productivity growth ranks a little below the middle of a group of 35 countries. For 2009-11 Australia ranked 20th out of the 35 countries for which estimates were available from the OECD. This suggests an average level of labour productivity growth. Although most of the countries in the list are European, Table 4 also includes Australia, Canada, Chile, Israel, New Zealand, Mexico, Japan, Korea and the USA. From Australia’s perspective, there are nevertheless many important omissions—Brazil, India, China, South Africa and a number of South East Asian countries, especially Indonesia. There must be a suspicion that labour productivity in many of these developing countries has been growing more rapidly than in Australia, underpinned by a rural-urban population shift associated with industrialisation.
Compared with the average of Group of 7 countries, growth in labour productivity in Australia was markedly lower in 2009-11 (0.5 per cent compared with 1.4 per cent). Labour productivity growth in the USA (1.7 per cent), often used as a benchmark for productivity growth, was substantially higher than in Australia (0.5 per cent) and Germany (0.3 per cent) was the only major economy with a lower rate of productivity growth than Australia.
4 | international coMparisons

1990-92 % 1999-01 % 2009-11 %
Korea 6.4 Poland 6.5 Korea 4.8
Portugal 5.1 Estonia 5.7 Ireland 3.7
Ireland 4.4 Czech Rep. 5.1 Poland 3.3
Norway 3.5 Korea 4.7 Estonia 2.3
Japan 3.3 Ireland 3.9 Japan 2.3
Germany 3.1 Slovenia 3.2 Chile 2.1
Belgium 2.7 Slovak Rep. 3.1 Portugal 2.0
Turkey 2.5 Greece 3.0 Spain 2.0
Australia 2.5 Hungary 2.9 USA 1.7
UK 2.4 Norway 2.8 Slovak Rep. 1.3
Finland 2.4 Russian Fed. 2.7 Czech Rep. 1.2
Israel 2.3 UK 2.6 Israel 1.2
Luxembourg 2.3 USA 2.6 Sweden 0.9
Denmark 2.2 Chile 2.6 Canada 0.8
USA 2.1 Canada 2.4 Austria 0.8
Spain 1.9 Finland 2.3 Denmark 0.8
France 1.8 Mexico 2.3 France 0.7
Sweden 1.2 Japan 2.3 UK 0.5
Canada 0.9 Australia 2.1 Russian Fed. 0.5
NZ 0.8 Portugal 2.1 Australia 0.5
Netherlands 0.8 Germany 2.0 Switzerland 0.5
Italy 0.8 France 2.0 Turkey 0.4
Greece 0.6 Sweden 2.0 Iceland 0.3
Mexico 0.1 NZ 1.8 Germany 0.3
Iceland -0.7 Austria 1.7 Mexico 0.3
Switzerland -2.2 Israel 1.6 Slovenia 0.2
Austria na Netherlands 1.6 Netherlands 0.2
Chile na Luxembourg 1.5 NZ 0.1
Czech Rep. na Switzerland 1.4 Italy 0.1
Estonia na Italy 1.3 Norway 0.0
Hungary na Belgium 1.1 Finland -0.3
Poland na Iceland 1.1 Belgium -0.4
Slovak Rep. na Denmark 0.8 Hungary -0.5
Slovenia na Spain 0.1 Greece -1.3
Russian Fed. na Turkey -1.6 Luxembourg -2.8
G7 countries 2.3 G7 countries 2.5 G7 countries 1.4
Table 4 Labour productivity growth by selected countries, 1990-92, 1999-01, 2009-11
Adapted from OECD.Stat, Data set: Labour productivity growth in the total economy, data extracted on 13 Oct 2012 03:19 UTC (GMT). Values are for average LP across three years. Countries are sorted from high to low on average LP for each period. Countries selected on the basis of availability of estimates for the three years 2009-11. Values are for the total economy, not the market economy, and hence values for Australia may differ from those elsewhere in this report. G7 countries are Canada, France, Germany, Italy, Japan, UK, and USA.

32
Productivity and Productivity growth in the australian transPort and logistics industries
0.5%was the annual
growth in Australia’s
labour productivity
in 2009–2011.
1.4%was the labour productivity growth in Group of 7 countries in 2009–2011.
1986-88 % 1996-98 % 2006-08 %
Korea 6.4 Ireland 4.5 Korea 3.4
Japan 2.9 Finland 2.9 Austria 2.5
Finland 2.5 Korea 2.8 Germany 1.4
Ireland 2.3 Australia 2.6 Finland 1.4
France 1.5 Sweden 1.6 Switzerland 1.0
Italy 1.5 Austria 1.4 Japan 0.7
NZ 1.1 USA 1.3 USA 0.3
Spain 0.9 Germany 1.1 France 0.2
USA 0.7 France 1.0 Ireland 0.1
Sweden 0.7 Switzerland 1.0 NZ 0.0
Australia 0.5 NZ 0.9 Spain 0.0
Canada -0.3 Canada 0.8 Sweden -0.1
Austria na Japan 0.3 Australia -0.3
Germany na Italy 0.0 Canada -0.3
Switzerland na Spain -0.1 Italy -0.4
Mean 12 countries 1.7 Mean 12 countries 1.6 Mean 12 countries 0.4
Mean 15 countries --- Mean 15 countries 1.5 Mean 15 countries 0.7
Table 5 Multifactor productivity growth by selected countries, 1986-88, 1996-98, 2006-08
Adapted from OECD.Stat, data extracted on 13 Oct 2012 02:15 UTC (GMT). Values are for average MFP across three years. Countries are sorted from high to low on average MFP for each period. Countries selected on the basis of availability of estimates for the three years 2006-08. Values are for the total economy, not the market economy, and hence values for Australia may differ from those elsewhere in the report.
Australia’s labour productivity growth has fallen only very slightly compared with other countries over the last two decades. Visually, Table 4 can be misleading. Australia has an apparently high ranking for 1990-92, but this is mostly because estimates were not available for nine countries. Worse still, many of these countries subsequently had higher rates of productivity growth than Australia. Had estimates been available for these countries in 1990-92, and had their relative productivity growth in 1999-01 prevailed in 1990-92, Australia would have been eight places lower in 1990-92. Nevertheless, there appears to be a trend over time—Australia might have been about 17th out of 35 countries in 1990-92, 19th in 1999-01 and 20th in 2009-11.
An alternative approach to the results in Table 4 would be to consider Australia’s position relative only to those countries for which estimates were available in 1990-92. In that case, Australia’s ranking dropped from 9th, to 11th to 13th across the three periods. These positions are indicated by horizontal lines. Australia’s international ranking has been declining, albeit so slightly that the apparent trend could reflect little more than the choice of years for comparison and the year-to-year variability of estimates.
The small relative decline in Australia’s labour productivity growth is partly because labour productivity growth has declined in many other countries. Annual growth in Australia’s labour productivity declined over time, from 2.5 per cent in 1990-92 to 2.1 per cent in 1999-01 and then quite sharply to 0.5 per cent for 2009-11. Australia’s international ranking, however, did not fall nearly as markedly because labour productivity growth in many other countries also declined. Labour productivity growth in Group of 7 countries, for instance, fell from 2.5 per cent to 1.4 per cent between 1999-01 and 2009-11.
4 | international coMparisons


Productivity and Productivity growth in the australian transPort and logistics industries

v
Industry comparisons
5 5.1 TLISC and the Transport & Logistics industryThis section outlines a little of the nature, scope, structure and purpose of TLISC and how these correspond to the industry-level estimates of productivity growth produced by the ABS. TLISC is one of 11 Industry Skills Councils (ISCs). It, like the other ISCs, is an independent not-for-profit incorporated body funded by the Australian Government to:
® provide information and advice to the Australian Workforce and Productivity Agency, government and enterprises on workforce development and skills needs in their area of industry coverage
® support the development, implementation and improvement of training and workforce development products and services, especially training packages
® engage with state and territory governments, state and territory industry advisory bodies and peak representative bodies in their area of industry coverage to address the skills and workforce development needs of industry.
The purpose of TLISC is to drive the skills and workforce development agenda across the Transport and Logistics industries. It has six industry sectors:
® Logistics and Warehousing ® Road Transport ® Rail ® Maritime ® Aviation ® Ports.
The industry sectors are covered by four training packages:
® Transport and Logistics training ® Rail training ® Maritime training ® Aviation training.
Table 6 shows the distribution of enrolments in the TLISC training packages in 2010. The estimates are drawn from NCVER’s provider collection and cover all public provision and publicly-funded private provision. They exclude privately-funded training by private providers.
Each course in the collection has an occupational category attached to it that indicates the occupational outcome of the education and training. In practice, of course, training is frequently relevant to work a particular narrow occupational category, but nevertheless the values in Table 7 provide a sense of the vocational education and training associated with TLISC. Although there is a broad diversity of occupations ranging from management to labouring occupations, the focus is clearly on courses associated with Storepersons (42.2 per cent of enrolments), Delivery Drivers (29.8 per cent), Deck Hands (10.4 per cent) and Logistics Clerks (5.4 per cent).
It has three parts:
1. A discussion of the correspondence between the Transport, Postal and Warehousing category of the ABS Australian and New Zealand Standard Industry Classification (ANZSIC) and the activities of TLISC— that is, it addresses the question of the extent to which estimates of productivity growth for the Transport, Postal and Warehousing industry correspond to the scope of TLISC.
2. A presentation of estimates of ABS industry-level estimates of growth in output, inputs and productivity growth, with a focus on estimates for Transport, Postal and Warehousing and the market economy.
3. A presentation of some results that, inter alia, bear on the level of absolute labour productivity in Australian industries, but most focus on comparisons of changes in total factor productivity in the International Standard Industry Classification (ISIC) defined Transport and Storage industry.
this section considers the transport & logistics industry more specifically.

36
Productivity and Productivity growth in the australian transPort and logistics industries
Table 6 Enrolments in vET courses by course occupation: TLISC training packages, 2010
Enrolments Enrolments
Course occupation group (ANZSCO) no. % Course occupation group (AnZSCo) no. %
Supply & distribution manager 981 2.0 Railway track plant operator 1 0.0
Transport company manager 1,197 2.5 Automobile, bus & rail drivers, nfd 3 0.0
Aeroplane pilot 134 0.3 Automobile drivers 110 0.2
Air transport professionals, nec 61 0.1 Train & tram drivers 1,036 2.1
Marine transport professionals, nfd 306 0.6 Delivery driver 14,570 29.8
Ship's officer 351 0.7 Storeperson 20,579 42.2
Armoured car escort 2 0.0 Railway track worker 166 0.3
Driving instructor 501 1.0 Freight handler (rail or road) 41 0.1
Travel attendants nec 58 0.1 Waterside worker 28 0.1
Logistics clerks 2,632 5.4 Deck hand 5,084 10.4
Misc. clerical & admin. workers 1 0.0 Railways assistant 29 0.1
Crane, hoist or lift operator 66 0.1 Total 48,811 100.0
Boiler or engine operator 739 1.5
Aircraft baggage handler & airline ground crew 135 0.3
Based on data derived from NCVER’s VOCSTATS. Enrolments in courses in the TLISC, 2010 by course occupation.
Table 7 Selected TLISC occupations by industry, Australia 2006 (%)
Supply & distribution managers
2.3 20.8 2.4 20.4 1.4 36.5 1.4 1.2 5.2 2.5 6.0 100.0
Transport services managers
0.8 4.8 2.6 4.1 0.5 71.9 0.4 0.6 3.1 1.1 10.2 100.0
Driving instructors 0.3 1.2 0.3 1.0 0.1 7.1 0.0 0.1 3.4 85.4 1.2 100.0
Logistics clerks 3.0 23.6 1.9 26.6 0.6 24.1 2.8 0.6 5.5 2.1 9.2 100.0
Train & tram drivers 1.6 42.6 1.7 25.5 0.3 21.6 0.5 0.2 0.2 0.4 5.4 100.0
Delivery drivers 0.7 2.8 15.7 0.5 4.9 56.4 0.0 0.0 13.2 0.2 5.5 100.0
Storepersons 4.5 12.6 6.5 7.8 0.3 60.5 0.1 0.1 4.0 0.7 2.9 100.0
Deck & fishing hands 53.1 4.2 1.2 5.3 1.3 27.6 0.1 0.1 5.0 0.3 1.8 100.0
Agr
icul
ture
/ M
inin
g
Man
ufac
turin
g.
& U
tiliti
es
Con
stru
ctio
n
Who
lesa
le/
reta
il
Acc
omm
odat
ion/
Food
Tran
spor
t
Info
Med
ia
Fina
nce
Pub.
Adm
in
Hea
lth &
Ed
ucat
ion
Oth
er
Tota
l
Based on data from the ABS 2006 Census of Population and Housing generated using ABS TableBuilder. Percentages exclude any missing data. Occupation is based on ANZSCO and industry on ANZSIC 2006. TLISC scope is limited to Deck hands.
TLISC and industry, occupation and education classifications. The name Industry Skills Council implies that each of the 11 organisations has a particular industry focus. On the other hand, as Table 6 shows, the training packages, which are a core responsibility of the ISCs, have an occupational rather than an industry focus—and occupations are not necessarily industry-specific.
Typically the occupations of interest to the ISCs through their training packages cut across the broad categories of the ABS’s Australian and New Zealand Standard Classification of Industries (ANZSIC)—a classification used by the ABS for most of its collections, including the National Accounts that provide the foundation for national and industry estimates of productivity growth.
5 | industrY coMparisons

re-classified as working in the Transport, Postal and Warehousing industry. An understanding of the creation and definition of ANZSIC is important because of the sometimes loose connection between intuitive understandings of what might be included under Transport, Postal and Warehousing, the scope of the TLISC and ABS statistics.
ANZSIC 2006 groups together organisations producing similar goods and services using similar processes. It is a four-level hierarchical classification of industries in which specific industries are nested within progressively broader industry categories. For instance:
® Class: Inter Urban and Rural Bus Transport (4621) ® Group : Road Passenger Transport (462) ® Sub-division: Road Transport (46) ® Division: Transport, Postal & Warehousing (I)
The identification of industry can vary somewhat across ABS collections. For instance, in collections that rely upon the self-report of individuals, such as the Census, the ABS asks for the name and address of the employer, which can then be linked
tlisc training packages focus on jobs in the transport & logistics industry.
Table 7 shows the distribution of selected TLISC-related occupations across broad industry categories. Transport (in full, the Transport, Postal and Warehousing industry) is the main industry for most of these occupations, particularly for Delivery Drivers (56.4 per cent work in the transport industry), Storepersons (60.5 per cent) and Transport Service Managers (71.9 per cent).
The correspondence between TLISC occupations and the transport industry is less than perfect. This apparent lack of correspondence follows in part from the fact that although, for instance, a Delivery Driver is clearly involved in transport as part of their job, the industry classification is based on the industry of the organisation for which the driver works. For instance, if a Storeperson is employed by say, Woolworths, their industry will be classified as Retail. If Woolworths were to out-source this same work to a specialist Transport and Logistics company, then that worker would be
71.9%of Transport service managers
work in the Transport, Postal
and Warehousing industry.

38
Productivity and Productivity growth in the australian transPort and logistics industries
to ANZSIC. Additionally, however, respondents are asked directly about the industry of their employer and answers to this question are based on the varying understandings of the respondents. The classification of some respondents who either do not supply employer information or whose employer cannot be classified under ANZSIC is therefore based on self-report.
Under the Australian system of National Accounts and industry-level productivity growth estimates, the classification is more rigorous. Organisations are identified by the level at which their financial and balance sheet accounts are maintained and from which a consolidated financial position can be derived. For instance, the activities of Wesfarmers, a conglomerate with components in retailing, coal mining and insurance, among other activities, would be allocated to the industries corresponding to those various components because the company identifies the finances of these components separately.
Organisations that conduct productive activities that belong to more than one industry class but do not account for these activities separately are classified by their main activity using other available information. The main activity is identified by its ‘value add’, that is, the revenue derived from the activity minus the costs of conducting that activity. ‘Value add’ may be difficult to identify because by definition separate accounts are not kept. In that case, the classification of an organisation may be based on the relative size of sales of goods and services, the amount of wages and salaries paid; or the number of employees. In some circumstances, the declared purpose of the organisation may be used. Therefore industry categories such as Road Transport do not necessarily contain all the organisations that undertake the activities belonging to that class.
As classes are aggregated into broader categories, and ultimately into the highest level of Divisions, the basis of their classification shifts away from the processes and organisation of activities towards similarities of output. The ANZSIC Transport, Postal and Warehousing division includes organisations:
mainly engaged in providing transportation of passengers and freight by road, rail, water or air. Other transportation activities such as postal services, pipeline transport and scenic and sightseeing transport are included in this division. Units mainly engaged in providing goods warehousing and storage activities are also included. The division also includes units mainly engaged in providing support services for the transportation of passengers and freight. These activities include stevedoring services, harbour services, navigation services, airport operations and customs agency services (ABS 2006).
Table 8 provides an overview of the broader context within which the ANZSIC Transport, Postal and Warehousing division is defined as well as more detail about the content of the division and the way in which ANZSIC corresponds to industry-level productivity growth estimates. Much of the content of Division I, Transport, Postal and Warehousing, corresponds to the sectors of TLISC—Road, Rail, Water and Air Transport and associated services. There are, however, a few minor discrepancies. Pipelines, for instance, are included in the ANZSIC Transport division because they are a means of moving gas and other products. Grain silos, as part of the storage and warehousing infrastructure, are also included. Arguably some components of leisure transport are more closely related to tourism. These activities may be outside the scope of TLISC. More detail would probably identify further modest exceptions. In general, however, this statistical division corresponds fairly well with the industry sectors of the TLISC.
5 | industrY coMparisons

6.0%of the value-added by the Australian
economy is contributed by the Transport,
Postal and Warehousing.
table 8 also shows the relative economic and employment size of the industry divisions and, in the case of the transport, postal and Warehousing division, the size of selected sub-divisions. The Transport, Postal and Warehousing division, for instance, contributes about 6.0 per cent of the value-added by the Australian economy and about 5.2 per cent of the employment. Within the division, Road Transport contributes 1.7 per cent of the value-add, Rail Transport (including Water and Other Transport) 0.9 per cent, Air Transport 0.6 per cent and Transport Services (including Postal and Warehousing Services) 2.8 per cent.
Industry-level estimates of productivity growth depend on the availability of market prices. Three ANZSIC divisions are deemed not to be sufficiently market-driven, mainly because of the dominance of government provision:
® Public Administration and Safety—Public administration, Defence, Public Order, Safety and Regulatory services
® Education and Training—Preschool and School Education, Tertiary education, Adult, Community and Other Education
® Health Care and Social Assistance—Hospitals, Social Assistance Services, Medical & Other Health Care Services, Residential Care Services.
Each of these divisions has some market components—private security and safety services; non-government pre-schools, schools, VET and higher education providers; and private health providers respectively. Nevertheless the level of government provision of services means that even for organisations providing commercial services their prices are not set in a competitive market. Instead prices are often strongly influenced by government policy and regulation. It is therefore difficult to estimate productivity growth using the standard ABS measures.
In summary, the ABS provides separate productivity growth estimates for the ANZSIC Transport, Postal and Warehousing division, which, apart from pipelines and grain silos, mostly corresponds with the scope and interests of TLISC. The division, however, may include economic activities that lie outside the scope of the TLISC and Transport, Postal and Warehousing where a firm that is predominantly engaged in Transport and Logistics also undertakes other activities that are not separately identified in their accounts. Similarly there are firms mainly engaged in other economic activities that also include Transport and Logistics as part of those activities. The implications for the TLISC of any estimates of changes in productivity growth in Transport, Postal and Warehousing, therefore, need to be considered with that substantial caveat.
40
Productivity and Productivity growth in the australian transPort and logistics industries
Table 8 AnZSIC divisions by market status and availability of productivity growth estimates
1 Per cent of gross value add (GVA) contributed by the industry division for the year to December 2011. The total excludes the contribution from ownership of dwellings and any corrections for taxes and subsidies and statistical discrepancies (ABS 2012b, Table 5 Gross Value Added (GVA) by Industry).
2 Share of total employment. Values are based on an average of estimates for 2006-07, 2007-08, 2008-09 (ABS 2010b).
Contribution to economy
value add1 Employment2
Market industries 82.1 76.2
Agriculture, Forestry & fishing 2.6 3.4
Mining 8.6 1.4
Manufacturing 9.6 10.8
Electricity, Gas, Water & Waste Services 2.5 1.1
Construction 9.2 9.1
Wholesale Trade 5.0 4.0
Retail Trade 5.2 11.5
Accommodation & Food Services 2.7 6.5
Transport, Postal & Warehousing 6.0 5.2
Road Transport 1.7
Rail Transport 0.9
Water Transport
Air & Space Transport 0.6
Other Transport
Postal & Courier Pick-up and Delivery Services 2.8
Transport Support Services
Warehousing and Storage Services
Information, Media & Telecommunications 3.7 2.2
Financial & Insurance Services 11.4 3.8
Rental, Hiring & Real Estate Services 2.3 1.8
Professional, Scientific & Technical Services 7.7 7.4
Administrative & Support Services 2.7 3.4
Arts & Recreation Services 1.0 1.8
Other Services 2.0 4.0
non-market industries 17.9 23.8
Public administration & safety 5.8 6.0
Education & training 5.2 7.4
Health care & social assistance 6.9 10.4
5 | industrY coMparisons
PrOduCTIvITy aNd PrOduCTIvITy grOwTh IN ThE auSTraLIaN TraNSPOrT aNd LOgISTICS INduSTrIES

Table 9 Average annual growth in gross value added by industry and productivity growth cycles, Australia, 1985-86 to 2010-11 (%)
Industries Productivity growth cycles Mean
From To
1985/861988/89
1988/891993/94
1993/941998/99
1998/992003/04
2003/042007/08
2007/082010/11
1984/852010/11
Agriculture 1.1 3.6 4.9 3.4 -0.4 8.5 3.5
Mining 5.6 4.6 4.1 2.2 4.4 2.7 3.9
Manufacturing 5.0 0.1 2.1 2.0 1.1 -1.5 1.4
Utilities 4.0 2.4 1.8 1.3 0.9 2.5 2.0
Construction 5.1 -0.1 5.8 5.5 6.3 3.3 4.2
Wholesale 5.7 0.1 6.6 3.3 3.0 1.3 3.3
Retail 1.3 2.5 4.6 4.6 4.3 1.1 3.3
Accommodation & Food 5.3 1.7 5.5 3.2 2.2 -1.4 2.9
Transport, Postal, Warehousing 3.6 2.3 4.6 4.0 5.0 1.6 3.6
Information, Media, Telecom 8.2 9.1 8.0 4.0 4.7 1.2 6.1
Finance & Insurance 12.0 5.5 5.8 5.9 8.6 1.0 6.4
Rental, Hiring, Real Estate --- --- --- 3.2 -0.9 1.5 2.0
Professional, Scientific, Technical --- --- --- 5.3 2.7 6.6 5.0
Admin., Support services --- --- --- 3.4 3.5 -0.4 3.3
Arts, Recreation Services 3.3 1.9 3.7 3.7 4.1 3.3 3.3
Other Services --- --- --- 3.4 0.3 -1.0 1.9
12 Selected industries 4.6 1.9 5.0 3.5 4.1 1.5 3.5
16 Market sector industries --- --- --- 3.6 3.7 1.8 3.6
Adapted from ABS (2012c), Table 8: Gross value added—Chain volume measures. Productivity growth cycles from Table 5: Productivity growth cycles - Selected industries aggregate. 1985/86-1988/89 and 2007/08-2010/11 are partial cycles. Totals for 12 industries based on those industries for which there were estimates in 1984/85-1988/89 and totals for 16 industries based on all industries listed in the table. Means for the additional four industries are from 1995/96.
This section includes six tables that provide industry-level information on six elements of measures of productivity growth:
® gross value added (GVA) ® hours of work (unadjusted) ® capital services ® labour productivity ® capital productivity ® multifactor productivity (MFP).
Gross value added is the measure of output in constant basic prices; hours of work and capital services are the measures of labour and capital inputs; labour productivity is the change in output from year to the next that cannot be explained by changes in labour inputs, capital productivity is the change in output from one year to the next that cannot be explained by changes in the amount of productive capital used to produce that output; and multifactor productivity is the change in output that cannot be explained by changes in either the number of hours of work or the amount of productive capital used to produce that output.
The tables contain information on average annual changes from 1985-86 to 2010-11. Results for the period are presented for six productivity cycles, usually of four to five years each. Productivity cycles are calculated as
the years between peaks in productivity—those years where the level of multifactor productivity achieves a local high value above a calculated trend. Presentation of results for these periods is intended to remove any effect of the business cycle on comparisons. Two cycles may be incomplete—the first, 1985-86 to 1988-89, because estimates were not available for earlier years, and the most recent, 2007-08 to 2010-11 because the cycle itself may not be complete yet. Hence care should be taken when interpreting values for these two cycles.
Each table contains values for 16 market industries (that is, those industries where goods and services are freely traded and where market prices can be more readily established) as well as totals for 12 of those industries and totals for all 16 industries. Estimates were not available over the full period for all sixteen industries. Hence when the commentary refers to the market economy, it is the total for only 12 industries that is intended. The results are derived from the ABS’s Experimental estimates of industry multifactor productivity.
The following discussion focuses on the Transport, Postal, Warehousing industry and comparisons between that industry and the averages for the 12 market industries. References to the Transport industry are to the broader ANZSIC category.
5.2 The transport industry, productivity and productivity growth

42
Productivity and Productivity growth in the australian transPort and logistics industries
Table 10 Average annual growth in hours worked by industry and productivity growth cycles, Australia, 1985-86 to 2010-11 (%)
Industries Productivity growth cycles Mean
From To
1985/861988/89
1988/891993/94
1993/941998/99
1998/992003/04
2003/042007/08
2007/082010/11
1984/852010/11
Agriculture -0.2 -1.5 0.1 -3.0 -0.6 -0.6 -1.1
Mining 0.5 -0.4 -1.2 2.3 10.4 12.6 3.4
Manufacturing 2.7 -1.6 0.1 -1.2 0.3 -2.4 -0.5
Utilities -5.2 -3.1 -3.8 3.5 6.1 9.3 0.8
Construction 6.4 -0.3 3.1 4.3 5.4 1.8 3.3
Wholesale 4.7 1.4 -0.5 0.5 0.6 1.7 1.1
Retail 2.9 0.0 1.6 2.5 3.0 -1.3 1.5
Accommodation & Food 6.1 2.2 3.6 1.9 0.9 1.6 2.6
Transport, Postal, Warehousing 0.9 0.3 2.7 1.1 3.1 1.3 1.6
Information, Media, Telecom 0.9 -0.5 1.1 2.6 1.5 -2.7 0.7
Finance & Insurance 5.2 -1.4 1.1 1.4 3.5 0.1 1.4
Rental, Hiring, Real Estate --- --- --- 5.2 2.2 1.2 2.8
Professional, Scientific, Technical --- --- --- 1.7 5.3 2.8 3.8
Admin., Support services --- --- --- 2.7 -0.6 4.5 3.1
Arts, Recreation Services 4.4 3.5 4.3 1.1 6.3 1.4 3.5
Other Services --- --- --- 1.0 1.7 -0.6 0.9
12 Selected industries 2.9 -0.5 1.2 1.0 2.5 0.5 1.2
16 Market sector industries --- --- --- 1.2 2.6 0.8 1.5
Adapted from ABS (2012c), Table 8: Hours worked indexes. Productivity growth cycles from Table 5: Productivity growth cycles - Selected industries aggregate. 1985/86-1988/89 and 2007/08-2010/11 are partial cycles. Totals for 12 industries based on those industries for which there were estimates in 1984/85-1988/89 and totals for 16 industries based on all industries listed in the table. Means for the additional four industries are from 1995/96.
gross value added by the Transport industry has grown at about the same rate as that of the market economy. Gross value added by the Transport, Postal and Warehousing industry grew at 3.6 per cent per year from 1985-86 to 2010-11, which was just slightly higher than for the market economy overall, for which GVA increased by 3.5 per cent per year (Table 9). During that time, gross value added grew substantially more quickly in the Finance (6.4 per cent) and Information Technology industries (6.1 per cent) and more slowly in Manufacturing (1.4 per cent), Utilities (2.0 per cent) and Accommodation and Food (2.9 per cent).
gross value added by the Transport industry has grown more quickly than the average for the market economy over the last decade. The last three productivity cycles from 1998-99 have seen a somewhat higher relative average annual increase in gross value added by the Transport industry—4.0 per cent for Transport compared with 3.5 per cent for the market economy for 1998-99 to 2003-04, 5.0 per cent compared with 4.1 per cent for 2003-04 to 2007-08, before returning closer to the average, 1.6 per cent compared with 1.5 per cent. In the most recent productivity cycle, with the breaking of the drought, Agriculture (8.5 per cent has shown strong growth in GVA, along with Construction, while Manufacturing (-1.5 per cent) and Accommodation and Food (-1.4 per cent had lower growth because of the high Australian dollar.
hours of work in Australia’s Transport industry have grown more than for the market economy overall. The number of hours worked in the Transport, Postal and Warehousing industry increased at about 1.6 per cent per year from 1985-86 to 2010-11 (Table 10). For the market economy (defined by the 12 industries for which estimates are available) hours of work grew at about 1.2 per cent per year. Over that period, there was a shift of working hours away from Agriculture (-1.1 per cent) and Manufacturing (-0.5 per cent) in particular towards Arts and recreation services (3.5 per cent, Mining (3.4 per cent) and Construction (3.3 per cent), which grew more quickly than the average.
Growth in hours of work in the Transport industry has increased in the last decade. The absolute and relative annual growth in hours worked in the Transport industry was particularly low in the first productivity cycle (0.9 per cent compared with 2.9 per cent in 1985-86 to 1988-89), which lowered the average for the whole period. By comparison, labour inputs grew particularly strongly during 2003-04 to 2007-08 (3.1 per cent), but even so, labour growth in the last decade or so was marked less than in Mining and Utilities, but more strongly than for Manufacturing.
Productive capital in the Australian Transport industry has grown more slowly than for the overall market economy. Table 11 shows that the amount of productive capital in the Transport, Postal and Warehousing industry grew
5 | industrY coMparisons

Table 11 Average annual growth in capital services indexes by industry and productivity growth cycles, Australia, 1985-86 to 2010-11 (%)
Industries Productivity growth cycles Mean
From To
1985/861988/89
1988/891993/94
1993/941998/99
1998/992003/04
2003/042007/08
2007/082010/11
1984/852010/11
Agriculture 0.7 0.0 0.4 0.2 1.6 1.5 0.6
Mining 3.7 2.9 5.3 2.3 8.3 10.9 5.2
Manufacturing 3.9 2.8 3.7 3.4 5.6 1.8 3.6
Utilities 1.3 0.6 2.1 3.7 5.9 5.6 3.1
Construction 10.8 2.7 3.6 3.3 6.3 4.9 4.8
Wholesale 3.8 4.2 4.5 5.2 8.3 3.7 5.0
Retail 5.4 3.1 5.5 5.8 7.0 3.9 5.1
Accommodation & Food 11.7 3.4 5.1 4.5 5.2 1.9 5.1
Transport, Postal, Warehousing 3.7 2.4 2.2 4.1 6.3 4.8 3.8
Information, Media, Telecom 7.0 6.0 8.2 6.8 6.6 3.7 6.5
Finance & Insurance 12.7 5.7 4.6 5.7 4.4 2.2 5.7
Rental, Hiring, Real Estate --- --- --- 8.6 11.5 6.6 8.8
Professional, Scientific, Technical --- --- --- 10.4 11.0 6.4 10.7
Admin., Support services --- --- --- 10.3 8.6 5.1 10.6
Arts, Recreation Services 9.3 5.0 9.3 5.8 5.7 3.7 6.5
Other Services --- --- --- 10.3 11.5 8.4 10.7
12 Selected industries 4.7 3.0 4.2 4.0 6.2 5.0 4.4
16 Market sector industries --- --- --- 4.4 6.6 5.2 5.2
Adapted from ABS (2012c), Table 9: Capital services indexes. Productivity growth cycles from Table 5: Productivity growth cycles - Selected industries aggregate. 1985/86-1988/89 and 2007/08-2010/11 are partial cycles. Totals for 12 industries based on those industries for which there were estimates in 1984/85-1988/89 and totals for 16 industries based on all industries listed in the table. Means for the additional four industries are from 1995/96.
by an average of 3.8 per cent per year from 1985-86 to 2010-11 while for the market economy it grew at 4.4 per cent per year. Productive capital grew more slowly only in Agriculture, with a very low growth rate of 0.6 per cent, the Utilities (electricity, gas, water and waste) with 3.1 per cent and Manufacturing (3.6 per cent). Interestingly Information, Media and Telecommunications (6.5 per cent) and Finance (5.7 per cent) had growth rates that were higher than Mining (5.2 per cent).
Growth in productive capital in the Transport industry has increased in the last decade. The absolute and relative rates of the formation of productive capital have varied over the last couple of decades. In more recent years, growth in productive capital has increased substantially—from 3.7 per cent, 2.4 per cent and 2.2 per cent per year for the first three productivity cycles to 1998-99 and then approximately doubled to 4.1 per cent, 6.3 per cent and 4.8 per cent for the more recent cycles to close to the average for the market economy. This higher absolute and relative growth of productive capital in the Transport industry has only partly mirrored the very substantial increase in capital formation in the Mining industry.
Labour productivity in the Transport industry has grown only slightly more slowly than in the market economy. Labour productivity in the Transport, Postal and Warehousing industry increased by about 2.1 per cent per year from 1985-86 to 2010-11. This was only slightly lower than for the market economy (defined
by the 12 industries for which estimates are available) where labour productivity grew by 2.3 per cent per year.
growth in labour productivity in the Transport industry has been slowing in recent productivity cycles. Labour productivity growth in the Transport industry has been fairly volatile across productivity cycles, but 0.4 per cent per year in the most recent productivity cycle is the lowest of the five cycles in Table 12 and is a somewhat steeper decline from the preceding cycle than for the whole market economy.
The decline in capital productivity has been less in the Transport industry than in the market economy. Capital productivity has declined by an average of 0.9 per cent per year between 1985 and 2011 but by only 0.2 per year in the Transport, Postal and Warehousing industry. In fact only Agriculture and Finance, with growth of 2.8 per cent and 0.7 per cent per year respectively, had better performance in capital productivity. Changes in the growth of capital productivity in the Transport industry have been fairly volatile, often close to zero, but peaking at 2.3 per cent per year in the 1993-94 to 1997-98 productivity cycle and plunging to minus 3.1 per cent per year in the most recent cycle. These changes have to some extent reflected the broader changes in the market economy.
Multifactor productivity in the Australian Transport industry has grown faster in the long run than in the overall market economy. Table 14 shows that

44
Productivity and Productivity growth in the australian transPort and logistics industries
MFP in Accommodation and Food also fell markedly, probably reflecting higher vacancy rates with decline of domestic tourism spurred on by the strong Australian dollar—minus 3.5 per cent compared with plus 0.4 per cent in the preceding period. The smaller Administration and services industry also experienced a decline in MFP growth (minus 4.7 per cent, down from plus 3.5 per cent in the preceding cycle). Finance and Insurance, with MFP growth of only minus 0.2 per cent has experienced a very large decline from plus 4.5 per cent in the preceding period and a long-term average of 1.2 per cent, clearly affected by the GFC. In the context of these industries, the recent decline in MFP in the Transport industry is modest (minus 1.1 per cent down from plus 0.7 per cent in the preceding period).
Some industries continue to show growth in MfP. The change in weather condition saw a stunning turnaround in the MPF growth in Agriculture, with 7.7 per cent growth compared with minus 1.0 per cent in the preceding period and a long-term average of 3.5 per cent per year. Less spectacularly, MFP growth in Retail improved from a very modest 0.3 per cent to 1.1 per cent in the midst of well documented difficult trading conditions. MFP growth in Construction and Information technology was modest but stable, while the small Rental, Hiring and Real Estate industry, while still exhibiting negative MFP growth in the most recent period (-1.7 per cent), experienced a substantial
Table 12 Average annual growth in labour productivity by industry and productivity growth cycles, Australia (%), 1985-86 to 2010-11
Industries Productivity growth cycles Mean
From To
1985/861988/89
1988/891993/94
1993/941998/99
1998/992003/04
2003/042007/08
2007/082010/11
1984/852010/11
Agriculture 1.3 5.2 4.9 6.4 0.6 9.2 4.6
Mining 5.2 5.4 5.4 0.5 -5.2 -8.3 1.1
Manufacturing 2.3 1.7 2.1 3.3 0.9 0.9 2.0
Utilities 9.7 5.8 6.2 -2.0 -4.9 -6.0 1.7
Construction -1.3 0.3 2.7 1.0 0.9 1.5 1.0
Wholesale 0.9 -1.3 7.3 2.8 2.6 -0.3 2.3
Retail -1.7 2.5 3.0 2.2 1.3 2.6 1.9
Accommodation & Food -0.8 -0.4 1.9 1.3 1.4 -3.0 0.3
Transport, Postal, Warehousing 2.8 2.1 1.9 2.9 1.9 0.4 2.1
Information, Media, Telecom 7.3 9.7 7.3 2.0 3.5 4.1 5.7
Finance & Insurance 6.3 7.2 4.7 4.4 4.9 0.8 4.9
Rental, Hiring, Real Estate --- --- --- -1.9 -2.9 1.0 -0.4
Professional, Scientific, Technical --- --- --- 3.6 -2.5 3.7 1.2
Admin., Support services --- --- --- 0.9 4.2 -4.6 0.4
Arts, Recreation Services -1.1 -0.8 -0.5 2.8 -2.0 2.0 0.1
Other Services --- --- --- 2.6 -1.2 -0.2 1.1
12 Selected industries 1.7 2.3 3.8 2.5 1.6 1.0 2.3
16 Market sector industries --- --- --- 2.4 1.1 1.0 2.1
Adapted from ABS (2012c), Table 6: Labour productivity indexes—Value added based measures. Productivity growth cycles from Table 5: Productivity growth cycles - Selected industries aggregate. 1985/86-1988/89 and 2007/08-2010/11 are partial cycles. Totals for 12 industries based on those industries for which there were estimates in 1984/85-1988/89 and totals for 16 industries based on all industries listed in the table. Means for the additional four industries are from 1995/96.
multifactor productivity in the Transport, Postal and Warehousing industry grew by an average of 1.2 per cent per year between 1985-86 and 2010-11 while it grew at 0.9 per cent per year in the market economy. MFP grew more strongly only in Agriculture (3.5 per cent), Finance (3.0 per cent) and Information, Media and Telecommunications (2.1 per cent). 2 per cent). In contrast, multifactor productivity declined in Arts and Recreation services (-0.9 per cent), Mining (-0.5 per cent) and Accommodation and Food (-0.1 per cent).
Multifactor productivity in the Transport industry has declined in the three most recent productivity cycles. Absolute and relative growth of MFP in the Transport industry has declined sharply during the current productivity cycle, falling to minus 1.1 per cent per year, well below the long-term average of plus 1.2 per cent. Part of this decline was associated with an overall decline of MFP in the market economy, but there seems to be an additional element as MFP growth in Transport has come back to the average for the market economy.
The recent decline in MfP growth is evident in a number of industries. Mining stands out with MFP decline by an astounding 7.5 per cent, 3.6 percentage points lower than in the preceding period. This decline is typically attributed to lags between the very high levels of current investment and the expected future production. The decline in MFP growth in the Utilities is also very high, but breaks a long-term decline in the industry, with the decline slightly lower than in the preceding period.
5 | industrY coMparisons
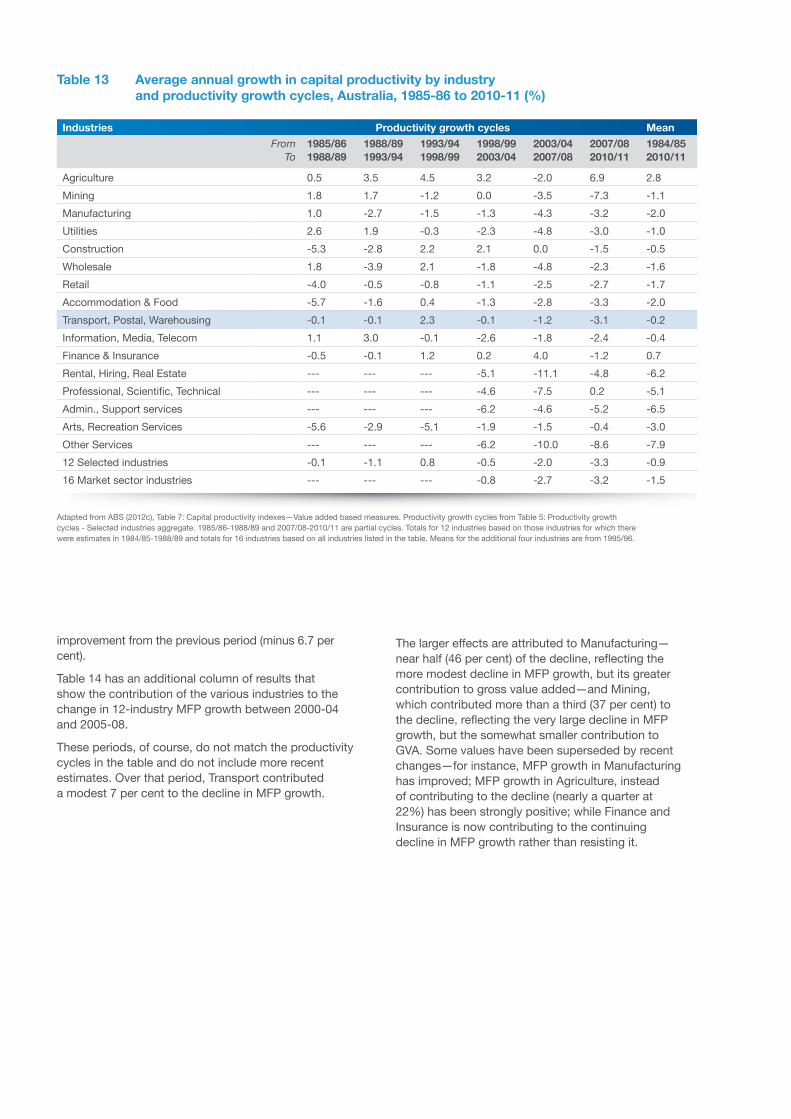
Table 13 Average annual growth in capital productivity by industry and productivity growth cycles, Australia, 1985-86 to 2010-11 (%)
Industries Productivity growth cycles Mean
From To
1985/861988/89
1988/891993/94
1993/941998/99
1998/992003/04
2003/042007/08
2007/082010/11
1984/852010/11
Agriculture 0.5 3.5 4.5 3.2 -2.0 6.9 2.8
Mining 1.8 1.7 -1.2 0.0 -3.5 -7.3 -1.1
Manufacturing 1.0 -2.7 -1.5 -1.3 -4.3 -3.2 -2.0
Utilities 2.6 1.9 -0.3 -2.3 -4.8 -3.0 -1.0
Construction -5.3 -2.8 2.2 2.1 0.0 -1.5 -0.5
Wholesale 1.8 -3.9 2.1 -1.8 -4.8 -2.3 -1.6
Retail -4.0 -0.5 -0.8 -1.1 -2.5 -2.7 -1.7
Accommodation & Food -5.7 -1.6 0.4 -1.3 -2.8 -3.3 -2.0
Transport, Postal, Warehousing -0.1 -0.1 2.3 -0.1 -1.2 -3.1 -0.2
Information, Media, Telecom 1.1 3.0 -0.1 -2.6 -1.8 -2.4 -0.4
Finance & Insurance -0.5 -0.1 1.2 0.2 4.0 -1.2 0.7
Rental, Hiring, Real Estate --- --- --- -5.1 -11.1 -4.8 -6.2
Professional, Scientific, Technical --- --- --- -4.6 -7.5 0.2 -5.1
Admin., Support services --- --- --- -6.2 -4.6 -5.2 -6.5
Arts, Recreation Services -5.6 -2.9 -5.1 -1.9 -1.5 -0.4 -3.0
Other Services --- --- --- -6.2 -10.0 -8.6 -7.9
12 Selected industries -0.1 -1.1 0.8 -0.5 -2.0 -3.3 -0.9
16 Market sector industries --- --- --- -0.8 -2.7 -3.2 -1.5
Adapted from ABS (2012c), Table 7: Capital productivity indexes—Value added based measures. Productivity growth cycles from Table 5: Productivity growth cycles - Selected industries aggregate. 1985/86-1988/89 and 2007/08-2010/11 are partial cycles. Totals for 12 industries based on those industries for which there were estimates in 1984/85-1988/89 and totals for 16 industries based on all industries listed in the table. Means for the additional four industries are from 1995/96.
improvement from the previous period (minus 6.7 per cent).
Table 14 has an additional column of results that show the contribution of the various industries to the change in 12-industry MFP growth between 2000-04 and 2005-08.
These periods, of course, do not match the productivity cycles in the table and do not include more recent estimates. Over that period, Transport contributed a modest 7 per cent to the decline in MFP growth.
The larger effects are attributed to Manufacturing—near half (46 per cent) of the decline, reflecting the more modest decline in MFP growth, but its greater contribution to gross value added—and Mining, which contributed more than a third (37 per cent) to the decline, reflecting the very large decline in MFP growth, but the somewhat smaller contribution to GVA. Some values have been superseded by recent changes—for instance, MFP growth in Manufacturing has improved; MFP growth in Agriculture, instead of contributing to the decline (nearly a quarter at 22%) has been strongly positive; while Finance and Insurance is now contributing to the continuing decline in MFP growth rather than resisting it.

46
Table 14 Average annual growth in multifactor productivity by industry and productivity growth cycles, Australia, 1985-86 to 2010-11 (%)
Industries Productivity growth cycles Mean Share
From To
1985/861988/89
1988/891993/94
1993/941998/99
1998/992003/04
2003/042007/08
2007/082010/11
1984/852010/11
2000-042005-08
Agriculture 0.8 4.1 4.7 4.4 -1.0 7.7 3.5 22
Mining 2.8 2.8 0.7 0.1 -3.9 -7.5 -0.5 37
Manufacturing 1.8 0.0 0.6 1.4 -1.4 -0.7 0.3 46
Utilities 6.0 3.5 2.0 -2.2 -4.8 -4.2 0.1 8
Construction -2.2 -0.5 2.6 1.3 0.7 0.6 0.6 -3
Wholesale 1.3 -2.2 5.4 1.3 0.0 -1.0 0.9 9
Retail -2.3 1.8 2.1 1.4 0.3 1.1 1.0 12
Accommodation & Food -1.8 -0.7 1.7 0.8 0.4 -3.0 -0.1 0
Transport, Postal, Warehousing
1.6 1.3 2.1 1.8 0.7 -1.1 1.2 7
Information, Media, Telecom 4.0 5.8 2.9 -0.9 0.2 0.0 2.1 -5
Finance & Insurance 3.9 4.1 2.9 2.3 4.5 -0.2 3.0 -39
Rental, Hiring, Real Estate --- --- --- -3.7 -6.7 -1.7 -3.4 ---
Professional, Scientific, Technical
--- --- --- 2.9 -3.2 2.9 0.6 ---
Admin., Support services --- --- --- 0.5 3.5 -4.7 -0.1 ---
Arts, Recreation Services -2.8 -1.5 -1.8 1.1 -1.8 1.1 -0.9 6
Other Services --- --- --- 0.6 -3.3 -1.7 -0.8 ---
12 Selected industries 0.9 0.9 2.5 1.2 0.0 -1.0 0.9 100
16 Market sector industries --- --- --- 1.0 -0.5 -0.9 0.5 ---
Adapted from ABS (2012c), Table 1: Gross value added based multifactor productivity indexes—Chain volume gross value added at basic prices. Productivity growth cycles taken from Table 5: Productivity growth cycles - Selected industries aggregate. 1985/86-1988/89 and 2007/08-2010/11 are partial cycles. Totals for 12 industries based on those industries for which there were estimates in 1984/85-1988/89 and totals for 16 industries based on all industries listed in the table. Means for the additional four industries are from 1995/96. Share is the estimated contribution of the industry to the decline in MFPgva growth for the 12 selected market industries between 2000-2004 and 2005-08 (Parham 2012, Table 1.1, p. 6).
5 | industrY coMparisons

14 The values are adapted from Green, Toner and Agarwai (2012). Table 2, p.51. The source provides details about the derivation of the values.
15 Eslake and Walsh (2011). p.20. Eslake & Walsh map estimates from their procedure against growth in labour productivity and find a satisfactory match. This, of course, is only prima facie evidence of the adequacy of their procedure.
The EU-KLEMS project and database provides industry-level estimates of gross value added, labour and capital inputs and total factor productivity for a considerable number of nations. As a European Union sponsored project, the focus is mostly on European countries, but it includes Australia, the USA and Japan, among several non EU countries. The data are derived mainly from national statistical bureaux, the OECD and World Bank and prepared by research partners to ensure the consistency of measures across countries. As is common with such enterprises, the length of the time series and the available estimates vary across countries. Countries discussed in this section mostly had time series of similar length to those available for Australia and more detailed data.
Data from this project permits comparisons across countries of estimates of total factor productivity growth for particular industries. The focus here, of course, is on the Transport and Storage industry.
Comparing Transport and Storage industries, and hence the productivity growth of Transport and Storage industries, across countries is a perilous task. Countries have different mixes of modes of transport—road, rail, sea and air—which in turn reflect their different geographies, population distributions and densities and trade patterns, as well as the relative importance of Transport and Storage for the overall economy. Different countries will have different experiences of productivity and productivity growth partly because their transport industries are different and partly because those industries operate within different economies.
The estimates of productivity growth for Australia and for other countries may differ in this section from estimates in other parts of this report because the estimates are for total factor productivity growth for the whole economy rather than, for instance, for multi-factor productivity growth for the market-based industries. The data for the EU-KLEMS estimates are ultimately derived from ABS data, but may be adjusted to improve international comparability. For instance, industry categories are based on ISIC rather than the ABS’s ANZSIC.
Before considering the international comparisons, it is possible to compare absolute levels of labour productivity (rather than productivity growth) across Australian industries. Figure 4 provides estimates of gross value added per hour of work in a number of broadly defined industries14. These estimates provide an indication of the absolute level of labour productivity across industries—something that is not directly available from the standard ABS indices of productivity growth15.
Value added per hour of labour, as with labour productivity, is influenced by the other inputs that are used in the production process. All else equal, Mining has a very high level of labour productivity because it is both capital intensive and uses raw materials. Utilities (power, water and sewerage plants, among others) are also highly capital intensive. At the other end of the spectrum, workers in hotels and restaurants are engaged in relatively labour intensive industries. The size of the difference among industries is considerable—an hour’s work in the Mining industry produces nearly 10 times as much as value added as an hour’s work in the Hotel and restaurant industry.
5.3 Transport, productivity and productivity growth in other countries

48
Productivity and Productivity growth in the australian transPort and logistics industries
$69is produced in an
hour of work in gross
value added in 2011.
figure 4 gross value added per hour by industry, Australia, 2011
$112
$52
$87
$46
$74
$43
$69
$37
$64
$35
$62
$32
$58
$30
$260
$57
$188
$55
$112
$54
Min
ing
fina
nce,
in
sura
nce
Info
., M
edia
, te
leco
m.
util
ities
Ren
tal,
hiri
ng
real
est
ate
who
lesa
le
T’p
ort
po
stal
, w
’ho
usin
g
All
ind
ustr
ies
Man
ufac
turi
ng
Pub
lic a
dm
in.
& s
afet
y
Pro
f., s
cien
tific,
te
chni
cal
Ad
min
. &
sup
po
rt
Ag
ric.
, fo
rest
ry,
fish
ing
Co
nstr
uctio
n
Ed
ucat
ion
& t
rain
ing
hea
lth c
are,
so
cial
ass
ist.
Art
s &
rec
reat
ion
Ret
ail
oth
er s
ervi
ces
Acc
om
od
atio
n &
foo
d
5 | industrY coMparisons

(0.7 per cent) or Japan (0.6 per cent). Fourth, the relative productivity growth of countries has varied over time, with Australia having higher levels of productivity growth than other countries or regions for some periods. As with many time series, the conclusions that emerge can depend on the start and end years chosen (or available) for the series. Hence caution is always required when making such comparisons.
Several features about Australia’s Transport and Storage industry emerge from Table 15:
® Average productivity growth in Australia’s Transport and Storage industry has generally been higher than for the whole economy over the 25 years from 1983 to 2007—1.0 per cent per year compared with 0.5 per cent per year for the whole economy. The years 2003 to 2007 were an exception, with productivity growth falling more rapidly (minus 5.2 per cent per year) than for the whole economy (minus 0.8 per cent per year).
® Average productivity growth in the Transport and Storage industry was generally higher than productivity growth in the whole economy for most countries for most periods in Table 15.
® Average productivity growth in Australia’s Transport industry has been lower than the productivity growth in the Transport industries of most of the other countries in Table 15 over the 25 years from 1983 to 2007—1.0 per cent per year in Australia compared with 2.0 per cent per year in the USA, 1.6 per cent per year in Europe and 1.4 per cent per year in Japan. Productivity growth Germany and France, in particular, was 3.0 per cent per year.
® Productivity growth was not consistently lower in the Australian industry than in other countries over the longer period. For instance in 1983-87 it (3.6 per cent) was substantially higher than in European Union (1.9 per cent) and in 1993-97 (2.7%) it was substantially stronger than in the USA (0.6%).
an hour’s work in the transport and storage industry produced about $69 in gross value added in 2011, which places the industry just above the average for the australian economy ($64 per hour). GVA per hour, however, is only a partial measure. It does not take into account the capital costs associated with production. Any attempt to use it as a basis for workforce planning policies is risky.
Table 15 shows the average total factor productivity (TFP) growth for the Transport and Storage industry and for the whole economy for selected (mostly European) countries for the years 1983 to 2007. Average growth is shown for five year periods. Context for productivity growth in the Transport and Storage industry is provided by productivity growth for the whole economy for each country.
Although the major point of Table 15 is to provide comparisons over time of productivity growth in the Australian Transport and Storage industry with the Transport and Storage industry in other countries, Table 15 provides some further information about productivity growth in Australia overall and compared with other countries. First the values reiterate the slowdown of productivity growth in Australia during the 2000s—average annual growth for the five years 2003 to 2007 was negative 0.8 per cent per year compared with positive 0.5 per cent per annum over the 25 years 1983 to 2007 and was even higher in the mid-1980s and 1990s. Second, the decline in productivity growth in Australia to 2007 was not reflected globally in other countries. Third, over the 25 years, Australia’s average annual productivity growth was similar to that in the USA (0.5 per cent), but slightly less than that in Europe

50
Productivity and Productivity growth in the australian transPort and logistics industries
Table 15 Annual total factor productivity growth, Transport and Storage industry and whole economy, selected countries, 1983-2007 (%)
Industries Transport & Storage whole economy
1983 - 87
1988 - 92
1993 - 97
1998 - 02
2003 - 07
1983 - 07
1983 - 87
1988 - 92
1993 - 97
1998 - 02
2003 - 07
1983 - 07
Australia 3.6 1.4 2.7 2.4 -5.2 1.0 1.4 0.4 0.9 0.5 -0.8 0.5
Belgium 0.1 8.6 -1.3 -1.0 0.5 1.4 0.7 0.1 0.0 -0.5 0.1 0.1
France 2.6 3.4 3.0 3.1 2.7 3.0 1.1 0.9 0.4 0.9 0.5 0.8
Germany --- 0.0 6.1 1.4 2.1 3.0 --- 0.5 0.9 0.3 0.8 0.7
Italy 0.5 3.1 3.0 0.0 -1.0 1.1 0.9 0.9 1.0 -0.3 -0.3 0.4
Japan 2.3 3.2 0.9 0.4 -0.0 1.4 1.3 1.4 -0.0 -0.4 0.7 0.6
Netherlands 1.2 1.3 1.9 0.6 2.1 1.4 1.0 0.3 0.4 0.2 1.1 0.6
Sweden --- --- 1.9 -1.9 -0.1 -0.2 --- --- 0.7 0.8 1.0 0.8
UK 4.4 0.1 3.6 1.4 1.4 2.2 1.5 0.3 1.0 0.0 0.7 0.7
USA 3.9 3.1 0.6 -0.4 2.8 2.0 1.0 0.4 -0.1 0.4 0.9 0.5
EU 1.9 2.0 3.0 0.4 0.8 1.6 1.1 0.8 0.7 0.2 0.5 0.7
EU includes European Union countries for which estimates were available: Austria, Belgium, Denmark, Spain, Finland, France, Germany, Italy, Netherlands & UK. Values for Australia were available for all five years of each period. Values for some countries were available for only some years at the start of their series and in some instances were not available for 2007. Transport & Storage in defined by ISIC, TFP for whole economy.
5 | industrY coMparisons

Table 1 18
Annual productivity growth in the market economy, Australia, 1995-2011 (%)
Table 2 24
Sources of annual output growth, Australia 1995-96 to 2010-11(%)
Table 3 30
Measures of total factor productivity, selected countries, 2007
Table 4 32
Labour productivity growth by selected countries, 1990-92, 1999-01, 2009-11
Table 5 32
Multifactor productivity growth by selected countries, 1986-88, 1996-98, 2006-08
Table 6 36
Enrolments in VET courses by course occupation: TLISC training packages, 2010
Table 7 36
Selected TLISC occupations by industry, Australia 2006 (%)
Table 8 40
ANZSIC divisions by market status and availability of productivity growth estimates
Table 9 42
Average annual growth in gross value added by industry and productivity growth cycles, Australia, 1985-86 to 2010-11 (%)
Table 10 42
Average annual growth in hours worked by industry and productivity growth cycles, Australia, 1985-86 to 2010-11 (%)
Tables and figuresTable 11 44
Average annual growth in capital services indexes by industry and productivity growth cycles, Australia, 1985-86 to 2010-11 (%)
Table 12 44
Average annual growth in labour productivity by industry and productivity growth cycles, Australia (%), 1985-86 to 2010-11
Table 13 46
Average annual growth in capital productivity by industry and productivity growth cycles, Australia, 1985-86 to 2010-11 (%)
Table 14 46
Average annual growth in multifactor productivity by industry and productivity growth cycles, Australia, 1985-86 to 2010-11 (%)
Table 15 50
Annual total factor productivity growth, Transport and Storage industry and whole economy, selected countries, 1983-2007 (%)
figure 1 18
Annual productivity growth in the market economy, Australia, 1995-2011 (%)
figure 2 20
Annual changes in gross value added per paid hour of work in the market economy, Australia, 1995-96 to 2011-12 (%)
figure 3 24
Annual growth in gross value added, labour and capital inputs and multifactor productivity in the market economy, Australia, 1995-2011 (%)
figure 4 48
Gross value added per hour by industry, Australia, 2011

52
Productivity and Productivity growth in the australian transPort and logistics industries
Ahn, S 2002, ‘Competition, innovation and productivity growth: A review of theory and evidence’, OECD Economics Department Working Paper No. 317, OECD, Paris.
Ashenfelter, o 2012, ‘Comparing real wages’, Paper No. 18006, NBER, Cambridge, MA.
Australian bureau of Statistics (AbS) 2006, Australian and New Zealand Standard Classification of Industry (ANZSIC), ABS, Canberra.
Australian bureau of Statistics (AbS) 2010a, Australian Demographic Statistics, Dec 2010, Cat. no. 3101.0, ABS, Canberra.
Australian bureau of Statistics (AbS) 2010b, Labour Force, Australia, Detailed, Quarterly, Nov 2010, Cat. no. 6291.0.55.003, ABS, Canberra.
Australian bureau of Statistics (AbS) 2012a, Australian National Accounts: National Income, Expenditure and Product, Sep 2012, Cat. no. 5206.0, ABS, Canberra.
Australian bureau of Statistics (AbS) 2012b, Australian system of national accounts 2011-12, Cat. no. 5204.0, ABS, Canberra.
Australian bureau of Statistics (AbS) 2012c, Experimental estimates of industry multifactor productivity 2011-12, Cat. no. 5260.0.55.002, ABS, Canberra.
Australian government 2010, Australia to 2050: future challenges, Circulated by The Hon. Wayne Swan MP Treasurer of the Commonwealth of Australia, Canberra.
baumol, w 1967, ‘Macroeconomics of unbalanced growth: the anatomy of urban crisis’, American Economic Review, vol. 57, pp. 415-426.
business Council of Australia 2012, Pipeline or pipe dream? Securing Australia’s investment future, Business Council of Australia.
Eslake, S & walsh, M 2011, Australia’s productivity challenge, Grattan Institute, Melbourne.
green, R, Toner, P & Agarwal, R 2012, Understanding productivity: Australia’s choice, The McKell Institute, University of Technology Sydney Sydney.
hall, R & Jones, C 1999, ‘why do some countries produce so much more output per worker than others?’, The Quarterly Journal of Economics, vol. 114, pp. 83-116.
house of Representatives Standing Committee on Economics 2010, Inquiry into raising the productivity growth rate in the Australian economy, Parliament of Australia, Canberra.
oECD 2005, ‘Is gDP a satisfactory measure of growth?’, OECD Observer, No 246-247, Dec. 2004-Jan. 2005.
Parham, D 2012, ‘Australia’s productivity growth slump: Signs of crisis, adjustment or both?’, Visting Researcher Paper, Productivity Commission, Melbourne.
Reilly, R, Milne, w & Zhao, S 2005, Quality-adjusted labour inputs, Cat. no. 1351.0.55.010, ABS, Canberra.
Stevens, g 2010, The challenge of prosperity (Address to the Committee for Economic Development of Australia (CEDA) Annual Dinner, Melbourne - 29 November 2010), viewed 17 February 2013, http://www.rba.gov.au/speeches/2010/sp-gov-291110.html.
Turner & Townsend 2012, International construction cost survey 2012, London.
references
reFerences

Transport & Logistics Industry Skills CouncilP: 03 9604 7200 F: 03 9629 8903E: [email protected]
tlisc.org.au
in the australian transport and logistics industries
Centre for the Economics of Educat ion and Tra iningFaculty of Educat ion, Monash Univers i ty