Embed Size (px)
Citation preview
Vol. 197: 139-149,2000 MARINE ECOLOGY PROGRESS SERIES Mar Ecol Prog Ser
Published May 12
Succession in marine benthic habitats and fauna in response to oxygen deficiency: analysed by
sediment profile-imaging and by grab samples
Hans C. Nilsson*, Rutger Rosenberg
Department of Marine Ecology, GBteborg University, Kristineberg Marine Research Station, 450 34 Fiskebiickskil, Sweden
ABSTRACT: This study shows, for the first time, in sifu images of changes in marine benthic habitats in response to oxygen deficiency. Tight coupling is demonstrated between gradual degradation of benthic habitat and faunal behaviour, species richness, abundance and biomass. The critical oxygen level that forced changes in the benthic faunal successional stages was -10% that of air saturation (-0.7 m1 O2 1-l). Before this critical saturation level was reached, tube-building polychaetes their tubes extended hlgher into the water column, the width of the sub-oxic sediment layer decreased, and vertical animal burrows (formerly oxidised and brown m colour) became sulphidic and black. Over a 10 mo hypoxic period (June 1997 to Apnl 1998) in the Gullmarsfjord (Swe&sh west coast), benthlc community succes- sional stages d e c h e d from equilibrium to virtually azoic conditions. As normoxic conditions returned, pioneering stages gradually recolonised the area.
KEY WORDS: REMOTS . SPI . Hypoxia . Anoxia - Melinna cristata
INTRODUCTION
Riverine inputs of nitrogen in many temperate re- gions have increased greatly since pre-industrial times, e.g. in the North Sea by 6- to 20-fold (Howarth et al. 1996). In addition to this and other nutrient inputs, organic enrichment of sediments in coastal areas is increasing worldwide (Rosenberg 1985, Nixon 1995). In stratified and partly enclosed waters, areas with low oxygen concentrations critical for marine bottom-living animals are expanding, which has a negative impact on fisheries (Caddy 1993, Diaz & Rosenberg 1995). In areas where benthic fauna has been reduced or even eliminated, sediment chemistry, including nutrient fluxes, is changing significantly, with consequences for the ecosystem (Aller 1988).
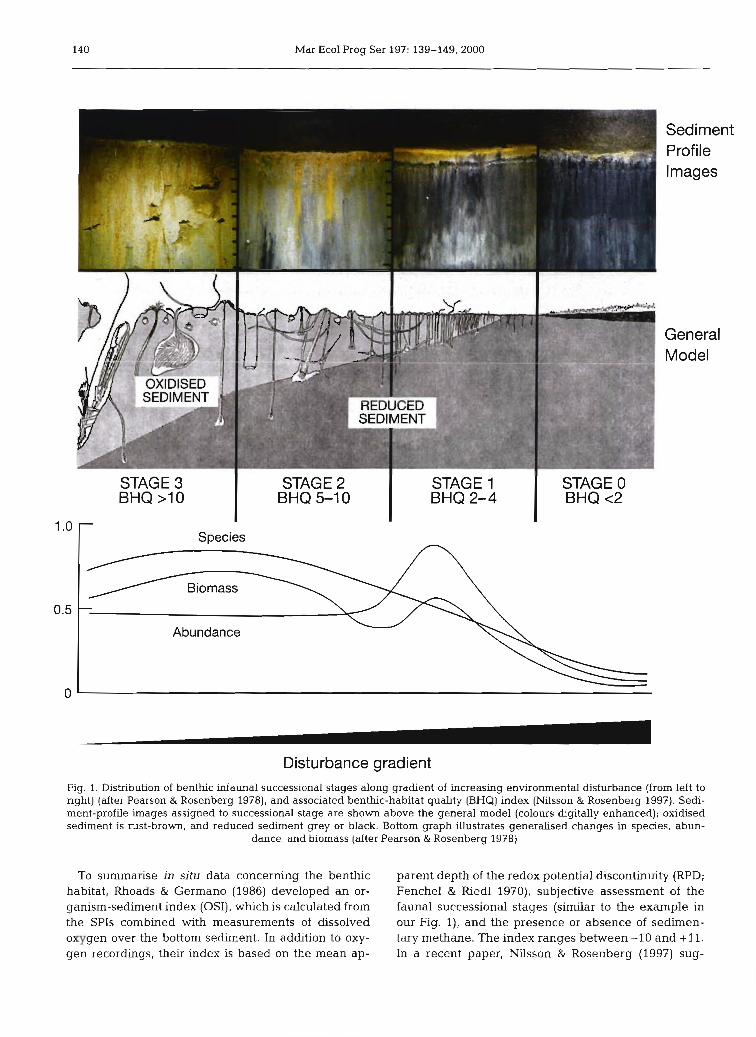
Structural changes in soft-bottom benthic communi- ties resulting from organic enrichment have been modelled by Pearson & Rosenberg (1978), who demon- strated how species-abundance-biomass (SAB) curves and faunal distributions in the sediment change along
a gradient from excess organic input to 'normal' condi- tions (Fig. 1). This generalised successional model has also been shown to hold for physical disturbance (Rhoads & Germano 1986) and to apply generally to disturbed sublittoral benthic communities (Heip 1995).
Since the pioneering work of Rhoads & Cande (1971) and Rhoads & Germano (1982), sediment-profile imag- ing, SPI, (Fig. 1) has proved useful in demonstrating benthic habitat changes connected with physical dis- turbance (Rhoads & Germano 1986, Rumohr & Scho- mann 1992), organic enrichment (O'Connor et al. 1989), low salinities (Bonsdorff et al. 1996), and low oxygen concentrations (Schaffner et al. 1992, Nilsson & Rosenberg 1997). The effects of oxygen deficiency on the behaviour of benthic fauna at the sediment surface (Dethlefsen & von Westernhagen 1983, Stachowitsch 1984) and the presence of sulphur bacteria (Rosenberg & Diaz 1993, Rumohr 1993) have also been docu- mented by in situ photography. One advantage of SPI over traditional grab sampling methods is that the organism-sediment relationship is lost in grab samples when the sediment sample is processed (Rhoads & Germano 1982).
O Inter-Research 2000 Resa le of full article not permitted
140 Mar Ecol Prog Ser 197: 139-149,2000
STAGE 3 I STAGE 2 BHQ >l0 BHQ 5-1 0
STAGE 1 STAGE 0 BHQ 2-4 I BHQ<2
Species
Biomass
Abundance
Disturbance gradient Fig. 1. Distribution of benthic ~nfaunal successional stages along gradient of increasing environmental disturbance (from left to nght) (after Pearson & Rosenberg 1978), and associated benthlc-habitat quality (BHQ) index (Nilsson & Rosenberg 1997). Sedi- ment-profile images assigned to successional stage are shown above the general model (colours digitally enhanced); oxidised sediment is rust-brown, and reduced sediment grey or black. Bottom graph dustrates generalised changes in species, abun-
dance, and biomass (after Pearson & Rosenberg 1978)
To summarise in situ data concerning the benthic parent depth of the redox potential discontinuity (RPD; habitat, Rhoads & Germano (1986) developed an or- Fenchel & Riedl 1970), subjective assessment of the ganism-sediment index (OSI), which is calculated from fauna1 successional stages (similar to the example in the SPIs combined with measurements of dissolved our Fig. l), and the presence or absence of sedirnen- oxygen over the bottom sediment. In addition to oxy- tary methane. The index ranges between -10 and + 11. gen recordings, their index is based on the mean ap- In a recent paper, Nilsson & Rosenberg (1997) sug-
Nilsson & Rosenberg: Response of m a m e benthos to oxygen deficiency 141
gested another method for assessing successional stages of the benthic habitat, whereby surface and sub- surface structures together with the mean depth of the apparent RPD are assessed and summarised as a benthic-habitat quality (BHQ) index, ranging between 0 and 15 (Table 1). The BHQ index is related to the faunal successional stages in Fig. 1, and we will de- monstrate in our study that it is correlated with SAB curves.
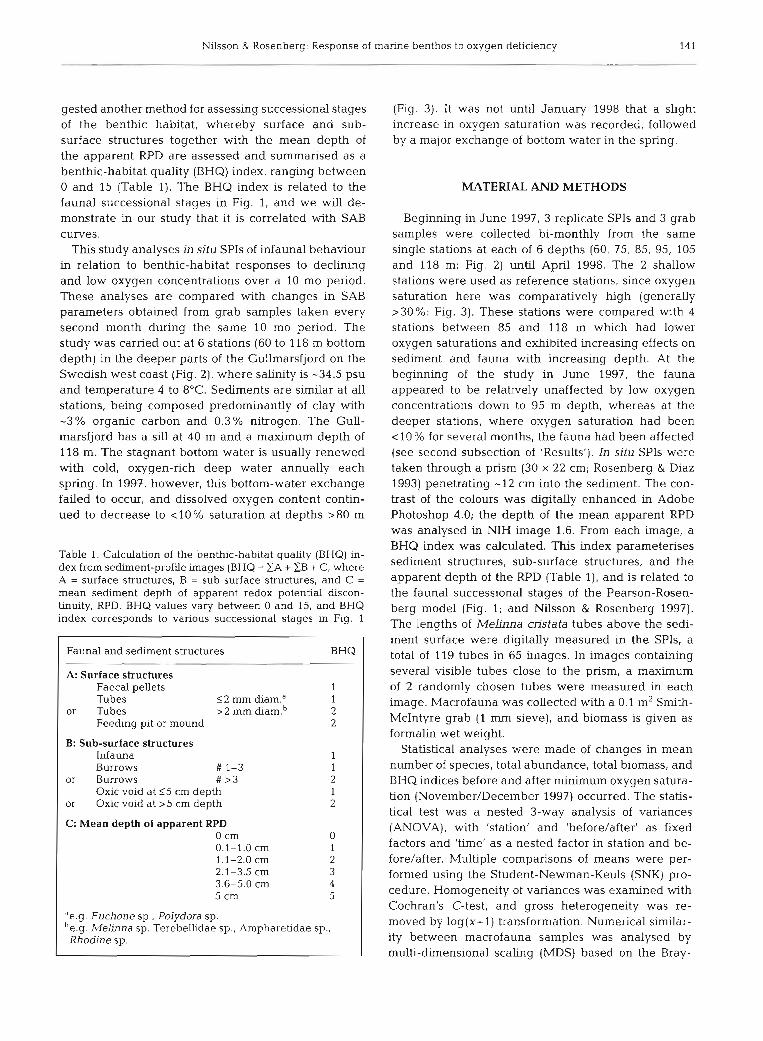
This study analyses in situ SPIs of infaunal behaviour in relation to benthic-habitat responses to declining and low oxygen concentrations over a 10 mo period. These analyses are compared with changes in SAB parameters obtained from grab samples taken every second month during the same 10 mo period. The study was carried out at 6 stations (60 to 118 m bottom depth) in the deeper parts of the Gullmarsfjord on the Swedish west coast (Fig. 2), where salinity is -34.5 psu and temperature 4 to 8°C. Sediments are similar at all stations, being composed predominantly of clay with -3% organic carbon and 0.3% nitrogen. The Gull- marsfjord has a sill at 40 m and a maximum depth of 118 m. The stagnant bottom water is usually renewed with cold, oxygen-rich deep water annually each spring. In 1997, however, this bottom-water exchange failed to occur, and dissolved oxygen content contin- ued to decrease to 110% saturation at depths >80 m
Table 1. Calculation of the benthic-habitat quality (BHQ) in- dex from sedunent-profile images (BHQ = + CB + C, where A = surface structures, B = sub-surface structures, and C = mean sediment depth of apparent redox potential discon- tinuity, RPD. BHQ values vary between 0 and 15, and BHQ index corresponds to various successional stages in Fig. 1
Fauna1 and sediment structures BHQ
A: Surface structures Faecal pellets 1 Tubes 52 mm diam.a 1
or Tubes > 2 mm diam.b 2 Feeding pit or mound 2
B: Sub-surface structures Infauna Burrows # 1-3
or Burrows # >3 Oxic void at 15 cm depth
or Oxic void at >5 cm depth
C: Mean depth of apparent RPD 0 cm 0 0.1-1.0 cm 1 1.1-2.0 cm 2 2.1-3.5 cm 3 3.6-5.0 cm 4 5 cm 5
"e.g. Euchone sp., Polydora sp. blelinna sp. Terebellidae sp.. Ampharetidae sp.,
Rhodine sp.
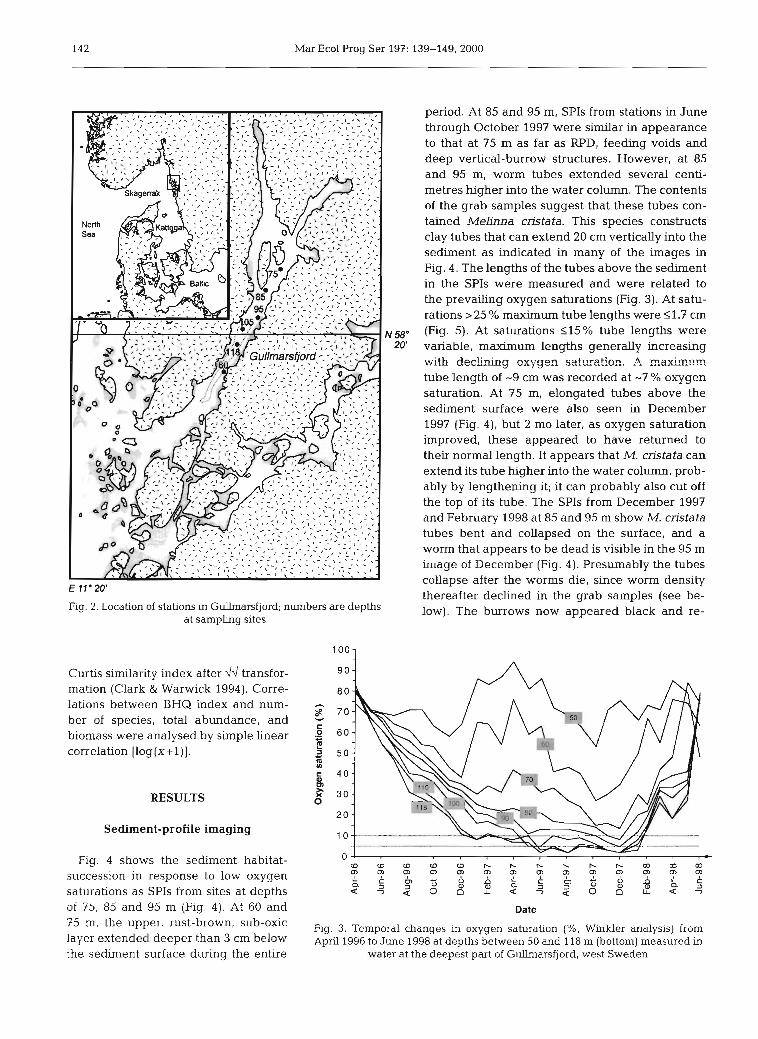
(Fig. 3). I t was not until January 1998 that a slight increase in oxygen saturation was recorded, followed by a major exchange of bottom water in the spring.
MATERIAL AND METHODS
Beginning in June 1997, 3 replicate SPIs and 3 grab samples were collected bi-monthly from the same single stations at each of 6 depths (60, 75, 85, 95, 105 and 118 m: Fig. 2) until April 1998. The 2 shallow stations were used as reference stations, since oxygen saturation here was comparatively high (generally >30%: Fig. 3). These stations were compared with 4 stations between 85 and 118 m whlch had lower oxygen saturations and exhibited increasing effects on sediment and fauna with increasing depth. At the beginning of the study in June 1997, the fauna appeared to be relatively unaffected by low oxygen concentrations down to 95 m depth, whereas at the deeper stations, where oxygen saturation had been <l0 % for several months, the fauna had been affected (see second subsection of 'Results'). In situ SPIs were taken through a prism (30 X 22 cm; Rosenberg & Diaz 1993) penetrating -12 cm into the sediment. The con- trast of the colours was digitally enhanced in Adobe Photoshop 4.0; the depth of the mean apparent RPD was analysed in NIH image 1.6. From each image, a BHQ index was calculated. This index parameterises sediment structures, sub-surface structures, and the apparent depth of the RPD (Table l), and is related to the faunal successional stages of the Pearson-Rosen- berg model (Fig. 1; and Nilsson & Rosenberg 1997). The lengths of Melinna cristata tubes above the sedi- ment surface were digitally measured in the SPIs, a total of 119 tubes in 65 images. In images containing several visible tubes close to the prism, a maximum of 2 randomly chosen tubes were measured in each image. Macrofauna was collected with a 0.1 m2 Smith- McIntyre grab (1 mm sieve), and biomass is given as formalin wet weight.
Statistical analyses were made of changes in mean number of species, total abundance, total biomass, and BHQ indices before and after minimum oxygen satura- tion (November/December 1997) occurred. The statis- tical test was a nested 3-way analysis of variances (ANOVA), with 'station' and 'before/afterl as fixed factors and 'time' as a nested factor in station and be- fore/after. Multiple comparisons of means were per- formed using the Student-Newman-Keuls (SNK) pro- cedure. Homogeneity of variances was examined with Cochran's C-test, and gross heterogeneity was re- moved by log(x+l) transformation. Numerical sirnilar- ity between macrofauna samples was analysed by multi-dimensional scaling (MDS) based on the Bray-
142 Mar Ecol Prog Ser 197: 139-149, 2000
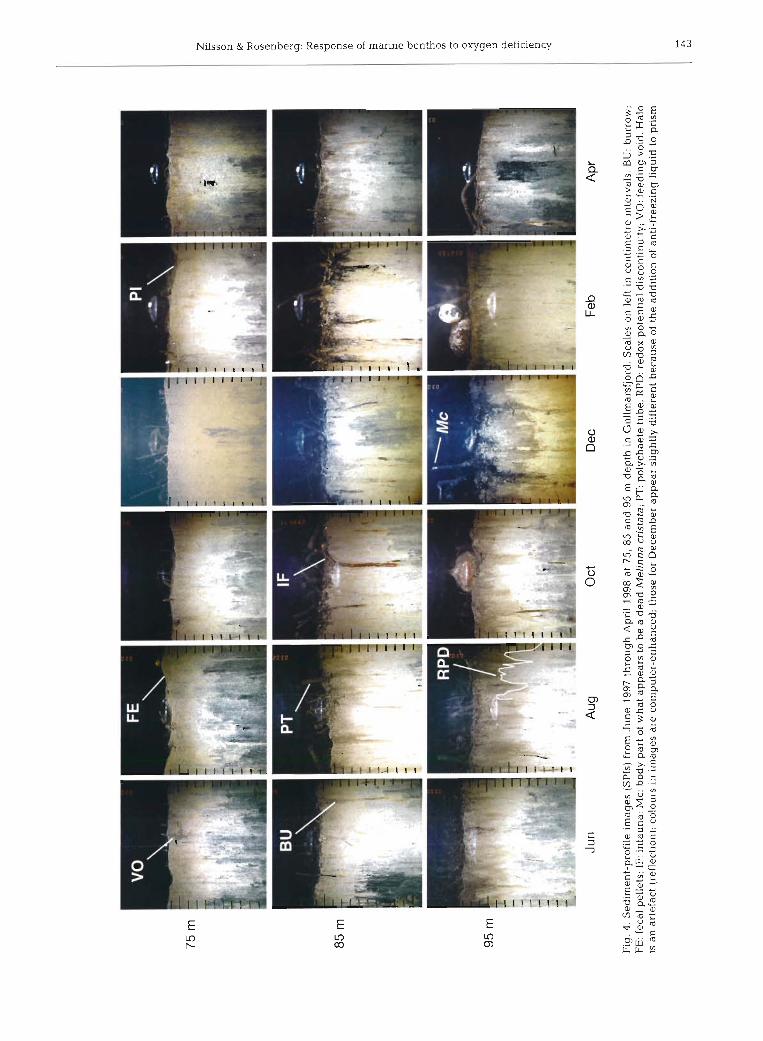
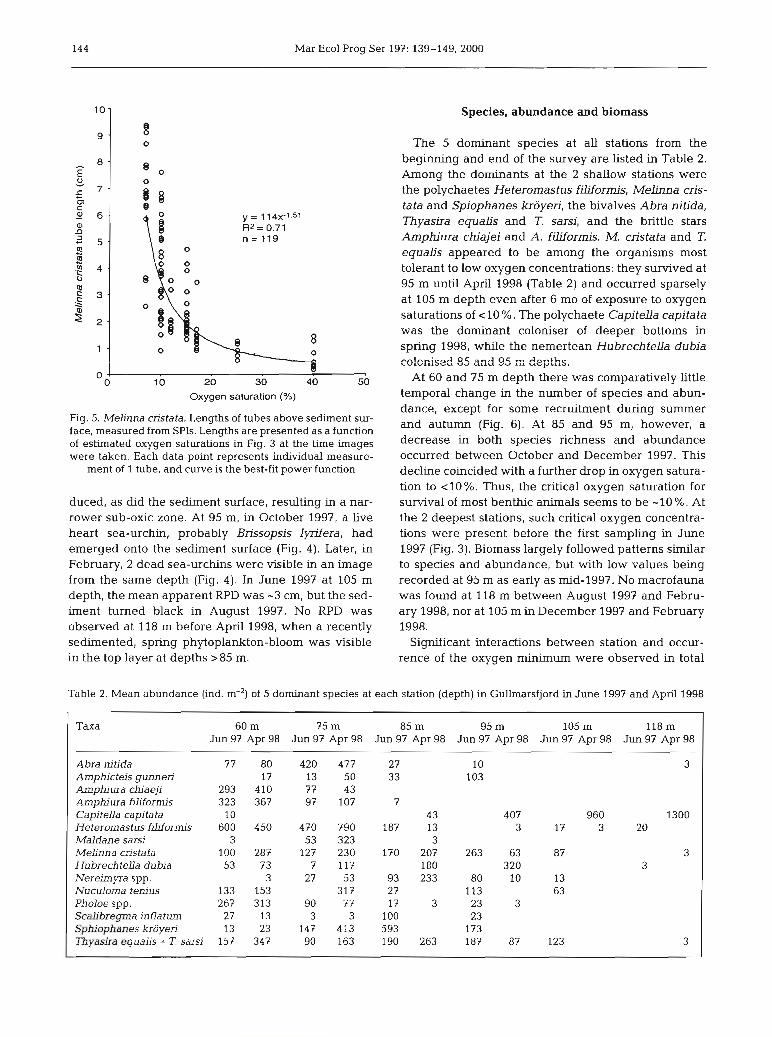
period. At 85 and 95 m, SPIs from stations in June through October 1997 were similar in appearance to that at 75 m as far as RPD, feeding voids and deep vertical-burrow structures. However, at 85 and 95 m, worm tubes extended several centi- metres higher into the water column. The contents of the grab samples suggest that these tubes con- tained Melinna cristata. This species constructs clay tubes that can extend 20 cm vertically into the sediment as indicated in many of the images in Fig. 4. The lengths of the tubes above the sediment in the SPIs were measured and were related to the prevailing oxygen saturations (Fig. 3). At satu- rations > 25 % maximum tube lengths were S1.7 cm
,,, 580 (Fig. 5). At saturations 115 % tube lengths were 20' variable, maximum lengths generally increasing
with deckix,j cxJgen satuation. A m a x k m tube length of -9 cm was recorded at -7 % oxygen saturation. At 75 m, elongated tubes above the sediment surface were also seen in December 1997 (Fig, 4), but 2 mo later, as oxygen saturation improved, these appeared to have returned to their normal length. It appears that M. cristata can extend its tube higher into the water column, prob- ably by lengthening it; it can probably also cut off the top of its tube. The SPIs from December 1997 and February 1998 at 85 and 95 m show M. cristata tubes bent and collapsed on the surface, and a worm that appears to be dead is visible in the 95 m image of December (Fig. 4). Presumably the tubes collapse after the worms die, since worm density
E 11' 20' thereafter declined in the grab samples (see be-
Fig. 2. Location of stations in Gullmarsfjord; numbers are depths low). The burrows now appeared black and re- at sampling sites
Curtis similarity index after dd transfor- mation (Clark & Warwick 1994). Corre- lations between BHQ index and num- ber of species, total abundance, and biomass were analysed by simple linear correlation [log (x+l)] .
RESULTS
Sediment-profile imaging
Fig. 4 shows the sediment habitat- succession in response to low oxygen saturations as SPIs from sites at depths of 75, 85 and 95 m (Fig. 4). At 60 and 75 m, the upper, rust-brown, sub-oxic layer extended deeper than 3 cm below the sediment surface during the entire
Date
Fig. 3. Temporal changes in oxygen saturation (%, Winkler analysis) from April 1996 to June 1998 at depths between 50 and 118 m (bottom) measured in
water at the deepest part of Gullnlarsfjord, west Sweden
Jun
Oct
D
ec
Feb
A
P~
Fig
. 4.
Sed
imen
t-pr
ofil
e im
ages
(S
Pls
) fro
m J
un
e 19
97 t
hrou
gh A
pril
199
8 at
75,
85
an
d 9
5 m
dep
th i
n G
ullm
arsf
jord
. S
cale
s on
lef
t in
cen
tim
etre
int
erva
ls.
BU
: bu
rrow
; F
E:
feca
l pel
lets
; IF:
in
fau
na;
MC
: bod
y p
art
of w
hat
ap
pea
rs to
be
a d
ead
Mel
inna
cri
stat
a; P
T: p
olyc
haet
e tu
be;
RPD
: red
ox p
oten
tial
dis
cont
inui
ty;
VO
: fee
ding
voi
d. H
alo
is a
n a
rtef
act
(ref
lect
ion)
; col
ours
in
imag
es a
re c
om
pu
ter-
enh
ance
d; t
hose
for
Dec
embe
r ap
pea
r sl
ight
ly d
iffe
rent
bec
ause
of
the
addi
tion
of
anti
-fre
ezin
g li
quid
to
pris
m
144 Mar Ecol Prog Ser 197: 139-149, 2000
Oxygen saturation (%)
Species, abundance and biomass
The 5 dominant species at all stations from the beginning and end of the survey are listed in Table 2. Among the dominants at the 2 shallow stations were the polychaetes Heteromastus filiformis, Melinna cris- tata and Spiophanes kroyen, the bivalves Abra nitida, Thyasira equalis and T. sarsi, and the brittle stars Amphiura chiajei and A. filiforrnis. M. cristata and T. equalis appeared to be among the organisms most tolerant to low oxygen concentrations: they survived at 95 m until April 1998 (Table 2) and occurred sparsely at 105 m depth even after 6 mo of exposure to oxygen saturations of ~ 1 0 % . The polychaete Capitella capitata was the dominant coloniser of deeper bottoms in spring 1998, while the nemertean Hubrechtella dubia colonised 85 and 95 r=, depths.
At 60 and 75 m depth there was comparatively little temporal change in the number of species and abun- - - dance, except for some recruitment during summer
Fig. 5. Melinna cristata. Lengths of tubes above sediment sur- face, measured from SPIs. Lengths are presented as a function and autumn (Fig. 6). At 85 and 95 m, however, a
of estimated oxygen saturations in Fig. 3 at the time images decrease in both species richness and abundance were taken. Each data point represents individual measure- occurred between October and December 1997. This
ment of 1 tube, and curve is the best-fit power function
duced, as did the sediment surface, resulting in a nar- rower sub-oxic zone. At 95 m, in October 1997, a live heart sea-urchin, probably Brissopsis lynfera, had emerged onto the sediment surface (Fig. 4 ) . Later, in February, 2 dead sea-urchins were visible in an image from the same depth (Fig. 4). In June 1997 at 105 m depth, the mean apparent RPD was -3 cm, but the sed- iment turned black in August 1997. No RPD was observed at 118 m before April 1998, when a recently sedirnented, spring phytoplankton-bloom was visible in the top layer at depths >85 m.
decline coincided with a further drop in oxygen satura- tion to 110%. Thus, the critical oxygen saturation for survival of most benthic animals seems to be -10%. At the 2 deepest stations, such critical oxygen concentra- tions were present before the first sampling in June 1997 (Fig. 3). Biomass largely followed patterns similar to species and abundance, but with low values being recorded at 95 m as early as mid-1997. No macrofauna was found at 118 m between August 1997 and Febru- ary 1998, nor at 105 m in December 1997 and February 1998.
Significant interactions between station and occur- rence of the oxygen minimum were observed in total
Table 2. Mean abundance (ind. m-') of 5 dominant species at each station (depth) in Gullmarsfjord in June 1997 and April 1998
Taxa 60 m 75 m 85 m 95 m 105 m 118 m Jun 97 Apr 98 Jun 97 Apr 98 Jun 97 Apr 98 Jun 97 Apr 98 Jun 97 Apr 98 Jun 97 Apr 98
Abra nitida 77 80 420 477 27 10 3 Amphicteis gunneri 17 13 50 33 103 Amphi ura chiaeji 293 410 77 43 Amphiura fddorm's 323 367 97 107 7 Capitella capitata 10 43 4 07 1300 HeteromastusfiLiformis 600 450 470 790 187 13 3 20 Maldane sarsi 3 53 323 3 M e h n a crista ta 100 287 127 230 170 207 263 63 3 Hubrechtella dubia 53 73 7 117 180 320 Nereimyra spp. 3 27 53 93 233 80 10 Nuculoma tenius 133 153 317 27 113 Pholoe spp. 267 313 90 77 17 3 23 3 Scalibregma inf7a turn 27 13 3 3 100 23 Sphiophanes kroyeri 13 23 147 413 593 173 Thyasira equalis + T. sarsi 153 347 90 163 190 263 187 87 123 3
Nilsson & Rosenberg: Response of marine benthos to oxygen deficiency 145
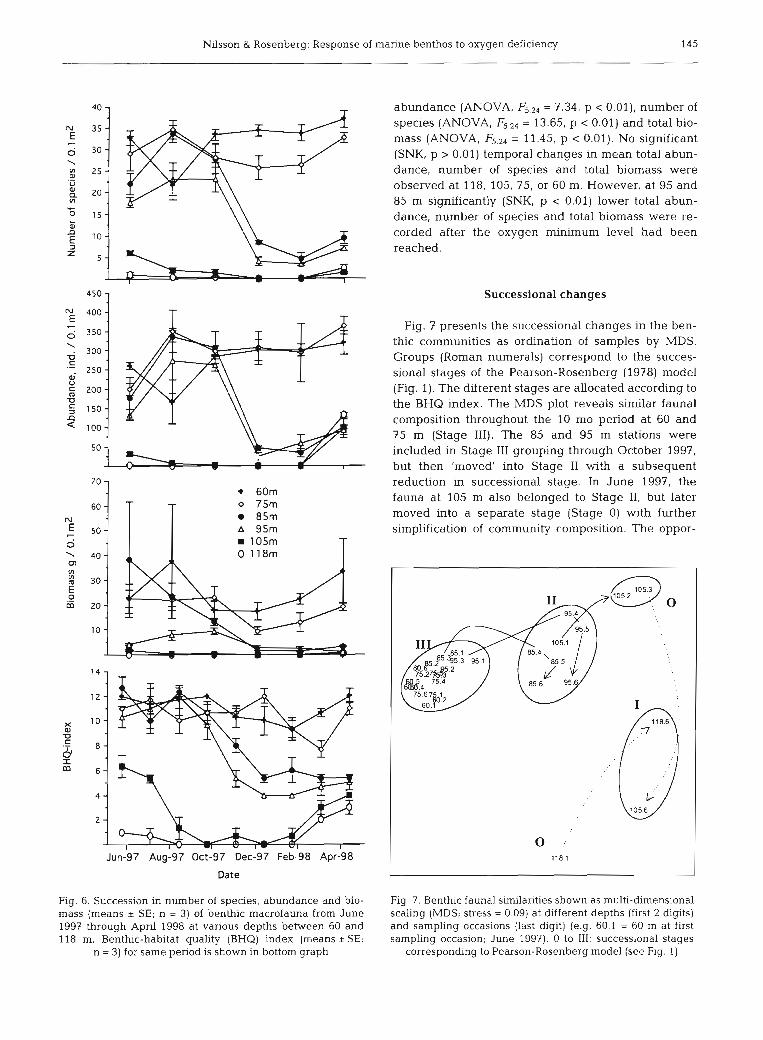
abundance (ANOVA, = 7.34, p c 0.01), number of species (ANOVA, F5.24 = 13.65, p < 0.01) and total bio- mass (ANOVA, F5.24 = 11.45, p < 0.01). NO significant (SNK, p > 0.01) temporal changes in mean total abun- dance, number of species and total biomass were observed at 118, 105, 75, or 60 m. However, at 95 and 85 m significantly (SNK, p < 0.01) lower total abun- dance, number of species and total biomass were re- corded after the oxygen minimum level had been
Z reached.
C
E zoo W
50
Successional changes
7
Fig. 7 presents the successional changes in the ben- thic communities as ordination of samples by MDS. Groups (Roman numerals) correspond to the succes- sional stages of the Pearson-Rosenberg (1978) model (Fig. 1). The different stages are allocated according to the BHQ index. The MDS plot reveals similar faunal composition throughout the 10 mo period at 60 and 75 m (Stage 111). The 85 and 95 m stations were included in Stage I11 grouping through October 1997, but then 'moved' into Stage I1 with a subsequent reduction in successional stage. In June 1997, the fauna at 105 m also belonged to Stage 11, but later moved into a separate stage (Stage 0) with further simplification of community composition. The oppor-
Date I I
Fig. 6. Succession in number of species, abundance and bio- Fig. 7. Benthic faunal similarities shown as multi-dimensional mass (means i SE; n = 3) of benthic macrofauna from June scaling (MDS; stress = 0.09) at different depths (first 2 digits) 1997 through April 1998 at various depths between 60 and and sampling occasions (last digit) (e.g. 60.1 = 60 m at first 118 m. Benthic-habitat quality (BHQ) index (means +SE; sampling occasion; June 1997). 0 to 111: successional stages
n = 3) for same period is shown in bottom graph correspondng to Pearson-Rosenberg model (see Fig. 1)
Mar Ecol Prog Ser 197: 139-149, 2000
tunistic polychaete Capitella capitata was the initial and dominant coloniser in April 1998 at the 2 deep stations when oxygen had increased to >20% satu- ration (Stage I).
BHQ index and correlations with number of species, abundance and biomass
We used the SPIs to assess benthic-habitat quality with the BHQ index (which parameterises animal and sediment structures) and the depth of the mean appar- ent RPD observed in the images (Table 1). The mean BHQ index was high (>10) at the 2 shallow stations, except for samples taken in March 1998 (Fig. 6). At the 2 stations at intermediate depths, similar high BHQ indices were observed until December 1997, followed by a decline. At the 2 deepest stations, significantly lower BHQ indices were observed as early as in June 1997. In March and April 1998, however, the low BHQ index at the 2 deepest stations increased in parallel to an improvement in the habitat as a response to re- oxygenation of the bottom water to >20 % saturation. A significant interaction (ANOVA, F5.36 = 4.65, p c 0.01) between station and before/after the oxygen minimum was observed in the BHQ indices. No significant (SNK, p > 0.01) temporal changes in mean BHQ indices were observed at 118, 105, 75, or 60 m. However, at 95 and 85 m significantly (SNK, p c 0.01) lower BHQ indices were measured after the oxygen minimum level had
BHQ 0 2 4 10 15
Successional stage I I1 111
Fig. 8. Succession in number of species, total abundance and biomass (means 2 SD) in Gullmarsfjord between June 1977 and Apnl 1998 based on MDS plot and BHQ index. Curves drawn to scale accordmg to Pearson-Rosenberg model (Fig. 1)
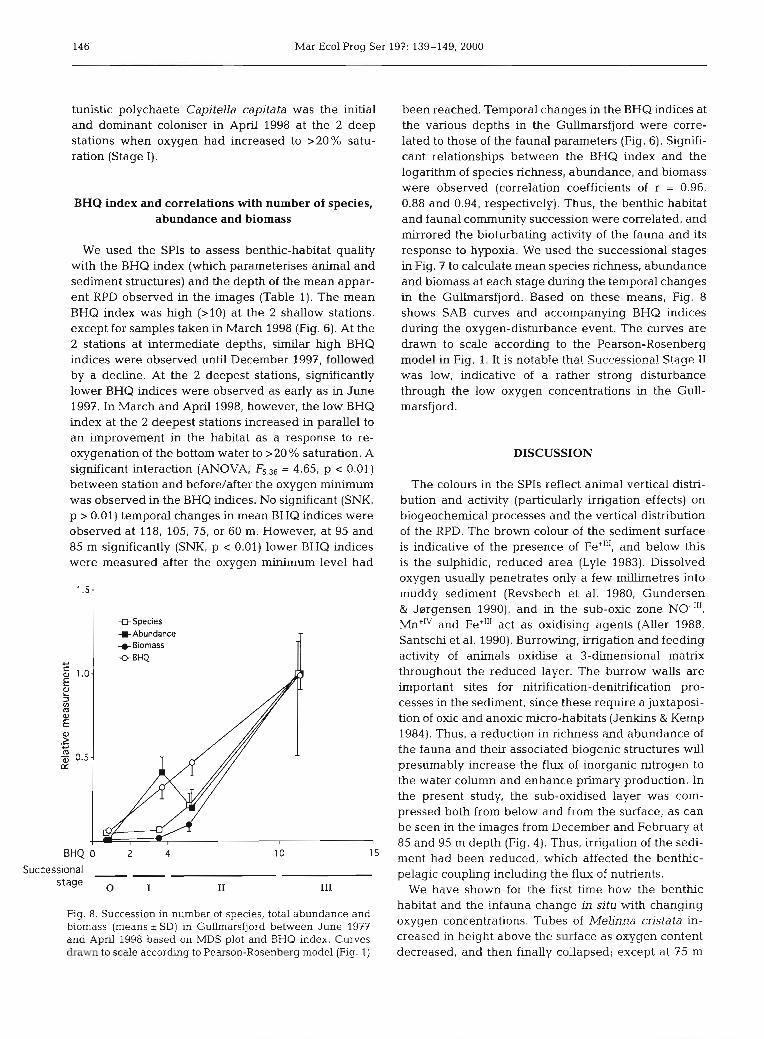
been reached. Temporal changes in the BHQ indices at the various depths in the Gullrnarsfjord were corre- lated to those of the faunal parameters (Fig. 6). Signifi- cant relationships between the BHQ index and the logarithm of species richness, abundance, and biomass were observed (correlation coefficients of r = 0.96, 0.88 and 0.94, respectively). Thus, the benthic habitat and faunal community succession were correlated, and mirrored the bioturbating activity of the fauna and its response to hypoxia. We used the successional stages in Fig. 7 to calculate mean species richness, abundance and biomass at each stage during the temporal changes in the Gullrnarsfjord. Based on these means, Fig. 8 shows SAB curves and accompanying BHQ indices during the oxygen-disturbance event. The curves are drawn to scale according to the Pearson-Rosenberg model in Fig. 1. It is notable that Successior?a! Stage I! was low, indicative of a rather strong disturbance through the low oxygen concentrations in the Gull- marsfjord.
DISCUSSION
The colours in the SPIs reflect animal vertical distri- bution and activity (particularly irrigation effects) on biogeochernical processes and the vertical distribution of the RPD. The brown colour of the sediment surface is indicative of the presence of Fe+"', and below this is the sulphidic, reduced area (Lyle 1983). Dissolved oxygen usually penetrates only a few millimetres into muddy sediment (Revsbech et al. 1980, Gundersen & J~lrgensen 1990), and in the sub-oxic zone NO-"', Mn+IV and Fe+"' act as oxidising agents (Aller 1988, Santschi et al. 1990). Burrowing, irrigation and feeding activity of animals oxidise a 3-dimensional matrix throughout the reduced layer. The burrow walls are important sites for nitrification-denitrification pro- cesses in the sediment, since these require a juxtaposi- tion of oxic and anoxic micro-habitats (Jenkins & Kemp 1984). Thus, a reduction in richness and abundance of the fauna and their associated biogenic structures will presumably increase the flux of inorganic nitrogen to the water column and enhance primary production. In the present study, the sub-oxidised layer was com- pressed both from below and from the surface, as can be seen in the images from December and February at 85 and 95 m depth (Fig. 4). Thus, irrigation of the sedi- ment had been reduced, which affected the benthic- pelagic coupling including the flux of nutrients.
We have shown for the first time how the benthic habitat and the infauna change in situ with changing oxygen concentrations. Tubes of Melinna cristata in- creased in height above the surface as oxygen content decreased, and then finally collapsed; except at 75 m
Nilsson & Rosenberg: Response of marine benthos to oxygen deficiency 147
depth, where they seemed to recover. M. cristata can probably lengthen and shorten its tube in response to variations in the ambient oxygen micro-climate. Long tube structures will induce turbulence in the near- bottom water layer, which may increase the oxygen supply to the viscous sublayer next to the sediment surface (Eckman & Nowell 1984, Gundersen & Jm- gensen 1990). Other infaunal species have also de- monstrated changes in positioning of tubes or burrow structures in response to critical oxygen concentra- tions; e.g. the polychaete Pectinaria koreni pushes its tube above the sediment surface (Nilsson & Rosenberg 1994), and the amphipod Corophium volutator extents its burrow higher above the mud surface (Eriksson & Weeks 1994). Similarly, under conditions of oxygen deficiency, the polychaete Malacoceros fuliginosa has been observed to stretch its body from the sediment surface high up mto the overlying water (Tyson &
Pearson 1991), and the brittle stars Amphiura chiajei (Stachowitsch 1984) and Ophiura albida (Baden et al. 1990), to aggregate in elevated regions of sediment, where presumably the oxygen concentration is some- what greater than in surrounding, flatter areas.
Elimination of macrofauna from the deepest bottoms (1 18 m) of the Gullmarsfjord as a result of low oxygen concentrations has been demonstrated on an earlier occasion: in the winter of 1979/1980 by Josefson & Widbom (1988), who recorded some of the last sur- vivors as Heteromastus filrformis, Thyasira equalis, T. sarsi, and Melinna cristata, i.e. the same species that we found to be most tolerant to hypoxia in the present investigation. We suggest that the 3 last-mentioned species should be added to the List of species resistant to severe hypoxia (summarised by Diaz & Rosenberg 1995). Infaunal dominants in the present study and in that of Josefson K Widbom (1988) were the same and consistent over the depths investigated (Table 2) . Oxy- gen concentrations in the deeper part of the Gullrnars- fjord show a clear seasonal trend, with annually rather low (<2 m1 O2 1-l) concentrations ( 0 . Lindahl pers. comm.); however such low concentrations for such a long period as in 1997/1998 have never been reported before. Our results suggest that the populations are pre-conditioned to hypoxia. As the oxygen conditions improved, the cosmopolitan opportunistic coloniser Capitella capitata was the first to appear in the deeper defaunated sediment; this was also the case in 1980 (Josefson & Widbom 1988). The present study of long- term hypoxia indicates a critical oxygen saturation for survival of -10% (=0.7 m1 O2 1-l), since at about this saturation great reductions in density and species rich- ness occurred at 85 and 95 m depth a.t the end of 1997. This critical value IS slightly lower than that reported for predominantly coastal areas, but higher than reported for upwelling areas (Diaz & Rosenberg 1995)
in which species have become adapted to permanently low oxygen concentrations for long periods.
The MDS (Fig. 7) shows the benthic community suc- cession in relation to changing oxygen concentrations over time. Should oxygen saturations over the coming years remain rather high, say with minimum satura- tions of >25 %, it is likely that the community structure at all depths would return to the original equilibrium stage as shown for Stage I11 in Fig. 7. This type of com- munity was also found at 118 m in 1977 to 1979 by Josefson & Widbom (1988). The recovery of benthic fauna was studied previously in an inner branch of the Gullmarsfjord. In these heavily enriched and defau- nated sediments, recovery to an equilibrium stage took 5 to 8 yr following pollution abatement (Rosenberg 1976). We suggest that the recovery is quicker in the deep part of the Gullmarsfjord because the sediment there is less organically enriched.
The changes in the benthic community showed clear similarities to the Pearson-Rosenberg model (Fig. l), but hypoxia had a rather sudden and strong negative effect at the 2 intermediate depths in the Gullmars- fjord. As a result, the SAB curves were low in relation to the BHQ index (Fig. 8). The 'buffering capacity' of the sediment in conditions of low oxygen concentration may arise from the fact that diminishment of the RPD layer is a slow process compared to the rather abrupt effects of decreased oxygen content on fauna.
Correlations have been demonstrated between the SAB curves and the BHQ index; thus changes in ben- thic habitat quality closely parallel changes in fauna1 community succession. The strongest correlation was for number of species and the BHQ index. This would be expected, since the species curve increases rather smoothly from Seral Stage 0 to I11 (Fig. 1). In their pioneering study with SPI, Rhoads & Germano (1982) also found that species richness generally corresponded to that inferred from in situ photos. In contrast, abun- dance and biomass may show peaks ('peaks of oppor- tunists': Pearson & Rosenberg 1978) in Seral Stage I, which would reduce the correlation. The OS1 devel- oped by Rhoads & Germano (1986) has been used in some studies to map habitat-quality (Rhoads & Ger- man0 1986), to assess physical disturbances and or- ganic enrichment (Valente et al. 1992), and to evaluate the effects of mariculture (O'Connor et al. 1989). In the 2 latter studies, low values of apparent RPD were cor- related with low OSIs. Similarly, Nilsson & Rosenberg (1997) found that the distribution of RPD corresponded well with benthic successional stages. One difference between the OS1 and the BHQ index is that in the for- mer the successional stages are determined by exam- ining the images by eye whereas in the BHQ index, different structures in the images are scored and their summary relates to a particular sera1 stage (Fig. 1).
148 Mar Ecol Prog Ser 197: 139-149, 2000
The variables in the BHQ index seem to constitute an accurate description of a benthic habitat that reflects the successional stages of a benthic community. In this and a related study (Nilsson & Rosenberg 1997), such correspondence has been demonstrated for coastal, oxygen-stressed areas, but the BHQ index is Likely to be useful also in other areas where the Pearson- Rosenberg succession model is applicable. From a benthic study in New Jersey, USA, Grizzle & Penniman (1991) concluded that SPI data are as useful as tradi- tional data in delimiting the spatial extent of benthos effected by pollution. Thus, the BHQ index is useful as a cost-effective sediment-habitat classification and in disturbance-impact assessment.
Aclu?owledgen?~n!s. We thank Odd Lindahl for allowing access to the oxygen recordings made withm the Gullmars- fjord Control Programme, Drs Alf Josefson and Tom Pearson for comments on this manuscript, Dr Robert Diaz for discus- sions, and Birthe Hellman, Pia Engstrom and Stefan Agrenius for technical assistance. Financial support was given by the Swedish Natural Research Council and the Swedish Environ- mental Protection Agency.
LITERATURE CITED
Aller RC (1988) Benthic fauna and biogeochernical processes in marine sediments: the role of burrow structures. In: Blackburn TH, Ssrensen J (eds) Nitrogen cycling in coastal marine environments. John Wiley & Sons Ltd, Chicester, p 301-338
Baden SP, Loo LO, Pihl L, Rosenberg R (1990) Effects of eutrophication on benthic communities including fish- Swehsh west coast. Arnbio 19:113-122
Bonsdorff E, Diaz RJ, Rosenberg R, Norkko A. Cutter GRJ (1996) Characterization of soft-bottom benthic habitats of the &and Islands, northern Baltic Sea. Mar Ecol Prog Ser 142:235-245
Caddy JF (1993) Toward a comparative evaluation of human impacts on fishery ecosystems of enclosed and semi- enclosed seas. Rev Fish Sci 1:57-95
Clark KR, Warwick RM (1994) Change in marine communi- ties: an approach to statistical analysis and interpretation. National Environment Research Council, Plymouth
Dethlefsen V, von Westernhagen H (1983) Oxygen deficiency and effects on bottom fauna in the eastern German Bight 1982. Meeresforsch Rep Mar Res 60:42-53
Diaz RJ, Rosenberg R (1995) Marine benthlc hypoxia-review of ecological effects and behavioural responses of marine macrofauna. Oceanogr Mar Biol Annu Rev 33:245-303
Eckman JE, Nowell RM (1984) Boundary skin friction and sediment transport about an animal-tube mimic. Sedimen- t010gy 31:851-862
Eriksson SP, Weeks JM (1994) Effects of copper and hypoxia on two populations of the benthic amphipod Corophium volutator (Pallas). Aquat Toxic 29:73-81
Fenchel TM, Riedl RJ (1970) The sulphide system: a new biotic community underneath the oxidized layer of marine sand bottoms. Mar Biol 7:255-268
Grizzle RE, Penniman CA (1991) Effects of organic enrich- ment on estuarine macrofaunal benthos: a comparison of
sediment profile imaging and traditional methods. Mar Ecol Prog Ser 74:249-262
Gundersen JK, Jsrgensen BB (1990) Microstructure of diffu- sive boundary layers and the oxygen uptake of the sea floor. Nature, Lond 345604-607
Heip C (1995) Eutrophication and zoobenthos dynamics. Ophelia 41:113-136
Howarth RW, Billen G, Swaney D, Townsend A, Jaworski N, Lajtha K, Downing JA, Elmgren R, Caraco N, Jordan T, Berendse F, Freney J, Kudeyarov V, Murdoch P, Zhu ZL (1996) Regional nitrogen budgets and riverine N & P fluxes for the drainages to the North Atlantic Ocean: nat- ural and human influences. Biogeochemistry 3575-139
Jenluns MC, Kemp WM (1984) The coupling of nitrification and denitrification in two estuarine sedirnents. Limnol Oceanogr 29:609-619
Josefson AB, Widbom B (1988) Differential response of ben- thic macrofauna and meiofauna to hypoxia in the Gullmar Fjord basin. Mar Biol 100:31-40
Lyle M (1983) The brown-green color in marine sediments: a marker of the ~ e ( " ) - ~ e ( " ) redox boundary. Limnol Ocean- ogr 28:1026-1033
Nilsson HC, Rosenberg R (1994) Hypoxic response of two marine benthlc communities. Mar Ecol Prog Ser 115: 209-217
Nilsson HC, Rosenberg R (1997) Benthic habitat quality as- sessment of an oxygen stressed fjord by surface and sedi- ment profile images. J Mar Syst 11:249-264
Nixon SW (1995) Coastal marine eutrophication: a definition, social causes, and future concerns. Ophelia 41:199-219
O'Comor BDS, Costolloe J, Keegan BF, Rhoads DC (1989) The use of REMOTS technology in monitoring coastal enrichment resulting from maricultu~e. Mar Pollut Bull 20: 384-390
Pearson TH, Rosenberg R (1978) Macrobenthic succession in relation to organic enrichment and pollution of the marine environment. Oceanogr Mar Biol Annu Rev 16:229-311
Revsbech NP, Ssrensen J , Blackburn TH (1980) Distribution of oxygen in marine sedirnents measured with micro- electrodes. Limnol Oceanogr 25403-411
Rhoads DC, Cande S (1971) Sediment profile camera for in situ study of organism-sediment relations. Limnol Ocean- ogr 16:110-114
Rhoads DC, Germano JD (1982) Charecterization of organ- ism-sediment relations using sediment profile imaging: a n efficient method of remote ecological monitoring of the seafloor. Mar Ecol Prog Ser 8:115-128
Rhoads DC, Germano JD (1986) Interpreting long-term changes in benthic community structure: a new protocol. Hydrobiologia 142:291-308
Rosenberg R (1976) Benthic fauna1 dynamics during succes- sion following pollution abatement in a Swedish estuary. Oikos 2?:414-427
Rosenberg R (1985) Eutrophication-the future marine coastal nuisance? Mar Pollut Bull 16:227-231
Rosenberg R, Diaz RJ (1993) Sulfur bacteria (Beggiatoa spp.) mats indicate hypoxic conditions in the inner Stockholm Archipelago. Anlbio 22:32-36
Rumohr H (1993) Erfahrungen und Ergebnisse aus 7 Jahren Benthosmonitoring in der siidlichen Ostsee. In: Duinker JC (ed) Das Biologische Monitoring der Ostsee im Insti- tut fiir Meereskunde Kiel 1985-1992. Inst Meereskunde Christian-Albrechts-Universitat, Kiel, p 90-109
Rumohr H, Schomann H (1992) REMOTS sediment profiles around an exploratory drilling rig in the southern North Sea. Mar Ecol Prog Ser 91:303-311
Santschi P, Hohener P, Benoit G, Buchholtz-ten M (1990)

N~lsson & Rosenberg: Response of marine benthos to oxygen deficiency 149
Chemical processes at the sediment-water interface. Mar Chem 30:269-315
Schaffner LC, Jonsson P, Diaz RJ , Rosenberg R, Gapcynski P (1992) Benthic communities and bioturbation history of estuarine and coastal systems: effects of hypoxia and anoxia. In: Vollenweider RA, Marchetti R, Viviani R (eds) Marine coastal eutrophication. Elsevier, Amsterdam, p 1001-1016
Stachowitsch M (1984) Mass mortality in the Gulf of Tneste:
Editorial responsibility: Otto Kinne (Editor), Oldendorf/Luhe, Germany
the cource of community destruction. Pub1 Stn Zoo1 Napoli (I: Mar Ecol) 5:243-264
Tyson RV, Pearson TH (1991) Modern and ancient continental shelf anoxia: an overview. In : Tyson RV, Pearson TH (eds) Modern and ancient continental shelf. The Geological Soc, London, p 1-24
Valente RM, Rhoads DC, Germano JD (1992) Mapping of benthic enrichment patterns in Narragansett Bay, Rhode Island. Estuaries 15:l-17
Submitted: April 20, 1999; Accepted: November 22, 1999 Proofs received from author(s): April 17, 2000