Embed Size (px)
Citation preview

ChemicalScience
EDGE ARTICLE
Ope
n A
cces
s A
rtic
le. P
ublis
hed
on 0
6 O
ctob
er 2
020.
Dow
nloa
ded
on 4
/4/2
022
7:27
:56
AM
. T
his
artic
le is
lice
nsed
und
er a
Cre
ativ
e C
omm
ons
Attr
ibut
ion-
Non
Com
mer
cial
3.0
Unp
orte
d L
icen
ce.
View Article OnlineView Journal | View Issue
In situ visualizati
College of Chemistry, Chemical Engineering
Molecular and Nano Probes, Ministry of Edu
Functionalized Probes for Chemical Imaging
Biomedical Sciences, Shandong Normal Univ
China. E-mail: [email protected]; lip@sd
† Electronic supplementary informationcells/mice culture, additional gures. See
Cite this: Chem. Sci., 2020, 11, 12149
All publication charges for this articlehave been paid for by the Royal Societyof Chemistry
Received 24th May 2020Accepted 2nd October 2020
DOI: 10.1039/d0sc02922j
rsc.li/chemical-science
This journal is © The Royal Society o
on of peroxisomal viscosity in theliver of mice with non-alcoholic fatty liver diseaseby near-infrared fluorescence and photoacousticimaging†
Yongqing Zhou, Ping Li, * Xin Wang, Chuanchen Wu, Nannan Fan, Xiaoning Liu,Lijie Wu, Wei Zhang, Wen Zhang, Zhenzhen Liu and Bo Tang *
Non-alcoholic fatty liver disease (NAFLD) can gradually develop into hepatic failure, and early diagnosis is
crucial to improve treatment efficiency. The occurrence of NAFLD is closely related to lipid metabolism.
Peroxisomes act as the first and main site for lipid metabolism in the hepatocytes, so abnormal lipid
metabolism might directly affect peroxisomal viscosity. Herein, we developed a new near-infrared
fluorescence (NIRF) and photoacoustic (PA) imaging probe (PV-1) for the real-time visualization of
peroxisomal viscosity in vivo. This PV-1 encompasses the malononitrile group as the rotor, which emits
strong NIRF (at 705 nm) and PA (at 680 nm) signals when rotation is hindered as viscosity increases.
Through dual-mode imaging, we discovered distinctly higher viscosity in the liver of NAFLD mice for the
first time. We further found the remarkable amelioration of NAFLD upon treatment with N-acetylcysteine
(NAC). Therefore, we anticipate that the PV-1 imaging method is promising for the early diagnosis and
prognostic evaluation of NAFLD.
Introduction
Non-alcoholic fatty liver disease (NAFLD) is one of the mostcommon causes of abnormal liver function. The prevalence ofNAFLD is gradually increasing, with serious consequences tohealth.1,2 If the condition is not diagnosed and treatedpromptly, NAFLD can gradually develop into non-alcoholicsteatohepatitis, cirrhosis, and even hepatocellular carcinoma,resulting in liver death.3–6 Therefore, timely and accurate diag-nosis is crucial to prevent the deterioration of NAFLD. Atpresent, the existing methods of diagnosing NAFLD mainlyinclude liver biopsy,7 serum biochemistry,8 histopathologicalexamination,9 and ultrasonic examination.10 However, most ofthese technologies have drawbacks, such as a high risk, falsepositives, and complicated operation steps.11,12 Therefore, thedevelopment of a real-time, reliable, and non-destructivemethod of early detection may help the timely treatment ofNAFLD, and prevent further development.
Peroxisomes, as the main site of lipid metabolism, playessential roles in maintaining intracellular morphology and
and Materials Science, Key Laboratory of
cation, Collaborative Innovation Center of
in Universities of Shandong, Institutes of
ersity, Jinan 250014, People's Republic of
nu.edu.cn
(ESI) available: Synthetic procedures,DOI: 10.1039/d0sc02922j
f Chemistry 2020
hepatocellular function.13,14 Excessive free fatty acids accumu-late in the peroxisomes when the peroxisomal fatty acid b-oxidation is disordered.15,16 These events can cause a disequi-librium in lipid homeostasis, eventually resulting in NAFLD.17,18
Notably, along with lipid accumulation, the peroxisomalmicroenvironment (including viscosity) can change.19–24 It isspeculated that the peroxisomal viscosity in liver tissues withNAFLD might be different from that in normal liver tissues.25,26
Therefore, establishing a method of accurately monitoringperoxisomal viscosity may help the early identication of thepossible onset of NAFLD.
Near-infrared uorescence (NIRF) imaging technology hasinherent advantages such as high resolution and a non-invasivenature, and has been widely used in the monitoring of bioactivemolecules and the intracellular microenvironment.27–30 NIRFprobes based on molecular motors have been developed todetect viscosity changes inside cells and organelles.31–34
However, limited by their penetration depth, most NIRF probesfail to detect changes of viscosity in the deep tissue. Photo-acoustic (PA) imaging can successfully overcome this short-coming, owing to its greater tissue penetration depth (up to 10.0cm).35,36 In recent years, PA probes have been used for the in situand non-destructive visualization of various active molecules indeep tissues of animals.37–39 Therefore, NIRF and PA dual-modeimaging may accurately detect peroxisomal viscosity in liverdeep tissue, promoting the early diagnosis of NAFLD. To date,
Chem. Sci., 2020, 11, 12149–12156 | 12149

Fig. 1 Ultraviolet spectra (a) and fluorescence spectra (b) of PV-1 (5.0mM) in different solvents, respectively. lex ¼ 650 nm.
Fig. 2 (a) Solvent viscosity-dependent fluorescence changes of PV-1(5.0 mM) in a methanol–glycerol system. (b) Linear relationshipbetween log I705 and log h of PV-1, (c) fluorescence lifetime changesof PV-1 (5.0 mM) in a methanol–glycerol system, (d) linear relationshipbetween log s and log h. lex ¼ 650 nm, lem ¼ 705 nm.
Chemical Science Edge Article
Ope
n A
cces
s A
rtic
le. P
ublis
hed
on 0
6 O
ctob
er 2
020.
Dow
nloa
ded
on 4
/4/2
022
7:27
:56
AM
. T
his
artic
le is
lice
nsed
und
er a
Cre
ativ
e C
omm
ons
Attr
ibut
ion-
Non
Com
mer
cial
3.0
Unp
orte
d L
icen
ce.
View Article Online
no PA probes have been reported for the detection of viscosity inliving animals.
For this purpose, we designed a two-mode (NIRF/PA) smallmolecule probe (PV-1) for peroxisomal viscosity detection. Asshown in Scheme 1, PV-1 is composed of a malononitrile groupas a rotor, a HLKPLQSKL peptide chain as a peroxisomal-targeting group,40–43 and a merocyanine dye as a uorophore.In the non-viscous or low viscosity environment, the rotorrotates freely around the large conjugate structure of the mer-ocyanine dye, which dissipates the excited state energy of thedye by non-radiation.44–48 This process could quench uores-cence of PV-1. As the viscosity increases, the free rotation of therotor is specically restricted, thereby reducing the possibilityof non-radiative. Therefore, uorescence of PV-1 rises at705 nm. At the same time, with the enhanced viscosity, the near-infrared absorbance of PV-1 at about 680 nm is also graduallyelevated. Moreover, PV-1 exhibits a high extinction coefficientand low uorescence quantum yield in glycerol.49 Based onthese properties, PV-1 could be responsive to viscosity viachanges in PA signals. Therefore, PV-1 could emit strong NIRFand PA signals when the viscosity increases. Given that thePAS8P receptor binds and transports HLKPLQSKL on theperoxisomal membrane surface, PV-1 could accumulate in theperoxisomes. Our experimental results show that PV-1possesses good specicity and sensitivity for viscosity by dualmodes. Fluorescence imaging proves that PV-1 could accuratelylocate in the peroxisomes and indicate changes in viscosity.More importantly, by using PV-1, we observed a signicantincrease in peroxisomal viscosity in the liver of NAFLD mousemodels.
Results and discussionPreparation and optical properties of PV-1
The synthesis and characterization of PV-1 are described in theESI.† First, we studied the photophysical properties of PV-1under various environmental viscosities. As shown in theabsorption spectra (Fig. 1a and S1†), it could be seen that PV-1exhibited different NIR absorption peaks in different solvents.Further, PV-1 (5.0 mM) exhibited bright uorescence in glycerol(Fig. S2†). To precisely evaluate the relationship between uo-rescence intensity of PV-1 and environmental viscosity, wegradually increased the media viscosity by adding glycerin into
Scheme 1 Structure of PV-1 and the proposed response mechanism to
12150 | Chem. Sci., 2020, 11, 12149–12156
the methanol–glycerol system, and recorded the uorescenceresponses of PV-1 in different viscosities. As shown in Fig. S3,†the main absorption peak of PV-1 at about 680 nm graduallyincreased with increasing viscosity. As shown in Fig. 2a, theuorescence intensity of PV-1 at 705 nm enhanced continuallyas the ratio of glycerin increased, and reached the highest value(about 25 times) in pure glycerol. There was a good linearrelationship (R2¼ 0.994) between log I705 and log h according tothe Forster–Hoffmann equation (Fig. 2b).50 In addition, theuorescence quantum yield of PV-1 also increased gradually
viscosity.
This journal is © The Royal Society of Chemistry 2020

Edge Article Chemical Science
Ope
n A
cces
s A
rtic
le. P
ublis
hed
on 0
6 O
ctob
er 2
020.
Dow
nloa
ded
on 4
/4/2
022
7:27
:56
AM
. T
his
artic
le is
lice
nsed
und
er a
Cre
ativ
e C
omm
ons
Attr
ibut
ion-
Non
Com
mer
cial
3.0
Unp
orte
d L
icen
ce.
View Article Online
from 0.007 to 0.13 (Table S1†), according to uorescencequantum yield equation.51 Considering that uorescence life-time is an important parameter to study the uorescence proleof PV-1, the uorescence lifetimes of PV-1 in different viscositymedia were measured. Fig. 2c shows that the uorescencelifetime of PV-1 has a similar growth tendency to that of solventviscosity. Furthermore, PV-1 possessed an excellent linear rela-tionship (R2 ¼ 0.999) between log s and log h, increasing from2.0 cp to 643.0 cp (Fig. 2d). Moreover, compared with the stronguorescence of PV-1 in glycerol, its uorescence in solvents withdifferent polarities was negligible. Therefore, the uorescenceintensity of PV-1 was insensitive to polarity changes. Theseresults suggest that PV-1 can detect viscosity with outstandingsensitivity. To further prove the detection mechanism, we alsoconrmed that the uorescence responses of precursor 3 werealso susceptible to viscosity (Fig. S4†).
To clarify the selectivity of PV-1, we studied its uorescenceresponse to peroxisomal substrates. We rst tested the PV-1uorescence response to viscosity in the presence of constitu-ents, including reactive oxygen species (ROS), reactive nitrogenspecies (RNS), reactive sulfur species (RSS), metal ions, andproteins. Experimental results showed that competing speciesand proteins had a negligible impact on the uorescenceresponse of PV-1 (Fig. S5†). The uorescence intensity of PV-1was investigated in different pH conditions. As demonstratedin Fig. S6,† the uorescence intensity of PV-1 remained almostunchanged in 30% glycerol solution under pH 5.0 to 9.0. Toexamine the photostability of PV-1, we recorded the uores-cence spectra of PV-1 in 30% glycerol and phosphate-bufferedsaline (PBS) for 1.0 h. Fig. S7† suggested that the uorescenceintensity of PV-1 in 30% glycerol was signicantly stronger thanthat in PBS. These results indicate that the uorescenceresponse of PV-1 remains stable in a complex and variedviscosity environment. Furthermore, these results conrm thatPV-1 has potential applications in sensing viscosity changeswithin a multicomponent biological environment.
PA properties of PV-1
To study the PA imaging properties of the PV-1, the PA signals ofPV-1 in a series of methanol–glycerol mixed solvents weremeasured subsequently. As Fig. 3a suggested, with increasingglycerol ratio, the PA intensity gradually strengthened at about
Fig. 3 (a) Linear relationship between log PA680 intensity of PV-1 (5.0mM) in a methanol–glycerol system, (b) PA680 intensity of PV-1 (5.0 mM)into various relevant analytes in PBS (pH ¼ 8.2, 10.0 mM). (1) ONOO�;(2) ClO�; (3) H2O2; (4) K
+; (5) Na+; (6) Fe2+; (7) Cu2+; (8) Zn2+; (9) Ca2+;(10) Mg2+; (11) Fe3+; (12) Al3+; (13) blank; (14) glycerol.
This journal is © The Royal Society of Chemistry 2020
680 nm, and a good linear relationship (R2 ¼ 0.991) wasrevealed by tting the Forster–Hoffmann equation. Moreover,we investigated the PA intensity of PV-1 in the presence of somereactive species under physiological conditions. Our results alsorevealed that PV-1 displayed a specic PA signal in glycerol at680 nm compared with other species (Fig. 3b). Altogether, theseresults prove that PV-1 is capable of PA detection of viscositychanges in complex conditions.
Subcellular localization of PV-1
To determine the applicability of PV-1 in a bioimaging experi-ment, we rst tested the cytotoxicity of PV-1 in HL-7702 cellsusing standard 3-(4,5-dimethylthiazol-2-yl)-2,5-diphenyl tetra-zolium bromide (MTT) assay.52 Fig. S8† showed that the IC50
value of PV-1 was 45 mM, which demonstrates its minimalcytotoxicity and good biocompatibility. Next, we tested itstoxicity in C57 mice.53,54 Mice experiments suggested no obviousdepilation or inammation in two mice groups treated withdifferent concentrations of PV-1, proving a low toxicity of PV-1(Fig. S9†). These results indicate that PV-1 has fascinatingbiocompatibility, and is suitable for biological imaging. Then,we validated the peroxisomal localization ability of PV-1 in HL-7702 cells and SMMC-7721 cells.55,56 In Fig. 4, the red uores-cence of PV-1 signicantly coincident with the green uores-cence of peroxisome-GFP was observed. The Pearson'scolocalization coefficient between PV-1 and peroxisome-GFPwas 0.91. We also obtained similar results in HL-7702 cells,with a Pearson's colocalization coefficient of 0.90. Further, thePV-1 hardly accumulated in the Golgi apparatus, endoplasmicreticulum, mitochondria, or lysosomes (Fig. S10†). The aboveresults indicate that PV-1 can precisely target and tune in on theperoxisomes of living cells.
Fluorescence imaging of peroxisomal viscosity during lipidabnormal metabolism in living cells
Previous studies have shown that when long free fatty acids arein excess, they impair peroxisomal b-oxidation capacity, causinglipid accumulation.57,58 Thus, we evaluated the viscositydetecting capability of PV-1 during abnormal lipid metabolismin living cells. Oleic acid (OA), a long chain fatty acid whichmetabolizes in cells, especially in liver cells, was chosen as aninitiator of lipid abnormal metabolism in HL-7702 cells.59,60 Asshown in Fig. 5, compared with control cells, the OA-simulatedcells exhibited brighter uorescence in peroxisomes shaped likedroplet-sized dots. These data verify that PV-1 can respond toperoxisomal viscosity increments in living cells duringabnormal lipid metabolism. Moreover, we found that unhealthycells evoked bright uorescence due to a higher uptake of theprobe. However, unlike droplet-size dots, the uorescencesignals were located in the entire cytoplasm rather than theperoxisomes.61 Therefore, these results demonstrated that theincreased uorescence in the peroxisomes of OA-simulated cellswas caused by the higher viscosity in cells under abnormal lipidmetabolism. Subsequently, time-dependent uorescenceimaging (from 0–60.0 min) of HL-7702 cells treated with OA wascarried out aer the addition of PV-1. It was found that the
Chem. Sci., 2020, 11, 12149–12156 | 12151

Fig. 4 (a–c) Confocal fluorescence images of the SMMC-7721 cells incubated with PV-1 and peroxisome-GFP. First, SMMC-7721 cells wereincubated with in peroxisome-GFP (3.0 mL, 108 particle per ml, 28 h), then stained with PV-1 (5.0 mM) after being treated with OA (5.0 mM, 30min).(a) Fluorescence image from PV-1 (lex ¼ 633 nm, lem ¼ 650–750 nm); (b) fluorescence image from peroxisome-GFP (lex ¼ 488 nm, lem ¼ 495–550 nm); (c) merged images; (d) intensity profile of ROI lines of the white circle. Scale bar ¼ 75 mm.
Fig. 5 (a–c) Confocal fluorescence images of the HL-7702 cells incubated with PV-1 (5.0 mM) for 30 min; (d–f) confocal fluorescence images ofthe cells incubated with PV-1 (5.0 mM) after treated with OA (5.0 mM) for 30 min. (g–i) Living HL-7702 cell were first incubated with PBS solutionfor 2.0 h, then added PV-1 (5.0 mM) to cells for confocal fluorescence images. (j) Relative fluorescence intensity to the control cells. Scale bar¼ 25mm. The values are the mean � s.d. for n ¼ 3, lex ¼ 633 nm, lem ¼ 650–750 nm.
Chemical Science Edge Article
Ope
n A
cces
s A
rtic
le. P
ublis
hed
on 0
6 O
ctob
er 2
020.
Dow
nloa
ded
on 4
/4/2
022
7:27
:56
AM
. T
his
artic
le is
lice
nsed
und
er a
Cre
ativ
e C
omm
ons
Attr
ibut
ion-
Non
Com
mer
cial
3.0
Unp
orte
d L
icen
ce.
View Article Online
uorescence intensity of PV-1 could remain stable for as long as60.0 min (Fig. S11†). Taken together, these results certify thata PV-1-based viscosity detection method can distinguish livercells with abnormal lipid metabolism from normal cells.
NIRF imaging in livers of mice with NAFLD
With this viscosity-sensitive tool, we next investigated whetherPV-1 could distinguish NAFLD mice from normal mice.Considering that NAFLD is caused by abnormal lipid accumu-lation, NAFLD mice models were constructed by introducinga high-fat diet (60 kcal% fat) for 6 weeks.62,63 Excess lipidaccumulation can trigger a series of stress responses andproduce excessive amounts of ROS, which result in serioussecondary liver damage in the process of NAFLD.64,65 Therefore,we used NAC (10 mg kg�1) to reduce ROS and alleviate theNAFLD of mice.66,67 Fig. S12† shows that the body weight of mice
12152 | Chem. Sci., 2020, 11, 12149–12156
with NAFLD was signicantly higher than that of the othergroup mice. Hematoxylin and eosin staining experimentsdemonstrated that the liver of NAFLD mice showed massivehepatic steatosis compared with that of the treatment groupand normal group (Fig. S13†). NIRF imaging was performedaer intravenous injection of PV-1, (100 mL, 10�4 M). As shownin Fig. 6 and S14,† the livers of normal mice evoked dim uo-rescence, while the livers of NAFLDmice emitted a conspicuousuorescence signal. This shows that the mice with NAFLD hada higher viscosity (about 3.4-times) than the normal mice. Incontrast, the uorescence intensity of livers in the NAC-treatedmice was clearly weaker compared with that of the NAFLDmice.Fascinatingly, NAC, as a mucolytic reagent, could also reduceviscosity in vivo due to a mucolytic effect (Fig. S15†).68,69
Therefore, we further investigated whether NAFLD can betreated by scavenging ROS. We used antioxidants and drugs to
This journal is © The Royal Society of Chemistry 2020
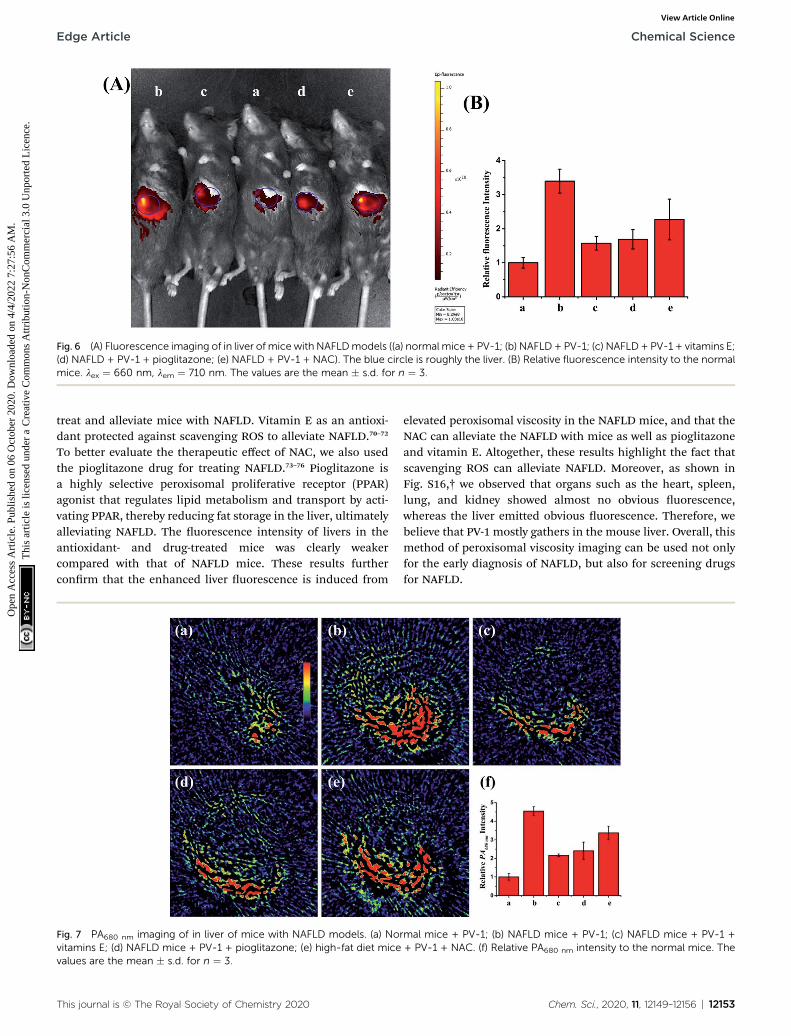
Fig. 6 (A) Fluorescence imaging of in liver of mice with NAFLDmodels ((a) normal mice + PV-1; (b) NAFLD + PV-1; (c) NAFLD + PV-1 + vitamins E;(d) NAFLD + PV-1 + pioglitazone; (e) NAFLD + PV-1 + NAC). The blue circle is roughly the liver. (B) Relative fluorescence intensity to the normalmice. lex ¼ 660 nm, lem ¼ 710 nm. The values are the mean � s.d. for n ¼ 3.
Edge Article Chemical Science
Ope
n A
cces
s A
rtic
le. P
ublis
hed
on 0
6 O
ctob
er 2
020.
Dow
nloa
ded
on 4
/4/2
022
7:27
:56
AM
. T
his
artic
le is
lice
nsed
und
er a
Cre
ativ
e C
omm
ons
Attr
ibut
ion-
Non
Com
mer
cial
3.0
Unp
orte
d L
icen
ce.
View Article Online
treat and alleviate mice with NAFLD. Vitamin E as an antioxi-dant protected against scavenging ROS to alleviate NAFLD.70–72
To better evaluate the therapeutic effect of NAC, we also usedthe pioglitazone drug for treating NAFLD.73–76 Pioglitazone isa highly selective peroxisomal proliferative receptor (PPAR)agonist that regulates lipid metabolism and transport by acti-vating PPAR, thereby reducing fat storage in the liver, ultimatelyalleviating NAFLD. The uorescence intensity of livers in theantioxidant- and drug-treated mice was clearly weakercompared with that of NAFLD mice. These results furtherconrm that the enhanced liver uorescence is induced from
Fig. 7 PA680 nm imaging of in liver of mice with NAFLD models. (a) Novitamins E; (d) NAFLD mice + PV-1 + pioglitazone; (e) high-fat diet micevalues are the mean � s.d. for n ¼ 3.
This journal is © The Royal Society of Chemistry 2020
elevated peroxisomal viscosity in the NAFLD mice, and that theNAC can alleviate the NAFLD with mice as well as pioglitazoneand vitamin E. Altogether, these results highlight the fact thatscavenging ROS can alleviate NAFLD. Moreover, as shown inFig. S16,† we observed that organs such as the heart, spleen,lung, and kidney showed almost no obvious uorescence,whereas the liver emitted obvious uorescence. Therefore, webelieve that PV-1 mostly gathers in the mouse liver. Overall, thismethod of peroxisomal viscosity imaging can be used not onlyfor the early diagnosis of NAFLD, but also for screening drugsfor NAFLD.
rmal mice + PV-1; (b) NAFLD mice + PV-1; (c) NAFLD mice + PV-1 ++ PV-1 + NAC. (f) Relative PA680 nm intensity to the normal mice. The
Chem. Sci., 2020, 11, 12149–12156 | 12153

Chemical Science Edge Article
Ope
n A
cces
s A
rtic
le. P
ublis
hed
on 0
6 O
ctob
er 2
020.
Dow
nloa
ded
on 4
/4/2
022
7:27
:56
AM
. T
his
artic
le is
lice
nsed
und
er a
Cre
ativ
e C
omm
ons
Attr
ibut
ion-
Non
Com
mer
cial
3.0
Unp
orte
d L
icen
ce.
View Article Online
PA imaging in livers of mice with NAFLD
Since the liver is located deep in the body, NIRF imaging hasinsufficient penetration depth for the liver in vivo. Fortunately,with favorable near-infrared absorbance/emission, PV-1 mightbe appropriate for peroxisomal viscosity detection inmouse liverby a PA imaging technique. In an PA experiment, we discoveredstronger PA signals (about 4.4-fold) at 680 nm in NAFLD micelivers compared with normal mice. In contrast, aer intragastricadministration of a dose of therapeutic reagents in NAFLDmice,such as pioglitazone, vitamins E and NAC, the intensity of the PAsignals decreased. These results revealed that the peroxisomalviscosity was enhanced in mice with NAFLD, and could bereduced by NAC treatment (Fig. 7 and S17†). The above resultssuggest that the PA signal variation tendency is consistent withthat of in vivo uorescence imaging. Thus, the PV-1-based PAimaging technique can accurately reect the peroxisomalviscosity changes and indicate the occurrence of NAFLD.Furthermore, the content of alanine aminotransferase (ALT) isan important index to measure the degree of liver lesions inNAFLD.77,78 To further make sure of the accuracy of the NIRF andPA imaging results, the liver ALT levels of ve mice groups weredetermined by enzyme-linked immunosorbent assay (ELISA).The ELISA results showed that the ALT in NAFLD mice liver washigher than that of normal mice (Fig. S18†). All the data furtherillustrate that the imaging method can effectively realize theearly diagnosis of NAFLD by monitoring liver viscosity change inNAFLD mice. Currently, the reported uorescence viscosityprobes are mostly applied to supercial tissue imaging, whilesingle-channel optical imaging is not reliable for trackingviscosity uctuations. Hence, PV-1 can monitor viscosity in thedeep liver tissue by superior PA imaging. Importantly, the dualmodel imaging viscosity method is used for the early accuratediagnosis and clinical drug evaluation of NAFLD.
Conclusions
In summary, we designed and synthesized the rst dual-mode(NIRF/PA) peroxisomal viscosity probe PV-1. The PV-1 exhibi-ted high specicity and selectivity to viscosity. By HLKPLQSKLpeptide chain, PV-1 can solely gather in peroxisomes. Moreover,the detection method of PV-1 could indicate the peroxisomalviscosity differences in OA stimulated and normal cells. Usingthis PV-1, we found that the liver viscosities of NAFLDmice weresignicantly higher than those of normal mice and three groupsof treated NAFLD mice. Therefore, the PV-1-based dual-modedetection viscosity method can not only be utilized for indi-cating the occurrence and development of NAFLD, but can alsobe used for evaluating the efficacy of drugs for NAFLD.
Live subject statement
All of the animal experiments were performed strictly inaccordance with the relevant laws and guidelines issued andapproved by the Ethical Committee of Shandong NormalUniversity for the Care and Use of Laboratory Animals.
12154 | Chem. Sci., 2020, 11, 12149–12156
Conflicts of interest
There are no conicts to declare.
Note added after first publication
This article replaces the version published on 19th October2020, which contained a duplication of one of the gures. Fig. 3and Fig. 6 have now been updated correctly.
Acknowledgements
This work was supported by the National Natural Science Fundof China (21675105, 21535004, 21927811) and the Key Researchand Development Program of Shandong Province(2018YFJH0502), National Major Scientic and TechnologicalSpecial Project for “Signicant New Drugs Development”(2017ZX09301030004).
Notes and references
1 L. A. Adams, P. Angulo and K. D. Lindor, CMAJ, 2015, 172,899–905.
2 T. Karlas, R. Physician, J. Wiegand, S. Physician and T. Berg,Best Pract. Res., Clin. Endocrinol. Metab., 2013, 27, 195–208.
3 E. Hashimoto, M. Taniai and K. Tokushige, J. Gastroenterol.Hepatol., 2013, 28, 64–70.
4 L. Vigan, A. Lleo and A. Aghemo, Hepatobiliary Surg. Nutr.,2018, 7, 130–133.
5 O. Massoud and M. Charlton, Clin. Liver Dis., 2018, 22, 201–211.
6 C. H. Ma, A. Kesarwala, T. Eggert, J. M. Echeverz,D. E. Kleiner, P. Jin, D. F. Stroncek, M. Terabe, V. Kapoor,A. M. ElGindi, M. Han, A. Thornton, H. B. Zhang,M. Egger, J. Luo, D. Felsher, D. McVicar, A. Weber,M. Heikenwalder and T. F. Greten, Nature, 2016, 531, 253–257.
7 P. Golabi, M. Sayiner, Y. Fazel, A. Koenig, L. Henry andZ. M. Younossi, Expet Rev. Gastroenterol. Hepatol., 2015, 10,1–9.
8 E. Cleveland, A. Bandy and L. VanWagner, Clin. Liver Dis.,2018, 11, 98–104.
9 E. Hashimoto, K. Tokushige and J. Ludwig, Hepatol. Res.,2015, 45, 20–28.
10 S. R. Mehta, E. L. Thomas, J. D. Bell, D. G. Johnston andS. T. Robinson, World J. Gastroenterol., 2008, 14, 3476–3483.
11 Y. Sumida, A. Nakajima and Y. Itoh, World J. Gastroenterol.,2014, 20, 475–485.
12 J. D. Browning and J. D. Horton, J. Clin. Invest., 2004, 114,147–152.
13 I. J. Lodhi and C. F. Semenkovich, Cell Metab., 2014, 19, 380–392.
14 T. B. Dansen and K. A. Wirtz, IUBMB Life, 2001, 51, 223–230.15 N. C. Tapia, N. Rosso and C. Tiribelli, BMC Gastroenterol.,
2012, 12, 20–30.
This journal is © The Royal Society of Chemistry 2020

Edge Article Chemical Science
Ope
n A
cces
s A
rtic
le. P
ublis
hed
on 0
6 O
ctob
er 2
020.
Dow
nloa
ded
on 4
/4/2
022
7:27
:56
AM
. T
his
artic
le is
lice
nsed
und
er a
Cre
ativ
e C
omm
ons
Attr
ibut
ion-
Non
Com
mer
cial
3.0
Unp
orte
d L
icen
ce.
View Article Online
16 N. Latruffe, M. C. Maki, V. N. Frances, M. C. Clemencet,B. Jannin and J. P. Berlot, Biochem. Pharmacol., 2000, 60,1027–1032.
17 P. Tessari, A. Coracina, A. Cosma and A. Tiengo, Nutr.Metabol. Cardiovasc. Dis., 2009, 19, 291–302.
18 O. Cheung and A. J. Sanyal, Semin. Liver Dis., 2008, 28, 351–359.
19 S. D. Kohlwein, M. Veenhuis and J. V. Klei, Lipid Droplets andPeroxisomes: Key Players in Cellular Lipid Homeostasis or AMatter of Fat—Store ‘em Up or Burn ’em Down, 2012.
20 I. J. Lodhi and C. F. Semenkovich, Cell Metab., 2014, 19, 380–392.
21 T. C. Walther and R. V. Farese, Annu. Rev. Biochem., 2012, 81,1–28.
22 G. Mannaerts, P. Veldhoven and M. Casteels, Cell Biochem.Biophys., 2000, 32, 73–87.
23 B. L. Parker, A. C. calkin, M. M. Seldin, M. F. Keating,A. Vallim and B. G. Drew, Nature, 2019, 567, 187–193.
24 A. D. Barbosa, D. B. Savage and S. Siniossoglou, Curr. Opin.Cell Biol., 2015, 35, 91–97.
25 P. Tessari, A. Coracina, A. Cosma and A. Tiengo, Nutr.,Metab. Cardiovasc. Dis., 2009, 19, 291–302.
26 N. C. Tapia, N. Rosso and C. Tiribelli, BMC Gastroenterol.,2012, 12, 20.
27 A. C. Sedgwick, H. H. Han, J. E. Gardiner, S. D. Bull, X. P. Heand T. D. James, Chem. Commun., 2017, 53, 12822–12825.
28 H. B. Xiao, P. Li, W. Zhang and B. Tang, Chem. Sci., 2016, 7,1588–1593.
29 Y. Suseela, N. Narayanaswamy, S. Pratihar andT. Govindaraju, Chem. Soc. Rev., 2018, 47, 1098–1131.
30 Y. Z. Min, J. M Li, F. Liu, E. L. Yeow and B. G. Xing, Angew.Chem., Int. Ed., 2014, 53, 1012–1016.
31 K. Dou, W. J. Huang, Y. H. Xiang, S. J. Li and Z. H. Liu, Anal.Chem., 2020, 92, 4177–4181.
32 R. Guo, J. L. Yin, Y. Y. Ma, G. H. Li, Q. Wang and W. Y. Lin,Sens. Actuators, B, 2018, 271, 321–328.
33 Z. G. Yang, Y. X. He, J. H. Lee, W. S. Cha, W. X. Ren, J. H. Lee,C. h. Kang and J. S. Kim, Chem. Commun., 2014, 50, 11672–11675.
34 Y. Liu, C. H. Wolstenholme, G. C. Carter, H. B. Liu, H. Hu,L. S. Grainger, K. Miao, M. Fares, C. A. Hoelzel,H. P. Yennawar, G. Ning, M. Y. Du, L. Bai, X. S. Li andX. Zhang, J. Am. Chem. Soc., 2018, 140, 7381–7384.
35 E. Y. Zhou, H. Knox, C. Liu and W. Zhao, J. Am. Chem. Soc.,2019, 141, 17601–17609.
36 L. L. Zeng, G. C. Ma, J. Lin and P. Huang, Small, 2018, 14,1800782.
37 J. J. Zhang, X. Zhen, P. K. Upputuri, M. Pramanik, P. Chenand K. Y. Pu, Adv. Mater., 2017, 29, 1604764.
38 H. Wang, Y. X. Zhang, Y. Y. Yang, Z. X. He, C. C. Wu,W. Zhang, W. Zhang, J. Liu, P. Li and B. Tang, Chem.Commun., 2019, 55, 9685–9688.
39 S. T. Li, F. Y. Meng, X. L. Liao, Y. M. Wang, Z. X. Sun,F. C. Guo, X. X. Li, M. Meng, Y. Li and C. H. Sun, PLoSOne, 2014, 9, e86724.
40 J. Y. Bai, P. Y. Lei, C. Y. Zhao, Y. Q. Wang, D. D. Yan andS. Y. Yang, Toxicol. Rep., 2016, 3, 98–104.
This journal is © The Royal Society of Chemistry 2020
41 D. M. Xi, M. Xiao, J. F. Cao, L. Y. Zhao, N. Xu, S. Long,J. L. Fan, K. Shao, W. Sun, X. H. Yan and X. J. Peng, Adv.Mater., 2020, 32, 1907855.
42 S. R. Terlecky, W. M. Nuttley, D. McCollum, E. Sock andS. Subramani, EMBO J., 1995, 14, 3627–3634.
43 A. Jankowski, J. H. Kim, R. F. Collins, R. Daneman, P. Waltonand S. Grinstein, J. Biol. Chem., 2001, 276, 48748.
44 J. A. McNew, K. Sykes and J. M. Goodman, Mol. Biol. Cell,1993, 4, 223.
45 Y. Q. Zhou, P. Li, N. N. Fan, X. Wang, X. N. Liu, L. J. Wu,W. Zhang, W. Zhang, C. Ma and B. Tang, Chem. Commun.,2019, 55, 6767–6770.
46 M. Haidekker, T. Brady, D. Lichlyter and E. Theodorakis, J.Am. Chem. Soc., 2006, 128, 398–399.
47 Z. G. Yang, Y. X. He, J. H. Lee, N. Y. Park, M. Suh, X. J. Peng,H. G. Jung, C. H. Kang and J. S. Kim, J. Am. Chem. Soc., 2013,135, 9181–9185.
48 T. Chen, Z. K. Chen, R. Y. Liu and S. B. Zheng, Org. Biomol.Chem., 2019, 17, 6398–6403.
49 H. B. Cheng, Y. Y. Li, B. Z. Tang and J. Y. Yoon, Chem. Soc.Rev., 2020, 49, 21–31.
50 M. K. Kuimova, S. W. Botchway, A. W. Parker, M. Balaz,H. A. Collins, H. L. Anderson, K. Suhling and P. R. Ogilby,Nat. Chem., 2009, 1, 69–73.
51 D. E. Fischer, A. Theodorakis and M. A. Haidekker, Nat.Protoc., 2007, 2, 227–236.
52 Z. Zou, Q. Yan, S. X. Ai, P. Qi, H. Yang, Y. F. Zhang,Z. H. Qing, L. H. Zhang, F. Feng and R. H. Yang, Anal.Chem., 2019, 91, 8574–8581.
53 X. J. Peng, Z. G. Yang, J. Y. Wang, J. L. Fan, Y. X. He,F. L. Song, B. S. Wang, S. G. Sun, J. L. Qu, J. Qi andM. Yan, J. Am. Chem. Soc., 2011, 133, 6626–6635.
54 H. Xu, H. Xu, S. N. Ma, X. N. Chen, L. X. Huang, J. W. Chen,F. Gao, R. Wang, K. Y. Lou and W. Wang, J. Am. Chem. Soc.,2018, 140, 16408–16412.
55 M. Z. Ye, X. H. Wang, J. B. Tang, Z. Q. Guo, Y. Q. Shen,H. Tian and W. H. Zhu, Chem. Sci., 2016, 7, 4958–4965.
56 Y. Z. Zhao, Q. X. Hu, F. X. Cheng, N. Su, A. X. Wang, Y. J. Zou,H. Y. Hu, X. J. Chen, H. M. Zhou, X. Z. Huang, K. Yang,Q. Zhu, X. Wang, J. Yi, L. Y. Zhu, X. H. Qian, L. X. Chen,Y. Tang, J. Loscalzo and Y. Yang, Cell Metab., 2015, 21,777–789.
57 R. J. Wanders, S. Ferdinandusse, P. Brites and S. Kemp,Biochim. Biophys. Acta, 2010, 1801, 272–280.
58 P. B. Lazarow, J. Biol. Chem., 1978, 253, 1522–1528.59 C. Wang, Z. L. LV, Y. J. Kang, T. X. Xing, P. L. Wang and
Z. Jiang, Int. J. Mol. Med., 2013, 32, 1159–1165.60 L. A. DelRio, Peroxisomes and their Key Role in Cellular
Singaling and Metabolism, 2013.61 F. Q. Yu, X. Y. Jing and W. Y. Lin, Sens. Actuators, B, 2020,
302, 127207.62 M. C. Heffern, H. M. Park, H. A. Yeung, C. V. de Bittner,
C. M. Ackerman, A. Stahlb and C. J. Chang, Proc. Natl.Acad. Sci. U. S. A., 2016, 113, 14219–14224.
63 G. Kanuri and I. Bergheim, Int. J. Mol. Sci., 2013, 14, 11963–11980.
Chem. Sci., 2020, 11, 12149–12156 | 12155

Chemical Science Edge Article
Ope
n A
cces
s A
rtic
le. P
ublis
hed
on 0
6 O
ctob
er 2
020.
Dow
nloa
ded
on 4
/4/2
022
7:27
:56
AM
. T
his
artic
le is
lice
nsed
und
er a
Cre
ativ
e C
omm
ons
Attr
ibut
ion-
Non
Com
mer
cial
3.0
Unp
orte
d L
icen
ce.
View Article Online
64 M. Kohjima, M. Enjoji, N. Highuchl, M. Kato, K. Koth,T. Yoshimoto, T. Fujino, M. Yada, R. Yada, N. Harada,R. I. Takayanag and M. Nakamut, Int. J. Mol. Med., 2007,20, 351–358.
65 J. Y. Kim, R. G. Carbonell, S. Yamachika, P. Zhao, D. Dhar,R. Loomba, R. J. Kaufman, A. R. Saltiel and M. Karin, Cell,2018, 175, 133–145.
66 A. Sadowska, Ther. Adv. Respir. Dis., 2012, 6, 127–135.67 K. F. Schoenberg, M. Wiedmann, K. J. Georgieff and
M. D. Applikation, Anaesthesist, 1995, 44, 651–658.68 G. A. Coque, M. Hernandez, V. Camanas and
C. M. Fernandez, Analyst, 1989, 84, 975–977.69 M. Jaworska, G. Szulinska, M. Wilk and J. Taut, J.
Chromatogr. A, 1999, 853, 479–485.70 H. Kitade, G. L. Chen, Y. H. Ni and T. Ota, Nutrients, 2017, 9,
387.71 J. E. Lavine, J. Pediatr., 2000, 5, 16–22.
12156 | Chem. Sci., 2020, 11, 12149–12156
72 T. Hardy, Q. M. Anstee and C. P. Day, Curr. Opin.Gastroenterol., 2015, 31, 175–183.
73 V. G. Athyros, T. K. Alexandrides, H. Bilianou,E. Cholongitas, M. Doumas, E. S. Ganotakis andJ. Goudevenos, Metabolism, 2017, 71, 17–32.
74 T. Schreuder, B. J. Verwer, C. V. Nieuwkerk and C. J. Mulder,World J. Gastroenterol., 2008, 28(14), 2474–2486.
75 K. M. Comar and R. K. Sterling, Aliment. Pharmacol. Ther.,2005, 23, 207–215.
76 A. Federico, C. Zulli, I. D. Sio, A. D. Prete, M. Dallio,M. Masarone and C. Loguercio, World J. Gastroenterol.,2014, 20, 16841–16857.
77 Y. Chang, S. Ryu, E. j. Sung and Y. Jang, Clin. Chem., 2007,53, 686–692.
78 H. J. Oh, T. H. Kim, Y. W. Sohn, Y. S. Kim, Y. R. Oh, E. Y. Cho,S. Y. Shim, S. R. Shin, A. L. Han, S. J. Yoon and H. C. Kim, J.Hepatol., 2011, 17, 27–36.
This journal is © The Royal Society of Chemistry 2020