Embed Size (px)
Citation preview
In-Situ TiC-Fe Deposition on Mild
Steel Using a Laser Cladding Process
by
Ali Emamian
A thesis
presented to the University of Waterloo
in fulfillment of the
thesis requirement for the degree of
Doctor of Philosophy
in
Mechanical Engineering
Waterloo, Ontario, Canada, 2011
© Ali Emamian 2011

ii
Author's Declaration
I hereby declare that I am the sole author of this thesis. This is a true copy of the thesis, including any
required final revisions, as accepted by my examiners.
I understand that my thesis may be made electronically available to the public.
Ali Emamian
iii
Abstract
The growing interest in increasing the wear resistance and hardness of surfaces that are in contact
with abrasives or corrosive materials has inspired the development of several processes for creating
protective coatings. In-situ laser cladding is one of the most promising of these processes. It enables
the formation of a uniform coating by melting powder to form the desired composition from a pure
powder component.
In this research, pure Ti, graphite, and Fe are used for in-situ laser cladding on a steel substrate to
form an Fe-TiC metal matrix composite (MMC). The effect of laser parameters on both the quality of
the bonding and morphology of the in-situ-formed TiC iron-based composite clad are investigated.
Results show that laser parameters play a crucial role in determining the clad quality and clad
microstructure. Two combined parameters, effective energy and powder deposition density, are used
to study the effect of laser parameters (i.e., laser power, scan speed and powder feed rate) on the clad
properties. While results indicate that combined parameters help to determine the quality limit, laser
process parameters need to be taken into account in order to study the clad microstructure.
To increase the clad hardness and TiC volume fraction, C:Ti atomic ratio should increase from 45:55
to 55:45, and Fe percentages in the powder composition should decrease from 70 wt% to the 10 wt%.
By varying the powder composition, a change in TiC morphology, clad microstructure and clad
hardness occurs. The dilution effect is also considered in the interpretation of results.
In order to estimate wear resistance, the ASTM G65-A procedure was selected to perform tests on
various clad compositions. An increased wear resistance is seen when the volume fraction of TiC is
increased.

iv
Acknowledgements
I am heartily thankful to my supervisors, Professor Amir Khajepour and Professor Stephen F. Corbin,
whose encouragement, guidance and support from the initial to the final stages enabled me to develop
a clear understanding of the subject.
My parents, Behnaz and Manouchehr, receive my deepest gratitude and love for their dedication and
the many years of support during my studies that provided the foundation for this work. I would like
to thank my wife, Bahareh, for her understanding and love during the past few years. Her support and
encouragement was in the end what made this dissertation possible.
Lastly, I offer my regards and blessings to all of those who supported me in any respect during the
completion of this research project.
Ali Emamian
v
Table of Contents
Author's Declaration ............................................................................................................................... ii
Abstract ................................................................................................................................................. iii
Acknowledgements ............................................................................................................................... iv
Table of Contents ................................................................................................................................... v
List of Figures ...................................................................................................................................... vii
List of Tables ......................................................................................................................................... xi
Chapter 1 Introduction ............................................................................................................................ 1
1.1 Overview ...................................................................................................................................... 1
1.2 Thesis Overview ........................................................................................................................... 3
Chapter 2 Literature Review and Background ....................................................................................... 4
2.1 Literature Review ......................................................................................................................... 4
2.1.1 Bulk Processing ..................................................................................................................... 4
2.1.2 Coating Ex-situ by Laser cladding ........................................................................................ 6
2.1.3 In-Situ Laser Cladding ........................................................................................................... 9
2.1.4 Other Methods ..................................................................................................................... 14
2.2 Solidification Behavior During Laser Cladding ......................................................................... 14
2.3 Phase Diagram ............................................................................................................................ 16
2.3.1 Ti-C Phase Diagram ............................................................................................................ 16
2.3.2 Fe-Ti Phase Diagram ........................................................................................................... 17
2.3.3 Fe-C Phase Diagram ............................................................................................................ 17
2.4 Thermodynamic of Formation .................................................................................................... 18
2.4.1 Objectives ............................................................................................................................ 19
Chapter 3 .............................................................................................................................................. 21
Experimental Methods and Results ...................................................................................................... 21
3.1 Experimental Method ................................................................................................................. 21
3.2 Results ........................................................................................................................................ 23
3.2.1 Laser Processing Conditions ............................................................................................... 23
3.2.2 Further Laser Process/Clad Development and Analysis ..................................................... 36
3.2.3 Effect of Laser Parameters on TiC Morphology ................................................................. 50
3.2.4 Composition Study .............................................................................................................. 66
3.2.5 Wear Resistance .................................................................................................................. 78
vi
Chapter 4 Discussion ............................................................................................................................ 84
4.1 The Effect of Initial Laser Process Parameters on Clad Microstructure .................................... 84
4.1.1 Ternary C-Fe-Ti Phase Diagram Consideration .................................................................. 84
4.1.2 TiC Formation and Morphology.......................................................................................... 90
4.2 Optimized Laser Process Parameters and their influence on TiC Morphology ......................... 94
4.3 Composition Study ..................................................................................................................... 96
4.3.1 Fe-Ti-C system .................................................................................................................... 96
4.3.2 Matrix Microstructure ....................................................................................................... 102
4.3.3 Hardness ............................................................................................................................ 109
4.4 Wear Resistance ....................................................................................................................... 110
Chapter 5 Conclusion ......................................................................................................................... 115
Chapter 6 Future Work ....................................................................................................................... 117
6.1 Multi-layer Deposition of Fe-TiC ............................................................................................ 117
6.2 Elimination of Metallic Powder ............................................................................................... 118
Appendix A ........................................................................................................................................ 119
Bibliography ....................................................................................................................................... 125
vii
List of Figures
Figure 1: “Reaction in Ti particle, a) starting from the surface, b) propagating toward the core
c) reaction product and d) melting the reacted Ti particle “E” and unreacted Fe particle “F” [10] 5
Figure 2: Core model for TiC formation [10]......................................................................................... 6
Figure 3: Epitaxial TiC layer on the surface of TiC particles [15] ......................................................... 7
Figure 4: SEM micrographs of ex-situ TiC particle in Ni-base alloy [26] ........................................... 10
Figure 5: TEM micrograph showing the chemical reaction layer around the TiC surface [26] ........... 10
Figure 6: SEM micrographs of in-situ TiC particles a) dendrite shapes with 8% Ti-C b) flower-like
shapes with 14% Ti-C C) blocky shapes with 20% Ti-C in the Ni-Ti-C system [29] .................. 11
Figure 7: Scan speed and solidification rate vectors ............................................................................ 14
Figure 8: Constitutional under cooling (grey area) .............................................................................. 15
Figure 9: Titanium-C phase diagram .................................................................................................... 16
Figure 10: Iron-Titanium phase diagram ............................................................................................. 17
Figure 11: Fe-C phase diagram ............................................................................................................ 18
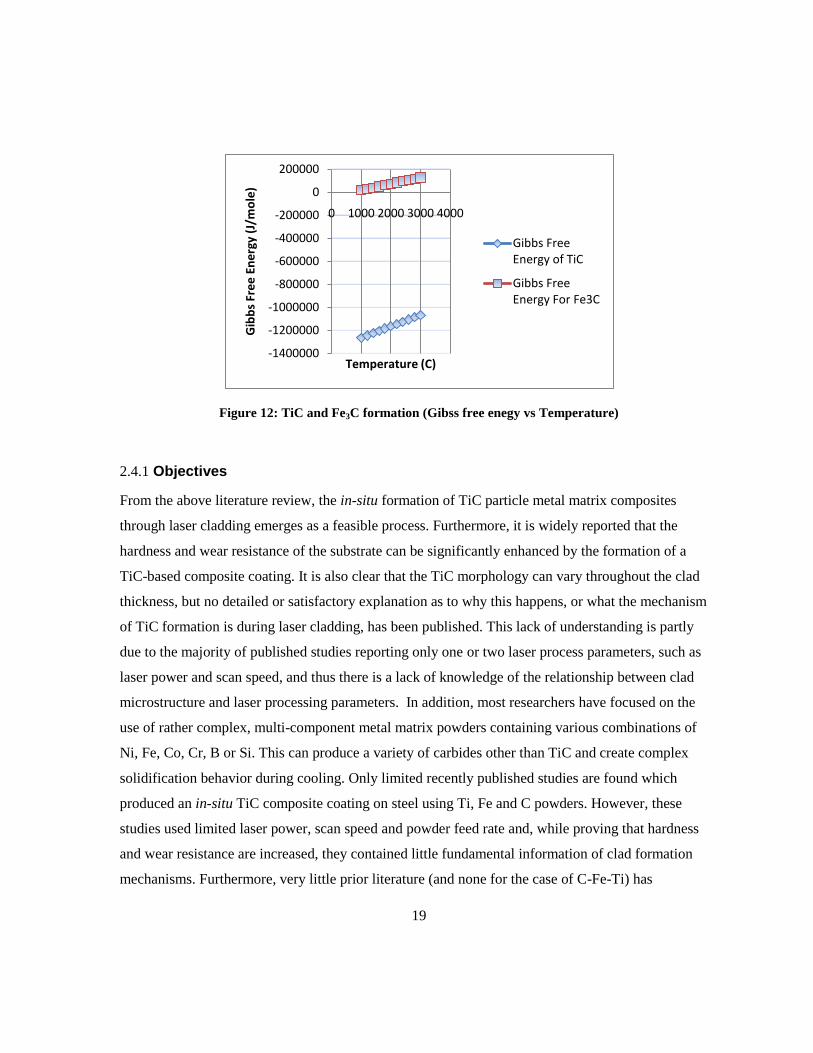
Figure 12: TiC and Fe3C formation (Gibss free enegy vs Temperature) .............................................. 19
Figure 13: SEM micrograph of distributed black particles in a matrix for the un-bonded clad (sample
9) ................................................................................................................................................... 26
Figure 14: BSE micrograph showing distributed black particles, individual and in clusters, in a matrix
of un-bonded clad (sample 9) ....................................................................................................... 27
Figure 15: a) Close-up of TiC cluster; b) region showing Fe-rich segregation; C) region containing
large black particles, all from un-bonded sample 3 ...................................................................... 28
Figure 16: SEM micrograph for single-layer clad (sample 23) ............................................................ 29
Figure 17: BSE micrograph-distributed black particles in matrix of single-layer clad (sample 23) .... 30
Figure 18: Sample 24 TiC distributions ............................................................................................... 31
Figure 19: XRD result un-bonded clad (sample 9) ............................................................................... 32
Figure 20: XRD result of single-layer clad (sample 23) ...................................................................... 32
Figure 21: Microhardness results for samples 23 and 25 ..................................................................... 33
Figure 22: Nanoindentation-punched area of different phases ............................................................. 34
Figure 23: Load displacement curve for three different phases ........................................................... 36
Figure 24: Effective energy versus powder deposition density ............................................................ 37
viii
Figure 25: Quality limit for laser process parameters .......................................................................... 42
Figure 26: Microstructure of entire cross section of the clad deposit from sample AA13 .................. 43
Figure 27: Higher magnification of Sample AA13 a) top of the clad and b) bottom of the clad ......... 44
Figure 28: Example of the eutectic structure in the clad deposit of sample AA13 .............................. 45
Figure 29: Microstructure of entire cross section of the clad deposit from sample AA14 ................... 46
Figure 30: Microstructure at the a) top and b) bottom of the clad deposited from sample AA15 ........ 47
Figure 31: Microstructure at the top of the clad for samples a) AA13 b) AA14 c)AA15 .................... 48
Figure 32: Microstructure at the top of the clad for samples a)AA7 b)AA8 c)AA9 ............................ 49
Figure 33: Study map for groups A to D .............................................................................................. 51
Figure 34: Detailed information for studied samples ([Dilution, Clad Height]) ................................. 53
Figure 35: a) sample A1 (dendrites of TiC), b) sample A2, c) sample A3 ........................................... 55
Figure 36: BSE micrographs for a) sample B1 and b) sample B2........................................................ 56
Figure 37: a) sample B3 b) sample B4 c) sample B5 d) sample B6 ..................................................... 58
Figure 38: Backscatter micrograph of sample C1 to C4 a) C1 b) C2 c) C3 d) C4 ............................... 59
Figure 39: Montage micrograph of sample C6 ..................................................................................... 61
Figure 40: a) Dendritic TiC in sample C5 and b) Spherical TiC in sample C7 .................................... 60
Figure 41: TiC morphology of sample of D1 ....................................................................................... 63
Figure 42: TiC morphology of sample D2 ........................................................................................... 63
Figure 43: Hardness profile for samples D1 and D2 ............................................................................ 65
Figure 44: Developed TiC morphologies using laser condition A (or AA) for compositions of: a)
745 b) 755 c) 655 d) 555 e) 155 ................................................................................................... 68
Figure 45: Developed TiC morphologies using laser condition B (or BB) for compositions of: a)
745 b) 755 c) 655 d) 555 e) 155 ................................................................................................... 68
Figure 46: XRD spectrum of sample 745A .......................................................................................... 70
Figure 47: XRD spectrum of sample 745B .......................................................................................... 71
Figure 48: XRD spectrum of sample 655A .......................................................................................... 72
Figure 49: XRD standard pattern of Fe3C .......................................................................................... 73
Figure 50: XRD standard pattern of Martensite .................................................................................. 73
Figure 51: XRD spectrum of sample 555A .......................................................................................... 74
Figure 52: XRD standard pattern of Austenite ..................................................................................... 75
Figure 53: Hardness profile for samples deposited with laser condition A .......................................... 76
Figure 54: Hardness profile for samples deposited with laser condition B .......................................... 76
ix
Figure 55: Schematic of rubber wheel test machine (ASTM G65) ...................................................... 78
Figure 56: Wear results with and without un-coated samples .............................................................. 83
Figure 57 Calculated liquidus projection with isotherms ..................................................................... 86
Figure 58 Magnification of Figure 57 in the Fe corner ........................................................................ 87
Figure 59: Vertical section of Fe-Ti-C ternary phase diagram at 19 at% ............................................. 88
Figure 60: The ternary diagrams for Ti-Fe-C at 1400 °C ..................................................................... 89
Figure 61: ternary diagrams for Ti-Fe-C at 1000 °C ............................................................................ 90
Figure 62: Increasing the temperature from a to c. a) Melting of Fe powder
b) Melting/dissolution of Ti powder reaction to form TiC c) Dissolution of TiC/C particles ..... 92
Figure 63: Microstructure of a combustion synthesis produced Fe-TiC composite [10] .................... 94
Figure 64 Liquidus projection with isotherms ...................................................................................... 96
Figure 65 Vertical section of Fe-Ti-C at 25%at C (composition 755) ................................................. 98
Figure 66 Vertical section of Fe-Ti-C at 30%at C (composition 655) ................................................. 99
Figure 67 Vertical section of Fe-Ti-C at 37%at C (composition 555) ............................................... 100
Figure 68 Vertical section of Fe-Ti-C at 52%at C (composition 155) ............................................... 101
Figure 69 Formation of Fe2Ti in sample 745 A in magnifications of a) 12000 and b) 22000 ........... 103
Figure 70: Sample 745B microstructure in magnification of 1000 .................................................... 103
Figure 71: Matrix microstructure of a) 755A martensitic formation b) 755B ................................... 104
Figure 72: Matrix microstructure of a) 655A with MAG 3000 B) 655A with MAG 10000 and c)
655B ........................................................................................................................................... 105
Figure 73: Matrix microstructure of a) 555A martensitic formation and b) 555B eutectoid and
dendritic microstructure .............................................................................................................. 106
Figure 74: Matrix microstructure of a) 155A martensitic formation at the clad bottom b) 155A
eutectoid and dendritic microstructure at the top of the clad ...................................................... 107
Figure 75: Microstructure of 155B Fe-rich matrix with distributed C particles ................................. 107
Figure 76: Un-reacted C in the matrix b) fine developed particles in the matrix could be carbon, Fe3C
or TiC from eutectoid transformation in sample 155B ............................................................... 108
Figure 77: Adjusted volume loss and microhardness vs TiC volume fraction in the clad for samples
deposited by a) Condition A b) Condition B ............................................................................ 111
Figure 78: Plastic deformations in worn surface of 745A .................................................................. 112
Figure 79: Pulling out of carbides in worn surface of 755A .............................................................. 113
Figure 80: Worn matrix and remaining TiC particles in sample 155A .............................................. 114
x
Figure 81: Worn matrix and remaining TiC particles in sample 755B .............................................. 114
Figure 82: XRD Spectrum of sample 755A ....................................................................................... 119
Figure 83: XRD Spectrum of sample 755 B...................................................................................... 120
Figure 84: XRD Spectrum of sample 655B ....................................................................................... 121
Figure 85: XRD Spectrum of sample 555B ....................................................................................... 122
Figure 86: XRD Spectrum of sample 155A ....................................................................................... 123
Figure 87: XRD Spectrum of sample 155 B....................................................................................... 124
xi
List of Tables
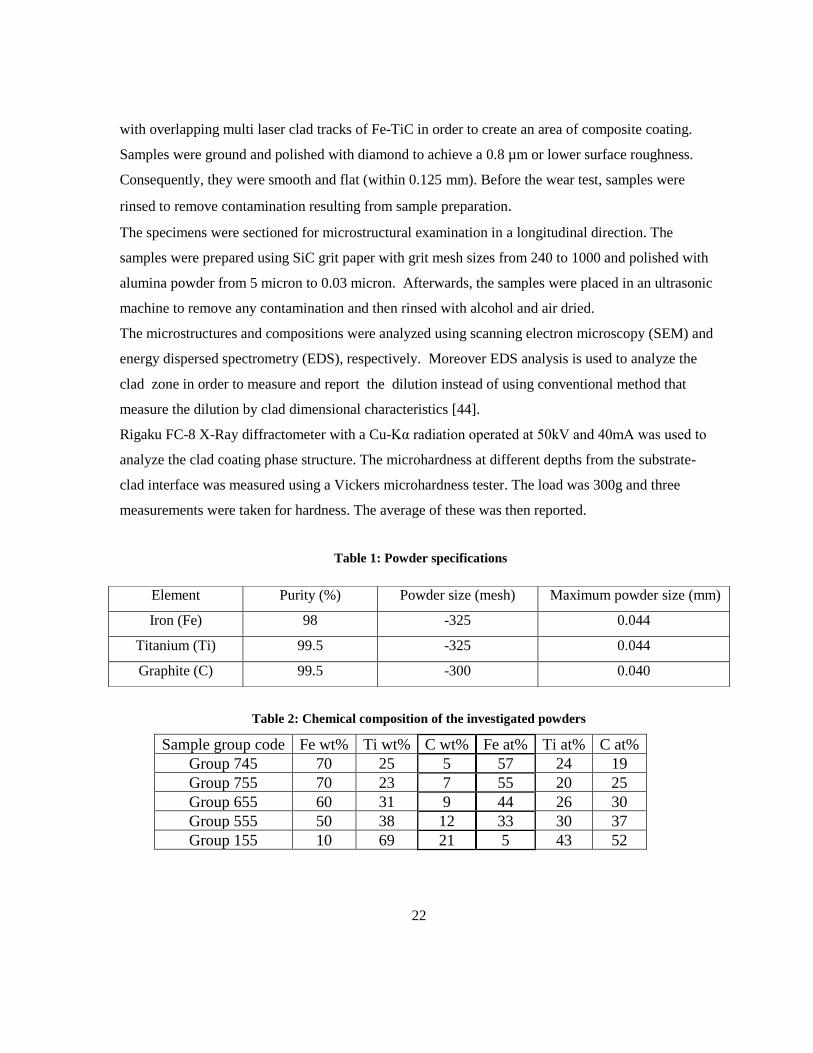
Table 1: Powder specifications ............................................................................................................. 22
Table 2: Chemical composition of the investigated powders ............................................................... 22
Table 3: Initial Laser Cladding Processing Conditions ........................................................................ 24
Table 4: EDS analysis of phases in Sample 9 (Carbon is not included in the analysis due to
inaccuracies in its inclusion in a quantitative analysis) ................................................................ 27
Table 5 EDS analysis of phases in sample 3 ........................................................................................ 29
Table 6: Hardness and moduluss of elasticity results ........................................................................... 35
Table 7: Effective energy and powder deposition density calculation ................................................. 40
Table 8: Laser parameter selection and results based on calculation ................................................... 41
Table 9: Results and data for groups A to D ........................................................................................ 52
Table 10 Applied laser parameters for different compositions ............................................................ 66
Table 11: Micrograph analysis results, dilution, TiC particle size and liquidus temperature for each
powder composition ..................................................................................................................... 69
Table 12: Wear test parameters according to the ASTM G65-04 ........................................................ 78
Table 13: Wear test results (adjusted volume loss mm3) ...................................................................... 83
Table 14: Particle size information ..................................................................................................... 112
1
Chapter 1
Introduction
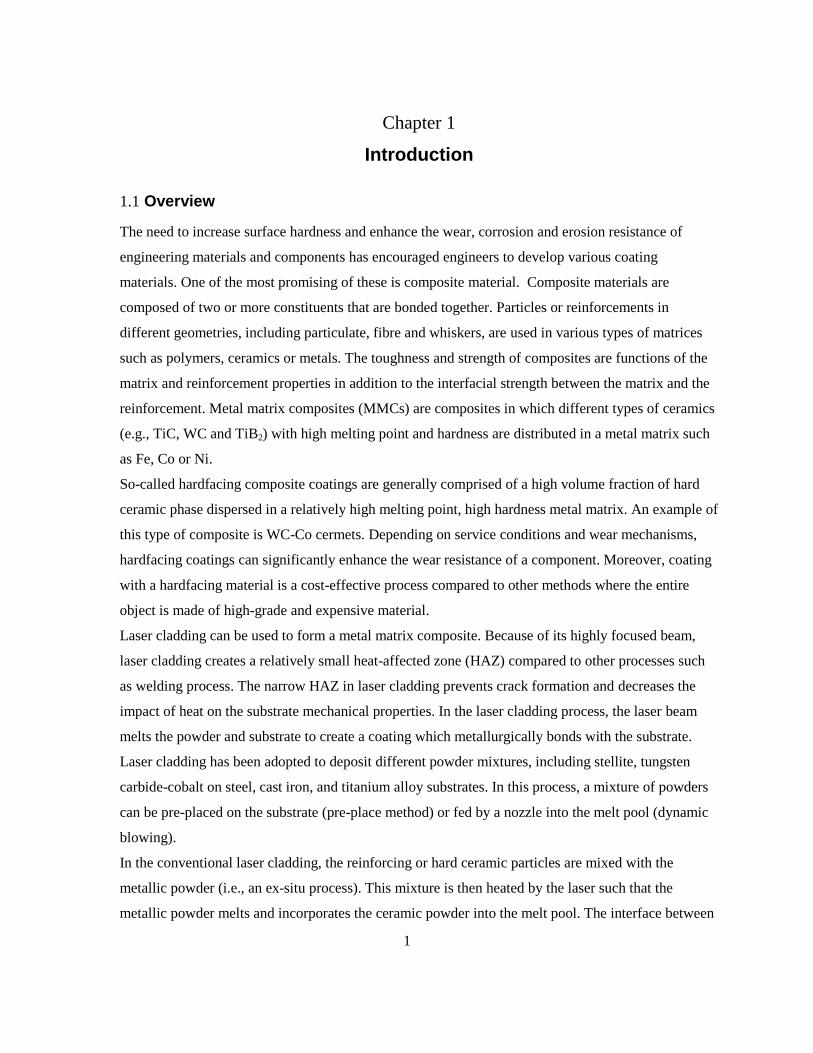
1.1 Overview
The need to increase surface hardness and enhance the wear, corrosion and erosion resistance of
engineering materials and components has encouraged engineers to develop various coating
materials. One of the most promising of these is composite material. Composite materials are
composed of two or more constituents that are bonded together. Particles or reinforcements in
different geometries, including particulate, fibre and whiskers, are used in various types of matrices
such as polymers, ceramics or metals. The toughness and strength of composites are functions of the
matrix and reinforcement properties in addition to the interfacial strength between the matrix and the
reinforcement. Metal matrix composites (MMCs) are composites in which different types of ceramics
(e.g., TiC, WC and TiB2) with high melting point and hardness are distributed in a metal matrix such
as Fe, Co or Ni.
So-called hardfacing composite coatings are generally comprised of a high volume fraction of hard
ceramic phase dispersed in a relatively high melting point, high hardness metal matrix. An example of
this type of composite is WC-Co cermets. Depending on service conditions and wear mechanisms,
hardfacing coatings can significantly enhance the wear resistance of a component. Moreover, coating
with a hardfacing material is a cost-effective process compared to other methods where the entire
object is made of high-grade and expensive material.
Laser cladding can be used to form a metal matrix composite. Because of its highly focused beam,
laser cladding creates a relatively small heat-affected zone (HAZ) compared to other processes such
as welding process. The narrow HAZ in laser cladding prevents crack formation and decreases the
impact of heat on the substrate mechanical properties. In the laser cladding process, the laser beam
melts the powder and substrate to create a coating which metallurgically bonds with the substrate.
Laser cladding has been adopted to deposit different powder mixtures, including stellite, tungsten
carbide-cobalt on steel, cast iron, and titanium alloy substrates. In this process, a mixture of powders
can be pre-placed on the substrate (pre-place method) or fed by a nozzle into the melt pool (dynamic
blowing).
In the conventional laser cladding, the reinforcing or hard ceramic particles are mixed with the
metallic powder (i.e., an ex-situ process). This mixture is then heated by the laser such that the
metallic powder melts and incorporates the ceramic powder into the melt pool. The interface between
2
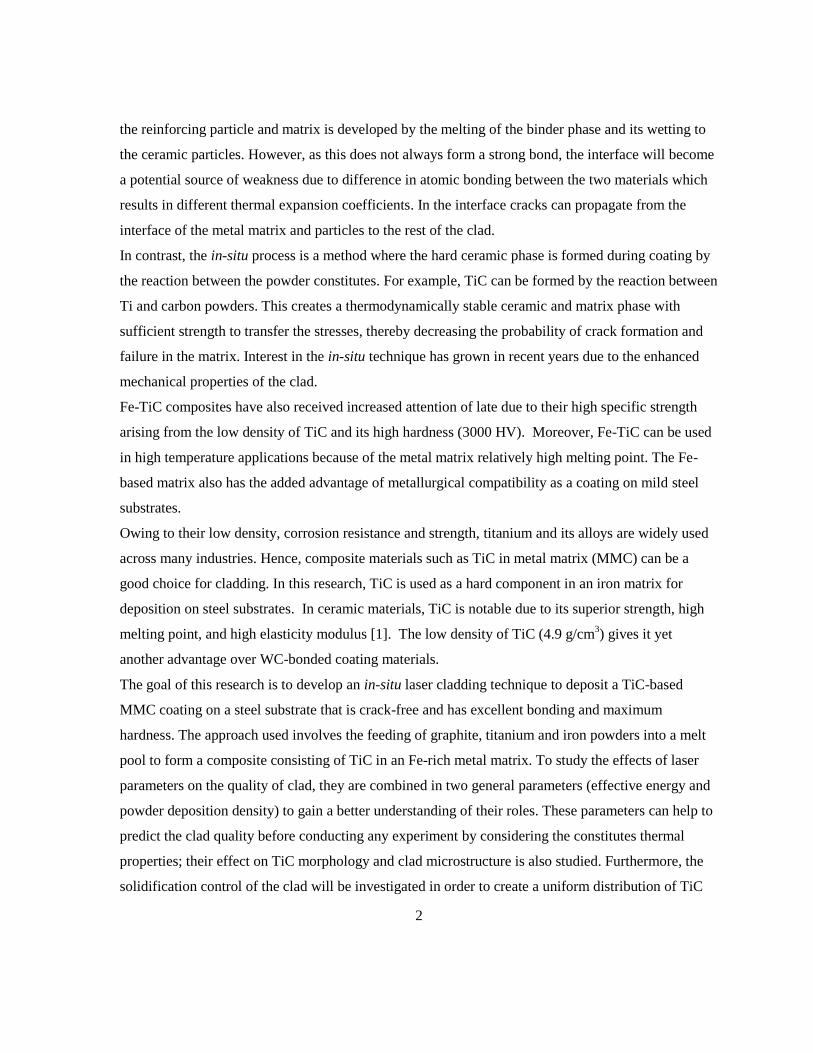
the reinforcing particle and matrix is developed by the melting of the binder phase and its wetting to
the ceramic particles. However, as this does not always form a strong bond, the interface will become
a potential source of weakness due to difference in atomic bonding between the two materials which
results in different thermal expansion coefficients. In the interface cracks can propagate from the
interface of the metal matrix and particles to the rest of the clad.
In contrast, the in-situ process is a method where the hard ceramic phase is formed during coating by
the reaction between the powder constitutes. For example, TiC can be formed by the reaction between
Ti and carbon powders. This creates a thermodynamically stable ceramic and matrix phase with
sufficient strength to transfer the stresses, thereby decreasing the probability of crack formation and
failure in the matrix. Interest in the in-situ technique has grown in recent years due to the enhanced
mechanical properties of the clad.
Fe-TiC composites have also received increased attention of late due to their high specific strength
arising from the low density of TiC and its high hardness (3000 HV). Moreover, Fe-TiC can be used
in high temperature applications because of the metal matrix relatively high melting point. The Fe-
based matrix also has the added advantage of metallurgical compatibility as a coating on mild steel
substrates.
Owing to their low density, corrosion resistance and strength, titanium and its alloys are widely used
across many industries. Hence, composite materials such as TiC in metal matrix (MMC) can be a
good choice for cladding. In this research, TiC is used as a hard component in an iron matrix for
deposition on steel substrates. In ceramic materials, TiC is notable due to its superior strength, high
melting point, and high elasticity modulus [1]. The low density of TiC (4.9 g/cm3) gives it yet
another advantage over WC-bonded coating materials.
The goal of this research is to develop an in-situ laser cladding technique to deposit a TiC-based
MMC coating on a steel substrate that is crack-free and has excellent bonding and maximum
hardness. The approach used involves the feeding of graphite, titanium and iron powders into a melt
pool to form a composite consisting of TiC in an Fe-rich metal matrix. To study the effects of laser
parameters on the quality of clad, they are combined in two general parameters (effective energy and
powder deposition density) to gain a better understanding of their roles. These parameters can help to
predict the clad quality before conducting any experiment by considering the constitutes thermal
properties; their effect on TiC morphology and clad microstructure is also studied. Furthermore, the
solidification control of the clad will be investigated in order to create a uniform distribution of TiC
3
particles in the iron matrix. In addition, the control of heat input is likewise considered to reduce
thermal stresses and unfavorable phase transformations. In order to increase the contribution of TiC,
the clad composition was changed by increasing the C:Ti ratio and decreasing the Fe percentage in
the initial powder composition. Finally, wear resistance and mechanical properties are determined
experimentally to gain a complete and in-depth understanding of the clad properties.
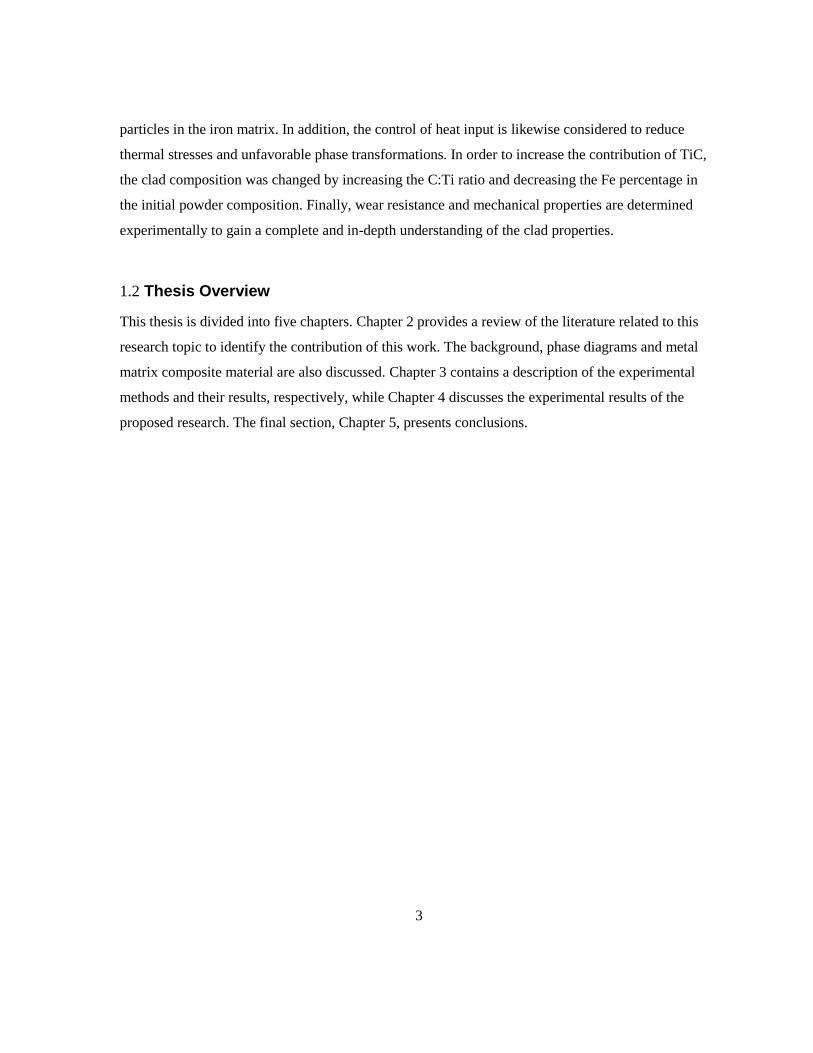
1.2 Thesis Overview
This thesis is divided into five chapters. Chapter 2 provides a review of the literature related to this
research topic to identify the contribution of this work. The background, phase diagrams and metal
matrix composite material are also discussed. Chapter 3 contains a description of the experimental
methods and their results, respectively, while Chapter 4 discusses the experimental results of the
proposed research. The final section, Chapter 5, presents conclusions.
4
Chapter 2
Literature Review and Background
2.1 Literature Review
In this chapter, the literature and background information related to this research are reviewed. The
emphasis here is on the application of TiC-based MMC coatings to improve surface quality for wear
and corrosion resistance. Various coating methods will also be reviewed and compared.
2.1.1 Bulk Processing
Das et al. [1] reviewed various synthesis methods of TiC-reinforced Fe-based composites such as
powder metallurgy, conventional melting, casting, combustion synthesis and laser surface melting.
The authors also formed TiC by a combustion synthesis method known as aluminothermy. The
powder metallurgy method heats and applies pressure to bond the particles and create a dense part for
different shapes and applications. It provides a wide range of shapes and sizes for commercial Fe-TiC
composites by distributing the TiC particles in an Fe-based matrix. Moreover, this method is able to
provide at or near net shape parts using powdered metal technology. Fe-TiC can be rendered one of
the hardest and most wear-resistant carbides by using 45% TiC. High wear-resistance and low
tendency towards cold welding is particularly useful in forming and cutting tools, industrial knives,
hydraulic jacks and cutter blades [2,3].
Jiang et al. [4,5] fabricated a metal matrix composite by a casting process. They used WC and TiC as
reinforcing particles and showed that these particles could be evenly distributed in a metal matrix.
There are several ways to form composites for different applications. Raghuntan [6] formed an Fe-
TiC composite with the casting process, reporting uniform 30% to 45% TiC particles in an iron
matrix. Ren et al. [7] employed an electrical arc furnace to form a 10% TiC but did not report
anything about the composite properties.
Capaldi et al. [8] synthesized the Fe-TiC with self-propagating high-temperature synthesis (SHS) and
investigated the thermodynamics of TiC formation via the combustion method. Similar research on
the formation of TiC denotes that the wetability of TiC by liquid iron is suitable [4,5,9]. Fan et al.
[10] used the combustion synthesis process to form Fe-TiC and measured the effect of Ti powder size
5
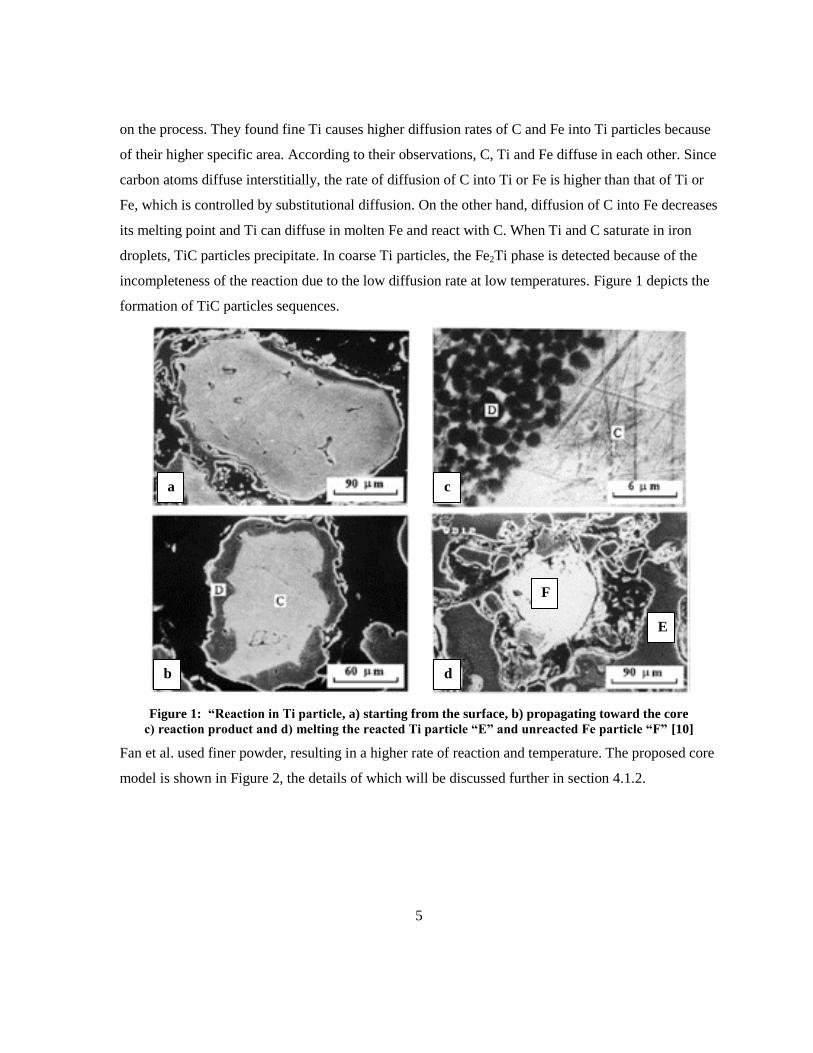
on the process. They found fine Ti causes higher diffusion rates of C and Fe into Ti particles because
of their higher specific area. According to their observations, C, Ti and Fe diffuse in each other. Since
carbon atoms diffuse interstitially, the rate of diffusion of C into Ti or Fe is higher than that of Ti or
Fe, which is controlled by substitutional diffusion. On the other hand, diffusion of C into Fe decreases
its melting point and Ti can diffuse in molten Fe and react with C. When Ti and C saturate in iron
droplets, TiC particles precipitate. In coarse Ti particles, the Fe2Ti phase is detected because of the
incompleteness of the reaction due to the low diffusion rate at low temperatures. Figure 1 depicts the
formation of TiC particles sequences.
Figure 1: “Reaction in Ti particle, a) starting from the surface, b) propagating toward the core
c) reaction product and d) melting the reacted Ti particle “E” and unreacted Fe particle “F” [10]
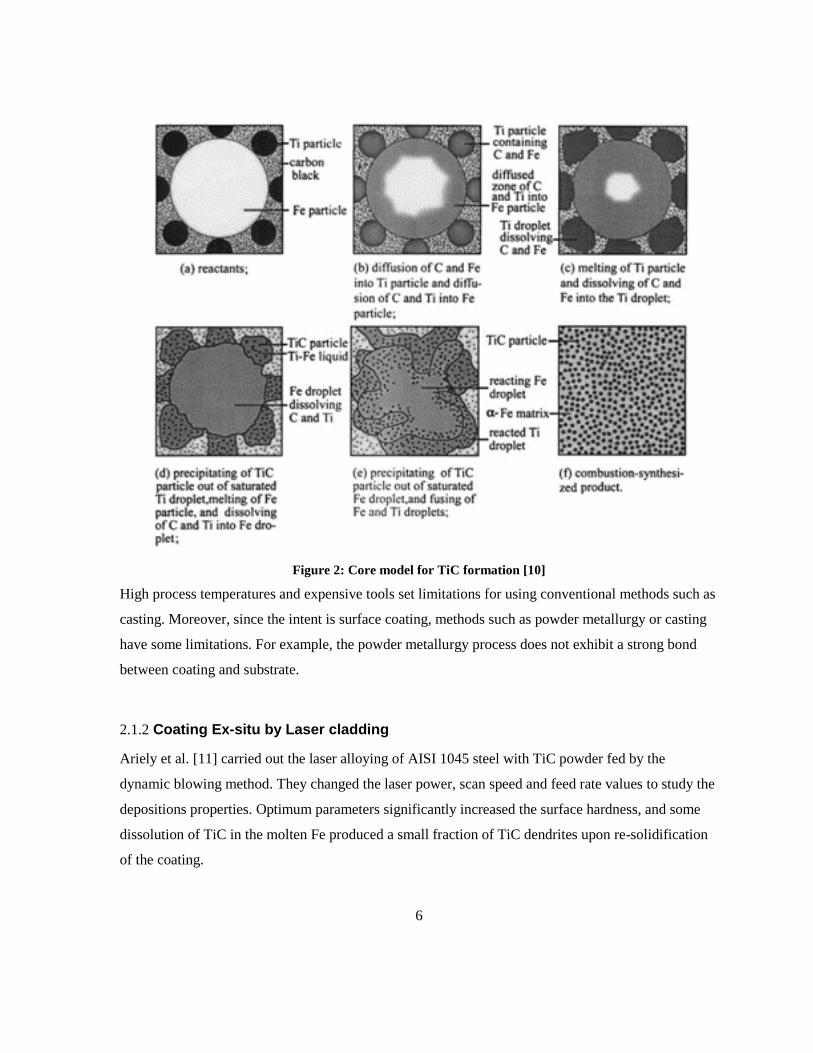
Fan et al. used finer powder, resulting in a higher rate of reaction and temperature. The proposed core
model is shown in Figure 2, the details of which will be discussed further in section 4.1.2.
a
b
c
d
F
E
6
Figure 2: Core model for TiC formation [10]
High process temperatures and expensive tools set limitations for using conventional methods such as
casting. Moreover, since the intent is surface coating, methods such as powder metallurgy or casting
have some limitations. For example, the powder metallurgy process does not exhibit a strong bond
between coating and substrate.
2.1.2 Coating Ex-situ by Laser cladding
Ariely et al. [11] carried out the laser alloying of AISI 1045 steel with TiC powder fed by the
dynamic blowing method. They changed the laser power, scan speed and feed rate values to study the
depositions properties. Optimum parameters significantly increased the surface hardness, and some
dissolution of TiC in the molten Fe produced a small fraction of TiC dendrites upon re-solidification
of the coating.
7
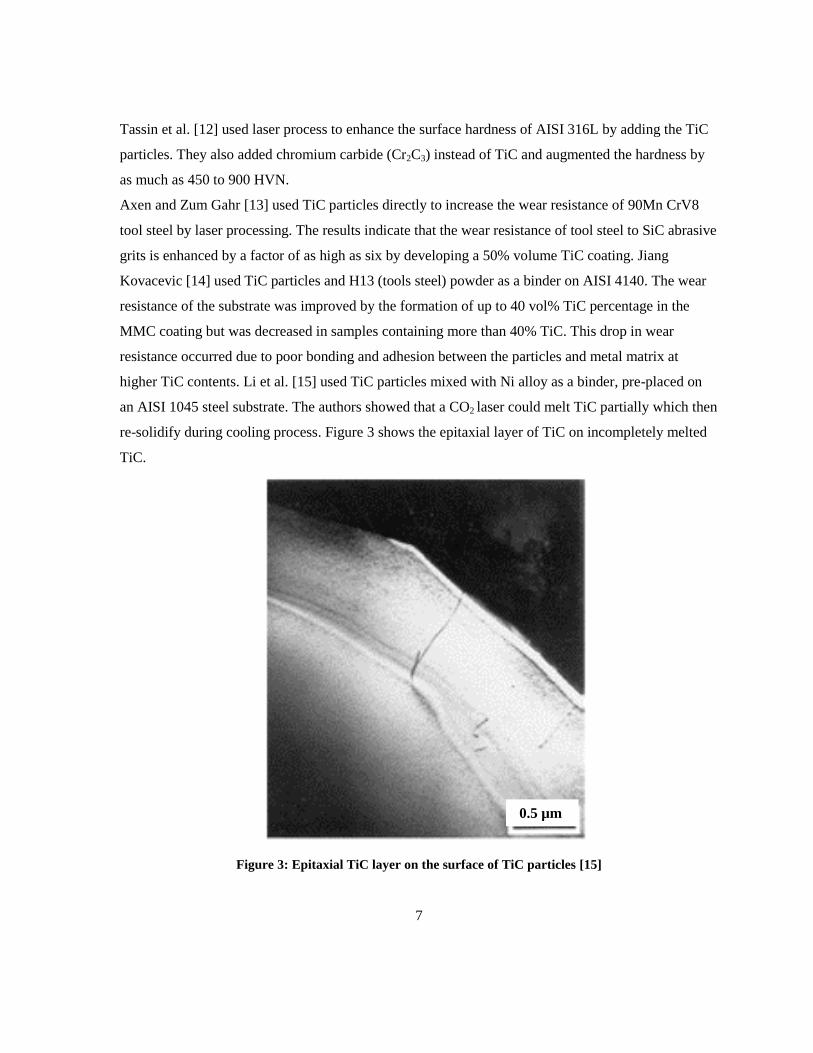
Tassin et al. [12] used laser process to enhance the surface hardness of AISI 316L by adding the TiC
particles. They also added chromium carbide (Cr2C3) instead of TiC and augmented the hardness by
as much as 450 to 900 HVN.
Axen and Zum Gahr [13] used TiC particles directly to increase the wear resistance of 90Mn CrV8
tool steel by laser processing. The results indicate that the wear resistance of tool steel to SiC abrasive
grits is enhanced by a factor of as high as six by developing a 50% volume TiC coating. Jiang
Kovacevic [14] used TiC particles and H13 (tools steel) powder as a binder on AISI 4140. The wear
resistance of the substrate was improved by the formation of up to 40 vol% TiC percentage in the
MMC coating but was decreased in samples containing more than 40% TiC. This drop in wear
resistance occurred due to poor bonding and adhesion between the particles and metal matrix at
higher TiC contents. Li et al. [15] used TiC particles mixed with Ni alloy as a binder, pre-placed on
an AISI 1045 steel substrate. The authors showed that a CO2 laser could melt TiC partially which then
re-solidify during cooling process. Figure 3 shows the epitaxial layer of TiC on incompletely melted
TiC.
Figure 3: Epitaxial TiC layer on the surface of TiC particles [15]
0.5 µm
8
Gaard et al. [16] used an Fe-Ni mixture as a matrix for TiC particles using a pre-placed powder
method and observed thermal cracking and porosity in the samples. Decreasing the TiC percentage to
30% eliminated the cracks but not the porosity; moreover, when the TiC percentage in the coating
was decreased, the hardness was significantly decreased. Similar results were experienced by
Kathuria [17] for Cr2C3 cermet. Wanliang et al. [18] utilized a Ti-TiC powder mixture on Ti-6Al-4V
by the pre-place method, reporting an increase in the microhardness of clad to 1100HVN. Titanium is
a binder and also forms TiO2 in the clad. Sun et al. [19] used TiC particles in a Ti and NiCrBSi
matrix on Ti-6Al-4V alloy. They discovered that the hardness of the clad was increased to 500-700
and 900-1100 HVN for Ti and Ni alloy, respectively, and that the wear resistance was enhanced in
both samples in different amounts.
Wu [20] investigated a TiC/Ti dissolution precipitation on Ti6Al4V substrate utilizing the preplaced
method. In using the ex-situ process and applying a very high laser power (i.e 6 kW), a liquid molten
pool developed. TiC particles were formed from the liquid state of Ti+TiC in which the observed
morphologies were dendritic. Moreover, according to the substrate material, formation of VC is
feasible. Using a high amount of laser power in this research resulted in increasing the dilution, heat
affected zone and thermal stress in the clad.
Candel et al.[21] formed ex-situ TiC in Ti6Al4V as a binding powder on a Ti6Al4V substrate. They
applied two different specific energies for 30 and 60 vol% TiC in order to study the wear properties.
By increasing the volume fraction, the clad microhardness was enhanced. They found that increasing
the specific energy resulted in dissolving the TiC in the matrix and precipitated in dendrite formation.
Although the re-precipitation mechanism increased the microhardness results, sliding wear resistance
was not improved. Results showed that the clad with 30% TiC had almost the same wear properties as
uncoated substrate.
Sun et al. [22] deposited TiC-NiCrBSi on a Ti6Al4V substrate by laser cladding. In three detected
zones, γNiP, and γNie+Ni3B eutectics, TiC particles and dendrites and Cr23C6, CrB and TiB2 were
detected. Solution re-precipitation mechanism was the main reason for formation of TiC dendrites.
Enhanced wear properties resulted from a variety of phase transformations, including carbides,
borides, etc. Therefore, regarding diversity of formed phases, it is difficult to address the accurate
wear mechanism or find the TiC effect on wear resistance.
Dong and Wang [23]studied a TiC-reinforced Ti-Ni-Si intermetallic composite coating with a
microstructure consisting of TiC uniformly distributed in Ti2Ni3Si-NiTi-Ti2Ni multi-phase. An
9
intermetallic matrix was fabricated on a substrate of TA15 titanium alloy by the laser cladding
process using TiC/Ti-Ni-Si alloy powders as the precursor materials. Results indicated that the
TiC/( Ti2Ni3Si-NiTi-Ti2Ni) intermetallic composite coating exhibited excellent abrasive and adhesive
wear resistance.
Paul et al. [24] used WC-12 Co with a pulsed laser to increase the wear resistance to form a dense and
crack-free coating. Hiduci et al. [25] used tungsten carbide (WC) particles in a nickel-based alloy on
low carbon steel by a CO2 laser. The coating was dense with good bonding to the substrate but
contained many cracks. The use of the nickel and cobalt-based alloy without reinforcements was also
investigated, but the results did not show a considerable effect on the hardness.
2.1.3 In-Situ Laser Cladding
Wu and Hong [26] studied the microstructure and mechanical properties of two types of TiC particles
in nickel-based alloy with a CO2 laser, in-situ reacted TiC particles, and direct-added TiC particles
(i.e., ex-situ). They measured elastic modulus and hardness by nano indentation for both types of
particles. Results confirmed that the hardness and wear resistance of an in-situ-reacted TiC coating
were better than ex-situ TiC-based coatings. Moreover, load-displacement curves for ex-situ TiC
particles revealed a pop-in phenomenon caused by plastic deformation and crack formation or de-
bonding of TiC from the matrix. The interface between the particle and matrix affects the mechanical
properties of the coating. As most coating failures happen in the interface zone, this may be due to
stress concentrations at the interface. The higher bond strength in in-situ produced composites helps
prevent such failure. In addition, the in-situ process generates sub-micron-sized ceramic particles
which are often much smaller than those formed in ex-situ methods. In the above research, TiC
particles are less than 6µm, despite the use of starting Ti and C particle sizes on the scale of 320 and
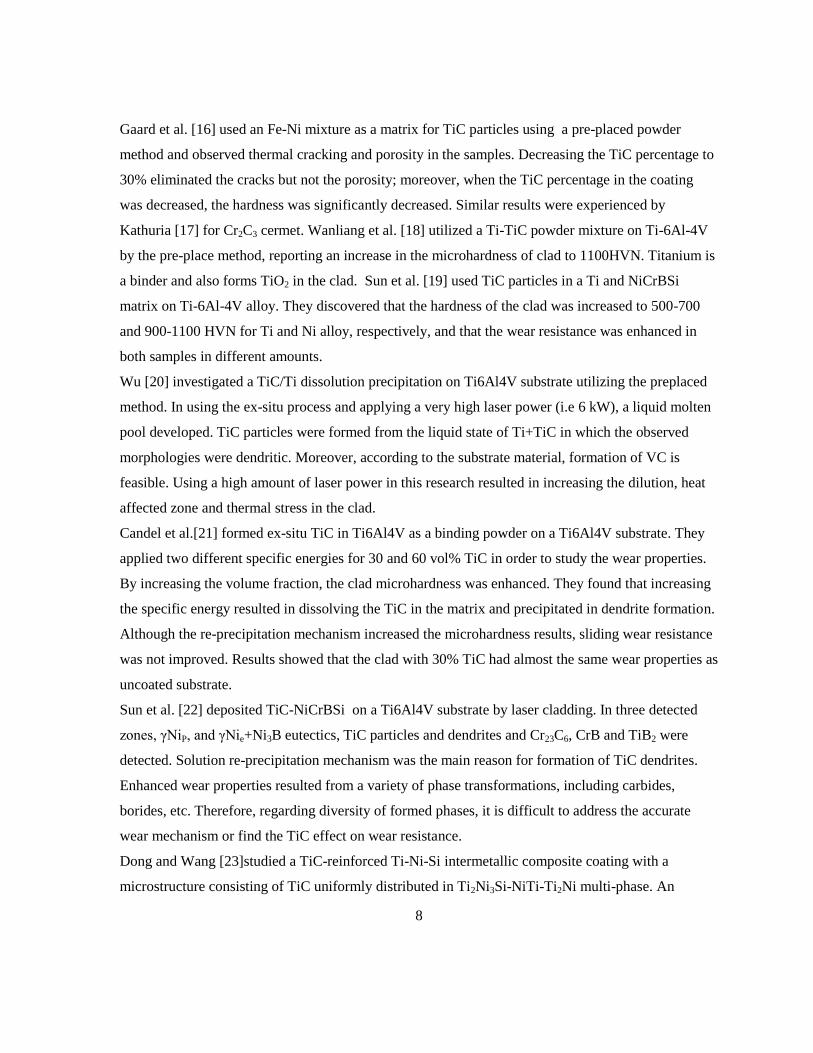
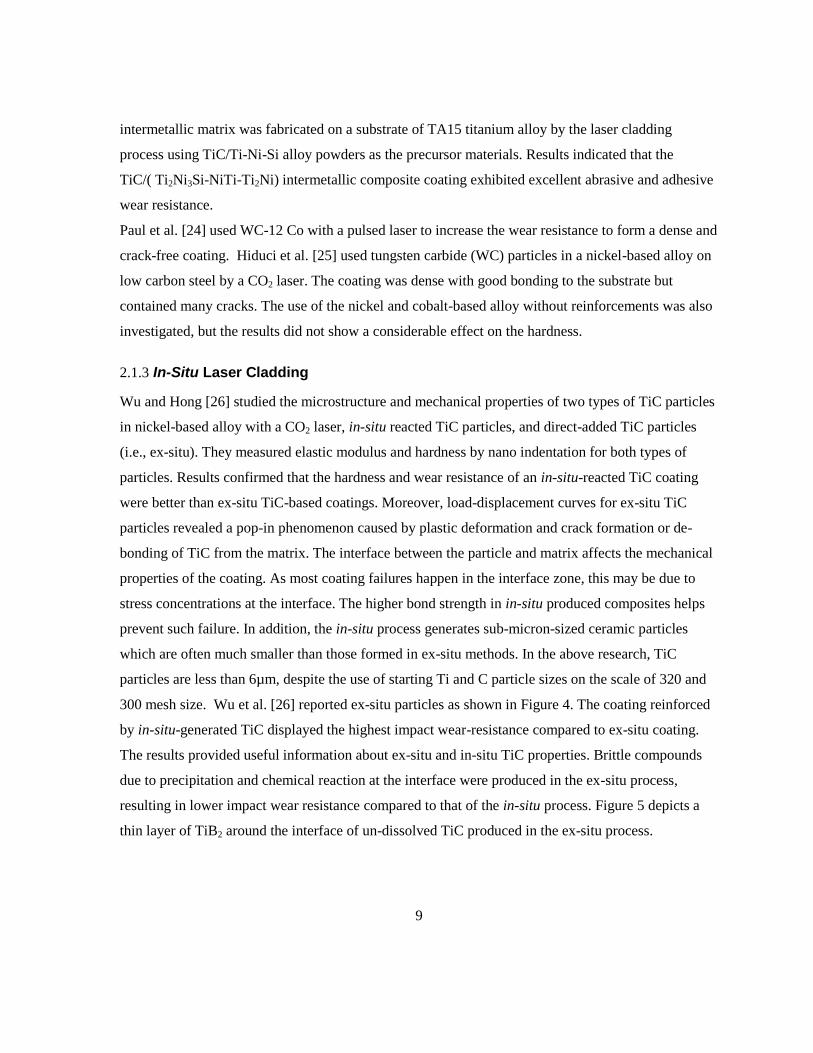
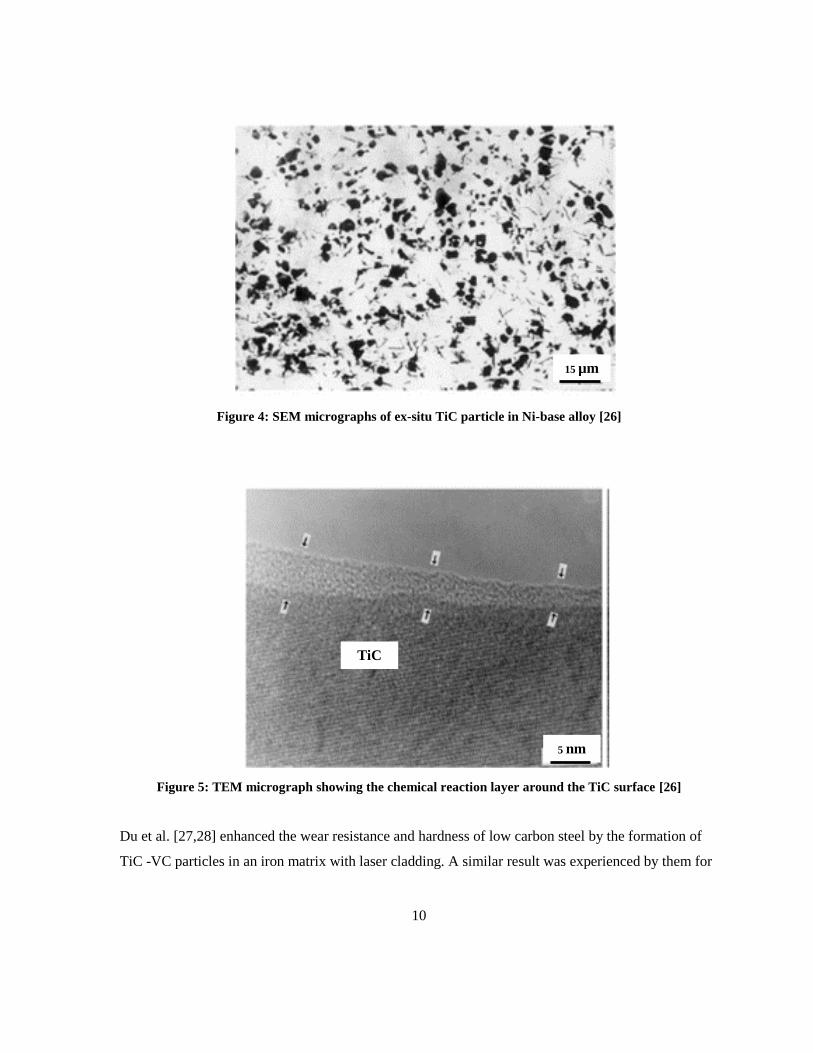
300 mesh size. Wu et al. [26] reported ex-situ particles as shown in Figure 4. The coating reinforced
by in-situ-generated TiC displayed the highest impact wear-resistance compared to ex-situ coating.
The results provided useful information about ex-situ and in-situ TiC properties. Brittle compounds
due to precipitation and chemical reaction at the interface were produced in the ex-situ process,
resulting in lower impact wear resistance compared to that of the in-situ process. Figure 5 depicts a
thin layer of TiB2 around the interface of un-dissolved TiC produced in the ex-situ process.
10
Figure 4: SEM micrographs of ex-situ TiC particle in Ni-base alloy [26]
Figure 5: TEM micrograph showing the chemical reaction layer around the TiC surface [26]
Du et al. [27,28] enhanced the wear resistance and hardness of low carbon steel by the formation of
TiC -VC particles in an iron matrix with laser cladding. A similar result was experienced by them for
15 µm
5 nm
TiC
11
TiC- TiB2. This increase in hardness was due to carbides being distributed uniformly in a metal
matrix.
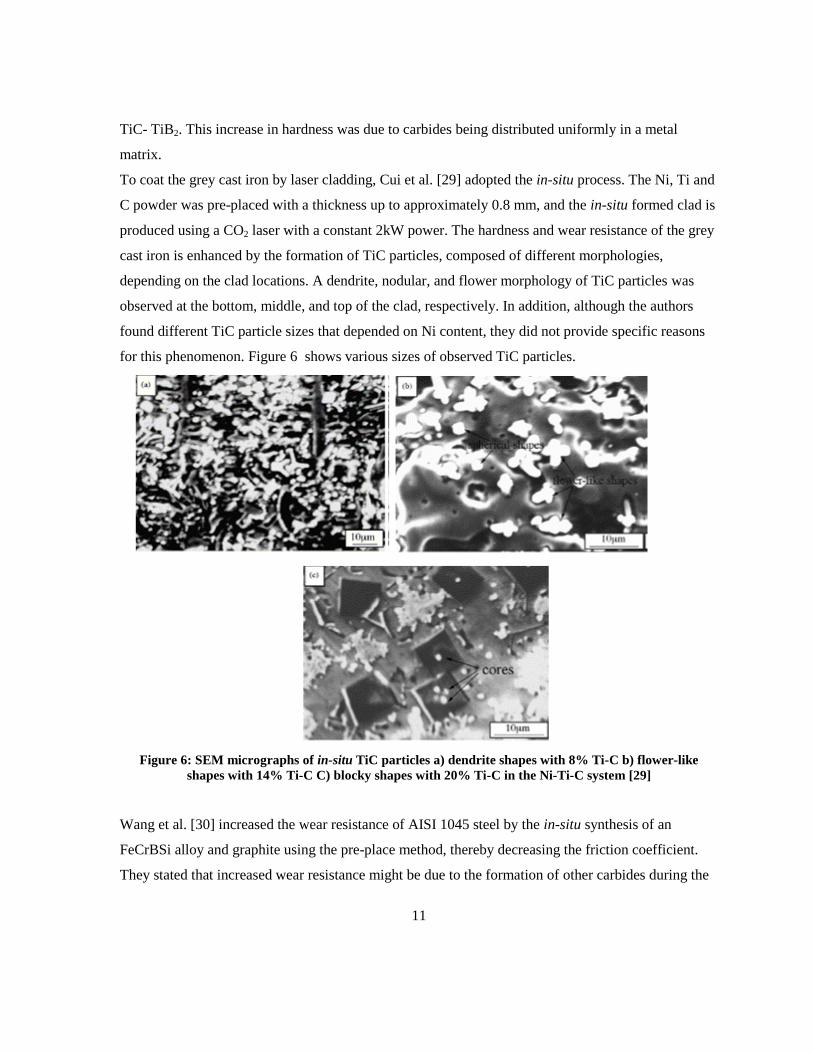
To coat the grey cast iron by laser cladding, Cui et al. [29] adopted the in-situ process. The Ni, Ti and
C powder was pre-placed with a thickness up to approximately 0.8 mm, and the in-situ formed clad is
produced using a CO2 laser with a constant 2kW power. The hardness and wear resistance of the grey
cast iron is enhanced by the formation of TiC particles, composed of different morphologies,
depending on the clad locations. A dendrite, nodular, and flower morphology of TiC particles was
observed at the bottom, middle, and top of the clad, respectively. In addition, although the authors
found different TiC particle sizes that depended on Ni content, they did not provide specific reasons
for this phenomenon. Figure 6 shows various sizes of observed TiC particles.
Figure 6: SEM micrographs of in-situ TiC particles a) dendrite shapes with 8% Ti-C b) flower-like
shapes with 14% Ti-C C) blocky shapes with 20% Ti-C in the Ni-Ti-C system [29]
Wang et al. [30] increased the wear resistance of AISI 1045 steel by the in-situ synthesis of an
FeCrBSi alloy and graphite using the pre-place method, thereby decreasing the friction coefficient.
They stated that increased wear resistance might be due to the formation of other carbides during the
12
process, not just TiC particles. Yang et al. [31] investigated a Ni-based composite coating reinforced
by in-situ TiC particles on medium carbon steel. The clad hardness was increased to as high as
1200HVN, which is four times greater than the substrate’s. Yang et al. [32] used a different weight
ratio of a nickel-based alloy, titanium and graphite powders with the in-situ laser cladding process on
a carbon steel substrate. The composite is composed of various TiC morphologies and nickel dendrite
as well as other carbides such as M23C6. The authors suggested that different thermal gradients and
solidification rates from the bottom to the top of the clad play a crucial role in the morphology of
nodular, cluster and flower-shaped TiC particles. While they did not explain the details of TiC
formation, they did increase the microhardness up to 850 HVN, which is three times greater than a
steel substrate.
Wang et al. [33] created an in-situ TiC in nickel-based alloy and deposited it on the steel substrate.
They then applied the dynamic blow method and enhanced the hardness up to 1200 HVN, which is
fairly high because of formation of other intermetallics such as Ni3B, and CrB.
Du et al. [27, 28] explored ferro-titanium, graphite and vanadium in an iron matrix to form TiC-VC
particles. In a similar research, they formed TiB2 by applying an in-situ pre-place method to increase
the surface hardness of steel substrate and also used Ni-Ti-B4C to form TiC and TiB2. In both cases,
the hardness result was increased to 800 HVN.
The in-situ process was likewise selected by Yan et al. [34], who formed the TiC in nickel-based
alloy on mild steel. During the cladding process, other types of particles such as Cr23C6, Ni5Si2 and
Cr2B evolved and increased the hardness uniformly on top of the second clad layer. They observed
the microstructure, but the details of particle formation were not investigated. Unfortunately, the
contribution of each particle to the overall hardness was not discussed in this work.
After Yang et al. [35] proposed a Ni-based alloy and in-situ TiC with a dynamic blowing on mild
steel, they investigated multi-layer clad properties. Experimental studies show that CrB, Ni3B and
M23C6 can be formed with TiC. The microhardness value is increased to 1200 HVN. Wu et al. [36]
developed TiC particles in an Ni-based alloy (Cr, B, Si ,C) matrix coating on 5CrMnMo steel using a
pre-placed method. They increased the hardness and investigated the different morphologies of TiC.
However, while they did observe various morphologies for TiC at different levels of the clad zone, no
specific mechanism was pointed out to interpret the morphologies.
Yang et al. [32,37] used dynamic blow method to deposit nickel-based alloy reinforced by in-situ TiC
on a steel substrate. They succeeded in forming in-situ TiC particles and increasing the hardness to
13
1200HVN. The authors observed different morphologies and particle sizes of the TiC, depending on
the clad position. Nevertheless, different morphologies and reinforcement sizes do affect the
properties, a fact which was not pointed out in Yang’s work.
Wang et al. [38] used an in-situ synthesis method to form TiC particles in Fe matrix. They pre-placed
mixed ferrotitanium (Fe-Ti) and graphite powders to form a composite coating by the laser cladding
process. Different TiC morphologies have been observed in Fe matrices, such as nodular and flower
shapes, but probable reasons or mechanisms to interpret the various TiC morphologies are not
investigated in this paper. Results confirmed the higher wear resistance of the coating compared to
the substrate.
Li et al. [39] produced clad layers of in-situ TiC-Ni on carbon steel by the dynamic blowing method.
They conducted microhardness and bending tests on a series of samples deposited with 20, 30, and
40wt% Ni content. By increasing the volume fraction of TiC in the clad, the microhardness increased
to 2200 HVN, and bending results decreased by increasing the Ni content. These circumstances were
not expected in the study. Moreover, since they used laser power in the range of 2400-2600W,
information about the actual clad chemical composition resulting from dilution was not provided. As
well, they deposited the clad layers with a 30% overlap, but here again no information was provided
about the probable different microstructures and mechanical properties resulting from different
microstructures of the overlapped zone or from the rest of the clad.
Li et al. [40] studied how a titanium matrix composite coating reinforced by in-situ synthesized TiB
and TiC is deposited on Ti6Al4V by laser cladding. Their results showed that the coating is composed
of Ti cellular dendrites and an eutectic in which a large number of needle-shaped TiB whiskers and a
few equiaxial TiC particles are embedded. Deposited clad showed enhanced microhardness compared
to the substrate.
Wang et al. [41] studied microstructure and wear properties of in-situ formation of TiC and (Ti,V)C.
They increased the volume fraction of carbides through the matrix by adding V element to the powder
and observed finer carbide particles in the presence of V. Dendrite carbides were detected by them,
which could have been due to the high laser power they used (i.e., 2500 W) in the preplaced method
to increase the wear resistance of AISI 1045 steel as a substrate. Dissolving V in a Fe matrix can be
another reason for better wear-resistance of the clad.
14
2.1.4 Other Methods
Welding processes have also been used for the in-situ formation of MMC. Wang et al. [33] attempted
to build up in-situ TiC particles by the GTAW melting process. Their results revealed that in-situ TiC
particles were formed, surface hardness increased up to 800 HVN, and different morphologies of TiC
in a nickel-based alloy were formed. Liu et al. [42] also used the plasma transferred arc weld (PTA)
to form TiC in a metal matrix. They reported a high wear resistance and excellent surface hardness.
Although welding processes generally are not expensive compared to laser processing, they do create
a wide heat affected zone area because of their high heat input, which potentially degrades
mechanical properties. Therefore, this effect should be taken into account during process selection.
2.2 Solidification Behavior During Laser Cladding
This section presents solidification theory which plays a crucial role in the laser cladding process.
Solidification conditions determine the clad microstructure and should be a determining factor in TiC
morphology and TiC distribution patterns in an iron matrix.
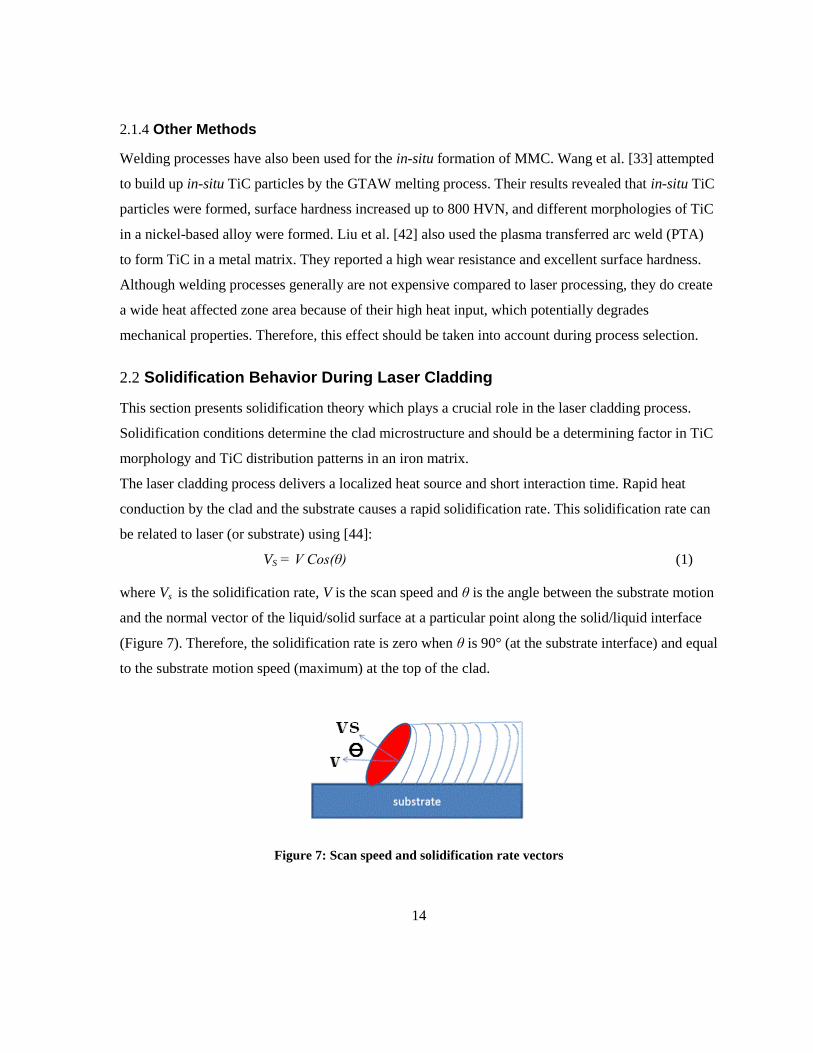
The laser cladding process delivers a localized heat source and short interaction time. Rapid heat
conduction by the clad and the substrate causes a rapid solidification rate. This solidification rate can
be related to laser (or substrate) using [44]:
VS = V Cos(θ) (1)
where Vs is the solidification rate, V is the scan speed and θ is the angle between the substrate motion
and the normal vector of the liquid/solid surface at a particular point along the solid/liquid interface
(Figure 7). Therefore, the solidification rate is zero when θ is 90° (at the substrate interface) and equal
to the substrate motion speed (maximum) at the top of the clad.
Figure 7: Scan speed and solidification rate vectors
15
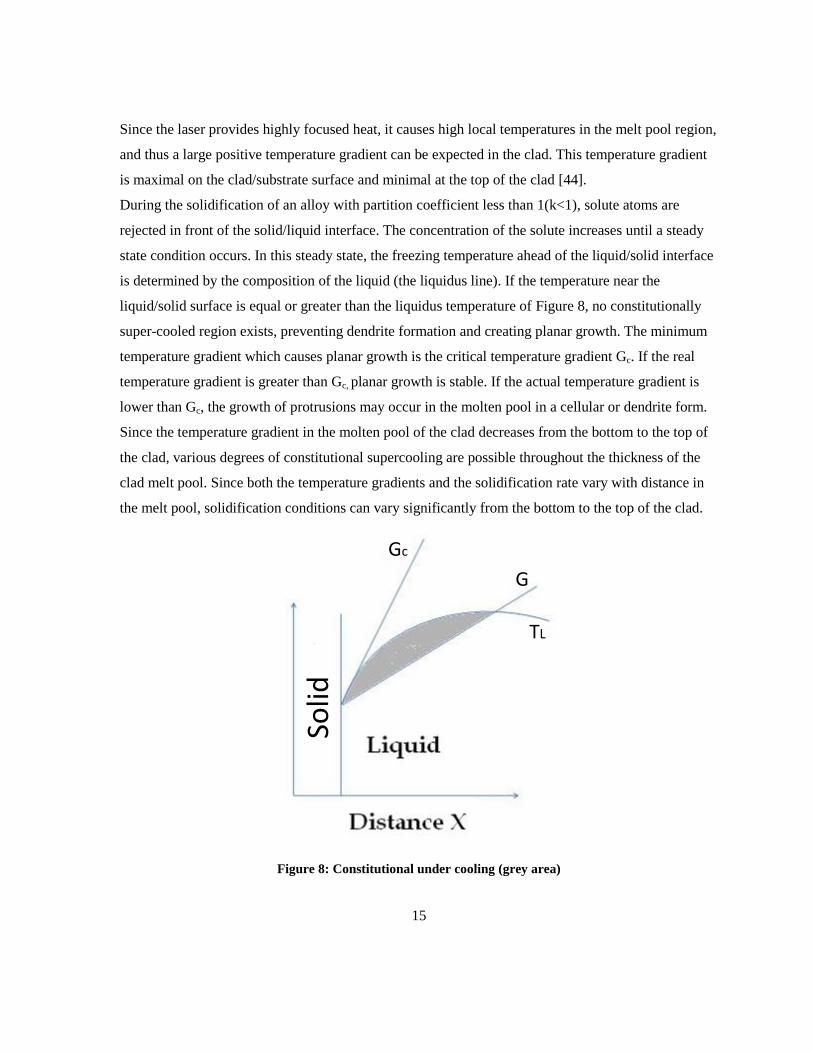
Since the laser provides highly focused heat, it causes high local temperatures in the melt pool region,
and thus a large positive temperature gradient can be expected in the clad. This temperature gradient
is maximal on the clad/substrate surface and minimal at the top of the clad [44].
During the solidification of an alloy with partition coefficient less than 1(k<1), solute atoms are
rejected in front of the solid/liquid interface. The concentration of the solute increases until a steady
state condition occurs. In this steady state, the freezing temperature ahead of the liquid/solid interface
is determined by the composition of the liquid (the liquidus line). If the temperature near the
liquid/solid surface is equal or greater than the liquidus temperature of Figure 8, no constitutionally
super-cooled region exists, preventing dendrite formation and creating planar growth. The minimum
temperature gradient which causes planar growth is the critical temperature gradient Gc. If the real
temperature gradient is greater than Gc, planar growth is stable. If the actual temperature gradient is
lower than Gc, the growth of protrusions may occur in the molten pool in a cellular or dendrite form.
Since the temperature gradient in the molten pool of the clad decreases from the bottom to the top of
the clad, various degrees of constitutional supercooling are possible throughout the thickness of the
clad melt pool. Since both the temperature gradients and the solidification rate vary with distance in
the melt pool, solidification conditions can vary significantly from the bottom to the top of the clad.
Solid
TL
Gc
G
Figure 8: Constitutional under cooling (grey area)
16
2.3 Phase Diagram
In this research, Fe, Ti and C are the primary components. The binary and ternary diagrams help to
find the phases which are expected to appear during the process. Although the laser cladding process
is a non-equilibrium process, phase diagrams are useful guides to interpret and estimate the results.
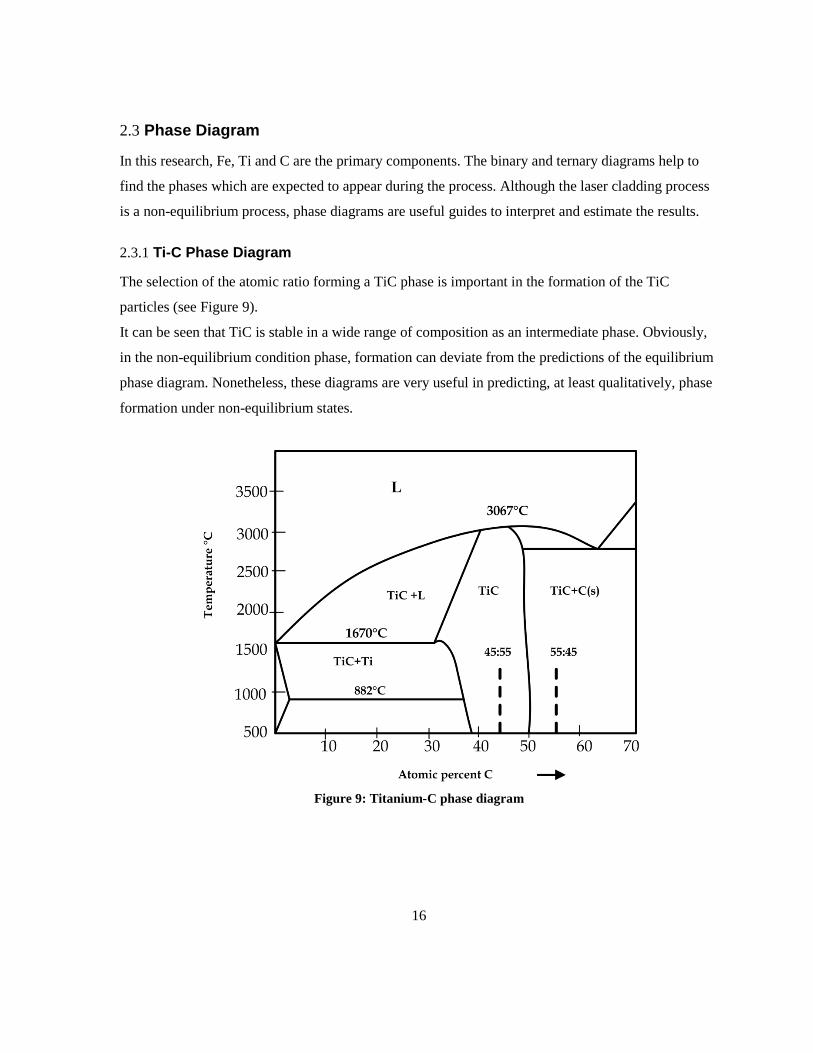
2.3.1 Ti-C Phase Diagram
The selection of the atomic ratio forming a TiC phase is important in the formation of the TiC
particles (see Figure 9).
It can be seen that TiC is stable in a wide range of composition as an intermediate phase. Obviously,
in the non-equilibrium condition phase, formation can deviate from the predictions of the equilibrium
phase diagram. Nonetheless, these diagrams are very useful in predicting, at least qualitatively, phase
formation under non-equilibrium states.
Figure 9: Titanium-C phase diagram
17
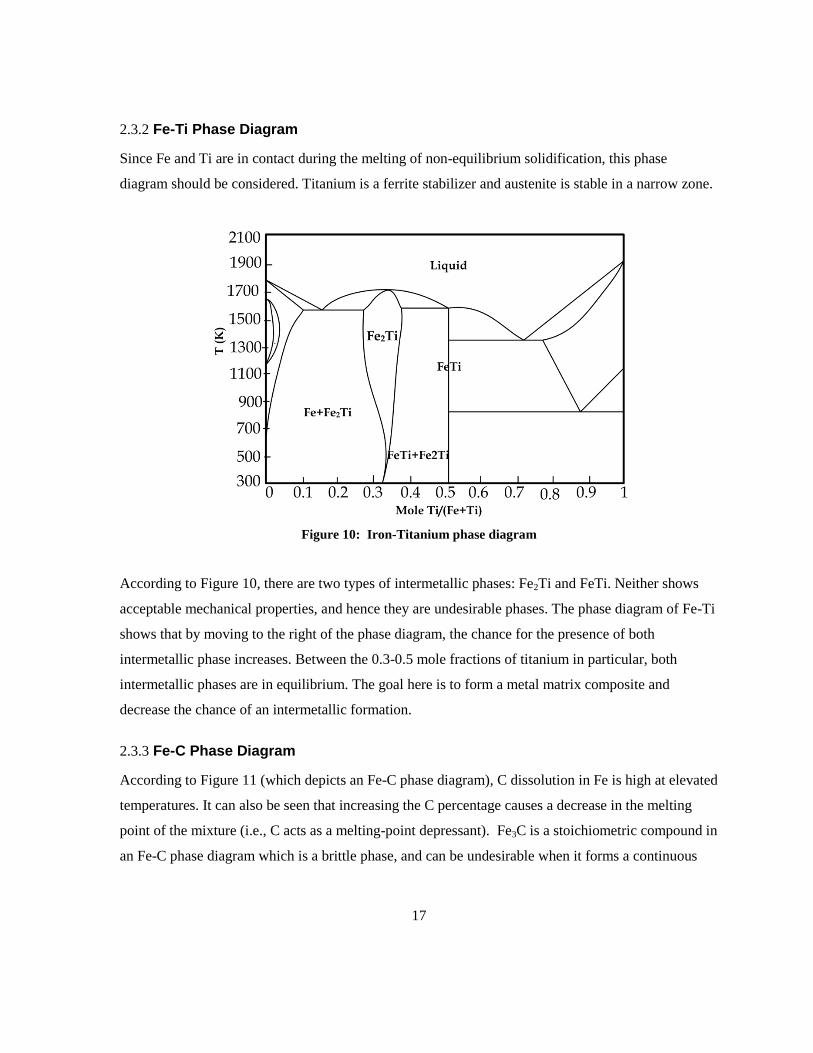
2.3.2 Fe-Ti Phase Diagram
Since Fe and Ti are in contact during the melting of non-equilibrium solidification, this phase
diagram should be considered. Titanium is a ferrite stabilizer and austenite is stable in a narrow zone.
Figure 10: Iron-Titanium phase diagram
According to Figure 10, there are two types of intermetallic phases: Fe2Ti and FeTi. Neither shows
acceptable mechanical properties, and hence they are undesirable phases. The phase diagram of Fe-Ti
shows that by moving to the right of the phase diagram, the chance for the presence of both
intermetallic phase increases. Between the 0.3-0.5 mole fractions of titanium in particular, both
intermetallic phases are in equilibrium. The goal here is to form a metal matrix composite and
decrease the chance of an intermetallic formation.
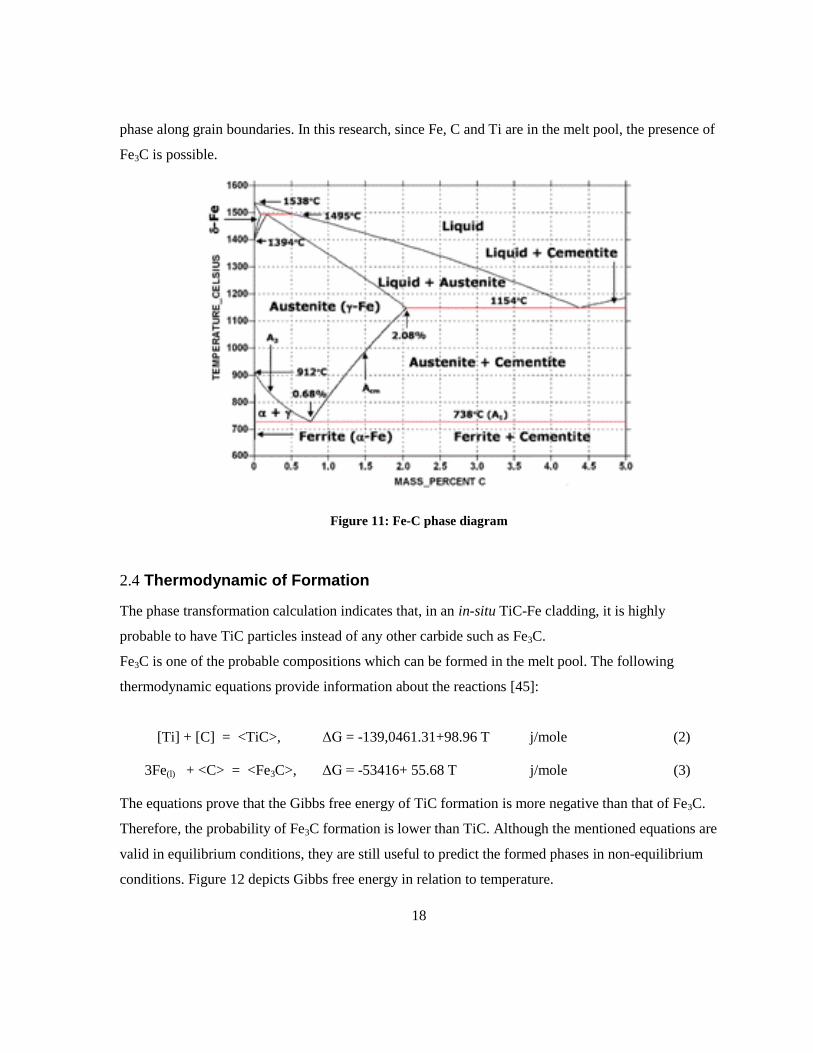
2.3.3 Fe-C Phase Diagram
According to Figure 11 (which depicts an Fe-C phase diagram), C dissolution in Fe is high at elevated
temperatures. It can also be seen that increasing the C percentage causes a decrease in the melting
point of the mixture (i.e., C acts as a melting-point depressant). Fe3C is a stoichiometric compound in
an Fe-C phase diagram which is a brittle phase, and can be undesirable when it forms a continuous
18
phase along grain boundaries. In this research, since Fe, C and Ti are in the melt pool, the presence of
Fe3C is possible.
Figure 11: Fe-C phase diagram
2.4 Thermodynamic of Formation
The phase transformation calculation indicates that, in an in-situ TiC-Fe cladding, it is highly
probable to have TiC particles instead of any other carbide such as Fe3C.
Fe3C is one of the probable compositions which can be formed in the melt pool. The following
thermodynamic equations provide information about the reactions [45]:
[Ti] + [C] = <TiC>, ΔG = -139,0461.31+98.96 T j/mole (2)
3Fe(l) + <C> = <Fe3C>, ΔG = -53416+ 55.68 T j/mole (3)
The equations prove that the Gibbs free energy of TiC formation is more negative than that of Fe3C.
Therefore, the probability of Fe3C formation is lower than TiC. Although the mentioned equations are
valid in equilibrium conditions, they are still useful to predict the formed phases in non-equilibrium
conditions. Figure 12 depicts Gibbs free energy in relation to temperature.
19
Figure 12: TiC and Fe3C formation (Gibss free enegy vs Temperature)
2.4.1 Objectives
From the above literature review, the in-situ formation of TiC particle metal matrix composites
through laser cladding emerges as a feasible process. Furthermore, it is widely reported that the
hardness and wear resistance of the substrate can be significantly enhanced by the formation of a
TiC-based composite coating. It is also clear that the TiC morphology can vary throughout the clad
thickness, but no detailed or satisfactory explanation as to why this happens, or what the mechanism
of TiC formation is during laser cladding, has been published. This lack of understanding is partly
due to the majority of published studies reporting only one or two laser process parameters, such as
laser power and scan speed, and thus there is a lack of knowledge of the relationship between clad
microstructure and laser processing parameters. In addition, most researchers have focused on the
use of rather complex, multi-component metal matrix powders containing various combinations of
Ni, Fe, Co, Cr, B or Si. This can produce a variety of carbides other than TiC and create complex
solidification behavior during cooling. Only limited recently published studies are found which
produced an in-situ TiC composite coating on steel using Ti, Fe and C powders. However, these
studies used limited laser power, scan speed and powder feed rate and, while proving that hardness
and wear resistance are increased, they contained little fundamental information of clad formation
mechanisms. Furthermore, very little prior literature (and none for the case of C-Fe-Ti) has
-1400000
-1200000
-1000000
-800000
-600000
-400000
-200000
0
200000
0 1000 2000 3000 4000
Gib
bs
Fre
e E
ne
rgy
(J/m
ole
)
Temperature (C)
Gibbs Free Energy of TiC
Gibbs Free Energy For Fe3C
20
interpreted phase formation and morphology in terms of phase equilibrium, despite well-publicized
data reported for the C-Fe-Ti phase diagram [6,43]. Finally, while laser cladding is a rapid
solidification process, no prior literature has yet applied the fairly well-developed rapid solidification
theory applicable to laser cladding to the specific case of in-situ composite formation using Fe-Ti-C
phase diagrams.
The material system of focus in this research will be the in-situ formation of Fe-TiC composite
coatings using only commercially available pure Ti, Fe and C powders deposited on a low carbon
steel substrate. This simplifies the material systems while maintaining the production of a composite
coating that has commercial relevance. An initial goal of this research includes an investigation of a
wide range of laser processing parameters (i.e., laser power, scanning speed and powder feed rate) in
order to determine their impact on basic clad characteristics such as clad density, clad/substrate
bonding, clad height and dilution. A second objective is to determine the relationship between laser
processing conditions and the Fe-TiC clad microstructure. This will involve an understanding of the
TiC formation mechanism and its dependence on the solidification behavior that occurs during
processing. The third objective is to determine an optimum cladding condition to produce a high
performance Fe-TiC-based in-situ composite coating in terms of uniform distribution of TiC in the
matrix and clad hardness. This objective will include a study on the relationships amongst laser
parameters, TiC morphology and clad microstructure. The fourth objective is to increase the TiC
volume fraction by increasing the C:Ti and decreasing the Fe percentages in the powder in order to
increase the hardness and wear resistance of the clad. The hardness and wear resistance of the
produced coatings with five different powder compositions (explored with two laser conditions) are
determined by the hardness and wear tests. An analysis of the solidification behavior using ternary
C-Fe-Ti phase equilibrium and rapid solidification theory is also included.
21
Chapter 3
Experimental Methods and Results
3.1 Experimental Method
AISI 1030 medium carbon steel was chosen as the substrate with 0.28-0.34C, 0.6-0.9 Mn, P less than
0.04, and S less than 0.05 in wt %. The substrate dimensions on which the claddings were performed
are 100×30×6.35 mm. The substrates were shot-blasted and rinsed with ethanol followed by acetone
before laser cladding.
Mixtures of Ti, carbon and iron powder from Alfastar Co. were placed in a Sulzer Metco TWIN 10-C
powder feeder with a side hopper, which was used to feed the mixture of Ti, C, and iron powder into
the melt pool. The ratios between the Ti and C were Ti-45 at% C and Ti-55 at% C atomic percent. Ti-
45 at% C composition was chosen because it has the potential to produce a 100% TiC compound with
no excess of α (Ti), ß (Ti) or carbon. The Ti-55 at% C was chosen to speficially investigate the case
of excess carbon. The Fe, Ti and C pre-cursor powders had the specifications listed in Table 1. Five
different powder compositions were considered in this research, according to Table 2. The first digit
of the composition code stands for Fe percentage (7 for 70 wt% Fe) and the next two digits stands for
C atomic percent on a Ti +C basis as described above (i.e. Ti-45 at% C or Ti-55 at% C) (Figure 9).
Except for sections 3.2.4 and 3.2.5, the default powder has a composition of 745 in the rest of this
research. To obtain a homogeneous distribution, all three powders were blended for 2 hours at 300
rpm in a quarter-filled jar of 165×60 mm with a milling media of glassy balls, where the ball-to-
powder-size ratio was 20:1.
An IPG fiber laser model YLR-1000-IC operated in continuous mode with a maximum power of 1
kW was used to produce a series of single-clad tracks. The diameter of the laser beam spot size on the
workpiece (WP) surface was fixed at 2.5 mm. The laser machine was integrated with a five-axis CNC
vertical machining centre to control the velocity of the workpiece. To protect the melt pool from
oxidation, Argon shielding gas was supplied through a nozzle at 10 Lmin-1
.
In order to analyze the wear resistance of the Fe-TiC, two laser conditions were selected for further
study (i.e., conditions A and B). According ASTM G65-04, a dry sand/rubber wheel, low-stress,
coarse and abrasive (three-body rolling) procedure A, was used to determine the wear resistance of
the samples. Wear test sample size was selected based on ASTM G65 (i.e., 75×28×6 mm) and coated
22
with overlapping multi laser clad tracks of Fe-TiC in order to create an area of composite coating.
Samples were ground and polished with diamond to achieve a 0.8 µm or lower surface roughness.
Consequently, they were smooth and flat (within 0.125 mm). Before the wear test, samples were
rinsed to remove contamination resulting from sample preparation.
The specimens were sectioned for microstructural examination in a longitudinal direction. The
samples were prepared using SiC grit paper with grit mesh sizes from 240 to 1000 and polished with
alumina powder from 5 micron to 0.03 micron. Afterwards, the samples were placed in an ultrasonic
machine to remove any contamination and then rinsed with alcohol and air dried.
The microstructures and compositions were analyzed using scanning electron microscopy (SEM) and
energy dispersed spectrometry (EDS), respectively. Moreover EDS analysis is used to analyze the
clad zone in order to measure and report the dilution instead of using conventional method that
measure the dilution by clad dimensional characteristics [44].
Rigaku FC-8 X-Ray diffractometer with a Cu-Kα radiation operated at 50kV and 40mA was used to
analyze the clad coating phase structure. The microhardness at different depths from the substrate-
clad interface was measured using a Vickers microhardness tester. The load was 300g and three
measurements were taken for hardness. The average of these was then reported.
Table 1: Powder specifications
Table 2: Chemical composition of the investigated powders
Sample group code Fe wt% Ti wt% C wt% Fe at% Ti at% C at%
Group 745 70 25 5 57 24 19
Group 755 70 23 7 55 20 25
Group 655 60 31 9 44 26 30
Group 555 50 38 12 33 30 37
Group 155 10 69 21 5 43 52
Element Purity (%) Powder size (mesh) Maximum powder size (mm)
Iron (Fe) 98 -325 0.044
Titanium (Ti) 99.5 -325 0.044
Graphite (C) 99.5 -300 0.040
23
3.2 Results
In this section, results and observations are presented. In section 3.2.1, the effect of laser parameters
on clad quality is investigated by conducting a range of process parameters and considering combined
laser parameters. In section 3.2.3, the effect of combined laser parameters on the morphology and
distribution of the TiC in the Fe matrix along with clad hardness are studied. In section 3.2.4 , the
effect of different powder compositions on TiC morphology and clad hardness are observed and
recorded. Finally, in section 3.2.5, the wear resistances of clads with two optimum laser conditions
and different clad compositions are investigated. Complete metallurgical bonding between the clad
and the substrate along with crack-free clad are the indicators for clad quality in this research.
3.2.1 Laser Processing Conditions
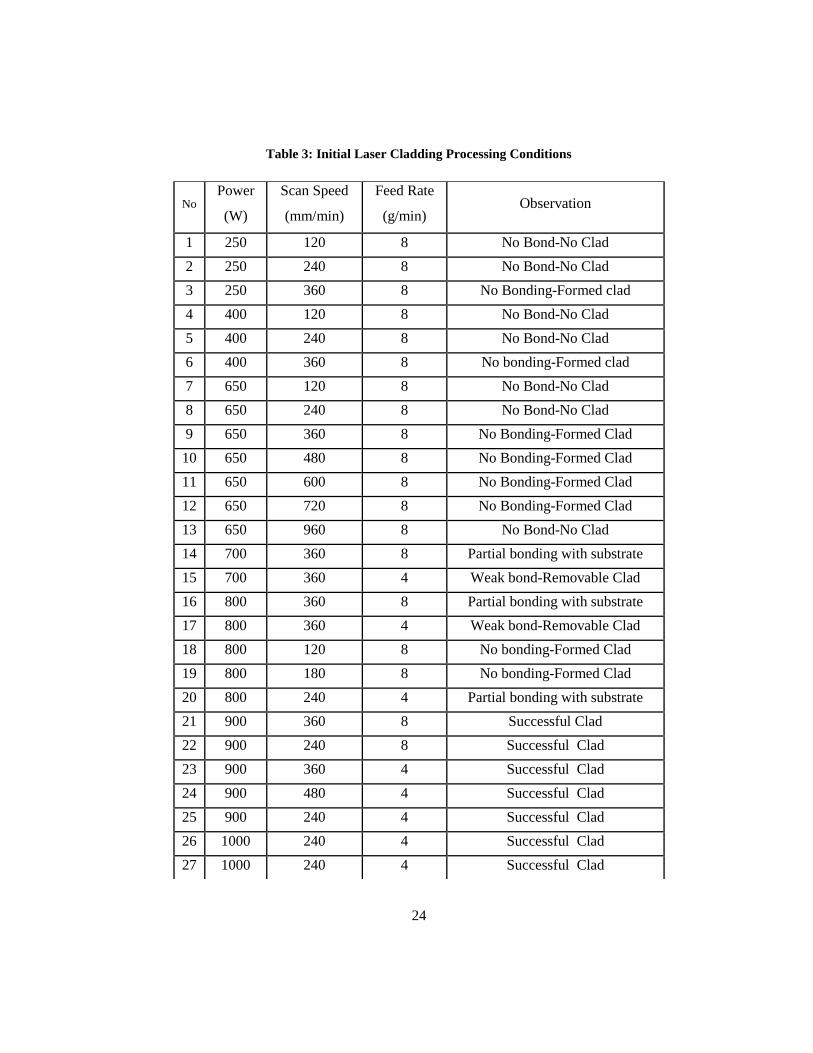
The laser processing parameters for determining optimum laser cladding conditions are given in
Table 3. Initial experiments performed with a constant powder feed rate of 8 g/min while
systematically increasing the workpiece scan speed from 120,240 to 360 mm/min. Each scan speed
was explored at laser powers ranging from 250 to 650 W (i.e., samples 1 to 9). A visual inspection of
the formed clad tracks revealed that, for the power setting, a scan speed of 360 mm/min was required
to produce a clad deposit. However, none of these processing conditions were able to create a bond
between the clad deposit and substrate.
In the second series of experiments (samples 10 to 13), the scan speed was increased from 360 to 960
mm/min, while the laser power and powder feed rate were fixed at 650 W and 8 g/min, respectively.
Again, a clad deposit was produced in each case (except at the highest scan speed), but no bonding
with the substrate occurred.
24
Table 3: Initial Laser Cladding Processing Conditions
No Power
(W)
Scan Speed
(mm/min)
Feed Rate
(g/min) Observation
1 250 120 8 No Bond-No Clad
((powde(PowderAccumulation) 2 250 240 8 No Bond-No Clad
3 250 360 8 No Bonding-Formed clad
4 400 120 8 No Bond-No Clad
5 400 240 8 No Bond-No Clad
6 400 360 8 No bonding-Formed clad
7 650 120 8 No Bond-No Clad
8 650 240 8 No Bond-No Clad
9 650 360 8 No Bonding-Formed Clad
10
17
650 480 8 No Bonding-Formed Clad
11 650 600 8 No Bonding-Formed Clad
12 650 720 8 No Bonding-Formed Clad
13 650 960 8 No Bond-No Clad
14 700 360 8 Partial bonding with substrate
melting 15 700 360 4 Weak bond-Removable Clad
16 800 360 8 Partial bonding with substrate
17 800 360 4 Weak bond-Removable Clad
18 800 120 8 No bonding-Formed Clad
19 800 180 8 No bonding-Formed Clad
20 800 240 4 Partial bonding with substrate
21 900 360 8 Successful Clad
22 900 240 8 Successful Clad
23 900 360 4 Successful Clad
24 900 480 4 Successful Clad
25 900 240 4 Successful Clad
26
6
1000 240 4 Successful Clad
27 1000 240 4
Successful Clad
25
In an effort to create a clad/substrate bond, the laser power was further increased to 700 and 800 W
while fixing the scan speed at 360 mm/min and using powder feed rates of 4 and 8 g/min (samples 14
to 17). Partial bonding of the clad to the substrate occurred in these cases. For example, at the higher
powder feed rate, the clad adhered to the substrate immediately following cladding but detached after
completely cooling. For the 4 g/min feed rate, clads remained attached to the substrate but were easily
removed with only a slight force of hand. Lowering the workpiece scan speed to 240, 180 or 120
mm/min (i.e., samples 18-20) did not rectify this situation.
In the final series of experiments, the laser power was increased to 900 W, while the powder feed rate
was at 4 or 8 g/min and the scan speed at 360 or 480 mm/min. A laser power of 1000 W was also
used, with a scan and powder feed rate of 4 mm/s and 4 g/min, respectively. Visual examination of
these clad tracks revealed that, in all cases, a clad deposit was produced and was well bonded to the
substrate.
3.2.1.1 SEM Results
A LEO SEM with 20keV was used to examine the microstructure and morphology of the phases
formed during cladding. The working distance was 9-14 mm and the vacuum system was set at 1.53e
-0.005 mBar. Different magnifications were used to capture the microstructure. To render the samples
conductive, they were painted with a graphite paste to prevent charging before being placed in a
vacuum chamber.
SEM was selected to determine the quality of the clad deposit and bonding with the substrate and to
determine whether in-situ TiC particles were formed. For this investigation, selected samples which
indicated a good clad deposit but no bonding with the substrate (i.e., samples 3 and 9) and a
successful clad deposit (i.e., samples 23 and 24) were chosen.
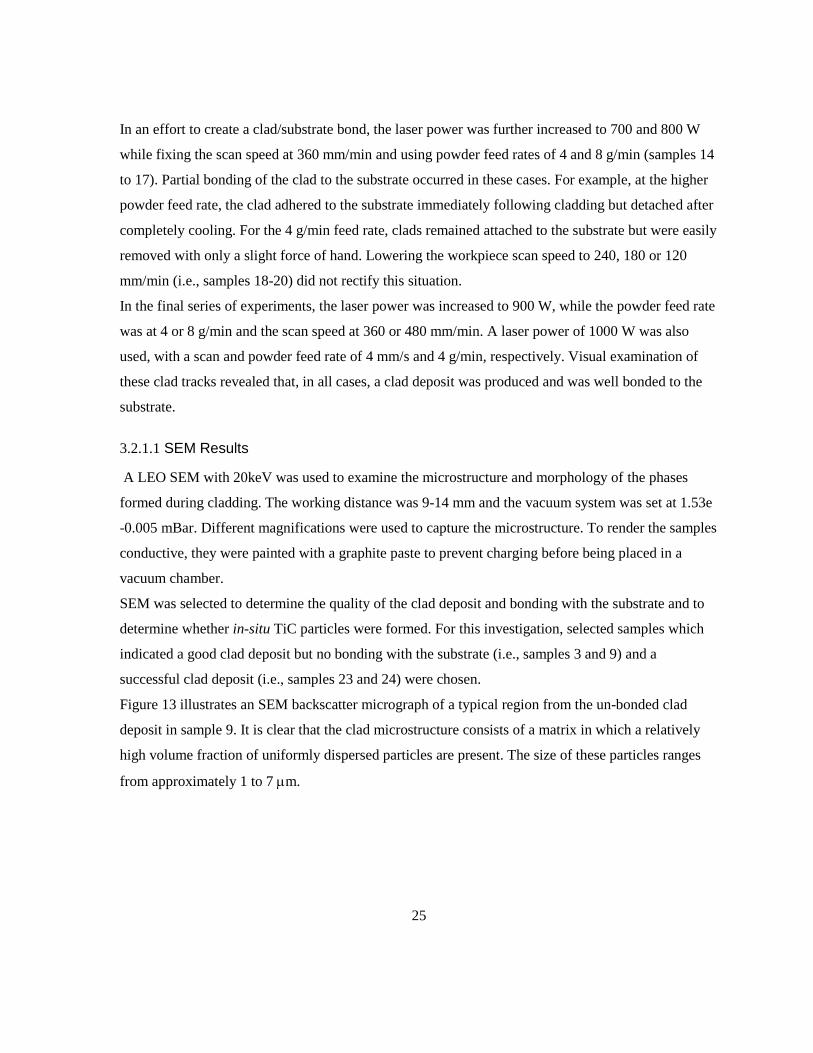
Figure 13 illustrates an SEM backscatter micrograph of a typical region from the un-bonded clad
deposit in sample 9. It is clear that the clad microstructure consists of a matrix in which a relatively
high volume fraction of uniformly dispersed particles are present. The size of these particles ranges
from approximately 1 to 7 m.
26
Figure 13:SEM micrograph of distributed black particles in a matrix for the un-bonded clad (sample 9)
Figure 14 illustrates a higher magnification micrograph of sample 9. Table 4 reports a typical EDS
analysis performed on the dark grey dispersed particles and on regions 1 and 2 of the matrix. The high
Ti content of the particles is consistent with TiC particles. The majority of the matrix is an Fe-rich
phase with slightly elevated Ti concentrations in region 2. The very small black particles in Figure 14
are too small to obtain a reliable EDS analysis.
27
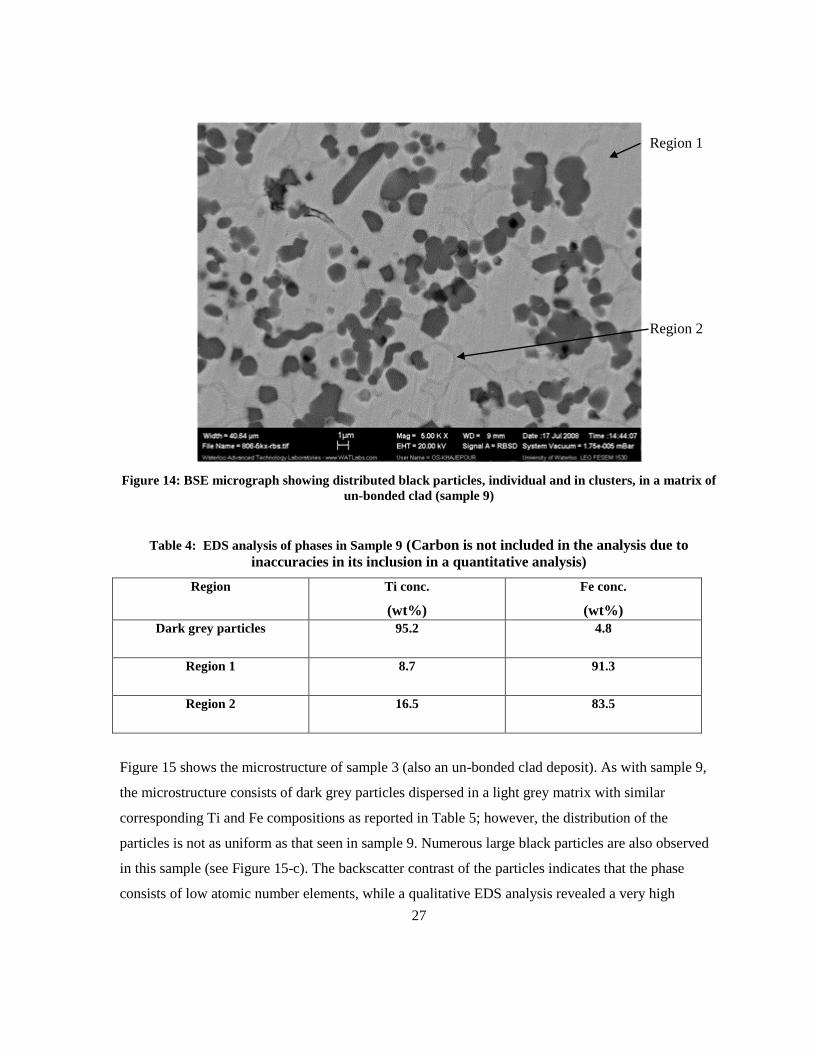
Figure 14: BSE micrograph showing distributed black particles, individual and in clusters, in a matrix of
un-bonded clad (sample 9)
Table 4: EDS analysis of phases in Sample 9 (Carbon is not included in the analysis due to
inaccuracies in its inclusion in a quantitative analysis)
Region Ti conc.
(wt%)
Fe conc.
(wt%)
Dark grey particles 95.2 4.8
Region 1 8.7 91.3
Region 2 16.5 83.5
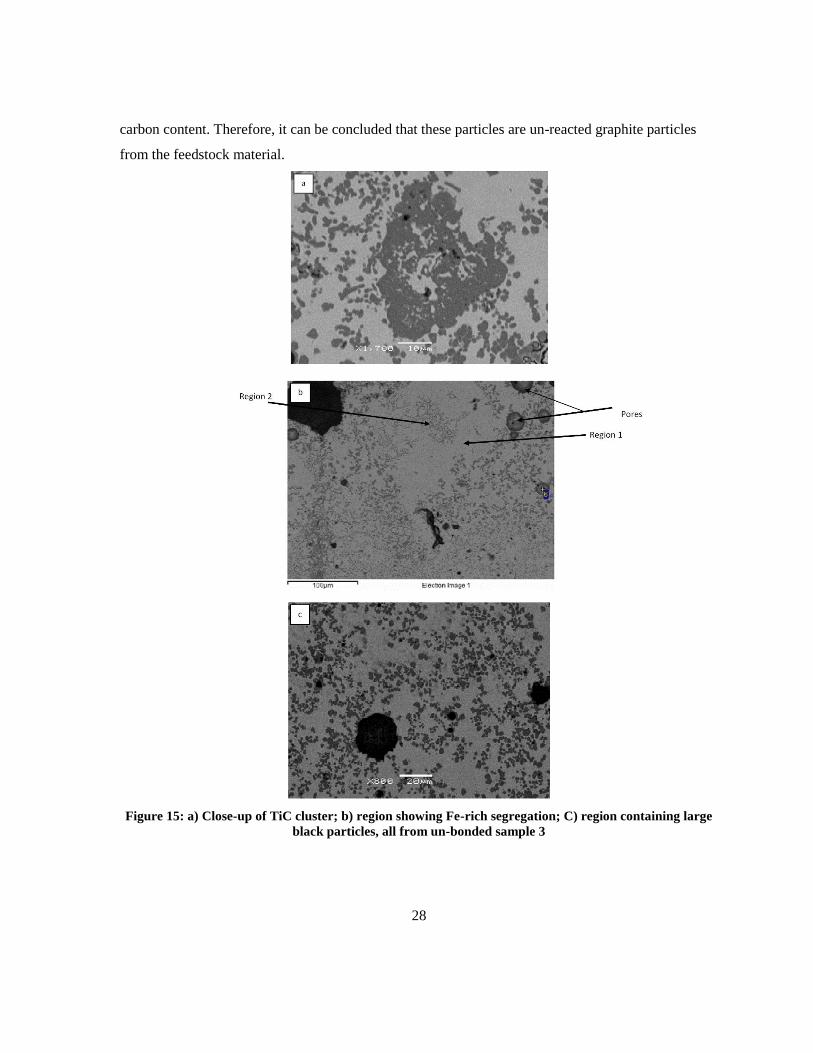
Figure 15 shows the microstructure of sample 3 (also an un-bonded clad deposit). As with sample 9,
the microstructure consists of dark grey particles dispersed in a light grey matrix with similar
corresponding Ti and Fe compositions as reported in Table 5; however, the distribution of the
particles is not as uniform as that seen in sample 9. Numerous large black particles are also observed
in this sample (see Figure 15-c). The backscatter contrast of the particles indicates that the phase
consists of low atomic number elements, while a qualitative EDS analysis revealed a very high
Region 1
Region 2
28
carbon content. Therefore, it can be concluded that these particles are un-reacted graphite particles
from the feedstock material.
Figure 15: a) Close-up of TiC cluster; b) region showing Fe-rich segregation; C) region containing large
black particles, all from un-bonded sample 3
29
Table 5: EDS analysis of phases in sample 3
Region Ti conc. (wt%)
Fe conc. (wt%)
Region 1 6.81 93.19
Region 2 26.44 73.56
Comparing the microstructures of sample 9 (i.e., Figure 13 and Figure 14) with sample 3 (i.e., Figure
15) reveals that while the lower laser power of 250 W produces a clad deposit, the degree of in-situ
reaction between the reactant powders is lower and the phase distribution is non-uniform.
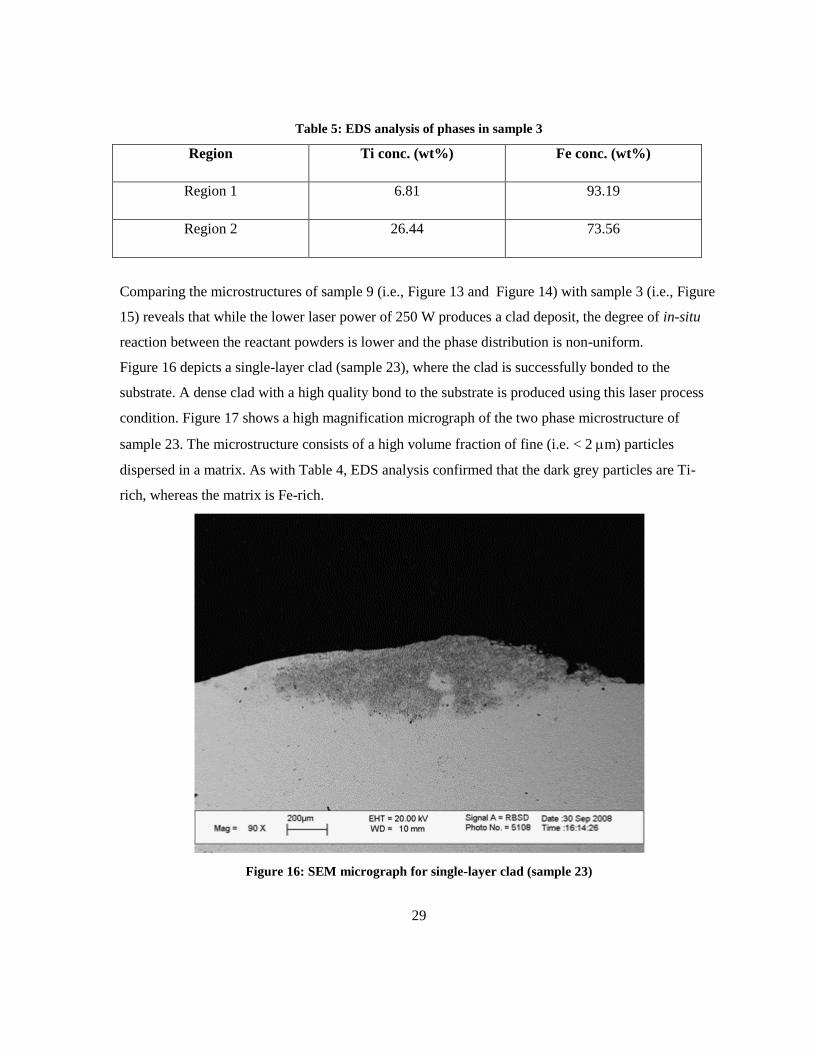
Figure 16 depicts a single-layer clad (sample 23), where the clad is successfully bonded to the
substrate. A dense clad with a high quality bond to the substrate is produced using this laser process
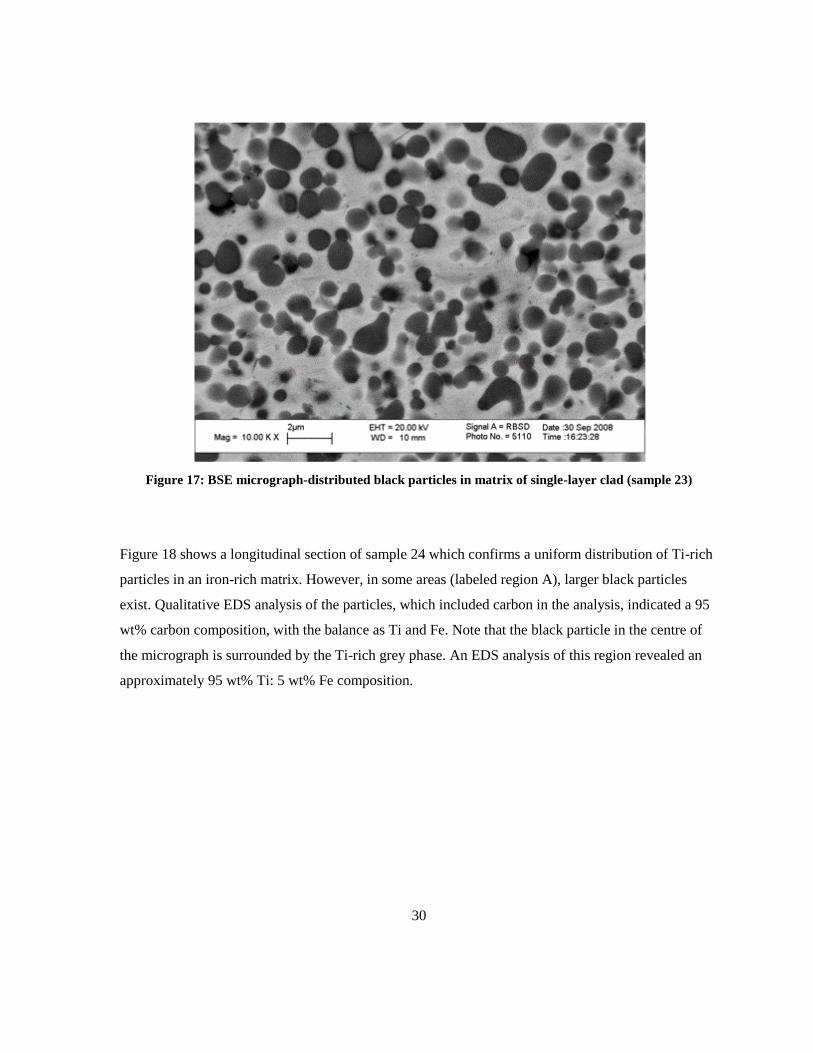
condition. Figure 17 shows a high magnification micrograph of the two phase microstructure of
sample 23. The microstructure consists of a high volume fraction of fine (i.e. < 2 m) particles
dispersed in a matrix. As with Table 4, EDS analysis confirmed that the dark grey particles are Ti-
rich, whereas the matrix is Fe-rich.
Figure 16: SEM micrograph for single-layer clad (sample 23)
30
Figure 17: BSE micrograph-distributed black particles in matrix of single-layer clad (sample 23)
Figure 18 shows a longitudinal section of sample 24 which confirms a uniform distribution of Ti-rich
particles in an iron-rich matrix. However, in some areas (labeled region A), larger black particles
exist. Qualitative EDS analysis of the particles, which included carbon in the analysis, indicated a 95
wt% carbon composition, with the balance as Ti and Fe. Note that the black particle in the centre of
the micrograph is surrounded by the Ti-rich grey phase. An EDS analysis of this region revealed an
approximately 95 wt% Ti: 5 wt% Fe composition.
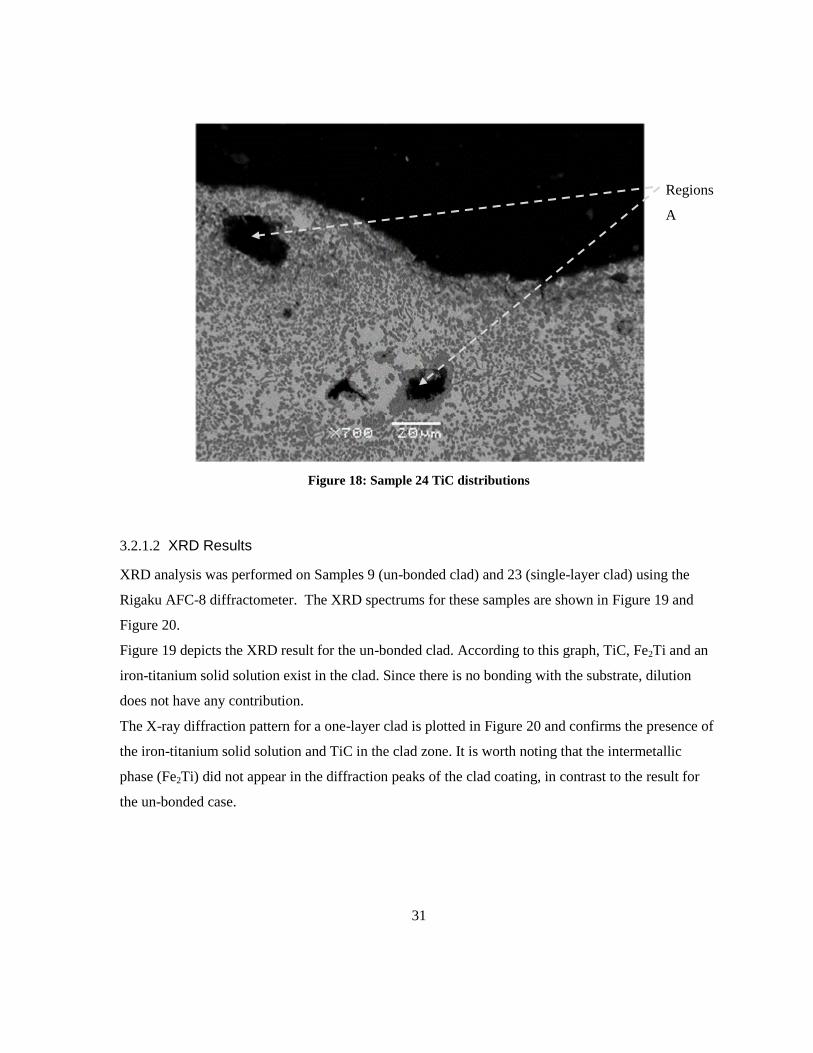
31
Figure 18: Sample 24 TiC distributions
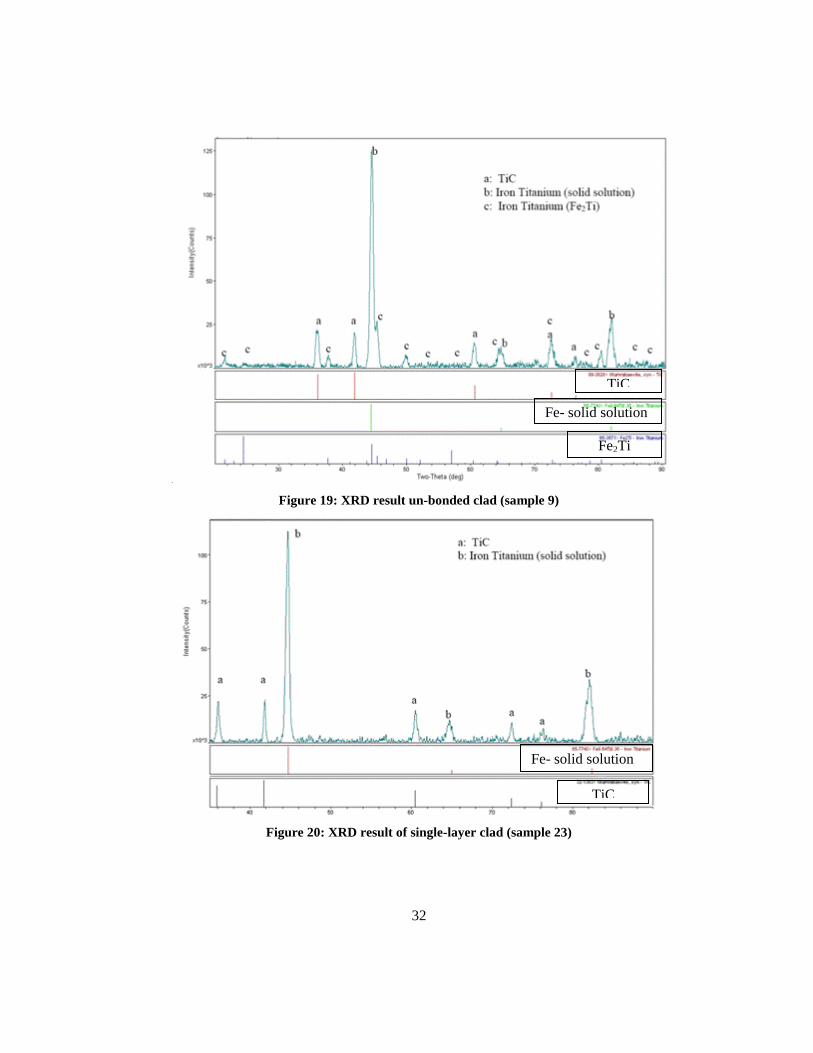
3.2.1.2 XRD Results
XRD analysis was performed on Samples 9 (un-bonded clad) and 23 (single-layer clad) using the
Rigaku AFC-8 diffractometer. The XRD spectrums for these samples are shown in Figure 19 and
Figure 20.
Figure 19 depicts the XRD result for the un-bonded clad. According to this graph, TiC, Fe2Ti and an
iron-titanium solid solution exist in the clad. Since there is no bonding with the substrate, dilution
does not have any contribution.
The X-ray diffraction pattern for a one-layer clad is plotted in Figure 20 and confirms the presence of
the iron-titanium solid solution and TiC in the clad zone. It is worth noting that the intermetallic
phase (Fe2Ti) did not appear in the diffraction peaks of the clad coating, in contrast to the result for
the un-bonded case.
Regions
A
32
Figure 19: XRD result un-bonded clad (sample 9)
Figure 20: XRD result of single-layer clad (sample 23)
c
a
c
a
Fe- solid solution
s
o
li
d
s
o
l
u
ti
o
n
sol
sol
uti
on
TiC
s
o
l
s
o
l
u
t
i
o
n
s
o
l
s
o
l
u
t
i
o
n
Fe2Ti
i
n
t
e
r
m
e
t
a
l
l
i
c
c
c
o
m
p
o
u
n
d
s
o
l
s
o
l
u
t
i
TiC
s
o
l
s
o
l
u
t
i
o
n
s
o
l
s
o
l
u
Fe- solid solution
sols
oluti
onso
lsolu
tion
33
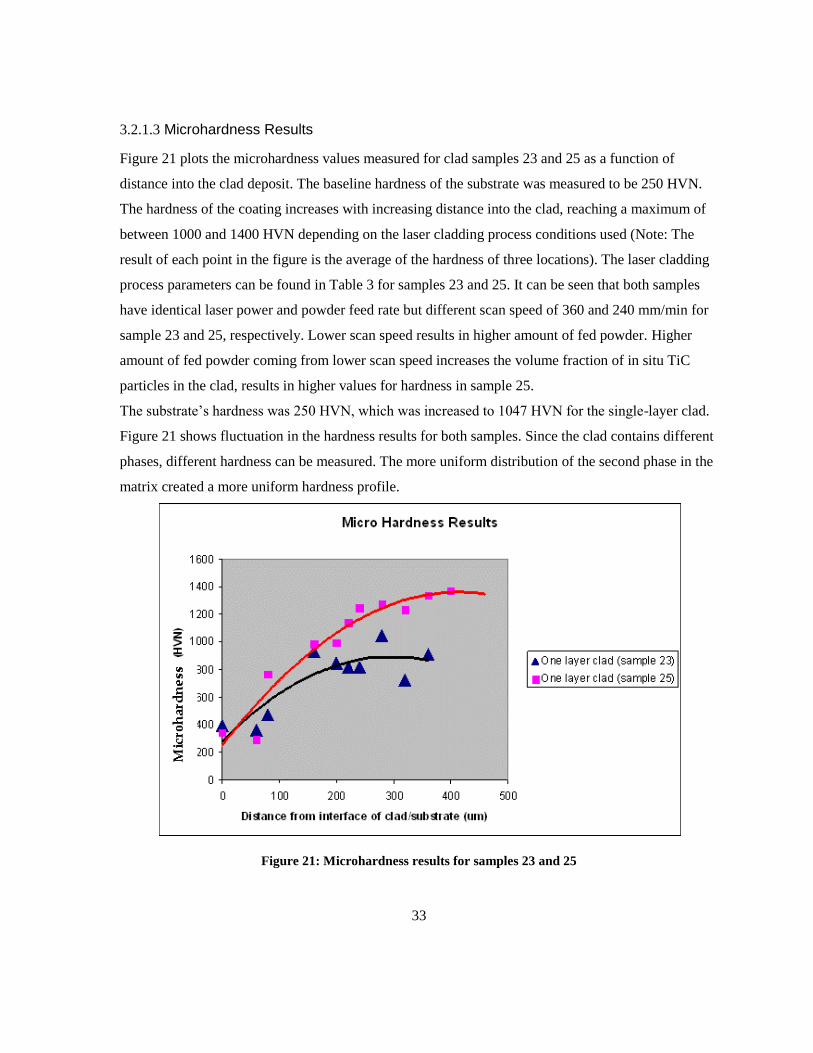
3.2.1.3 Microhardness Results
Figure 21 plots the microhardness values measured for clad samples 23 and 25 as a function of
distance into the clad deposit. The baseline hardness of the substrate was measured to be 250 HVN.
The hardness of the coating increases with increasing distance into the clad, reaching a maximum of
between 1000 and 1400 HVN depending on the laser cladding process conditions used (Note: The
result of each point in the figure is the average of the hardness of three locations). The laser cladding
process parameters can be found in Table 3 for samples 23 and 25. It can be seen that both samples
have identical laser power and powder feed rate but different scan speed of 360 and 240 mm/min for
sample 23 and 25, respectively. Lower scan speed results in higher amount of fed powder. Higher
amount of fed powder coming from lower scan speed increases the volume fraction of in situ TiC
particles in the clad, results in higher values for hardness in sample 25.
The substrate’s hardness was 250 HVN, which was increased to 1047 HVN for the single-layer clad.
Figure 21 shows fluctuation in the hardness results for both samples. Since the clad contains different
phases, different hardness can be measured. The more uniform distribution of the second phase in the
matrix created a more uniform hardness profile.
Figure 21: Microhardness results for samples 23 and 25
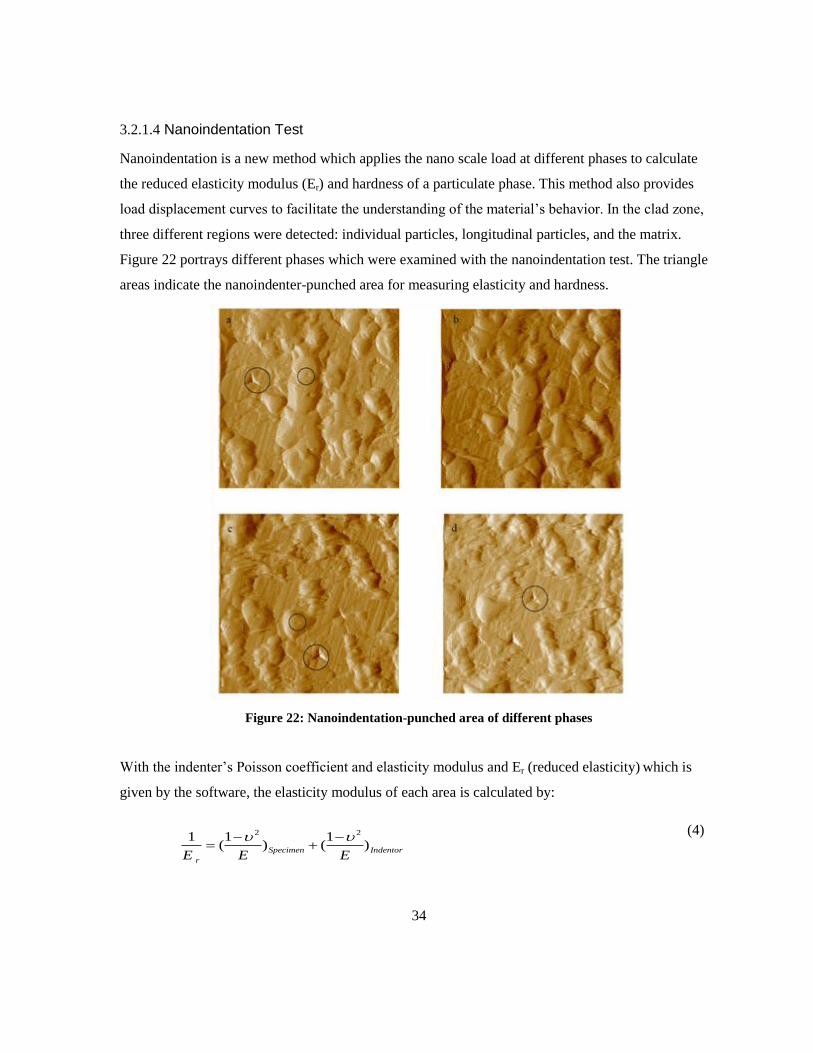
34
3.2.1.4 Nanoindentation Test
Nanoindentation is a new method which applies the nano scale load at different phases to calculate
the reduced elasticity modulus (Er) and hardness of a particulate phase. This method also provides
load displacement curves to facilitate the understanding of the material’s behavior. In the clad zone,
three different regions were detected: individual particles, longitudinal particles, and the matrix.
Figure 22 portrays different phases which were examined with the nanoindentation test. The triangle
areas indicate the nanoindenter-punched area for measuring elasticity and hardness.
Figure 22: Nanoindentation-punched area of different phases
With the indenter’s Poisson coefficient and elasticity modulus and Er (reduced elasticity) which is
given by the software, the elasticity modulus of each area is calculated by:
(4)
2 21 1 1( ) ( )Specimen Indentor
rE E E
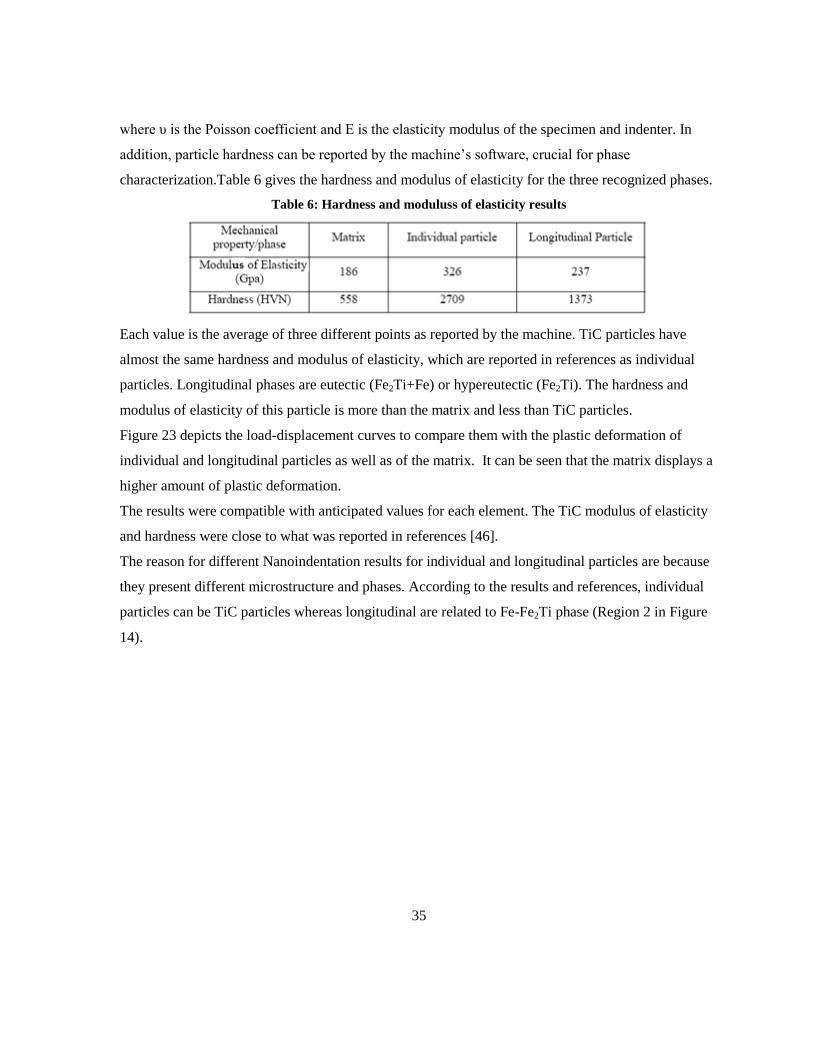
35
where υ is the Poisson coefficient and E is the elasticity modulus of the specimen and indenter. In
addition, particle hardness can be reported by the machine’s software, crucial for phase
characterization.Table 6 gives the hardness and modulus of elasticity for the three recognized phases.
Table 6: Hardness and moduluss of elasticity results
Each value is the average of three different points as reported by the machine. TiC particles have
almost the same hardness and modulus of elasticity, which are reported in references as individual
particles. Longitudinal phases are eutectic (Fe2Ti+Fe) or hypereutectic (Fe2Ti). The hardness and
modulus of elasticity of this particle is more than the matrix and less than TiC particles.
Figure 23 depicts the load-displacement curves to compare them with the plastic deformation of
individual and longitudinal particles as well as of the matrix. It can be seen that the matrix displays a
higher amount of plastic deformation.
The results were compatible with anticipated values for each element. The TiC modulus of elasticity
and hardness were close to what was reported in references [46].
The reason for different Nanoindentation results for individual and longitudinal particles are because
they present different microstructure and phases. According to the results and references, individual
particles can be TiC particles whereas longitudinal are related to Fe-Fe2Ti phase (Region 2 in Figure
14).
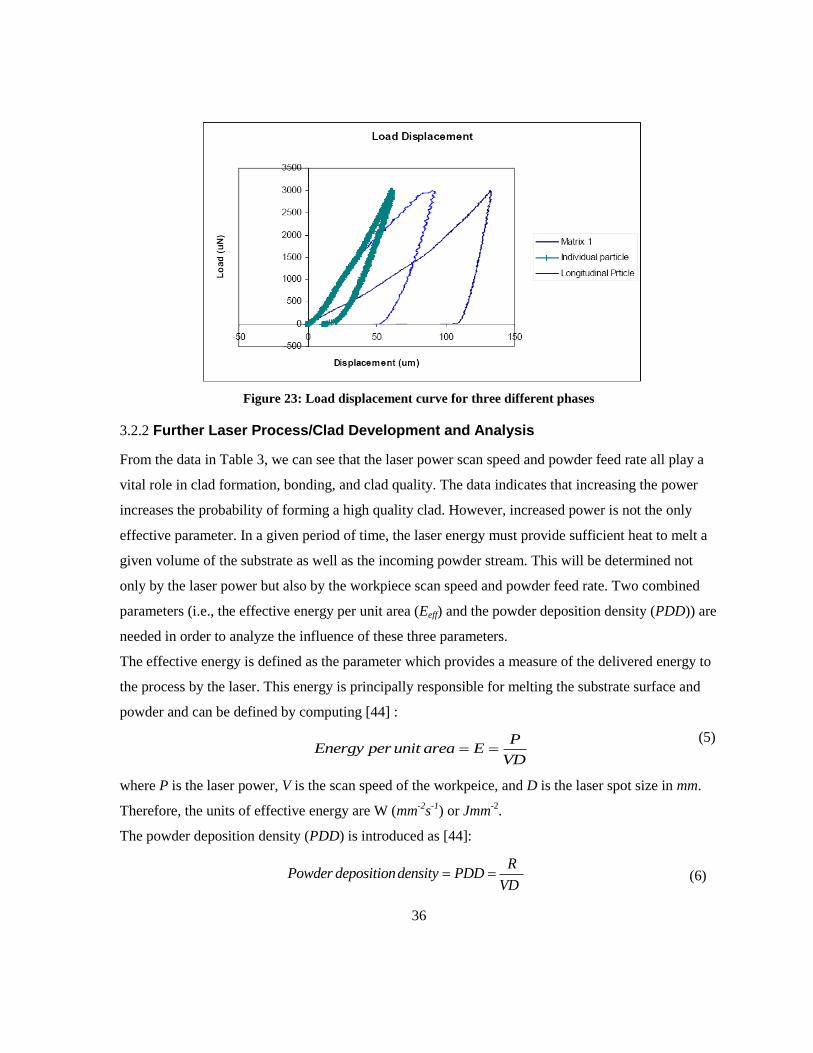
36
Figure 23: Load displacement curve for three different phases
3.2.2 Further Laser Process/Clad Development and Analysis
From the data in Table 3, we can see that the laser power scan speed and powder feed rate all play a
vital role in clad formation, bonding, and clad quality. The data indicates that increasing the power
increases the probability of forming a high quality clad. However, increased power is not the only
effective parameter. In a given period of time, the laser energy must provide sufficient heat to melt a
given volume of the substrate as well as the incoming powder stream. This will be determined not
only by the laser power but also by the workpiece scan speed and powder feed rate. Two combined
parameters (i.e., the effective energy per unit area (Eeff) and the powder deposition density (PDD)) are
needed in order to analyze the influence of these three parameters.
The effective energy is defined as the parameter which provides a measure of the delivered energy to
the process by the laser. This energy is principally responsible for melting the substrate surface and
powder and can be defined by computing [44] :
(5)
where P is the laser power, V is the scan speed of the workpeice, and D is the laser spot size in mm.
Therefore, the units of effective energy are W (mm-2
s-1
) or Jmm-2
.
The powder deposition density (PDD) is introduced as [44]:
RPowder depositiondensity PDD
VD (6)
PEnergy per unit area E
VD

37
where V and D have the previous meaning, R is powder feed rate in g/min such that the powder
deposition density (PDD) has units of g/mm2.
Table 7 reports these calculated parameters for each of the laser conditions from Table 3 and plots the
data where PDD is the x-axis and (Eeff) is the y-axis.
As seen in Figure 24 , low Eeff and high PDD values leads to no clad deposit formation or bonding
with the substrate (i.e., Zone I). Increasing the Eeff and reducing PDD leads to the formation of a clad
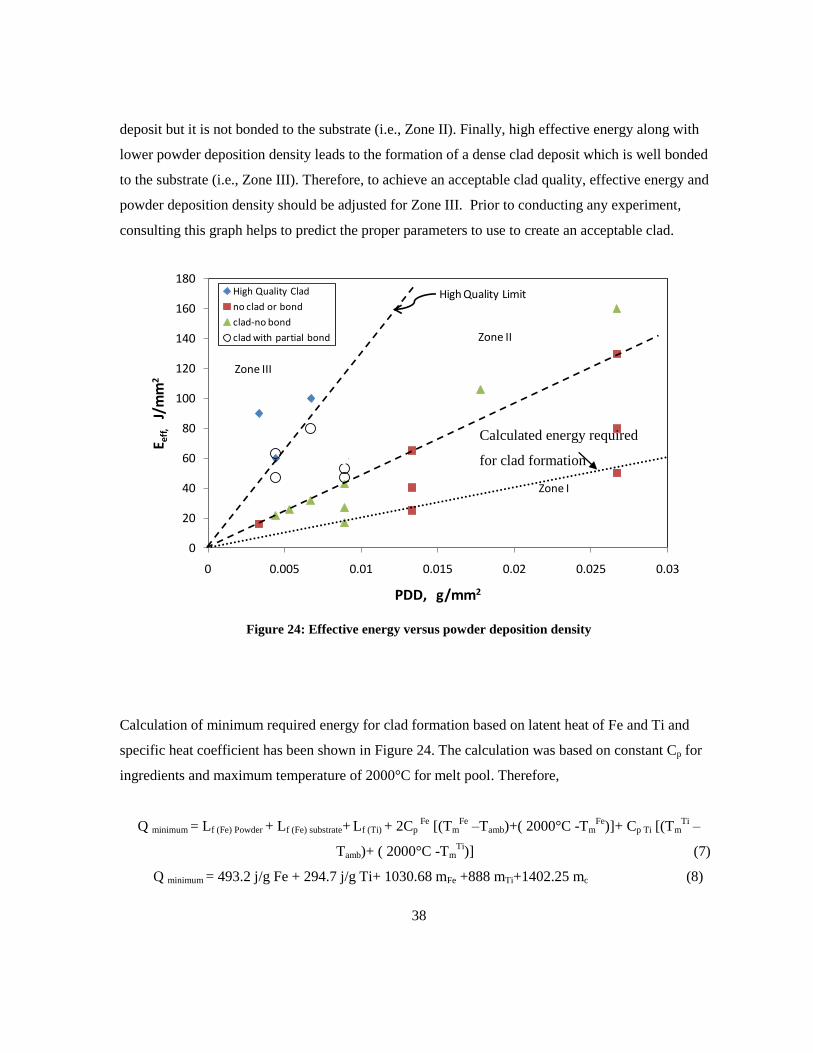
38
deposit but it is not bonded to the substrate (i.e., Zone II). Finally, high effective energy along with
lower powder deposition density leads to the formation of a dense clad deposit which is well bonded
to the substrate (i.e., Zone III). Therefore, to achieve an acceptable clad quality, effective energy and
powder deposition density should be adjusted for Zone III. Prior to conducting any experiment,
consulting this graph helps to predict the proper parameters to use to create an acceptable clad.
Figure 24: Effective energy versus powder deposition density
Calculation of minimum required energy for clad formation based on latent heat of Fe and Ti and
specific heat coefficient has been shown in Figure 24. The calculation was based on constant Cp for
ingredients and maximum temperature of 2000°C for melt pool. Therefore,
Q minimum = Lf (Fe) Powder + Lf (Fe) substrate+ Lf (Ti) + 2Cp Fe
[(TmFe
–Tamb)+( 2000°C -TmFe
)]+ Cp Ti [(TmTi
–
Tamb)+ ( 2000°C -TmTi
)] (7)
Q minimum = 493.2 j/g Fe + 294.7 j/g Ti+ 1030.68 mFe +888 mTi+1402.25 mc (8)
0
20
40
60
80
100
120
140
160
180
0 0.005 0.01 0.015 0.02 0.025 0.03
E eff
,J/
mm
2
PDD, g/mm2
High Quality Clad
no clad or bond
clad-no bond
clad with partial bond
Zone I
Zone II
Zone III
High Quality Limit
Calculated energy required
for clad formation
39
According to the powder composition minimum required energy is calculated based on 70% wt Fe,
25%wt Ti, and 5%wt C. Based on this calculation minimum required energy is considerably lower
than experimental results. This can be because of simple assumptions such as independency of Cp to
temperature, difficulty in calculation of melt pool volume , powder diffraction that decrease the
efficiency of energy and ignoring the heat conduction, irritation and convection.
To further explore the predictability of this figure, a range of clad conditions which lie close to the
boundary line between Zones II and III were chosen and clad experiments completed. These
conditions are given in
Table 8 and plotted in Figure 25. All of the conditions produced a clad deposit that could not be
removed from the substrate, indicating good bonding. Metallographic examination of these samples is
completed to further analyze clad quality and microstructure.
Figure 26 shows a low magnification micrograph of the entire cross section of the clad deposit for
sample AA13, which was clad using the highest Eeff and PDD values (i.e., P = 900 W; V = 120
mm/min and R = 4 g/min). Figure 27 illustrates higher magnifications of the bottom and top of the
clad deposit. It is clear from these figures that the microstructure of the clad changes significantly
throughout the clad thickness. At the bottom of the clad, the TiC particles are uniformly and finely
dispersed. The TiC particle size is on the order of 2 m and the shapes range from spherical to aspect
ratios on the order of 2:1 to 4:1. Conversely, at the top of the clad, the TiC particles are much coarser
and exhibit a clear dendrite structure. The two-phase contrast in the matrix is consistent with previous
samples (e.g., sample 9) and indicate an Fe-Ti solid solution with some inter-dendrite eutectic phase
present. A clearer indication of eutectic formation is shown in Figure 28.
It is also evident from Figure 26 that bonding with the substrate was incomplete and that some
porosity remained in the clad structure. This result indicates that the laser cladding conditions used in
Table 8 and plotted in Figure 25 are truly at the boundary between Zones II and III, and that a
combination of Eeff and PDD above the lines of Figure 25 should be used to obtain a high quality clad.
Partial bonding was again indicated in Figure 29, which depicts a low magnification micrograph of
the entire clad cross section of sample AA14. The lower Eeff and PDD values of this laser condition
produced a lower clad height compared to sample AA13.

40
Table 7: Effective energy and powder deposition density calculation
No Power
(W)
Scan Speed
(mm/min)
Feed
Rate
(g/min)
Effective
Energy
Jmm-2
Powder Deposition
Density gmm-2
Observation
1 250 120 8 50 0.027 No Bond-No Clad
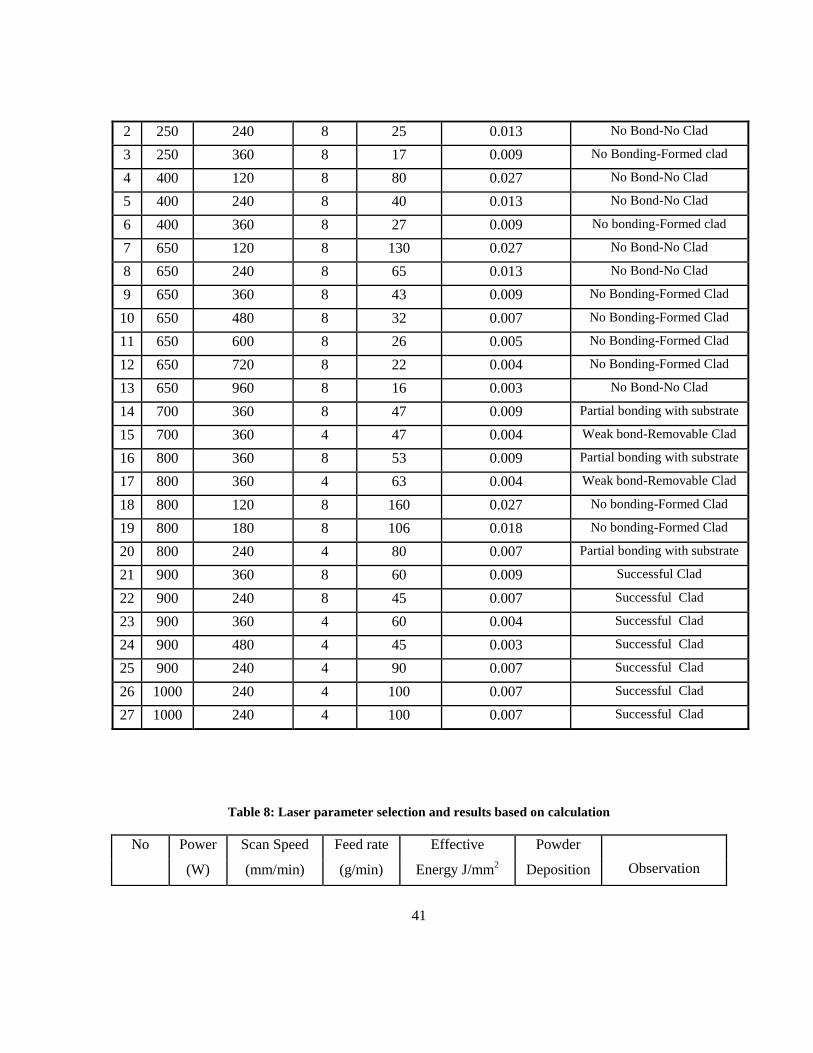
41
Table 8: Laser parameter selection and results based on calculation
2 250 240 8 25 0.013 No Bond-No Clad
3 250 360 8 17 0.009 No Bonding-Formed clad
4 400 120 8 80 0.027 No Bond-No Clad
5 400 240 8 40 0.013 No Bond-No Clad
6 400 360 8 27 0.009 No bonding-Formed clad
7 650 120 8 130 0.027 No Bond-No Clad
8 650 240 8 65 0.013 No Bond-No Clad
9 650 360 8 43 0.009 No Bonding-Formed Clad
10 650 480 8 32 0.007 No Bonding-Formed Clad
11 650 600 8 26 0.005 No Bonding-Formed Clad
12 650 720 8 22 0.004 No Bonding-Formed Clad
13 650 960 8 16 0.003 No Bond-No Clad
14 700 360 8 47 0.009 Partial bonding with substrate
15 700 360 4 47 0.004 Weak bond-Removable Clad
16 800 360 8 53 0.009 Partial bonding with substrate
17 800 360 4 63 0.004 Weak bond-Removable Clad
18 800 120 8 160 0.027 No bonding-Formed Clad
19 800 180 8 106 0.018 No bonding-Formed Clad
20 800 240 4 80 0.007 Partial bonding with substrate
21 900 360 8 60 0.009 Successful Clad
22 900 240 8 45 0.007 Successful Clad
23 900 360 4 60 0.004 Successful Clad
24 900 480 4 45 0.003 Successful Clad
25 900 240 4 90 0.007 Successful Clad
26 1000 240 4 100 0.007 Successful Clad
27 1000 240 4
100 0.007 Successful Clad
No Power Scan Speed Feed rate Effective Powder
dDDepositi
on
Observation (W) (mm/min) (g/min) Energy J/mm2
Deposition
ddDensity
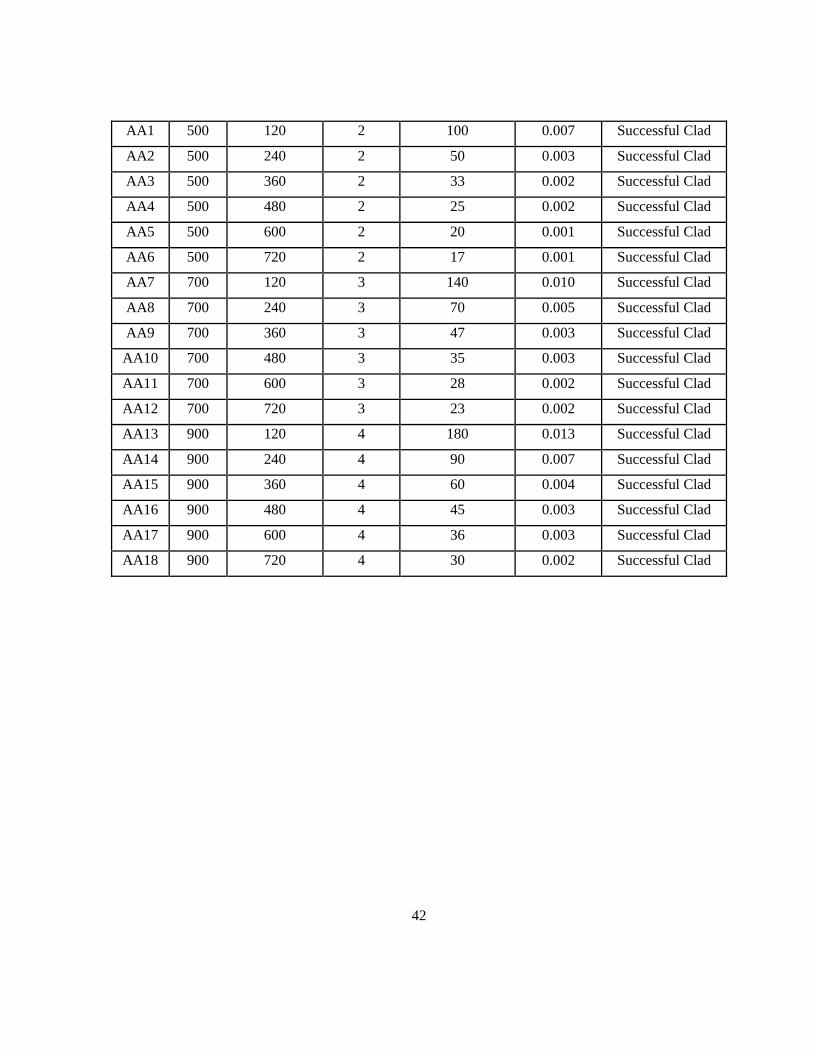
42
AA1 500 120 2 100 0.007 Successful Clad
AA2 500 240 2 50 0.003 Successful Clad
AA3 500 360 2 33 0.002 Successful Clad
AA4 500 480 2 25 0.002 Successful Clad
AA5 500 600 2 20 0.001 Successful Clad
AA6 500 720 2 17 0.001 Successful Clad
AA7 700 120 3 140 0.010 Successful Clad
AA8 700 240 3 70 0.005 Successful Clad
AA9 700 360 3 47 0.003 Successful Clad
AA10 700 480 3 35 0.003 Successful Clad
AA11 700 600 3 28 0.002 Successful Clad
AA12 700 720 3 23 0.002 Successful Clad
AA13 900 120 4 180 0.013 Successful Clad
AA14 900 240 4 90 0.007 Successful Clad
AA15 900 360 4 60 0.004 Successful Clad
AA16 900 480 4 45 0.003 Successful Clad
AA17 900 600 4 36 0.003 Successful Clad
AA18
900 720 4 30 0.002 Successful Clad
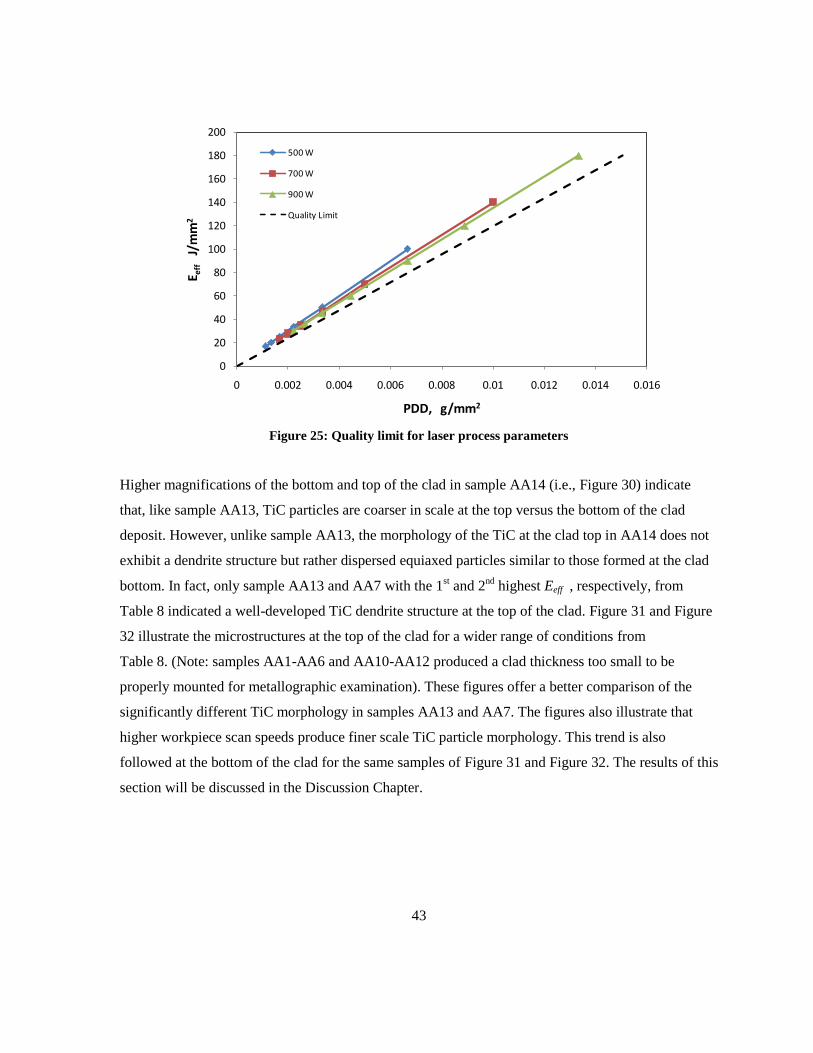
43
Figure 25: Quality limit for laser process parameters
Higher magnifications of the bottom and top of the clad in sample AA14 (i.e., Figure 30) indicate
that, like sample AA13, TiC particles are coarser in scale at the top versus the bottom of the clad
deposit. However, unlike sample AA13, the morphology of the TiC at the clad top in AA14 does not
exhibit a dendrite structure but rather dispersed equiaxed particles similar to those formed at the clad
bottom. In fact, only sample AA13 and AA7 with the 1st and 2
nd highest Eeff , respectively, from
Table 8 indicated a well-developed TiC dendrite structure at the top of the clad. Figure 31 and Figure
32 illustrate the microstructures at the top of the clad for a wider range of conditions from
Table 8. (Note: samples AA1-AA6 and AA10-AA12 produced a clad thickness too small to be
properly mounted for metallographic examination). These figures offer a better comparison of the
significantly different TiC morphology in samples AA13 and AA7. The figures also illustrate that
higher workpiece scan speeds produce finer scale TiC particle morphology. This trend is also
followed at the bottom of the clad for the same samples of Figure 31 and Figure 32. The results of this
section will be discussed in the Discussion Chapter.
0
20
40
60
80
100
120
140
160
180
200
0 0.002 0.004 0.006 0.008 0.01 0.012 0.014 0.016
E eff
J/m
m2
PDD, g/mm2
500 W
700 W
900 W
Quality Limit
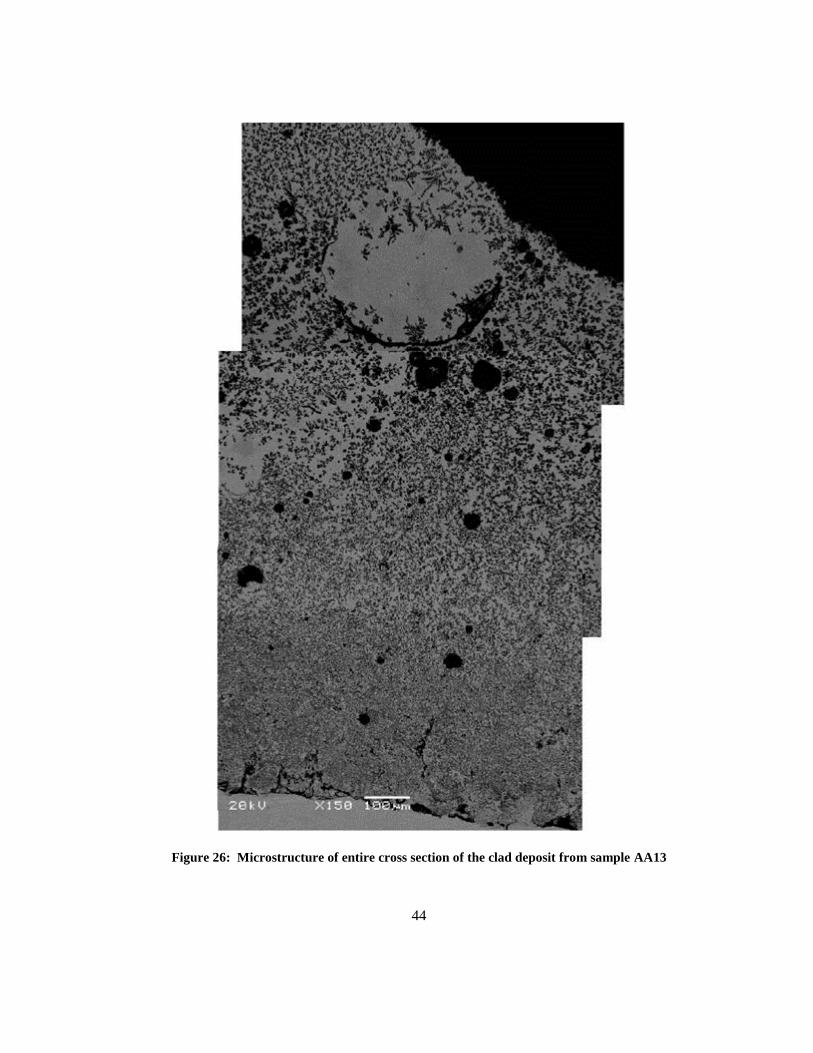
44
Figure 26: Microstructure of entire cross section of the clad deposit from sample AA13
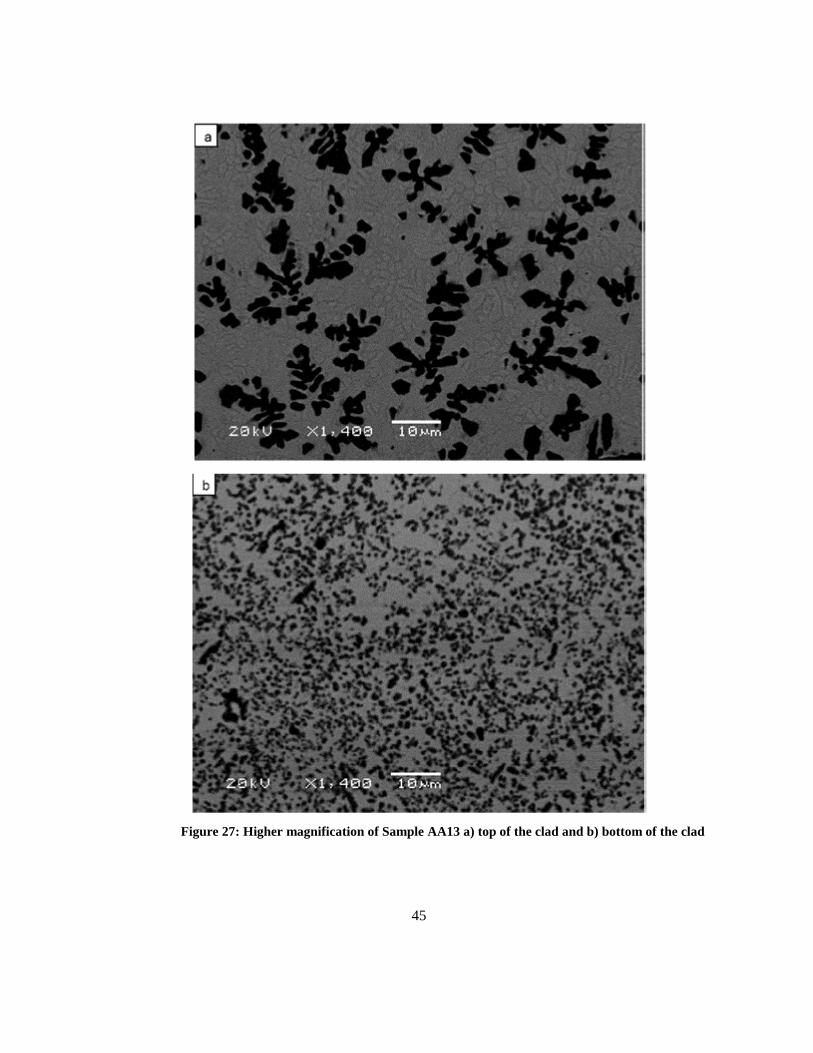
45
Figure 27: Higher magnification of Sample AA13 a) top of the clad and b) bottom of the clad
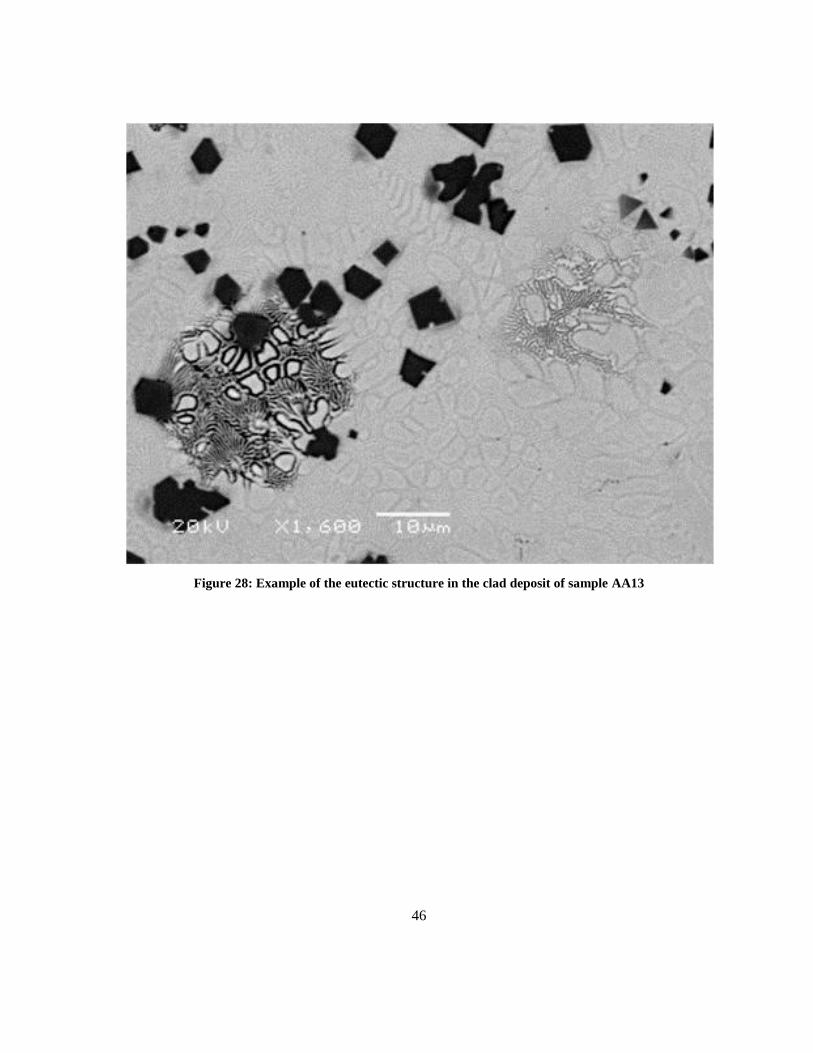
46
Figure 28: Example of the eutectic structure in the clad deposit of sample AA13
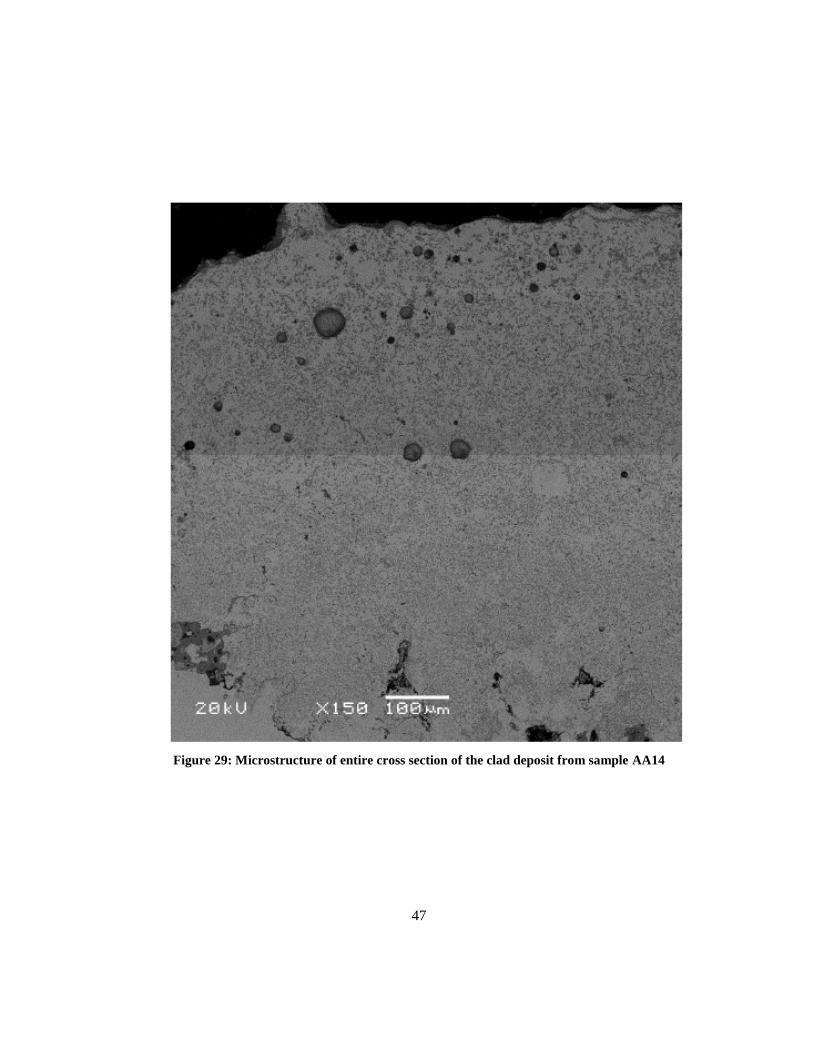
47
Figure 29: Microstructure of entire cross section of the clad deposit from sample AA14
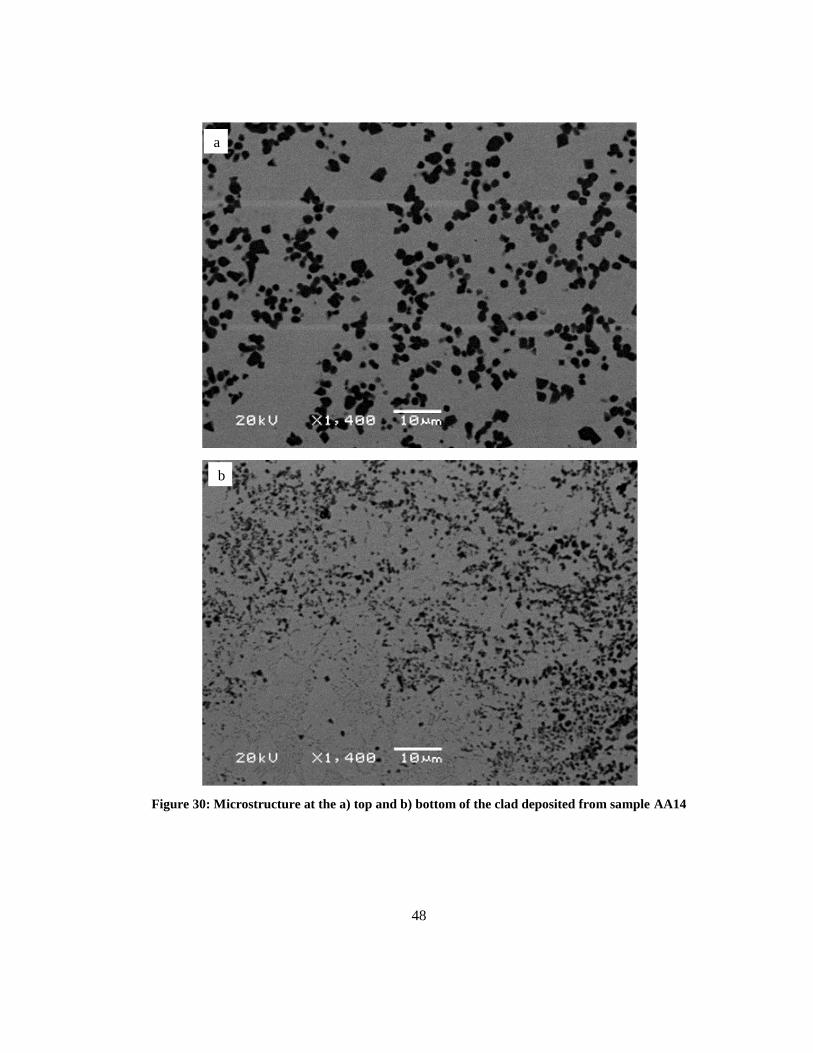
48
Figure 30: Microstructure at the a) top and b) bottom of the clad deposited from sample AA14
a
b
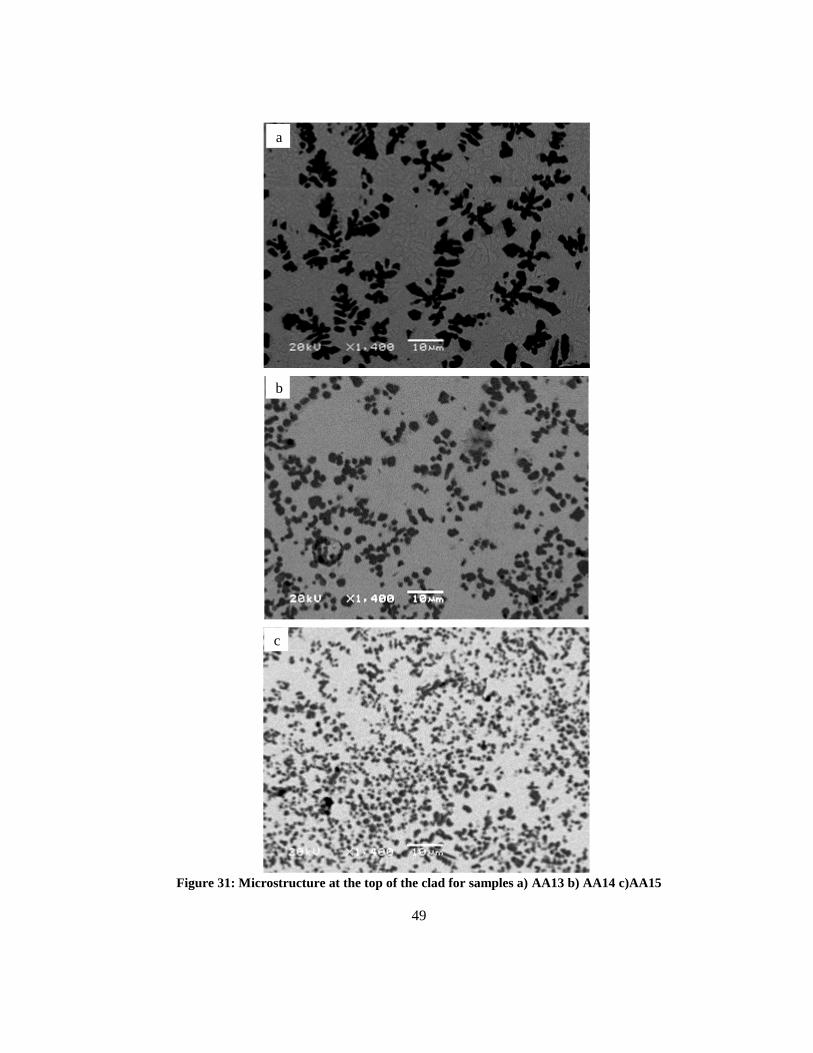
49
Figure 31: Microstructure at the top of the clad for samples a) AA13 b) AA14 c)AA15
b
c
a
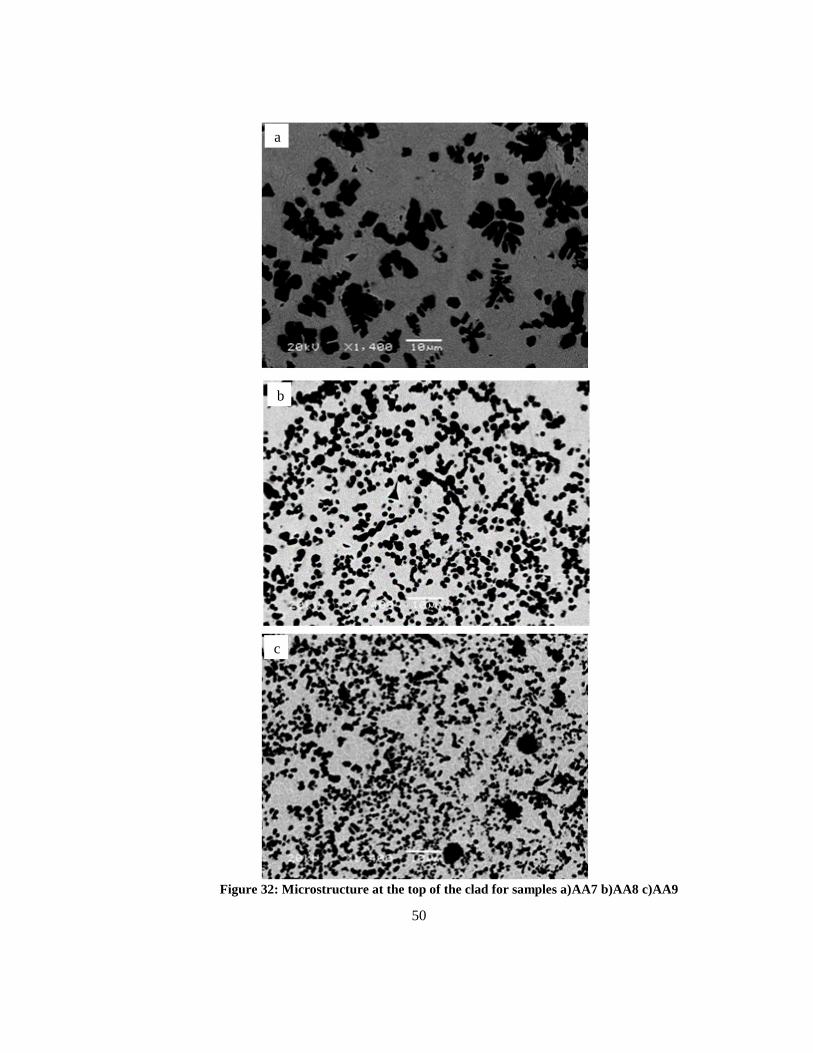
50
Figure 32: Microstructure at the top of the clad for samples a)AA7 b)AA8 c)AA9
a
b
c
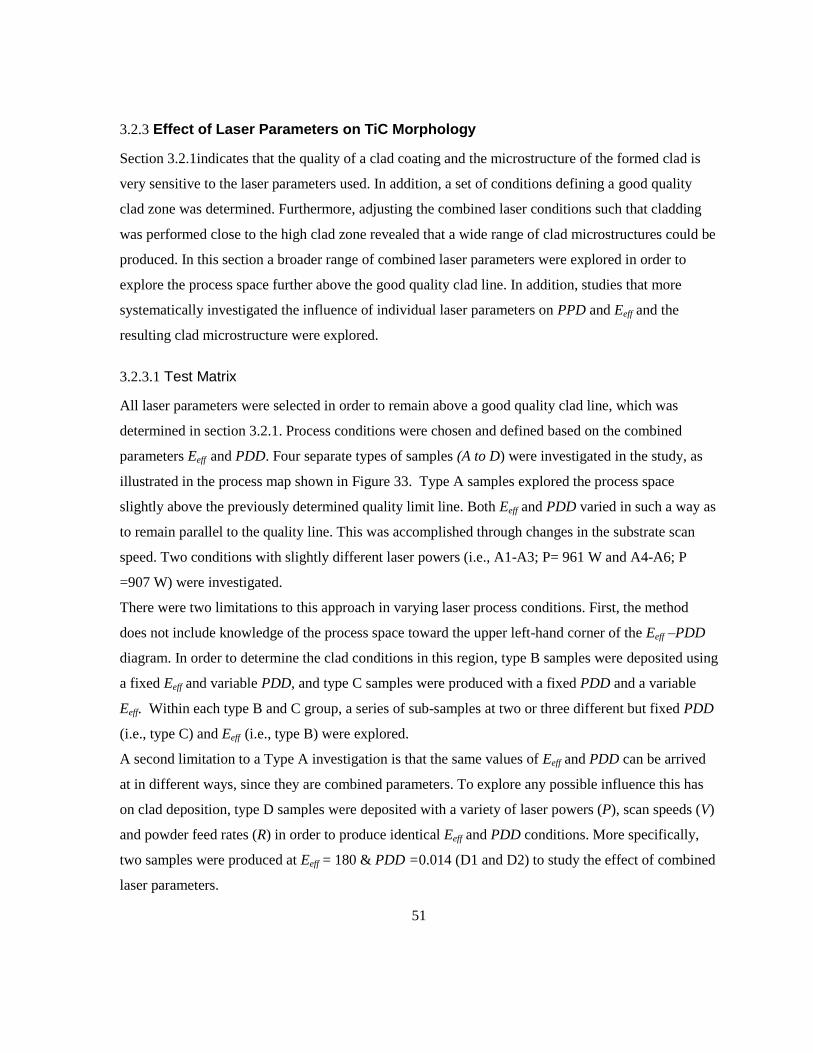
51
3.2.3 Effect of Laser Parameters on TiC Morphology
Section 3.2.1indicates that the quality of a clad coating and the microstructure of the formed clad is
very sensitive to the laser parameters used. In addition, a set of conditions defining a good quality
clad zone was determined. Furthermore, adjusting the combined laser conditions such that cladding
was performed close to the high clad zone revealed that a wide range of clad microstructures could be
produced. In this section a broader range of combined laser parameters were explored in order to
explore the process space further above the good quality clad line. In addition, studies that more
systematically investigated the influence of individual laser parameters on PPD and Eeff and the
resulting clad microstructure were explored.
3.2.3.1 Test Matrix
All laser parameters were selected in order to remain above a good quality clad line, which was
determined in section 3.2.1. Process conditions were chosen and defined based on the combined
parameters Eeff and PDD. Four separate types of samples (A to D) were investigated in the study, as
illustrated in the process map shown in Figure 33. Type A samples explored the process space
slightly above the previously determined quality limit line. Both Eeff and PDD varied in such a way as
to remain parallel to the quality line. This was accomplished through changes in the substrate scan
speed. Two conditions with slightly different laser powers (i.e., A1-A3; P= 961 W and A4-A6; P
=907 W) were investigated.
There were two limitations to this approach in varying laser process conditions. First, the method
does not include knowledge of the process space toward the upper left-hand corner of the Eeff –PDD
diagram. In order to determine the clad conditions in this region, type B samples were deposited using
a fixed Eeff and variable PDD, and type C samples were produced with a fixed PDD and a variable
Eeff. Within each type B and C group, a series of sub-samples at two or three different but fixed PDD
(i.e., type C) and Eeff (i.e., type B) were explored.
A second limitation to a Type A investigation is that the same values of Eeff and PDD can be arrived
at in different ways, since they are combined parameters. To explore any possible influence this has
on clad deposition, type D samples were deposited with a variety of laser powers (P), scan speeds (V)
and powder feed rates (R) in order to produce identical Eeff and PDD conditions. More specifically,
two samples were produced at Eeff = 180 & PDD =0.014 (D1 and D2) to study the effect of combined
laser parameters.
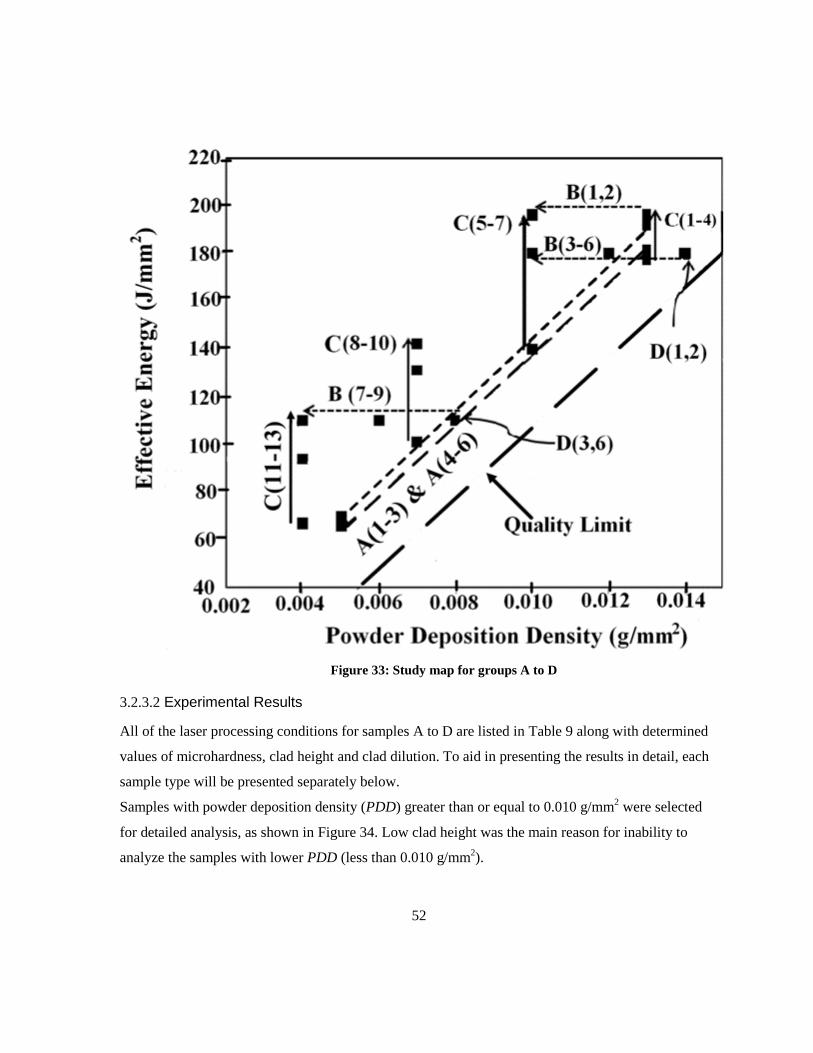
52
Figure 33: Study map for groups A to D
3.2.3.2 Experimental Results
All of the laser processing conditions for samples A to D are listed in Table 9 along with determined
values of microhardness, clad height and clad dilution. To aid in presenting the results in detail, each
sample type will be presented separately below.
Samples with powder deposition density (PDD) greater than or equal to 0.010 g/mm2 were selected
for detailed analysis, as shown in Figure 34. Low clad height was the main reason for inability to
analyze the samples with lower PDD (less than 0.010 g/mm2).
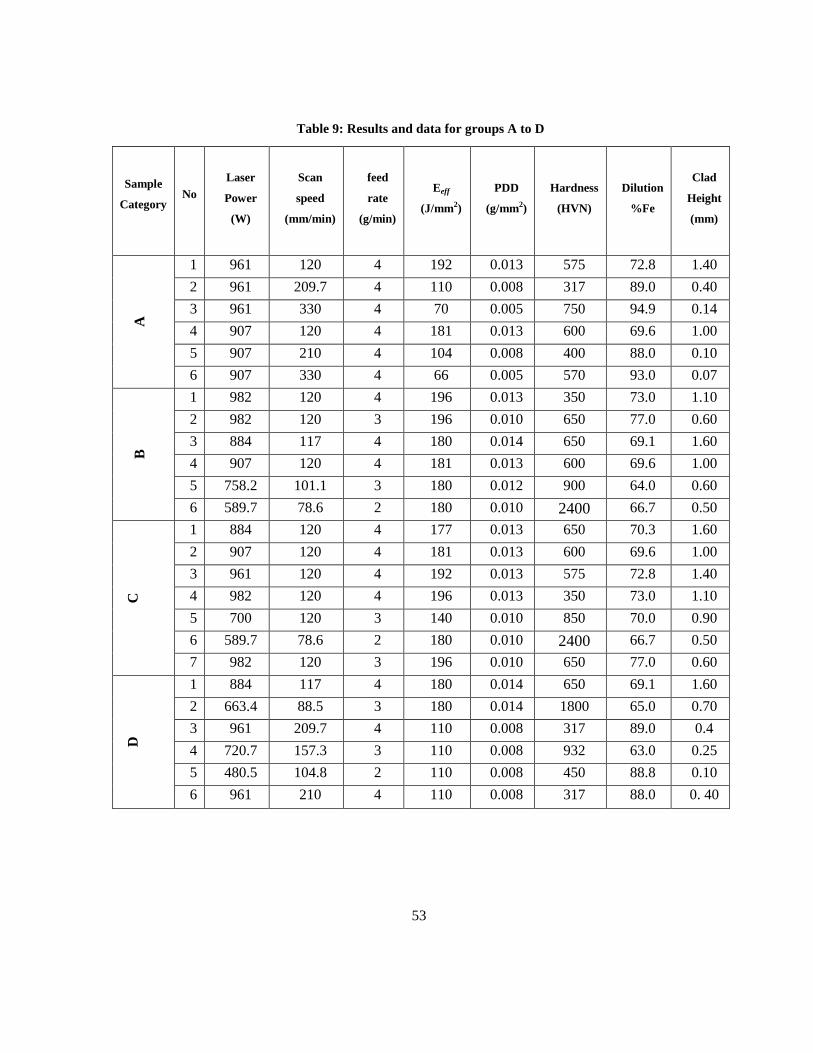
53
Table 9: Results and data for groups A to D
Sample
Category No
Laser
Power
(W)
Scan
speed
(mm/min)
feed
rate
(g/min)
Eeff
(J/mm2)
PDD
(g/mm2)
Hardness
(HVN)
Dilution
%Fe
Clad
Height
(mm)
A
1 961 120 4 192 0.013 575 72.8 1.40
2 961 209.7 4 110 0.008 317 89.0 0.40
3 961 330 4 70 0.005 750 94.9 0.14
4 907 120 4 181 0.013 600 69.6 1.00
5 907 210 4 104 0.008 400 88.0 0.10
6 907 330 4 66 0.005 570 93.0 0.07
B
1 982 120 4 196 0.013 350 73.0 1.10
2 982 120 3 196 0.010 650 77.0 0.60
3 884 117 4 180 0.014 650 69.1 1.60
4 907 120 4 181 0.013 600 69.6 1.00
5 758.2 101.1 3 180 0.012 900 64.0 0.60
6 589.7 78.6 2 180 0.010 2400 66.7 0.50
C
1 884 120 4 177 0.013 650 70.3 1.60
2 907 120 4 181 0.013 600 69.6 1.00
3 961 120 4 192 0.013 575 72.8 1.40
4 982 120 4 196 0.013 350 73.0 1.10
5 700 120 3 140 0.010 850 70.0 0.90
6 589.7 78.6 2 180 0.010 2400 66.7 0.50
7 982 120 3 196 0.010 650 77.0 0.60
D
1 884 117 4 180 0.014 650 69.1 1.60
2 663.4 88.5 3 180 0.014 1800 65.0 0.70
3 961 209.7 4 110 0.008 317 89.0 0.4
4 720.7 157.3 3 110 0.008 932 63.0 0.25
5 480.5 104.8 2 110 0.008 450 88.8 0.10
6 961 210 4 110 0.008 317 88.0 0. 40
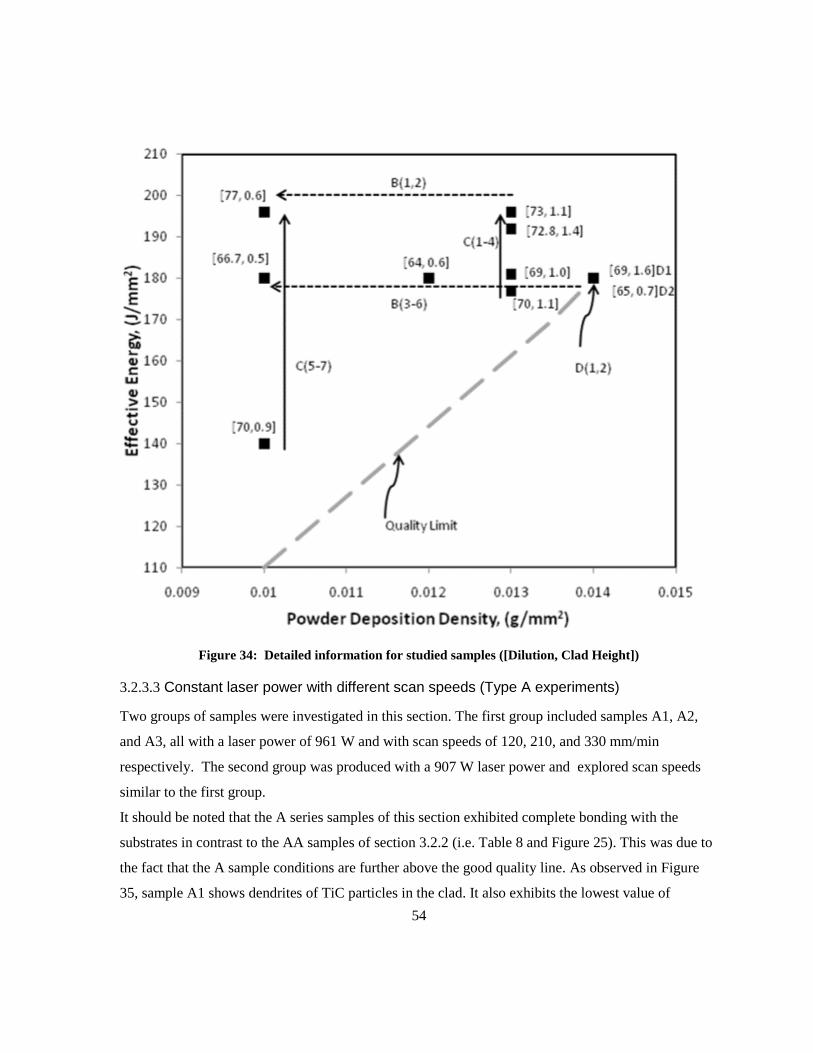
54
Figure 34: Detailed information for studied samples ([Dilution, Clad Height])
3.2.3.3 Constant laser power with different scan speeds (Type A experiments)
Two groups of samples were investigated in this section. The first group included samples A1, A2,
and A3, all with a laser power of 961 W and with scan speeds of 120, 210, and 330 mm/min
respectively. The second group was produced with a 907 W laser power and explored scan speeds
similar to the first group.
It should be noted that the A series samples of this section exhibited complete bonding with the
substrates in contrast to the AA samples of section 3.2.2 (i.e. Table 8 and Figure 25). This was due to
the fact that the A sample conditions are further above the good quality line. As observed in Figure
35, sample A1 shows dendrites of TiC particles in the clad. It also exhibits the lowest value of
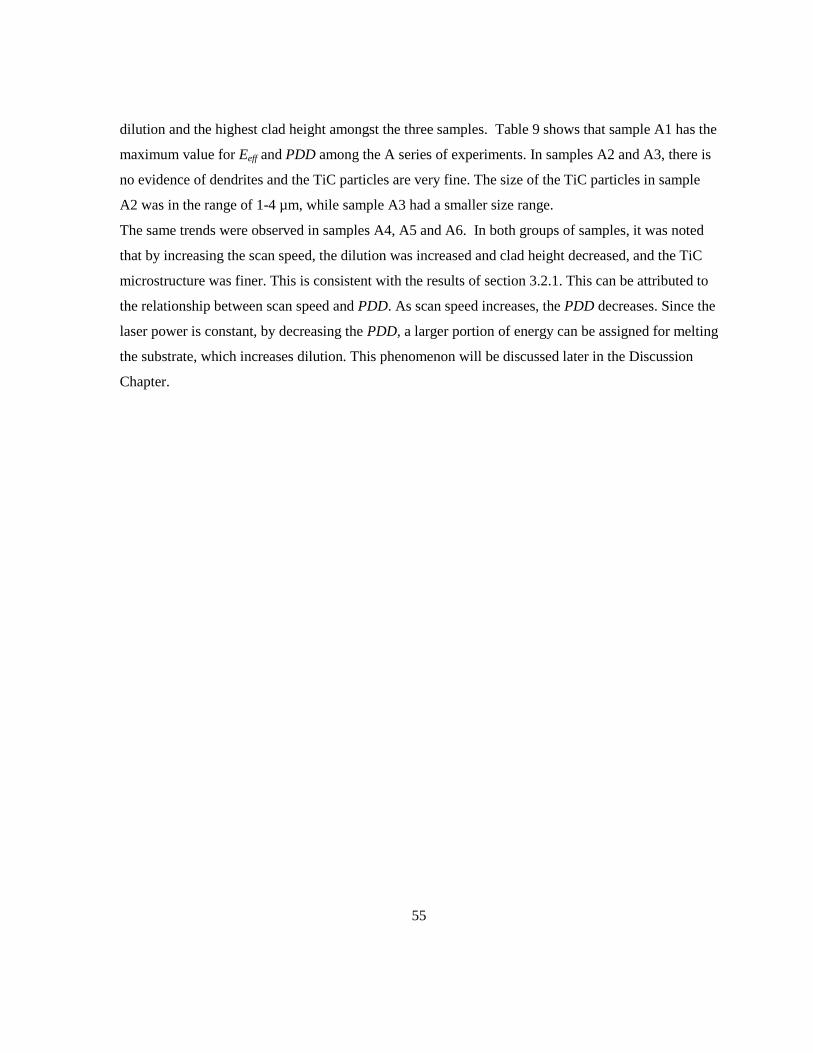
55
dilution and the highest clad height amongst the three samples. Table 9 shows that sample A1 has the
maximum value for Eeff and PDD among the A series of experiments. In samples A2 and A3, there is
no evidence of dendrites and the TiC particles are very fine. The size of the TiC particles in sample
A2 was in the range of 1-4 µm, while sample A3 had a smaller size range.
The same trends were observed in samples A4, A5 and A6. In both groups of samples, it was noted
that by increasing the scan speed, the dilution was increased and clad height decreased, and the TiC
microstructure was finer. This is consistent with the results of section 3.2.1. This can be attributed to
the relationship between scan speed and PDD. As scan speed increases, the PDD decreases. Since the
laser power is constant, by decreasing the PDD, a larger portion of energy can be assigned for melting
the substrate, which increases dilution. This phenomenon will be discussed later in the Discussion
Chapter.
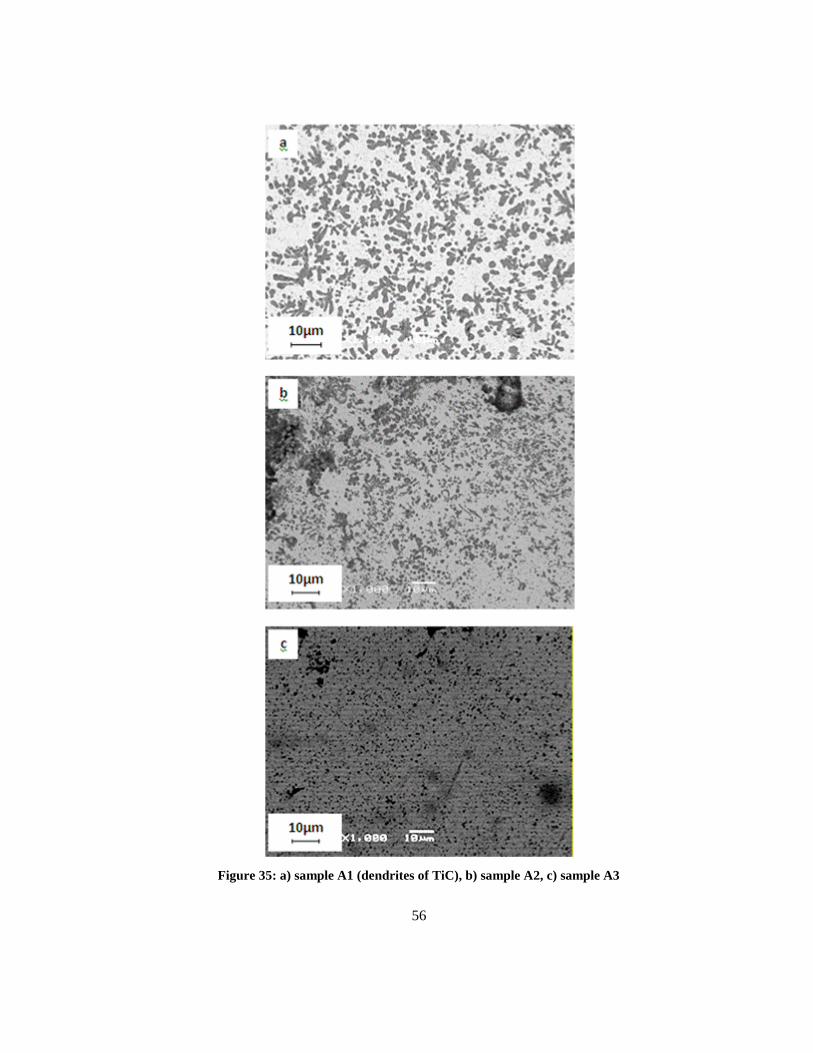
56
Figure 35: a) sample A1 (dendrites of TiC), b) sample A2, c) sample A3
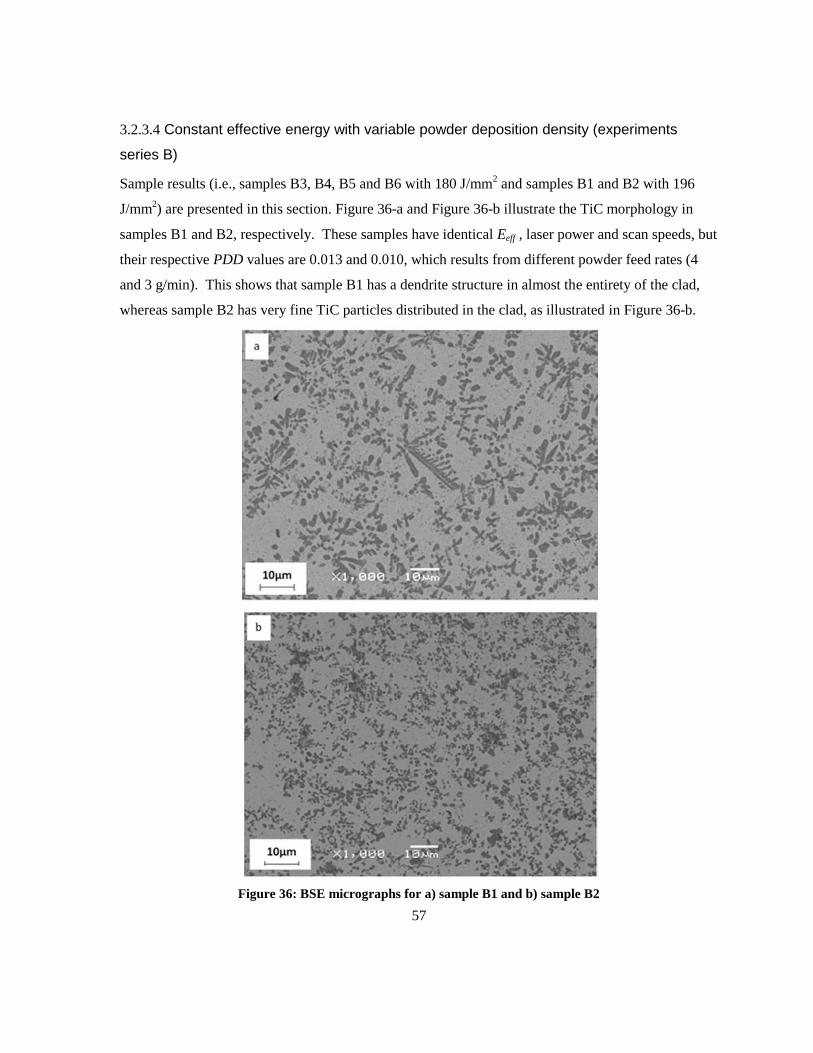
57
3.2.3.4 Constant effective energy with variable powder deposition density (experiments
series B)
Sample results (i.e., samples B3, B4, B5 and B6 with 180 J/mm2 and samples B1 and B2 with 196
J/mm2) are presented in this section. Figure 36-a and Figure 36-b illustrate the TiC morphology in
samples B1 and B2, respectively. These samples have identical Eeff , laser power and scan speeds, but
their respective PDD values are 0.013 and 0.010, which results from different powder feed rates (4
and 3 g/min). This shows that sample B1 has a dendrite structure in almost the entirety of the clad,
whereas sample B2 has very fine TiC particles distributed in the clad, as illustrated in Figure 36-b.
Figure 36: BSE micrographs for a) sample B1 and b) sample B2
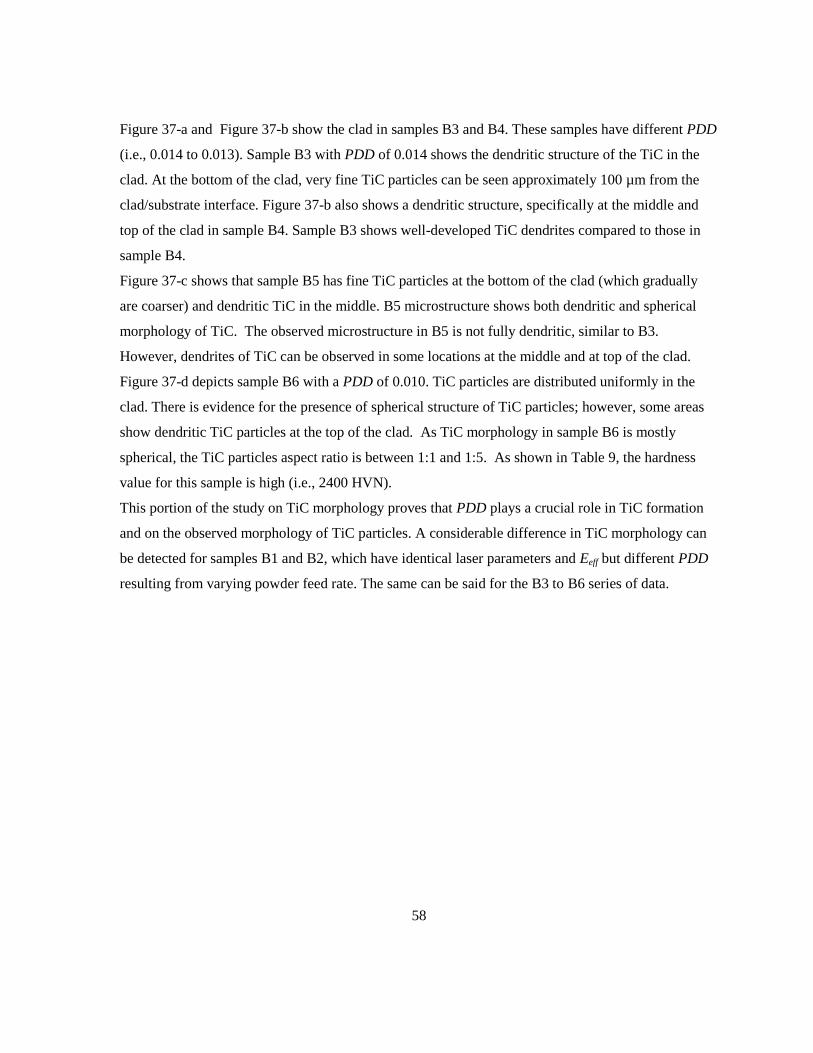
58
Figure 37-a and Figure 37-b show the clad in samples B3 and B4. These samples have different PDD
(i.e., 0.014 to 0.013). Sample B3 with PDD of 0.014 shows the dendritic structure of the TiC in the
clad. At the bottom of the clad, very fine TiC particles can be seen approximately 100 µm from the
clad/substrate interface. Figure 37-b also shows a dendritic structure, specifically at the middle and
top of the clad in sample B4. Sample B3 shows well-developed TiC dendrites compared to those in
sample B4.
Figure 37-c shows that sample B5 has fine TiC particles at the bottom of the clad (which gradually
are coarser) and dendritic TiC in the middle. B5 microstructure shows both dendritic and spherical
morphology of TiC. The observed microstructure in B5 is not fully dendritic, similar to B3.
However, dendrites of TiC can be observed in some locations at the middle and at top of the clad.
Figure 37-d depicts sample B6 with a PDD of 0.010. TiC particles are distributed uniformly in the
clad. There is evidence for the presence of spherical structure of TiC particles; however, some areas
show dendritic TiC particles at the top of the clad. As TiC morphology in sample B6 is mostly
spherical, the TiC particles aspect ratio is between 1:1 and 1:5. As shown in Table 9, the hardness
value for this sample is high (i.e., 2400 HVN).
This portion of the study on TiC morphology proves that PDD plays a crucial role in TiC formation
and on the observed morphology of TiC particles. A considerable difference in TiC morphology can
be detected for samples B1 and B2, which have identical laser parameters and Eeff but different PDD
resulting from varying powder feed rate. The same can be said for the B3 to B6 series of data.
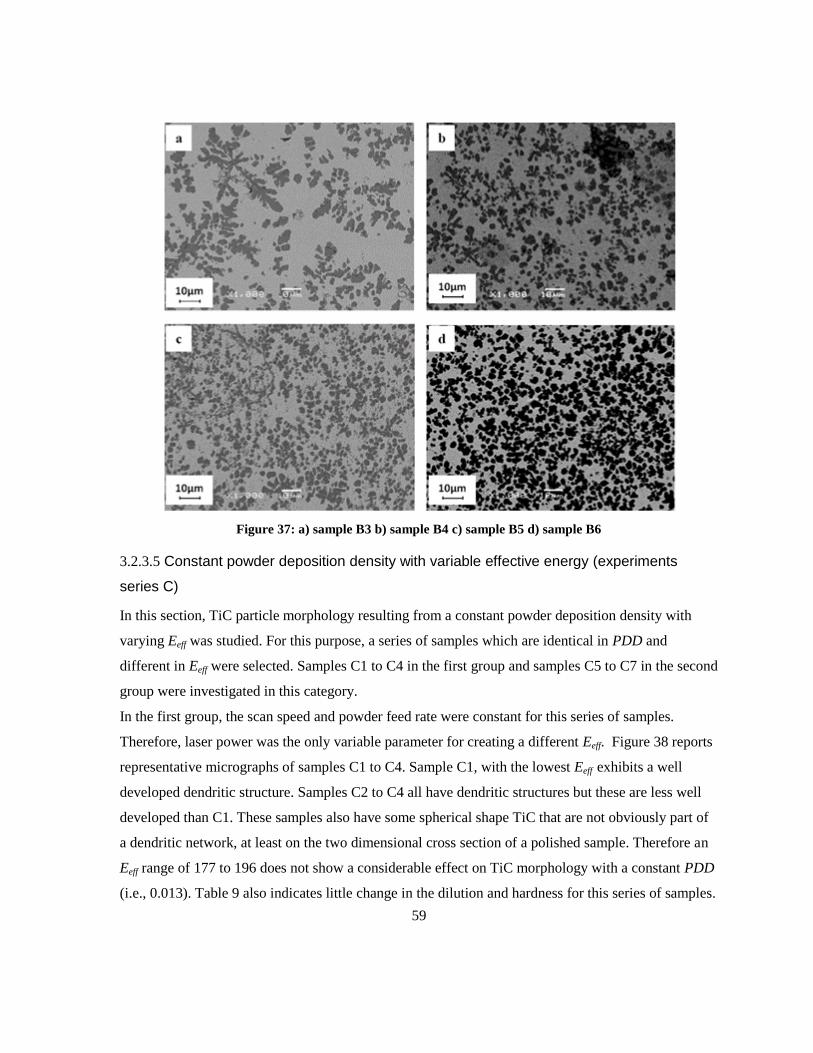
59
Figure 37: a) sample B3 b) sample B4 c) sample B5 d) sample B6
3.2.3.5 Constant powder deposition density with variable effective energy (experiments
series C)
In this section, TiC particle morphology resulting from a constant powder deposition density with
varying Eeff was studied. For this purpose, a series of samples which are identical in PDD and
different in Eeff were selected. Samples C1 to C4 in the first group and samples C5 to C7 in the second
group were investigated in this category.
In the first group, the scan speed and powder feed rate were constant for this series of samples.
Therefore, laser power was the only variable parameter for creating a different Eeff. Figure 38 reports
representative micrographs of samples C1 to C4. Sample C1, with the lowest Eeff exhibits a well
developed dendritic structure. Samples C2 to C4 all have dendritic structures but these are less well
developed than C1. These samples also have some spherical shape TiC that are not obviously part of
a dendritic network, at least on the two dimensional cross section of a polished sample. Therefore an
Eeff range of 177 to 196 does not show a considerable effect on TiC morphology with a constant PDD
(i.e., 0.013). Table 9 also indicates little change in the dilution and hardness for this series of samples.
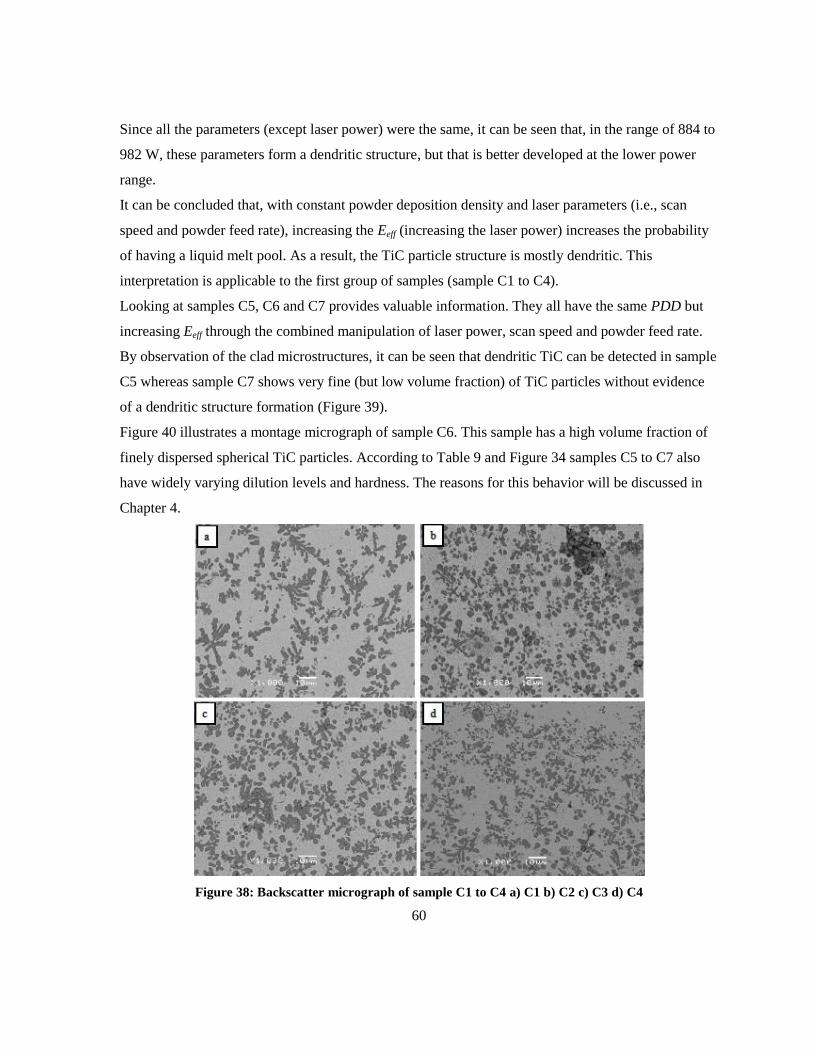
60
Since all the parameters (except laser power) were the same, it can be seen that, in the range of 884 to
982 W, these parameters form a dendritic structure, but that is better developed at the lower power
range.
It can be concluded that, with constant powder deposition density and laser parameters (i.e., scan
speed and powder feed rate), increasing the Eeff (increasing the laser power) increases the probability
of having a liquid melt pool. As a result, the TiC particle structure is mostly dendritic. This
interpretation is applicable to the first group of samples (sample C1 to C4).
Looking at samples C5, C6 and C7 provides valuable information. They all have the same PDD but
increasing Eeff through the combined manipulation of laser power, scan speed and powder feed rate.
By observation of the clad microstructures, it can be seen that dendritic TiC can be detected in sample
C5 whereas sample C7 shows very fine (but low volume fraction) of TiC particles without evidence
of a dendritic structure formation (Figure 39).
Figure 40 illustrates a montage micrograph of sample C6. This sample has a high volume fraction of
finely dispersed spherical TiC particles. According to Table 9 and Figure 34 samples C5 to C7 also
have widely varying dilution levels and hardness. The reasons for this behavior will be discussed in
Chapter 4.
Figure 38: Backscatter micrograph of sample C1 to C4 a) C1 b) C2 c) C3 d) C4
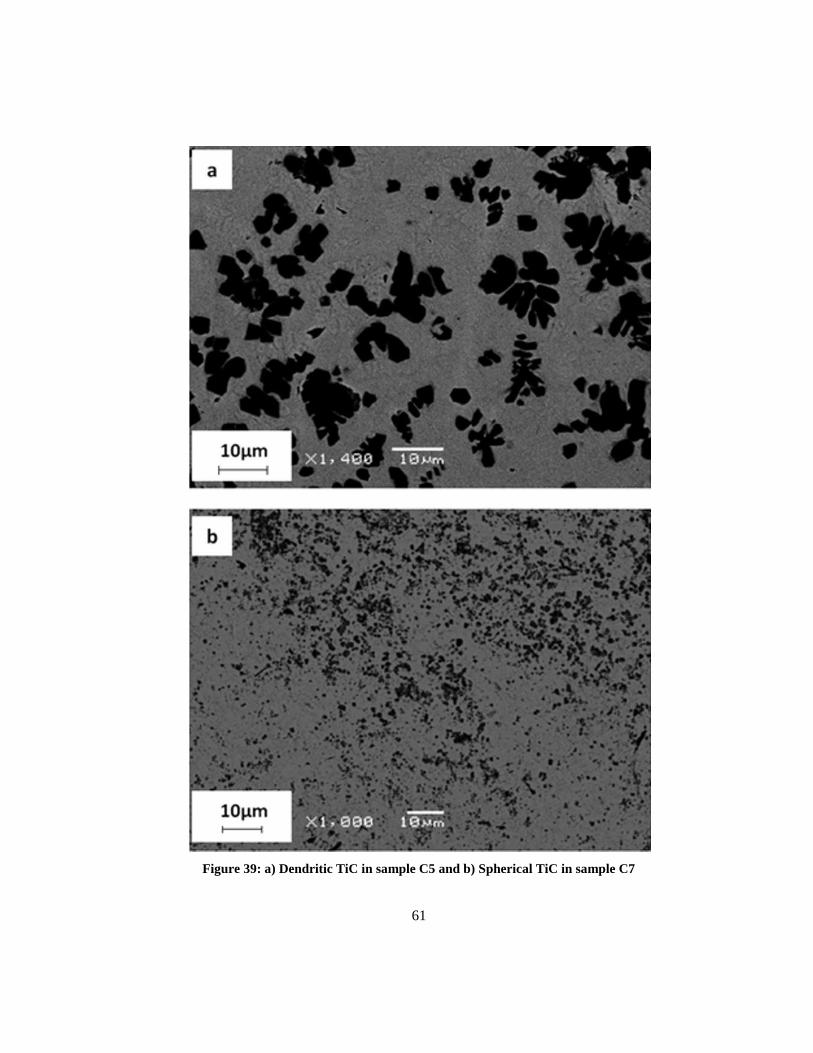
61
Figure 39: a) Dendritic TiC in sample C5 and b) Spherical TiC in sample C7
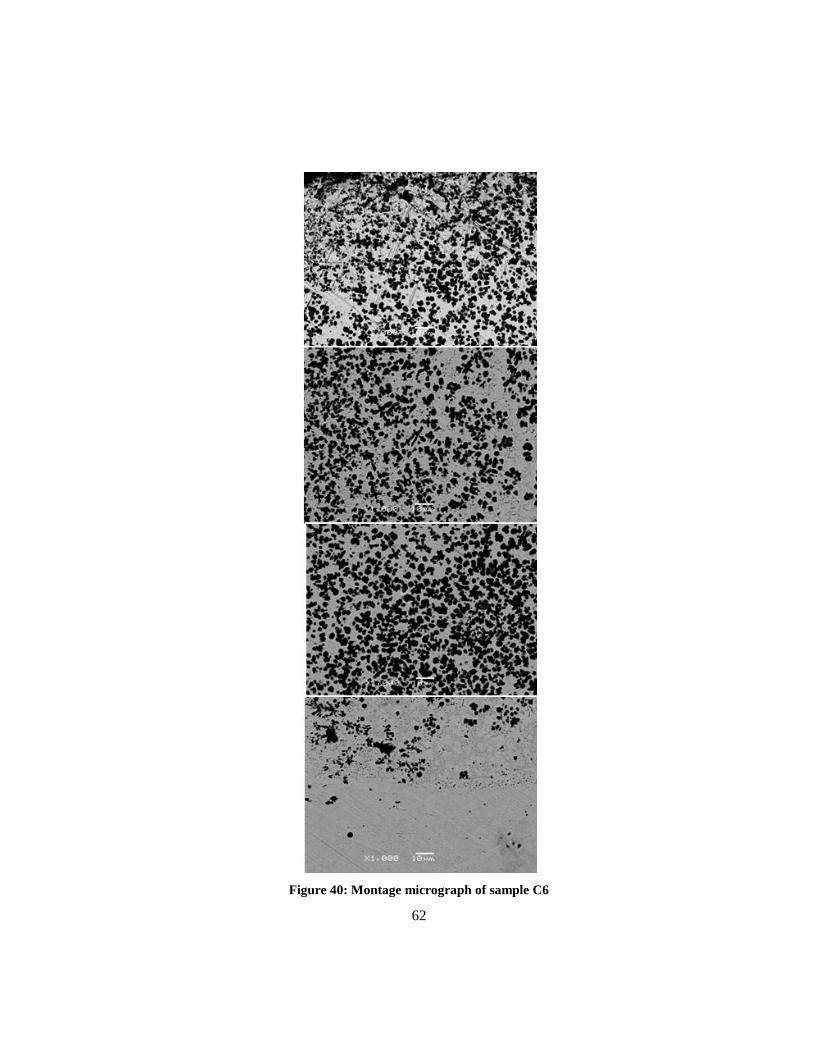
62
Figure 40: Montage micrograph of sample C6
63
3.2.3.6 Identical effective energy and powder deposition density (experiment series D)
The purpose of this section is to clarify the effect of identical effective energy and powder deposition
density on the morphology of TiC particles formed during in-situ laser cladding. As mentioned
earlier, the process parameters have been calculated to be in the high quality clad zone and also
resulted in a specific effective energy and powder deposition density. Table 9 shows that samples D1
and D2 have the same effective energies (Eeff) and powder deposition densities (PDD) but dissimilar
process parameters. The same situation can be seen in samples D4, D5, and D6. Unfortunately the
extent of the deposited clad for conditions D4 to D6 was too low to properly interpret the
micrographs.
Figure 41 illustrates backscatter micrographs of sample D1. Dendritic TiC can be seen in this
micrograph. Figure 42 illustrates the TiC morphology for sample D2. There is no evidence of a
dendritic structure for TiC. Moreover, the distribution of TiC particles in the clad is very uniform
compared to sample D1. A simple comparison between Figure 41 and Figure 42 shows that there is a
considerable difference between the TiC morphology in these samples, even though both have the
same Eeff and PDD values. More detailed explanation can be found in the Discussion Chapter.
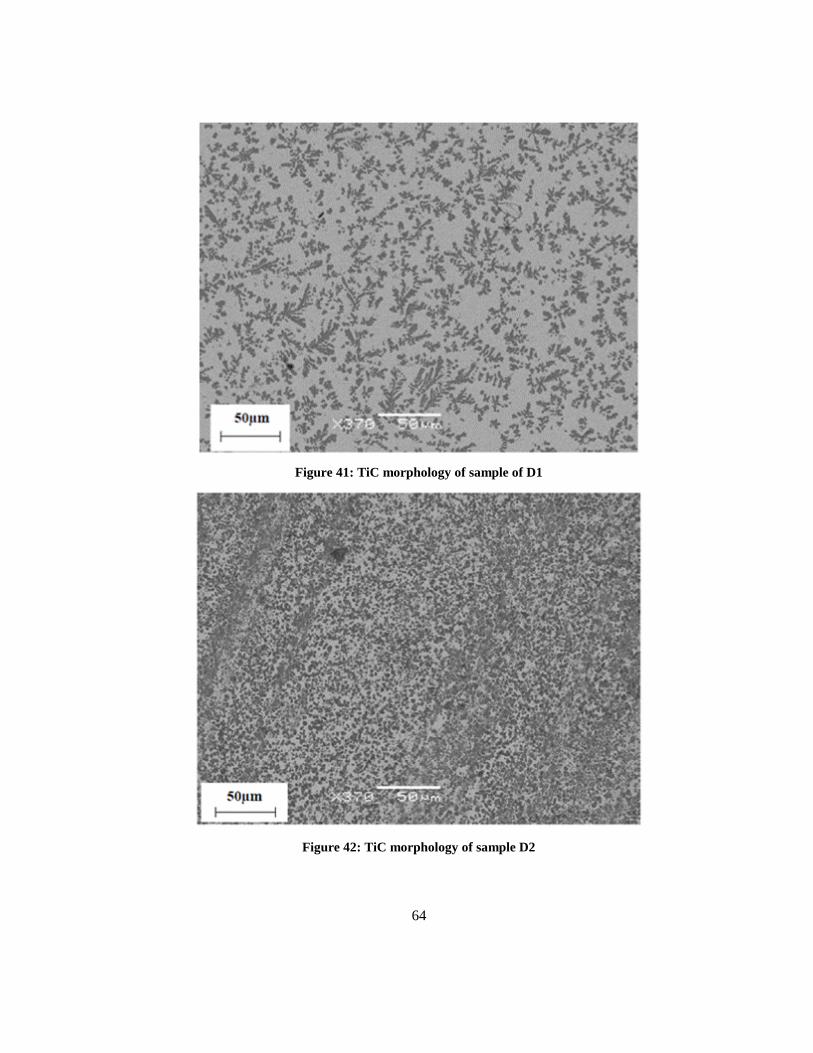
64
Figure 41: TiC morphology of sample of D1
Figure 42: TiC morphology of sample D2
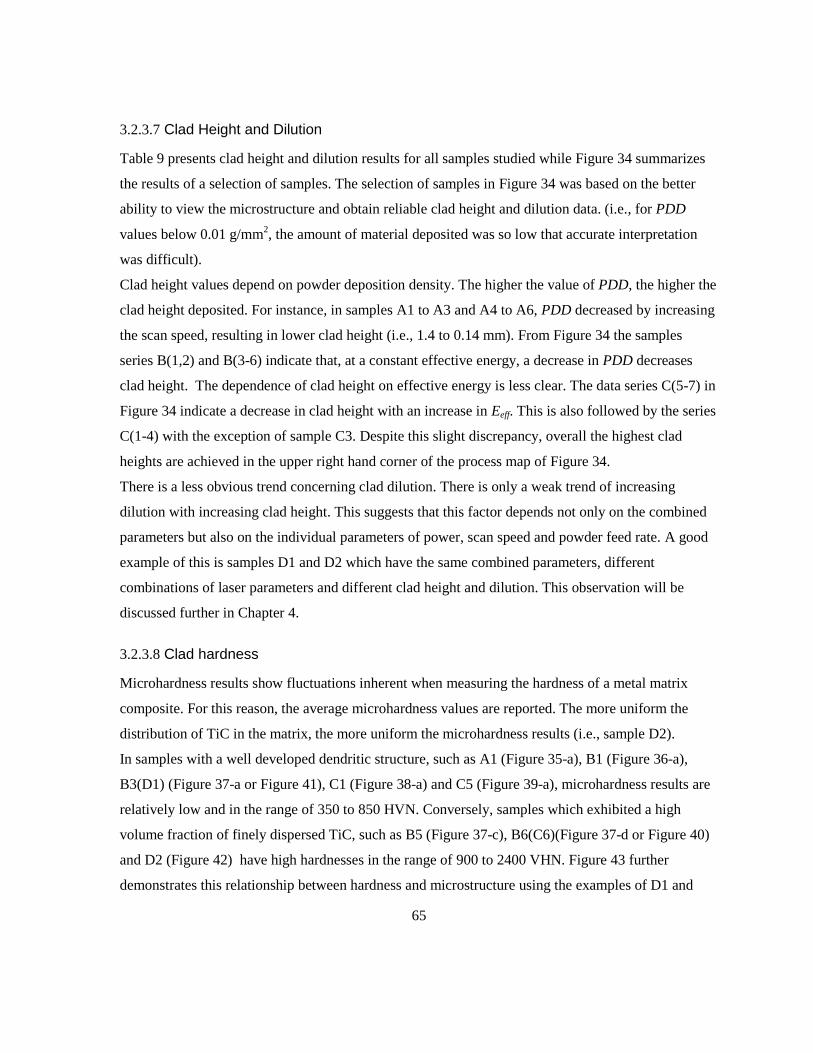
65
3.2.3.7 Clad Height and Dilution
Table 9 presents clad height and dilution results for all samples studied while Figure 34 summarizes
the results of a selection of samples. The selection of samples in Figure 34 was based on the better
ability to view the microstructure and obtain reliable clad height and dilution data. (i.e., for PDD
values below 0.01 g/mm2, the amount of material deposited was so low that accurate interpretation
was difficult).
Clad height values depend on powder deposition density. The higher the value of PDD, the higher the
clad height deposited. For instance, in samples A1 to A3 and A4 to A6, PDD decreased by increasing
the scan speed, resulting in lower clad height (i.e., 1.4 to 0.14 mm). From Figure 34 the samples
series B(1,2) and B(3-6) indicate that, at a constant effective energy, a decrease in PDD decreases
clad height. The dependence of clad height on effective energy is less clear. The data series C(5-7) in
Figure 34 indicate a decrease in clad height with an increase in Eeff. This is also followed by the series
C(1-4) with the exception of sample C3. Despite this slight discrepancy, overall the highest clad
heights are achieved in the upper right hand corner of the process map of Figure 34.
There is a less obvious trend concerning clad dilution. There is only a weak trend of increasing
dilution with increasing clad height. This suggests that this factor depends not only on the combined
parameters but also on the individual parameters of power, scan speed and powder feed rate. A good
example of this is samples D1 and D2 which have the same combined parameters, different
combinations of laser parameters and different clad height and dilution. This observation will be
discussed further in Chapter 4.
3.2.3.8 Clad hardness
Microhardness results show fluctuations inherent when measuring the hardness of a metal matrix
composite. For this reason, the average microhardness values are reported. The more uniform the
distribution of TiC in the matrix, the more uniform the microhardness results (i.e., sample D2).
In samples with a well developed dendritic structure, such as A1 (Figure 35-a), B1 (Figure 36-a),
B3(D1) (Figure 37-a or Figure 41), C1 (Figure 38-a) and C5 (Figure 39-a), microhardness results are
relatively low and in the range of 350 to 850 HVN. Conversely, samples which exhibited a high
volume fraction of finely dispersed TiC, such as B5 (Figure 37-c), B6(C6)(Figure 37-d or Figure 40)
and D2 (Figure 42) have high hardnesses in the range of 900 to 2400 VHN. Figure 43 further
demonstrates this relationship between hardness and microstructure using the examples of D1 and
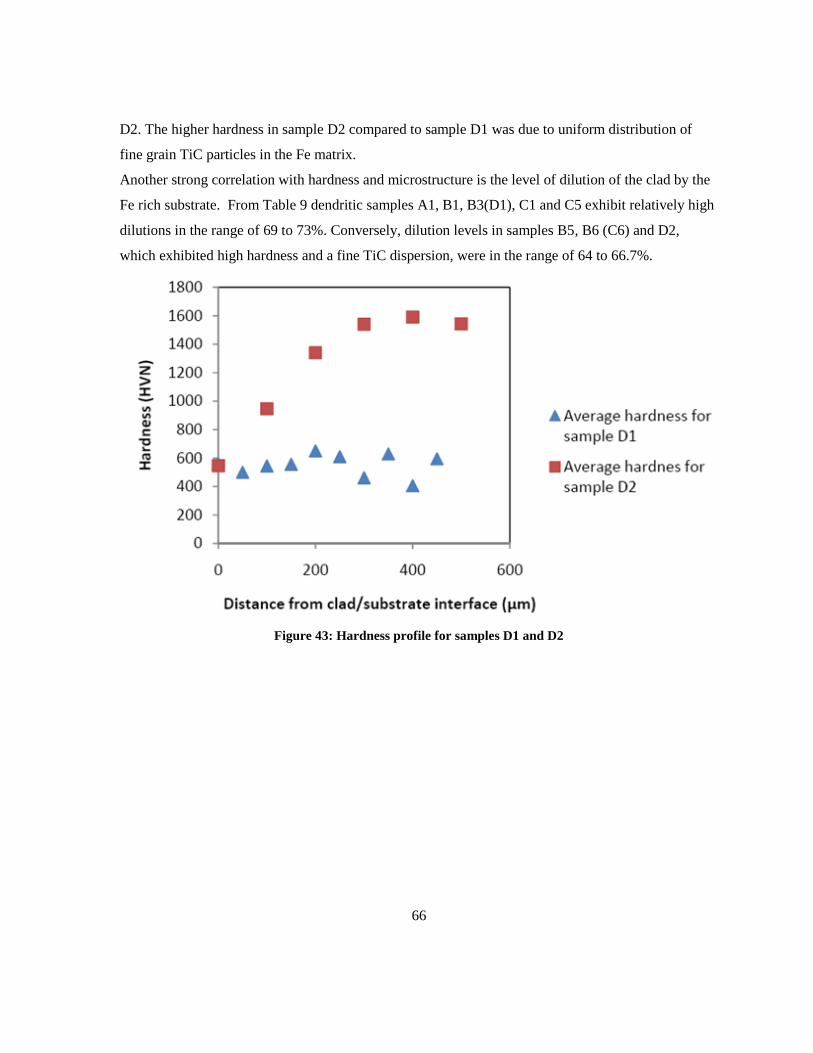
66
D2. The higher hardness in sample D2 compared to sample D1 was due to uniform distribution of
fine grain TiC particles in the Fe matrix.
Another strong correlation with hardness and microstructure is the level of dilution of the clad by the
Fe rich substrate. From Table 9 dendritic samples A1, B1, B3(D1), C1 and C5 exhibit relatively high
dilutions in the range of 69 to 73%. Conversely, dilution levels in samples B5, B6 (C6) and D2,
which exhibited high hardness and a fine TiC dispersion, were in the range of 64 to 66.7%.
Figure 43: Hardness profile for samples D1 and D2
67
3.2.4 Composition Study
In this section, the effect of powder composition on TiC morphology and clad hardness using the in-
situ laser cladding process was studied. Two C:Ti atomic ratios, 45:55 and 55:45, were selected. The
first ratio (i.e. the ratio used in sections 3.2.1and 3.2.3) had the potential to form near stochiometric
TiC without the formation of excess Ti (α) phase (Figure 9).
3.2.4.1 Composition Study Results
Table 10 shows the laser parameters chosen for deposition of the various powder compositions.
Conditions A and B were the identical conditions used for samples D1 and D2 of the previous
section. These were chosen because they represent conditions that produced the range of
microstructure previously observed. Condition B produced a fine, high volume fraction of dispersed
TiC resulting in high hardness, while condition A produced a coarse, dendritic TiC morphology with
lower hardness. It was important to determine if these broad laser parameter affects were consistent
over different powder compositional ranges.
For sample 155, the A and B laser parameters could not deposit an acceptable clad track. Therefore,
the powder feed rates for this group were decreased in order to deposit a bonded clad. All other laser
parameters remained the same. In order to distinguish these altered parameters they are labeled AA
and BB. The reported amount for the powder feed rate was the maximum amount where deposition
was feasible. Therefore, any other feed rate higher than the reported powder feed rate did not create
metallurgical bonding between the clad and substrate.
Table 10 Applied laser parameters for different compositions
Par
amet
ers
con
dit
ion
Sam
ple
No
Las
er p
ow
er W
Sca
n s
pee
d
(mm
/sec
)
Po
wd
er f
eed r
ate
(g/m
in)
Eff
ecti
ve
Ener
gy
(J/m
m2)
Po
wd
er
dep
osi
tio
n d
ensi
ty
(g/m
m2)
A 745, 755,655,555 884 120 4 180 0.014
B 745, 755,655,555 663.4 88.5 3 180 0.014
AA 155 884 120 2.12 180 0.007
BB 155 663.4 88.5 0.95 180 0.004
68
3.2.4.2 SEM, EDS and Micrograph Analysis Results
In this section, clad microstructures of samples with different clad compositions were studied. Figure
44 shows the SEM micrographs of samples with similar laser parameters (i.e. type A and AA) but
different chemical compositions. Results show that clad composition affected both clad
microstructure and morphology. Examination of Figure 44-a and Figure 44-b allow a determination
of the influence of carbon ratio only (i.e. the same in Fe weight percentage and laser conditions).
Figure 44-a shows the dendritic microstructure of TiC expected from the results of section 3.2.3,
while Figure 44-b depicts a transition to finer, spherical TiC distributed uniformly in the matrix
which was more typical of laser condition B. Therefore an increase in the C:Ti ratio alone can change
the morphology of the TiC within the clad.
For the higher C:Ti ratio and laser condition A, decreasing the Fe percentage in the clad powder has
the affect of increasing the volume fraction of spherical TiC as well as the size of the spherical
dispersoids.
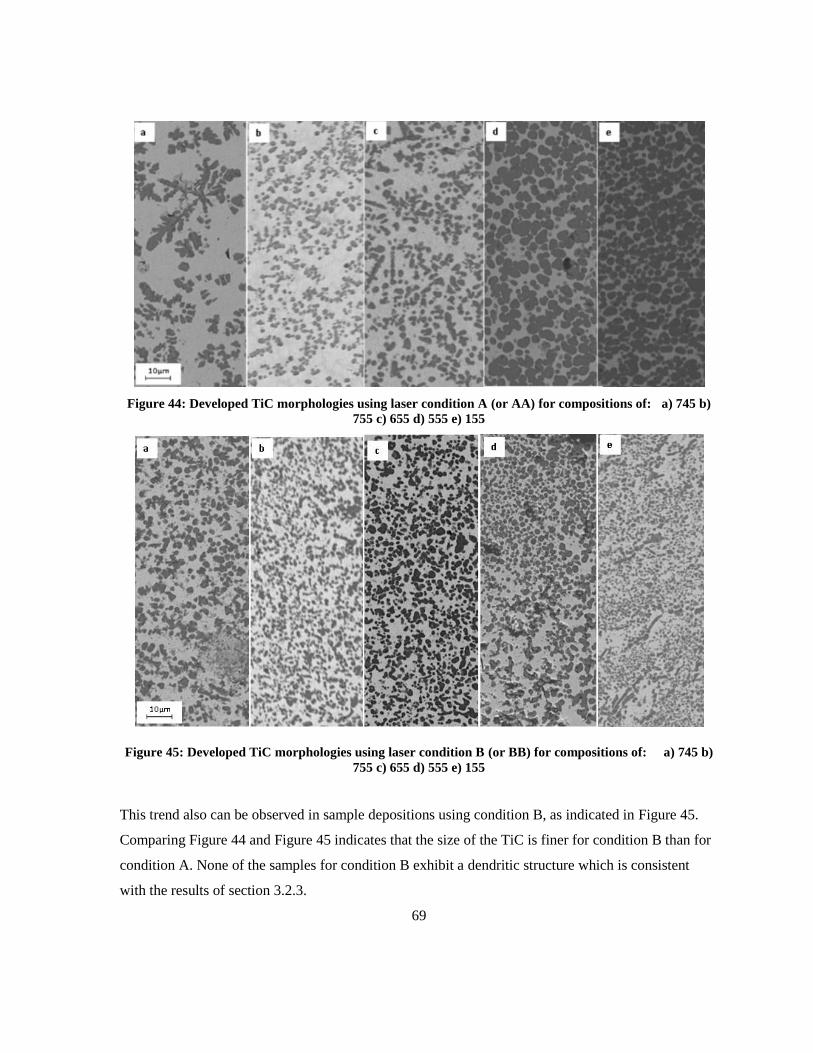
69
Figure 44: Developed TiC morphologies using laser condition A (or AA) for compositions of: a) 745 b)
755 c) 655 d) 555 e) 155
Figure 45: Developed TiC morphologies using laser condition B (or BB) for compositions of: a) 745 b)
755 c) 655 d) 555 e) 155
This trend also can be observed in sample depositions using condition B, as indicated in Figure 45.
Comparing Figure 44 and Figure 45 indicates that the size of the TiC is finer for condition B than for
condition A. None of the samples for condition B exhibit a dendritic structure which is consistent
with the results of section 3.2.3.
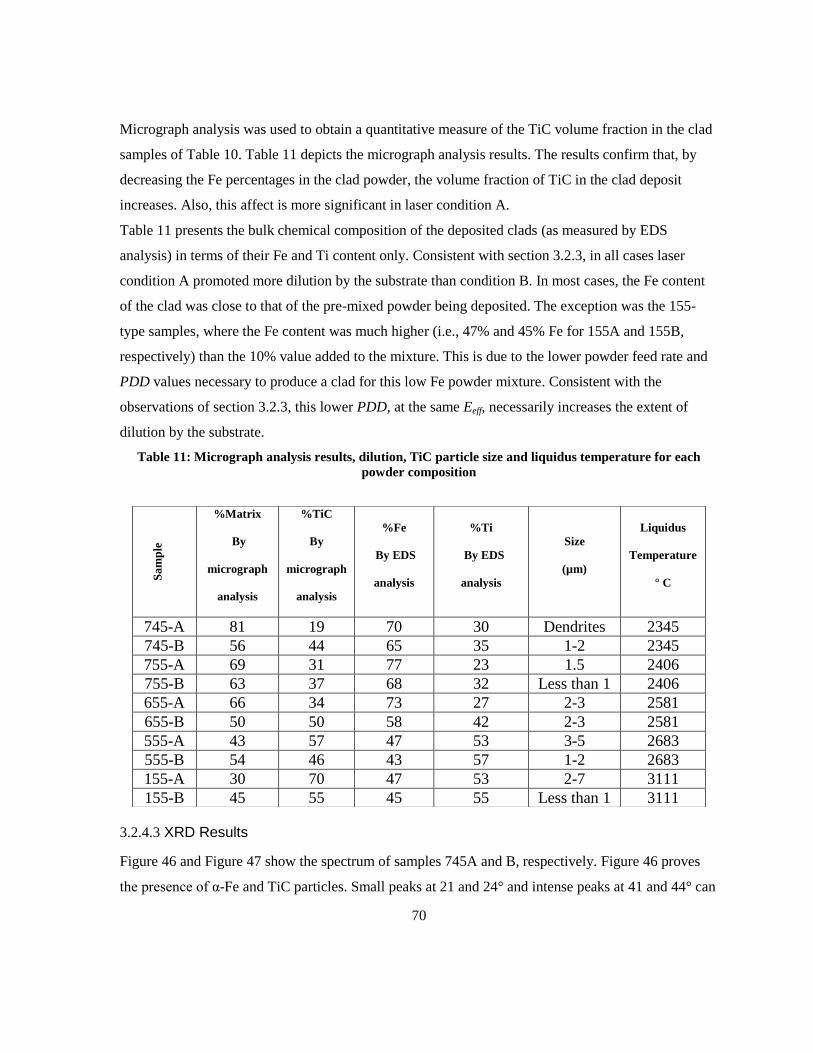
70
Micrograph analysis was used to obtain a quantitative measure of the TiC volume fraction in the clad
samples of Table 10. Table 11 depicts the micrograph analysis results. The results confirm that, by
decreasing the Fe percentages in the clad powder, the volume fraction of TiC in the clad deposit
increases. Also, this affect is more significant in laser condition A.
Table 11 presents the bulk chemical composition of the deposited clads (as measured by EDS
analysis) in terms of their Fe and Ti content only. Consistent with section 3.2.3, in all cases laser
condition A promoted more dilution by the substrate than condition B. In most cases, the Fe content
of the clad was close to that of the pre-mixed powder being deposited. The exception was the 155-
type samples, where the Fe content was much higher (i.e., 47% and 45% Fe for 155A and 155B,
respectively) than the 10% value added to the mixture. This is due to the lower powder feed rate and
PDD values necessary to produce a clad for this low Fe powder mixture. Consistent with the
observations of section 3.2.3, this lower PDD, at the same Eeff, necessarily increases the extent of
dilution by the substrate.
Table 11: Micrograph analysis results, dilution, TiC particle size and liquidus temperature for each
powder composition
3.2.4.3 XRD Results
Figure 46 and Figure 47 show the spectrum of samples 745A and B, respectively. Figure 46 proves
the presence of α-Fe and TiC particles. Small peaks at 21 and 24° and intense peaks at 41 and 44° can
Sa
mp
le
%Matrix
By
micrograph
analysis
%TiC
By
micrograph
analysis
%Fe
By EDS
analysis
%Ti
By EDS
analysis
Size
(µm)
Liquidus
Temperature
° C
745-A 81 19 70 30 Dendrites 2345
745-B 56 44 65 35 1-2 2345
755-A 69 31 77 23 1.5 2406
755-B 63 37 68 32 Less than 1 2406
655-A 66 34 73 27 2-3 2581
655-B 50 50 58 42 2-3 2581
555-A 43 57 47 53 3-5 2683
555-B 54 46 43 57 1-2 2683
155-A 30 70 47 53 2-7 3111
155-B 45 55 45 55 Less than 1 3111
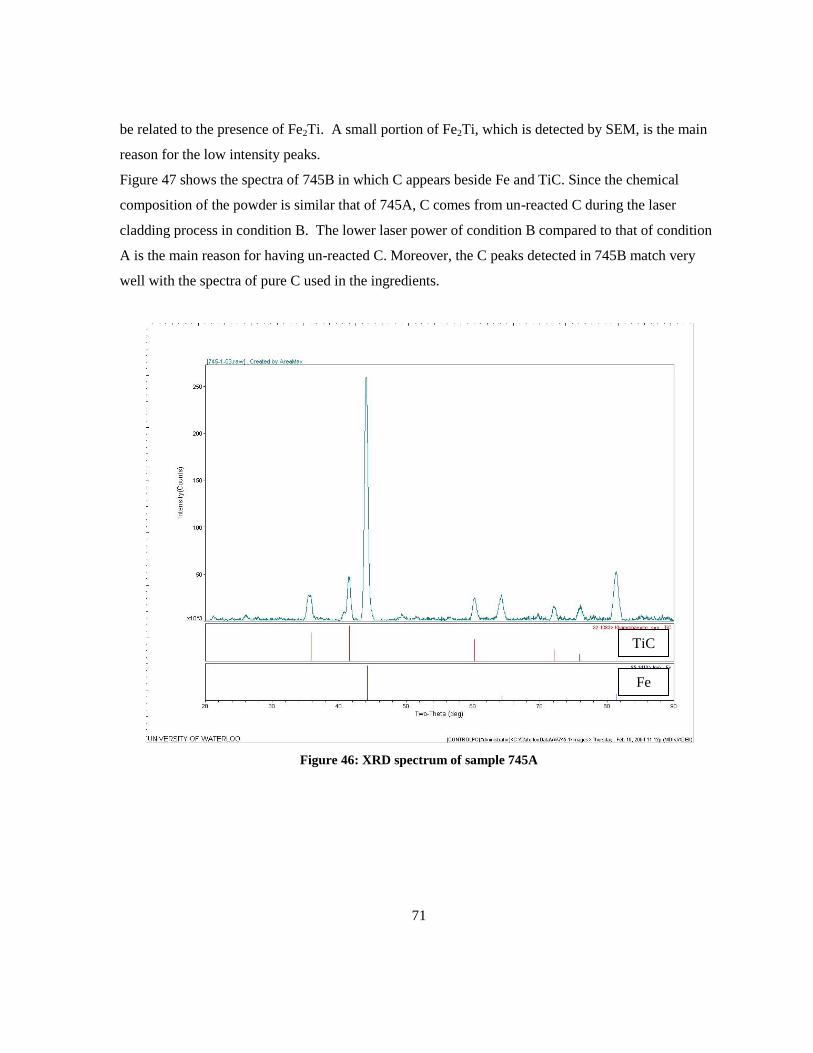
71
be related to the presence of Fe2Ti. A small portion of Fe2Ti, which is detected by SEM, is the main
reason for the low intensity peaks.
Figure 47 shows the spectra of 745B in which C appears beside Fe and TiC. Since the chemical
composition of the powder is similar that of 745A, C comes from un-reacted C during the laser
cladding process in condition B. The lower laser power of condition B compared to that of condition
A is the main reason for having un-reacted C. Moreover, the C peaks detected in 745B match very
well with the spectra of pure C used in the ingredients.
Figure 46: XRD spectrum of sample 745A
Fe
TiC
72
Figure 47: XRD spectrum of sample 745B
Spectra of samples 655B and 155B (Appendix A) are very similar to 745A; however, 655B shows
some peaks that are related to Fe3C. Moreover, weak peaks in 43 and 74° are related to the Fe(γ)
presence (note spectra for Fe(γ) in Figure 52). In sample 155B, Fe(α) and TiC’s peaks are showed
up. Moreover, peaks appeared in 72, 78 and 81° confirm the presence of Fe3C (note spectra for Fe3C
in Figure 49).
Figure 48 shows the spectrums of 655A. Fe3C along with different types of crystalline C are now
detected in addition to previously seen Fe, and TiC. Three different types of crystalline C are
detected. One of these three spectra matches with fed C, which means the probability of un-reacted C
still exits. Small peaks that appeared in 65 and 78° belong to martensite (Figure 50) that was
transformed from Fe(γ). Detection of martensite from Fe3C is hard since their main peaks are close to
each other.
Fe
TiC
C
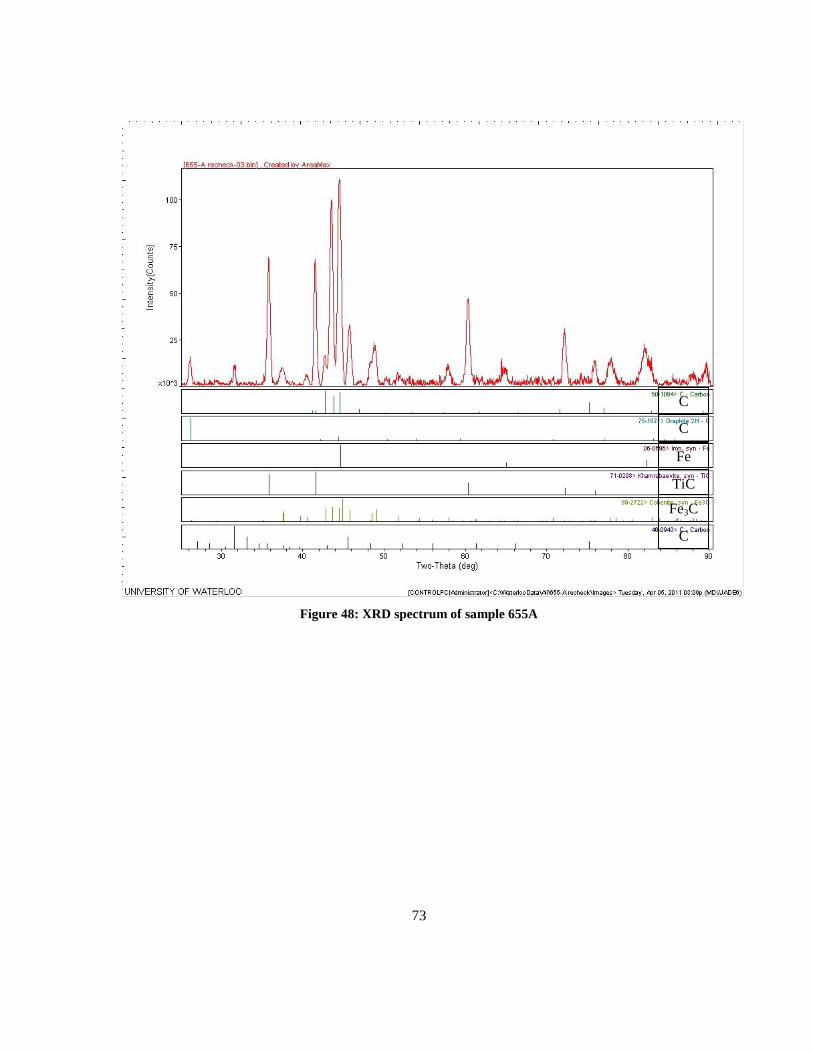
73
Figure 48: XRD spectrum of sample 655A
C
Fe
Fe3C
C
C
TiC
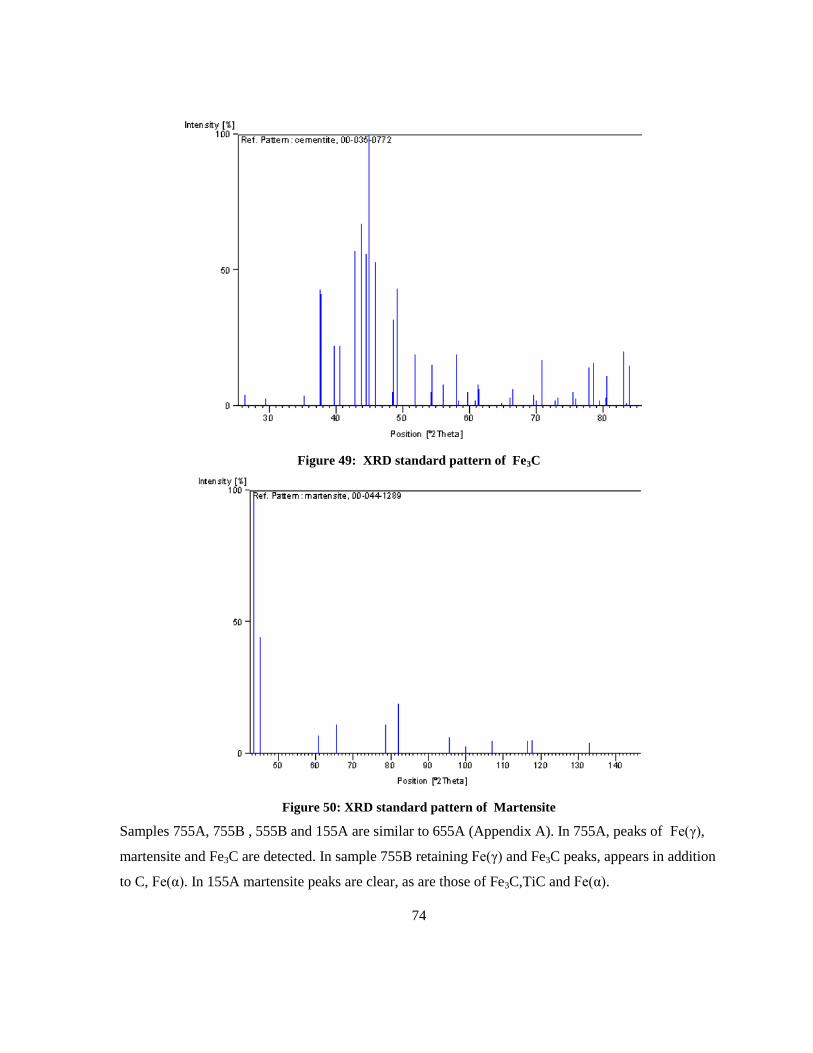
74
Figure 49: XRD standard pattern of Fe3C
Figure 50: XRD standard pattern of Martensite
Samples 755A, 755B , 555B and 155A are similar to 655A (Appendix A). In 755A, peaks of Fe(γ),
martensite and Fe3C are detected. In sample 755B retaining Fe(γ) and Fe3C peaks, appears in addition
to C, Fe(α). In 155A martensite peaks are clear, as are those of Fe3C,TiC and Fe(α).
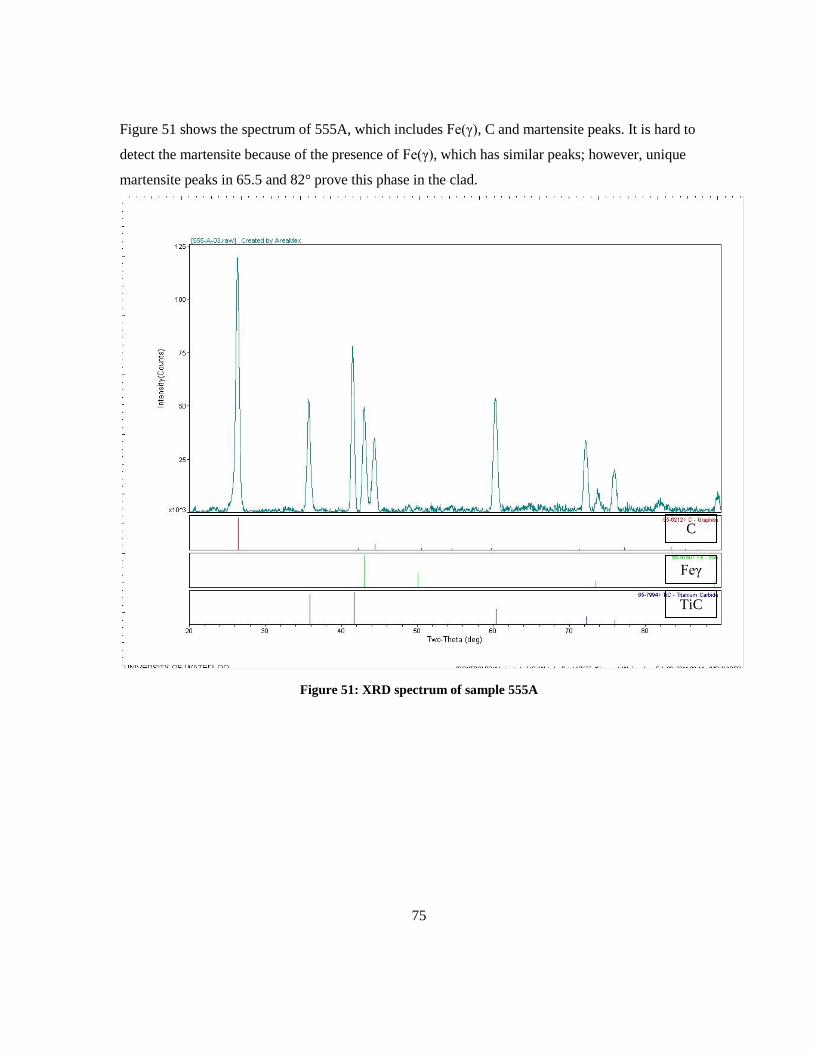
75
Figure 51 shows the spectrum of 555A, which includes Fe(γ), C and martensite peaks. It is hard to
detect the martensite because of the presence of Fe(γ), which has similar peaks; however, unique
martensite peaks in 65.5 and 82° prove this phase in the clad.
Figure 51: XRD spectrum of sample 555A
Feγ
C
TiC
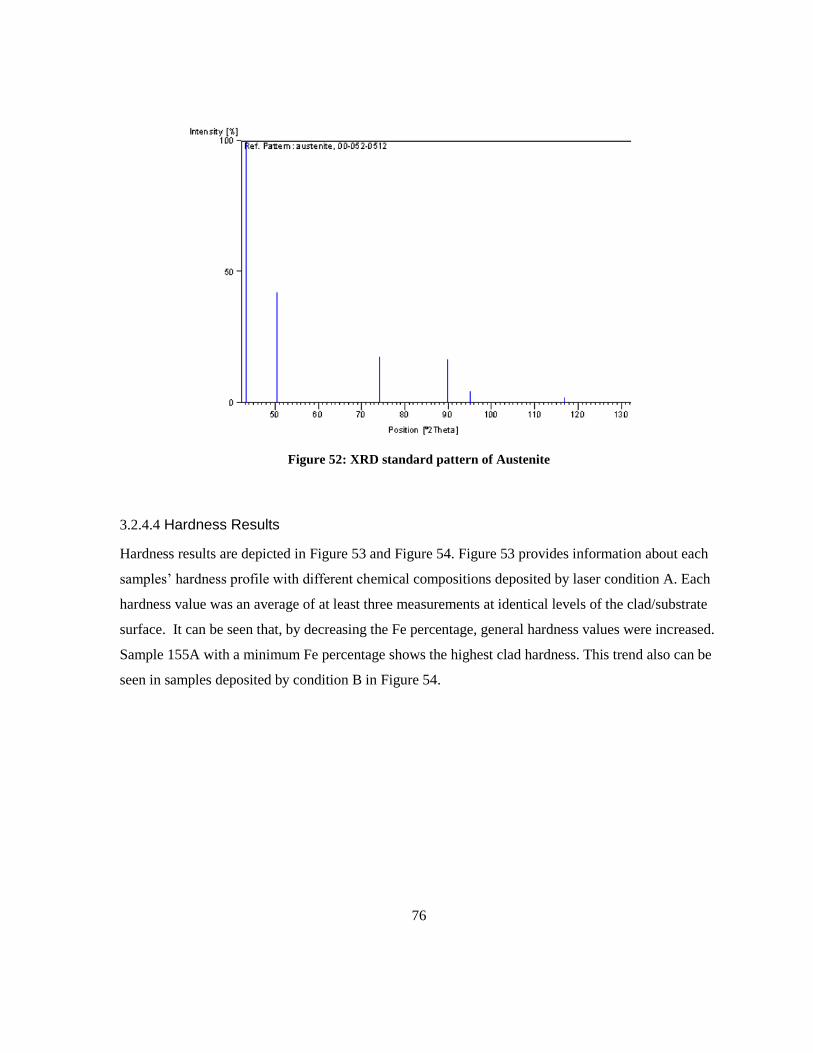
76
Figure 52: XRD standard pattern of Austenite
3.2.4.4 Hardness Results
Hardness results are depicted in Figure 53 and Figure 54. Figure 53 provides information about each
samples’ hardness profile with different chemical compositions deposited by laser condition A. Each
hardness value was an average of at least three measurements at identical levels of the clad/substrate
surface. It can be seen that, by decreasing the Fe percentage, general hardness values were increased.
Sample 155A with a minimum Fe percentage shows the highest clad hardness. This trend also can be
seen in samples deposited by condition B in Figure 54.
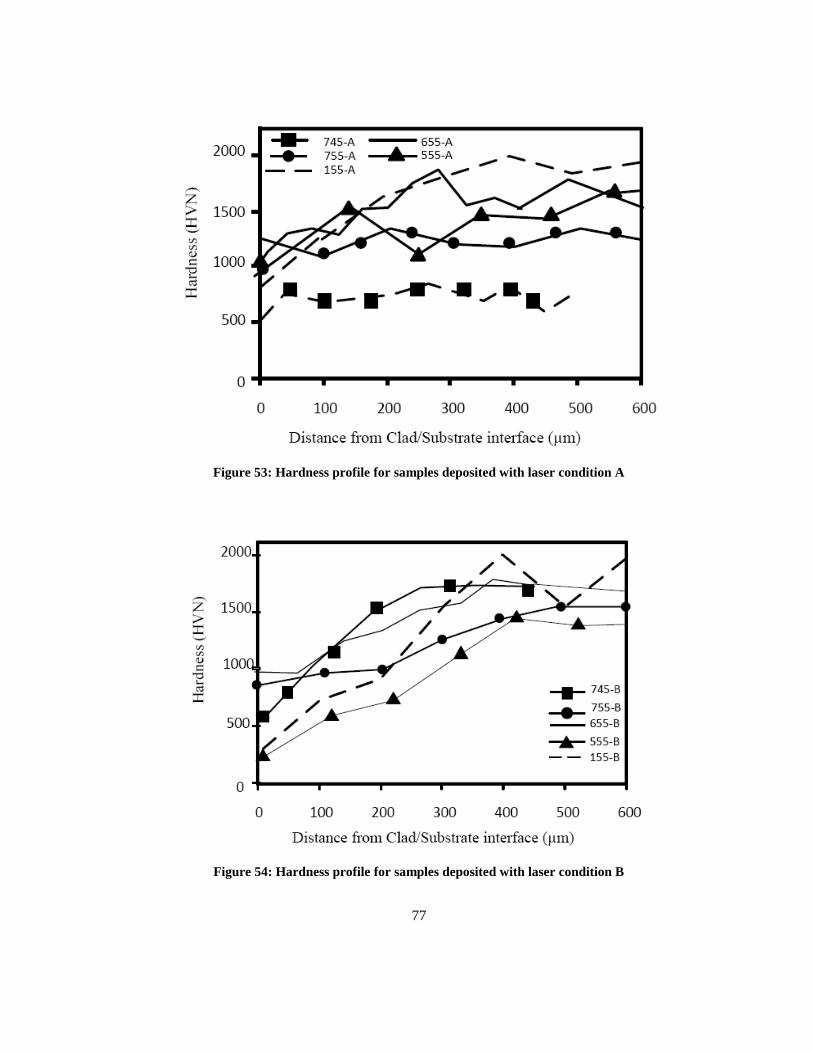
77
Figure 53: Hardness profile for samples deposited with laser condition A
Figure 54: Hardness profile for samples deposited with laser condition B
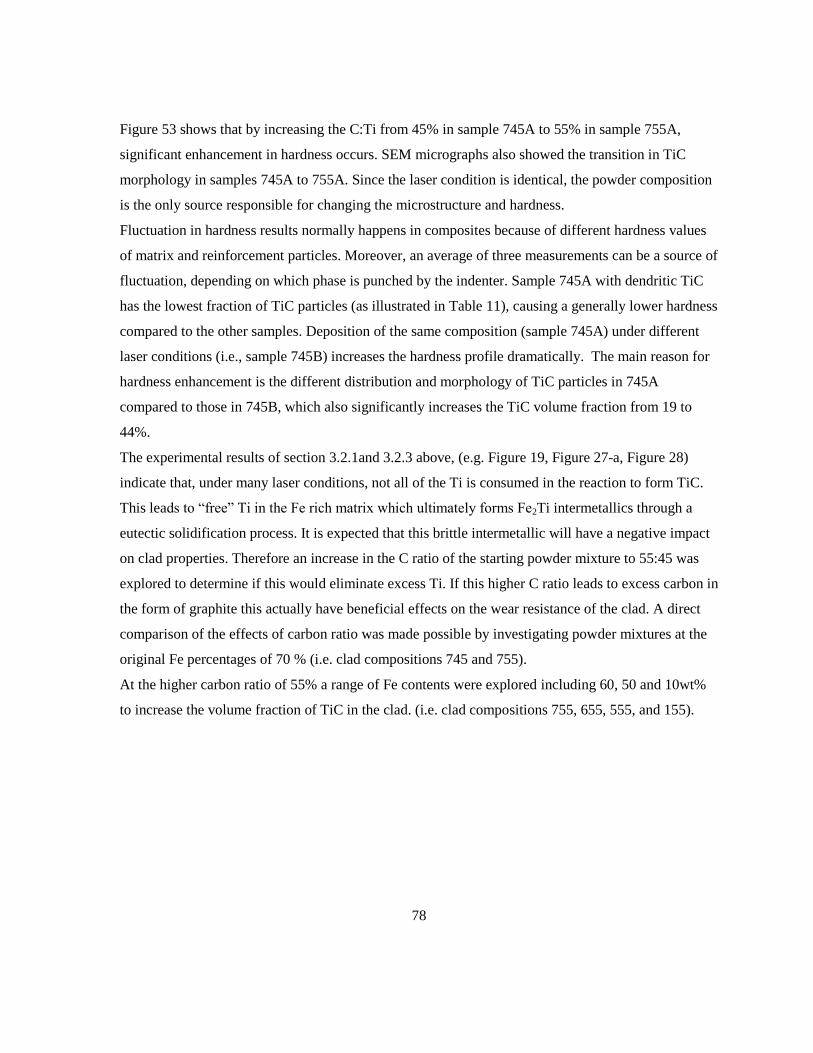
78
Figure 53 shows that by increasing the C:Ti from 45% in sample 745A to 55% in sample 755A,
significant enhancement in hardness occurs. SEM micrographs also showed the transition in TiC
morphology in samples 745A to 755A. Since the laser condition is identical, the powder composition
is the only source responsible for changing the microstructure and hardness.
Fluctuation in hardness results normally happens in composites because of different hardness values
of matrix and reinforcement particles. Moreover, an average of three measurements can be a source of
fluctuation, depending on which phase is punched by the indenter. Sample 745A with dendritic TiC
has the lowest fraction of TiC particles (as illustrated in Table 11), causing a generally lower hardness
compared to the other samples. Deposition of the same composition (sample 745A) under different
laser conditions (i.e., sample 745B) increases the hardness profile dramatically. The main reason for
hardness enhancement is the different distribution and morphology of TiC particles in 745A
compared to those in 745B, which also significantly increases the TiC volume fraction from 19 to
44%.
The experimental results of section 3.2.1and 3.2.3 above, (e.g. Figure 19, Figure 27-a, Figure 28)
indicate that, under many laser conditions, not all of the Ti is consumed in the reaction to form TiC.
This leads to “free” Ti in the Fe rich matrix which ultimately forms Fe2Ti intermetallics through a
eutectic solidification process. It is expected that this brittle intermetallic will have a negative impact
on clad properties. Therefore an increase in the C ratio of the starting powder mixture to 55:45 was
explored to determine if this would eliminate excess Ti. If this higher C ratio leads to excess carbon in
the form of graphite this actually have beneficial effects on the wear resistance of the clad. A direct
comparison of the effects of carbon ratio was made possible by investigating powder mixtures at the
original Fe percentages of 70 % (i.e. clad compositions 745 and 755).
At the higher carbon ratio of 55% a range of Fe contents were explored including 60, 50 and 10wt%
to increase the volume fraction of TiC in the clad. (i.e. clad compositions 755, 655, 555, and 155).
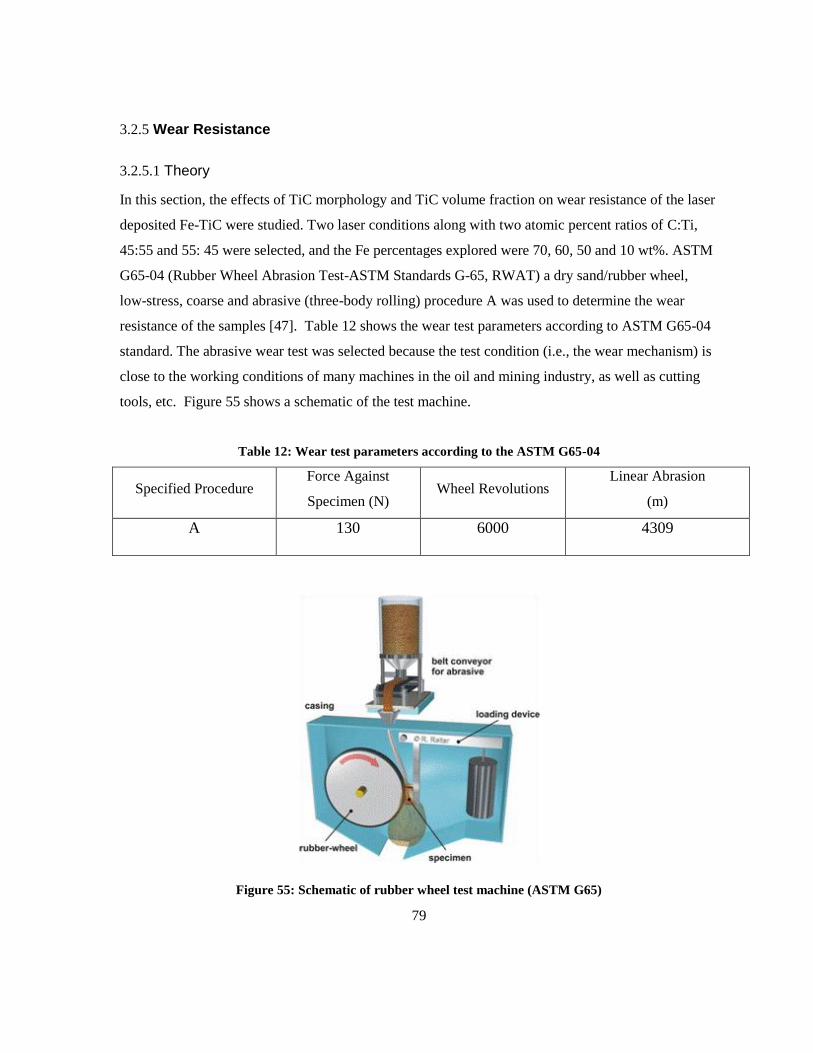
79
3.2.5 Wear Resistance
3.2.5.1 Theory
In this section, the effects of TiC morphology and TiC volume fraction on wear resistance of the laser
deposited Fe-TiC were studied. Two laser conditions along with two atomic percent ratios of C:Ti,
45:55 and 55: 45 were selected, and the Fe percentages explored were 70, 60, 50 and 10 wt%. ASTM
G65-04 (Rubber Wheel Abrasion Test-ASTM Standards G-65, RWAT) a dry sand/rubber wheel,
low-stress, coarse and abrasive (three-body rolling) procedure A was used to determine the wear
resistance of the samples [47]. Table 12 shows the wear test parameters according to ASTM G65-04
standard. The abrasive wear test was selected because the test condition (i.e., the wear mechanism) is
close to the working conditions of many machines in the oil and mining industry, as well as cutting
tools, etc. Figure 55 shows a schematic of the test machine.
Table 12: Wear test parameters according to the ASTM G65-04
Specified Procedure Force Against
Specimen (N) Wheel Revolutions
Linear Abrasion
(m)
A 130 6000 4309
Figure 55: Schematic of rubber wheel test machine (ASTM G65)
80
In this method, the abrasive particles flow from the nozzle into the gap between the sample and
rubber wheel contact surfaces. According to the selected procedures in ASTM G65, different loads
can be applied to the sample-rubber wheel contact depending on the coating hardness and coating
material. The abrasive particles and the applied load cause the wearing action removing material from
the sample surface, at a rate depending on the wear resistance of the sample coating. The weight of
the sample before and after the wear test can be used to determine the adjusted volume loss (mm3),
based on the equations below:
Volume loss (mm3) = weight loss (g)/density of coating (g.cm
-3)×1000 (9)
Adjusted volume loss (mm3) = measured volume loss (mm
3)×[228.6 (mm)/wheel diameter after use
(mm)] (10)
Metal matrix composites (MMC) have advantages such as high wear and corrosion resistance along
with the ability to work at high temperature by using high melting point metals such as Ni and Co as a
matrix [48]. These advanced materials have a metal matrix in which nonmetallic fibers, particles, or
whiskers are dispersed. For use in tribological applications, metal-matrix composites must be able to
support a load without distortion, deformation or fracture during performance and to maintain
controlled friction and wear over long periods without seizure under working conditions [49].
Wear resistance is an important function in the balance of properties of metal matrix composites.
Wear starts from softer components which are in contact with counterfaces (pin, abrasive material or
steel ball). Therefore, in metal matrix composites with hard particles, the matrix is worn in the
preliminary stages of the wear process. Different mechanisms of matrix degradation, such as plastic
deformation, micromachining, crack propagation and brittle chipping (depending on matrix
mechanical properties, i.e., hardness, fracture toughness) can exacerbate the wear rate [50-53]. Wear
can usually be classified on the basis of the nature of the interaction, such as between two or three
bodies. For two-body abrasive wear, Saka et al. [54] have shown that a delamination model is
feasible for copper-based hard-particle (Cu2O) composites. In this model, wear resistance depends on
fracture toughness, not on composite strength, as crack propagation is the controlling factor.
In three-body abrasive wear, abrasive particles such as silica sand tend to break down and bury
themselves in alloys with relatively soft matrices. However, hard particles in composites resist
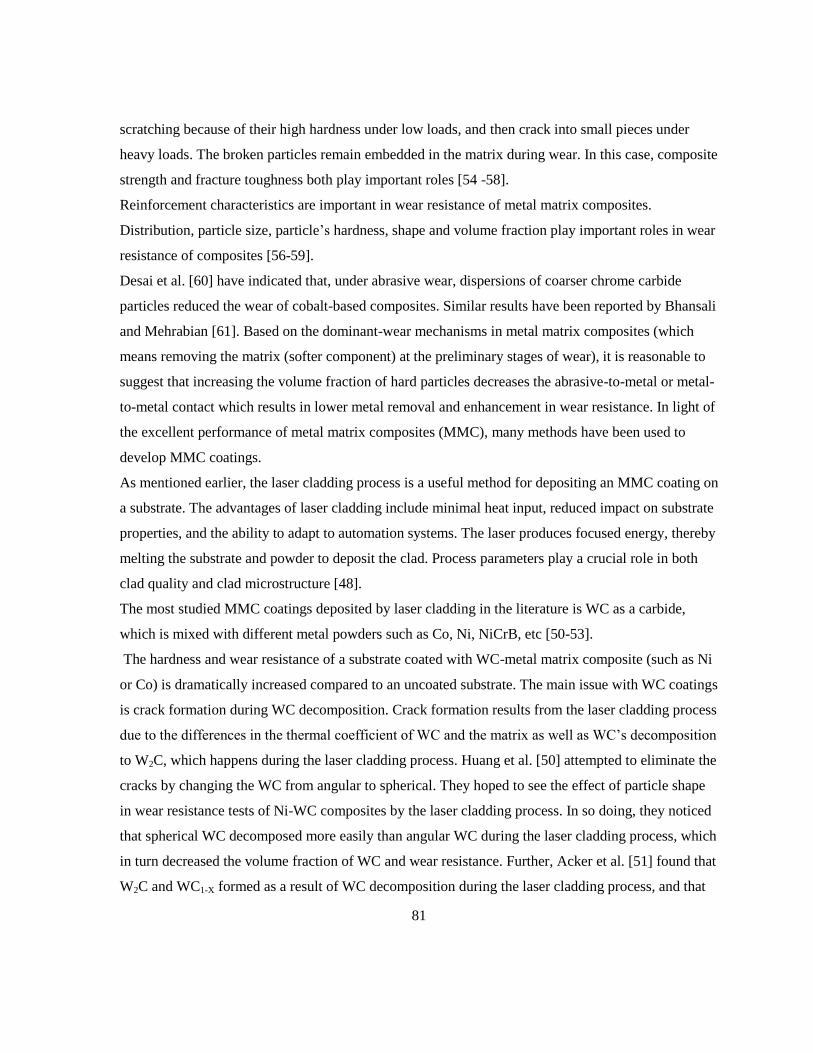
81
scratching because of their high hardness under low loads, and then crack into small pieces under
heavy loads. The broken particles remain embedded in the matrix during wear. In this case, composite
strength and fracture toughness both play important roles [54 -58].
Reinforcement characteristics are important in wear resistance of metal matrix composites.
Distribution, particle size, particle’s hardness, shape and volume fraction play important roles in wear
resistance of composites [56-59].
Desai et al. [60] have indicated that, under abrasive wear, dispersions of coarser chrome carbide
particles reduced the wear of cobalt-based composites. Similar results have been reported by Bhansali
and Mehrabian [61]. Based on the dominant-wear mechanisms in metal matrix composites (which
means removing the matrix (softer component) at the preliminary stages of wear), it is reasonable to
suggest that increasing the volume fraction of hard particles decreases the abrasive-to-metal or metal-
to-metal contact which results in lower metal removal and enhancement in wear resistance. In light of
the excellent performance of metal matrix composites (MMC), many methods have been used to
develop MMC coatings.
As mentioned earlier, the laser cladding process is a useful method for depositing an MMC coating on
a substrate. The advantages of laser cladding include minimal heat input, reduced impact on substrate
properties, and the ability to adapt to automation systems. The laser produces focused energy, thereby
melting the substrate and powder to deposit the clad. Process parameters play a crucial role in both
clad quality and clad microstructure [48].
The most studied MMC coatings deposited by laser cladding in the literature is WC as a carbide,
which is mixed with different metal powders such as Co, Ni, NiCrB, etc [50-53].
The hardness and wear resistance of a substrate coated with WC-metal matrix composite (such as Ni
or Co) is dramatically increased compared to an uncoated substrate. The main issue with WC coatings
is crack formation during WC decomposition. Crack formation results from the laser cladding process
due to the differences in the thermal coefficient of WC and the matrix as well as WC’s decomposition
to W2C, which happens during the laser cladding process. Huang et al. [50] attempted to eliminate the
cracks by changing the WC from angular to spherical. They hoped to see the effect of particle shape
in wear resistance tests of Ni-WC composites by the laser cladding process. In so doing, they noticed
that spherical WC decomposed more easily than angular WC during the laser cladding process, which
in turn decreased the volume fraction of WC and wear resistance. Further, Acker et al. [51] found that
W2C and WC1-X formed as a result of WC decomposition during the laser cladding process, and that
82
the volume fraction of WC dropped and wear resistance dramatically decreased. The worn surfaces
showed that wear resistance depends strongly on the volume fraction of reinforcements in the clad
[50,52,53].
The many advantages of TiC over WC (e.g., hardness, lower weight, and reduced tendency to
decompose during laser processing) have stimulated some researchers to laser deposit TiC by ex-situ
or in-situ processes. Wu [36] compared the wear performance of in-situ and ex-situ TiC using an
impact wear test. Results showed that in-situ synthesis has better performance compared to the ex-situ
method. In ex-situ synthesis, TiC’s weak bonding with the matrix can cause “pull out” failures during
wear, reducing wear resistance. Conversely, the in-situ method forms a stable TiC with a strong
TiC/matrix interface, since in-situ TiC evolved by chemical reaction during the laser cladding
process. Many researchers have used in-situ TiC composite coatings to increase surface hardness
[25,29,36,62]; however, most of them report only the microhardness profile of the coating,
concluding that the higher hardness compared to the substrate would result in a higher wear property.
Some researchers have studied different laboratory methods to measure the wear property of both in-
situ and ex situ TiC [63-66]. They compared the wear resistance of TiC composite coating in Ni-
based alloys deposited by laser cladding with the uncoated substrate and observed a higher wear
resistance of the coated substrate. The coating contains different morphologies and distributions of
TiC carbide which randomly resulted from selected laser processing parameters. In other words, TiC
morphologies have not been controlled by laser process parameters to choose the optimum
morphology in terms of having the best wear resistance. Moreover, in most of the research in the
literature, the maximum volume fraction of TiC studied has been limited to about 30 vol% TiC
composite in Ni (i.e., NiCrB)-based, Co-based alloy and Ti alloy [67].
Guo et al. [68] used a WC/TiC–Ni composite coating to increase the wear resistance of H13 steel
with the laser cladding process. They increased the wear resistance using a maximum 30%wt TiC-Ni
composite coating. Although TiC has considerable advantages in wear properties, there is limited
evidence presented in the literature which demonstrates the composite’s real potential. Firstly, most of
the research has focused on microhardness results, concluding that higher hardness would result in
higher wear resistance, even though a specific wear test has not yet been completed. Secondly, there
has been little research on in-situ TiC to form and control the morphology, size, distribution and
volume fraction of the carbide phase. Most of the investigations have been limited to coatings with
10-30%vol TiC. However, in WC, the coating usually contains more than 60% WC. This causes an
83
unfair comparison between TiC and WC composite wear resistance. Thirdly, using a mixture of
elements in a matrix alloy or even in a reinforcement powder such as NiCrBV can result in the
formation of a variety of carbides during the laser cladding process. Unknown volume fractions of
carbides and their effect on wear properties are too difficult to study and do not isolate the
contributions of TiC particles.
The objectives of this section are: (1) to find the optimal microstructure (resulting from the laser
process parameters and powder composition) of TiC in an Fe matrix according to wear resistance
results; (2) to measure the wear resistance of in-situ deposition of Fe-TiC by laser cladding; (3) to
compare the results with wear properties of WC-12%wt Ni commonly used in industry; and (4) to
find an optimal laser cladding operating parameter that produces the best wear properties in a in-situ-
formed TiC composite coating.
3.2.5.2 Wear Resistance Results
Figure 56 and Table 13 illustrate the wear test results based on ASTM G65-04. The maximum
volume loss after the uncoated sample (AISI 1030) belongs to sample 745A, while sample 155A has a
minimum volume loss. shows that by increasing C:Ti in the samples, the volume loss decreases. By
comparing samples 745 and 755 in both conditions A and B, group 755 shows better wear resistance.
In order to compare Fe-TiC abrasive wear resistance, a sample of WC-12%wt Ni (80% vol WC) is
tested under identical test conditions. Figure 56 shows that volume losses in group 155 (specifically,
155A with a 70% volume fraction TiC) are equivalent to the WC-12%wt Ni sample with an 80%
volume fraction of WC.
84
Figure 56: Wear results with and without un-coated samples
Table 13: Wear test results (adjusted volume loss mm3)
Sample No Adjusted Volume Loss (mm3)
745-A 70.1582
755-A 14.8973
655-A 2.0050
555-A 1.9960
155-A 1.7731
745-B 36.2324
755-B 2.4560
655-B 2.4509
555-B 2.1230
155-B 1.9305
WC-Ni 1.9744
AISI 1030 (un-coated sample) 149.3846
85
Chapter 4
Discussion
4.1 The Effect of Initial Laser Process Parameters on Clad Microstructure
4.1.1 Ternary C-Fe-Ti Phase Diagram Consideration
Before the results of this work can be properly interpreted, an analysis of the ternary C-Fe-Ti phase
diagram must be completed. Figure 57 presents the liquidus surface projections for the entire ternary
composition, while Figure 58 presents a more detailed picture of the Fe- rich corner of the liquidus
surface. The actual ternary composition of the powder mixture being deposited on the 1030 steel
substrate is indicated by the black dot in Figure 57 .
Using Factstage software a vertical section through the C-Fe-Ti ternary phase diagram at the carbon
composition of the powder mixture (i.e. 19 at%) was developed (see Figure 59). The composition of
the powder mixture is shown by the vertical red line. If no dilution by the substrate is assumed, then
we can determine from the figure that the equilibrium liquidus temperature of the powder mixture is
2345 °C as reported in Table 11). In establishing a fusion zone with the substrate, dilution by Fe
would have the effect of moving the clad composition to the left and decreasing the liquidus
temperature of the molten pool. If it is assumed that the temperature of the melt pool exceeds its
liquidus temperature for a composition based on zero dilution by the substrate, the expected
solidification path is shown by the dashed line in Figure 57. The first phase to form would be primary
dendrites of TiC. With further non-equilibrium cooling, the liquid composition would become more
Fe-rich until it reached the triple point where the TiC, fcc (γ) and bcc (α) phase fields meet. This point
is better illustrated in Figure 58.
The solidification path from this point onwards would depend on the specific composition. For
example, mixtures with a slightly carbon-rich composition would follow solidification path 1A. If the
composition were carbon-poor and Ti-rich, then the solidification path should follow path 1B.
Solidification path 1A would share similarities with binary Fe-C, forming γ -Fe solid solution
dendrites and possibly non-equilibrium eutectic, with the associated formation of graphite (or Fe3C).
Solidification path 1B would share similarities with binary Fe-Ti, forming primary dendrites of α -Fe
solid solution, followed by non-equilibrium eutectic freezing and the ultimate formation of Fe2Ti.
86
Figure 60 and Figure 61 illustrate the equilibrium phases present at temperatures of 1400 and 1000
°C. The ternary composition of the powder mixture is also plotted in the figures. The laser cladding
process produces a solidification condition that is far from equilibrium, but it is still useful to apply
the equilibrium predictions of Figure 60 and Figure 61 as a guide to phase formation. These figures
predict that, if the molten clad cooled under equilibrium conditions, primary TiC and secondary α and
γ - (Fe) solid solutions solidify. At 1400 °C, some liquid would still remain. At 1000 °C, when
solidification is complete, Figure 60 predicts that the clad should contain α - (Fe) solid solution and
TiC. The XRD results of Figure 19 for the un-bonded clad (i.e., no dilution present) indicate the
presence of these two phases as well as of Fe2Ti. This phase forms through eutectic reaction (i.e.,
L=Fe2Ti+Fe(α)). This experimental result shows that the non-equilibrium solidification path for the
un-bonded clad follows path 1B, as illustrated in Figure 58.
The bonded clad (i.e., sample 23) underwent some dilution by the substrate, shifting the melt pool
composition to a more Fe-rich concentration. The XRD spectrum of this sample indicates the
presence of α-(Fe) and TiC phases. Since no Fe2Ti was present in the XRD spectrum of this sample,
this shifted composition prevented the non-equilibrium eutectic reaction from taking place. This clad
would have followed solidification path 1A.
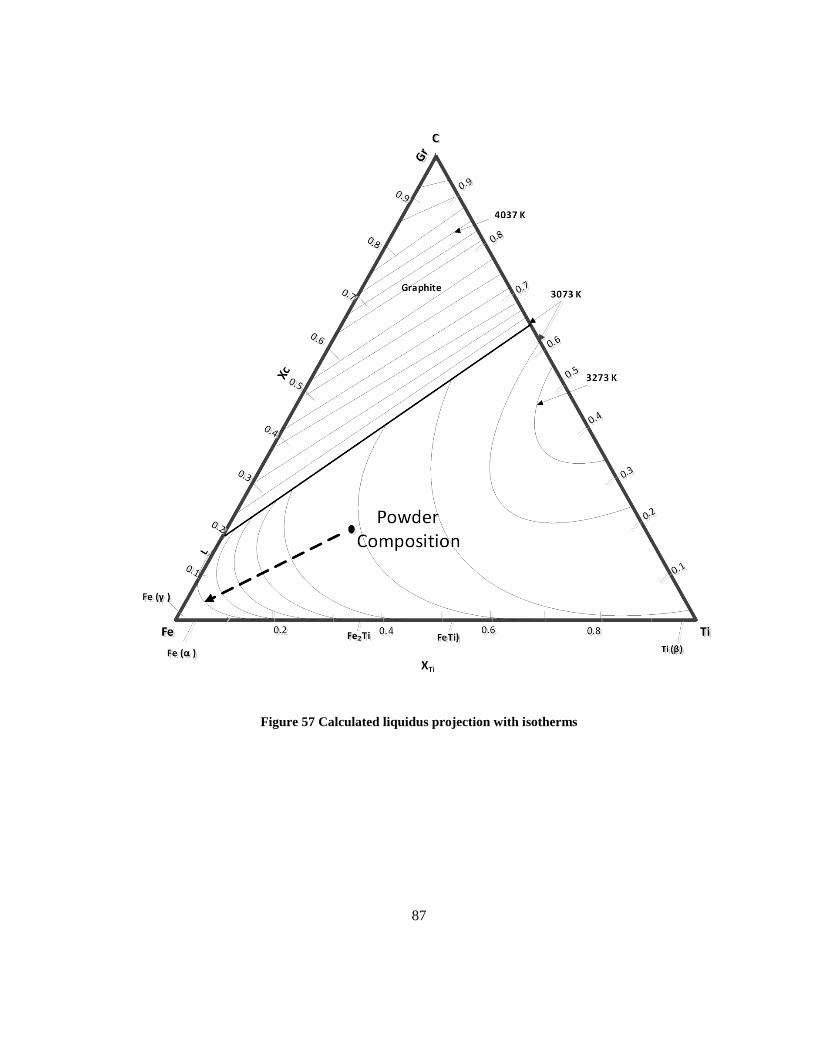
87
Figure 57 Calculated liquidus projection with isotherms
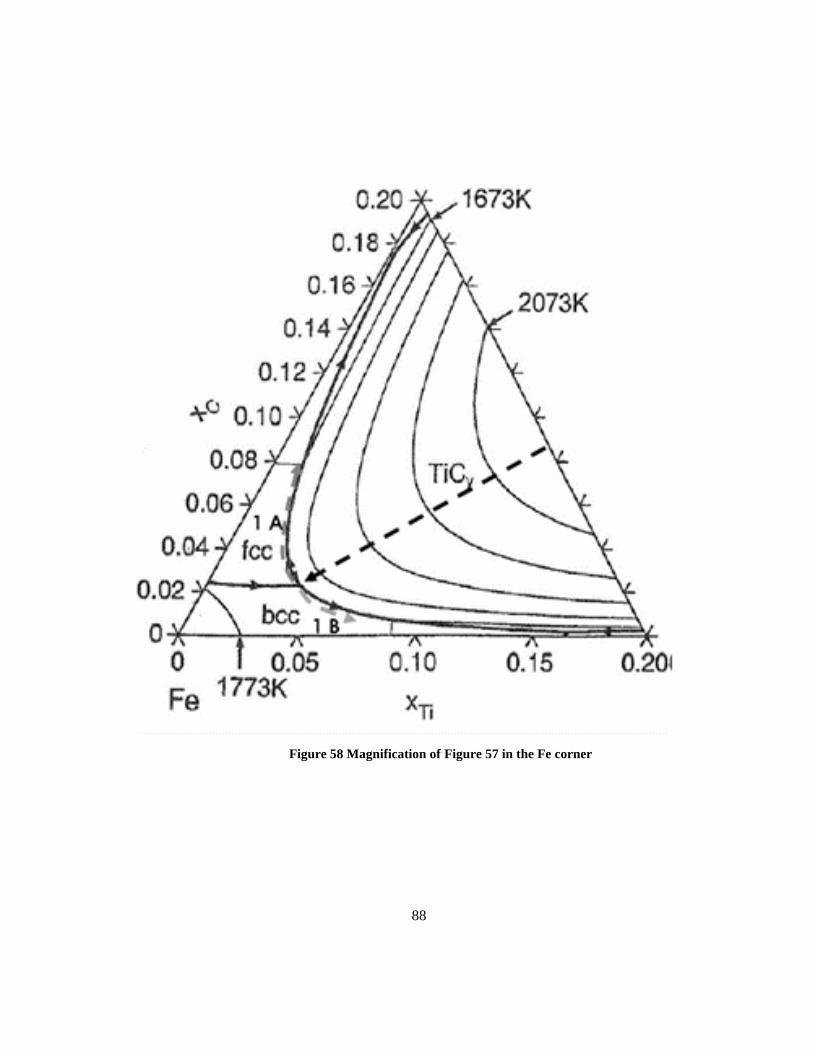
88
Figure 58 Magnification of Figure 57 in the Fe corner
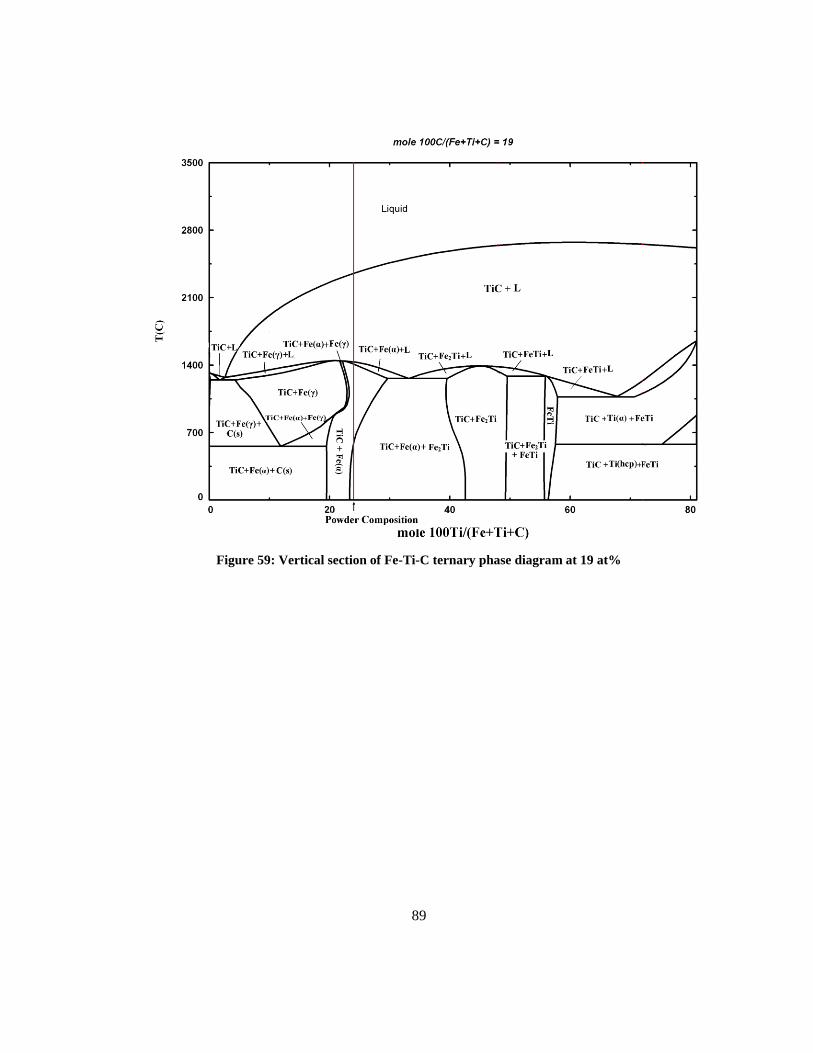
89
Figure 59: Vertical section of Fe-Ti-C ternary phase diagram at 19 at%
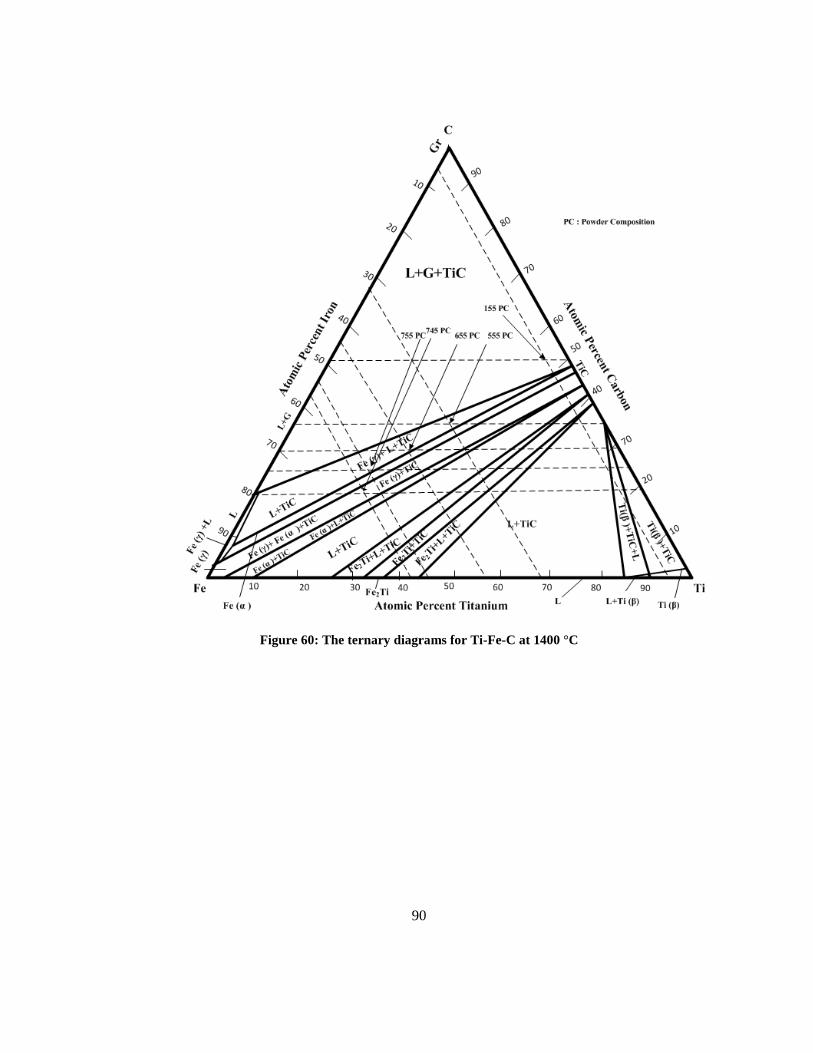
90
Figure 60: The ternary diagrams for Ti-Fe-C at 1400 °C
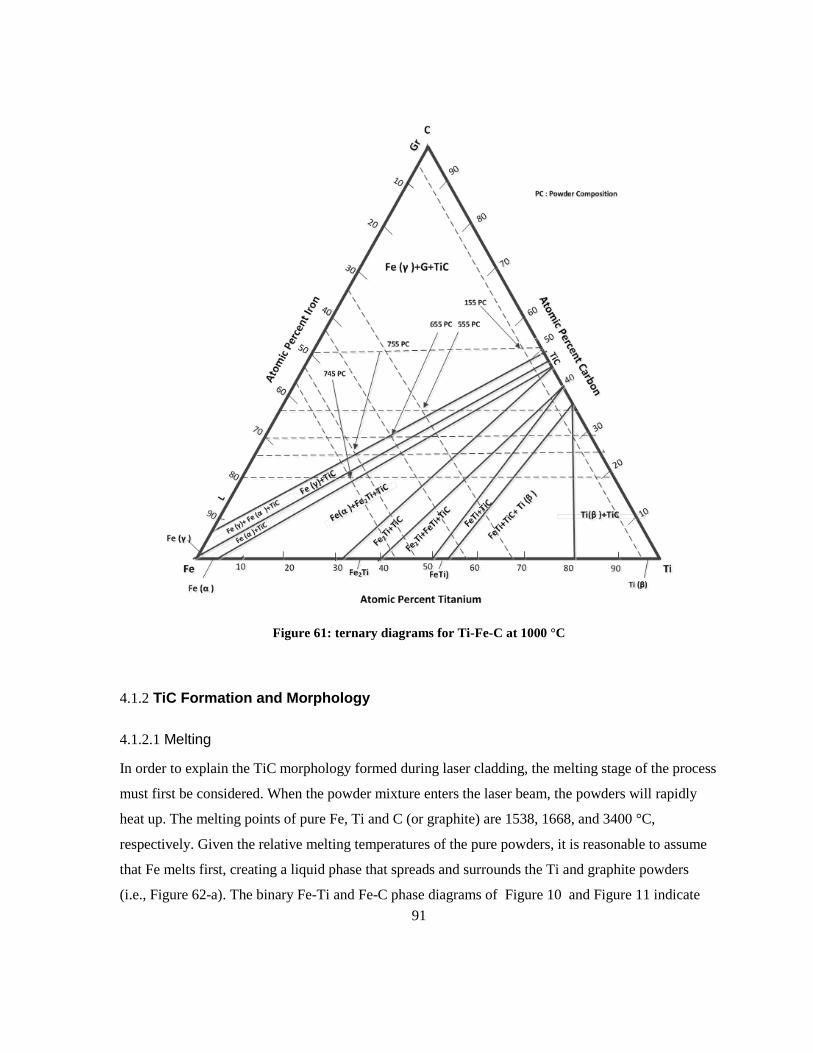
91
Figure 61: ternary diagrams for Ti-Fe-C at 1000 °C
4.1.2 TiC Formation and Morphology
4.1.2.1 Melting
In order to explain the TiC morphology formed during laser cladding, the melting stage of the process
must first be considered. When the powder mixture enters the laser beam, the powders will rapidly
heat up. The melting points of pure Fe, Ti and C (or graphite) are 1538, 1668, and 3400 °C,
respectively. Given the relative melting temperatures of the pure powders, it is reasonable to assume
that Fe melts first, creating a liquid phase that spreads and surrounds the Ti and graphite powders
(i.e., Figure 62-a). The binary Fe-Ti and Fe-C phase diagrams of Figure 10 and Figure 11 indicate
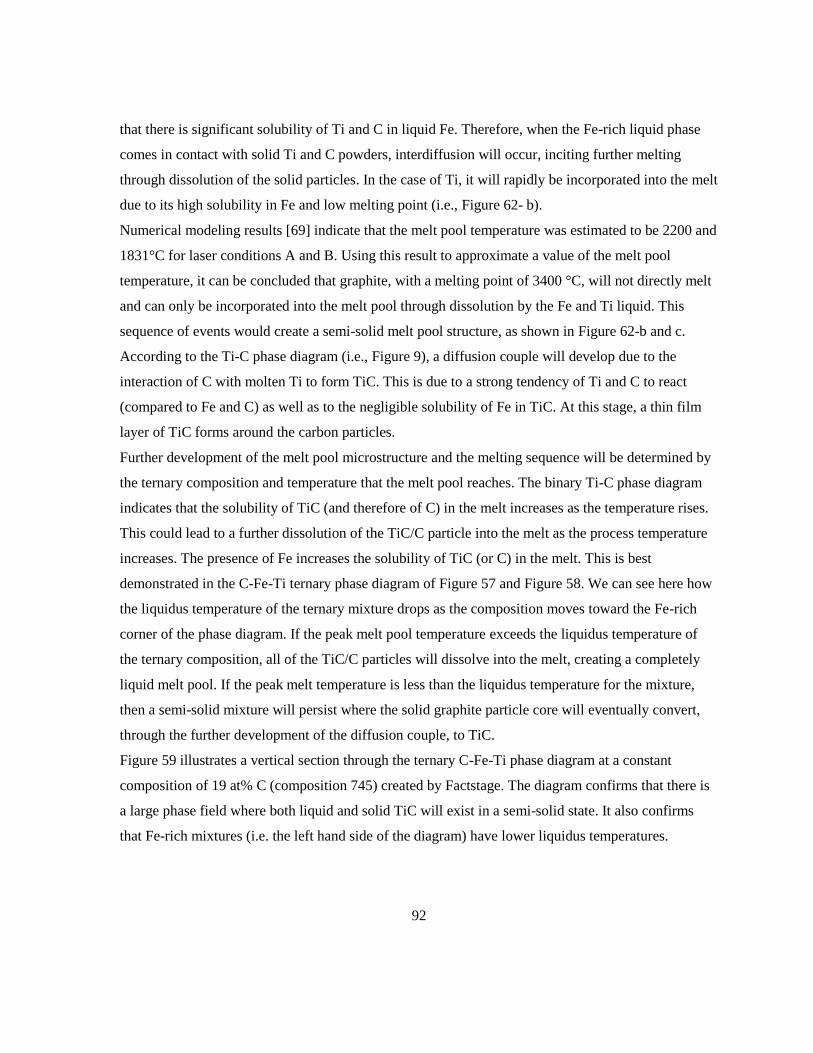
92
that there is significant solubility of Ti and C in liquid Fe. Therefore, when the Fe-rich liquid phase
comes in contact with solid Ti and C powders, interdiffusion will occur, inciting further melting
through dissolution of the solid particles. In the case of Ti, it will rapidly be incorporated into the melt
due to its high solubility in Fe and low melting point (i.e., Figure 62- b).
Numerical modeling results [69] indicate that the melt pool temperature was estimated to be 2200 and
1831°C for laser conditions A and B. Using this result to approximate a value of the melt pool
temperature, it can be concluded that graphite, with a melting point of 3400 °C, will not directly melt
and can only be incorporated into the melt pool through dissolution by the Fe and Ti liquid. This
sequence of events would create a semi-solid melt pool structure, as shown in Figure 62-b and c.
According to the Ti-C phase diagram (i.e., Figure 9), a diffusion couple will develop due to the
interaction of C with molten Ti to form TiC. This is due to a strong tendency of Ti and C to react
(compared to Fe and C) as well as to the negligible solubility of Fe in TiC. At this stage, a thin film
layer of TiC forms around the carbon particles.
Further development of the melt pool microstructure and the melting sequence will be determined by
the ternary composition and temperature that the melt pool reaches. The binary Ti-C phase diagram
indicates that the solubility of TiC (and therefore of C) in the melt increases as the temperature rises.
This could lead to a further dissolution of the TiC/C particle into the melt as the process temperature
increases. The presence of Fe increases the solubility of TiC (or C) in the melt. This is best
demonstrated in the C-Fe-Ti ternary phase diagram of Figure 57 and Figure 58. We can see here how
the liquidus temperature of the ternary mixture drops as the composition moves toward the Fe-rich
corner of the phase diagram. If the peak melt pool temperature exceeds the liquidus temperature of
the ternary composition, all of the TiC/C particles will dissolve into the melt, creating a completely
liquid melt pool. If the peak melt temperature is less than the liquidus temperature for the mixture,
then a semi-solid mixture will persist where the solid graphite particle core will eventually convert,
through the further development of the diffusion couple, to TiC.
Figure 59 illustrates a vertical section through the ternary C-Fe-Ti phase diagram at a constant
composition of 19 at% C (composition 745) created by Factstage. The diagram confirms that there is
a large phase field where both liquid and solid TiC will exist in a semi-solid state. It also confirms
that Fe-rich mixtures (i.e. the left hand side of the diagram) have lower liquidus temperatures.
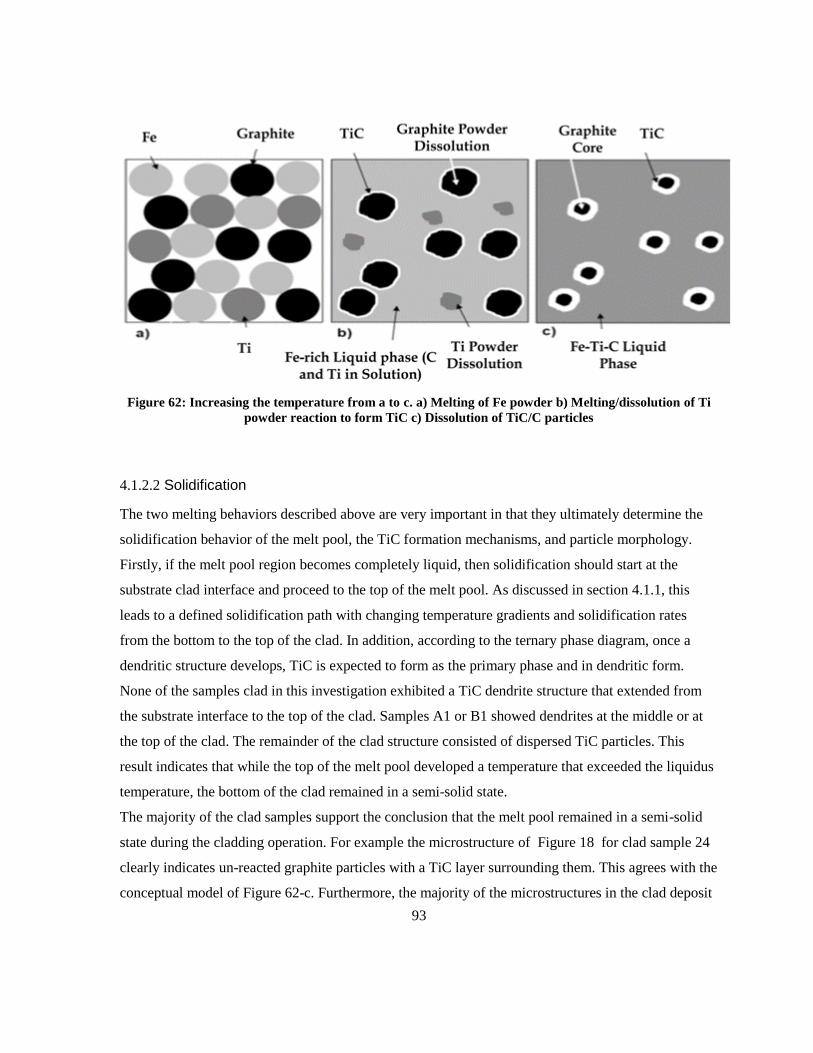
93
Figure 62: Increasing the temperature from a to c. a) Melting of Fe powder b) Melting/dissolution of Ti
powder reaction to form TiC c) Dissolution of TiC/C particles
4.1.2.2 Solidification
The two melting behaviors described above are very important in that they ultimately determine the
solidification behavior of the melt pool, the TiC formation mechanisms, and particle morphology.
Firstly, if the melt pool region becomes completely liquid, then solidification should start at the
substrate clad interface and proceed to the top of the melt pool. As discussed in section 4.1.1, this
leads to a defined solidification path with changing temperature gradients and solidification rates
from the bottom to the top of the clad. In addition, according to the ternary phase diagram, once a
dendritic structure develops, TiC is expected to form as the primary phase and in dendritic form.
None of the samples clad in this investigation exhibited a TiC dendrite structure that extended from
the substrate interface to the top of the clad. Samples A1 or B1 showed dendrites at the middle or at
the top of the clad. The remainder of the clad structure consisted of dispersed TiC particles. This
result indicates that while the top of the melt pool developed a temperature that exceeded the liquidus
temperature, the bottom of the clad remained in a semi-solid state.
The majority of the clad samples support the conclusion that the melt pool remained in a semi-solid
state during the cladding operation. For example the microstructure of Figure 18 for clad sample 24
clearly indicates un-reacted graphite particles with a TiC layer surrounding them. This agrees with the
conceptual model of Figure 62-c. Furthermore, the majority of the microstructures in the clad deposit
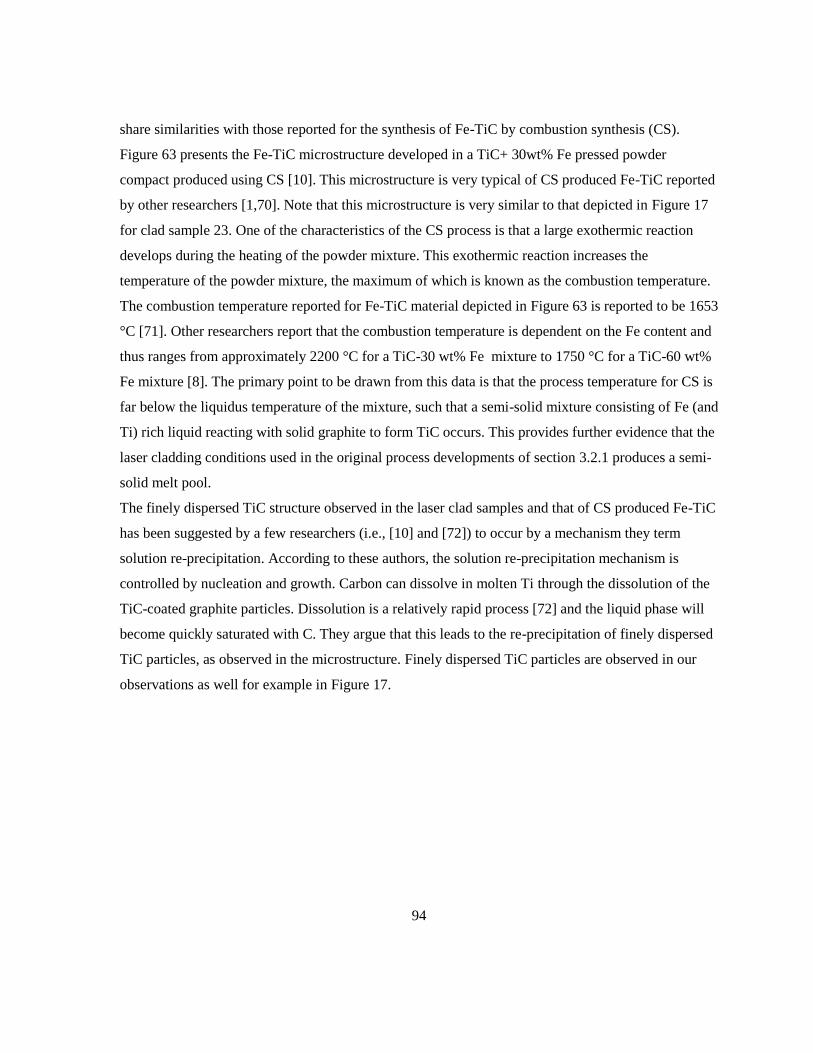
94
share similarities with those reported for the synthesis of Fe-TiC by combustion synthesis (CS).
Figure 63 presents the Fe-TiC microstructure developed in a TiC+ 30wt% Fe pressed powder
compact produced using CS [10]. This microstructure is very typical of CS produced Fe-TiC reported
by other researchers [1,70]. Note that this microstructure is very similar to that depicted in Figure 17
for clad sample 23. One of the characteristics of the CS process is that a large exothermic reaction
develops during the heating of the powder mixture. This exothermic reaction increases the
temperature of the powder mixture, the maximum of which is known as the combustion temperature.
The combustion temperature reported for Fe-TiC material depicted in Figure 63 is reported to be 1653
°C [71]. Other researchers report that the combustion temperature is dependent on the Fe content and
thus ranges from approximately 2200 °C for a TiC-30 wt% Fe mixture to 1750 °C for a TiC-60 wt%
Fe mixture [8]. The primary point to be drawn from this data is that the process temperature for CS is
far below the liquidus temperature of the mixture, such that a semi-solid mixture consisting of Fe (and
Ti) rich liquid reacting with solid graphite to form TiC occurs. This provides further evidence that the
laser cladding conditions used in the original process developments of section 3.2.1 produces a semi-
solid melt pool.
The finely dispersed TiC structure observed in the laser clad samples and that of CS produced Fe-TiC
has been suggested by a few researchers (i.e., [10] and [72]) to occur by a mechanism they term
solution re-precipitation. According to these authors, the solution re-precipitation mechanism is
controlled by nucleation and growth. Carbon can dissolve in molten Ti through the dissolution of the
TiC-coated graphite particles. Dissolution is a relatively rapid process [72] and the liquid phase will
become quickly saturated with C. They argue that this leads to the re-precipitation of finely dispersed
TiC particles, as observed in the microstructure. Finely dispersed TiC particles are observed in our
observations as well for example in Figure 17.
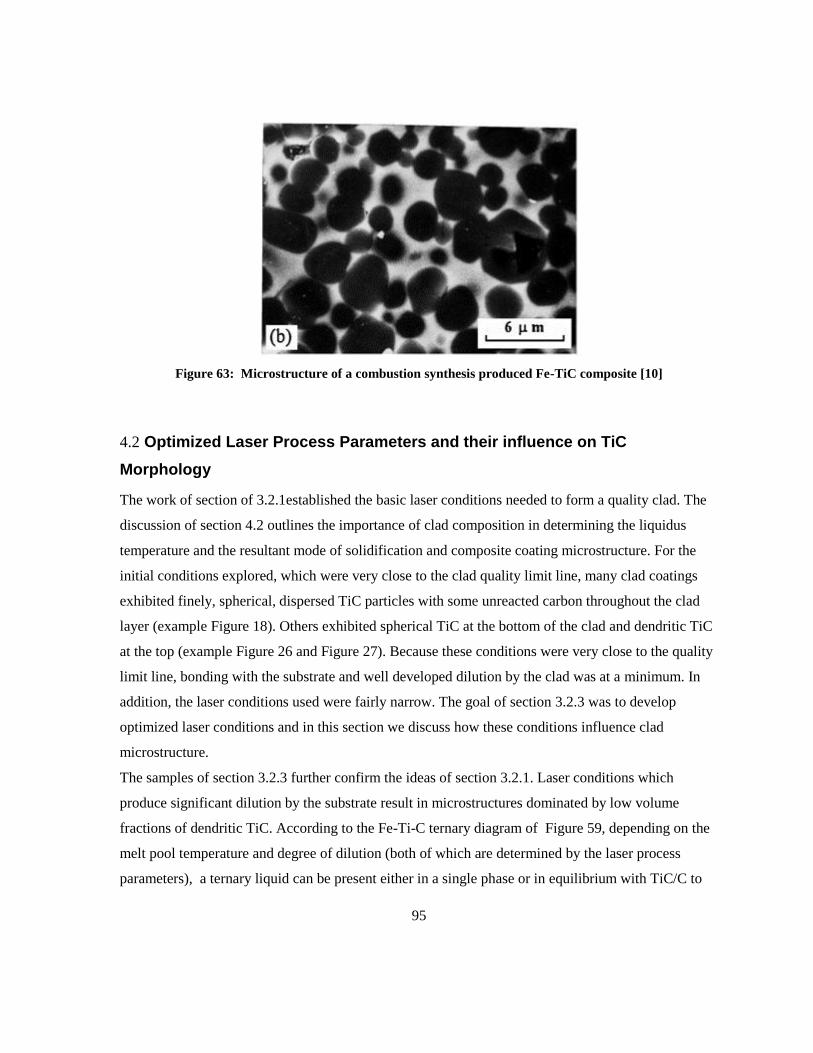
95
Figure 63: Microstructure of a combustion synthesis produced Fe-TiC composite [10]
4.2 Optimized Laser Process Parameters and their influence on TiC
Morphology
The work of section of 3.2.1established the basic laser conditions needed to form a quality clad. The
discussion of section 4.2 outlines the importance of clad composition in determining the liquidus
temperature and the resultant mode of solidification and composite coating microstructure. For the
initial conditions explored, which were very close to the clad quality limit line, many clad coatings
exhibited finely, spherical, dispersed TiC particles with some unreacted carbon throughout the clad
layer (example Figure 18). Others exhibited spherical TiC at the bottom of the clad and dendritic TiC
at the top (example Figure 26 and Figure 27). Because these conditions were very close to the quality
limit line, bonding with the substrate and well developed dilution by the clad was at a minimum. In
addition, the laser conditions used were fairly narrow. The goal of section 3.2.3 was to develop
optimized laser conditions and in this section we discuss how these conditions influence clad
microstructure.
The samples of section 3.2.3 further confirm the ideas of section 3.2.1. Laser conditions which
produce significant dilution by the substrate result in microstructures dominated by low volume
fractions of dendritic TiC. According to the Fe-Ti-C ternary diagram of Figure 59, depending on the
melt pool temperature and degree of dilution (both of which are determined by the laser process
parameters), a ternary liquid can be present either in a single phase or in equilibrium with TiC/C to
96
form a semi-solid melt pool. In a semi-solid melt pool, TiC and liquid are in equilibrium, as shown in
Figure 59. Here, a semi-solid melt pool would result from an actual peak temperature lower than the
liquidus temperature for a specific composition. Spherical TiC particles, which are distributed
uniformly or in a cluster mode, can result from this mechanism.
In contrast, if the peak temperature exceeds the liquidus temperature, a liquid melt pool can be
formed. Therefore, according to Figure 59, TiC dendrites are the first phase to solidify during cooling
and create dendritic TiC. Samples D1 and D2 are good examples of the range of behavior that can be
achieved.
Figure 41 and Figure 42 depict different microstructures for sample D1 and D2. Sample D1 contains
dendritic TiC whereas sample D2 shows spherical TiC particles which are distributed in the matrix.
Since the Eeff and PDD are identical for both, the only reason for the dissimilar microstructure could
be the variation in specific laser parameters (i.e., laser powder scan speed and powder feed rate).
Numerical modeling of laser condition A and B for stainless steel powder deposited on steel shows
that laser condition A produces a melt pool temperature of 2200 °C while that of condition B
produces a melt pool temperature of 1831 °C. This confirms that, despite the same Eeff and PDD,
specific conditions can also alter the cladding condition. It also indicates a lower temperature in
condition B, which would result in a lower level of dilution by the substrate, consistent with the
measurements of dilution for sample D2 versus D1. According to Figure 57, this greater dilution with
Fe decreases the liquidus temperature for the melt pool composition of sample D1. Since laser
condition A also increases the melt pool temperature, the probability of having a fully liquid melt
pool increases. Hence the clad microstructure exhibits a well-developed dendritic structure of TiC for
sample D1. The opposite is true for sample D2 where the lower melt pool temperature produced by
laser condition B, results in a lower level of dilution, a higher liquidus temperature, a semi-solid melt
pool condition and the development of spherical TiC.
One condition that appears somewhat contradictory to the above concepts is sample C5 and C7.
Dendrites of TiC were observed in C5 with a laser power of 700 W, whereas no evidence was
observed for dendritic TiC in sample C7 with laser power of 900 W. However, sample C7 has the
highest level of dilution measured in the samples of section 3.2.3. Figure 59 shows that by increasing
the Fe content by dilution, the freezing range decreases, and that by decreasing the freezing range, the
chance of dendrite formation decreases.
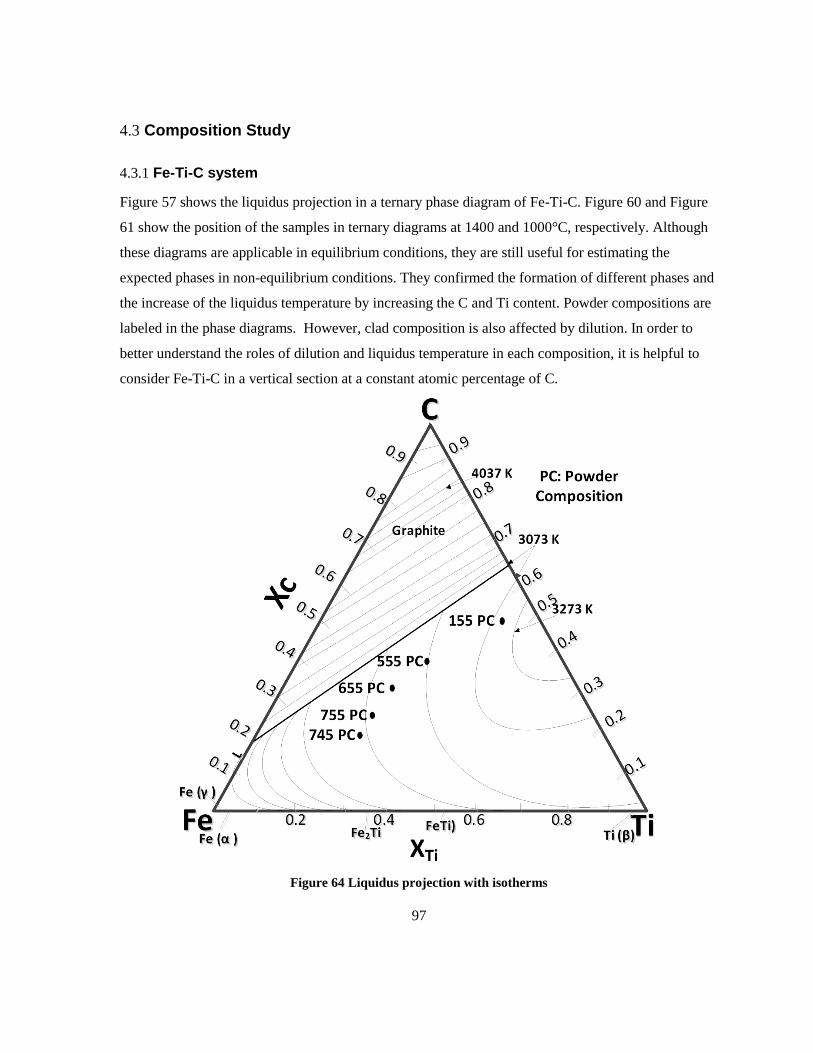
97
4.3 Composition Study
4.3.1 Fe-Ti-C system
Figure 57 shows the liquidus projection in a ternary phase diagram of Fe-Ti-C. Figure 60 and Figure
61 show the position of the samples in ternary diagrams at 1400 and 1000°C, respectively. Although
these diagrams are applicable in equilibrium conditions, they are still useful for estimating the
expected phases in non-equilibrium conditions. They confirmed the formation of different phases and
the increase of the liquidus temperature by increasing the C and Ti content. Powder compositions are
labeled in the phase diagrams. However, clad composition is also affected by dilution. In order to
better understand the roles of dilution and liquidus temperature in each composition, it is helpful to
consider Fe-Ti-C in a vertical section at a constant atomic percentage of C.
Figure 64 Liquidus projection with isotherms
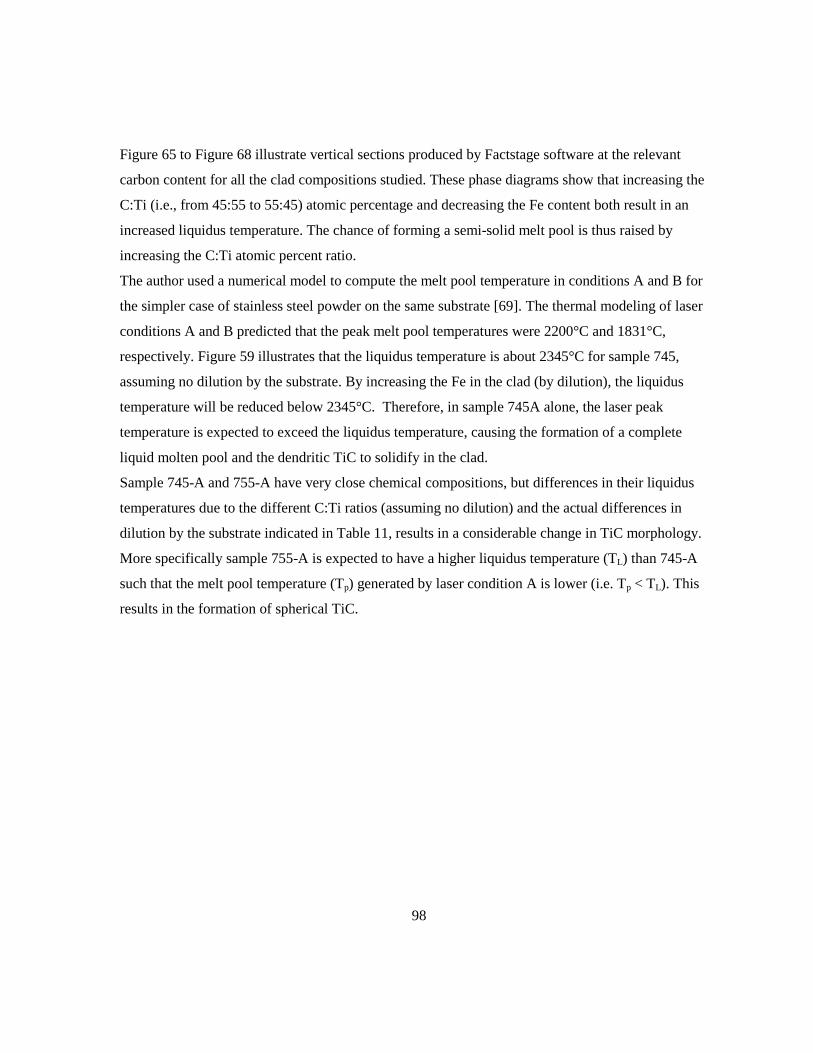
98
Figure 65 to Figure 68 illustrate vertical sections produced by Factstage software at the relevant
carbon content for all the clad compositions studied. These phase diagrams show that increasing the
C:Ti (i.e., from 45:55 to 55:45) atomic percentage and decreasing the Fe content both result in an
increased liquidus temperature. The chance of forming a semi-solid melt pool is thus raised by
increasing the C:Ti atomic percent ratio.
The author used a numerical model to compute the melt pool temperature in conditions A and B for
the simpler case of stainless steel powder on the same substrate [69]. The thermal modeling of laser
conditions A and B predicted that the peak melt pool temperatures were 2200°C and 1831°C,
respectively. Figure 59 illustrates that the liquidus temperature is about 2345°C for sample 745,
assuming no dilution by the substrate. By increasing the Fe in the clad (by dilution), the liquidus
temperature will be reduced below 2345°C. Therefore, in sample 745A alone, the laser peak
temperature is expected to exceed the liquidus temperature, causing the formation of a complete
liquid molten pool and the dendritic TiC to solidify in the clad.
Sample 745-A and 755-A have very close chemical compositions, but differences in their liquidus
temperatures due to the different C:Ti ratios (assuming no dilution) and the actual differences in
dilution by the substrate indicated in Table 11, results in a considerable change in TiC morphology.
More specifically sample 755-A is expected to have a higher liquidus temperature (TL) than 745-A
such that the melt pool temperature (Tp) generated by laser condition A is lower (i.e. Tp < TL). This
results in the formation of spherical TiC.
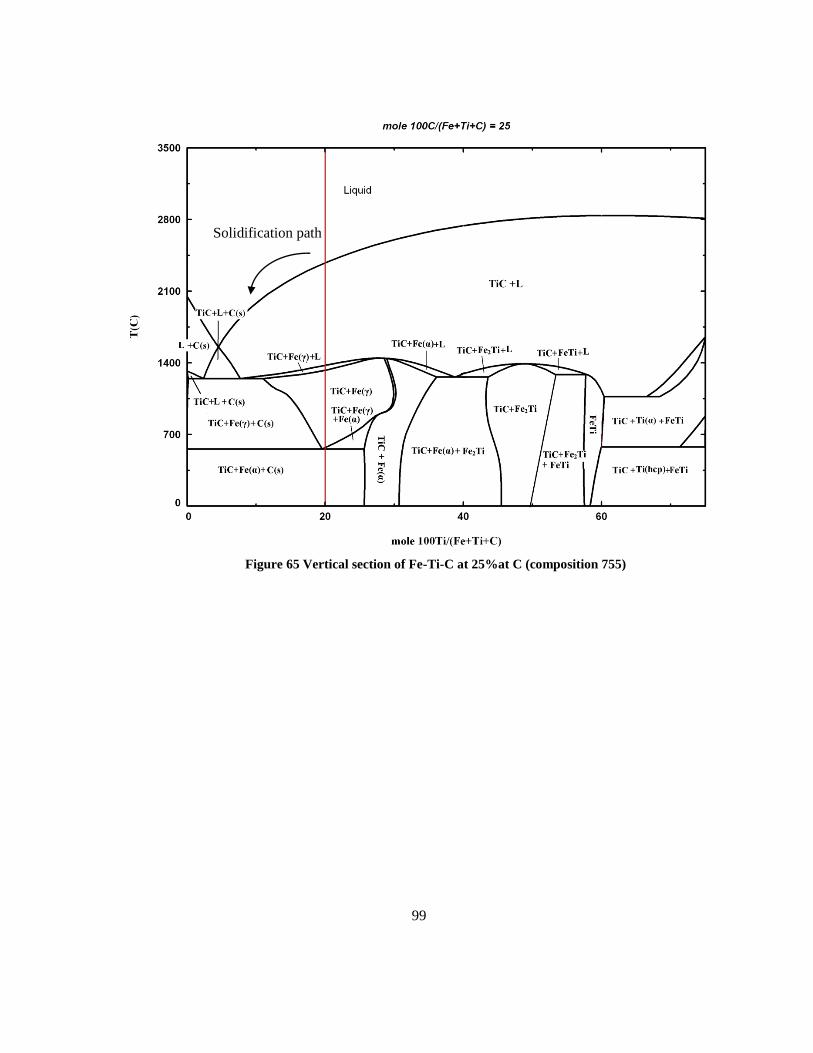
99
Figure 65 Vertical section of Fe-Ti-C at 25%at C (composition 755)
Solidification path
100
Figure 66 Vertical section of Fe-Ti-C at 30%at C (composition 655)
Solidification path
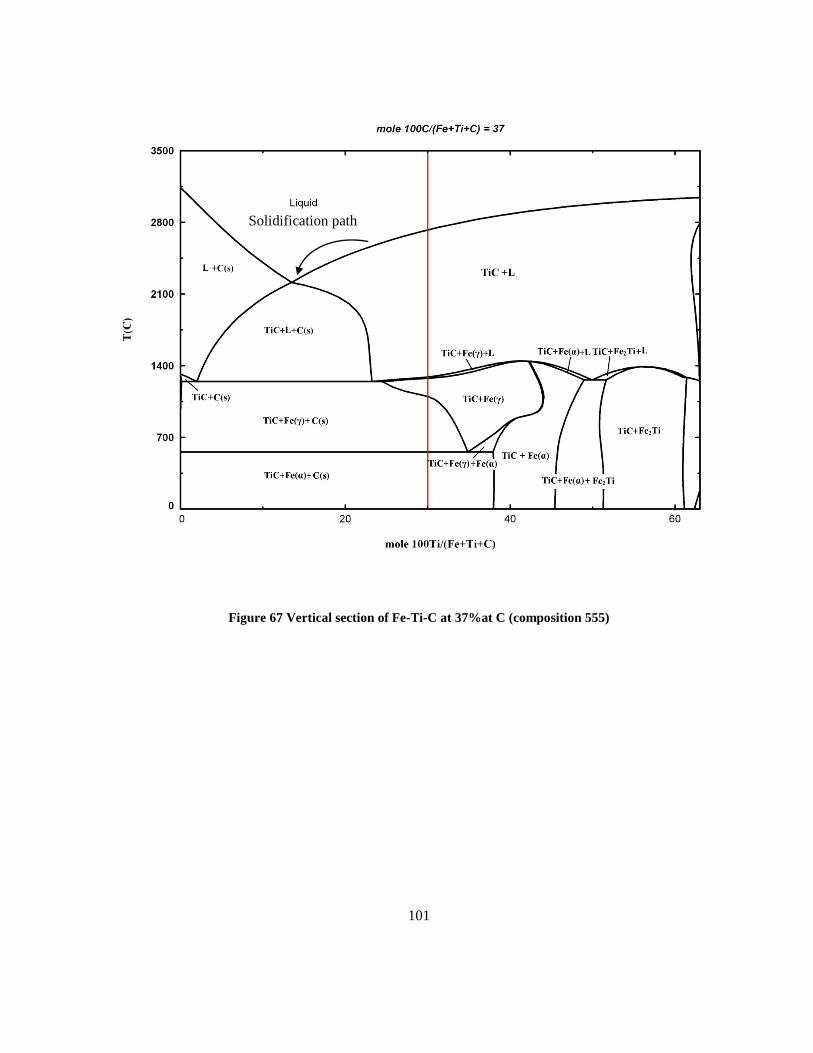
101
Figure 67 Vertical section of Fe-Ti-C at 37%at C (composition 555)
Solidification path
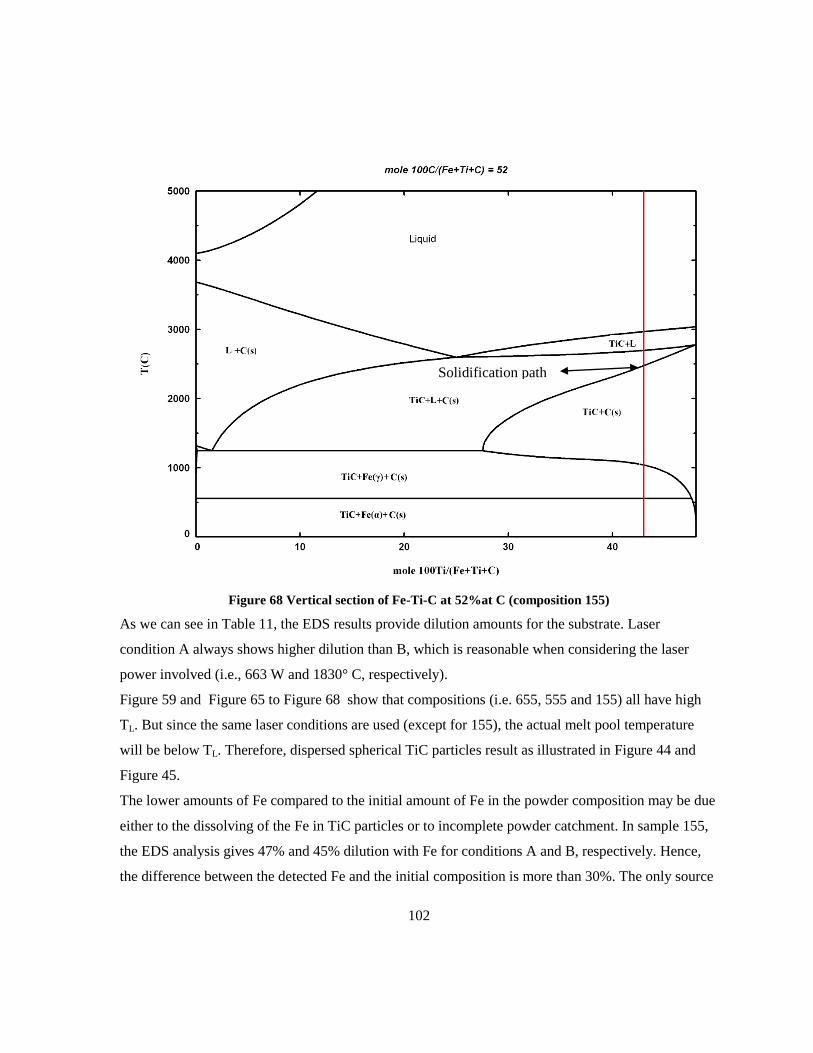
102
Figure 68 Vertical section of Fe-Ti-C at 52%at C (composition 155)
As we can see in Table 11, the EDS results provide dilution amounts for the substrate. Laser
condition A always shows higher dilution than B, which is reasonable when considering the laser
power involved (i.e., 663 W and 1830° C, respectively).
Figure 59 and Figure 65 to Figure 68 show that compositions (i.e. 655, 555 and 155) all have high
TL. But since the same laser conditions are used (except for 155), the actual melt pool temperature
will be below TL. Therefore, dispersed spherical TiC particles result as illustrated in Figure 44 and
Figure 45.
The lower amounts of Fe compared to the initial amount of Fe in the powder composition may be due
either to the dissolving of the Fe in TiC particles or to incomplete powder catchment. In sample 155,
the EDS analysis gives 47% and 45% dilution with Fe for conditions A and B, respectively. Hence,
the difference between the detected Fe and the initial composition is more than 30%. The only source
Solidification path
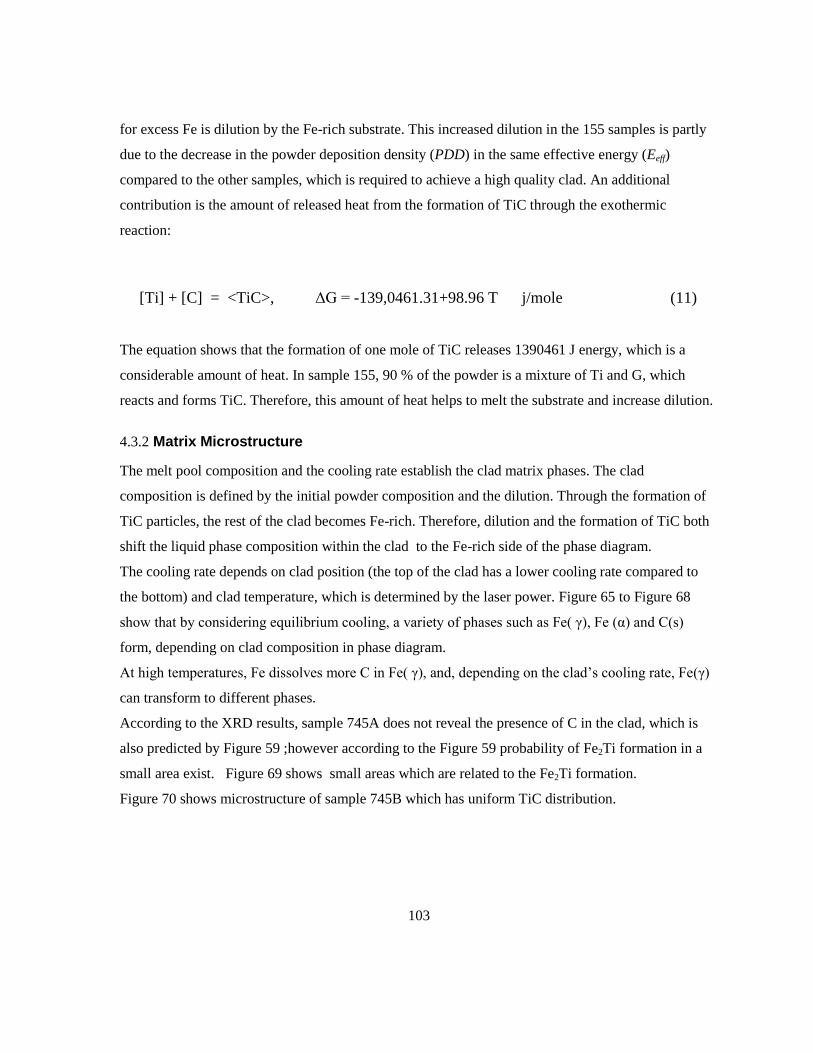
103
for excess Fe is dilution by the Fe-rich substrate. This increased dilution in the 155 samples is partly
due to the decrease in the powder deposition density (PDD) in the same effective energy (Eeff)
compared to the other samples, which is required to achieve a high quality clad. An additional
contribution is the amount of released heat from the formation of TiC through the exothermic
reaction:
[Ti] + [C] = <TiC>, ΔG = -139,0461.31+98.96 T j/mole (11)
The equation shows that the formation of one mole of TiC releases 1390461 J energy, which is a
considerable amount of heat. In sample 155, 90 % of the powder is a mixture of Ti and G, which
reacts and forms TiC. Therefore, this amount of heat helps to melt the substrate and increase dilution.
4.3.2 Matrix Microstructure
The melt pool composition and the cooling rate establish the clad matrix phases. The clad
composition is defined by the initial powder composition and the dilution. Through the formation of
TiC particles, the rest of the clad becomes Fe-rich. Therefore, dilution and the formation of TiC both
shift the liquid phase composition within the clad to the Fe-rich side of the phase diagram.
The cooling rate depends on clad position (the top of the clad has a lower cooling rate compared to
the bottom) and clad temperature, which is determined by the laser power. Figure 65 to Figure 68
show that by considering equilibrium cooling, a variety of phases such as Fe( γ), Fe (α) and C(s)
form, depending on clad composition in phase diagram.
At high temperatures, Fe dissolves more C in Fe( γ), and, depending on the clad’s cooling rate, Fe(γ)
can transform to different phases.
According to the XRD results, sample 745A does not reveal the presence of C in the clad, which is
also predicted by Figure 59 ;however according to the Figure 59 probability of Fe2Ti formation in a
small area exist. Figure 69 shows small areas which are related to the Fe2Ti formation.
Figure 70 shows microstructure of sample 745B which has uniform TiC distribution.
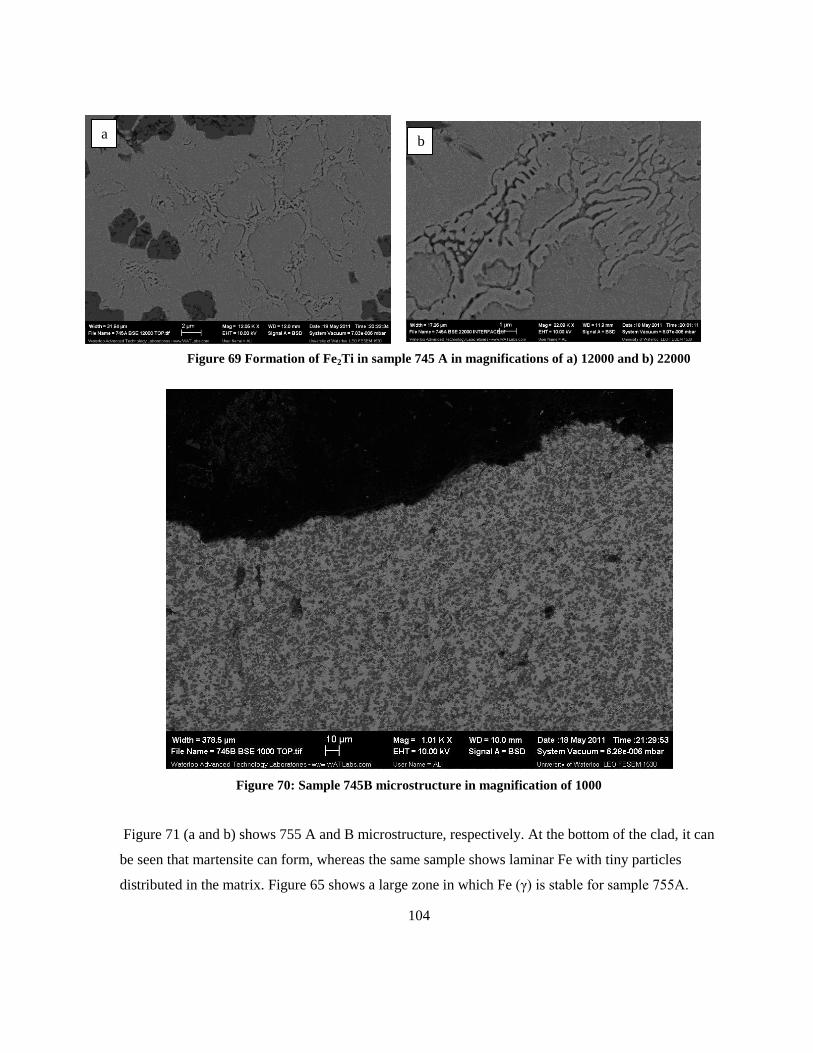
104
Figure 69 Formation of Fe2Ti in sample 745 A in magnifications of a) 12000 and b) 22000
Figure 70: Sample 745B microstructure in magnification of 1000
Figure 71 (a and b) shows 755 A and B microstructure, respectively. At the bottom of the clad, it can
be seen that martensite can form, whereas the same sample shows laminar Fe with tiny particles
distributed in the matrix. Figure 65 shows a large zone in which Fe (γ) is stable for sample 755A.
a b
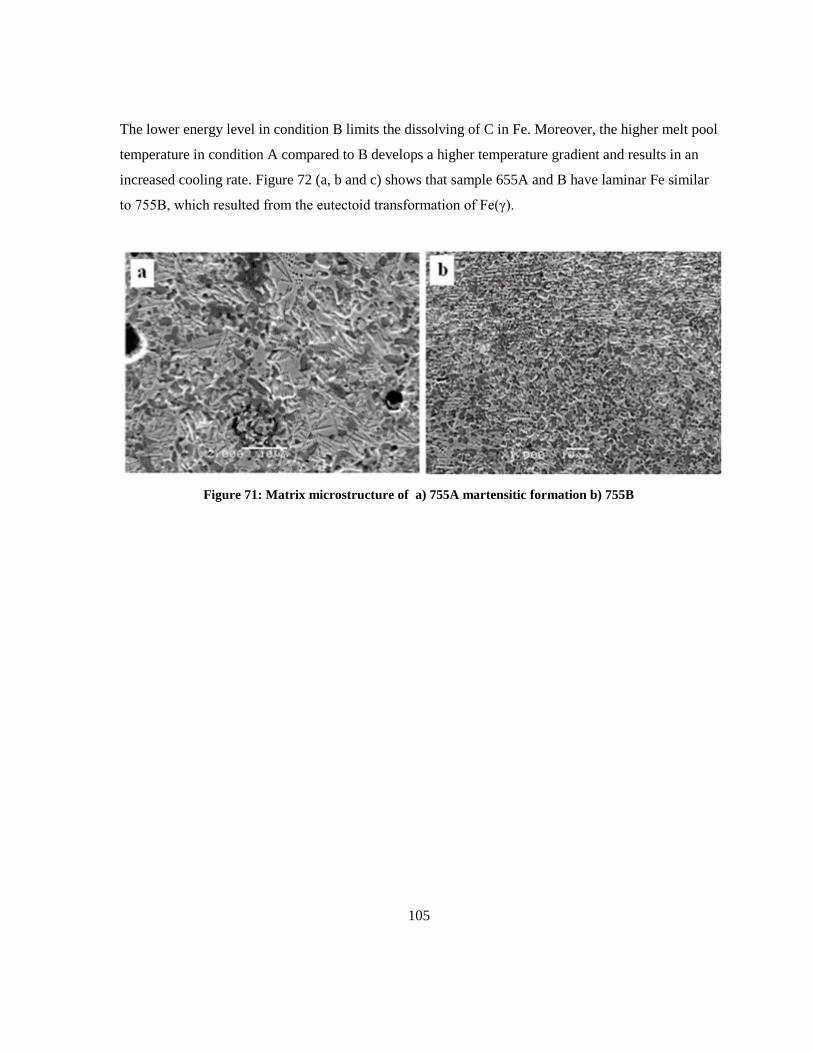
105
The lower energy level in condition B limits the dissolving of C in Fe. Moreover, the higher melt pool
temperature in condition A compared to B develops a higher temperature gradient and results in an
increased cooling rate. Figure 72 (a, b and c) shows that sample 655A and B have laminar Fe similar
to 755B, which resulted from the eutectoid transformation of Fe(γ).
Figure 71: Matrix microstructure of a) 755A martensitic formation b) 755B
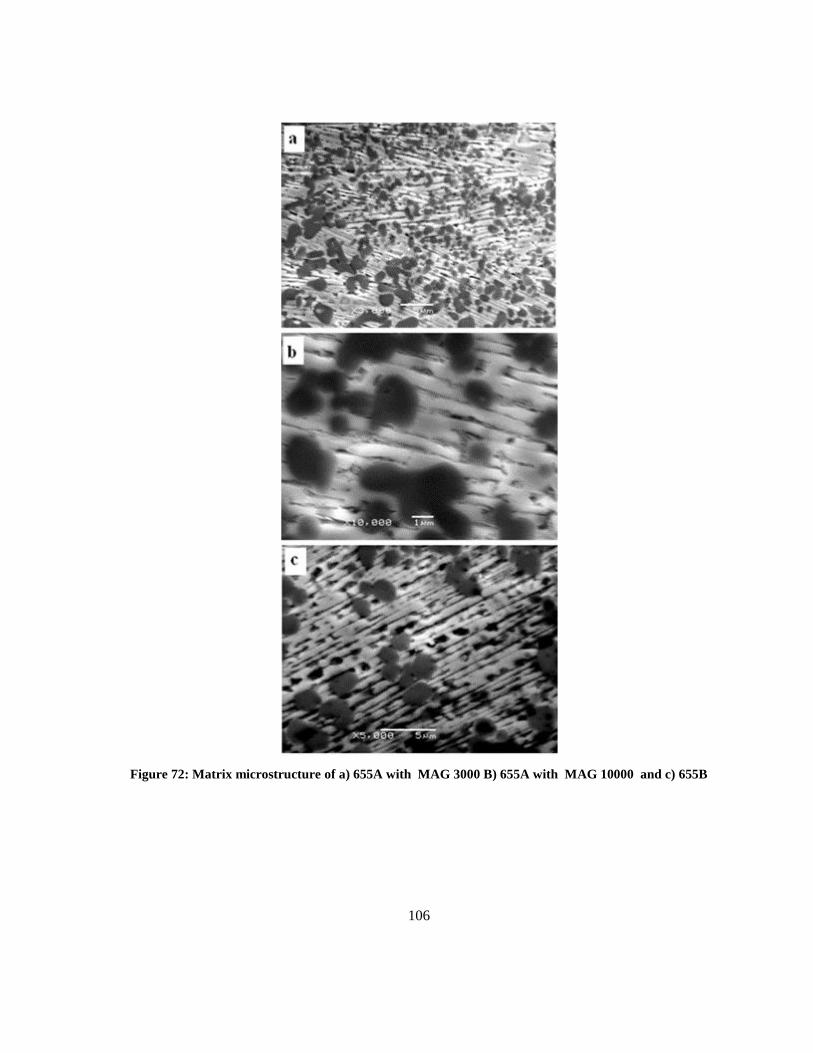
106
Figure 72: Matrix microstructure of a) 655A with MAG 3000 B) 655A with MAG 10000 and c) 655B
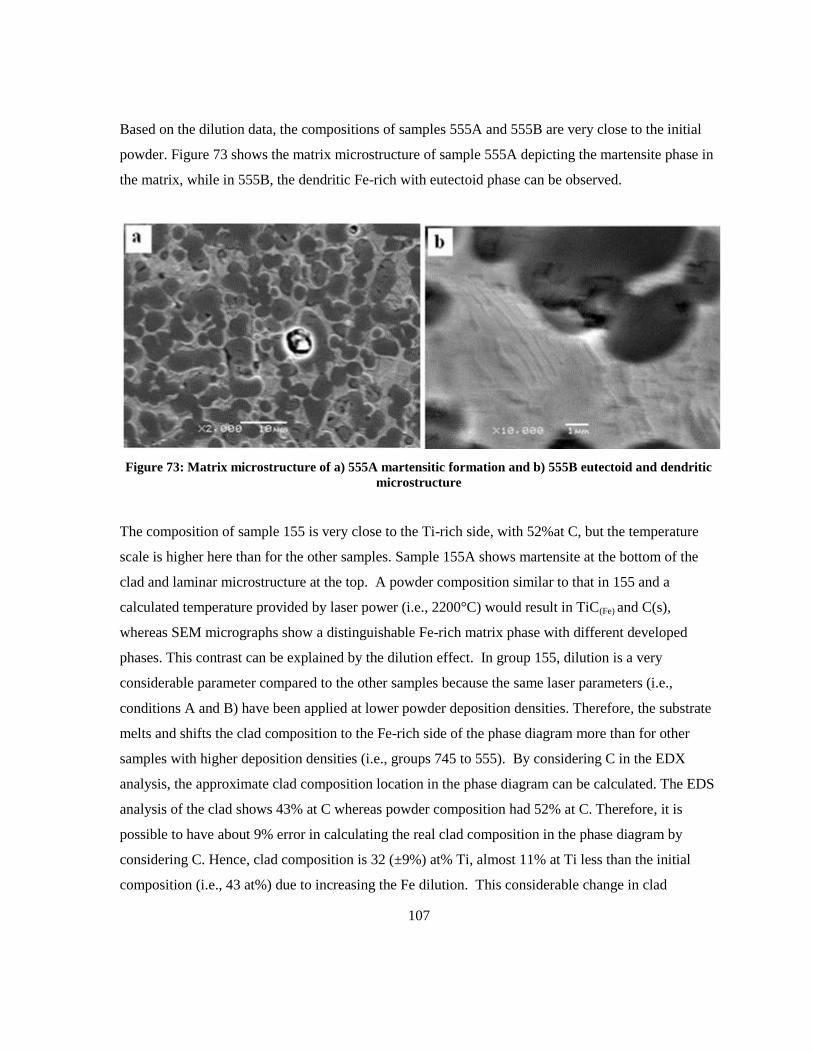
107
Based on the dilution data, the compositions of samples 555A and 555B are very close to the initial
powder. Figure 73 shows the matrix microstructure of sample 555A depicting the martensite phase in
the matrix, while in 555B, the dendritic Fe-rich with eutectoid phase can be observed.
Figure 73: Matrix microstructure of a) 555A martensitic formation and b) 555B eutectoid and dendritic
microstructure
The composition of sample 155 is very close to the Ti-rich side, with 52%at C, but the temperature
scale is higher here than for the other samples. Sample 155A shows martensite at the bottom of the
clad and laminar microstructure at the top. A powder composition similar to that in 155 and a
calculated temperature provided by laser power (i.e., 2200°C) would result in TiC(Fe) and C(s),
whereas SEM micrographs show a distinguishable Fe-rich matrix phase with different developed
phases. This contrast can be explained by the dilution effect. In group 155, dilution is a very
considerable parameter compared to the other samples because the same laser parameters (i.e.,
conditions A and B) have been applied at lower powder deposition densities. Therefore, the substrate
melts and shifts the clad composition to the Fe-rich side of the phase diagram more than for other
samples with higher deposition densities (i.e., groups 745 to 555). By considering C in the EDX
analysis, the approximate clad composition location in the phase diagram can be calculated. The EDS
analysis of the clad shows 43% at C whereas powder composition had 52% at C. Therefore, it is
possible to have about 9% error in calculating the real clad composition in the phase diagram by
considering C. Hence, clad composition is 32 (±9%) at% Ti, almost 11% at Ti less than the initial
composition (i.e., 43 at%) due to increasing the Fe dilution. This considerable change in clad
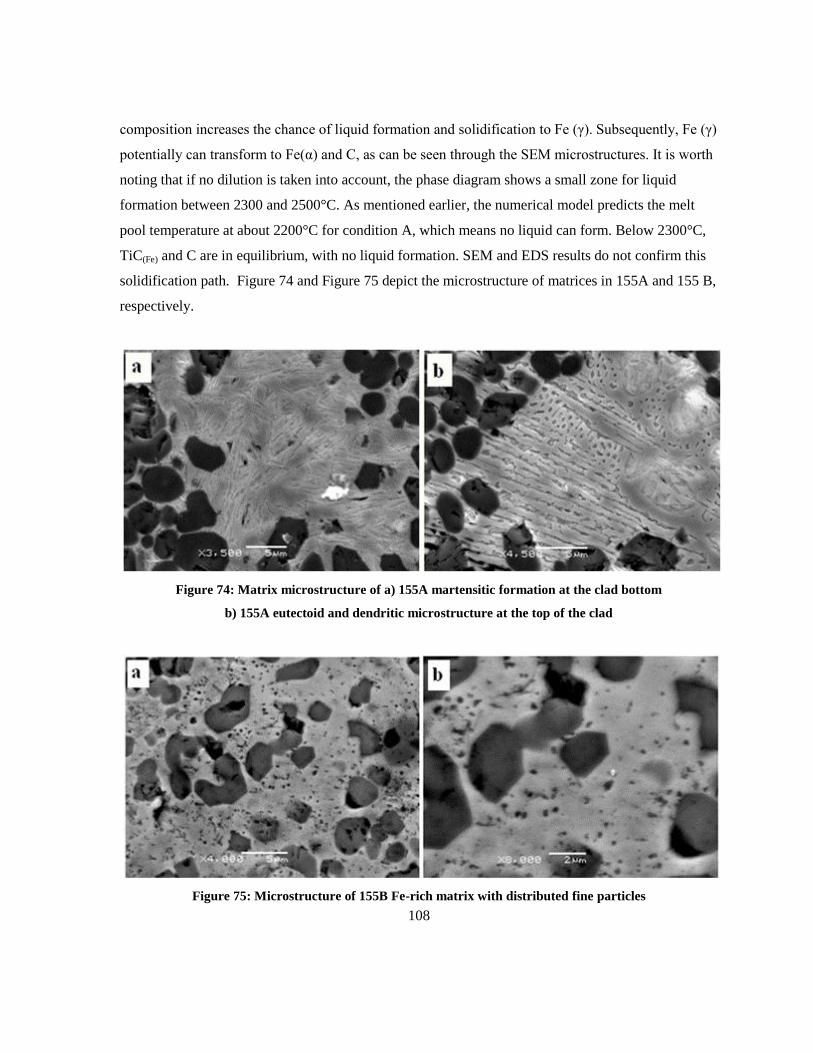
108
composition increases the chance of liquid formation and solidification to Fe (γ). Subsequently, Fe (γ)
potentially can transform to Fe(α) and C, as can be seen through the SEM microstructures. It is worth
noting that if no dilution is taken into account, the phase diagram shows a small zone for liquid
formation between 2300 and 2500°C. As mentioned earlier, the numerical model predicts the melt
pool temperature at about 2200°C for condition A, which means no liquid can form. Below 2300°C,
TiC(Fe) and C are in equilibrium, with no liquid formation. SEM and EDS results do not confirm this
solidification path. Figure 74 and Figure 75 depict the microstructure of matrices in 155A and 155 B,
respectively.
Figure 74: Matrix microstructure of a) 155A martensitic formation at the clad bottom
b) 155A eutectoid and dendritic microstructure at the top of the clad
Figure 75: Microstructure of 155B Fe-rich matrix with distributed fine particles
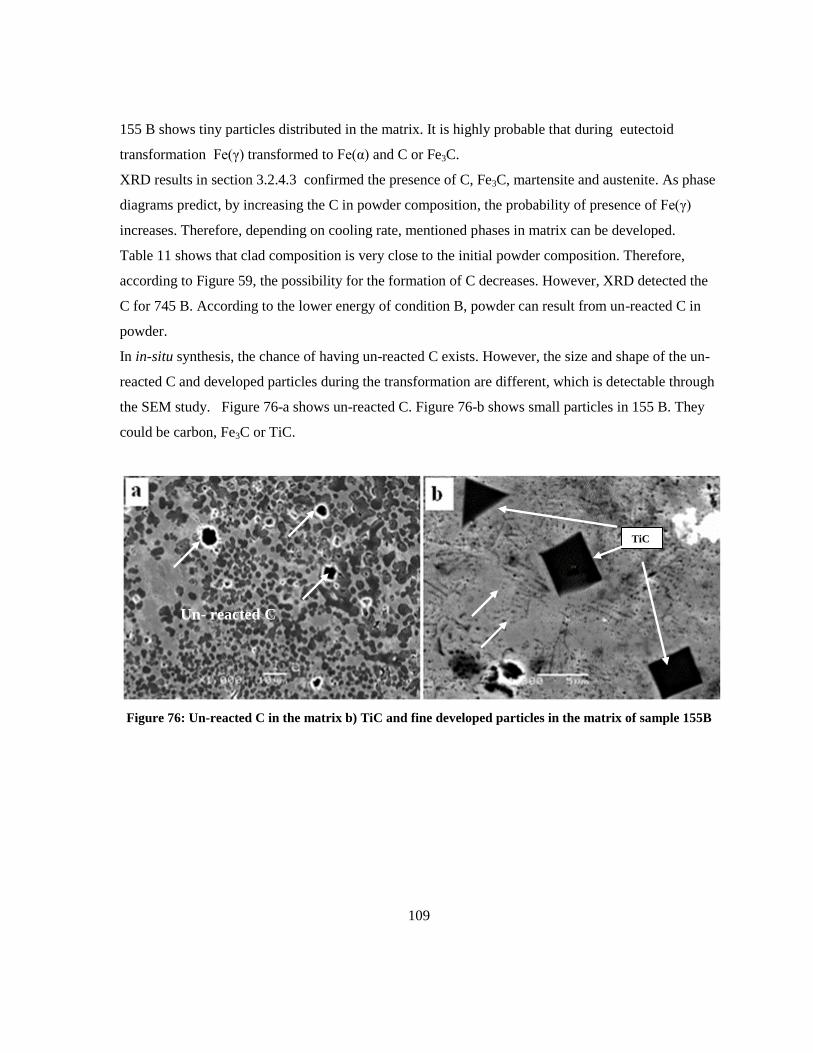
109
155 B shows tiny particles distributed in the matrix. It is highly probable that during eutectoid
transformation Fe(γ) transformed to Fe(α) and C or Fe3C.
XRD results in section 3.2.4.3 confirmed the presence of C, Fe3C, martensite and austenite. As phase
diagrams predict, by increasing the C in powder composition, the probability of presence of Fe(γ)
increases. Therefore, depending on cooling rate, mentioned phases in matrix can be developed.
Table 11 shows that clad composition is very close to the initial powder composition. Therefore,
according to Figure 59, the possibility for the formation of C decreases. However, XRD detected the
C for 745 B. According to the lower energy of condition B, powder can result from un-reacted C in
powder.
In in-situ synthesis, the chance of having un-reacted C exists. However, the size and shape of the un-
reacted C and developed particles during the transformation are different, which is detectable through
the SEM study. Figure 76-a shows un-reacted C. Figure 76-b shows small particles in 155 B. They
could be carbon, Fe3C or TiC.
Figure 76: Un-reacted C in the matrix b) TiC and fine developed particles in the matrix of sample 155B
TiC
Un- reacted C
110
4.3.3 Hardness
The hardness results indicate that spherical and uniformly-distributed TiC particles resulted in higher
and less fluctuating hardness results. Furthermore, the formation of a liquid molten pool results in the
formation of dendritic TiC (i.e., 745A) that causes non-uniform distribution of carbides in the matrix,
resulting in a larger area without the support of carbides. Increasing the C:Ti ratio increases the
chance of TiC formation and also increases the hardness property. A low amount of C in the fed
powder enhances the chances of dissolving the Ti in Fe, which, according to the ternary diagrams,
causes hard intermetallic phases such as Fe-Ti and Fe2Ti.
Moreover, Table 11 and the hardness profiles in conditions A and B illustrate that increasing the
volume fraction (resulting from higher C:Ti and a lower Fe percentage) leads to higher hardness
values. This trend reads well for condition A. However, the hardness profile for 555B and 155B
shows a lower value compared to the other samples. Figure 44 and Figure 45 illustrate a considerable
difference in TiC particle size. Particle size for samples 555 A and B is 3-5 and 1-2µm, respectively.
This value for 155A and B is 2-7 and less than 1 µm, respectively.
TiC volume fraction is the major reason for changes in hardness and wear resistance. The actual
difference in hardness between 155B and A is small and likely within measurement error.
Figure 53 and Figure 54 depict higher hardness values in the clad/substrate interface of samples
deposited by condition A compared to sample series B. This trend can be explained by matrix
hardness. In the last section, the matrix microstructure is studied. The martensite phase is developed
at the bottom of the clad because of the higher cooling rate. The formation of martensite also depends
on the formation of Fe(γ) during the process. In 155A, martensite formed, whereas in 155B, no
evidence is observed for the formation of martensite. In condition A, normally higher laser power
results in higher temperature in the clad than for condition B. Therefore, thermal gradient in condition
A is higher than condition B, which results in a higher cooling rate, and condition B is closer to the
equilibrium conditions, resulting in lower hardness in the clad/substrate interface.
111
4.4 Wear Resistance
Figure 77 depicts how the abrasive wear performance of samples is affected by the volume fraction of
TiC particles. By increasing the TiC volume fraction, wear resistance and hardness increase. The
volume fraction of TiC particles in reverse is related to the distance between carbides occupied by the
Fe matrix. It is obvious that, in abrasive conditions, the softer part is removed by grits. Therefore, by
increasing the volume fraction of TiC in the coating, it is expected that the wear resistance increases
[29,64,68,73]. The volume fraction in this research is increased by increasing the C:Ti ratio in the
constant Fe percentage and by increasing the TiC in the clad (decreasing the Fe percentage in powder
composition). Optimal results for wear resistance of in-situ Fe-TiC can be found in group 155 with
10% Fe. Since Ti can dissolve in Fe during the laser cladding process, nominal 90%wt TiC (93%vol
TiC) was not achieved during the process; however, a maximum 70% volume fraction of TiC shows
considerable wear resistance compared to WC-12%Ni (80%vol WC).
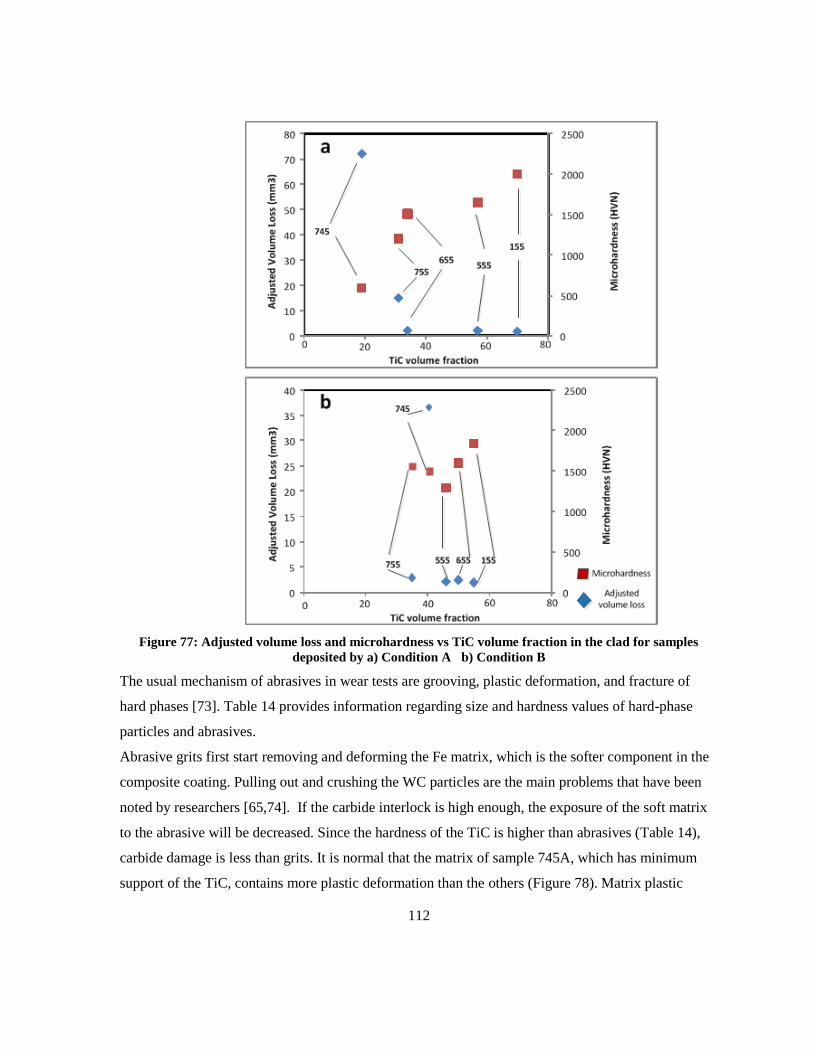
112
Figure 77: Adjusted volume loss and microhardness vs TiC volume fraction in the clad for samples
deposited by a) Condition A b) Condition B
The usual mechanism of abrasives in wear tests are grooving, plastic deformation, and fracture of
hard phases [73]. Table 14 provides information regarding size and hardness values of hard-phase
particles and abrasives.
Abrasive grits first start removing and deforming the Fe matrix, which is the softer component in the
composite coating. Pulling out and crushing the WC particles are the main problems that have been
noted by researchers [65,74]. If the carbide interlock is high enough, the exposure of the soft matrix
to the abrasive will be decreased. Since the hardness of the TiC is higher than abrasives (Table 14),
carbide damage is less than grits. It is normal that the matrix of sample 745A, which has minimum
support of the TiC, contains more plastic deformation than the others (Figure 78). Matrix plastic
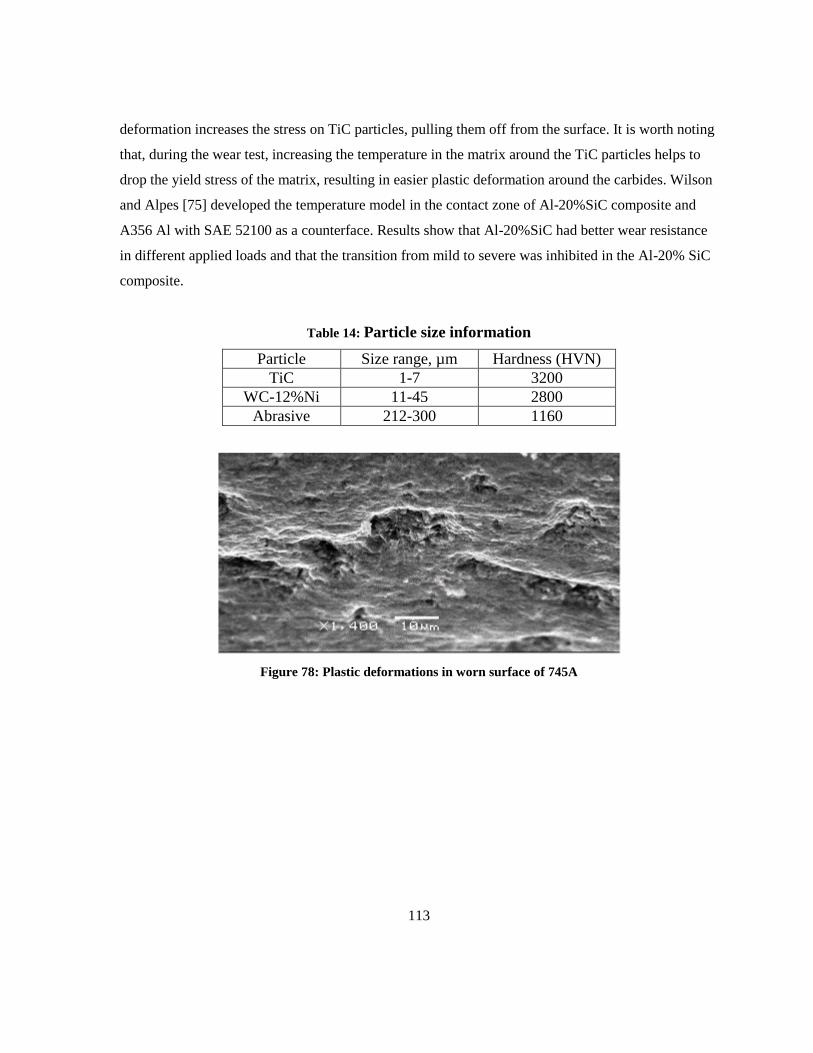
113
deformation increases the stress on TiC particles, pulling them off from the surface. It is worth noting
that, during the wear test, increasing the temperature in the matrix around the TiC particles helps to
drop the yield stress of the matrix, resulting in easier plastic deformation around the carbides. Wilson
and Alpes [75] developed the temperature model in the contact zone of Al-20%SiC composite and
A356 Al with SAE 52100 as a counterface. Results show that Al-20%SiC had better wear resistance
in different applied loads and that the transition from mild to severe was inhibited in the Al-20% SiC
composite.
Table 14: Particle size information
Particle Size range, µm Hardness (HVN)
TiC 1-7 3200
WC-12%Ni 11-45 2800
Abrasive 212-300 1160
Figure 78: Plastic deformations in worn surface of 745A
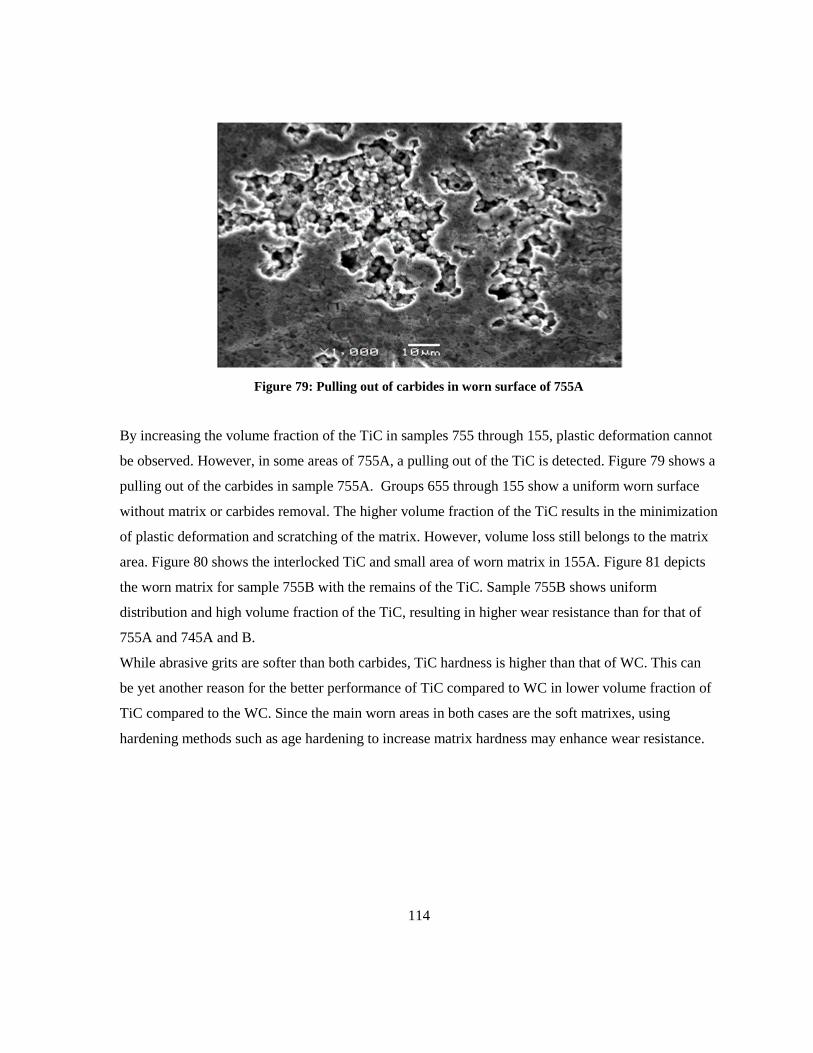
114
Figure 79: Pulling out of carbides in worn surface of 755A
By increasing the volume fraction of the TiC in samples 755 through 155, plastic deformation cannot
be observed. However, in some areas of 755A, a pulling out of the TiC is detected. Figure 79 shows a
pulling out of the carbides in sample 755A. Groups 655 through 155 show a uniform worn surface
without matrix or carbides removal. The higher volume fraction of the TiC results in the minimization
of plastic deformation and scratching of the matrix. However, volume loss still belongs to the matrix
area. Figure 80 shows the interlocked TiC and small area of worn matrix in 155A. Figure 81 depicts
the worn matrix for sample 755B with the remains of the TiC. Sample 755B shows uniform
distribution and high volume fraction of the TiC, resulting in higher wear resistance than for that of
755A and 745A and B.
While abrasive grits are softer than both carbides, TiC hardness is higher than that of WC. This can
be yet another reason for the better performance of TiC compared to WC in lower volume fraction of
TiC compared to the WC. Since the main worn areas in both cases are the soft matrixes, using
hardening methods such as age hardening to increase matrix hardness may enhance wear resistance.
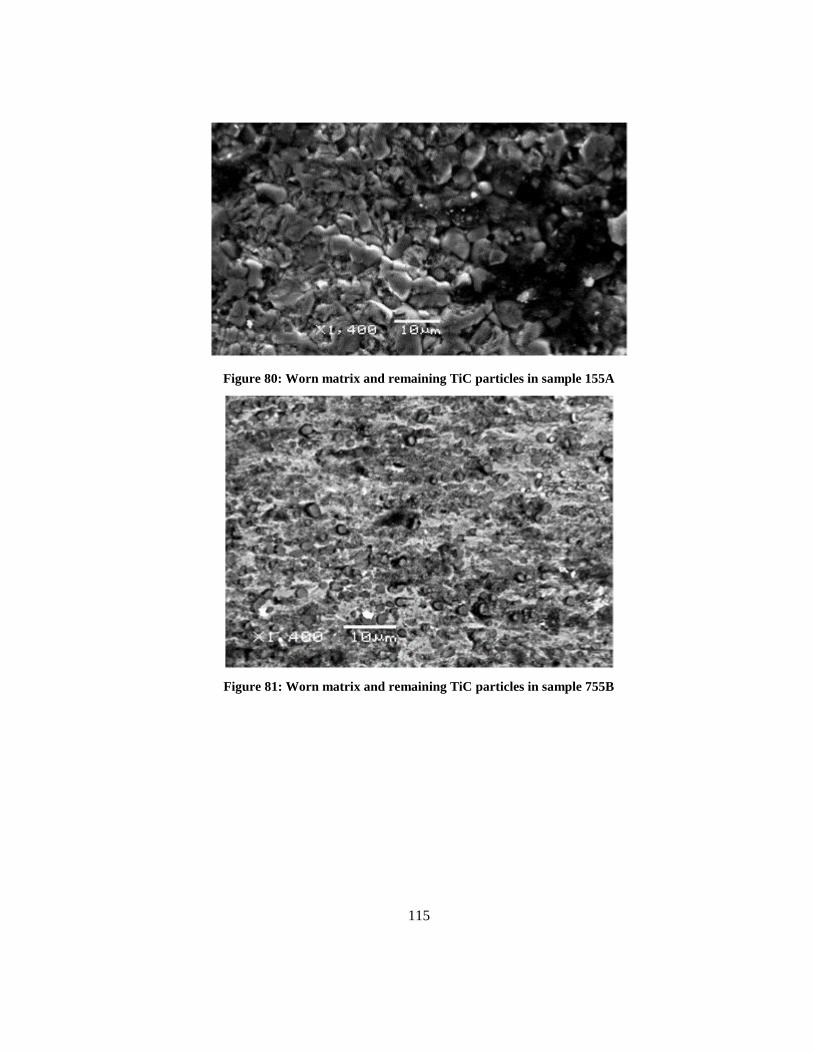
115
Figure 80: Worn matrix and remaining TiC particles in sample 155A
Figure 81: Worn matrix and remaining TiC particles in sample 755B
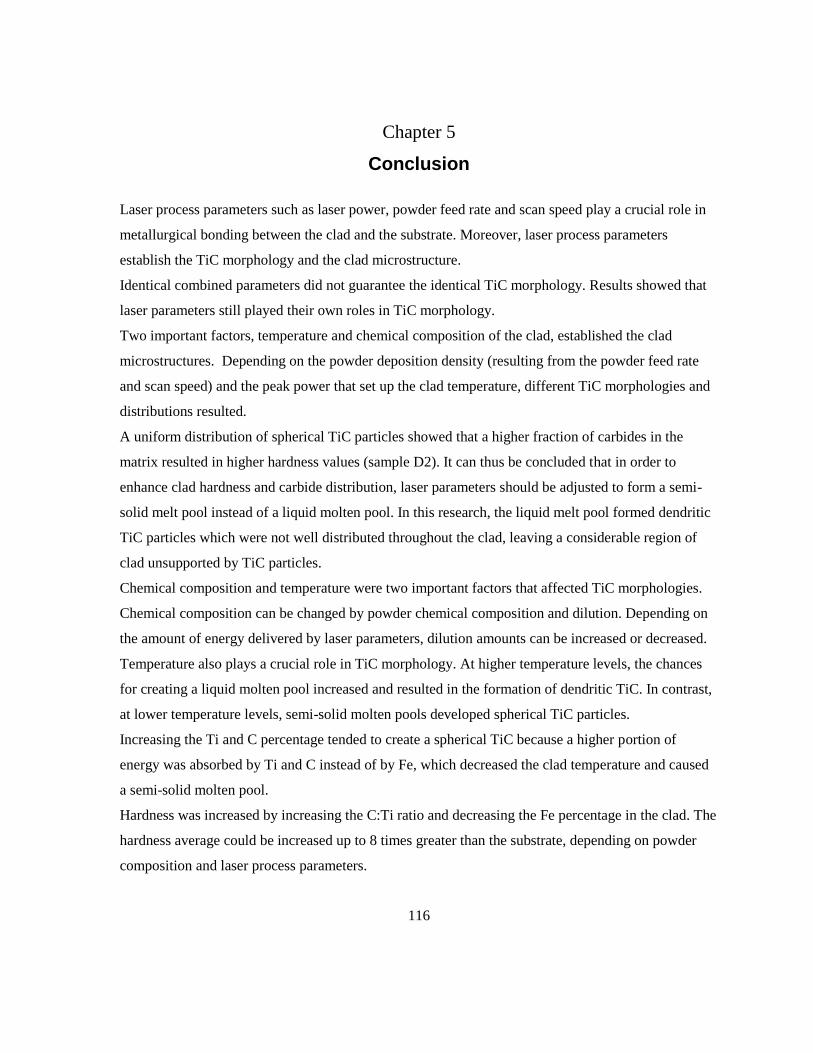
116
Chapter 5
Conclusion
Laser process parameters such as laser power, powder feed rate and scan speed play a crucial role in
metallurgical bonding between the clad and the substrate. Moreover, laser process parameters
establish the TiC morphology and the clad microstructure.
Identical combined parameters did not guarantee the identical TiC morphology. Results showed that
laser parameters still played their own roles in TiC morphology.
Two important factors, temperature and chemical composition of the clad, established the clad
microstructures. Depending on the powder deposition density (resulting from the powder feed rate
and scan speed) and the peak power that set up the clad temperature, different TiC morphologies and
distributions resulted.
A uniform distribution of spherical TiC particles showed that a higher fraction of carbides in the
matrix resulted in higher hardness values (sample D2). It can thus be concluded that in order to
enhance clad hardness and carbide distribution, laser parameters should be adjusted to form a semi-
solid melt pool instead of a liquid molten pool. In this research, the liquid melt pool formed dendritic
TiC particles which were not well distributed throughout the clad, leaving a considerable region of
clad unsupported by TiC particles.
Chemical composition and temperature were two important factors that affected TiC morphologies.
Chemical composition can be changed by powder chemical composition and dilution. Depending on
the amount of energy delivered by laser parameters, dilution amounts can be increased or decreased.
Temperature also plays a crucial role in TiC morphology. At higher temperature levels, the chances
for creating a liquid molten pool increased and resulted in the formation of dendritic TiC. In contrast,
at lower temperature levels, semi-solid molten pools developed spherical TiC particles.
Increasing the Ti and C percentage tended to create a spherical TiC because a higher portion of
energy was absorbed by Ti and C instead of by Fe, which decreased the clad temperature and caused
a semi-solid molten pool.
Hardness was increased by increasing the C:Ti ratio and decreasing the Fe percentage in the clad. The
hardness average could be increased up to 8 times greater than the substrate, depending on powder
composition and laser process parameters.
117
ASTM G65-04 was selected to measure the wear property of Fe-TiC, with different TiC
morphologies and volume fractions resulting from laser process parameters and powder composition.
Poor wear resistance belonged to dendritic TiC, which showed a minimum volume fraction of TiC in
the clad. Increasing the C:Ti atomic ratio and decreasing the Fe percentage helped to increase the TiC
volume fraction and wear resistance.
Laser process parameters played a crucial role in TiC morphology. To obtain optimal conditions, the
chemical composition of powder and dilution amounts should be considered.
TiC with a lower volume fraction compared to WC showed enhanced wear resistance in group 155.
118
Chapter 6
Future Work
The most important contribution of this research is its complete clarification of a one-layer deposition
of Fe-TiC. The research results and process maps provide useful information on the size, distribution
and morphology of TiC particles. In addition, the series of experiments conducted during this
research cover a considerable range of laser conditions thereby minimizing the number of
experiments needed in future research and industry applications. This research also gives detailed
information about the microhardness and wear resistance of the clad deposited by a variety of powder
compositions and laser process parameters. In the following, two research directions that can be
considered for the continuation of this research are explained.
6.1 Multi-layer Deposition of Fe-TiC
The excellent hardness and wear resistance of Fe-TiC coatings achieved in this research suggest many
possible industrial applications such as coating and protecting component surfaces, and tool making
and repair processes. In most applications, multi-layer deposition is a crucial factor in achieving
required thicknesses. Therefore, continuing this research with a multi-layer study would increase
knowledge of Fe-TiC deposition by laser cladding. Thermal control, minimizing the re-melting and
re-solidification zone of the composite, control of the laser conditions in each layer to minimize the
heat input, and dilution are examples of future topics in multi-layer deposition. In addition, changing
the powder composition in each layer helps to increase the particle volume fraction by increasing the
TiC volume fraction (i.e., 90%vol TiC) for the top layers.

119
6.2 Elimination of Metallic Powder
It was shown that by increasing the dilution, TiC volume fraction decreases. Eliminating the metallic
powder (i.e., Fe) in fed powder and making use of the Fe ( or Ti, Ni, etc.) that comes from substrate,
minimizes the dilution. In this situation, laser conditions have to be adjusted to melt a minimum
amount of substrate. The important question in this stage is how to choose the laser process
parameters to melt enough of the substrate to create a strong bonding between the clad and the
substrate while minimizing the dilution.
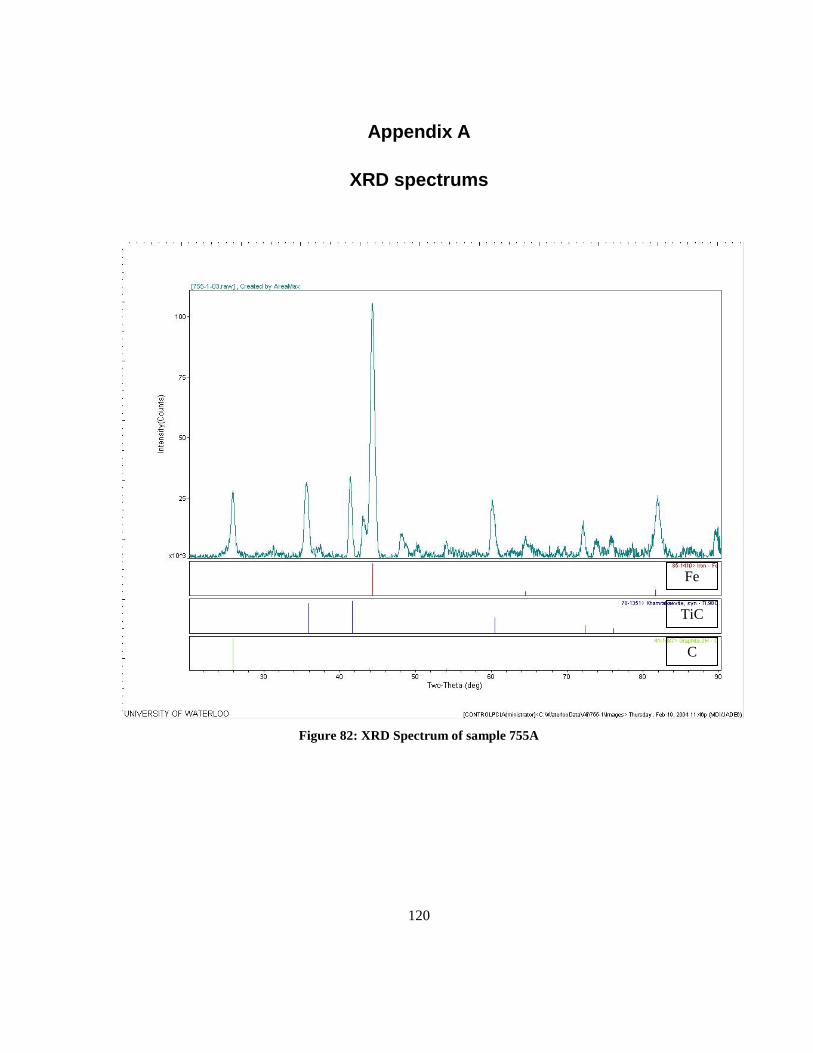
120
Appendix A
XRD spectrums
Figure 82: XRD Spectrum of sample 755A
Fe
TiC
C
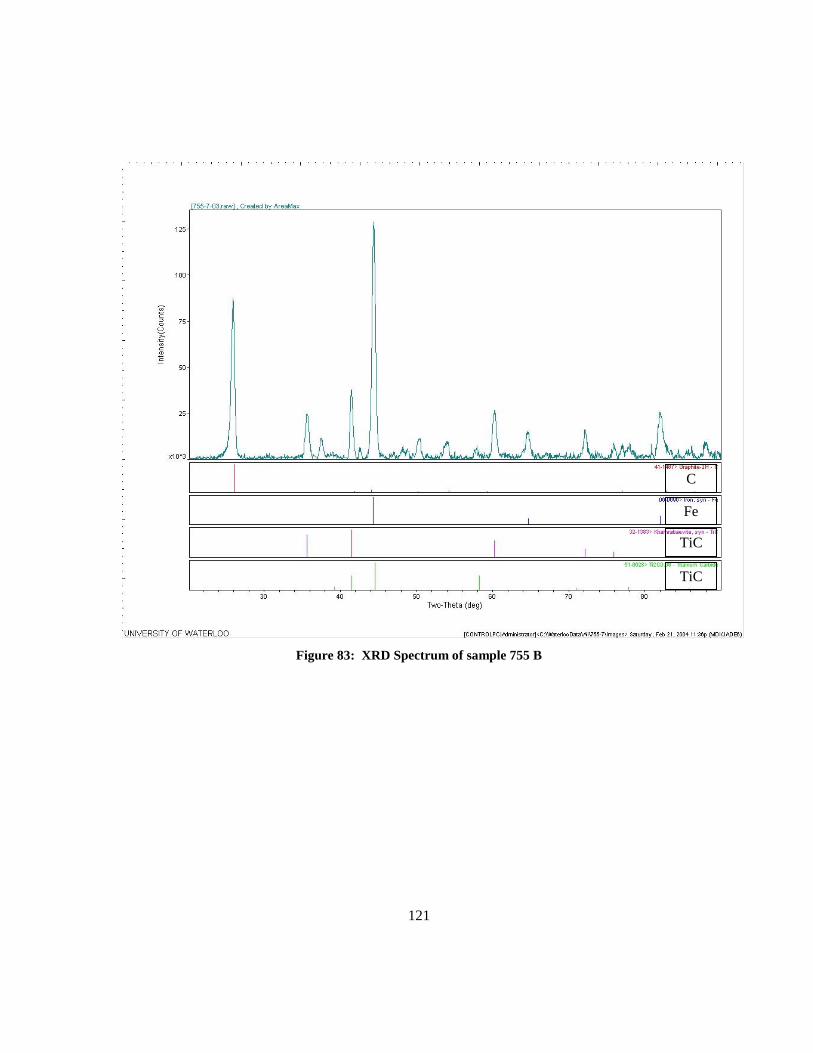
121
Figure 83: XRD Spectrum of sample 755 B
C
Fe
TiC
Fe
TiC
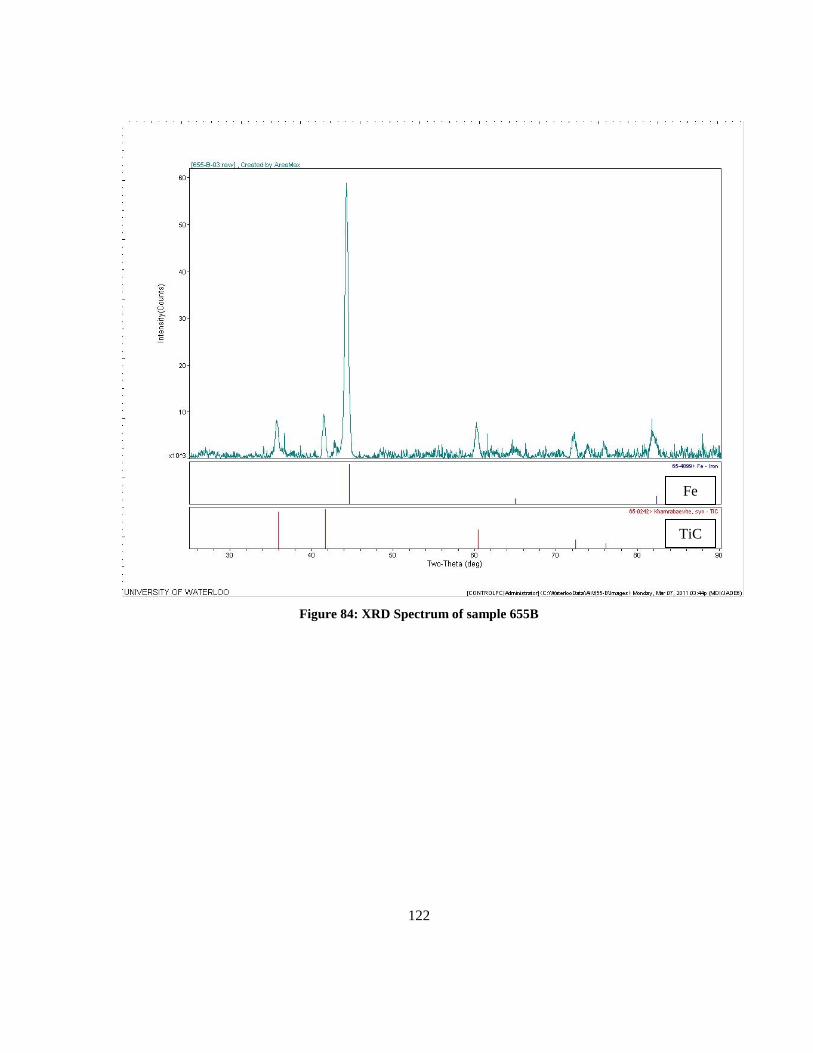
122
Figure 84: XRD Spectrum of sample 655B
Fe
TiC
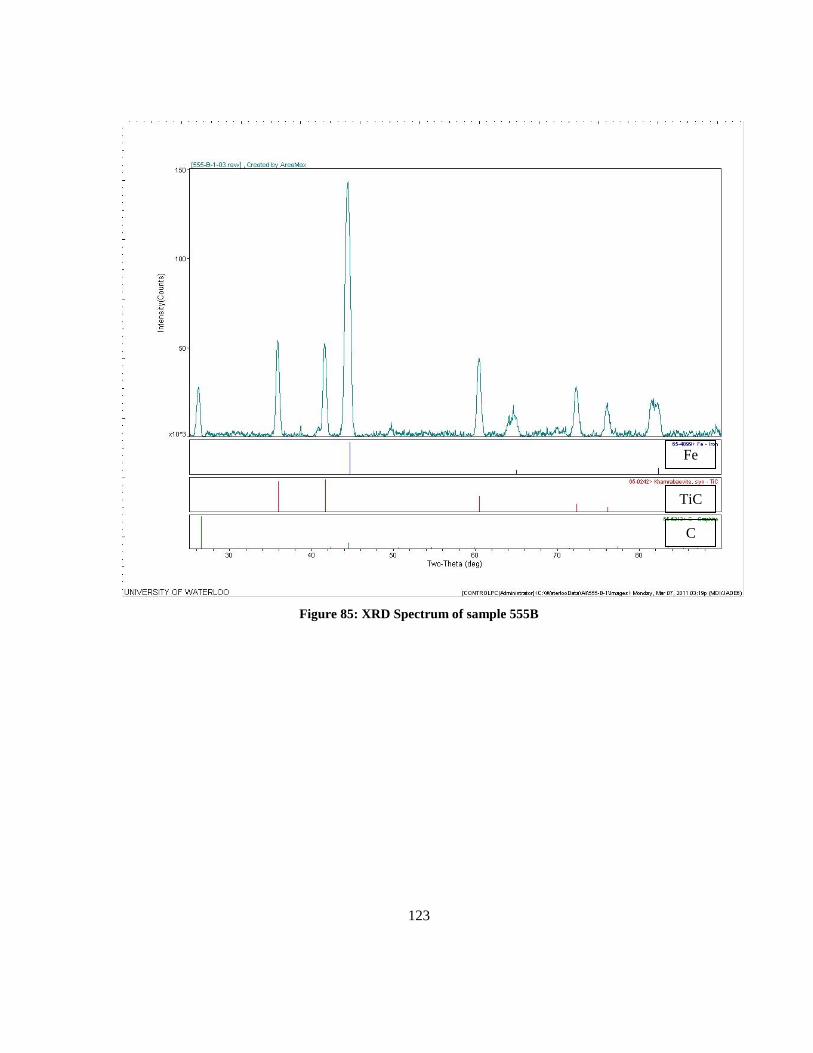
123
Figure 85: XRD Spectrum of sample 555B
Fe
TiC
C
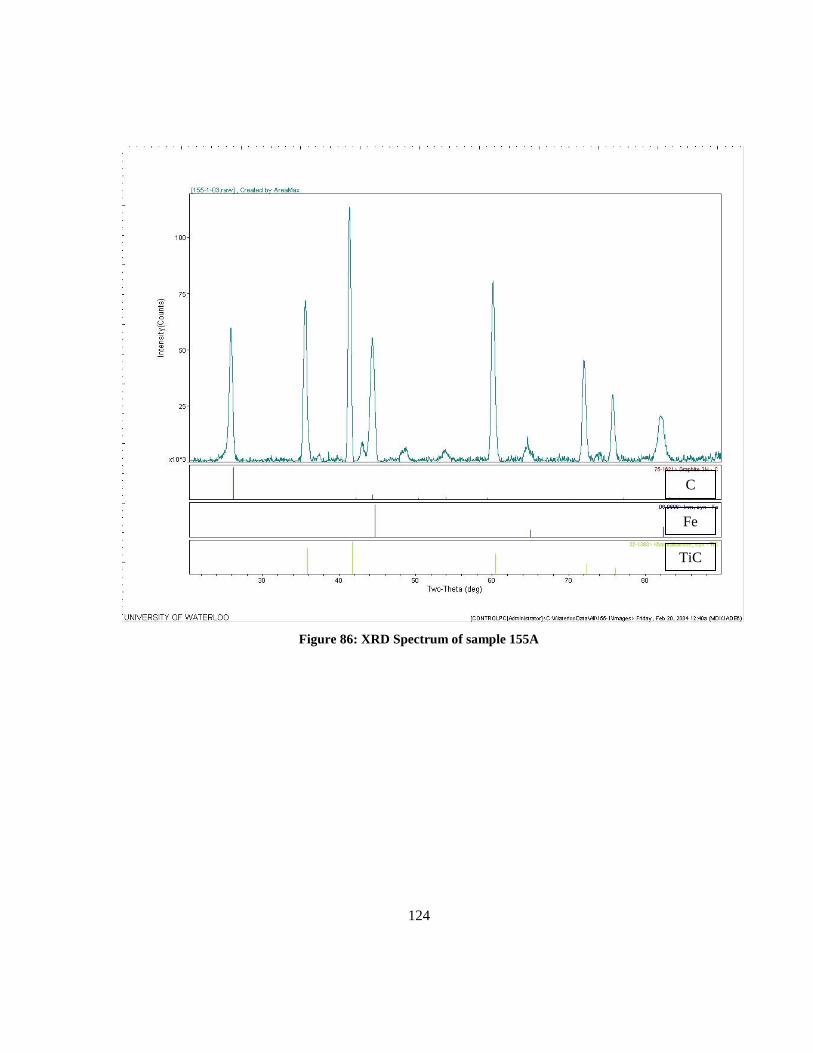
124
Figure 86: XRD Spectrum of sample 155A
Fe
C
TiC
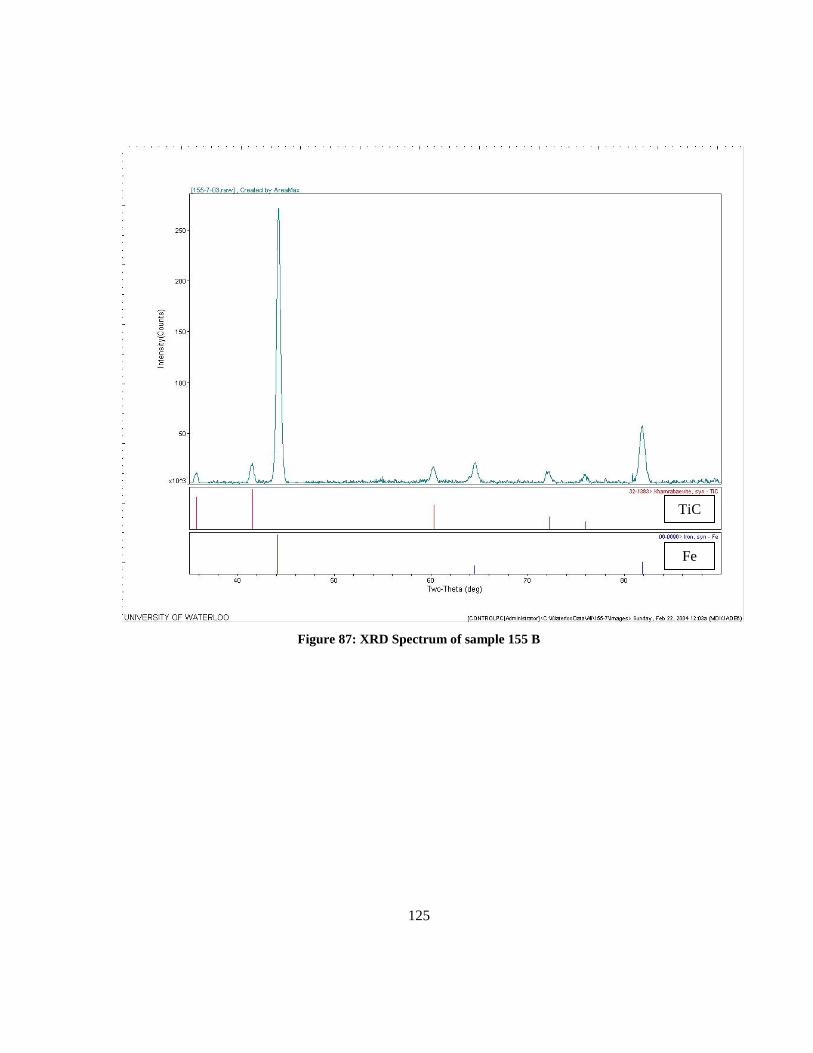
125
Figure 87: XRD Spectrum of sample 155 B
Fe
TiC
126
Bibliography
[1] Das, K., T. K. Bandyopadhyay, and S. Das, 2002, A review on the various synthesis routes of
TiC reinforced ferrous based composites, Journal of Materials Science, vol. 37, no. 18, p. 3881-3892.
[2] http://www.ferro-tic.com, Accessed .
[3] http://www.dew-stahl.com, Accessed .
[4] Jiang, W. H., J. Fei, and X. L. Han, 2000, In situ synthesis of (TiW)C/Fe composites, Materials
Letters, vol. 46, no. 4, p. 222-224.
[5] Jiang, W. H., W. D. Pan, G. H. Song, and X. L. Han, 1997, In-situ synthesis of a TiC-Fe
composite in liquid iron, Journal of Materials Science Letters, vol. 16, no. 22, p. 1830-1832.
[6] Raghavan, V., 2003, C-Fe-Ti (Carbon-Iron-Titanium), , vol. 24, no. 1, p. 62.
[7] Ren, Y. L., L. Qi, L. M. Fu, X. M. Zhou, X. L. Han, W. H. Jiang, W. D. Pan, and Q. K. Cai,
2002, Microstructural characteristics of TiC and (TiW)C iron matrix composites, Journal of
Materials Science, vol. 37, no. 23, p. 5129-5133.
[8] Capaldi, M. J., A. Saidi, and J. V. Wood, 1997, Reaction synthesis of TiC and Fe-TiC
composites, ISIJ International, vol. 37, no. 2, p. 188-193.
[9] Feng, K., Y. Yang, B. Shen, and L. Guo, 2005, In situ synthesis of TiC/Fe composites by reaction
casting, Materials & Design, vol. 26, no. 1, p. 37-40.
[10] Fan, Q., H. Chai, and Z. Jin, 2001, Dual-solution-precipitation mechanism of combustion
synthesis of TiC-Fe cermet with fine Ti powder, Journal of Materials Science, vol. 36, no. 23, p.
5559-5563.
127
[11] Ariely, S., J. Shen, M. Bamberger, F. Dausiger, and H. Hugel, 1991, Laser surface alloying of
steel with TiC, Surface and Coatings Technology, vol. 45, no. 1-3, p. 403-408.
[12] Tassin, C., F. Laroudie, M. Pons, and L. Lelait, 1995, Carbide-reinforced coatings on AISI 316
L stainless steel by laser surface alloying, Surface and Coatings Technology, vol. 76-77, no. Part
2, p. 450-455.
[13] Ax n, N. and K. -. Zum Gahr, 1992, Abrasive wear of TiC-steel composite clad layers on tool
steel, Wear, vol. 157, no. 1, p. 189-201.
[14] Jiang, W. H. and R. Kovacevic, 2007, Laser deposited TiC/H13 tool steel composite coatings
and their erosion resistance, Journal of Materials Processing Technology, vol. 186, no. 1-3, p. 331-
338.
[15] Li, Q., T. C. Lei, and W. Z. Chen, 1999, Microstructural characterization of laser-clad TiCp-
reinforced Ni-Cr-B-Si-C composite coatings on steel, Surface and Coatings Technology, vol. 114,
no. 2-3, p. 278-284.
[16] Gåård, A., P. Krakhmalev, and J. Bergström, 2006, Microstructural characterization and wear
behavior of (Fe,Ni)–TiC MMC prepared by DMLS, Journal of Alloys and Compounds, vol. 421,
no. 1-2, p. 166-171.
[17] Kathuria, Y. P., 2001, Nd–YAG laser cladding of Cr3C2 and TiC cermets, Surface and Coatings
Technology, vol. 140, no. 3, p. 195-199.
[18] Wanliang, W., L. Yong, Y. Dezhuang, and H. Wenrong, 2003, Microstructure of TiC dendrites
reinforced titanium matrix composite layer by laser cladding, Journal of Materials Science Letters,
vol. 22, no. 16, p. 1169-1171.
128
[19] Sun, R., W. Niu, and L. Liu, 2006, Effects of substrate materials on microstructure and
tribological properties of NiCrBSiC alloy laser clad layer, Cailiao Gongcheng/Journal of Materials
Engineering, no. 9, p. 45-48.
[20] Wu, W. L., 2010, Dissolution precipitation mechanism of TiC/Ti composite layer produced by
laser cladding, Materials Science and Technology, vol. 26, no. 3, p. 367-370.
[21] Candel, J. J., V. Amigó, J. A. Ramos, and D. Busquets, 2010, Sliding wear resistance of TiCp
reinforced titanium composite coating produced by laser cladding, Surface and Coatings
Technology, vol. 204, no. 20, p. 3161-3166.
[22] Sun, Sun, Zhang, Yu, and Li, Anonymous Anonymous (2011), Laser fabricated in situ (Ti, W)C
multi-ceramics reinforced intermetallic matrix composite, Advanced Materials Research, vol. 154-
155,pp. 929-932.
[23] Dong, Y. J. and H. M. Wang, 2009, Microstructure and dry sliding wear resistance of laser clad
TiC reinforced Ti-Ni-Si intermetallic composite coating, Surface and Coatings Technology, vol.
204, no. 5, p. 731-735.
[24] Paul, C. P., H. Alemohammad, E. Toyserkani, A. Khajepour, and S. Corbin, 2007, Cladding of
WC–12 Co on low carbon steel using a pulsed Nd:YAG laser, Materials Science and Engineering:
A, vol. 464, no. 1-2, p. 170-176.
[25] Hidouci, A., J. M. Pelletier, F. Ducoin, D. Dezert, and R. El Guerjouma, 2000, Microstructural
and mechanical characteristics of laser coatings, Surface and Coatings Technology, vol. 123, no.
1, p. 17-23.
129
[26] Wu, X. and Y. Hong, 2001, Microstructure and mechanical properties at TiCp/Ni-alloy
interfaces in laser-synthesized coatings, Materials Science and Engineering A, vol. 318, no. 1-2, p.
15-21.
[27] Du, B., Q. Li, X. Wang, and Z. Zou, 2007, In situ synthesis of TiC-VC particles reinforced Fe-
based metal matrix composite coating by laser cladding, Hanjie Xuebao/Transactions of the China
Welding Institution, vol. 28, no. 4, p. 65-68.
[28] Du, B., Z. Zou, X. Wang, and Q. Li, 2007, In situ synthesis of TiC-TiB2 reinforced FeCrSiB
composite coating by laser cladding, Surface Review and Letters, vol. 14, no. 2, p. 315-319.
[29] Cui, C., Z. Guo, H. Wang, and J. Hu, 2007, In situ TiC particles reinforced grey cast iron
composite fabricated by laser cladding of Ni–Ti–C system, Journal of Materials Processing
Technology, vol. 183, no. 2-3, p. 380-385.
[30] Wang, X. H., M. Zhang, X. M. Liu, S. Y. Qu, and Z. D. Zou, 2008, Microstructure and wear
properties of TiC/FeCrBSi surface composite coating prepared by laser cladding, Surface and
Coatings Technology, vol. 202, no. 15, p. 3600-3606.
[31] Yang, S., W. Liu, and M. Zhong, 2006, In-situ TiC reinforced composite coating produced by
powder feeding laser cladding, Journal of Materials Science and Technology, vol. 22, no. 4, p.
519-525.
[32] Yang, Liu, and Zhong, Anonymous Anonymous (2002), Microstructure characteristics and
properties of in-situ formed TiC/Ni based alloy composite coating by laser cladding, , vol.
4831,pp. 481-486.
130
[33] Wang, X. H., S. L. Song, S. Y. Qu, and Z. D. Zou, 2007, Characterization of in situ synthesized
TiC particle reinforced Fe-based composite coatings produced by multi-pass overlapping GTAW
melting process, Surface & Coatings Technology, vol. 201, no. 12, p. 5899-5905.
[34] Yan, M. and H. Hanqi, 1996, In situ laser surface coating of TiC metal-matrix composite layer,
Journal of Materials Science, vol. 31, no. 16, p. 4303-4306.
[35] Yang, S. 1., W. Liu, M. Zhong, Z. Wang, and H. Kokawa, 2005, Fabrication of in-situ
synthesized TiC particles reinforced composite coating by powder feeding laser cladding, Journal
of Materials Science, vol. 40, no. 9-10, p. 2751-4.
[36] Wu, X., 1999, In situ formation by laser cladding of a TiC composite coating with a gradient
distribution, Surface and Coatings Technology, vol. 115, no. 2-3, p. 111-115.
[37] Yang1, S., W. Liu, and M. Zhong, 2006, In-situ TiC reinforced composite coating produced by
powder feeding laser cladding, Journal of Materials Science & Technology, vol. 22, no. 4, p. 519-
25.
[38] Wang, X. H., S. Y. Qu, B. S. Du, and Z. D. Zou, 2009, In situ synthesised TiC particles
reinforced Fe based composite coating produced by laser cladding, Materials Science and
Technology, vol. 25, no. 3, p. 388-392.
[39] Li, Y., P. Bai, Y. Wang, J. Hu, and Z. Guo, 2009, Effect of Ni contents on the microstructure
and mechanical properties of TiC–Ni cermets obtained by direct laser fabrication, International
Journal of Refractory Metals and Hard Materials, vol. 27, no. 3, p. 552-555.
[40] Li, Yu, and Wang, Anonymous Anonymous (2010), Laser cladding of an in situ synthesized
TiB and TiC reinforced titanium matrix composite coating on Ti6Al4V, Advanced Materials
Research, vol. 97-101,pp. 3861-3865.
131
[41] Wang, X. H., M. Zhang, B. S. Du, S. Y. Qu, and Z. D. Zou, 2010, Microstructure and wear
properties of in situ multiple carbides reinforced Fe based surface composite coating produced by
laser cladding, Materials Science and Technology, vol. 26, no. 8, p. 935-939.
[42] Liu, Y. F., J. S. Mu, X. Y. Xu, and S. Z. Yang, 2007, Microstructure and dry-sliding wear
properties of TiC-reinforced composite coating prepared by plasma-transferred arc weld-surfacing
process, Materials Science & Engineering A, vol. 458, no. 1-2, p. 366-370.
[43] Jonsson, S., 1998, Assessment of the Fe-Ti-C system, calculation of the Fe-Ti-N system, and
prediction of the solubility limit of Ti(C,N) in liquid Fe, Metallurgical and Materials Transactions
B: Process Metallurgy and Materials Processing Science, vol. 29, no. 2, p. 371-384.
[44] Ehsan Toyserkani, Amir Khajepour, Stephen Corbin, 2005, Laser Cladding, 260 p.
[45] Dubourg, L. and L. St-Georges, 2006, Optimization of laser cladding process using Taguchi and
EM methods for MMC coating production, Journal of Thermal Spray Technology, vol. 15, no. 4,
p. 790-795.
[46] Hathaway, Rohatgi , Soczak, and Sobczak, Anonymous Anonymous (1997), Ferrous
Composites, .
[47] ASTM, ed., 1996, Measuring Abrasion Using Dry Sand /Rubber-Wheel Apparatus G65,
Philadelphia, PA.
[48] Emamian, A., S. F. Corbin, and A. Khajepour, 2010, Effect of laser cladding process parameters
on clad quality and in-situ formed microstructure of Fe–TiC composite coatings, Surface and
Coatings Technology, vol. 205, no. 7, p. 2007-2015.
132
[49] Rohatgi, P. K., S. Ray, and Y. Liu, 1992, Tribological properties of metal matrix-graphite
particle composites, International Materials Reviews, vol. 37, no. 3, p. 129-149.
[50] Huang, S. W., M. Samandi, and M. Brandt, 2004, Abrasive wear performance and
microstructure of laser clad WC/Ni layers, Wear, vol. 256, no. 11-12, p. 1095-1105.
[51] Van Acker, K., D. Vanhoyweghen, R. Persoons, and J. Vangrunderbeek, 2005, Influence of
tungsten carbide particle size and distribution on the wear resistance of laser clad WC/Ni coatings,
Wear, vol. 258, no. 1-4 SPEC. ISS., p. 194-202.
[52] Zhu, B., X. Zeng, Z. Tao, S. Yang, and K. Cui, 1993, Coarse cemented WC particle ceramic-
metal composite coatings produced by laser cladding, Wear, vol. 170, no. 2, p. 161-166.
[53] Bhagat, R. B., J. C. Conway Jr., M. F. Amateau, and R. A. Brezler III, 1996, Tribological
performance evaluation of tungsten carbide-based cermets and development of a fracture
mechanics wear model, Wear, vol. 201, no. 1-2, p. 233-243.
[54] Saka, N. and D. P. Karalekas, 1985, Friction and wear of particle-reinforced metal-ceramic
composites. .
[55] Prasad, S. V., P. K. Rohatgi, and T. H. Kosel, 1986, Mechanisms of material removal during
low stress and high stress abrasion of aluminum alloy-zircon particle composites, Materials
Science and Engineering, vol. 80, no. 2, p. 213-220.
[56] Suh, N. P., 1973, The delamination theory of wear, Wear, vol. 25, no. 1.
[57] Jahanmir, S. and N. P. Suh, 1977, Mechanics of subsurface void nucleation in delamination
wear, Wear, vol. 44, no. 1, p. 17-38.
133
[58] Jahanmir, S., E. P. Abrahamson II, and N. P. Suh, 1976, Sliding wear resistance of metallic
coated surfaces, Wear, vol. 40, no. 1, p. 75-84.
[59] Suwa, M., K. Komuro, and K. Soeno, 1978, Effect of graphite particle size on the wear of
graphite-dispersed bronze castings, J.JAPAN INST.METALS, vol. 42, no. 11 , 1978, p. 1034-
1038.
[60] Desai, V. M., C. M. Rao, T. H. Kosel, and N. F. Fiore, 1984, Effect of carbide size on the
abrasion of cobalt-base powder metallurgy alloys, Wear, vol. 94, no. 1, p. 89-101.
[61] Bhansali, K. J. and R. Mehrabian, 1982, ABRASIVE WEAR OF ALUMINUM-MATRIX
COMPOSITES. Journal of Metals, vol. 34, no. 9, p. 30-34.
[62] Budinski, K. G., 1991, Tribological properties of titanium alloys, Wear, vol. 151, no. 2, p. 203-
217.
[63] Esteban Fernández, J., M. del Rocío Fernández, R. Vijande Diaz, and R. Tucho Navarro, 2003,
Abrasive wear analysis using factorial experiment design, Wear, vol. 255, no. 1-6, p. 38-43.
[64] He, Q., Y. Wang, W. Zhao, and Y. Cheng, 2009, Interface microstructure and wear properties of
TiC-Ni-Mo coatings prepared by in-situ fabrication of laser cladding, Hanjie Xuebao/Transactions
of the China Welding Institution, vol. 30, no. 1.
[65] Pu, Y., B. Guo, J. Zhou, S. Zhang, H. Zhou, and J. Chen, 2008, Microstructure and tribological
properties of in situ synthesized TiC, TiN, and SiC reinforced Ti3Al intermetallic matrix
composite coatings on pure Ti by laser cladding, Applied Surface Science, vol. 255, no. 5 PART
2, p. 2697-2703.
134
[66] Wang, X. H., S. Y. Qu, B. S. Du, and Z. D. Zou, 2009, In situ synthesised TiC particles
reinforced Fe based composite coating produced by laser cladding, Materials Science and
Technology, vol. 25, no. 3, p. 388-392.
[67] Sun, R. -. and X. -. Yang, 2006, Microstructure and friction wear properties of TiC laser clad
layer, Guangxue Jishu/Optical Technique, vol. 32, no. 2, p. 287-289.
[68] Guo, S. -., X. -. Li, Q. -. Yang, J. Yang, and F. Meng, 2008, Microstructure and tribological
properties of laser clad WC-Ni/TiC composite coatings, Cailiao Gongcheng/Journal of Materials
Engineering, no. 6, p. 72-75.
[69] Alimardani, Emamian, Corbin, and Khajepour, (2010), The Effect of Thermal Field on the
Deposition of Fe-TiC on Carbon Steel Using Laser Cladding/IMECE conference, Vancouver,
Canada.
[70] Wu, X. and G. Chen, 1999, Microstructure and wear resistance of in situ TiCp composite
coating by laser cladding, Journal of Materials Science and Technology, vol. 15, no. 3, p. 233-238.
[71] Quncheng, F., C. Huifen, and J. Zhihao, 1999, Microstructural evolution during combustion
synthesis of TiC-Fe cermet, Transactions of Nonferrous Metals Society of China, vol. 9, no. 2, p.
286-291.
[72] occi, A. M., A. Cincotti, F. Delogu, R. Orr , and G. Cao, 2005, Combustion synthesis of metal
carbides: Part I. Model development, Journal of Materials Research, vol. 20, no. 5, p. 1257-1268.
[73] Nurminen, J., J. Näkki, and P. Vuoristo, 2009, Microstructure and properties of hard and wear
resistant MMC coatings deposited by laser cladding, International Journal of Refractory Metals
and Hard Materials, vol. 27, no. 2, p. 472-478.
135
[74] Stachowiak, G. B. and G. W. Stachowiak, 2010, Tribological characteristics of WC-based
claddings using a ball-cratering method, International Journal of Refractory Metals and Hard
Materials, vol. 28, no. 1, p. 95-105.
[75] Wilson, S. and A. T. Alpas, 1997, Wear mechanism maps for metal matrix composites, Wear,
vol. 212, no. 1, p. 41-49.