Embed Size (px)
Citation preview
HAL Id: hal-03012691https://hal.archives-ouvertes.fr/hal-03012691
Submitted on 19 Nov 2020
HAL is a multi-disciplinary open accessarchive for the deposit and dissemination of sci-entific research documents, whether they are pub-lished or not. The documents may come fromteaching and research institutions in France orabroad, or from public or private research centers.
L’archive ouverte pluridisciplinaire HAL, estdestinée au dépôt et à la diffusion de documentsscientifiques de niveau recherche, publiés ou non,émanant des établissements d’enseignement et derecherche français ou étrangers, des laboratoirespublics ou privés.
In situ surface imaging: High temperatureenvironmental SEM study of the surface changes during
heat treatment of an Al Si coated boron steelM. Barreau, C. Méthivier, T. Sturel, C. Allely, P. Drillet, S. Cremel, R.
Grigorieva, B. Nabi, Renaud Podor, J. Lautru, et al.
To cite this version:M. Barreau, C. Méthivier, T. Sturel, C. Allely, P. Drillet, et al.. In situ surface imaging: High temper-ature environmental SEM study of the surface changes during heat treatment of an Al Si coated boronsteel. Materials Characterization, Elsevier, 2020, 163, pp.110266. �10.1016/j.matchar.2020.110266�.�hal-03012691�

1
In situ surface imaging: high temperature Environmental SEM
study of the surface changes during heat treatment of an Al-Si
coated boron steel
M. Barreau,a C. Méthivier,a T. Sturel,b C. Allely,b P. Drillet,b S. Cremel,b R. Grigorieva,b B. Nabi,c R. Podor,d J. Lautru,d V. Humblot,a J. Landoulsi,a X. Carrier,*,a a Sorbonne Université, CNRS, Laboratoire de Réactivité de Surface, UMR CNRS 7197, F-75005, Paris, France b ArcelorMittal Research SA, Voie Romaine BP 30320, 57283 Maizières-lès-Metz, France c Centre for Research in Metallurgy - CRM Group, Avenue du Bois-Saint-Jean n°21, 4000 Liège, Belgium d ICSM, Univ Montpellier, CEA, CNRS, ENSCM, Bagnols sur Cèze, France
* Corresponding author; E-mail: [email protected]
Abstract: Al-Si coated boron steels have been of interest for many years because of their superior mechanical properties and their excellent oxidation resistance. These high strength steels are particularly used in hot stamping processes during which the Al-Si coating undergoes multiple microstructural transformations. In this study, morphology and structure transformations are investigated using an original approach. Most of the time, the coating evolution is studied in cross section, by ex situ characterization of its different layers after heat treatment. In this work, the evolution of the surface is explored for the first time using in situ high-temperature Environmental Scanning Electron Microscopy (HT-ESEM). The austenitization step reproduced in the ESEM chamber allows a precise description of several surface changes occurring, depending on the temperature range. Among them, the main change in morphology is occurring between 650 and 800 °C and is linked to different reactions between aluminium and bi- and ternary Fe-Al-Si phases. The heating rate is also pointed out as a key parameter that affects the surface morphology. In fact, with low heating rates the surface is mostly composed of hexagonal and rectangular elements coming from t5 (Fe2Al8Si) structuration, while needle-shaped FeAl3 structures are found for higher heating rates. In addition, it is observed that the heating rate also affects the surface roughness depending on the surface morphology. Finally, the origin of the presence of micrometrics pores appearing between 800 and 900 °C at the coating surface is discussed. Our hypothesis supported by ex situ characterization is that they result from formation of a crystallized oxide layer, probably close to a-Al2O3 structure.
Keywords: HT-ESEM; Al-Si boron steel; 3D surface topography; hot stamping; austenitization; intermetallic phases; surface oxidation
2
1. Introduction
Since the last decades, important efforts have been made in the automotive sector to reduce
the atmospheric CO2 emissions and one current approach is to reduce the fuel consumption by
lightening the vehicles. In this context, ultra-high strength steels have been developed to
minimize their amount, the most common being composed of boron and achieving tensile
strengths of around 1500 MPa in quenched condition [1]. These materials, produced using a
hot stamping process [2,3], have been significantly employed into vehicles since then,
particularly in their body structure, such as door beams, bumpers or roof pillars. In 1995, they
accounted for 1 wt.% of the body structure components, while they can now reach up to 60
wt.% [4]. As illustrated in Figure 1, in order to achieve these mechanical properties, the steel
blank is first heated at 900 - 950 °C for 3 - 10 min in a furnace in order to obtain the austenitic
structure. Then, the steel is quenched, leading to a martensitic microstructure [5]. However,
under the austenitization conditions, the hot steel surface reacts with air, leading to oxide
scale formation and decarburization (oxidation of carbides into CO and/or CO2, resulting in a
decrease of the carbon content and a loss of the wear resistance) [1].
In order to prevent decarburization as well as oxidation, boron steels are pre-coated with a
protective layer. At present, Al-Si are the most widespread coatings. They are obtained by
dipping the unprotected steel into an aluminizing bath composed of molten Al, Si and Fe.
After aluminizing, the Al-Si coating is composed of two different layers [6]. The thinnest
layer (3 µm thick for a usual AS-150 coated steel) is localized at the steel/coating interface
and results from the dissolution of iron from the steel into the coating. Its diffusion through
the coating yields in an intermetallic Fe-enriched layer composed of Fe-Al binary phases
(mostly Fe2Al5 and FeAl3, FeAl3 being also designated as Fe4Al13 in literature [7]), and t5 Fe-
Al-Si ternary phase. Regarding the t5 composition, several propositions have been reported,
including Fe3Al12Si2 and/or Fe5Al20Si2 [8], Fe3–6Al12–15Si2-5 [9] or Fe2Al7-8Si [5,10]. The

3
second part of the coating, thicker (up to 25 µm thick for a usual AS-150 coated steel), is
mainly composed of pure Al, Si rods and Fe-Al-Si ternary phases such as t5 or t6 (Fe2Al9Si2).
Figure 1. Schematic illustration of a typical hot-stamping line [11].
During austenitization, the Al-Si coating undergoes many transformations, as reported in
numerous studies [6,9,10,12–14]. For instance, Wang and Chen [12] studied the oxidation
behaviour of Al-Si coated steels between 750 and 950 °C and observed that a high dwell time
results in the diffusion of more iron from the steel to the surface coating, accompanied by
intermetallic phase transformations. Among these phases, the formation of binary Fe-Al
phases such as Fe4Al13, Fe2Al5, FeAl2 and FeAl, was reported [15,16]. Grigorieva et al. [6]
studied the phase transformations occurring during an austenitization step at 900 - 930 °C by
Energy Dispersive X-ray Spectrometry (EDS) analysis of a cross-section, after interrupting
the heat treatment at several temperatures. At 615 °C, they observed that the t5 ternary phase,
localized at the steel/coating interface, grows rapidly into the coating because of the iron
diffusion into molten Si. When the temperature reaches 830 °C, the diffusion of more iron
leads to the appearance of more t5 at the coating surface. Moreover, the molten Al can cause
FeAl3 formation by reaction with t5. After 10 min of austenitization at 900 °C, they identified
five different layers: two layers composed of ternary phases, sandwiched by layers of binary
Fe-Al phases. In contrast, Guo et al. observed that the coating is composed of only four layers
after a heat treatment at 930 °C for 5 min [17]. By EDS analysis, they attributed the surface
layer to Fe2Al5 and FeAl2 and the second layer as a mix of ternary phases. In brief, depending
on the heating parameters, the coating will be structured differently.

4
Most of the studies characterizing the Al-Si coating evolution during austenitization are
carried out ex situ on cross-sections of the coated steel, i.e. only after the heat treatment
[3,13,17]. However, to our knowledge, few studies have been focused on the surface
evolution during austenitization. Liang et al. [14] noted by 3D reconstructions (with optical
microscopy) of the coated surface that a maximum surface roughness is obtained at near 700
°C. Moreover, it is known that an alumina layer is formed at the extreme surface by oxidation
with air. As mentioned in the review of Fan and De Cooman [5], this oxide layer is often
mentioned but without any detailed characterization. Nevertheless, the structure and the
composition of the oxide surface are parameters which require in depth analysis for better
understanding of surface properties, such as weldability, paintability, corrosion resistance or
hydrogen diffusion.
The aim of this work is the identification of the different surface changes at the surface of an
Al-Si coating occurring during austenitization. To the best of our knowledge, this is the first
time that in situ High-Temperature Environmental Scanning Electron Microscopy (HT-
ESEM) is used to observe the changes in surface morphology of Al-Si coated steels in real-
time during heating. We demonstrate here that such a powerful and fast technique can be used
to better understand the parameters affecting the surface thus allowing to better control its
properties. The heating conditions are the main parameters investigated in this study,
particularly the heating rate. In addition, ex situ techniques (XPS, XRD) are used with the aim
to characterize the intermetallic phases and the oxide layer at the coating surface.
2. Materials and Methods
2.1. Material
The material chosen in the present study was a patented 22MnB5 steel covered by a 25 µm
thick Al-Si coating [18]. The chemical composition of the boron steel is shown in Table 1.
The coating was obtained by dipping the steel into an aluminizing bath composed of 88 wt%
5
Al, 9 wt% Si (Si/Al = 0.1) and 3 wt% Fe at about 675 ± 5 °C. During immersion, part of the
iron from the steel dissolves into the coating. After cooling down to ambient temperature,
FexAly binary and FexAlySiz ternary phases form on the coating surface.
Table 1. Chemical composition of the 22MnB5 steel
Element C Mn Si Cr Ti B S P Fe
wt.% 0.22 1.3 0.25 0.15 0.04 0.003 0.002 0.013 bal.
In the industrial process, an austenitization step, which consists of heating the coated steel in a
furnace at 900 - 930 °C for 3 – 10 min before hot stamping, is performed to obtain the desired
mechanical properties. In these real conditions, the starting heating rate is close to 600
°C.min-1 until a temperature break around 600 °C. From 600 to 900 °C, the heating rate is
lower, around 200 °C.min-1. During austenitization, further iron from the steel bulk diffuses
into the coating, leading to the formation of binary and ternary phases with a higher iron
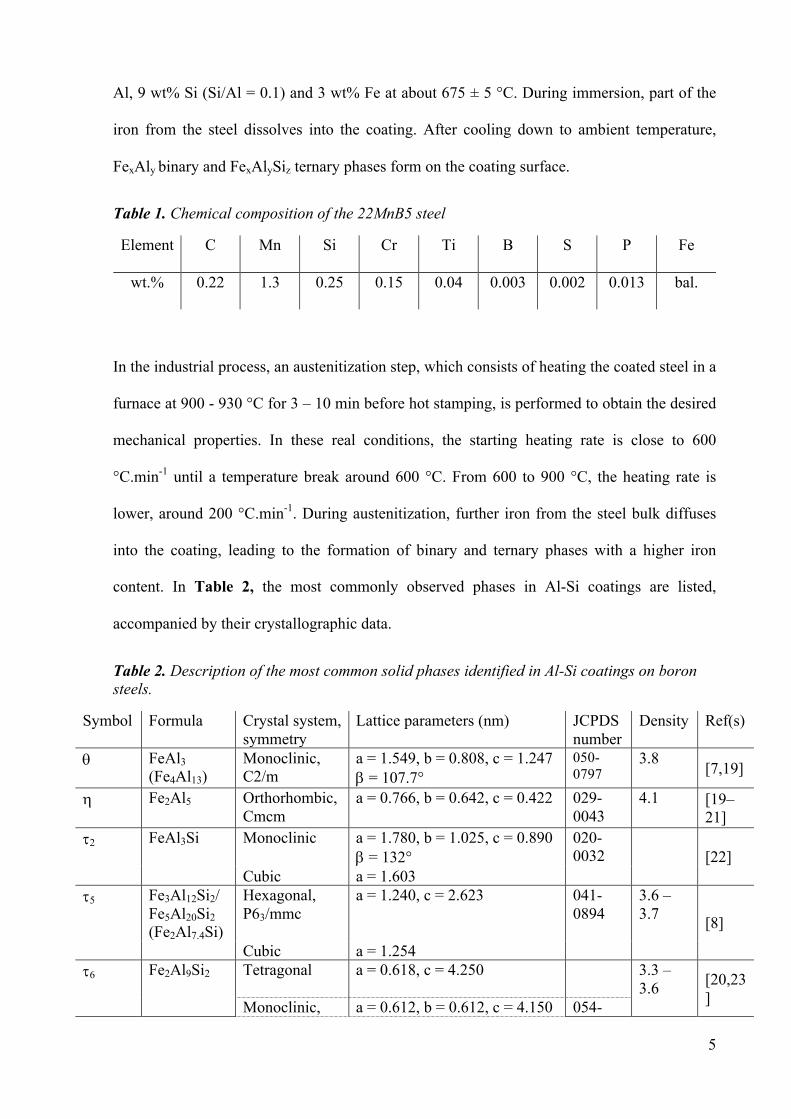
content. In Table 2, the most commonly observed phases in Al-Si coatings are listed,
accompanied by their crystallographic data.
Table 2. Description of the most common solid phases identified in Al-Si coatings on boron steels.
Symbol Formula Crystal system, symmetry
Lattice parameters (nm) JCPDS number
Density Ref(s)
q FeAl3 (Fe4Al13)
Monoclinic, C2/m
a = 1.549, b = 0.808, c = 1.247 b = 107.7°
050-0797
3.8 [7,19]
h Fe2Al5 Orthorhombic, Cmcm
a = 0.766, b = 0.642, c = 0.422 029-0043
4.1 [19–21]
t2 FeAl3Si
Monoclinic
a = 1.780, b = 1.025, c = 0.890 b = 132°
020-0032
[22]
Cubic a = 1.603 t5 Fe3Al12Si2/
Fe5Al20Si2 (Fe2Al7.4Si)
Hexagonal, P63/mmc
a = 1.240, c = 2.623 041-0894
3.6 – 3.7 [8]
Cubic a = 1.254 t6 Fe2Al9Si2 Tetragonal
a = 0.618, c = 4.250 3.3 –
3.6 [20,23] Monoclinic, a = 0.612, b = 0.612, c = 4.150 054-

6
A2/a b = 91° 0376 w FeSi2 Orthorhombic,
Cmca
a = 0.987, b = 0.779, c = 0.783 020-0532
[24]
2.2. Characterization
X-ray Photoelectron Spectroscopy. X-ray Photoelectron Spectroscopy (XPS) analysis were
carried out using an Omicron Argus X-ray photoelectron spectrometer with a monochromated
Al Ka radiation source (hn = 1486.6 eV). The photoelectrons from the sample were analysed
at a take-off angle of 45°. The spectra were recorded at room temperature under ultra-high
vacuum conditions (10-9 – 10-10 mbar), with a 100 eV pass energy for the survey and a 20 eV
pass energy for the C 1s, O 1s, N 1s, Al 2p, Si 2p, Zn 2p and Ca 2p regions. Binding energies
were calibrated by centring the C 1s peak resulting from adventitious carbon contamination at
284.8 eV and element peak intensities were corrected by Scofield factors [25]. The peak areas
were determined after subtraction of a linear background. The spectra were fitted using Casa
XPS v.2.3.15 software (Casa Software Ltd., U.K.) and applying a Gaussian/Lorentzian ratio
G/L equal to 70/30.
X-Ray Diffraction. X-Ray Diffraction (XRD) patterns were recorded using two
diffractometers. Austenitized samples were classically analysed with a Bruker D8 Advance
powder diffractometer operating at 40 kV and 30 mA in the q-2q mode with Bragg-Brentano
geometry (few microns of depth analysis), using Cu Ka radiation (l = 1.5418 Å). XRD
patterns were recorded from 2q=10 to 80° at a scan rate of 0.01 ° s-1. In order to characterize
the thin layers on the surface, in-plane Grazing Incidence X-Ray Diffraction (GIXRD)
patterns were collected with a Smartlab Rigaku diffractometer operating at 45 kV and 200
mA, equipped with a 9 kW Cu rotating anode. Data were collected with an incident beam
angle of 0.5°, from 2q = 20 to 80° at a scan rate of 0.033 ° s-1.
7
Scanning Electron Microscopy. Scanning Electron Microscopy (SEM) observations were
performed using two different microscopes, one for ex situ observation at room-temperature
and another one for in situ high-temperature measurements and 3D reconstruction.
Ex situ room-temperature measurements were performed on a Hitachi SU-70 FEG-SEM
operating at 10 kV with a working distance near 15 mm, and equipped with an in-lens
secondary electron detector (SE-Lower) for high lateral resolution images. This microscope
was particularly used to examine and determine the chemical composition of the surfaces
(except the elements lighter than carbon), by the use of an Oxford X-Max detector for
localized analysis or elemental mapping.
In situ High-Temperature Environmental Scanning Electron Microscopy experiments (HT-
ESEM) and 3D reconstructions were conducted using a FEI QUANTA 200 FEG-SEM
microscope. For HT-ESEM experiments, the microscope was operating at 20 kV, with a
working distance near 22 mm and equipped with a gaseous secondary electron detector
(GSED). An in situ platinum heating stage allows heating 6 mm diameter pieces of steel with
a temperature accuracy of ± 5 °C, through the use of a homemade thermocouple placed below
the sample [26]. Many images (1 per second) of the sample surface were recorded during the
heat treatment. The resulting video was then obtained by superimposing the images using
ImageJ software [27].
All experiments were performed under 200 Pa of outdoor air. According to the hygrometric
data, the experiments were realized with a dew point close to 12 °C. To examine the surface
changes occurring during austenitization, Al-Si coated boron steels samples were heated to
900 °C with a dwell time of 5 minutes before cooling down to room temperature (without
imposed cooling conditions). In total, four videos of high temperature treatments of the Al-Si
coated steels were recorded, with heating rates equals to 20, 50, 100 and 200 °C min-1
(provided in the Supporting Information). Note that in the industrial conditions the starting
8
heating rate is close to 600 °C min-1 until a temperature break around 600 °C. From 600 to
900 °C, the heating rate is lower, around 200 °C min-1. Since the present work is focusing on
what happens from 600 °C (where the surface transformations occur) then the 200 °C min-1
heating rate fits well with the real industrial conditions. Another experiment was achieved by
inserting the raw material into the crucible preheated at 900 °C. The goal of this experiment
was to get even closer to the industrial conditions. Unfortunately, the heating was too fast to
record a video, especially due to the time between the closure of the ESEM chamber and the
detector ignition (vacuum needed). Only micrographs of the final microstructure were thus
recorded and the heating rate was estimated around 400 °C.min-1. Note also that the quality of
the video recorded at heating rates of 100 and 200 °C.min-1 is relatively poor, because of the
significant mobility of the surface during these experiments and the short frame time used to
record the images.
The temperature indicated on videos is not accurate and was corrected by measuring the
temperature with a thermocouple directly in contact with the sample. The corrected
temperature is provided with each video (Figures S1 to S4). Logically, the error percentage
between the temperature measured by the thermocouple and the one indicated on the video
increases with the heating rate: from 3 to 9% in the 500 – 900 °C temperature range at 20 and
50 °C.min-1, and from 2 to 25% at 100 - 200 °C min-1.
This microscope was also used for 3D surface reconstruction (operating at 2.1 kV), by
recording several images of the same surface with different tilt angles. Once the images were
acquired, surface 3D reconstructions were generated using the MeX software (Alicone,
Austria) [28]. From the reconstructions, surface roughness parameters were extracted, such as
the height average (Sa) and the maximum height (Sz) of the selected area. In addition, the
difference in altitude could be locally explored using ImageJ software (version 1.51) [27].
9
3. Results and Discussion
3.1. Characterization of the raw material surface
A micrograph of the raw surface recorded at a x5000 magnification is presented in Figure 2
(as-received, before austenitization) accompanied by a mapping of the elements Al, Si and Fe.
Channels of pure aluminium were identified at the surface, surrounding different phases.
Regarding the Si map (Figure 2c), several silicon rods were identified but they were not
clearly seen on the micrograph, which suggests that they are mostly localized below the
extreme surface. At the bottom left of the micrograph an area composed of Al and Si, without
Fe is observed. On the other hand, iron can be observed with Al and Si, as intermetallic Fe-
Al-Si phases (see arrows on Figure 2a). Localized EDS analysis of a dendritic morphology
present in the centre of the image (yellow dotted circle on Figure 2a), shows that the
measured chemical composition corresponds to 13 Al, 2 Fe and 1 Si atoms, thus probably
corresponding to a t5 ternary phase (Fe2Al7Si) plus metallic Al. This result is in agreement
with the attribution reported by Maitra and Gupta for dendrites in a Fe-Al-Si ternary system
[29]. Furthermore, they also observed that these dendrites were not only composed by the t5
phase but also by the t6 phase (Fe2Al9Si2), crystallizing with needle or rod shapes around t5.
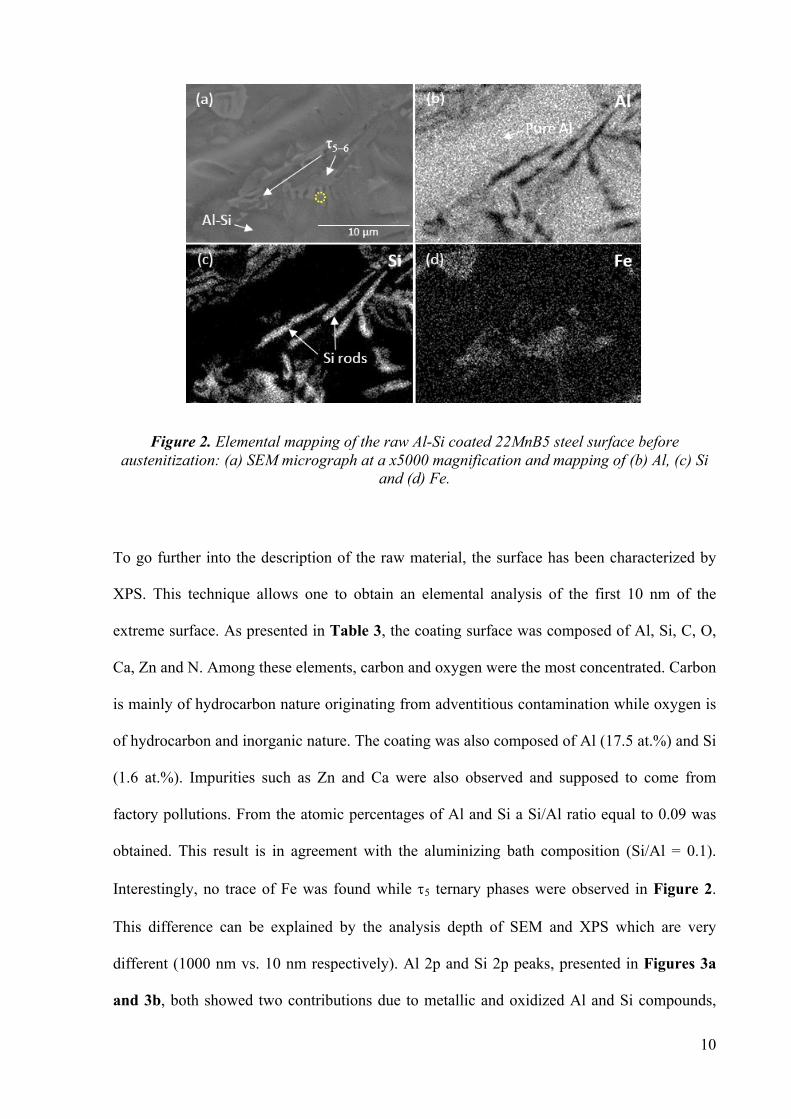
10
Figure 2. Elemental mapping of the raw Al-Si coated 22MnB5 steel surface before austenitization: (a) SEM micrograph at a x5000 magnification and mapping of (b) Al, (c) Si
and (d) Fe.
To go further into the description of the raw material, the surface has been characterized by
XPS. This technique allows one to obtain an elemental analysis of the first 10 nm of the
extreme surface. As presented in Table 3, the coating surface was composed of Al, Si, C, O,
Ca, Zn and N. Among these elements, carbon and oxygen were the most concentrated. Carbon
is mainly of hydrocarbon nature originating from adventitious contamination while oxygen is
of hydrocarbon and inorganic nature. The coating was also composed of Al (17.5 at.%) and Si
(1.6 at.%). Impurities such as Zn and Ca were also observed and supposed to come from
factory pollutions. From the atomic percentages of Al and Si a Si/Al ratio equal to 0.09 was
obtained. This result is in agreement with the aluminizing bath composition (Si/Al = 0.1).
Interestingly, no trace of Fe was found while t5 ternary phases were observed in Figure 2.
This difference can be explained by the analysis depth of SEM and XPS which are very
different (1000 nm vs. 10 nm respectively). Al 2p and Si 2p peaks, presented in Figures 3a
and 3b, both showed two contributions due to metallic and oxidized Al and Si compounds,
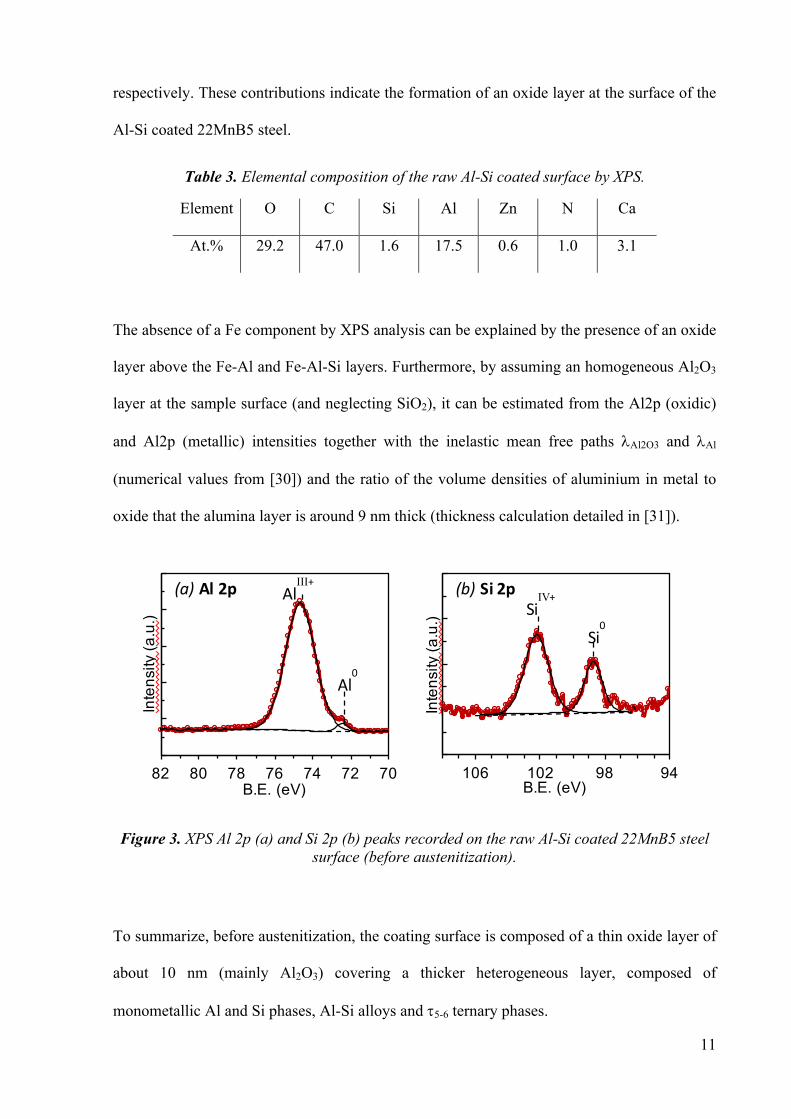
11
respectively. These contributions indicate the formation of an oxide layer at the surface of the
Al-Si coated 22MnB5 steel.
Table 3. Elemental composition of the raw Al-Si coated surface by XPS.
Element O C Si Al Zn N Ca
At.% 29.2 47.0 1.6 17.5 0.6 1.0 3.1
The absence of a Fe component by XPS analysis can be explained by the presence of an oxide
layer above the Fe-Al and Fe-Al-Si layers. Furthermore, by assuming an homogeneous Al2O3
layer at the sample surface (and neglecting SiO2), it can be estimated from the Al2p (oxidic)
and Al2p (metallic) intensities together with the inelastic mean free paths lAl2O3 and lAl
(numerical values from [30]) and the ratio of the volume densities of aluminium in metal to
oxide that the alumina layer is around 9 nm thick (thickness calculation detailed in [31]).
Figure 3. XPS Al 2p (a) and Si 2p (b) peaks recorded on the raw Al-Si coated 22MnB5 steel surface (before austenitization).
To summarize, before austenitization, the coating surface is composed of a thin oxide layer of
about 10 nm (mainly Al2O3) covering a thicker heterogeneous layer, composed of
monometallic Al and Si phases, Al-Si alloys and t5-6 ternary phases.
70727476788082
Inte
nsity
(a.u
.)
B.E. (eV)
(a)Al2p AlIII+
Al0
9498102106
Inte
nsity
(a.u
.)
B.E. (eV)
(b)Si2p
Si0
SiIV+
12
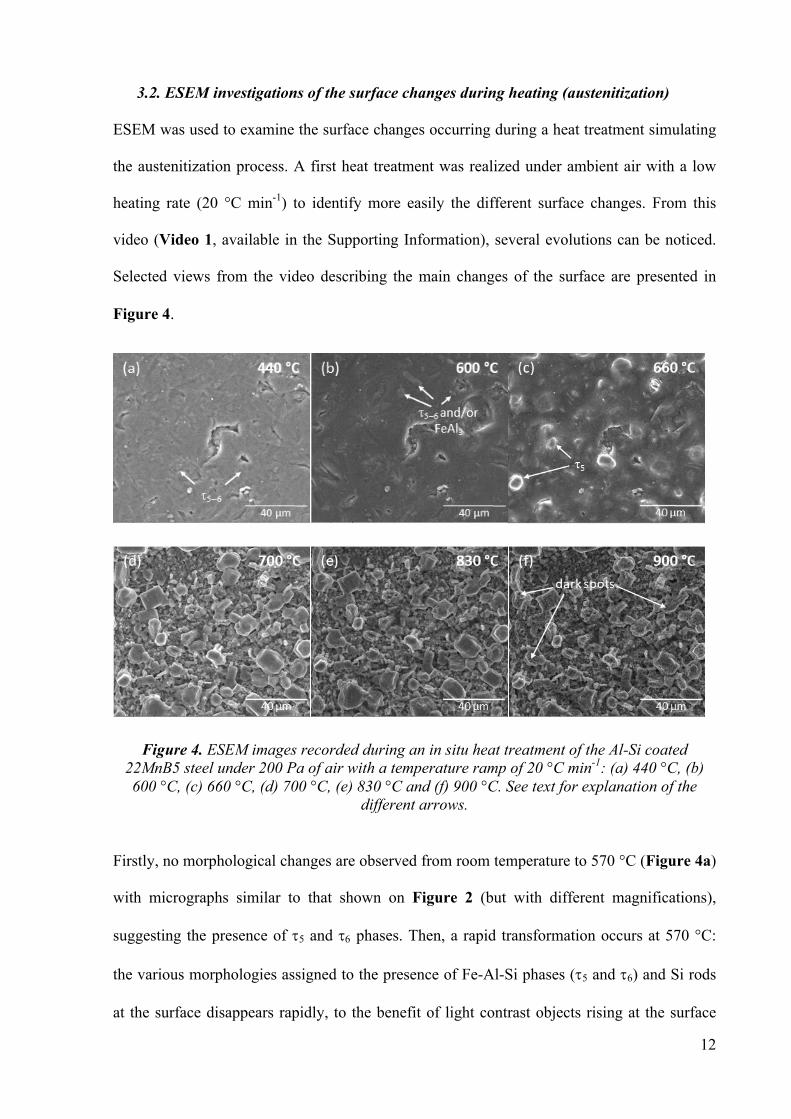
3.2. ESEM investigations of the surface changes during heating (austenitization)
ESEM was used to examine the surface changes occurring during a heat treatment simulating
the austenitization process. A first heat treatment was realized under ambient air with a low
heating rate (20 °C min-1) to identify more easily the different surface changes. From this
video (Video 1, available in the Supporting Information), several evolutions can be noticed.
Selected views from the video describing the main changes of the surface are presented in
Figure 4.
Figure 4. ESEM images recorded during an in situ heat treatment of the Al-Si coated 22MnB5 steel under 200 Pa of air with a temperature ramp of 20 °C min-1: (a) 440 °C, (b) 600 °C, (c) 660 °C, (d) 700 °C, (e) 830 °C and (f) 900 °C. See text for explanation of the
different arrows.
Firstly, no morphological changes are observed from room temperature to 570 °C (Figure 4a)
with micrographs similar to that shown on Figure 2 (but with different magnifications),
suggesting the presence of t5 and t6 phases. Then, a rapid transformation occurs at 570 °C:
the various morphologies assigned to the presence of Fe-Al-Si phases (t5 and t6) and Si rods
at the surface disappears rapidly, to the benefit of light contrast objects rising at the surface

13
(Figure 4b) that will be attributed to t5, t6 and FeAl3 phases in the next section. Some areas
of the surface also collapse, resulting in the formation of wide cavities (10 - 30 µm wide). By
increasing the temperature the entire surface changes, and the bright objects disappear
(between 600 and 620 °C), suggesting a melting reaction.
An important surface transformation takes place around 650 °C characterized by the melting
of the surface and the appearance of many structured elements, from hexagonal to rectangular
shape (Figure 4c) later assigned to t5 phase. This large transformation also reflects the
important formation of porosity and consequently the increase of specific surface area. At 700
°C, this transformation is finally over and the image in Figure 4d reveals elements of
different shapes and sizes. Among them, the presence of hexagonal and rectangular structures
can be underlined with sizes mostly ranging from 5 to 20 µm.
From 780 °C, the various surface structured elements and particularly the larger ones begin to
retract, leading to the appearance of many dark spots on the surface (Figure 4e). These spots,
smaller than 1 µm in diameter, appears not only on the hexagonal and rectangular structured
elements but also on the smallest objects in the background. When the temperature of 900 °C
is reached, dark spots are still appearing (Figure 4f) and expands over time, finally covering
an important part of the surface at the end of the heat treatment (after 5 min at 900 °C) with a
final diameter of about 1.5 – 2 µm.
The evolution reported above can be decomposed in four consecutive steps during the heat
treatment that can be associated to: (i) dissolution of ternary phases and Si rods starting at 570
°C (Step 1); (ii) surface liquefaction followed by formation of structured elements with
creation of roughness at 650 °C (Step 2); (iii) retraction of the structured elements at 780 °C
(Step 3) and (iv) formation of dark spots starting also at 780 °C (Step 4). Although the last
two transformations started at the same temperature, they did not end at the same temperature.
Indeed, the retraction of the structured elements stopped at 890 °C while the growth of the

14
dark spots continued until the end of the heat treatment. The possible explanation is that two
different phase transformations occur at the same time. This last step (Step 4) will be further
investigated in part 3.5.
Review of phase transformations. According to a phase transformation study realized by
Grigorieva et al. [6], three main reactions, selected form the Fe-Al-Si ternary phase diagram
established by Raynor and Rivlin [23], are occurring during austenitization of an Al-Si
coating. These three reactions ((1) to (3)) are listed below with their theoretical formation
temperature (see Table 2 for phase description):
At 577 °C: Al + Si + t6 → L (1) At 620 °C: t5 + Al → L + FeAl3 (2) At 855 °C: t5 → t2 + FeAl3 + L (3) Interestingly, one surface transformation observed with HT-ESEM (Video 1) is in good
agreement with one of the reaction temperatures listed above. According to reaction (1), the
first transformation recorded at 570 °C in the video should correspond to a reaction involving
Al, Si and t6, leading to their dissolution into a liquid phase. As a matter of fact, the FexAlySiz
phases and Si rods identified on the surface disappear at this temperature. However, in section
3.1, the FexAlySiz objects of dendritic shape were described as a mix of t5 and t6 while,
according to reaction (1), only t6 reacts with Al and Si at 577 °C. Consequently, the
appearance of the bright objects recorded just after the dendrites dissolution (Figure 4b)
could be attributed to the concentration of residual t5. This explanation is supported by the
fact that some of these bright objects disappear at 620 °C, which corresponds to the
temperature of reaction (2) involving t5 dissolution in Al matrix. However, some of the
objects appearing at 570 °C melt before reaching 620 °C (from 600 °C more exactly).
According, to Rivlin and Raynor [23], reaction (4) described below, can occur in this
temperature range.
At 615 °C: t6 + Al → t5 + L (4)

15
We can then conclude that the first step (at 570 °C) cannot be reduced to one reaction but may
result from the t6 progressive dissolution into Al, Si or Al-Si with formation of t5 and FeAl3.
According to reaction (2) at 620 °C, a reaction between the FexAlySiz phase t5 and metallic
aluminium causes a transformation into liquidus and the formation of FeAl3. At this
temperature, bright objects dissolution was recorded on Video 1. Even if no new phases that
could be attributed to FeAl3 were distinguished, the latter is still supposed to be present on the
surface.
As already described above, the second step leads to the most important surface
transformation at about 650 °C consisting in the dissolution of the entire surface with the
formation of structured elements. Such transformation is not consistent with any of the three
reactions reported by Grigorieva et al. [6] or with the other reactions from the Fe-Al-Si
ternary phase diagram. However, according to the Fe-Al binary phase diagram [19,32], FeAl3
dissolution into Al matrix occurs at 655 °C as described by reaction (5), and should explain
the important melting of the surface:
At 655 °C: FeAl3 + Al → L (5)
FeAl3 results from reaction (2) at 620 °C by t5 dissolution. Unfortunately, only liquid phase
results from the reaction, which cannot explain the formation of structured objects (hexagonal
or rectangular). It is interesting to note that among all the quoted phases in Table 2, the t5
ternary phase is the only one presenting a hexagonal crystal system. This phase can also
crystallize in the cubic system. Thus, it is possible to correlate the hexagonal and rectangular
structured elements present on the coating surface (Figure 4c) with a t5 ternary phase already
formed at 615 °C. Complementary Wavelength Dispersive Spectrometry (WDS)
characterizations of the coating surface were conducted after interrupting the heat treatment at
different temperatures. Note that cooling step was realized without control of the ramp, which
16
means that RT is rapidly reached. Moreover, no morphological changes were observed during
the cooling phase recorded by ESEM. Consequently, even if it could be possible that phase
transformations occur locally, it is believed that most of the chemical composition did not
change during cooling of the sample. The results conducted after interrupting the heat
treatment at 680 °C (see Figure S5) highlighted the presence of t5, t6, FeAl3 and liquidus at
the coating surface, thus confirming the reactions (1), (2), (4) and (5) discussed above
together with the assumption that no change occurred during cooling.
Regarding the third step of surface transformation (retraction) starting at 780 °C, the
temperature difference with reaction (3) is also too important to be correlated only with the
last of the main three invariant reactions reported by Grigorieva et al. [6]. Complementary
WDS characterizations were conducted after interrupting the heat treatment at 810 °C (see
Figure S6), namely before the reaction temperature of (3) (855°C). The results especially
highlighted the presence of t1 and t2 in addition to t5 and FeAl3 on the coating surface. The
formation of t1 (Al3Fe3Si2) and t2 (FeAl3Si) is interesting because of their higher iron content,
as compared to t5 and t6. Thus, their presence could be attributed to a progressive Fe-
enrichment of the t5 or t6 phases previously formed by iron dissolution from the steel to the
coating surface. Consequently, the beginning of the retraction step could be attributed to their
formation before reaction (3) involving t5 dissolution into t2, FeAl3 and liquidus.
After the retraction step, it is then supposed that the surface is mainly composed of t1 and t2
not reacting in this temperature range after being formed, and FeAl3. Note that according to
the binary Fe-Al phase diagram, once FeAl3 is formed a local enrichment of iron, caused by
its progressive diffusion into the coating at high temperature, can lead to its progressive
transformation into Fe2Al5, FeAl2 or FeAl with an increased Fe/Al ratio, such as previously
seen with t5 and t6 transformation into t1 and t2. Consequently, these last phases can also be
present at the surface at the end of the heat treatment.

17
The principal reason for the retraction of the different structures can be explained by
observing the densities of each compound (listed in Table 2). For example, the density of the
t5 phase is around 3.6 - 3.7 [8] while that of FeAl3 is near 3.8 [7]. Moreover, Fe2Al5 resulting
from the Fe enrichment of FeAl3 exhibits a higher density, near 4.1 [19,32]. Thus, the
transformation of the t5 structures into denser phases could be accompanied by a retraction as
observed in ESEM.
The previous discussion can be summarized in the Figure below (Figure 5) with all the
hypothesized phase transformations all along the four different steps described above that are
related to phase transformations. Stabilization periods are also shown, following the
dissolution and the structuration steps (Steps 1 and 2 respectively), and correspond to the
temperature range during which no transformation is observed at the surface.
Figure 5. Reactions and transformation steps occurring at the surface of an Al-Si coated 22MnB5 steel during a heat treatment under 200 Pa of air up to 900 °C with a temperature
ramp of 20 °C min-1.
3.3. Influence of the temperature rate on the surface morphology
In order to examine the influence of the heating rate on the surface composition and
morphology, five different tests were conducted under ambient air up to 900 °C. Heating rates
of 20, 50, 100, 200 (Videos 1 to 4, Supporting Information) and 400 °C min-1 were thus
compared during HT-ESEM experiments. At first sight, it can be concluded that the same

18
steps take place during heating. However, some important differences can be seen, such as the
final surface morphology or the temperature onsets and temperature ranges of the steps
occurring at the surface.
Figure 6 shows a comparison of the images of each surface obtained after heating at 900 °C,
with a temperature ramp between 20 and 400 °C min-1. Regarding the initial morphology
described in part 3.2 (Figure 6a, 20 °C min-1), an important evolution of the morphology was
observed by increasing the heating rate. With a heating rate of 50 °C min-1, the structured
elements at the surface were still hexagonal or rectangular but more rounded (Figure 6b) and
generally smaller, with a maximum diameter of 15 µm. As detailed in the previous part, the
hexagonal and rectangular structures are a consequence of t5 formation during heating and
consequently, an increased heating rate results in a decline of t5 structuration.
Figure 6. Influence of the heating rate on the surface morphology after heat treatments at 900°C of the Al-Si coated 22MnB5 steel under 200 Pa of air. Heating rates of (a) 20 °C min-1,
(b) 50 °C min-1, (c) 100 °C min-1, (d) 200 °C min-1 and (e) 400 °C min-1.
40µm
(a)
40µm
(b)
40µm
(c)
40µm
(d)
40µm
(e)
20°Cmin-1 50°Cmin-1 100°Cmin-1
200°Cmin-1 400°Cmin-1

19
By further increasing the heating rate (Figure 6c, 100 °C min-1), the surface appears
completely transformed after heating up to 900 °C. The structured elements at the surface are
no longer hexagonal or rectangular but rather needle-shaped. The absence of hexagonal and
rectangular structuration suggests that t5 ternary phase is not formed in important amounts
during structuration in this case. As mentioned by Maitra and Gupta [29], needle-shaped
structures can be related to the formation of FeAl3 or related compounds. Some wide cavities
evidenced by a dark contrast are also present, between the needles. By looking at Video 3
(100 °C min-1, Supporting Information), this important porosity appears between 820 and 850
°C during the heat treatment. When increasing the heating rate (200 and 400 °C min-1,
Figures 6d and 6e), the final surface (after completion of the heat treatment) appears still
composed of needle-shaped structures, but the needles decrease in number for the benefit of
areas without well-defined structures. By considering the contrast of the sample surfaces, it
seems that the needles lead to the protrusions of the surface while the poorly defined areas
define the valleys. It has to be underlined that the morphology of these final surfaces are very
similar to that obtained after a conventional (industrial) austenitization process (see Figure
S7). Hence, it can be concluded that the two samples shown on Figures 6d and 6e are
representative of real industrial conditions.
3.4. Correlation between surface morphology and phase transformations
In situ HT-ESEM experiments. Some temperature ranges related to the four transformation
steps (described in part 3.2) are shifted to the higher temperatures when increasing the
heating rate.
As for the first transformation step, starting with the Al, Si and t6 melting (reaction (1)), no
difference is observed since the temperatures recorded during the four tests are all included
between 560 and 570 °C.

20
On the contrary, a difference is observed for the second step (structuration of the surface)
since this step is shifted to higher temperatures by increasing the heating rate. For example,
this transformation step starts around 650 °C when the heating rate is equal to 20 °C min-1 and
shifts to 695 °C and 710 °C with ramps of 50 °C and 100 °C min-1 respectively. Moreover,
compared to the test achieved at 20 °C min-1, this step occurs over a longer temperature range
for higher heating rates. A summary of the different steps and their shift in temperature from
600 to 900 °C is given in Figure 7 along with the possible reactions involved (assigned from
the experiment realized at 20 °C min-1). Note that the dissolution step (Step 1, from 570 to
620 °C) is not detailed in the figure since no difference is observed by increasing the heating
rate.
Figure 7. Reactions and transformation steps as a function of the heating rate in the 600 – 900 °C range, as defined in Figure 5.
From that description, the period of stabilization decreases when increasing the heating rate,
as the structuration step is shifted to higher temperatures. With 100 and 200 °C min-1 heating

21
rates, no stabilization is observed, the structuration step and the final step occurring
successively. With increasing the heating rate, the transformation also shifts to higher
temperatures, from 785°C at 20 °C min-1 to 855 °C at 50 and 100 °C min-1 and 900 °C at 200
°C min-1. All these shifts in temperature cannot be related to a simple kinetic effect since the
onset of each step as well as the temperature ranges have no linear relationship with the
increase in temperature rate (see for example a similar retraction temperature for 50 and 100
°C min-1).
The different reactions possibly occurring in the 600 - 900 °C temperature region shown in
Figure 7 were already described in part 3.2, At a heating rate of 50 °C min-1, the
structuration step is shifted to higher temperature, starting near 700 °C. Thus, reaction (6)
(involving FeAl3 dissolution at 655 °C) is not predominant into the surface transformation. It
implies that FeAl3 was not concentrated at the surface, which could also be explained by less
t5 transformation into FeAl3 in reaction (2) at 620 °C and similarly less t6 transformation into
t5 in reaction (4) at 615 °C. In the 600 – 620 °C range, it can be noticed that less bright
objects appear at the surface (compare Video 2 to Video 1). Thus, the increase of the
temperature rate possibly results in less t6 dissolution which explains the temperature shift of
the structuration step. Contrary to the sample heated at 20 °C min-1, the retraction step finally
started with reaction (3) involving t5 transformation into t2, FeAl3 and L.
At 100 °C min-1, the structuration step starts at about the same temperature as in the test
performed at 50 °C min-1 but persisted longer. Moreover, Video 3 (100 °C min-1) shows an
evolution of surface morphology from t5 hexagonal structures (650 °C) to ill-defined needle-
shaped structures when reaching 800 °C. At 855 °C, the formation of long needles was clearly
identified resulting from FeAl3 formation (from reaction (3)). By increasing the temperature,
the surface structures keep changing in morphology probably caused by a Fe-enrichment of
the present phases. Finally, the retraction step was accompanied by a volume reduction of the

22
needles on the surface. Unfortunately, the low quality of the video obtained at a high heating
rate impedes a precise estimation of the temperature of dark spots appearance. In brief, at 100
°C min-1, reactions (4) and (5) are inhibited. The surface morphology mainly results of
reaction (3), leading to t2 and FeAl3 with needle-shaped structuration.
At 200 °C min-1, the structuration step is again shifted to higher temperatures, in comparison
with the three other tests. The surface structuration starts near 800 °C, probably with t5 and t6
Fe-enrichments leading to t1 and t2 formations. Near 850 °C in Video 4, the appearance of
needle-shaped structures (FeAl3, reaction (3)) is clearly visible. Then, the creation of an
important porosity starts and continues until 880 °C. Finally, the retraction step starts after
reaching the plateau of 900 °C probably with a Fe-enrichment of the present phases,
especially FeAl3.
To summarize, these results show that the increase of the heating rate causes an increase of
the temperature of surface structuration. Depending on this temperature and the associated
reactions, the surface morphology changes from t5 hexagonal and rectangular structures to
FeAl3 needle-shaped structures.
Ex situ characterizations. In order to better understand the surface morphology observed
after the heat treatments during the HT-ESEM experiments, the austenitized materials have
been characterized using ex situ characterization methods after sample cooling to room
temperature (5 min of dwell time).
XRD measurements were conducted on materials heated with temperature rates of 50 and 400
°C min-1 and the corresponding diffractograms are presented in Figure 8. The results show
that the two materials do not present exactly the same composition on surface, according to
distinct peaks observed in each X-ray diffractogram. Two phases are present on both surfaces:
Fe2Al5 (JCPDS 00-029-0043) and a FexAlySiz ternary phase. Regarding this last, an attribution

23
to t12 (Fe2Al3Si, JCPDS 04-011-4183) has been reported by Marker et al. [10]. They
hypothesized that this phase results from a solid-state reaction involving t1 and Fe2Al5.
Presence of Fe2Al5 is explained by transformation of FeAl3, mainly resulting from reaction (3)
at 855 °C. According to the binary Fe-Al phase diagram, Fe enrichment causes the
progressive FeAl3 → Fe2Al5 transformation. By increasing the austenitization time, an
increasing iron content could also lead to the Fe2Al5 transformation into Fe richer phases,
such as FeAl2 and FeAl [33].
Figure 8. XRD profiles of the Al-Si coated 22MnB5 steel, recorded after heat treatments up to 900 °C for 5 min under 200 Pa of air, with a heating rate of (a) 50 °Cmin-1 and (b) 400 °C min-1 (tests performed in the ESEM chamber)
At 50 °C min-1, the X-ray diffractogram is also composed of peaks from t1 ternary phase
(JCPDS 04-011-4183) and low intense peaks from FeAl3 binary phase (JCPDS 00-050-0797),
in agreement with the reactions discussed in part 3.2. Concerning the treatment performed at
400 °C min-1, a FexSiy phase is also identified, with a peak at 44.8°. This phase has been
previously identified by Allely et al. [34] as Fe3Si. This result is to take with caution because

24
this phase is often observed on the surface of samples having suffered from corrosion during
their storage. Hence, its formation may not have occurred during the heat treatment.
3D images of the surface of each sample were reconstructed for a x1000 magnification using
both tilted image series and the MeX software [28]. An image of the surface of the raw
material before the heat treatment was also reconstructed. The corresponding images are
presented in Figure 9 and accompanied by their surface roughness parameters.
8
6
4
2
0
-2
-4
µm
-6
18.9µm
(d)
25
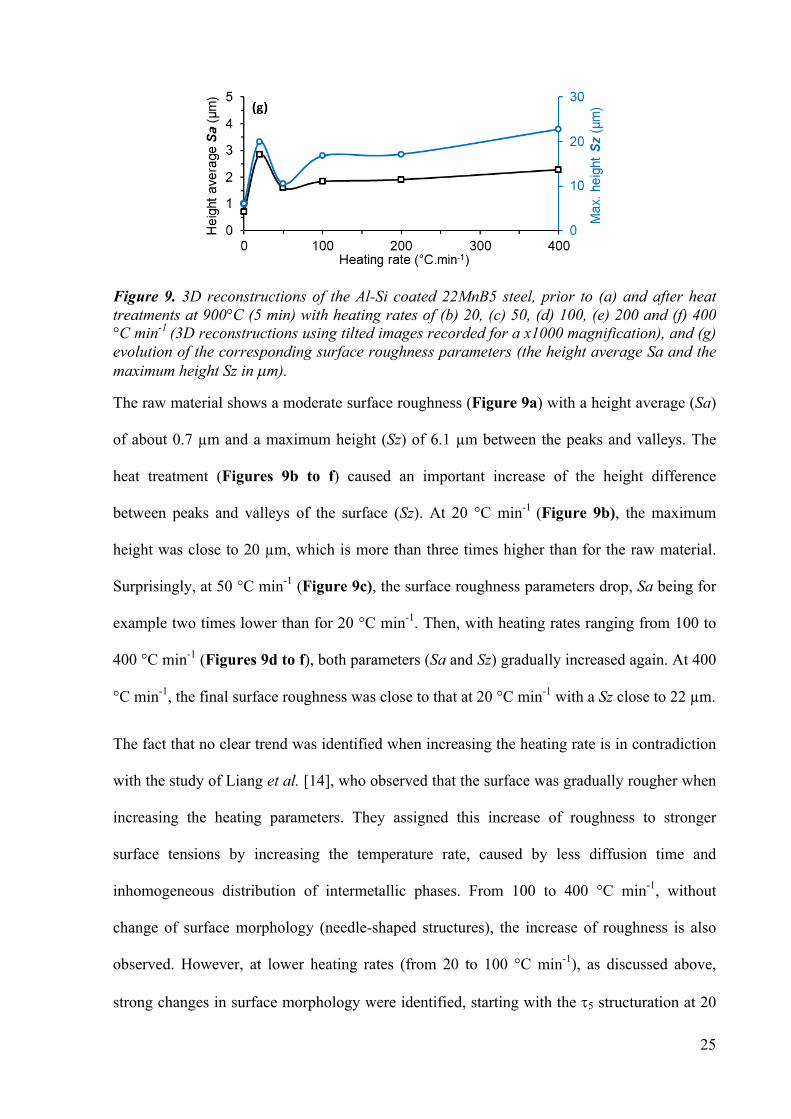
Figure 9. 3D reconstructions of the Al-Si coated 22MnB5 steel, prior to (a) and after heat treatments at 900°C (5 min) with heating rates of (b) 20, (c) 50, (d) 100, (e) 200 and (f) 400 °C min-1 (3D reconstructions using tilted images recorded for a x1000 magnification), and (g) evolution of the corresponding surface roughness parameters (the height average Sa and the maximum height Sz in µm).
The raw material shows a moderate surface roughness (Figure 9a) with a height average (Sa)
of about 0.7 µm and a maximum height (Sz) of 6.1 µm between the peaks and valleys. The
heat treatment (Figures 9b to f) caused an important increase of the height difference
between peaks and valleys of the surface (Sz). At 20 °C min-1 (Figure 9b), the maximum
height was close to 20 µm, which is more than three times higher than for the raw material.
Surprisingly, at 50 °C min-1 (Figure 9c), the surface roughness parameters drop, Sa being for
example two times lower than for 20 °C min-1. Then, with heating rates ranging from 100 to
400 °C min-1 (Figures 9d to f), both parameters (Sa and Sz) gradually increased again. At 400
°C min-1, the final surface roughness was close to that at 20 °C min-1 with a Sz close to 22 µm.
The fact that no clear trend was identified when increasing the heating rate is in contradiction
with the study of Liang et al. [14], who observed that the surface was gradually rougher when
increasing the heating parameters. They assigned this increase of roughness to stronger
surface tensions by increasing the temperature rate, caused by less diffusion time and
inhomogeneous distribution of intermetallic phases. From 100 to 400 °C min-1, without
change of surface morphology (needle-shaped structures), the increase of roughness is also
observed. However, at lower heating rates (from 20 to 100 °C min-1), as discussed above,
strong changes in surface morphology were identified, starting with the t5 structuration at 20

26
°C min-1. At 50 °C min-1, hexagonal and rectangular structures coming from t5 formation
were less structured than at 20 °C min-1. The 3D reconstruction (compare Figure 9b and 9c)
also underlines the genesis of needle-shaped structures at 50 °C min-1 between the valleys of
the surface. Then, by increasing the heating rate (100 °C min-1) this needle-shaped
structuration is more expressed, accompanied with an increase of the surface roughness.
Hence, the transition between the t5 (20 °C min-1) and FeAl3 (100 °C min-1) structurations
causes a decrease in surface roughness followed by an increase. In brief, these results show
that the heating rate is not the only parameter to take into account to predict the roughness of
an Al-Si surface after austenitization. The surface morphology is also a determining parameter
which can explain the non-linear evolution of surface roughness from 20 to 400 °C min-1.
3.5. Identification of dark contrast spots
In part 3.2 the appearance of dark spots at the surface has been noticed at the beginning of the
retraction step and these spots kept growing in width and densify at the surface until the end
of the heat treatment. These spots were found at the surface of each treated sample, whatever
the heating rate. In order to determine the origin, composition and structuration of the dark
spots, different characterizations were conducted.
Firstly, after a heat treatment at 200 °C min-1 up to 900°C, XPS analysis showed only Al 2p,
O 1s and C 1s peaks, while Si 2p was identified on the raw material (see part 3.1).
Interestingly, the XPS spectrum of the Al 2p photoelectron line (available in Supporting
Information, Figure S8) shows only one contribution at 74.8 eV, assigned to oxidized
aluminium which means that the surface is covered by an alumina layer with a thickness
exceeding the analysis depth of XPS (i.e. ~10 nm).
Second, elemental mapping of the surface was conducted with EDS coupled to SEM. Figure
10 shows the image of the surface obtained after a heat treatment at 200 °C min-1 up to 900°C
along with the elemental maps of Al, Si, O and Fe. Al, O and Fe are homogeneously
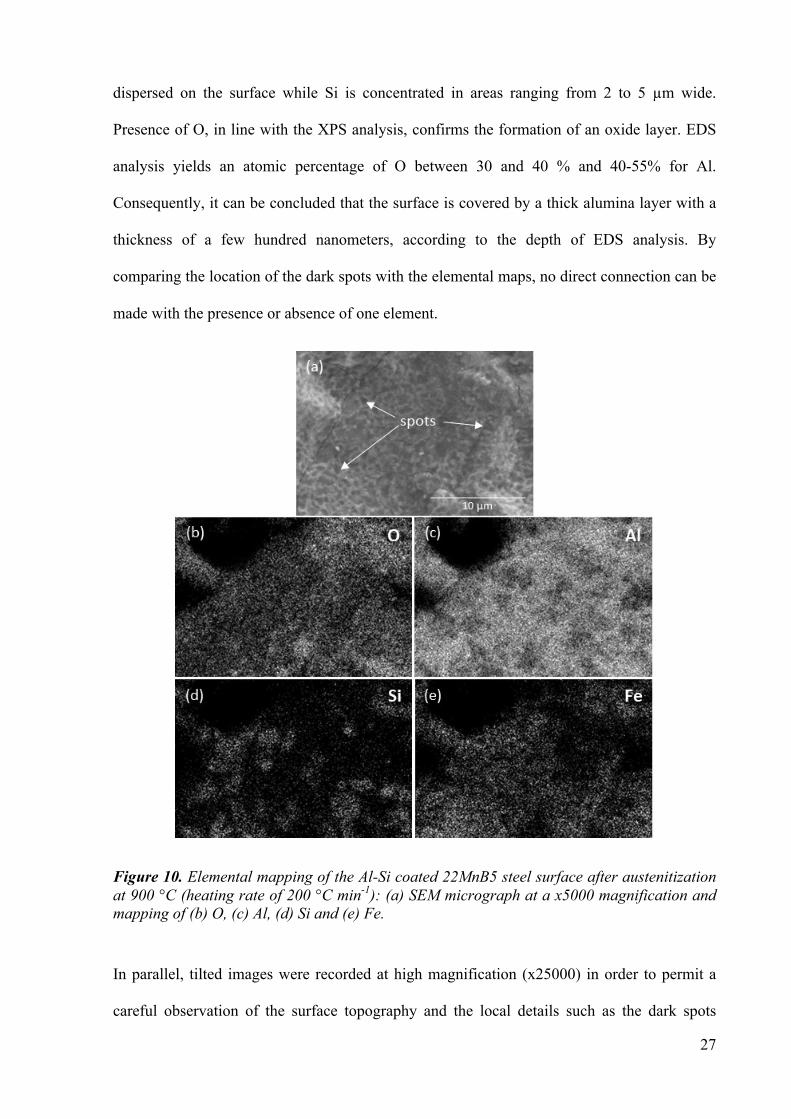
27
dispersed on the surface while Si is concentrated in areas ranging from 2 to 5 µm wide.
Presence of O, in line with the XPS analysis, confirms the formation of an oxide layer. EDS
analysis yields an atomic percentage of O between 30 and 40 % and 40-55% for Al.
Consequently, it can be concluded that the surface is covered by a thick alumina layer with a
thickness of a few hundred nanometers, according to the depth of EDS analysis. By
comparing the location of the dark spots with the elemental maps, no direct connection can be
made with the presence or absence of one element.
Figure 10. Elemental mapping of the Al-Si coated 22MnB5 steel surface after austenitization at 900 °C (heating rate of 200 °C min-1): (a) SEM micrograph at a x5000 magnification and mapping of (b) O, (c) Al, (d) Si and (e) Fe.
In parallel, tilted images were recorded at high magnification (x25000) in order to permit a
careful observation of the surface topography and the local details such as the dark spots

28
(Figures 11a and 11b, 50 °C min-1). This processing showed that the two dark spots crossed
by the red segment in Figure 11a are cavities of 1.1 – 1.2 µm diameter and 130 – 160 nm
depth. The micrometrics pores pointed by an arrow in Figure 11b are of the same dimension
(0.8 µm wide and 180 nm deep).
Figure 11. Tilted SEM images (a) and (b) (x25000 magnification, from two different
samples) of the Al-Si coated 22MnB5 steel surface recorded after austenitization at 900 °C
(heating rate of 50 °C min-1).
EDS analyses showed that a thick aluminium oxide layer is formed at the sample surface
while the pores are around 130 – 180 nm deep, which means that they are probably located in
the alumina layer. Secondary-Ion Mass Spectrometry (SIMS) analysis (results not shown)
confirmed that the oxide layer is between 150 and 200 nm thick.
In order to describe the structuration of the oxide layer that should be highly dependent on the
environment and heating conditions [35–37], in-plane GI-XRD measurements were recorded
to characterize the outermost part of the surface (less than 1 µm). Two X-ray diffractograms
are shown on Figure 12 for samples obtained after a classical treatment at 900 °C (heating
rate of 200 °C min-1, dwell time of 5 min) and after inserting the raw coated steel into a
muffle furnace preheated at 700 °C for 7 min. The goal is to compare the surface crystallinity
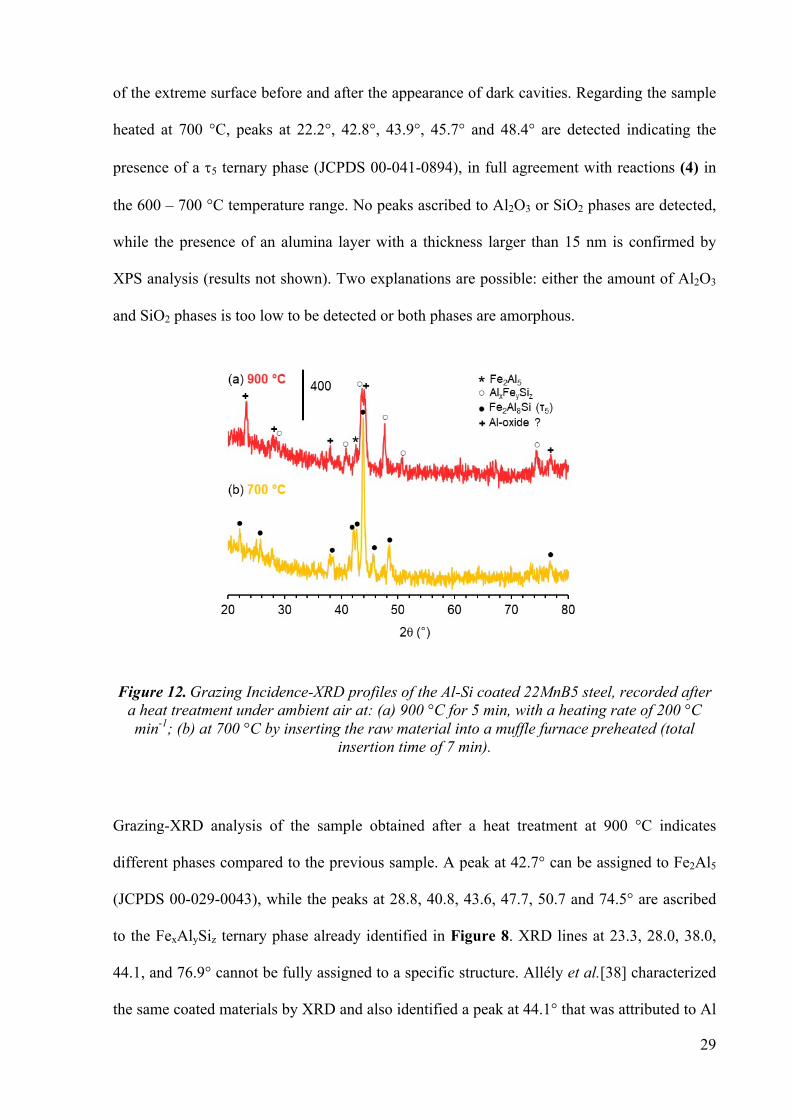
29
of the extreme surface before and after the appearance of dark cavities. Regarding the sample
heated at 700 °C, peaks at 22.2°, 42.8°, 43.9°, 45.7° and 48.4° are detected indicating the
presence of a t5 ternary phase (JCPDS 00-041-0894), in full agreement with reactions (4) in
the 600 – 700 °C temperature range. No peaks ascribed to Al2O3 or SiO2 phases are detected,
while the presence of an alumina layer with a thickness larger than 15 nm is confirmed by
XPS analysis (results not shown). Two explanations are possible: either the amount of Al2O3
and SiO2 phases is too low to be detected or both phases are amorphous.
Figure 12. Grazing Incidence-XRD profiles of the Al-Si coated 22MnB5 steel, recorded after a heat treatment under ambient air at: (a) 900 °C for 5 min, with a heating rate of 200 °C min-1; (b) at 700 °C by inserting the raw material into a muffle furnace preheated (total
insertion time of 7 min).
Grazing-XRD analysis of the sample obtained after a heat treatment at 900 °C indicates
different phases compared to the previous sample. A peak at 42.7° can be assigned to Fe2Al5
(JCPDS 00-029-0043), while the peaks at 28.8, 40.8, 43.6, 47.7, 50.7 and 74.5° are ascribed
to the FexAlySiz ternary phase already identified in Figure 8. XRD lines at 23.3, 28.0, 38.0,
44.1, and 76.9° cannot be fully assigned to a specific structure. Allély et al.[38] characterized
the same coated materials by XRD and also identified a peak at 44.1° that was attributed to Al
30
oxide and more precisely to a-Al2O3 (JCPDS 00-010-0173). However, as mentioned by the
authors, other characteristic peaks of a-Al2O3 were absent. In our case, peaks at 38.0 and
76.9° are very close to those expected for a-Al2O3 (37.8 and 76.9°) while peaks at 23.3 and
28.0° are shifted (25.6 and 35.2° for a-Al2O3). The fact that peaks are missing or shifted can
have several reasons: either the phase is not pure, or the lattice and the crystal structure are
altered by mechanical stress. Consequently, according to these results, the formation of a
crystallized surface layer close to a-Al2O3 is strongly assumed but Grazing-XRD cannot bring
a definitive answer. However, this hypothesis is also supported by the work of Kitajima et al.
[36] who demonstrated that a-Al2O3 layer can easily be formed on a Fe-Al alloy at 900 °C.
Classical XRD measurements on the same sample (Figure 8) did not permit identification of
a-Al2O3 which means that this phase is localised at the extreme surface (less than 1 µm deep)
and in a low amount. Moreover, this phase was only identified when the sample was heated to
900 °C. Consequently, a link between the formation of a surface a-Al2O3 phase and the
genesis of dark spots can be postulated.
To summarize, the dark spots appearing at the beginning of the retraction step (between
780 and 900 °C depending on temperature ramps) are micrometric pores (130 – 180 nm deep)
that are most probably a consequence of the progressive formation of crystallized alumina
(close to a-Al2O3) at the surface. This mechanism explains why these dark spots keep
growing with time, even if no phase transformation is occurring.
4. Conclusion
High-temperature Environmental SEM (HT-ESEM) investigation of the surface
transformation of an Al-Si coated 22MnB5 steel up to 900°C in ambient air shows that there

31
are three important temperature ranges linked to surface changes during austenitization. Near
570 °C, a first evolution is related to the dissolution of Al, Si and t6 phases into liquidus. A
second transformation takes place between 650 and 800 °C (according to the temperature
ramp) and is the most important in terms of final surface morphology. This evolution can be
rationalized with several reactions between ternary phases, binary FexAly phases and liquid
Al. Moreover, the type of reaction occurring is depending on the heating rate, which has a
drastic effect on the surface structuration and roughness. At low heating rates (≤ 50 °C min-1),
the surface at 900°C was mostly composed of hexagonal and rectangular elements coming
from t5 (Fe2Al8Si) structuration. At high heating rates (≥ 50 °C min-1) the surface at 900°C is
made of needle-shaped FeAl3 structures. Finally, the third and last surface transformation
takes place between 800 and 900 °C and is mainly explained by the transformation of the
previous surface phases into denser phases, resulting in a retraction of the structures present at
the surface. In parallel, the identification of dark spots appearing at the end of the heating step
at 900°C, could be attributed to the formation of crystallized a-Al2O3 leading to the genesis of
cavities and opening a porosity in the surface of the coated steel. The use of HT-ESEM proves
to be a powerful in situ tool to understand the surface transformations occurring on the surface
of Al-Si coatings. It has the advantage to yield a direct and fast correlation between the
temperature and a specific transformation, which is quite difficult to achieve using ex situ
characterization. Moreover, it allows one to identify rapid transformations such as those
occurring between 570 and 600 °C that would otherwise have been difficult to observe.
Acknowledgements
The Hitachi SU-70 SEM-FEG microscope was financially supported by the C’Nano
consortium of the Région Ile-de-France and IMPC FR2482 (Institut des Matériaux de Paris
Centre). S. Casale (Sorbonne Université) is warmly thanked for her assistance in performing

32
ex situ SEM measurements. Mohamed Selmane and Nicolas Casaretto (Sorbonne Université)
are also acknowledged for their help in XRD analysis.
Data availability
The raw data required to reproduce these findings (video) are available from the supporting
information section.

33
References [1] H. Karbasian, A.E. Tekkaya, A review on hot stamping, J. Mater. Process. Technol. 210
(2010) 2103–2118. https://doi.org/10.1016/j.jmatprotec.2010.07.019. [2] K. Mori, P.F. Bariani, B.-A. Behrens, A. Brosius, S. Bruschi, T. Maeno, M. Merklein, J.
Yanagimoto, Hot stamping of ultra-high strength steel parts, CIRP Ann. 66 (2017) 755–777. https://doi.org/10.1016/j.cirp.2017.05.007.
[3] J.N. Rasera, K.J. Daun, C.J. Shi, M. D’Souza, Direct contact heating for hot forming die quenching, Appl. Therm. Eng. 98 (2016) 1165–1173. https://doi.org/10.1016/j.applthermaleng.2015.12.142.
[4] T. Taylor, A. Clough, Critical review of automotive hot-stamped sheet steel from an industrial perspective, Mater. Sci. Technol. 34 (2018) 809–861. https://doi.org/10.1080/02670836.2018.1425239.
[5] D.W. Fan, B.C. De Cooman, State-of-the-Knowledge on Coating Systems for Hot Stamped Parts, Steel Res. Int. 83 (2012) 412–433. https://doi.org/10.1002/srin.201100292.
[6] R. Grigorieva, P. Drillet, J.M. Mataigne, A. Redjaïmia, Phase Transformations in the Al-Si Coating during the Austenitization Step, Solid State Phenom. 172–174 (2011) 784–790. https://doi.org/10.4028/www.scientific.net/SSP.172-174.784.
[7] P.J. Black, The structure of FeAl 3 . I, Acta Crystallogr. 8 (1955) 43–48. https://doi.org/10.1107/S0365110X5500011X.
[8] R.N. Corby, P.J. Black, The structure of α-(AlFeSi) by anomalous-dispersion methods, Acta Crystallogr. Sect. B. 33 (1977) 3468–3475. https://doi.org/10.1107/S0567740877011224.
[9] C. Georges, T. Sturel, P. Drillet, J.-M. Mataigne, Absorption/Desorption of Diffusible Hydrogen in Aluminized Boron Steel, ISIJ Int. 53 (2013) 1295–1304. https://doi.org/10.2355/isijinternational.53.1295.
[10] M.C.J. Marker, B. Skolyszewska-Kühberger, H.S. Effenberger, C. Schmetterer, K.W. Richter, Phase equilibria and structural investigations in the system Al–Fe–Si, Intermetallics. 19 (2011) 1919–1929. https://doi.org/10.1016/j.intermet.2011.05.003.
[11] Daimler Chrysler, Typical hot-stamping lines, Automotive Symposium Cannes 2005. [12] C.-J. Wang, S.-M. Chen, The high-temperature oxidation behavior of hot-dipping Al–Si
coating on low carbon steel, Surf. Coat. Technol. 200 (2006) 6601–6605. https://doi.org/10.1016/j.surfcoat.2005.11.031.
[13] L. Pelcastre, J. Hardell, A. Rolland, B. Prakash, Influence of microstructural evolution of Al-Si coated UHSS on its tribological behaviour against tool steel at elevated temperatures, J. Mater. Process. Technol. 228 (2016) 117–124. https://doi.org/10.1016/j.jmatprotec.2015.03.009.
[14] W. Liang, W. Tao, B. Zhu, Y. Zhang, Influence of heating parameters on properties of the Al-Si coating applied to hot stamping, Sci. China Technol. Sci. 60 (2017) 1088–1102. https://doi.org/10.1007/s11431-016-0231-y.
[15] M. Windmann, A. Röttger, I. Hahn, W. Theisen, Mechanical properties of AlXFeY intermetallics in Al-base coatings on steel 22MnB5 and resulting wear mechanisms at press-hardening tool steel surfaces, Surf. Coat. Technol. 321 (2017) 321–327. https://doi.org/10.1016/j.surfcoat.2017.04.075.
[16] M. Windmann, A. Röttger, W. Theisen, Phase formation at the interface between a boron alloyed steel substrate and an Al-rich coating, Surf. Coat. Technol. 226 (2013) 130–139. https://doi.org/10.1016/j.surfcoat.2013.03.045.
[17] M. Guo, K. Gao, W. Wang, X. Wei, Microstructural evolution of Al-Si coating and its influence on high temperature tribological behavior of ultra-high strength steel against H13 steel, J. Iron Steel Res. Int. 24 (2017) 1048–1058. https://doi.org/10.1016/S1006-706X(17)30152-8.

34
[18] J.-P. Laurent, J.-P. Hennechart, D. Spehner, J. Devroc, Coated hot- and cold-rolled steel sheet comprising a very high resistance after thermal treatment, US6296805B1, 2001. https://patents.google.com/patent/US6296805B1/en?oq=FR2780984 (accessed July 18, 2018).
[19] B. Sundman, I. Ohnuma, N. Dupin, U.R. Kattner, S.G. Fries, An assessment of the entire Al–Fe system including D03 ordering, Acta Mater. 57 (2009) 2896–2908. https://doi.org/10.1016/j.actamat.2009.02.046.
[20] V.I. Dybkov, V.P. Dybkov, Growth Kinetics of Chemical Compound Layers, Cambridge Int Science Publishing, 1998.
[21] U. Burkhardt, Y. Grin, M. Ellner, K. Peters, Structure refinement of the iron–aluminium phase with the approximate composition Fe2Al5, Acta Crystallogr. Sect. B. 50 (1994) 313–316. https://doi.org/10.1107/S0108768193013989.
[22] N. Krendelsberger, F. Weitzer, J.C. Schuster, On the Reaction Scheme and Liquidus Surface in the Ternary System Al-Fe-Si, Metall. Mater. Trans. A. 38 (2007) 1681–1691. https://doi.org/10.1007/s11661-007-9182-x.
[23] V.G. Rivlin, G.V. Raynor, 4: Critical evaluation of constitution of aluminium-iran-silicon system, Int. Met. Rev. 26 (1981) 133–152. https://doi.org/10.1179/imtr.1981.26.1.133.
[24] G. Shao, Y. Gao, X.H. Xia, M. Milosavljević, Crystallographic characteristics and fine structures of semiconducting transition metal silicides, Thin Solid Films. 519 (2011) 8446–8450. https://doi.org/10.1016/j.tsf.2011.05.036.
[25] J.H. Scofield, Hartree-Slater subshell photoionization cross-sections at 1254 and 1487 eV, J. Electron Spectrosc. Relat. Phenom. 8 (1976) 129–137. https://doi.org/10.1016/0368-2048(76)80015-1.
[26] R. Podor, D. Pailhon, J. Ravaux, H.-P. Brau, Development of an Integrated Thermocouple for the Accurate Sample Temperature Measurement During High Temperature Environmental Scanning Electron Microscopy (HT-ESEM) Experiments, Microsc. Microanal. 21 (2015) 307–312. https://doi.org/10.1017/S1431927615000252.
[27] C.A. Schneider, W.S. Rasband, K.W. Eliceiri, NIH Image to ImageJ: 25 years of Image Analysis, Nat. Methods. 9 (2012) 671–675.
[28] M. Pirisinu, V. Mazzarello, 3D profilometric characterization of the aged skin surface using a skin replica and alicona Mex software, Scanning. 38 (n.d.) 213–220. https://doi.org/10.1002/sca.21256.
[29] T. Maitra, S.P. Gupta, Intermetallic compound formation in Fe–Al–Si ternary system: Part II, Mater. Charact. 49 (2002) 293–311. https://doi.org/10.1016/S1044-5803(03)00005-6.
[30] S. Tanuma, C.J. Powell, D.R. Penn, Calculations of electron inelastic mean free paths for 31 materials, Surf. Interface Anal. 11 (1988) 577–589. https://doi.org/10.1002/sia.740111107.
[31] B.R. Strohmeier, An ESCA method for determining the oxide thickness on aluminum alloys, Surf. Interface Anal. 15 (1990) 51–56. https://doi.org/10.1002/sia.740150109.
[32] X. Li, A. Scherf, M. Heilmaier, F. Stein, The Al-Rich Part of the Fe-Al Phase Diagram, J. Phase Equilibria Diffus. 37 (2016) 162–173. https://doi.org/10.1007/s11669-015-0446-7.
[33] M. Windmann, A. Röttger, W. Theisen, Formation of intermetallic phases in Al-coated hot-stamped 22MnB5 sheets in terms of coating thickness and Si content, Surf. Coat. Technol. 246 (2014) 17–25. https://doi.org/10.1016/j.surfcoat.2014.02.056.
[34] N.R. Baldwin, D.G. Ivey, Iron slicide formation in bulk iron-silicon diffusion couples, J. Phase Equilibria. 16 (1995) 300–307. https://doi.org/10.1007/BF02645285.
[35] A. Boumaza, L. Favaro, J. Lédion, G. Sattonnay, J.B. Brubach, P. Berthet, A.M. Huntz, P. Roy, R. Tétot, Transition alumina phases induced by heat treatment of boehmite: An

35
X-ray diffraction and infrared spectroscopy study, J. Solid State Chem. 182 (2009) 1171–1176. https://doi.org/10.1016/j.jssc.2009.02.006.
[36] Y. Kitajima, S. Hayashi, T. Nishimoto, T. Narita, S. Ukai, Rapid Formation of α-Al2O3 Scale on an Fe–Al Alloy by Pure-Metal Coatings at 900 °C, Oxid. Met. 73 (2010) 375–388. https://doi.org/10.1007/s11085-009-9184-8.
[37] S.R.J. Saunders, M. Monteiro, F. Rizzo, The oxidation behaviour of metals and alloys at high temperatures in atmospheres containing water vapour: A review, Prog. Mater. Sci. 53 (2008) 775–837. https://doi.org/10.1016/j.pmatsci.2007.11.001.
[38] C. Allély, L. Dosdat, O. Clauzeau, K. Ogle, P. Volovitch, Anticorrosion mechanisms of aluminized steel for hot stamping, Surf. Coat. Technol. 238 (2014) 188–196. https://doi.org/10.1016/j.surfcoat.2013.10.072.