Embed Size (px)
Citation preview
Abstract— The joint application of a cell pressure probe (PP)
and a UV-matrix-assisted laser desorption/ionization time of flight (UV-MALDI-TOF) mass spectrometer was used for picoliter sampling and shotgun metabolite profiling of in situ living single cells of plants. Plant cell wall and plasma membrane properties and water relations of in situ living single cells can be analyzed before sampling the cell sap. With different organic compounds and nanoparticles as UV-MALDI matrix, metabolites from neutral carbohydrates to amino acids and secondary other metabolites can be detected through UV-MALDI-TOF mass spectrometry analyses of picoliter single-cell samples.
Index Terms— metabolomics, nanoparticles, plant cell, shotgun metabolite profiling, UV-MALDI-TOF
I. INTRODUCTION
ODERN biology research focus is moving from classical organ and tissue-level analyses to single cells,
where very fundamental events of life happen. Therefore, omics analyses with the single-cell resolution can explore basic aspects of life, cell to cell variations, primary responses to abiotic stresses or biotic attacks, and the processes of growth or death. For such a molecular analysis of single cells, a reliable access to the cell solution, the sampling in real time, and a strong detection power are critical. In this context, methodologies for single-cell omics analyses have been being developed for high-throughput exploration of biomolecules. Instrumentation and data processing for genomics and proteomics analyses of cells seem to be well-established [1]. Metabolomics based on soft ionization mass spectrometry methods as the frontier of omics sciences is, however, emerging and it demands for both methods and detection power [2]. Currently, for a higher resolution, versatility, a wide detection, and the structure elucidation and higher sensitivity, mass spectrometry is the top candidate.
Manuscript received March 3, 2012; revised April 4, 2012. This work was
supported in part by Grant-in-Aid (S) from the Japan Society for the Promotion of Science (JSPS) for Scientific Research (20228004).
Rosa Erra-Balsells is with the Organic Chemistry Department-CIHIDECAR, University of Buenos Aires, 1428-Buenos Aires, Argentina (corresponding author, phone: +54-11-4576-3346; fax: +54-11-4576-3346; e-mail: [email protected]).
Yousef Gholipour is with the Department of Biomechanical Systems, Faculty of Agriculture, Ehime University, 3-5-7 Tarumi, Matsuyama 780-8566, Japan (e-mail: [email protected]).
Hiroshi Nonami is with the Department of Biomechanical Systems, Faculty of Agriculture, Ehime University, 3-5-7 Tarumi, Matsuyama 780-8566, Japan (e-mail: [email protected]).
In vitro cell solution analysis on which some single-cell omics analyses are based includes cell lysis, homogenization, centrifugation and some purification steps. In this approach a number of cells are included for each analysis which provides sub-nanoliter analyte solutions. The result is an averaged data reflecting metabolite profiles of a few cells [3] – [5]. A second approach, in situ single-cell analysis, is based on a direct, real time sampling of intact cells followed by the metabolite profiling of the cell sap sample. In the case of plant cells, femtoliter to nanoliter solution samples can be obtained. In this work, we describe in situ sampling processes of cell sap with a cell pressure probe, followed by UV-MALDI-TOF MS for cell metabolites analyses.
II. PROCEDURE FOR PRESSURE PROBE OPERATION
A. Instrument Setups
A cell pressure probe (PP) consists of a microcapillary connected to a pressure transducer (XTM-190M-100G, Kulite Semiconductor Products Inc., USA), a piezo motor (PM101 Märzhäuser Wetzlar, Germany) mounted on a 3D micro-manipulator, a motorized micrometer having a rotational metal rod, and its speed controller. The micro-capillary and the pressure transducer are connected with a silicon oil filled PEEK (polyether ether ketone) tube and a T-shaped metal connector. One side of the T-shaped connector is fit through a rubber seal together with the metal rod connected to the micrometer. The diameter of the rod is 0.4 mm. By rotating the micrometer with a speed-adjustable motor (Oriental Motor Co. LTD, Japan), changes in silicon oil volume in the pressure probe can be adjusted. To minimize the vibrations, PP and its accompanying instruments are placed on a magnetically-floated table. The capillary tip manipulation is accurately performed. The operation is monitored under a digital microscope (VHX-900 digital microscope, Keyence Co., Osaka, Japan) which facilitates recording the experiment and an online measurement of the sample volume. The pressure transducer is connected to a digital pressure display and a chart recorder. The pressure probing process is, therefore, monitored and recorded for further data analysis. Anatomy of the plant model is previously studied and hence, the location and the depth of the target cells are known. With a 3D manipulator the capillary tip is located and penetrated by pushing the tip into the tissue by the piezo-motor. The penetration depth can be monitored since a distance in the horizontal movement of
In Situ Pressure Probe Sampling of Single Cell Solution from Living Plants for Metabolite
Analyses with UV-MALDI MS
Rosa Erra-Balsells, Yousef Gholipour, and Hiroshi Nonami, Member, IAENG
M
Proceedings of the World Congress on Engineering 2012 Vol I WCE 2012, July 4 - 6, 2012, London, U.K.
ISBN: 978-988-19251-3-8 ISSN: 2078-0958 (Print); ISSN: 2078-0966 (Online)
WCE 2012
the probe tip is displayed in the controller of the piezo-motor. A premium ultramicrobalance (MSA2.7S-000-DM,
Sartorius AG, Germany), having 0.1 g accuracy was used to measure weight of a droplet of aqueous solution.
B. Materials and Preparations
2,4,6-Trihydroxyacetophenone (THAP) was purchased from Fluka (St. Gallen Buchs, Switzerland), -cyclodextrin, nor-harmane (nHo), and 2,5-dihydroxybenzoic acid (DHB) from Sigma-Aldrich (Tokyo, Japan), and multiwalled 10-30 nm carbon nanotubes (CNTs), mannitol, sucrose, and glucose from Wako Chemicals (Osaka, Japan). HPLC grade methanol (MeOH), ethanol (ETOH), chloroform (CHCl3), and acetone (Merck, Darmstadt, Germany) were used without further purification. Nanopowders of diamond (97% purity, <10-nm size and BET surface area 278-335 m2/g), TiSiO (99.8% purity, and <50-nm size), BaSrTiO ( 99.7% purity, <100-nm size), norHo, DHB, glucose, fructose (F1), and sucrose (F2) were purchased from Sigma-Aldrich Chemical Co., USA. Titanium dioxide (DP-25-nm diameter with ∼ 80% anatase and 20% rutile) was obtained from Evonik Degussa Corp., USA. Silver NPs (<20 nm) suspended in water were obtained from British Biocell International. Multiwalled 10-30-nm carbon nanotubes; fructans, including 1-kestose (>99% purity; triose; F3), nystose (>99% purity; tetraose; F4), and 1Ffructofuranosylnystose (>80% purity; pentaose; F5); and KCl were obtained from Wako Chemicals, Japan. Water with very low conductivity of Milli-Q grade that was purified at 56-59 nS/cm with a PURIC-S, (Orugano Co., Ltd., Tokyo, Japan) was used. Tulip (Tulipa gesneriana L.) bulbs were supplied by a local grower.
Saturated solution of THAP in acetone was prepared. DHB and nHo solutions were prepared by dissolving 4 mg of matrix in 2 L methanol/water 1:1 (vol/vol). CNTs were purified by successive rinsing–centrifuging with acetone and water/methanol, followed by suspending in water/methanol 1:9 (vol/vol). Aqueous solutions of 10 M standard glucose, sucrose, and -cyclodextrin were prepared, mixed with the matrix selected solution (1:3 vol/vol), and deposited on the probe for external calibration.
C. Mass Spectra Measurements
Mass spectra were obtained with an AB SCIEX TOF/TOFTM 5800 System (Framingham, MA 01701, USA) having a 349-nm Neodymium-doped yttrium lithium fluoride laser and a Voyager-DE STR time-of-flight mass spectrometer (Applied Biosystems, Foster City, CA) utilizing a 337-nm nitrogen laser with a 3-ns pulse width, delayed extraction in positive and negative ion modes and accelerating voltages of 20 kV. To obtain good resolution and signal-to noise (S/N) ratios, the laser power was adjusted to slightly above the threshold, and each mass spectrum was generated by averaging 100 lasers pulses per spot. Standard fructans were used for external calibration. Carbohydrate-related peaks detected by UV-MALDI-MS of extracts and tissues were verified by comparison with those from standard fructans and maltoses as well as by the fragmentation patterns obtained by MS/MS analysis in post
source decay (PSD) mode in Voyager-DE STR. All soluble samples were spotted on a 100-well gold plate
from Applied Biosystems. Matrix and sample applications were carried out using the dried-droplet method, in which 1.0 μL of the matrix solution is applied first and allowed to dry. Another 1.0 μL aliquot of the sample solution is then spotted on top of the matrix and air-dried.
Electrospray mass spectrometry (ESI MS) experiments were conducted on a Velos Orbitrap Pro (Thermo Fisher Scientific Inc., CA, USA).
D. Single-Cell Cytoplasm Extraction
Silicon oil is filled inside the microcapillary of the PP and also in the space between the capillary and the pressure sensor of the PP. When the capillary tip of the PP is inserted to a cell, a meniscus is formed by the boundary between the cell solution and the silicon oil in the capillary. A motorized metal rod of the PP can adjust the amount of volume in subpicoliter level so that the meniscus position can be manipulated accurately, because the silicon oil is incompressible under pressure applied by the movement of the metal rod inside the PP. The PP microcapillary tip (about 2.5 m o.d.) was penetrated into the intact over-rested single bulb scale and leaf stalk cells, with cell volumes of about 1 nL and 5 pL, respectively.
The pressure probe instrument and plant stands were placed on a magnetically floated vibration-free table (Magfloat; Sanaikogyo Co. Ltd.). Operation was monitored by an online stereomicroscopy system. By the meniscus management, cell wall elastic modulus [6], hydraulic conductivity [6] of plasma membrane, and the volume of the target cell [7] can be measured. A part of the cell solution sample inside the capillary tip can be transferred to a nanoliter cryo-osmometer plate [8]. Subsequently, osmotic potential of the cell is directly measured by a nanoliter cryo-osmometer (Clifton Instruments, USA). Water potential, a central concept in cell biology, is then uniquely calculated with a single-cell resolution (water potential is equal to the sum of turgor plus and osmotic potential) [8].
To diminish probable cell-to-cell variation among samples when different matrices were used, the tip was penetrated into the same place with a bit more penetration depth or with a small relocation to enter the tip into an adjacent cell to extract the sample for the next matrix. Consequently, four samples were collected for four matrices from the same or very nearby punctured location. In addition, sampling was repeated five times from different locations on a 10 × 10 mm2 area on the bulb surface and on a 2 × 4 mm2 on the leaf stalk, to collect a total of 20 samples from bulb and 20 from leaf. Each experiment was repeated three times, using different bulbs all kept under similar conditions (80% to 90% relative humidity, 5 °C). Turgor pressure caused the entering of 1–10 pL (varying with cell size, tissue type, and cell water status) of cell cytoplasm into the microcapillary. The tip was then inserted into a micropipette containing 0.5 L of water followed by transfer of extract into the pipette by applying positive pressure in the microcapillary.
Both water and oil are incompressible, and since the whole system from the pressure transducer to the capillary tip is air-tightly assembled, a sub-millibar change inside capillary
Proceedings of the World Congress on Engineering 2012 Vol I WCE 2012, July 4 - 6, 2012, London, U.K.
ISBN: 978-988-19251-3-8 ISSN: 2078-0958 (Print); ISSN: 2078-0966 (Online)
WCE 2012
tip is immediately sensed by the pressure transducer far from the capillary. On the other hand, pushing the rod inside the tubing tube by a micrometer connected to the speed-control motor correspondingly leads to a forward movement of silicon oil and a backward movement of cell solution. Since the diameter of the rod is 0.4 mm and the movement is nanometer-order, a sub-picoliter volume of oil or sample solution is conveniently handled: with each click on the speed adjustment buttons on the micrometer motor controller at the minimum speed, the rod is moved about 100 nm forward or backward. In practice, with the 0.2 mm radius of the rod and varying by the viscosity and the surface tension of aqueous standard or cell solutions,1-10 pL volume inside the tip can be handled. With some practices (and possibly with a long tip and smaller opening), an experimenter can take a femtoliter solution, as well. To do so, while sucking a
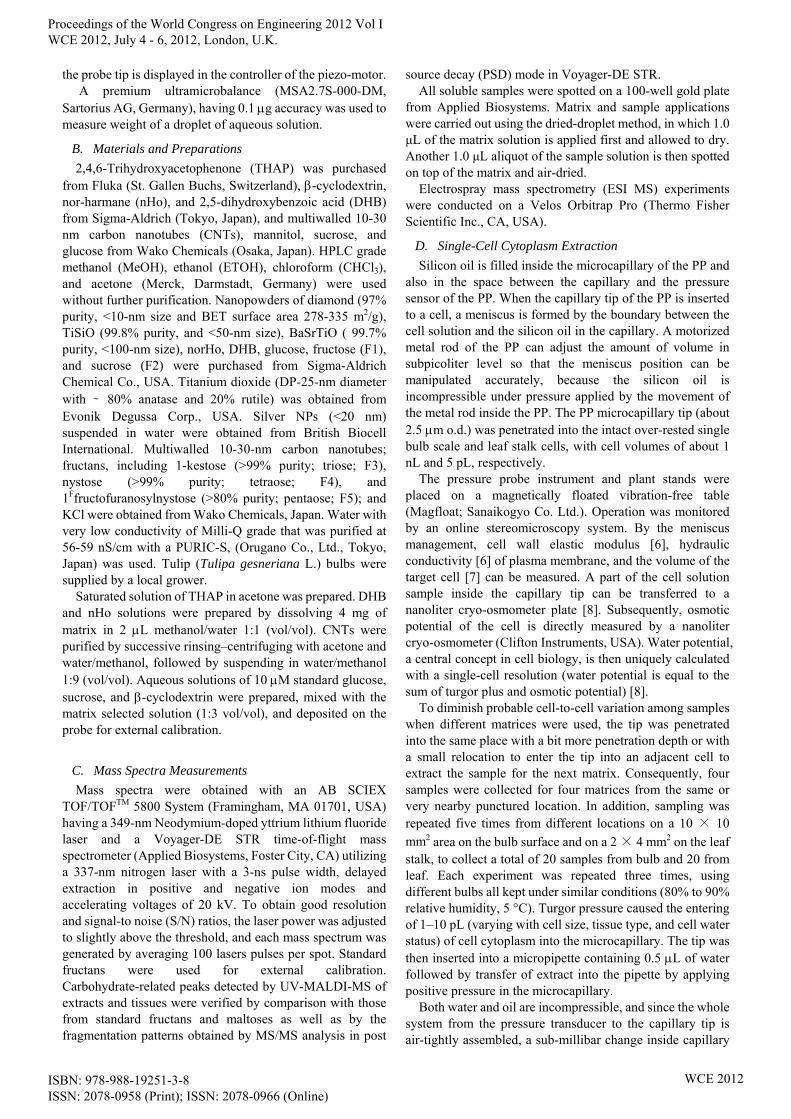
Fig. 1. (A) Photo of a capillary of the pressure probe which was inserted in a cell, having the meniscus between cell sap and the silicon oil. (B) Photo of the meniscus formed between the analyte solution and silicon oil in a capillary of the pressure probe. (C) Schematic illustration of changes in the radius, r(x), of the inner space in the capillary from the tip (i.e., l0) to the location of meniscus (i.e., ln) formed between cell sap and the silicon oil. See (1) and (2) which use the symbols and their definitions.
standard or cell solution into the capillary tip, the capillary is pulled out of the droplet quickly to capture a femtoliter volume of the solution inside the tip (Fig. 1B).
The volume of the cell sap inside the capillary tip (Fig. 1A) can be determined by measuring radius with respect to a distance from the tip up to the location of the meniscus as illustrated in Fig.1C. By balancing pressure inside the capillary against the atmospheric pressure, the surface tension at the tip can hold the cell sap in the capillary. The radius of the inner wall of the capillary (r(x)) can be expressed as a linear function of a distance (x) from the tip, and piecewise linear lines can be extended from the tip to the location of the meniscus between cell sap and silicon oil as shown in Fig. 1C; i.e.,
iiii
ii rlxll
rrxr
1
1)( (1)
where r(x) = r0 at l0; ln= distance at the position of the meniscus from the tip. The lines can be revolved around the x-axis, and the volume (V(x)) of cell sap in the capillary can be calculated as follows;
dxxrxVn
i
l
l
i
i
1
0
21
))(()( (2)
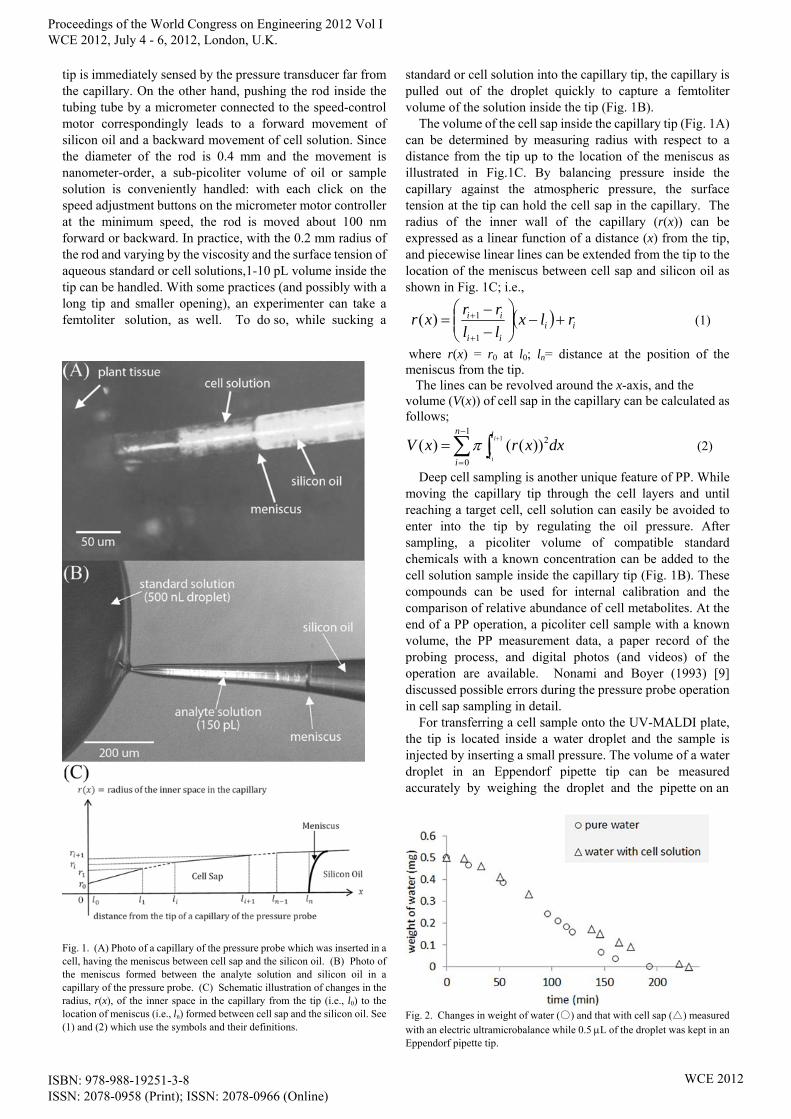
Deep cell sampling is another unique feature of PP. While moving the capillary tip through the cell layers and until reaching a target cell, cell solution can easily be avoided to enter into the tip by regulating the oil pressure. After sampling, a picoliter volume of compatible standard chemicals with a known concentration can be added to the cell solution sample inside the capillary tip (Fig. 1B). These compounds can be used for internal calibration and the comparison of relative abundance of cell metabolites. At the end of a PP operation, a picoliter cell sample with a known volume, the PP measurement data, a paper record of the probing process, and digital photos (and videos) of the operation are available. Nonami and Boyer (1993) [9] discussed possible errors during the pressure probe operation in cell sap sampling in detail. For transferring a cell sample onto the UV-MALDI plate, the tip is located inside a water droplet and the sample is injected by inserting a small pressure. The volume of a water droplet in an Eppendorf pipette tip can be measured accurately by weighing the droplet and the pipette on an
Fig. 2. Changes in weight of water (○) and that with cell sap (△) measured with an electric ultramicrobalance while 0.5 L of the droplet was kept in an Eppendorf pipette tip.
Proceedings of the World Congress on Engineering 2012 Vol I WCE 2012, July 4 - 6, 2012, London, U.K.
ISBN: 978-988-19251-3-8 ISSN: 2078-0958 (Print); ISSN: 2078-0966 (Online)
WCE 2012
electric ultramicrobalance with accuracy of 0.1 g, i.e., equivalent of 0.1 nL. The volume of the water droplet may influence the quality of sample on the plate; the localization of the sample after drying may change with small or big droplet deposited on a dried layer of matrix. The change in the volume of water droplet inside the pipette tip is negligible for about 10 minutes at room temperature (Fig. 2). On other hand, the whole process of transferring the sample into the water droplet and depositing a droplet of the mixture of the sample and the water droplet on a previously air-dried matrix layer on the plate is usually carried out within 1-3 minutes. We conveniently use 0.5 µl droplets for transferring cell samples (Figs. 1B and 2). Before UV-MALDI MS analyses, if necessary, a sample preparation step can be also added to the workflow.
III. UV-MALDI MS ANALYSES
Finding a proper matrix for a specific group of chemicals is a big challenge in UV-MALDI MS as since there are no clear criteria for the selection of the matrix and it is mostly empirical. In the shotgun metabolite profiling, a wide range of compounds from carbohydrates, amino acids, organic acids, secondary metabolites and fatty acids are examined. Even after sample purification and separation, diverse types of metabolites may still exist in the mixture. Furthermore, in the mass spectrometry-based, single-cell metabolomics the limit of detection and the need for the relative quantitation make the matrix challenge bigger. Among organic matrixes For UV-MALDI MS metabolite profiling of plant cell samples THAP and DHB have been commonly used. In the case of THAP, with an almost uniform deposition on the plate, the possibility of the co-existence of sample and matrix molecules in a location on the plate is quite high, compared to the DHB with an extremely localized crystallization. Additionally, more diverse metabolites can be detected with THAP. Another common matrix in UV-MALDI MS analyses, 3,5-dimethoxy-4-hydroxycinnamic acid (sinapinic acid), can be evaluated for its potential efficiency in single-cell metabolite analyses by UV-MALDI MS. We have examined [10] some common organic matrixes already introduced by other authors for UV-MALDI MS of biomolecules including 2,4,6-trihydroxyacetophenone (THAP) and 2,5-dihydroxybenzoic acid (DHB), as well as 9H-pyrido[3,4-b]indole (norHo) introduced and extensively studied its properties and applications by us [11], for their usefulness in plant single-cell metabolite profiling. Additionally, we have introduced a number of new matrixes for UV-MALDI MS metabolite profiling of plants including the nanoparticles (NPs) of titanium silicon oxide ((SiO2)(TiO2), barium strontium titanium oxide ((BaTiO3)(SrTiO3), titanium oxide (TiO2) and carbon nanotubes (CNTs) [12], [13]. Sugars including simple saccharides and fructans play important roles in plant cell growth and stress tolerance. Therefore, the availability of matrixes able to desorb/ionize these chemicals is quite helpful to plant physiology. Nanoparticles are powerful matrixes for UV-MALDI MS analyses of underivatized carbohydrates. Low limit of detection (LOD) and high linearity response of NPs make them a choice for detecting
(Figs. 3 and 4) and the quantifying underivatized carbohydrates with UV-MALDI MS (Fig. 4). In our UV-MALDI MS analyses of single-cell samples, for each sample spot on the plate, 15 tiles each 400×400 μm2, 10 at the edge and 5 at the center are determined. Each tile is shot with 400 laser pulses and is separately saved. Regarding the dimension and the distribution of dried cell sample on the plate and the size of the tile, it seems 1-2 tiles can be enough to localize all cell sample aggregates. Those mass spectra with cell metabolite signals are used for further analyses and reporting the experiment. Since the number of molecules of cell metabolites is in the range of attomoles to picomoles, therefore, after 400 laser shots, almost all of the cell metabolites located at irradiation area seem to desorb and ionize. Although still developing, some rich plant metabolite databases are available for comparing the exact mass values of putative metabolite signals. A network of plant metabolic databases (http://www.plantcyc.org/) has been established that contributes plant metabolome analyses by providing information about genes, enzymes, pathways and compounds. Signal assignment in our UV-MALDI MS analyses is based on several approaches including the exact mass value search, the elemental composition analysis, physiology information and the literature. Since the number of molecules of metabolites in a picoliter cell sample and consequently the signal abundance may not be high, a small part of the plant tissue where single-cell analyses are performed could be sampled, homogenized and its soluble compounds extracted for the MS/MS analysis of detected metabolites.
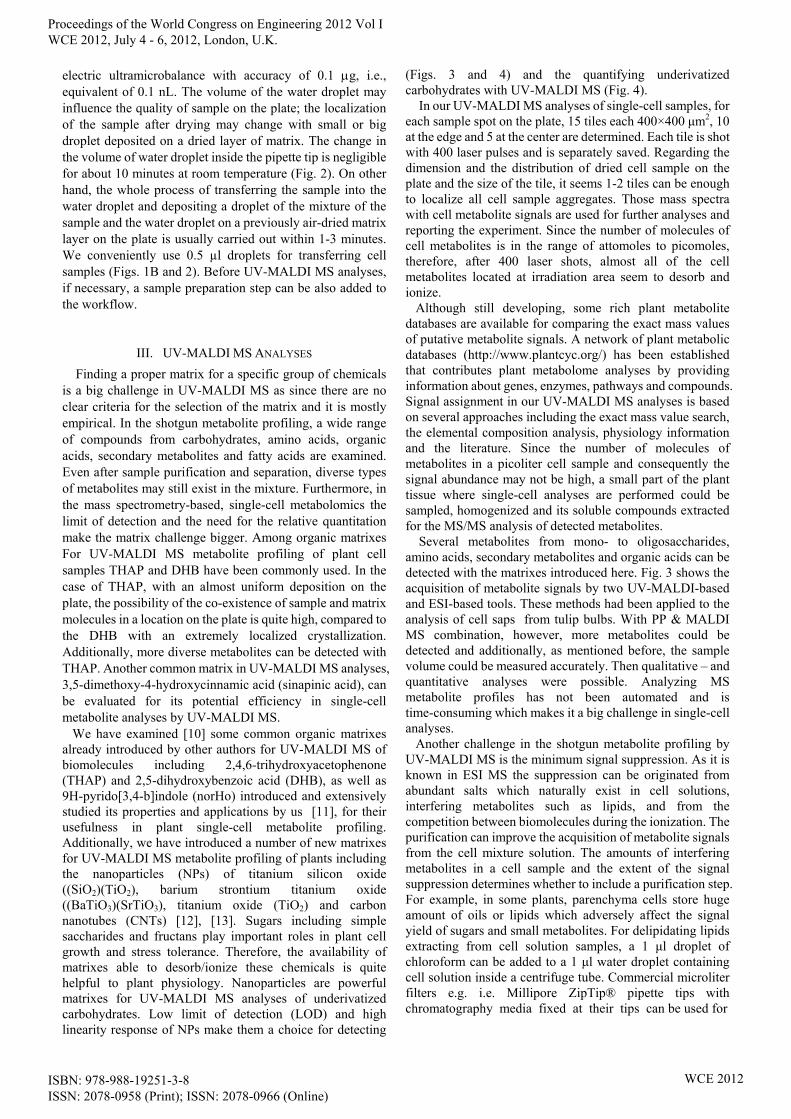
Several metabolites from mono- to oligosaccharides, amino acids, secondary metabolites and organic acids can be detected with the matrixes introduced here. Fig. 3 shows the acquisition of metabolite signals by two UV-MALDI-based and ESI-based tools. These methods had been applied to the analysis of cell saps from tulip bulbs. With PP & MALDI MS combination, however, more metabolites could be detected and additionally, as mentioned before, the sample volume could be measured accurately. Then qualitative – and quantitative analyses were possible. Analyzing MS metabolite profiles has not been automated and is time-consuming which makes it a big challenge in single-cell analyses. Another challenge in the shotgun metabolite profiling by UV-MALDI MS is the minimum signal suppression. As it is known in ESI MS the suppression can be originated from abundant salts which naturally exist in cell solutions, interfering metabolites such as lipids, and from the competition between biomolecules during the ionization. The purification can improve the acquisition of metabolite signals from the cell mixture solution. The amounts of interfering metabolites in a cell sample and the extent of the signal suppression determines whether to include a purification step. For example, in some plants, parenchyma cells store huge amount of oils or lipids which adversely affect the signal yield of sugars and small metabolites. For delipidating lipids extracting from cell solution samples, a 1 μl droplet of chloroform can be added to a 1 μl water droplet containing cell solution inside a centrifuge tube. Commercial microliter filters e.g. i.e. Millipore ZipTip® pipette tips with chromatography media fixed at their tips can be used for
Proceedings of the World Congress on Engineering 2012 Vol I WCE 2012, July 4 - 6, 2012, London, U.K.
ISBN: 978-988-19251-3-8 ISSN: 2078-0958 (Print); ISSN: 2078-0966 (Online)
WCE 2012
further single-cell sample preparations including concentrating, separating or desalting biomolecules. Single-cell solution preparations may result in the loss of the signal of less abundant metabolites and can reduce the signaling yield of underivatized sugars which usually ionize as the potassiated and sodiated cations in the positive ion mode. Therefore, preparations need to be carefully protocoled and are most useful to the targeted metabolite profiling. As it is known, the advantage of UV-MALDI MS is its robustness under high salt concentration.
Although the UV-MALDI technique is not necessarily a quantitation tool, signal abundance can be used, to some extents, to explore relative changes in the natural abundance of metabolites. THAP and metal nanoparticles (NPs) have
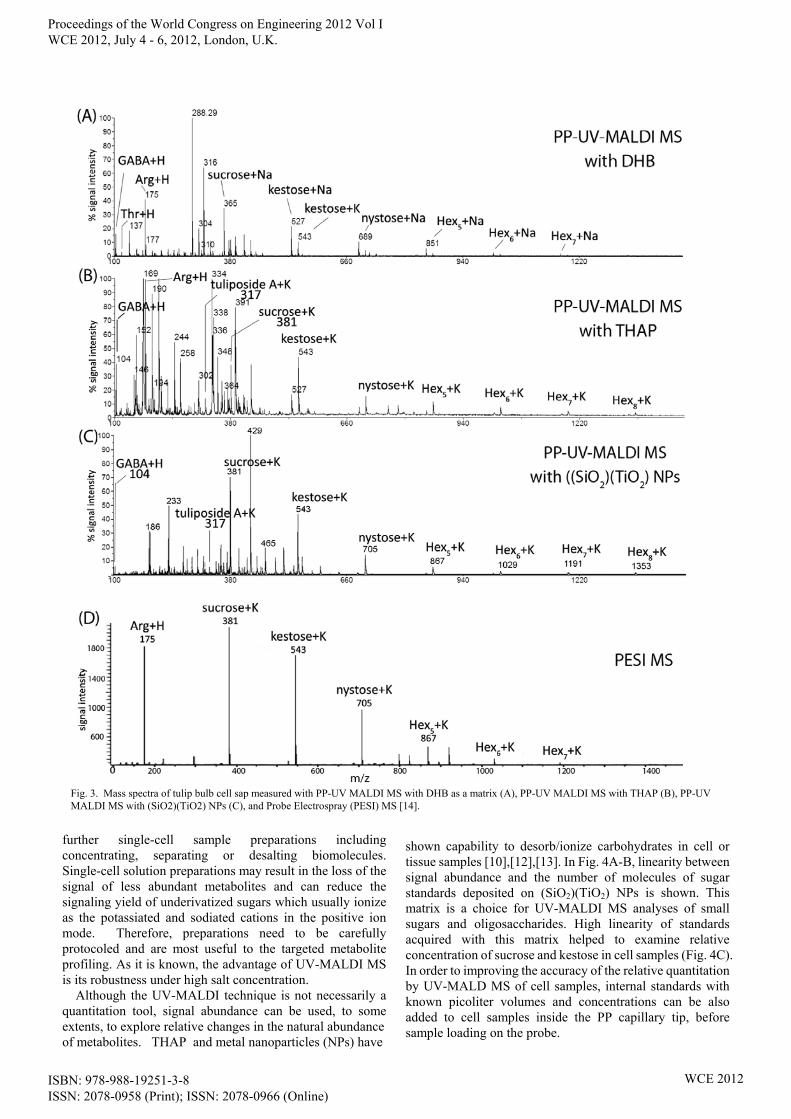
shown capability to desorb/ionize carbohydrates in cell or tissue samples [10],[12],[13]. In Fig. 4A-B, linearity between signal abundance and the number of molecules of sugar standards deposited on (SiO2)(TiO2) NPs is shown. This matrix is a choice for UV-MALDI MS analyses of small sugars and oligosaccharides. High linearity of standards acquired with this matrix helped to examine relative concentration of sucrose and kestose in cell samples (Fig. 4C). In order to improving the accuracy of the relative quantitation by UV-MALD MS of cell samples, internal standards with known picoliter volumes and concentrations can be also added to cell samples inside the PP capillary tip, before sample loading on the probe.
Fig. 3. Mass spectra of tulip bulb cell sap measured with PP-UV MALDI MS with DHB as a matrix (A), PP-UV MALDI MS with THAP (B), PP-UV MALDI MS with (SiO2)(TiO2) NPs (C), and Probe Electrospray (PESI) MS [14].
Proceedings of the World Congress on Engineering 2012 Vol I WCE 2012, July 4 - 6, 2012, London, U.K.
ISBN: 978-988-19251-3-8 ISSN: 2078-0958 (Print); ISSN: 2078-0966 (Online)
WCE 2012
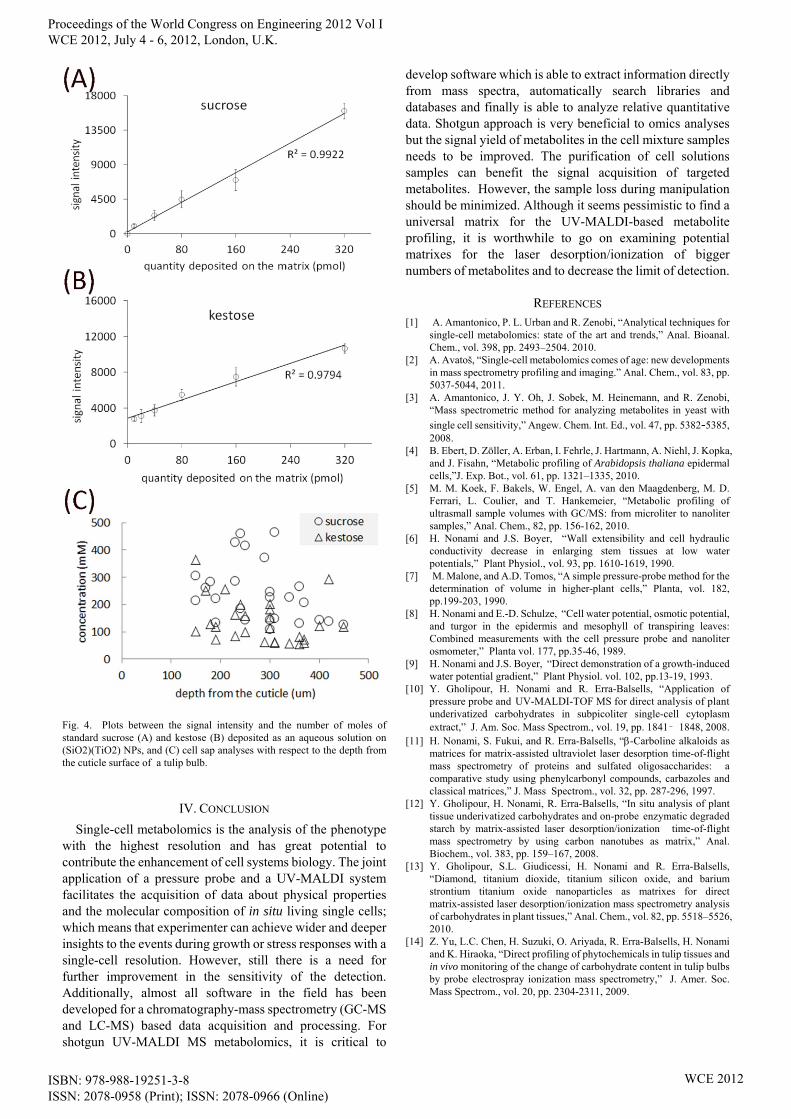
Fig. 4. Plots between the signal intensity and the number of moles of standard sucrose (A) and kestose (B) deposited as an aqueous solution on (SiO2)(TiO2) NPs, and (C) cell sap analyses with respect to the depth from the cuticle surface of a tulip bulb.
IV. CONCLUSION
Single-cell metabolomics is the analysis of the phenotype with the highest resolution and has great potential to contribute the enhancement of cell systems biology. The joint application of a pressure probe and a UV-MALDI system facilitates the acquisition of data about physical properties and the molecular composition of in situ living single cells; which means that experimenter can achieve wider and deeper insights to the events during growth or stress responses with a single-cell resolution. However, still there is a need for further improvement in the sensitivity of the detection. Additionally, almost all software in the field has been developed for a chromatography-mass spectrometry (GC-MS and LC-MS) based data acquisition and processing. For shotgun UV-MALDI MS metabolomics, it is critical to
develop software which is able to extract information directly from mass spectra, automatically search libraries and databases and finally is able to analyze relative quantitative data. Shotgun approach is very beneficial to omics analyses but the signal yield of metabolites in the cell mixture samples needs to be improved. The purification of cell solutions samples can benefit the signal acquisition of targeted metabolites. However, the sample loss during manipulation should be minimized. Although it seems pessimistic to find a universal matrix for the UV-MALDI-based metabolite profiling, it is worthwhile to go on examining potential matrixes for the laser desorption/ionization of bigger numbers of metabolites and to decrease the limit of detection.
REFERENCES [1] A. Amantonico, P. L. Urban and R. Zenobi, “Analytical techniques for
single-cell metabolomics: state of the art and trends,” Anal. Bioanal. Chem., vol. 398, pp. 2493–2504. 2010.
[2] A. Avatoš, “Single-cell metabolomics comes of age: new developments in mass spectrometry profiling and imaging.” Anal. Chem., vol. 83, pp. 5037-5044, 2011.
[3] A. Amantonico, J. Y. Oh, J. Sobek, M. Heinemann, and R. Zenobi, “Mass spectrometric method for analyzing metabolites in yeast with
single cell sensitivity,” Angew. Chem. Int. Ed., vol. 47, pp. 5382-5385, 2008.
[4] B. Ebert, D. Zöller, A. Erban, I. Fehrle, J. Hartmann, A. Niehl, J. Kopka, and J. Fisahn, “Metabolic profiling of Arabidopsis thaliana epidermal cells,”J. Exp. Bot., vol. 61, pp. 1321–1335, 2010.
[5] M. M. Koek, F. Bakels, W. Engel, A. van den Maagdenberg, M. D. Ferrari, L. Coulier, and T. Hankemeier, “Metabolic profiling of ultrasmall sample volumes with GC/MS: from microliter to nanoliter samples,” Anal. Chem., 82, pp. 156-162, 2010.
[6] H. Nonami and J.S. Boyer, “Wall extensibility and cell hydraulic conductivity decrease in enlarging stem tissues at low water potentials,” Plant Physiol., vol. 93, pp. 1610-1619, 1990.
[7] M. Malone, and A.D. Tomos, “A simple pressure-probe method for the determination of volume in higher-plant cells,” Planta, vol. 182, pp.199-203, 1990.
[8] H. Nonami and E.-D. Schulze, “Cell water potential, osmotic potential, and turgor in the epidermis and mesophyll of transpiring leaves: Combined measurements with the cell pressure probe and nanoliter osmometer,” Planta vol. 177, pp.35-46, 1989.
[9] H. Nonami and J.S. Boyer, “Direct demonstration of a growth-induced water potential gradient,” Plant Physiol. vol. 102, pp.13-19, 1993.
[10] Y. Gholipour, H. Nonami and R. Erra-Balsells, “Application of pressure probe and UV-MALDI-TOF MS for direct analysis of plant underivatized carbohydrates in subpicoliter single-cell cytoplasm extract,” J. Am. Soc. Mass Spectrom., vol. 19, pp. 1841– 1848, 2008.
[11] H. Nonami, S. Fukui, and R. Erra-Balsells, “-Carboline alkaloids as matrices for matrix-assisted ultraviolet laser desorption time-of-flight mass spectrometry of proteins and sulfated oligosaccharides: a comparative study using phenylcarbonyl compounds, carbazoles and classical matrices,” J. Mass Spectrom., vol. 32, pp. 287-296, 1997.
[12] Y. Gholipour, H. Nonami, R. Erra-Balsells, “In situ analysis of plant tissue underivatized carbohydrates and on-probe enzymatic degraded starch by matrix-assisted laser desorption/ionization time-of-flight mass spectrometry by using carbon nanotubes as matrix,” Anal. Biochem., vol. 383, pp. 159–167, 2008.
[13] Y. Gholipour, S.L. Giudicessi, H. Nonami and R. Erra-Balsells, “Diamond, titanium dioxide, titanium silicon oxide, and barium strontium titanium oxide nanoparticles as matrixes for direct matrix-assisted laser desorption/ionization mass spectrometry analysis of carbohydrates in plant tissues,” Anal. Chem., vol. 82, pp. 5518–5526, 2010.
[14] Z. Yu, L.C. Chen, H. Suzuki, O. Ariyada, R. Erra-Balsells, H. Nonami and K. Hiraoka, “Direct profiling of phytochemicals in tulip tissues and in vivo monitoring of the change of carbohydrate content in tulip bulbs by probe electrospray ionization mass spectrometry,” J. Amer. Soc. Mass Spectrom., vol. 20, pp. 2304-2311, 2009.
Proceedings of the World Congress on Engineering 2012 Vol I WCE 2012, July 4 - 6, 2012, London, U.K.
ISBN: 978-988-19251-3-8 ISSN: 2078-0958 (Print); ISSN: 2078-0966 (Online)
WCE 2012


![[Sucrose][Fructose] [H3P04= · quired fructose molecule could be produced from a second molecule of G-1-P by way of glucose-6-phos-phate (G-6-P) and fructose-6-phosphate (F-6-P) as](https://img.pdfslide.us/doc/110x75/5ec3bc19478bbc53f3182a8b/sucrosefructose-h3p04-quired-fructose-molecule-could-be-produced-from-a-second.jpg)