Embed Size (px)
Citation preview
In situ Measurement and Characterization of In situ Measurement and Characterization of Crystal Growth by X-ray Diffraction
Crystallization Monitoring Detlef BeckersDetlef BeckersCrystallization Monitoring –a QbD tool
Detlef BeckersDetlef Beckers,Klaus Bethke, PANalytical B.V. The NetherlandsThe Netherlands
1
This document was presented at PPXRD -Pharmaceutical Powder X-ray Diffraction Symposium
Sponsored by The International Centre for Diffraction Data
This presentation is provided by the International Centre for Diffraction Data in cooperation with the authors and presenters of the PPXRD symposia for the express purpose of educating the scientific community.
All copyrights for the presentation are retained by the original authors.
The ICDD has received permission from the authors to post this material on our website and make the material available for viewing. Usage is restricted for the purposes of education and scientific research.
ICDD Website - www.icdd.comPPXRD Website – www.icdd.com/ppxrd
Contents of presentation
• MotivationMotivation
• Experimental set-up
• In situ monitoring of DL-Alanine crystal growthg
• Crystal morphology investigation by CT
2
Crystallization monitoring: a key industry requirement
• Crystallization is always a key aspect of y y y p pharmaceutical manufacturing and development:
– Significant impact on the efficiency and profitability of the ll overall process
– Over 90% of all pharmaceutical products contain active ingredients produced in crystalline form
– Undetected fluctuations in the crystallization process can alter the crystal structure or stability, affecting the safety and the bioavailability of the product.a d t e b oa a ab ty o t e p oduct
– Failure to meet product specifications incurs significant costs
3
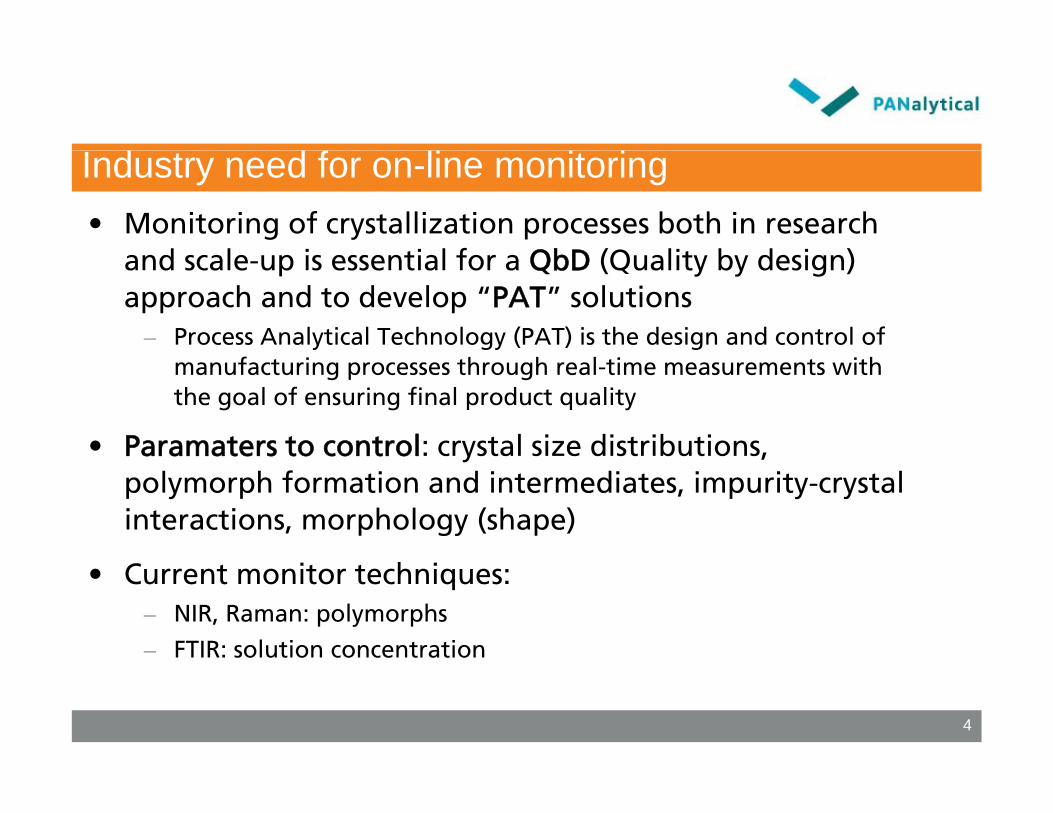
Industry need for on-line monitoring• Monitoring of crystallization processes both in research
d l i ti l f QbD (Q lit b d i ) and scale-up is essential for a QbD (Quality by design) approach and to develop “PAT” solutions
– Process Analytical Technology (PAT) is the design and control of manufacturing processes through real-time measurements with the goal of ensuring final product quality
• Paramaters to control: crystal size distributions, y , polymorph formation and intermediates, impurity-crystal interactions, morphology (shape)
• Current monitor techniques:– NIR, Raman: polymorphs
– FTIR: solution concentration
4
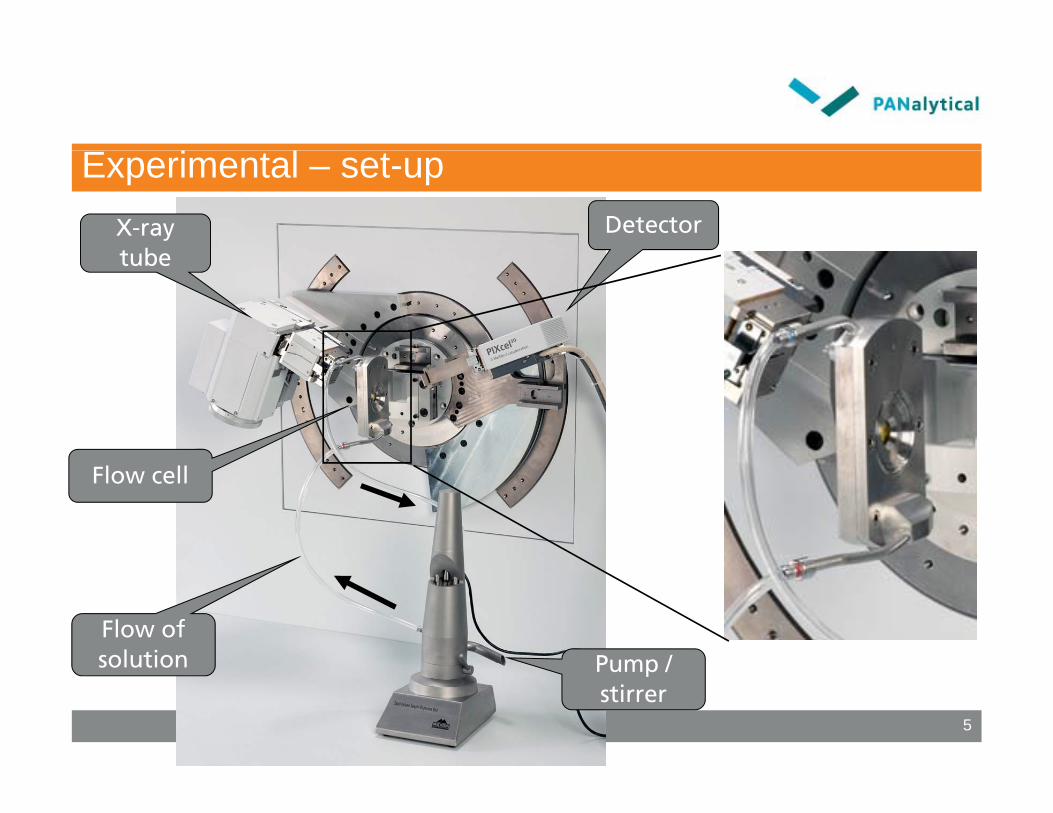
Experimental – set-upDetectorX-ray
t btube
Flow cell
Flow of solution Pump /
5
solution Pump / stirrer
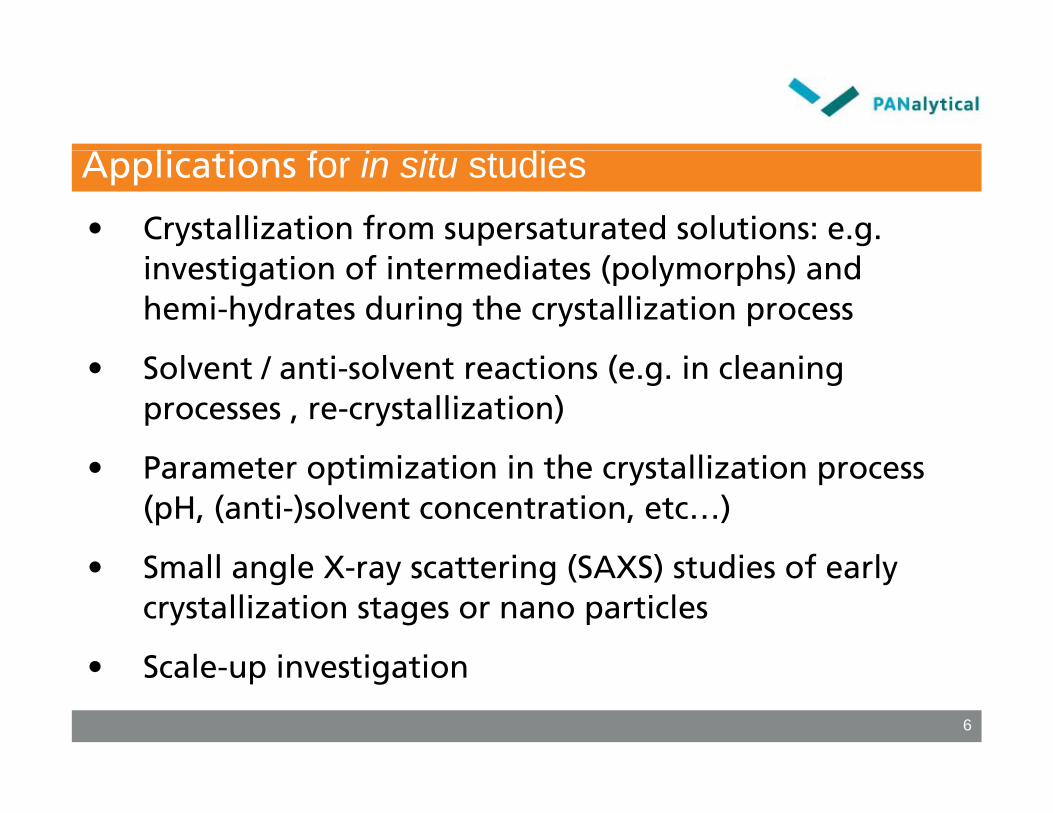
li iApplications for in situ studies • Crystallization from supersaturated solutions: e.g.
investigation of intermediates (polymorphs) and hemi-hydrates during the crystallization process
l l ( l • Solvent / anti-solvent reactions (e.g. in cleaning processes , re-crystallization)
P t ti i ti i th t lli ti • Parameter optimization in the crystallization process (pH, (anti-)solvent concentration, etc…)
S ll l X tt i (SAXS) t di f l • Small angle X-ray scattering (SAXS) studies of early crystallization stages or nano particles
• Scale up investigation
6
• Scale-up investigation
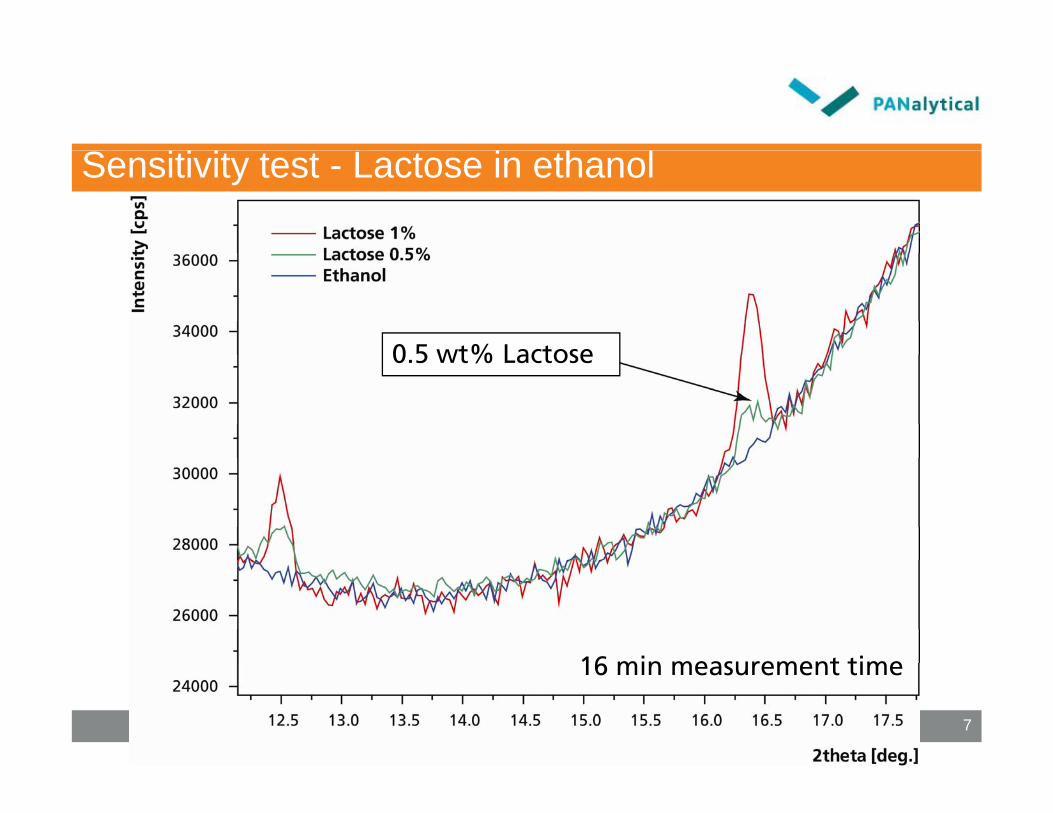
Sensitivity test - Lactose in ethanol
0 5 wt% Lactose0.5 wt% Lactose
16 min measurement time
7
16 min measurement time
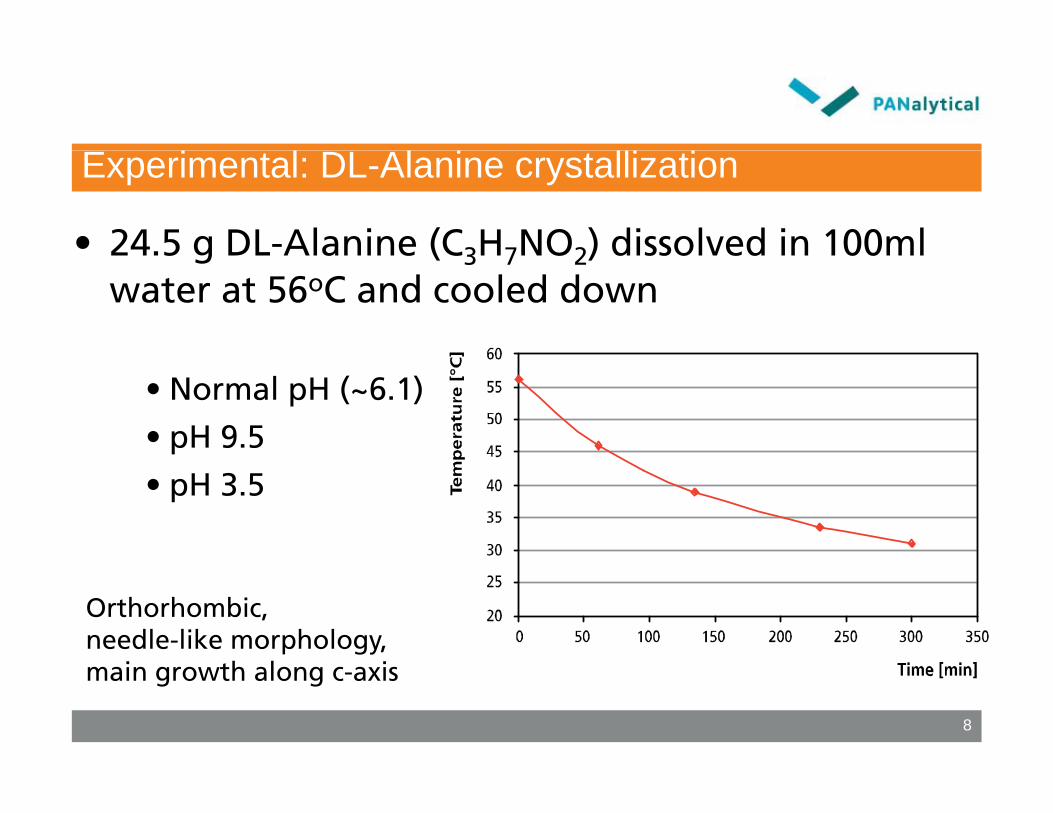
Experimental: DL-Alanine crystallization
• 24.5 g DL-Alanine (C3H7NO2) dissolved in 100ml 24.5 g DL Alanine (C3H7NO2) dissolved in 100ml water at 56oC and cooled down
• Normal pH (~6.1)
• pH 9.5
• pH 3.5
Orthorhombic, needle-like morphology,
i h l i
8
main growth along c-axis
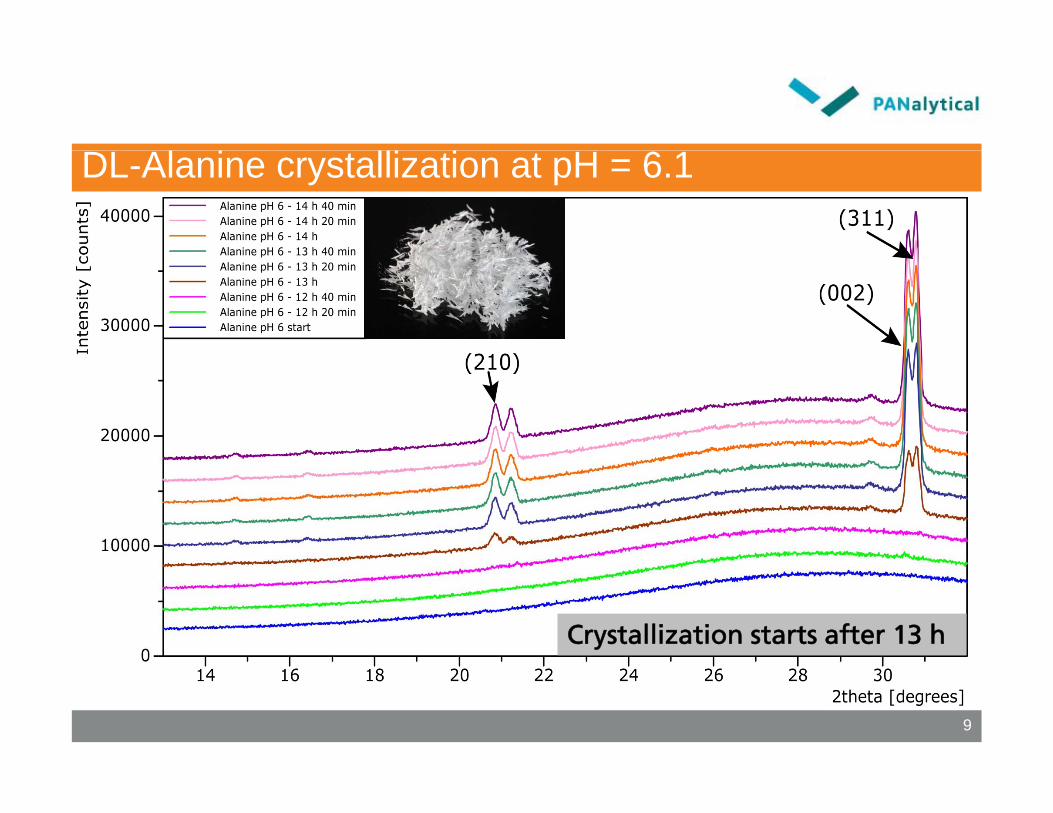
DL-Alanine crystallization at pH = 6.1
Crystallization starts after 13 h
9
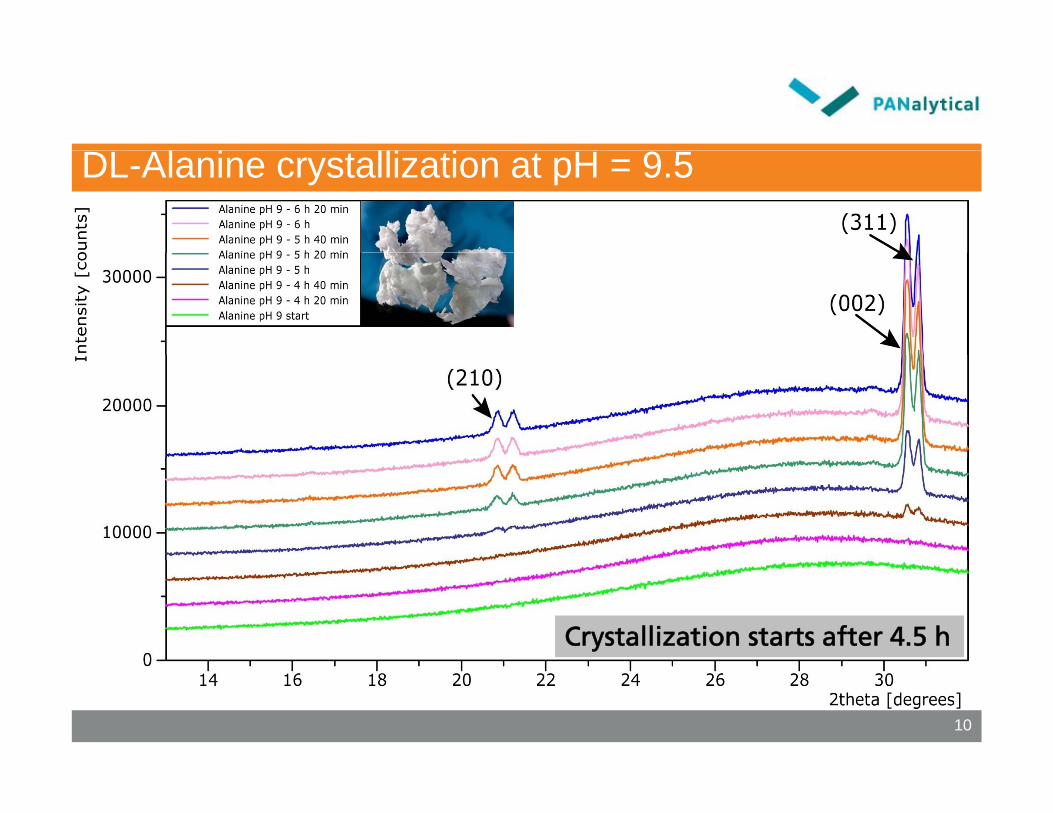
DL-Alanine crystallization at pH = 9.5
Crystallization starts after 4.5 h
10
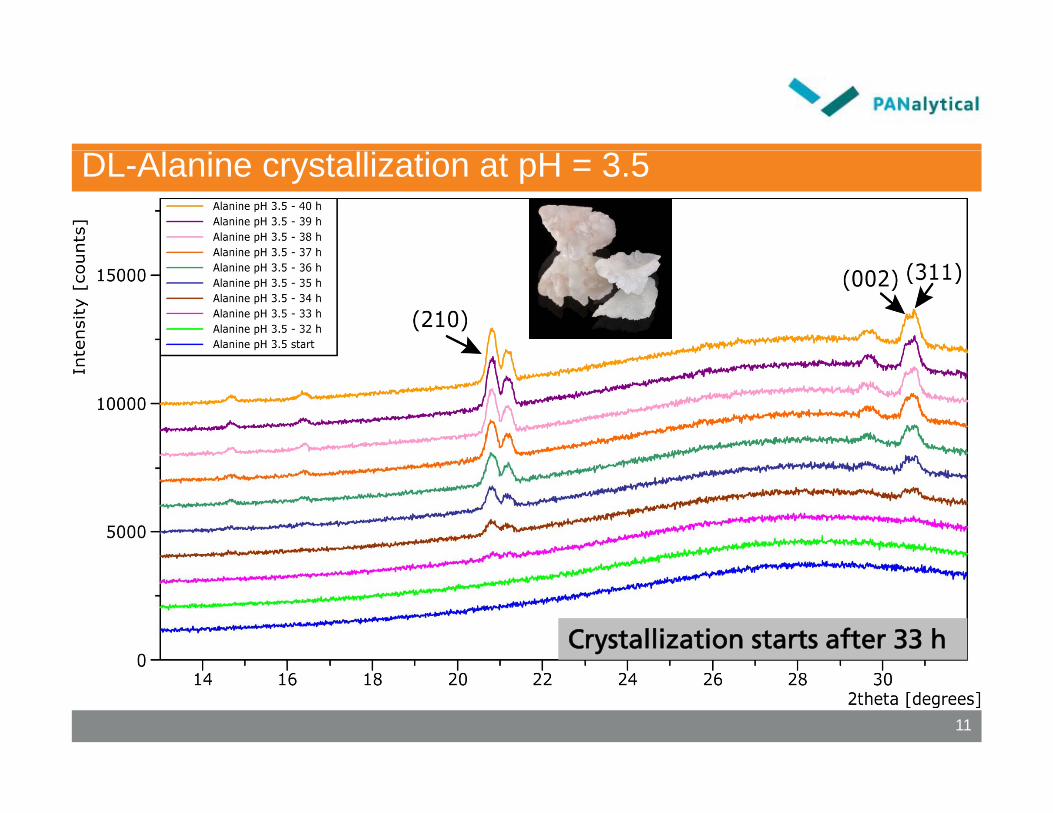
DL-Alanine crystallization at pH = 3.5
Crystallization starts after 33 h
11
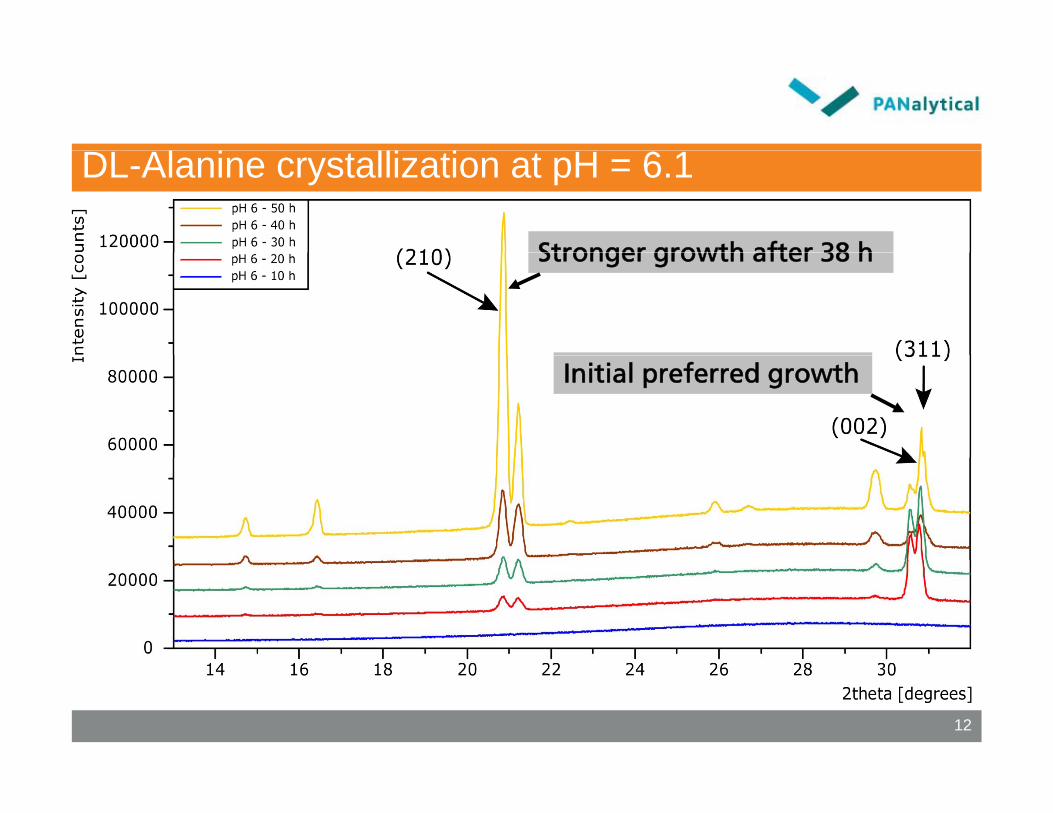
DL-Alanine crystallization at pH = 6.1
Stronger growth after 38 hStronger growth after 38 h
Initial preferred growth
12
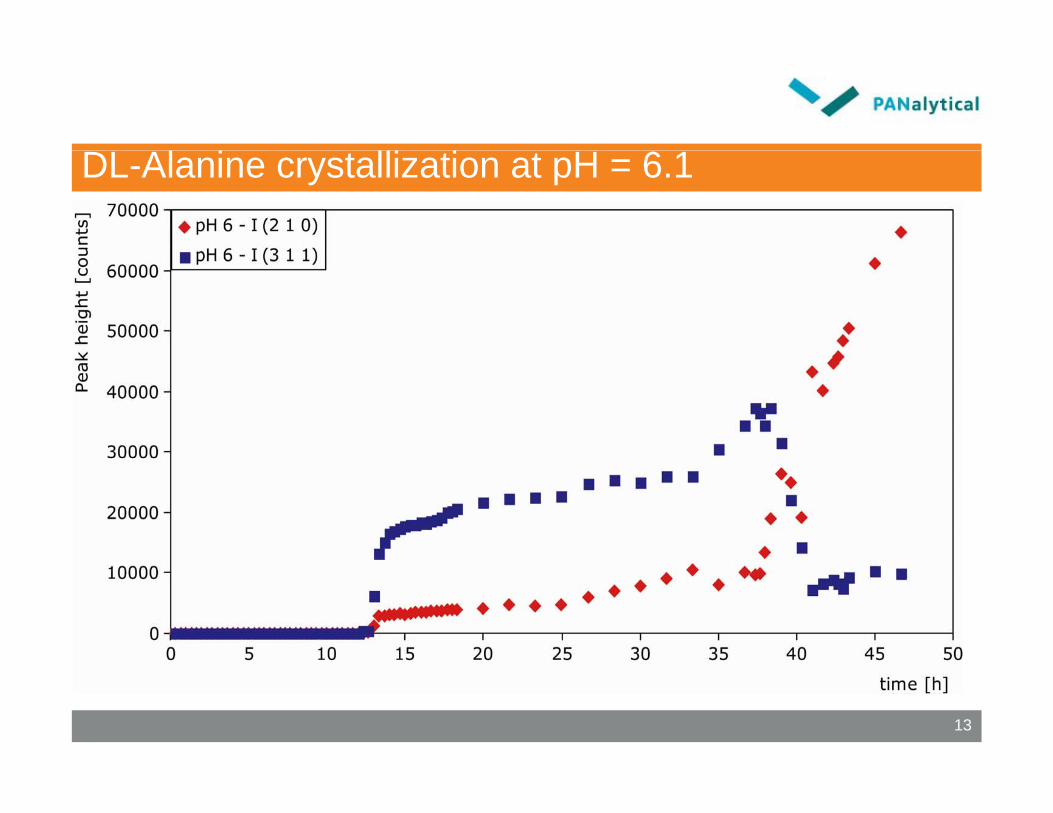
DL-Alanine crystallization at pH = 6.1
13
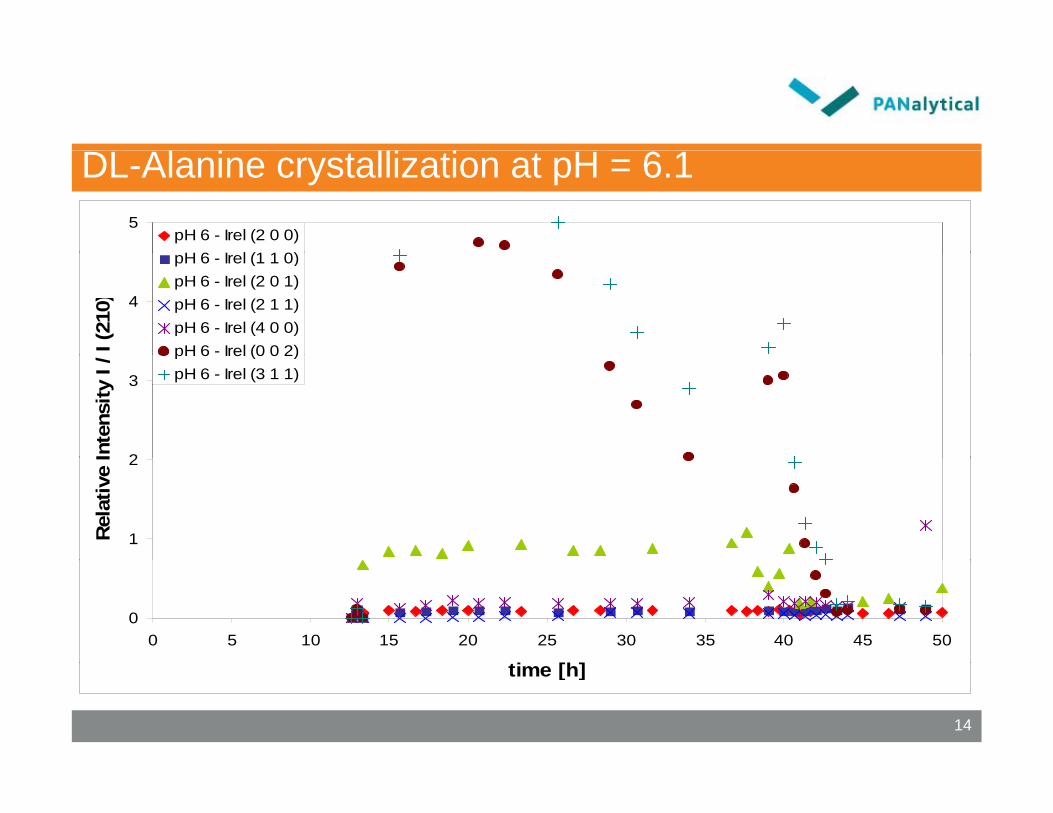
DL-Alanine crystallization at pH = 6.15
pH 6 - Irel (2 0 0)H 6 I l (1 1 0)
4
I (21
0)
pH 6 - Irel (1 1 0)pH 6 - Irel (2 0 1)pH 6 - Irel (2 1 1)pH 6 - Irel (4 0 0)pH 6 - Irel (0 0 2)
2
3
Inte
nsity
I / pH 6 Irel (0 0 2)
pH 6 - Irel (3 1 1)
1
2
Rel
ativ
e I
00 5 10 15 20 25 30 35 40 45 50
ti [h]
14
time [h]
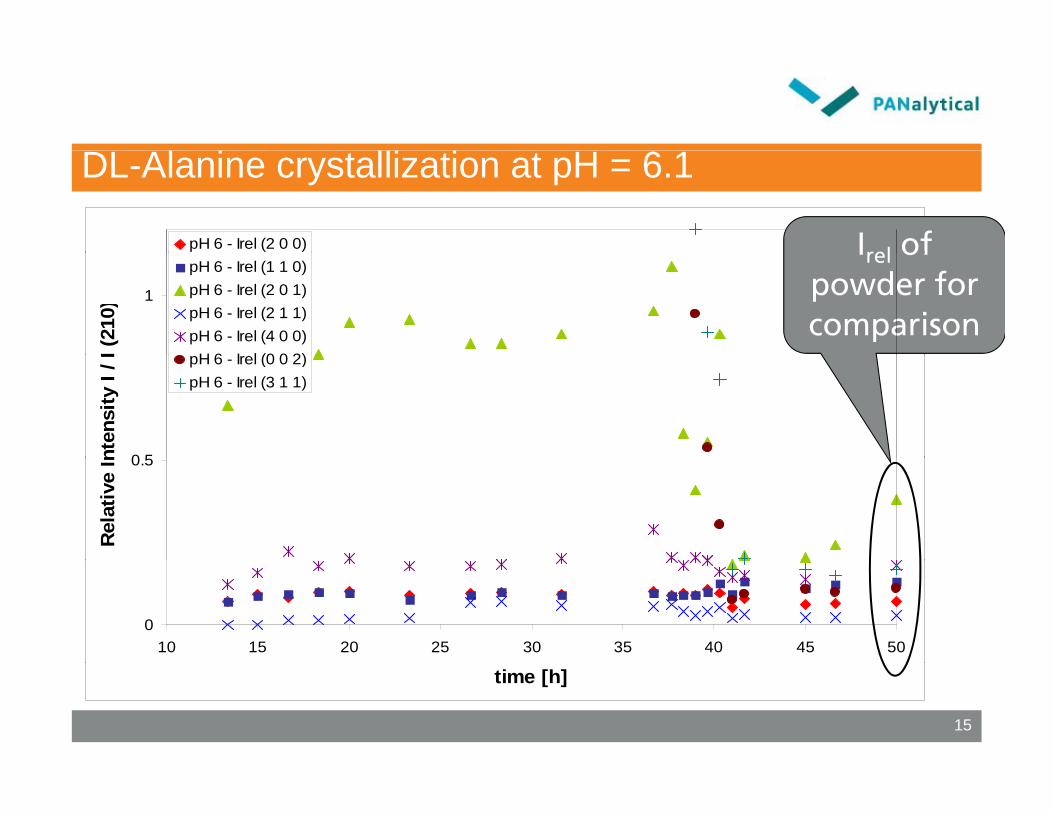
DL-Alanine crystallization at pH = 6.1
pH 6 - Irel (2 0 0) Irel of 1
I (21
0)
pH 6 - Irel (1 1 0)pH 6 - Irel (2 0 1)pH 6 - Irel (2 1 1)pH 6 - Irel (4 0 0)
H 6 I l (0 0 2)
Irel of powder for comparison
0 5nten
sity
I / I pH 6 - Irel (0 0 2)
pH 6 - Irel (3 1 1)
0.5
Rel
ativ
e In
010 15 20 25 30 35 40 45 50
15
time [h]
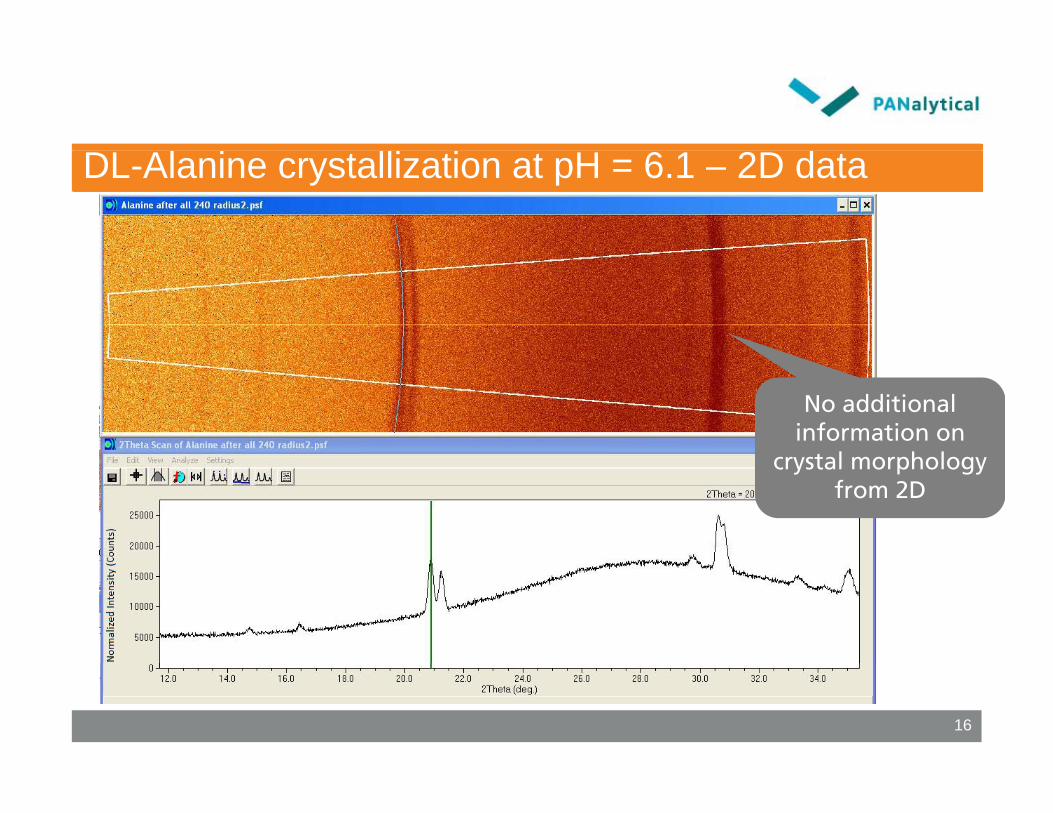
DL-Alanine crystallization at pH = 6.1 – 2D data
No additional information on
crystal morphology crystal morphology from 2D
16
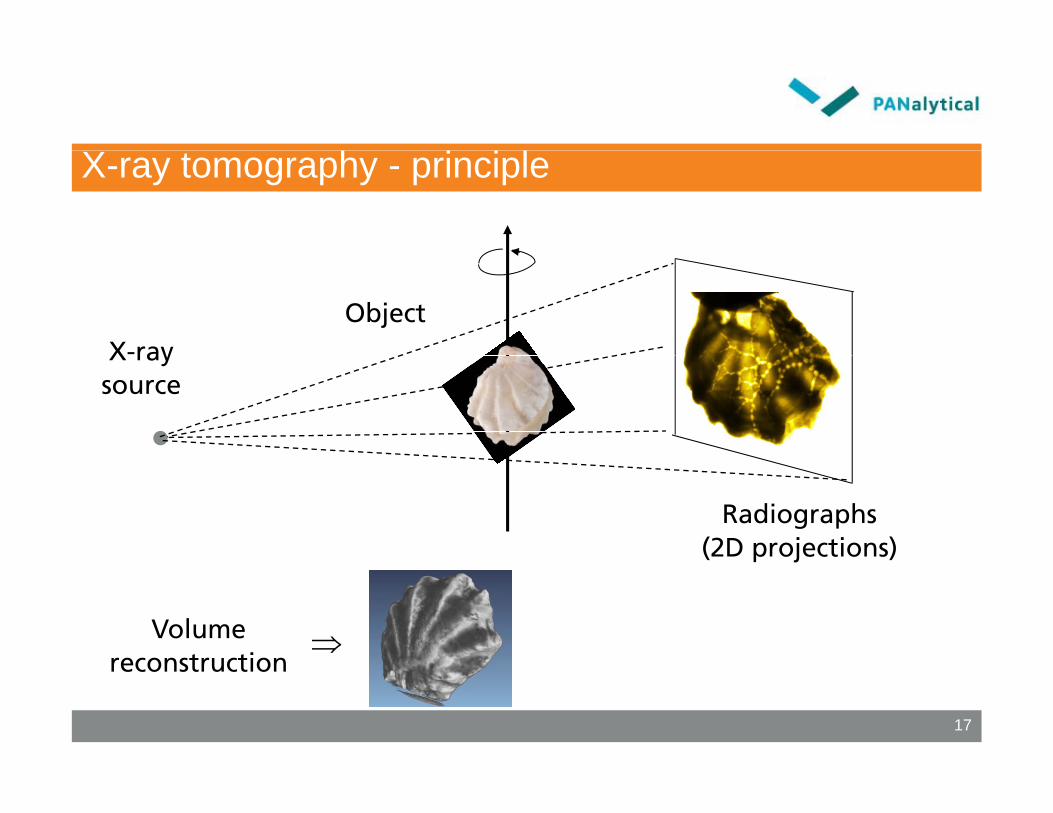
X-ray tomography - principle
ObjectX-ray X ray
source
Radiographs (2D projections)p j
Volume reconstruction
⇒
17
reconstruction
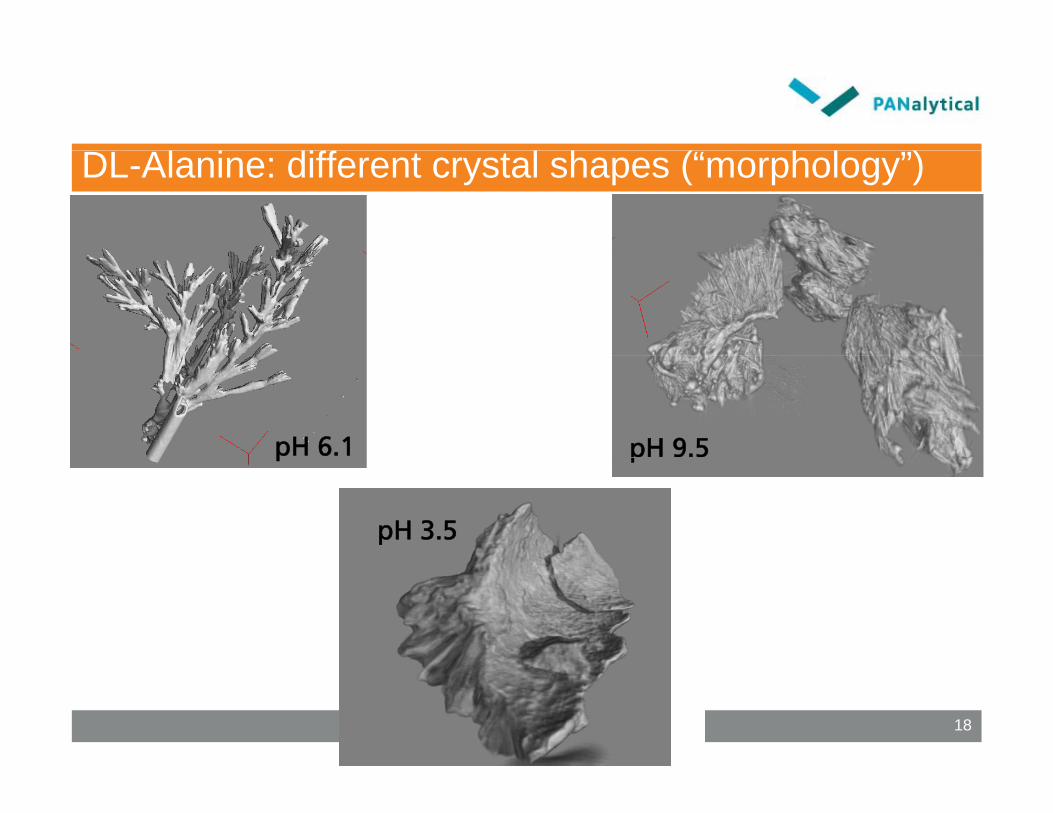
DL-Alanine: different crystal shapes (“morphology”)
pH 6.1 pH 9.5p p
pH 3.5
18
Conclusions 1 – DL-Alanine crystrallization
• Different crystallization conditions show distinct Different crystallization conditions show distinct differences in crystallization initiation and crystal morphology.
• At pH = 6.1 and pH = 9.5, first crystallization is most pronounced by the (002) and (311) p yreflections. Only much later followed by fast growth of the (210) reflection.
19
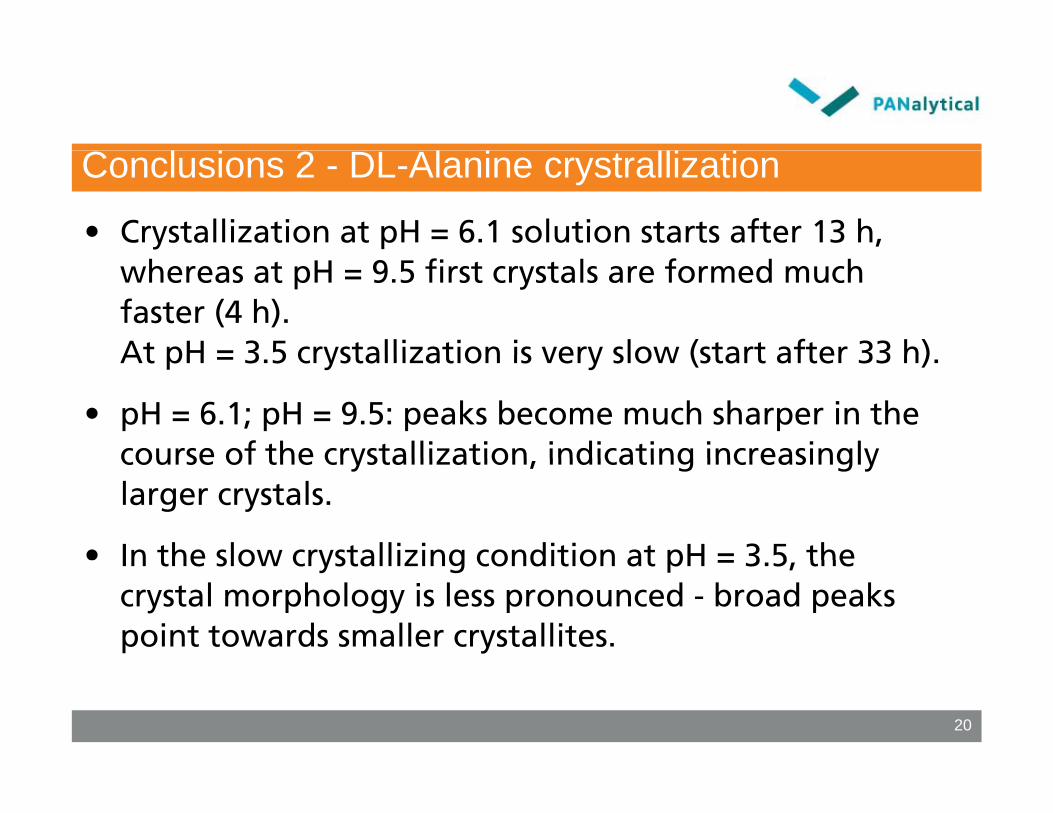
Conclusions 2 - DL-Alanine crystrallization
• Crystallization at pH = 6.1 solution starts after 13 h, whereas at pH = 9.5 first crystals are formed much faster (4 h). At pH = 3 5 crystallization is very slow (start after 33 h)At pH = 3.5 crystallization is very slow (start after 33 h).
• pH = 6.1; pH = 9.5: peaks become much sharper in the course of the crystallization indicating increasingly course of the crystallization, indicating increasingly larger crystals.
• In the slow crystallizing condition at pH = 3 5 the In the slow crystallizing condition at pH = 3.5, the crystal morphology is less pronounced - broad peaks point towards smaller crystallites.
20
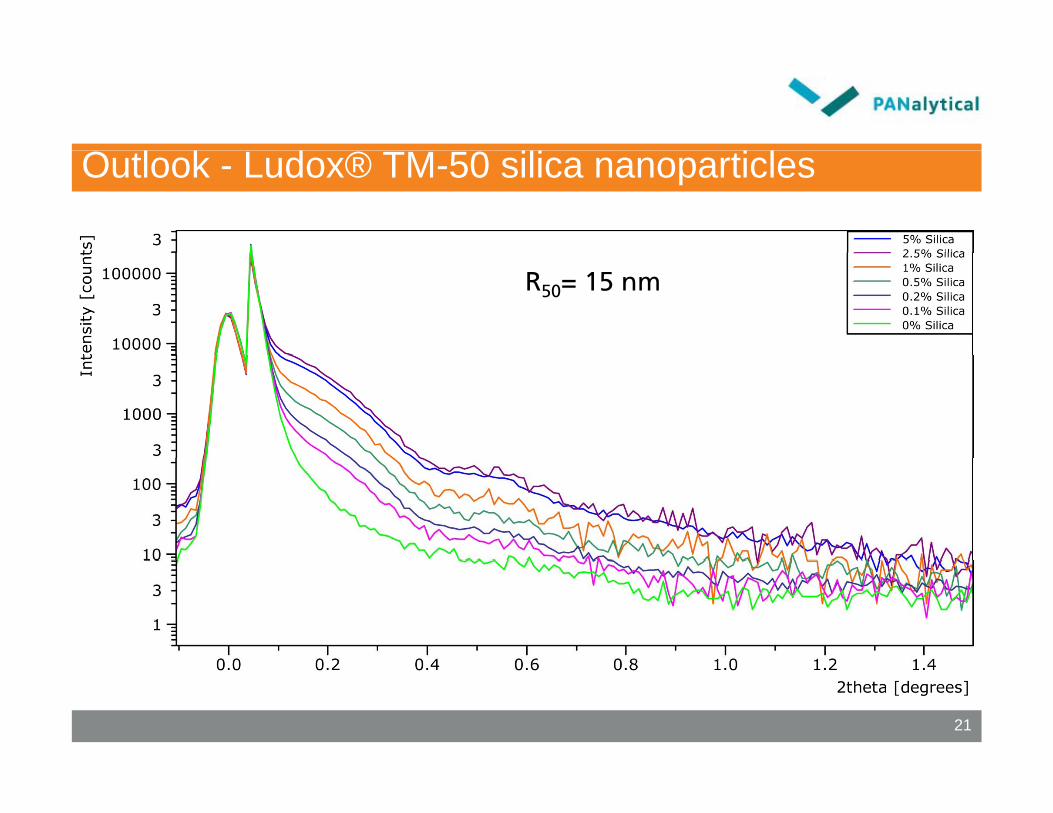
OOutlook - Ludox® TM-50 silica nanoparticles
R50= 15 nm
21