Embed Size (px)
Citation preview

1 Slide 1
In Situ Analysis of Geochemistry and Mineralogy on the Venus Surface
M. Darby Dyar Mount Holyoke College University of Massachusetts Planetary Science Institute
2
Possibilities for Venus In-Situ Measurements Geochemistry LIBS: Laser-Induced Breakdown Spectroscopy APXS: Alpha-Particle X-Ray Spectrometer XRF: X-ray Fluorescence GRS: Gamma-ray Spectroscopy Mineralogy XRD: X-ray Diffraction Raman Spectroscopy Reflectance/Emission Spectroscopy
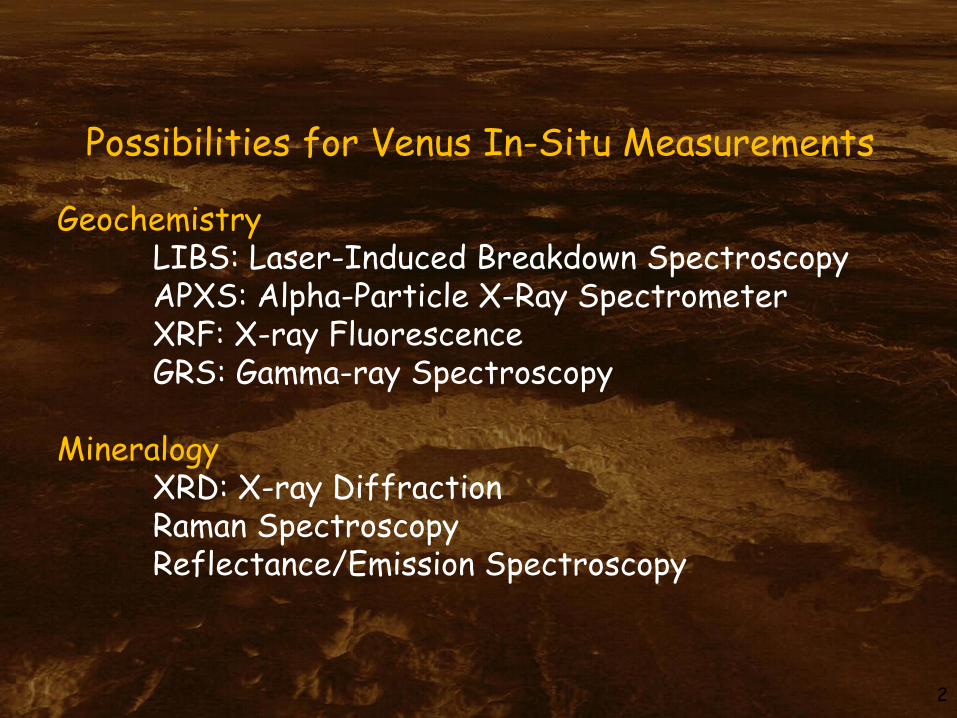
Laser-Induced Breakdown Spectroscopy (LIBS)

Los Alamos National Laboratory and Jet Propulsion Laboratory

LIBS Advantages
• Quantify elements from H to Pb • Plasma is very high T and thus insensitive to 740K • No sample collection, no interlocks • Probe multiple locations: 1000’s in a hour • Rapid analysis: minutes/spot • Prototype built with PIDDP and internal LANL funding • Easily coupled with Raman • Flight heritage from ChemCam + SuperCam • Concurrent development for deep sea applications
Venus = 92 bars, ocean floor = 1000 bars

LIBS Disadvantages • Issues needing further study include:
• Plasma stability (repeatability) • Effects of turbulence • Lack of large calibration databases • Effects of sample porosity • More calibration data under Venus
pressures needed to support calibration transfer
• Pressure effects need to be studied
Pink font = “we’re working on it”

Manifold Alignment Techniques
overcome variations in calibration suites
In LIBS, ionization states of the plasma are a direct function of plasma temperature so emission spectra vary with power density on targets

Manifold Alignment shows great potential for all types of instrument cross-calibration and merging of datasets acquired under varying conditions

• Exposes material to α particles and x-rays emitted by decay of 244Cm
• Emitted x-rays from rock/soil measured with detectors
• Data take 1-10 hours to acquire and improve with length of acquisition
• Needs to be contact or close to rocks/soil
APXS
• Tremendous flight heritage • Would need a different
kind of detector that can detect x-rays at Venus surface conditions or be inside pressure vessel and use sample delivery

Advantages • “gold standard” for bulk chemical analyses of
geological samples Disadvantages • Would need a different kind of detector that can
detect x-rays at Venus surface conditions, or use sample delivery
• Would have to develop a Be window on the pressure/temperature shell, so you could bring the sample up to the window without breaking containment
• Sample handling and preparation important – lots of moving parts
X-ray Fluorescence
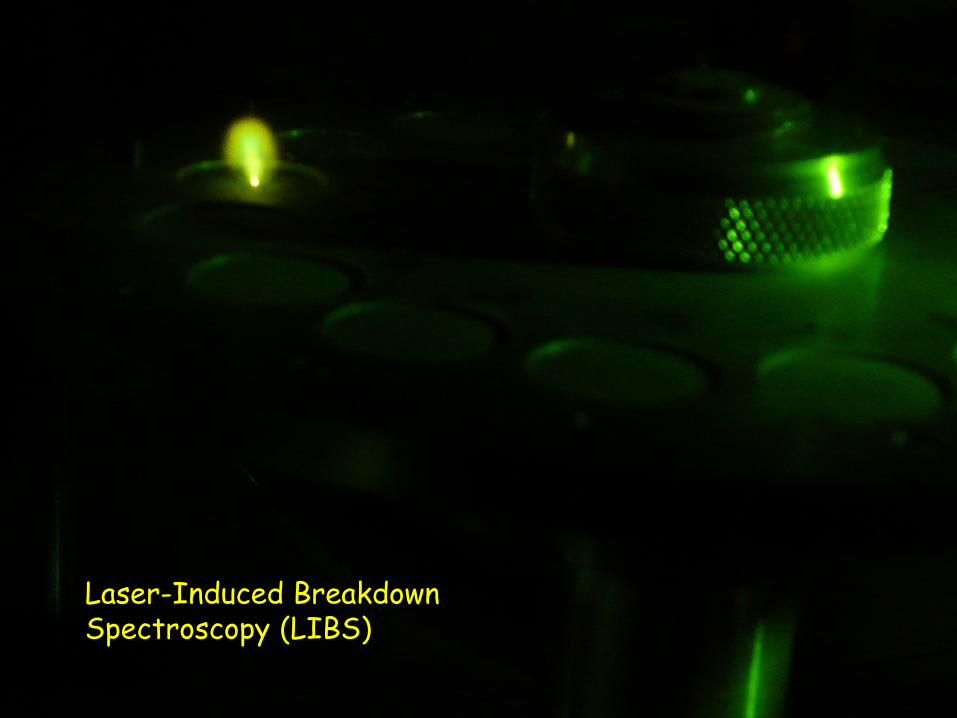
PING: Probing In situ with Neutrons and Gamma Rays
Slides courtesy of Ann Parsons
~20 cm deep
~50 cm radius
Venus Lander
Bulk Elemental Composition Data
over a large volume below the Venus Lander
PING uses high energy neutrons and gamma rays to penetrate Venus’ surface and measure the bulk elemental composition over a large volume: ~20 cm deep, ~50 cm radius • PING is located inside the Venus lander pressure vessel • No moving parts • No arm for sample manipulation required • No window required
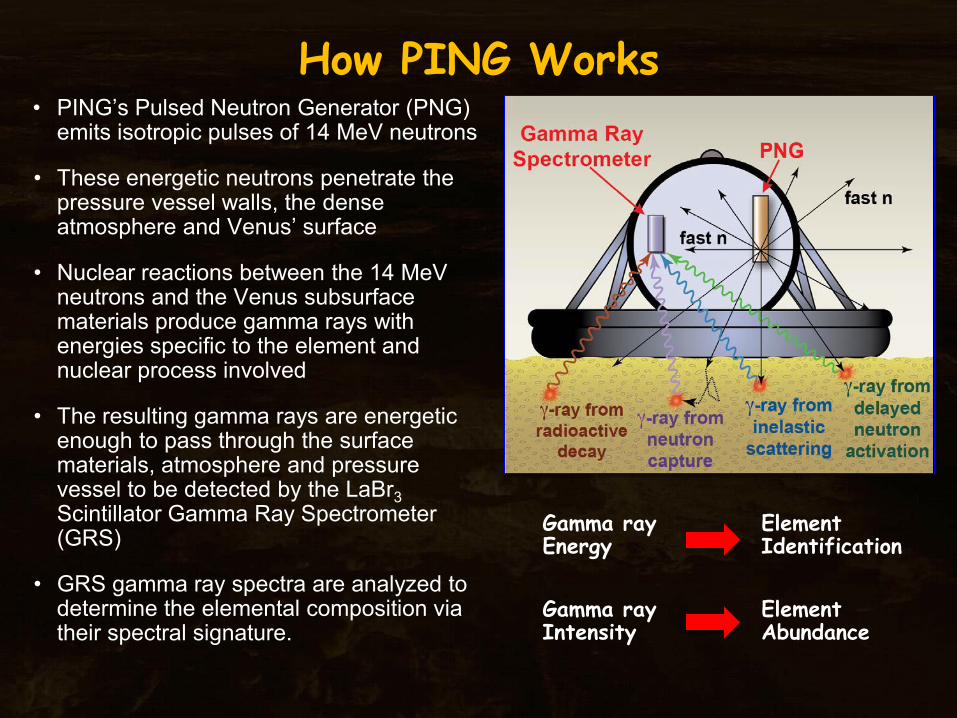
How PING Works • PING’s Pulsed Neutron Generator (PNG)
emits isotropic pulses of 14 MeV neutrons
• These energetic neutrons penetrate the pressure vessel walls, the dense atmosphere and Venus’ surface
• Nuclear reactions between the 14 MeV neutrons and the Venus subsurface materials produce gamma rays with energies specific to the element and nuclear process involved
• The resulting gamma rays are energetic enough to pass through the surface materials, atmosphere and pressure vessel to be detected by the LaBr3 Scintillator Gamma Ray Spectrometer (GRS)
• GRS gamma ray spectra are analyzed to determine the elemental composition via their spectral signature.
Gamma ray Energy
Element Identification
Element Abundance
Gamma ray Intensity
PING Pros and Cons Pros: • established technique in drill hole chemical analysis • excellent precision and accuracy • bulk measurement • no moving parts • no window required • located inside pressure vessel • Flexibility in placement/orientation within pressure vessel
Cons: • mixed flight heritage (DAN on Curiosity, GRS from Chang’e) • TRL 5 due to robust oil field heritage • current units are proprietary • requires massive rock blocks for calibration and testing • as yet no robust calibration model

14
SUMMARY Geochemical Measurements on Venus
LIBS: Laser-Induced Breakdown Spectroscopy data processing still in development APXS: Alpha-Particle X-Ray Spectrometer contact instrument requires moving parts interior instrument requires breaking interlock XRF: X-ray Fluorescence no good detector options for external use requires breaking interlock for interior use GRS: Gamma-ray Spectroscopy mixed flight heritage; testing, calibration
needed

X-Ray Diffraction (XRD)
• Powdered sample exposed to collimated x-ray beam • Diffracted x-rays are identified by energy, creating
a diffraction pattern • Diagnostic patterns for minerals all well-understood

Pros: • “Gold standard” for terrestrial mineral
identification • Definitive mineral identification
Cons: • Data acquisition takes >10 hours (even on Mars) • Extensive sample handling needed to drill, sieve,
and deliver sample
X-Ray Diffraction Pros and Cons

Raman Spectroscopy
Raman peaks are diagnostic of mineral species

Same mineral, different samples
Same exact sample, different
spectrometers

Mineral mixing is non-linear No methodology currently exists for unmixing
Equivalent of “absorption corefficients” does not exist

Pros: • Excellent accuracy when identifying single minerals • Can be stand-off technique requiring no sample contact • Flight heritage from Mars 2020 and ExoMars
Cons: • Rocks and soils require methods for unmixing Raman
spectra non-existent • If microscope is used, must bring sample to window or
inside to use microscope to ID • Pure mineral databases exist but are not verified (e.g.,
RRUFF is only 64.1% XRD’d) • Need techniques to align data from different
instruments
Raman Spectroscopy
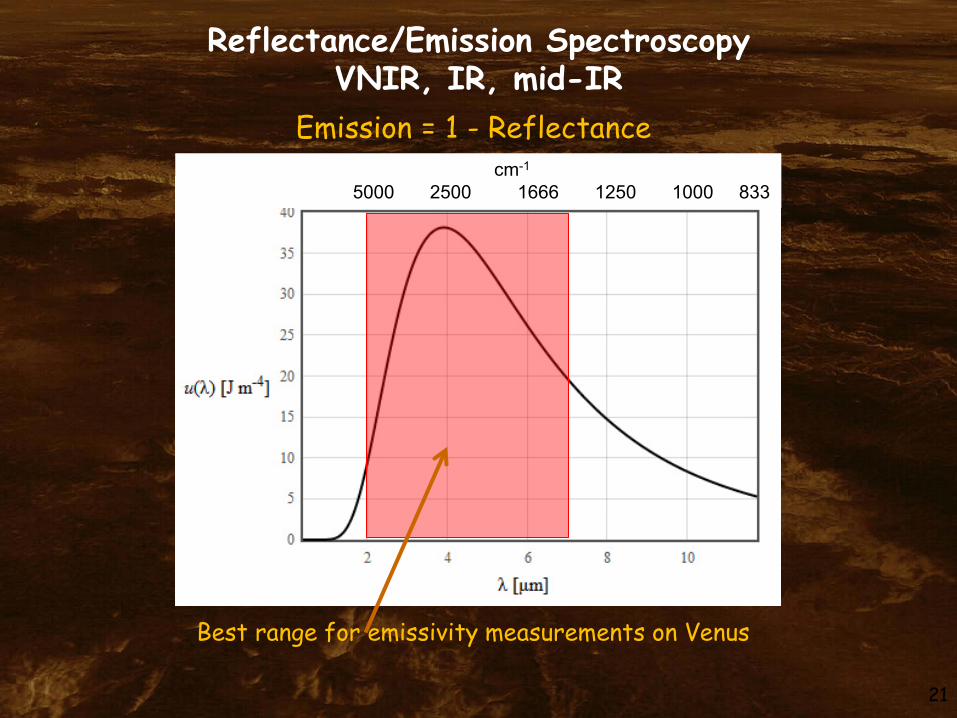
Reflectance/Emission Spectroscopy VNIR, IR, mid-IR
21
Emission = 1 - Reflectance cm-1 5000 2500 1666 1250 1000 833
Best range for emissivity measurements on Venus
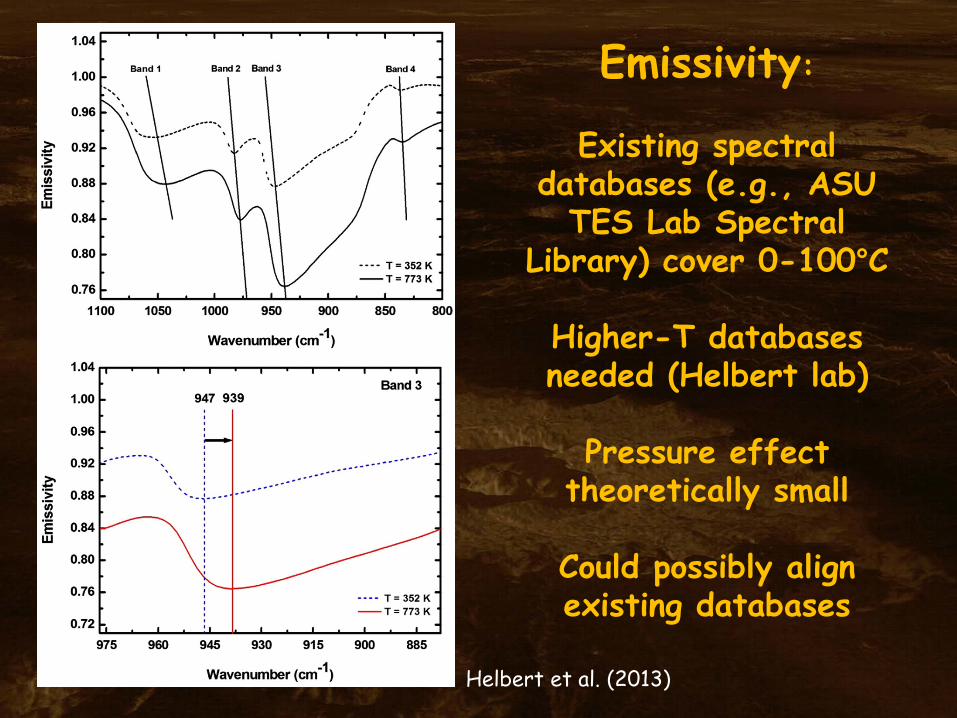
Emissivity:
Existing spectral databases (e.g., ASU
TES Lab Spectral Library) cover 0-100°C
Higher-T databases needed (Helbert lab)
Pressure effect
theoretically small
Could possibly align existing databases
Helbert et al. (2013)

23
What about reflectance?
Wagner and Schade (1996): Thermal emission must be taken into account when considering reflectance at IR to mid-IR wavelengths. “…drastic weakening of features with increasing temperature” because emission mutes reflectance features.

24
SUMMARY Mineralogical Measurements on Venus
XRD: X-ray Diffraction requires sample handling requires yet-to-be-developed detectors Raman Spectroscopy promising for both stand-off and close-up needs better databases needs development of unmixing algorithms Reflectance/Emission Spectroscopy reflectance spectra have emittance contribution all spectra have shifts from temperature needs better databases pressure effects need study