Embed Size (px)
Citation preview
In-situ aberration monitoring using phase wheel targets
Lena Zavyalova*a, Bruce Smitha, Toshifumi Suganagab, Seiji Matsuurab, Toshiro Itanib, Julian Cashmorec
aRochester Institute of Technology, Rochester, New York bSemiconductor Leading Edge Technologies, Inc. (Selete), Japan
cExitech Limited, Oxford UK
ABSTRACT
Aberration metrology is critical to the manufacture of quality lithography lenses in order to meet strict optical requirements. Additionally, it is becoming increasingly important to be able to measure and monitor lens performance in an IC production environment on a regular basis. The lithographer needs to understand the influence of aberrations on imaging and any changes that may occur in the aberration performance of the lens between assembly and application, and over the course of using an exposure tool. This paper will present a new method for the detection of lens aberrations that may be employed during standard lithography operation. The approach allows for the detection of specific aberration types and trends, as well as levels of aberration, though visual inspection of high resolution images of resist patterns and fitting of the aberrated wavefront. The approach consists of a test target made up of a 180-degree phase pattern array in a “phase wheel” configuration. The circular phase regions in the phase wheel are arranged so that their response to lens aberration is interrelated and the regions respond uniquely to specific aberrations, depending on their location within the target. This test method offers an advantage because of the sensitivity to particular aberration types, the unique response of multiple zones of the test target to aberrations, and the ease with which aberrations can be distinguished. The method of lens aberration detection is based on the identification of the deviations that occur between the images printed with the phase wheel target and images that would be produced in the absence of aberration. This is carried out through the use of lithography simulation, where simulated images can be produced without aberration and with various levels of lens aberration. Comparisons of printed resist images to simulated resist images are made while the values of the coefficients for the primary Zernike aberrations are varied.
Keywords: Optical lithography, aberration, phase wheel target
1. INTRODUCTION
Optical lithography has been the dominant technology for the patterning of semiconductor device features. As the size of the geometry for these devices continues to shrink below the ultraviolet (UV) wavelength used for imaging, significant demands are placed on the quality of the optical components within the projection imaging system. The projection systems used for imaging of sub-wavelength features comprise a large number of lens elements. The level of aberration in these systems must be low enough to allow resolution at or below 0.30λ/NA, where λ is the imaging wavelength and NA is the numerical aperture of the lens system. This type of performance is near the physical limit of diffraction and aberrations must be low enough to produce optical wavefront deformation in the projection lens pupil approaching 0.01 wavelengths for the most current systems.
* [email protected], Rochester Institute of Technology, Microelectronic Engineering Dept., 82 Lomb Memorial Dr., Rochester, NY 14623

Lens quality can be described in terms of the ability of an optical system to convert the spherical wavefront emerging from a point object into a spherical wavefront converging toward a point image. Different aberration types will produce unique deviations in the wavefront within the lens pupil. For a system utilizing full circular pupil, Zernike circle polynomials can be used to represent optimally balanced classical aberrations. An expansion of the wave aberration function in terms of a complete set of Zernike polynomials can be expressed as:
( ) ( ) ( ) [ ]∑∑∞
= =
+++=0 0
0 )sin()cos()(112,n
nmnmmn
n
mm msmcRnW θθρδθρ
where n and m are positive integers (n–m≥0 and even), cnm and snm are aberration coefficients, θ is pupil azimuth, and the circle polynomial R of nth degree in terms of the normalized radial coordinate in the pupil plane ρ is in Mahajan's convention [1]. Commonly, a set of 37 Zernike polynomial coefficients is utilized to describe primary and higher order aberrations, although some applications may require additional terms.
One of the most accurate methods for measuring wavefront aberration (and subsequently fitting coefficients of
Zernike polynomials) is phase measurement interferometry (PMI) [2]. PMI generally describes both data collection and the analysis methods that have been highly developed for lens fabrication and assembly and used by all major lithography lens suppliers. The concept behind PMI is that a time-varying phase shift is introduced between a reference wavefront and a test wavefront in an interferometer. The accuracy of PMI methods lies in the ability to sample a wavefront. A limitation of PMI however is the need for the reference and test beams to follow separate paths, making field use or in situ application difficult. The lithographer is therefore restricted to using alternative approaches to measure, predict, approximate, or monitor lens performance and aberrations.
More importantly, the optical system must be characterized as a whole and cannot be described in any simple way
from the functions of parts of the system taken separately. Phase errors in the projection optical system may arise from a variety of sources, including uneven pupil illumination due to condenser aberrations or illumination conditioning optics subject to misalignment. Any amount of aberration will result in image degradation and the entire optical train will contribute to overall system performance at the image plane. These and other considerations indicate the need to study the full pupil function in situ [3]. The knowledge of the system optical transfer function (OTF), which is a measure of image quality in terms of contrast and resolution in the presence of aberrations, is key. A method for aberration monitoring in situ, by imaging critical image features that are also related to overall system performance, can be a useful tool for this purpose.
2. METHODOLOGY
2.1 OTF and PSF One approach for describing the system OTF is by taking image measurements and studying the contribution of
aberration types to losses in the image. If an object consisted of all spatial frequencies, then the OTF is the Fourier transform of the image. Such an object is called a point object and its image is the point spread function (PSF). Therefore a Fourier transform is a mutual relation between the main functions and the OTF is simply the Fourier transform of the PSF.
By obtaining the PSF convolved with the image, one should be able to gain the knowledge of the OTF and
aberrations. This is challenging for partially coherent imaging, thus one begins by making the simplifying assumption that the imaging system is linear and shift-invariant [4]. The imaging equation is given by:
[ ] [ ] [ ]yxhyxfyxg ,,, ∗=

where g is the image, f is the object, h is the spread function of the optical system, and the symbol ∗ denotes a two dimensional convolution. In addition, the photoresist effects need to be considered along with process noise. The Fourier representation of the blurred lithographic image can be expressed as
NRHFG +⋅⋅=
where F is the object Fourier transform, H is the aberrated OTF, R is a resist modulation transfer function, and N is a noise term.
It can be shown that the PSF term is a function of the wavefront deformation on the exit pupil [5]. Since the point spread function is the irradiance in the image of a point source in an optical system, mathematically it is the complex square of the amplitude distribution in the image:
∗⋅= AAPSF
The A is given by the 2D Fourier transform of the complex pupil function P on the exit pupil:
[ ] [ ] WFF ryyxxikFF eyxPyxA )(,
1, +
∫∫=σ
π
where integration is made over the exit pupil area σ, rw is radius of curvature of the wavefront at exit pupil, and (xF,yF) are the coordinates in the focal plane.
2.2 LSF
By analogy, the image of a line object is called a line spread function (LSF), and it is often used instead of the PSF. This function may be obtained in a number of ways. For example, in lithography the LSF imagery can be accomplished with a phase shift mask. A 0-to-180 degree phase transition can be viewed as an opaque object, where the phase edge prints as a line into resist, thereby yielding an LSF. The LSF will have an unknown aberration associated with it that is due to phase error in the exit pupil.
As an example, Figure 1(a) shows how three small vertical phase bars (between 0.5 and 1.5 λ/NA) of chromeless
π-phase shift design are printed in the photoresist. The images are a result of a lithographic simulation using a Prolith vector model (Prolith version 8.0, KLA-Tencor) with a wavelength of 157nm, a numerical aperture of 0.85, a partial coherence value of 0.30, and a resist thickness of 80nm. The resulting image consists of six separate lines, each occurring at the phase transitions on the mask. The differences between the six lines are a result of the random aberration programmed into the simulator at a level corresponding to a root mean square (RMS) of 0.03 waves, a reasonable level for such a lithography system. To have the information in several directions, LSF’s need to be computed for several object orientations. Figure 1(b) shows the effects of rotating the transparent test object by 90 degrees, resulting in a different and unique effect to these six lines, which is indicative of the radial and angular dependence of aberrations within the lens. Figure 1(c) shows the effects of rotating the transparent test object by 45 degrees where results are also unique. It is desirable to detect aberration effects at all orientations or directions simultaneously.
The test phase objects of Figure 1 can be reduced from multiple line groupings to multiple phase box groupings, as
shown in Figure 2. These figures show how the image intensity through the center of the three boxes, sizes L1 and L3 spaced distance L2 apart and oriented along a horizontal axis, results in six dark regions, or lines, in a clear field, similar to the effect for the three bar patterns in earlier figures. The separation of the three dark regions is determined by the L1, L2, and L3 dimensions.

2.3 Pupil sampling It is desirable to design an aberration test target so that it will sample a lens pupil in the most beneficial way. Since
aberrations have unique character in the manner which they influence specific portions of a lens pupil, the test target can be designed so that it is most sensitive to particular aberration types and order.
Rather than spatially, it is convenient to examine this object structure in the frequency domain. The idea is to find the
optimum linear combination of features that samples the entire pupil. As an example, Figure 2(a) shows the magnitude of the diffraction energy within the objective lens pupil for a test object comprising zones with sizing values corresponding to L1=200nm, L2=200nm, and L3=200nm for a 157nm 0.85NA imaging system. Additionally, Figures 2(b) through (d) show the distribution of the diffraction energy as the target takes on the 200nm/150nm/200nm, 100nm/150nm/200nm, and 100nm/200nm/200nm sizings, respectively. Normalized, the above dimensions correspond to the following L1/L2/L3 ratios: (a) 1:1:1, (b) 2:1.5:2, (c) 1:1.5:2, and (d) 1:2:2. The frequency content within the lens pupil is different for each example and shows how a test object can be designed for particular sensitivity to an aberration order. The diffraction energy distribution of Figure 2(c), for example, is most sensitive to third order (or primary) aberration and the sizing values of this example are used for the next several examples.
2.4 Phase wheel aberration target A single point phase target provides a limited sampling of the lens pupil and a series of imaging conditions are
needed. To achieve an averaging effect, we want a number of important features in the PSF fit within the single target field of view. For a point-like object this merely allows the object to move around in the field but for extended objects it means that more image data can be used without increasing the computing time. A target consisting of multiple zones (a “wheel”) allows a larger sampling of the lens pupil through the interaction of phase components. Since the phase information is concentrated to within the first few diffraction rings, the LSF errors, in principle, would be reduced. This kind of design has the potential to overcome some of the limitations of the existing methods for fast in situ aberration extraction, where in order to have good accuracy the number of data points must be as large as possible.
The preferred configuration is shown in Figure 3. In this configuration, a test target is designed with multiple phase
zones so that it forms a single open figure based on this collection of zones. This test target is referred to as a wheel aberration target. The phase of the zones is shifted with respect to the phase of the surrounding field by 180 degrees. The features are sized in ranges between 0.5 and 1.5λ/NA and the entire open phase test target is between 2.5 and 5λ/NA in size. As shown in figure, the wheel geometry is designed so that the center region (sized L3) is surrounded by a group of elements, each sized L1 and spaced L2 away at 0, 45, 90, 135, 180, 225, 270 and 315° in azimuth. Thus, the interrelationship between the multiple phase geometry is distinct for each region within the wheel target as each portion has a unique proximity to surrounding phase values.
The grouping of the features is not limited to this described example. The test structure can also take on forms
different than that shown in Figure 3. Also, the shape of the phase features within the test target need not be square. Examples of test targets with nine phase features are shown in Figure 4. These targets consist of groupings of square and circular phase features of various sizing. Targets in Figures 4 (a) through (d) will produce similar intensity profiles along a central region of a multiple pattern grouping. The shape of the features within the target is less critical than the sizing and spacing since the detailed structure of the features is likely beyond the resolution of the lithography system. The transmission of the zones can be varied: the transmission of all zones and all surrounding regions can be unity, or the center zone can have a transmission of zero. Variations in the number of features, shape, size, phase, transmission, and density can be modified with the same open phase test target effect where the interrelations among the phase features allow for the unique detection of aberrations.

2.5 Influence of even and odd aberration types Figures 5 through 7 show simulated resist images from a test object which comprises multiple phase elements, where
dimensions correspond to L1=100nm, L2=150nm, and L3=200nm for a wavelength of 157nm and a numerical aperture of 0.85. The zones within the figure are circular. The phase of the circular regions is shifted from the surrounding region by 180 degrees. The transmission of the figure is unity.
Even aberrations, with the symmetry about the meridional plane, are astigmatism and spherical. Their effect is best
appreciated when considered together with defocus. Figure 5(a) shows the impact of negative 3rd order astigmatism through a defocus of ~1.5 waves (+/- 0.12 microns). The characteristic deformation of the images printed from the zones within the test target at X and Y orientations results. In the presence of negative astigmatism, positive defocus causes the opening of the zones at the extreme Y locations, while negative defocus causes the opening of the zones at the extreme X locations. Figure 5(b) shows the impact of positive 3rd order astigmatism through a defocus range of +/- 0.12 microns. There is a characteristic deformation of the images printed from the zones within the test target at X and Y orientations. In the presence of positive astigmatism, positive defocus causes the opening of the zones at the extreme X locations, while negative defocus causes the opening of the zones at the extreme Y locations.
Figure 5(c) shows the impact of positive 3rd order 45 degree astigmatism through a defocus range of +/- 0.12
microns. There is a characteristic deformation of the images printed from the zones within the test target at diagonal orientations. In the presence of positive 45 degree astigmatism, positive defocus causes the opening of the zones at the extreme -45 degree locations. Negative defocus causes opening of the zones at extreme +45 degree locations. Figure 5(d) shows the impact of negative 3rd order 45 degree astigmatism through a defocus range of +/- 0.12 microns. The unique behavior of the images resulting from the phase wheel target is the deformation in the printed target at diagonal orientations. In the presence of negative 45 degree astigmatism, positive defocus causes the opening of the zones at the extreme +45 degree locations. Negative defocus causes the opening of the zones at the extreme -45 degree locations.
The impact of spherical aberration is also unique in itself, as shown in Figure 6. The figure shows the effect of
defocus values of –0.16, 0.12, +0.12, and +0.16 microns of defocus for negative and positive aberration. Depending on the amount of defocus, spherical aberration causes a distinct symmetrical expansion or contraction of the zones within the target. The effects are symmetrical within the target, which is an indication of the symmetrical nature of this aberration.
Odd aberration types such as coma and 3-foil have a main effect in the XY plane. Figure 7(a) shows the unique
impact of 3rd order coma along the X and Y axes, positive and negative in sign. The deformation of the images printed from the zones within the test target results at all orientations. Coma aberration leads to the characteristic deformation so that the zones are opened and oriented toward a point corresponding to the coma aberration. The outermost zone along the direction of the coma aberration, and opposite in sign, remains closed. Vectors can be drawn from the openings within the zones, which are directed opposite in sign along the direction of the coma aberration, converging to a point at the edge of the target.
Figure 7(b) shows the impact of 3rd order 3-foil aberration with the base on Y and X axes. The test structures
respond uniquely at all orientations. 3-foil aberration leaves the zones that are opened and oriented toward a point. Vectors can be drawn from the openings within the zones, directed opposite in sign along the direction of the 3-foil aberration, converging to a point within the target. Unlike the coma aberration effects, the influence of 3-foil is a deformation of all zones and a convergence of vectors corresponding to a 120 degree symmetry of the aberration.

Figure 8(a) is a simulated resist image of a phase wheel target showing the effects of no aberration. The zones within the test target open to a central region of the target. Figure 8(b) is a simulated resist image of a phase wheel target demonstrating the combined effects of third order aberrations. The total wavefront aberration in this example is 0.03wave (RMS). The contribution from primary aberrations is: -0.0025 waves of astigmatism, 0.0091 waves of 45 degree astigmatism, -0.0093 waves of X-coma, 0.0227 waves of Y-coma, -0.0207 waves of spherical, -0.0676 waves of 3-foil, and 0.0422 waves of 45 degree 3-foil. Figure 8(c) is a SEM image of a test target in resist showing the effects of the stepper with RMS OPD > 0.05wave. Coma, astigmatism, spherical, and 3-point aberration combined produce collective deformation effects on the zones of the test target similar to the previous simulated examples.
3. IMPLEMENTATION
The test implementation requires producing a varying phase signal at the image plane. One of these images (and the spread function) is the in-focus image that has been degraded by the unknown aberrations. Additional images of the same object are formed by perturbing these aberrations with a known amount of phase error such as defocus. The relative phase difference introduced between the wavefronts is encoded within the spread function signal of each.
The phase wheel test implementation is made possible through the use of a standard phase shift mask with the
chromeless π-phase shifted regions defining the test object structure in complex amplitude. The test is run during a standard operation of a lithography system where the phase wheel target is projected onto a wafer image plane where it is captured in photoresist and evaluated. Target dimensions, structures, orientations, placement, and the like are optimized to accommodate specific imaging conditions. The design, optimization, and analysis methods can be incorporated into a design layout tool, a lithographic simulator, a computer program, or other analysis tools.
Aberration analysis is carried out through the use of lithography modeling, where simulated images can be produced
without aberration and with various levels of lens aberration. The lens aberration detection is based on the identification of the deviations that occur between the images printed with the test target and images that would be produced in the absence of aberration. Comparisons of printed resist images to simulated resist images are made while the values of the coefficients for primary Zernike aberrations are varied. Furthermore, the detection of specific aberration types and trends, as well as levels of aberration, is possible though a visual inspection due to ease with which aberrations can be distinguished. A more in depth mathematical analysis of images (fitting algorithm) is possible for aberration parameter fitting such as through the means of frequency analysis using Fourier transform.
4. RESULTS
The method was field tested on three different projection exposure tools. Two high numerical aperture small field 157nm lithography lenses and a full field 193nm lens were evaluated. Wavefront decomposition was performed on a restricted wavefront (primary spherical, astigmatism, coma, and 3-foil only) on a circular aperture using Prolith/8 full vector simulation. The evaluation involved experiments with different relative target dimensions. The 1:1.5:2, 2:2.5:2, 1.5:2.5:2 and 1:1:1.5 target sensitivities were explored. In general, smaller target size tends to the increased sensitivity to both projection lens aberration and illumination errors.
For a 157nm 0.90NA lens (lens A) a series of phase wheel images were collected through focus. The image data was
used to fit the primary Zernike polynomials. Figure 9 shows a subset of the printed resist patterns and the corresponding fit contours in the focal plane as well as in the out-of-focus planes. Figure 10(a) is a density plot of the resulting aberration phase map with piston, tilts, and defocus removed. It was established that the lens A wavefront dominant aberrations are astigmatism Z5 and Z6, followed at a much lower level by spherical (Z9) and 3-foil Y (Z11). For this lens
the obtained Strehl ratio is 0.927 at 157 nm, revealing the phase wheel test ability to characterize diffraction-limited optics. A comparison of the measured aberration coefficients is shown in Figure 10(b), where a satisfactory agreement was achieved with the 157nm PMI data.
Figures 11 and 12 show results of aberration measurement of a 157nm 0.85NA lens (lens B). Again, information
about the phase errors was extracted from multiple SEM images of the phase wheel object taken at the ~0.3λ defocus step phase difference. The wavefront as described by primary Zernike polynomials is shown in Figure 12. The Strehl ratio was under 0.80 for the lens. As expected, the phase wheel target is capable of detecting a variety of aberration types including coma, spherical, astigmatism, and 3-foil. The 3-foil as measured by the phase wheel method is predominant.
The final example is shown in Figure 13 where the phase wheel target was applied to estimate the performance of the
193nm 0.75NA lens (lens C). Recorded images in Figure 13 were analyzed to determine the phase map of lens C. Figure 14 shows the resulting wavefront. The spherical aberration (Z9,16,25), the astigmatism (Z4,5,12,13) and the 5-foil X aberration (Z25) are contributing to the wavefront error. Most notably, the additional source of error, which could not be described by including higher order Zernike terms in this fit, was attributed to the effective source error present in this system. Effective source errors typically are manifest of the alignment errors, tilts/decentrations, or condenser aberrations, and could consume some portion of the total λ/100 RMS budget. More insight may be gained on this subject by studying the reference [6]. Understanding the illumination errors allowed for the agreement between the data and the estimated wavefront and object. The illumination source asymmetry as deduced from the fit is shown in Figure 15. However systematic source errors folded into the wavefront are difficult to describe with a regular model. The Zernike polynomial description fails when the coefficients are no longer orthogonal [1]. Zernike polynomials may need to be modified to represent illumination and alignment errors. Illumination source metrology and aberration sensing therefore must be considered jointly for any in situ tests.
5. CONCLUSIONS
An efficient target design capable of accurate phase measurement is demonstrated. The target was applied to testing of aberrations in 157 and 193 nm projection lithography tools. The design is relatively simple making this test suitable for a broad range of measurement applications and wavelengths. The method combines some of the good qualities such as speed and the possibility of qualitative information due to sensitivity to certain aberration types. The phase wheel aberration monitor is a useful tool for estimating and correcting the phase errors in the projection tool setup. Since the test also establishes unique associations between the various aberrations, the phase wheel is a good choice as a monitoring tool capable of providing rapid feedback. Phase aberrations may be inferred directly from the image data. Targets can be included on all PSMs as aberration monitors. Qualitative and quantitative analysis is possible, with small aberration effects becoming obvious.
REFERENCES
1. V.N. Mahajan, Zernike circular polynomials and optical aberrations of systems with circular pupils, in Eng. and Lab Notes 17, R. Shannon ed., 1994.
2. J.E. Greivenkamp and J.H. Bruning, “Phase shifting interferometers,” in Optical Shop Testing, D. Malacara ed., John Wiley & Sons, 1992.
3. B.W. Smith, Variations to the influence of lens aberration invoked with PSM and OAI, Proc. SPIE 3679, 1999. 4. R. L. Easton, “Mathematics of linear imaging systems”, Manuscript to be published. 5. D. Malacara, Z. Malacara, “Handbook of lens design”, Marcel Dekker, New York, 1994. 6. D. Goodman, A. Rosenbluth, Condenser aberrations in Köhler illumination, Proc. SPIE 922, 1988.

Fig. 1. Aberrated system acting on: (a) an X-oriented open multiple phase bar test object and its image in photoresist; (b) a Y-oriented object and its image in resist; (c) test object oriented at 45 degrees and its image in resist. Object transmission is 1; phase difference is from 0 to π.
Fig. 2. Power spectrum within objective lens pupil verses test object dimensions L1, L2, and L3.
L1
L2
L3
L1 L2
L3 L1
L2
L3
0.00
0.05
0.10
0.15
0.20
0.25
X Pupil Position
Mag
nitu
de
-1.0 -0.70 0 0.70 1.0
0.00
0.05
0.10
0.15
0.20
0.25
X Pupil Position
Mag
nitu
de
-1.0 -0.70 0 0.70 1.0
0.00
0.05
0.10
0.15
0.20
0.25
X Pupil Position
Mag
nitu
de
-1.0 -0.70 0 0.70 1.0
0.00
0.05
0.10
0.15
0.20
0.25
X Pupil Position
Mag
nitu
de
-1.0 -0.70 0 0.70 1.0
0.00
0.05
0.10
0.15
0.20
X Pupil Position
Mag
nitu
de
-1.0 -0.70 0 0.70 1.0
0.00
0.05
0.10
0.15
0.20
X Pupil Position
Mag
nitu
de
-1.0 -0.70 0 0.70 1.0
0.00
0.05
0.10
0.15
0.20
0.25
X Pupil Position
Mag
nitu
de
-1.0 -0.70 0 0.70 1.0
0.00
0.05
0.10
0.15
0.20
0.25
X Pupil Position
Mag
nitu
de
-1.0 -0.70 0 0.70 1.0
L1
L2
L3L1
L2
L3
200/200/200 200/150/200
100/150/200 100/200/200
Effective sampling of 3rd
order aberration at 0.70 and the edge of the
pupil
(b) (a)
(c) (b) (a)
(d) (c)

Fig. 3. Wheel aberration target with 0°–180°,90°–270°, Fig. 4. Multiple π-phase regions in a single target: 45°–225°, and 135°–315° azimuthal orientations. (a) multiple open phase box test object; Chromeless π-phase shift design. (b) multiple open phase circle test object (c) & (d) variations of open phase test targets using circular and square shaped elements.
Fig. 5. Effects of astigmatism on wheel aberration target through focus. Images at 157nm, 0.85NA, 0.30σ in resist. Target dimensions L1=100nm, L2=150nm, L3=200nm.
(a)
(d) (b)
(c)
90° 45°
0°
315° 270°
225°
180°
135°
(a) -3rd order astigmatism Focus +/- 0.12 um
(b) +3rd order astigmatism Focus +/- 0.12 um
(c) +3rd order 45° astigmatism Focus +/- 0.12 um
(d) -3rd order 45° astigmatism Focus +/- 0.12 um
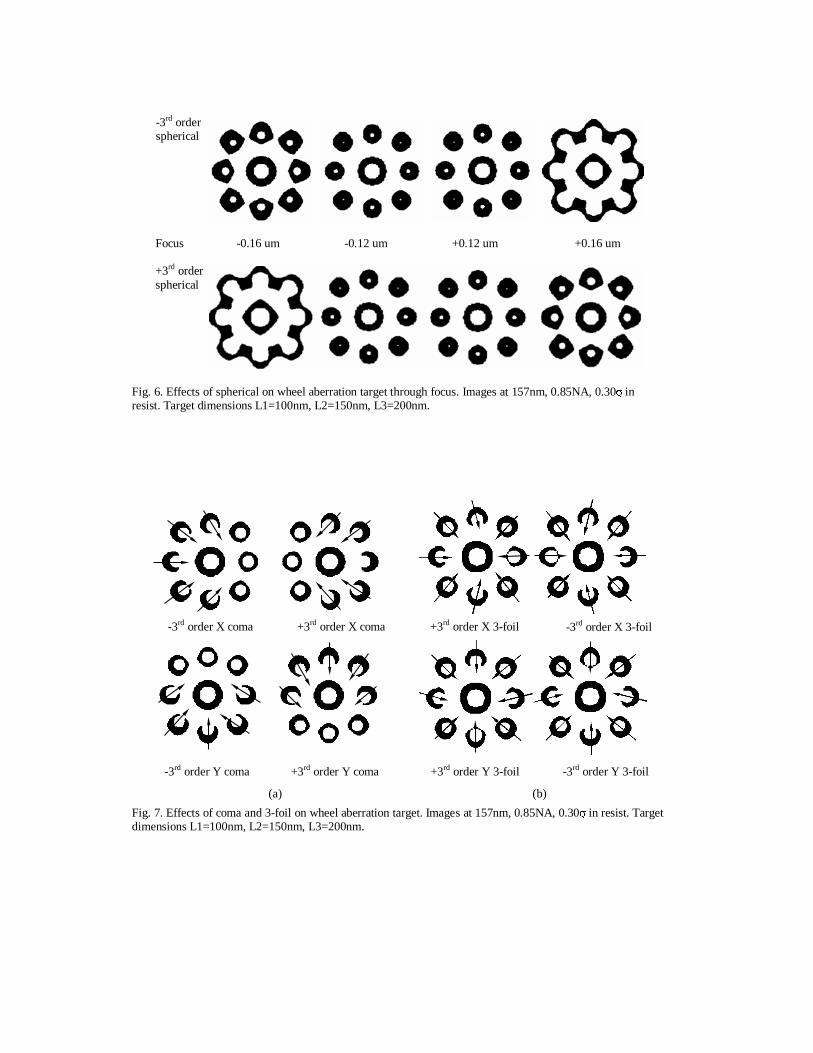
Fig. 6. Effects of spherical on wheel aberration target through focus. Images at 157nm, 0.85NA, 0.30σ �in resist. Target dimensions L1=100nm, L2=150nm, L3=200nm.
Fig. 7. Effects of coma and 3-foil on wheel aberration target. Images at 157nm, 0.85NA, 0.30σ �in resist. Target dimensions L1=100nm, L2=150nm, L3=200nm.
-3rd order X coma +3rd order X coma+3rd order X 3-foil -3rd order X 3-foil
-3rd order X coma +3rd order X coma
-3rd order Y coma +3rd order Y coma
+3rd order X 3-foil -3rd order X 3-foil
+3rd order Y 3-foil -3rd order Y 3-foil
(a) (b)
Focus -0.16 um -0.12 um +0.12 um +0.16 um +3rd order spherical
-3rd order spherical

Fig. 8. Effect of multiple aberrations on wheel aberration targets using: (a) aberration-free lens; (b) programmed random aberrations of 0.03λ RMS OPD with 0.10 microns of defocus; (c) lens system with RMS OPD error > 0.05λ and observing pattern in resist.
Fig. 9. Lens A phase wheel target image data and fits through focus. Target dimensions L1=200nm, L2=250nm, L3=200nm (2:2.5:2).
(a) (b) (c)
0 um
+0.05 um
+0.10 um
+0.15 um
-0.05 um
-0.10 um
-0.15 um
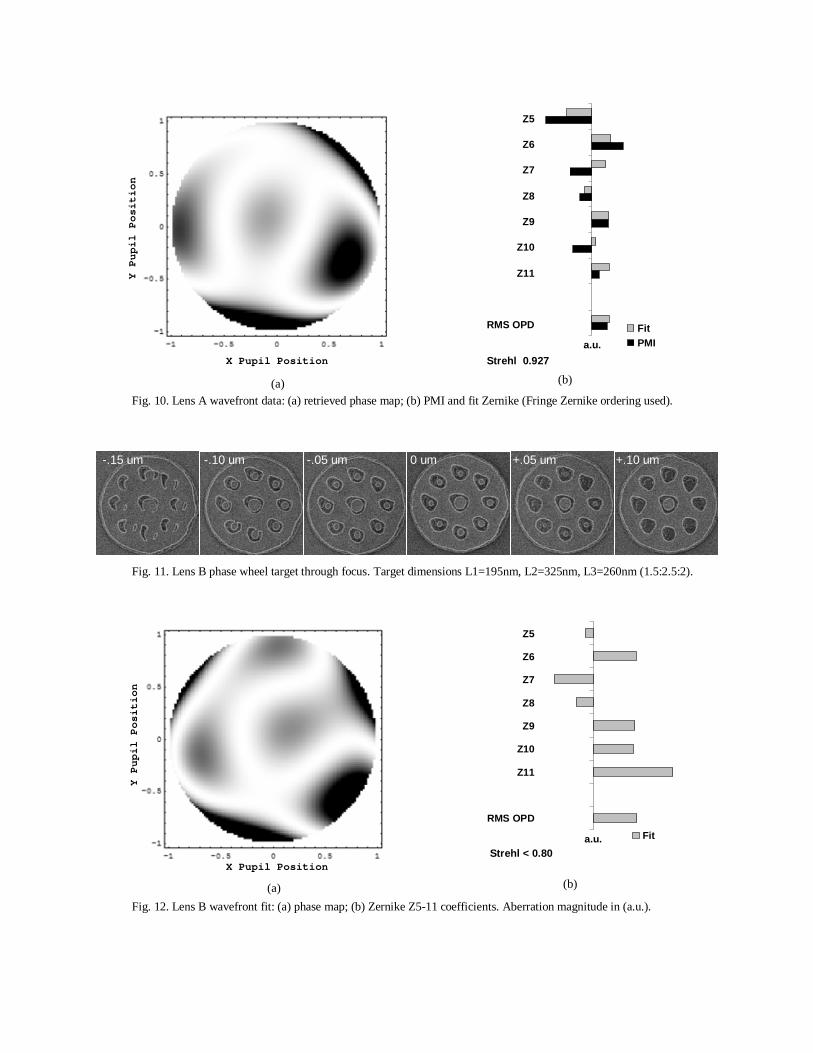
Fig. 10. Lens A wavefront data: (a) retrieved phase map; (b) PMI and fit Zernike (Fringe Zernike ordering used).
Fig. 11. Lens B phase wheel target through focus. Target dimensions L1=195nm, L2=325nm, L3=260nm (1.5:2.5:2).
Fig. 12. Lens B wavefront fit: (a) phase map; (b) Zernike Z5-11 coefficients. Aberration magnitude in (a.u.).
a.u.
FitPMI
X Pupil Position
Y Pupil Position
Strehl 0.927
Z5
Z6
Z7
Z8
Z9
Z10
Z11
RMS OPD
(a) (b)
0 um +.05 um +.10 um -.05 um -.10 um -.15 um
Z5
Z6
Z7
Z8
Z9
Z10
Z11
RMS OPD
X Pupil Position
Y Pupil Position
Strehl < 0.80 a.u. Fit
(a) (b)
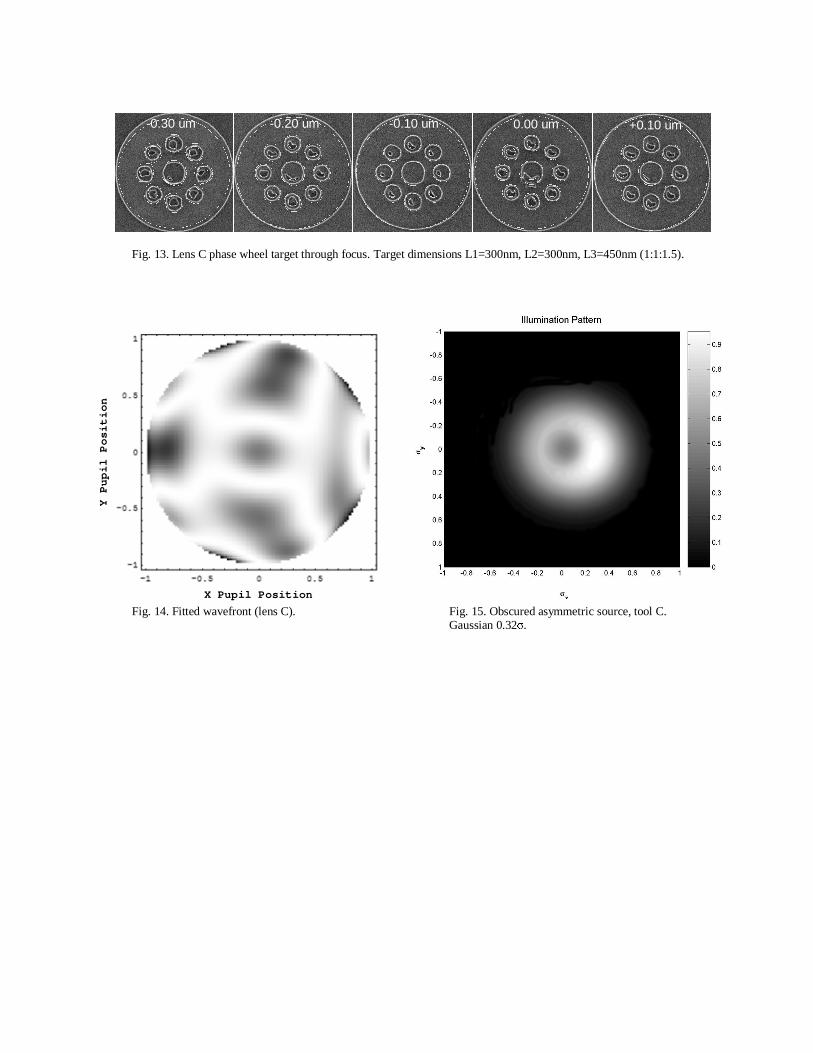
Fig. 13. Lens C phase wheel target through focus. Target dimensions L1=300nm, L2=300nm, L3=450nm (1:1:1.5).
Fig. 14. Fitted wavefront (lens C). Fig. 15. Obscured asymmetric source, tool C. Gaussian 0.32σ.
0.00 um +0.10 um -0.10 um -0.30 um -0.20 um
X Pupil Position
Y Pupil Position