Embed Size (px)
Citation preview

InFo
cus
Seri
es
Global Folding Carton Market Outlook to 2021
www.commodityinside.com
2
Contents
Co
nte
nts
Table of Contents
Chapter-1 Executive Summary
Chapter-2 Introduction and methodology
Chapter-3 Major folding carton markets
Chapter-4 End use sectors
Chapter-5 Trade analysis of the folding carton market
Chapter-6 Major trends and developments
Chpater-7 Brexit and its implications on the folding carton market
Chpater-8 Leading companies in the folding carton market
Appendix-A Trade statistics 2011-2015
Appendix-B Macroeconomic forecasts in selected countries and regions 2013-2021

3
Table of contents
Tab
le o
f co
nte
nts
1.1 Folding carton in the regional perspective
1.2 End use sectors dynamics
1.3 Emerging trends and its implications
1.4 Key conclusions and recommendations
Chapter 1- Executive summary
Chapter 3- Major folding carton markets
3.1 Asia
3.1.1 China
3.1.2 India
3.1.3 Indonesia
3.1.4 Japan
3.1.5 South Korea
3.2 Europe
3.2.1 France
3.2.2 Germany
Chapter 2- Introduction and methodology
2.1 Introduction and assumptions
2.2 Aims and objectives
2.3 Methodology
4
Table of contents
Tab
le o
f co
nte
nts
3.2.3 Italy
3.2.4 Poland
3.2.5 Russia
3.2.6 Turkey
3.2.7 UK
3.3 Central and South America
3.3.1 Brazil
3.3.2 Argentina
3.4 North America
3.4.1 Canada
3.4.2 Mexico
3.4.3 USA
3.5 Middle East and Africa
3.5.1 Saudi Arabia
3.5.2 South Africa
3.6 Oceania
3.6.1 Australia
Chapter 4- Major end use sectors
4.1 Food
4.1.1 Beverage multipack
4.1.2 Cereals
4.1.3 Chilled food
4.1.4 Confectionery

5
Table of contents
Tab
le o
f co
nte
nts
4.1.5 Dairy food
4.1.6 Dried food
4.1.7 Fresh food
4.1.8 Frozen food
4.1.9 Other food
4.2 Non-food
4.2.1 Health care
4.2.2 Home Care
4.2.3 Personal Care
4.2.4 Tobacco
4.2.5 White goods & consumer electronics
4.2.6 Other non-food
Chapter 5- Trade analysis of the folding carton market
5.1 Trends analysis
Chapter 6- Major trends and developments
6.1 Alternative packaging
6.2 Brands and brand owners
6.3 Consumer behaviour
6.4 Demography
6.5 Economic developments

6
Table of contents
Tab
le o
f co
nte
nts
6.6 Efficient and cost effective supply chain
6.7 Environment and suitability
6.8 Excessive packaging
6.9 Globalisation
6.10 Health and wellbeing
6.11 Online retailing
6.12 Printing and technological changes
Chapter 7- Brexit and its implication on the folding carton market
7.1 Process and options after triggering article 50 and its implications for the folding carton market
7.2 Trade patterns analysis
Chapter 8- Leading companies in the folding carton market
8.1 AR Packaging
8.1.1 Brief Overview
8.1.2 Recent M&A
8.1.3 Challenges, opportunities and strategies
8.2 Graphic Packaging Holding Company
8.2.1 Brief Overview
8.2.2 Recent M&A
8.2.3 Financials
8.2.4 Challenges, opportunities and strategies

7
Table of contents
Tab
le o
f co
nte
nts
8.3 Mayr-Melnhof Group
8.3.1 Brief Overview
8.3.2 Recent M&A
8.3.3 Challenges, opportunities and strategies
8.4 PaperWorks Industries
8.4.1 Brief Overview
8.4.2 Recent M&A
8.4.3 Challenges, opportunities and strategies
8.5 Smurfit Kappa
8.5.1 Brief Overview
8.5.2 Recent M&A
8.5.3 Challenges, opportunities and strategies
8.6 WestRock Company
8.6.1 Brief Overview
8.6.2 Recent M&A
8.6.3 Financials
8.6.4 Challenges, opportunities and strategies
8.8 List of other major companies
Appendix A- Trade statistics 2011-2015
Appendix B- Macroeconomic forecasts in selected countries and regions 2013-2021

8
Table of contents
Tab
le o
f co
nte
nts
List of tables
Table 1.1: Global folding carton consumption by region 2013- 2021 (million tonnes) Table 1.2: Global folding carton consumption by region 2013- 2021 ($ billions) Table 1. 3: Folding carton demand segmentations by 9 food sectors 2013-2021 (million tonnes) Table 1. 4: Folding carton demand segmentations by 6 non-food sectors 2013-2021(million tonnes) Table 1. 5: Folding carton demand segmentations by 9 food sectors 2013-2021 ($ billions) Table 1. 6: Folding carton demand segmentations by 6 non-food sectors 2013-2021($ billions) Table 3.1: Chinese folding carton demand and annual growth 2013-2021 (million tonnes, %) Table 3.2: Chinese folding carton demand and annual growth 2013-2021 ($ billions, %) Table 3.3: Indian folding carton demand and annual growth 2013-2021 (million tonnes, %) Table 3.4: Indian folding carton demand and annual growth 2013-2021 ($ billions, %) Table 3.5: Indonesian folding carton demand and annual growth 2013-2021 (million tonnes, %) Table 3.6: Indonesian folding carton demand and annual growth 2013-2021 ($ billions, %) Table 3.7: Japanese folding carton demand and annual growth 2013-2021 (million tonnes, %) Table 3.8: Japanese folding carton demand and annual growth 2013-2021 ($ billions, %) Table 3.9: South Korean folding carton demand and annual growth 2013-2021 (million tonnes, %) Table 3.10: South Korean folding carton demand and annual growth 2013-2021 ($ billions, %) Table 3.11: Brazilian folding carton demand and annual growth 2013-2021 (million tonnes, %) Table 3.12: Brazilian folding carton demand and annual growth 2013-2021 ($ billions, %) Table 3.13: Argentinean folding carton demand and annual growth 2013-2021 (million tonnes, %) Table 3.14: Argentinean folding carton demand and annual growth 2013-2021 ($ billions, %) Table 3.15: French folding carton demand and annual growth 2013-2021 (million tonnes, %) Table 3.16: French folding carton demand and annual growth 2013-2021 ($ billions, %)

9
Table of contents
Tab
le o
f co
nte
nts
Table 3.17: German folding carton demand and annual growth 2013-2021 (million tonnes, %) Table 3.18: German folding carton demand and annual growth 2013-2021 ($ billions, %) Table 3.19: Italian folding carton demand and annual growth 2013-2021 (million tonnes, %) Table 3.20: Italian folding carton demand and annual growth 2013-2021 ($ billions, %) Table 3.21: Polish folding carton demand and annual growth 2013-2021 (million tonnes, %) Table 3.22: Polish folding carton demand and annual growth 2013-2021 ($ billions, %) Table 3.23: Russian folding carton demand and annual growth 2013-2021 (million tonnes, %) Table 3.24: Russian folding carton demand and annual growth 2013-2021 ($ billions, %) Table 3.25: Turkish folding carton demand and annual growth 2013-2021 (million tonnes, %) Table 3.26: Turkish folding carton demand and annual growth 2013-2021 ($ billions, %) Table 3.27: UK folding carton demand and annual growth 2013-2021 (million tonnes, %) Table 3.28: UK folding carton demand and annual growth 2013-2021 ($ billions, %) Table 3.29: Canadian folding carton demand and annual growth 2013-2021 (million tonnes, %) Table 3.30: Canadian folding carton demand and annual growth 2013-2021 ($ billions, %) Table 3.31: Mexican folding carton demand and annual growth 2013-2021 (million tonnes, %) Table 3.32: Mexican folding carton demand and annual growth 2013-2021 ($ billions, %) Table 3.33: US folding carton demand and annual growth 2013-2021 (million tonnes, %) Table 3.34: US folding carton demand and annual growth 2013-2021 ($ billions, %) Table 3.35: South African folding carton demand and annual growth 2013-2021 (million tonnes, %) Table 3.36: South African folding carton demand and annual growth 2013-2021 ($ billions, %) Table 3.37: Saudi Arabian folding carton demand and annual growth 2013-2021 (million tonnes, %) Table 3.38: Saudi Arabian folding carton demand and annual growth 2013-2021 ($ billions, %) Table 3.39: Australian folding carton demand and annual growth 2013-2021 (million tonnes, %) Table 3.40: Australian folding carton demand and annual growth 2013-2021 ($ billions, %)

10
Table of contents
Tab
le o
f co
nte
nts
Table 4.1: Folding carton demand by the beverage multipack sector 2013-2021 (tonnes, % change) Table 4.2: Folding carton demand by the beverage multi-pack sector 2013-2021 ($ billions, % change) Table 4.3: Folding carton demand by the breakfast cereals sector 2013-2021 (tonnes, % change) Table 4.4: Folding carton demand by the breakfast cereals sector 2013-2021 ($ billions, % change) Table 4.5: Folding carton demand by the chilled food sector 2013-2021 (tonnes, % change) Table 4.6: Folding carton demand by the chilled food sector 2013-2021 ($ billions, % change) Table 4.7: Folding carton demand by the confectionery sector 2013-2021 (tonnes, % change) Table 4.8: Folding carton demand by the confectionery sector 2013-2021 ($ billions, % change) Table 4.9: Folding carton demand by the dairy food sector 2013-2021 (tonnes, % change) Table 4.10: Folding carton demand by the dairy food sector 2013-2021 ($ billions, % change) Table 4.11: Folding carton demand by the dried food sector 2013-2021 (tonnes, % change) Table 4.12: Folding carton demand by the dried food sector 2013-2021 ($ billions, % change) Table 4.13: Folding carton demand by the fresh food sector 2013-2021 (tonnes, % change) Table 4.14: Folding carton demand by the fresh food sector 2013-2021 ($ billions, % change) Table 4.15: Folding carton demand by the frozen food sector 2013-2021 (tonnes, % change) Table 4.16: Folding carton demand by the frozen food sector 2013-2021 ($ billions, % change) Table 4.17: Folding carton demand by the other food sector 2013-2021 (tonnes, % change) Table 4.18: Folding carton demand by the other food sector 2013-2021 ($ billions, % change) Table 4.19: Folding carton demand by the healthcare sector 2013-2021 (tonnes, % change) Table 4.20: Folding carton demand by the healthcare sector 2013-2021 ($ billions, % change) Table 4.21: Folding carton demand by the homecare sector 2013-2021 (tonnes, % change) Table 4.22: Folding carton demand by the homecare sector 2013-2021 ($ billions, % change) Table 4.23: Folding carton demand by the personal care sector 2013-2021 (tonnes, % change) Table 4.24: Folding carton demand by the personal care sector 2013-2021 ($ billions, % change) Table 4.25: Folding carton demand by the tobacco sector 2013-2021 (tonnes, % change)

11
Table of contents
Tab
le o
f co
nte
nts
Table 4.26: Folding carton demand by the tobacco sector 2013-2021 ($ billions, % change) Table 4.27: Folding carton demand by the white goods & consumer electronics sector 2013-2021 (tonnes, % change) Table 4.28: Folding carton demand by the white goods & consumer electronics sector 2013-2021 ($ billions, % change) Table 4.29: Folding carton demand by the other non-food sector 2013-2021 (tonnes, % change) Table 4.30: Folding carton demand by the other non-food sector 2013-2021 ($ billions, % change) Table 5.1: Top ten exporters of folding cartons in the world 2011-2015 ('000 tonnes) Table 5.2: Top ten importers of folding cartons in the world 2011-2015 ('000 tonnes) Table 5.3: Top ten net exporters of folding cartons in the world 2011-2015 ('000 tonnes) Table 5.4: Top ten net importers of folding cartons in the world 2011-2015 ('000 tonnes) Table 7.1: T he UK exports of folding carton 2001-2015 (000 tonnes) Table 7.2: T he UK imports of folding carton 2001-2015 (000 tonnes) Table 7.3: Top 10 exporters of folding carton to the UK 2001-2015 (000 tonnes) Table A.1: Net exports of folding carton by 150 countries 2011-2015 ('000 tonnes) Table A.2: Net exports of folding carton by 150 countries 2011-2015 ('000 tonnes) Table A.3: Net exports of folding carton by 150 countries 2011-2015 ('000 tonnes) Table A.4: Net exports of folding carton by 150 countries 2011-2015 ('000 tonnes) Table A.5: Net exports of folding carton by 150 countries 2011-2015 ('000 tonnes) Table A.6: Net exports of folding carton by 150 countries 2011-2015 ('000 tonnes) Table A.7: Net exports of folding carton by 151 countries 2011-2015 ($ millions) Table A.8: Net exports of folding carton by 151 countries 2011-2015 ($ millions) Table A.9: Net exports of folding carton by 151 countries 2011-2015 ($ millions) Table A.10: Net exports of folding carton by 151 countries 2011-2015 ($ millions)

12
Table of contents
Tab
le o
f co
nte
nts
Table A.11: Net exports of folding carton by 151 countries 2011-2015 ($ millions) Table A.12: Net exports of folding carton by 151 countries 2011-2015 ($ millions) Table B.1: Real GDP growth in selected countries (% growth) Table B.2: Real per capita GDP growth in selected countries (% growth) Table B.3: Population growth in selected countries (% growth)
List of tables
Figure 1.1: Global folding carton consumption by region 2013- 2020 (million tonnes) Figure 1.2: Global folding carton consumption by region 2013- 2020 ($ billions) Figure 1. 3: Folding carton demand segmentations by 9 food sectors (million tonnes) Figure 1. 4: Folding carton demand segmentations by 6 non-food sectors (million tonnes) Figure 1. 5: Folding carton demand segmentations by 9 food sectors ($ billions) Figure 1. 6: Folding carton demand segmentations by 6 non-food sectors ($ billions) Figure 3.1: Chinese folding carton demand and annual growth 2013-2021 (million tonnes, %) Figure 3.2: Chinese folding carton demand and annual growth 2013-2021 ($ billions, %) Figure 3.3: Indian folding carton demand and annual growth 2013-2021 (million tonnes, %) Figure 3.4: Indian folding carton demand and annual growth 2013-2021 ($ billions, %) Figure 3.5: Indonesian folding carton demand and annual growth 2013-2021 (million tonnes, %) Figure 3.6: Indonesian folding carton demand and annual growth 2013-2021 ($ billions, %) Figure 3.7: Japanese folding carton demand and annual growth 2013-2021 (million tonnes, %) Figure 3.8: Japanese folding carton demand and annual growth 2013-2021 ($ billions, %) Figure 3.9: South Korean folding carton demand and annual growth 2013-2021 (million tonnes, %) Figure 3.10: South Korean folding carton demand and annual growth 2013-2021 ($ billions, %)

13
Table of contents
Tab
le o
f co
nte
nts
Figure 3.11: Brazilian folding carton demand and annual growth 2013-2021 (million tonnes, %) Figure 3.12: Brazilian folding carton demand and annual growth 2013-2021 ($ billions, %) Figure 3.13: Argentinean folding carton demand and annual growth 2013-2021 (million tonnes, %) Figure 3.14: Argentinean folding carton demand and annual growth 2013-2021 ($ billions, %) Figure 3.15: French folding carton demand and annual growth 2013-2021 (million tonnes, %) Figure 3.16: French folding carton demand and annual growth 2013-2021 ($ billions, %) Figure 3.17: German folding carton demand and annual growth 2013-2021 (million tonnes, %) Figure 3.18: German folding carton demand and annual growth 2013-2021 ($ billions, %) Figure 3.19: Italian folding carton demand and annual growth 2013-2021 (million tonnes, %) Figure 3.20: Italian folding carton demand and annual growth 2013-2021 ($ billions, %) Figure 3.21: Polish folding carton demand and annual growth 2013-2021 (million tonnes, %) Figure 3.22: Polish folding carton demand and annual growth 2013-2021 ($ billions, %) Figure 3.23: Russian folding carton demand and annual growth 2013-2021 (million tonnes, %) Figure 3.24: Russian folding carton demand and annual growth 2013-2021 ($ billions, %) Figure 3.25: Turkish folding carton demand and annual growth 2013-2021 (million tonnes, %) Figure 3.26: Turkish folding carton demand and annual growth 2013-2021 ($ billions, %) Figure 3.27: UK folding carton demand and annual growth 2013-2021 (million tonnes, %) Figure 3.28: UK folding carton demand and annual growth 2013-2021 ($ billions, %) Figure 3.29: Canadian folding carton demand and annual growth 2013-2021 (million tonnes, %) Figure 3.30: Canadian folding carton demand and annual growth 2013-2021 ($ billions, %) Figure 3.31: Mexican folding carton demand and annual growth 2013-2021 (million tonnes, %) Figure 3.32: Mexican folding carton demand and annual growth 2013-2021 ($ billions, %) Figure 3.33: US folding carton demand and annual growth 2013-2021 (million tonnes, %) Figure 3.34: US folding carton demand and annual growth 2013-2021 ($ billions, %) Figure 3.35: South African folding carton demand and annual growth 2013-2021 (million tonnes, %)

14
Table of contents
Tab
le o
f co
nte
nts
Figure 3.36: South African folding carton demand and annual growth 2013-2021 ($ billions, %) Figure 3.37: Saudi Arabian folding carton demand and annual growth 2013-2021 (million tonnes, %) Figure 3.38: Saudi Arabian folding carton demand and annual growth 2013-2021 ($ billions, %) Figure 3.39: Australian folding carton demand and annual growth 2013-2021 (million tonnes, %) Figure 3.40: Australian folding carton demand and annual growth 2013-2021 ($ billions, %) Figure 4.1: Folding carton demand by the beverage multipack sector 2013-2021 (tonnes, % change) Figure 4.2: Folding carton demand by the beverage multi-pack sector 2013-2021 ($ billions, % change) Figure 4.3: Folding carton demand by the breakfast cereals sector 2013-2021 (tonnes, % change) Figure 4.4: Folding carton demand by the breakfast cereals sector 2013-2021 ($ billions, % change) Figure 4.5: Folding carton demand by the chilled food sector 2013-2021 (tonnes, % change) Figure 4.6: Folding carton demand by the chilled food sector 2013-2021 ($ billions, % change) Figure 4.7: Folding carton demand by the confectionery sector 2013-2021 (tonnes, % change) Figure 4.8: Folding carton demand by the confectionery sector 2013-2021 ($ billions, % change) Figure 4.9: Folding carton demand by the dairy food sector 2013-2021 (tonnes, % change) Figure 4.10: Folding carton demand by the dairy food sector 2013-2021 ($ billions, % change) Figure 4.11: Folding carton demand by the dried food sector 2013-2021 (tonnes, % change) Figure 4.12: Folding carton demand by the dried food sector 2013-2021 ($ billions, % change) Figure 4.13: Folding carton demand by the fresh food sector 2013-2021 (tonnes, % change) Figure 4.14: Folding carton demand by the fresh food sector 2013-2021 ($ billions, % change) Figure 4.15: Folding carton demand by the frozen food sector 2013-2021 (tonnes, % change) Figure 4.16: Folding carton demand by the frozen food sector 2013-2021 ($ billions, % change) Figure 4.17: Folding carton demand by the other food sector 2013-2021 (tonnes, % change) Figure 4.18: Folding carton demand by the other food sector 2013-2021 ($ billions, % change) Figure 4.19: Folding carton demand by the healthcare sector 2013-2021 (tonnes, % change) Figure 4.20: Folding carton demand by the healthcare sector 2013-2021 ($ billions, % change)

15
Table of contents
Tab
le o
f co
nte
nts
Figure 4.21: Folding carton demand by the homecare sector 2013-2021 (tonnes, % change) Figure 4.22: Folding carton demand by the homecare sector 2013-2021 ($ billions, % change) Figure 4.23: Folding carton demand by the personal care sector 2013-2021 (tonnes, % change) Figure 4.24: Folding carton demand by the personal care sector 2013-2021 ($ billions, % change) Figure 4.25: Folding carton demand by the tobacco sector 2013-2021 (tonnes, % change) Figure 4.26: Folding carton demand by the tobacco sector 2013-2021 ($ billions, % change) Figure 4.27: Folding carton demand by the white goods & consumer electronics sector 2013-2021 (tonnes, % change) Figure 4.28: Folding carton demand by the white goods & consumer electronics sector 2013-2021 ($ billions, % change) Figure 4.29: Folding carton demand by the other non-food sector 2013-2021 (tonnes, % change) Figure 4.30: Folding carton demand by the other non-food sector 2013-2021 ($ billions, % change) Figure 5.1: Top ten exporters of folding cartons in the world 2011-2015 ('000 tonnes) Figure 5.2: Top ten importers of folding cartons in the world 2011-2015 ('000 tonnes) Figure 5.3: Top ten net exporters of folding cartons in the world 2011-2015 ('000 tonnes) Figure 5.4: Top ten net importers of folding cartons in the world 2011-2015 ('000 tonnes) Figure 5.5: Folding carton imports and exports in the EU28 2011-2015 (000 tonnes) Figure 5.6: Folding carton imports within and outside the EU28 2011-2015 (000 tonnes) Figure 5.7: Folding carton exports within and outside the EU28 2011-2015 (000 tonnes) Figure 5.8: % share of top 5 importers of folding carton in the EU28 2011-2015 (000 tonnes) Figure 5.9: % share of top 5 exporters of folding carton in the EU28 2011-2015 (000 tonnes) Figure 7.1: The UK exports of folding carton 2001-2015 (000 tonnes) Figure 7.2: The UK imports of folding carton 2001-2015 (000 tonnes) Figure 7.3: Major steps for the UK leaving the EU Figure 7.4: Some of the available options in case of Brexit Figure 7.5: Brexit and its implications scenario

The healthcare market will be the leading market segment in the non-food sector, followed by tobacco. We expect that tobacco will further lose its market share due to a patchy way ahead for the sector.
Ch
apte
r 1
Table 1.4: Folding carton demand segmentations in non-food sectors 2013-2021 (million tonnes)
2013 2014 2015 2016 2017 2018 2019 2020 2021
Healthcare
Home care
Personal Care
Tobacco
White goods & consumer electronics
Others non-food
Total non-food
2013 2014 2015 2016 2017 2018 2019 2020 2021
Figure 1.4: Folding carton demand segmentations in non-food sectors 2013-2021 (million tonnes)
End
use
se
cto
rs d
ynam
ics
www.commodityinside.com

The tough competition ahead for the folding carton market from various alternative packaging as well as cost reduction strategies will hit the market in value terms.
Ch
apte
r 1
Table 1.5: Folding carton demand segmentations in food sectors ($ billions)
2013 2014 2015 2016 2017 2018 2019 2020 2021
Beverage multi-pack
Cereals
Chilled foods
Confectionery
Dairy food
Dried food
Fresh food
Frozen food
Others food
Total food
2013 2014 2015 2016 2017 2018 2019 2020 2021
Figure 1.5: Folding carton demand segmentations in food sectors ($ billions)
End
use
se
cto
rs d
ynam
ics
www.commodityinside.com
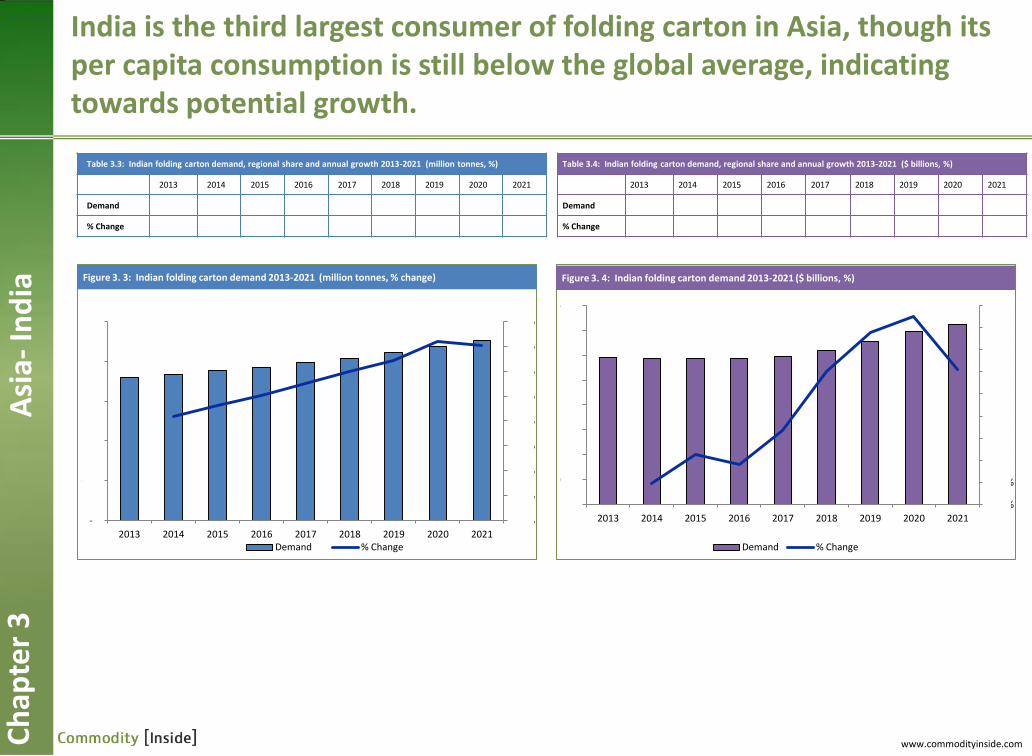
India is the third largest consumer of folding carton in Asia, though its per capita consumption is still below the global average, indicating towards potential growth.
Asi
a- In
dia
Table 3.3: Indian folding carton demand, regional share and annual growth 2013-2021 (million tonnes, %)
2013 2014 2015 2016 2017 2018 2019 2020 2021
Demand
% Change
0.0%
0.5%
1.0%
1.5%
2.0%
2.5%
3.0%
3.5%
4.0%
-
0.5
1.0
1.5
2.0
2.5
2013 2014 2015 2016 2017 2018 2019 2020 2021 Demand % Change
Figure 3. 3: Indian folding carton demand 2013-2021 (million tonnes, % change)
Ch
apte
r 3
Table 3.4: Indian folding carton demand, regional share and annual growth 2013-2021 ($ billions, %)
2013 2014 2015 2016 2017 2018 2019 2020 2021
Demand
% Change
-2.0%
-1.0%
0.0%
1.0%
2.0%
3.0%
4.0%
5.0%
6.0%
7.0%
-
0.5
1.0
1.5
2.0
2.5
3.0
3.5
4.0
2013 2014 2015 2016 2017 2018 2019 2020 2021
Demand % Change
Figure 3. 4: Indian folding carton demand 2013-2021 ($ billions, %)
www.commodityinside.com
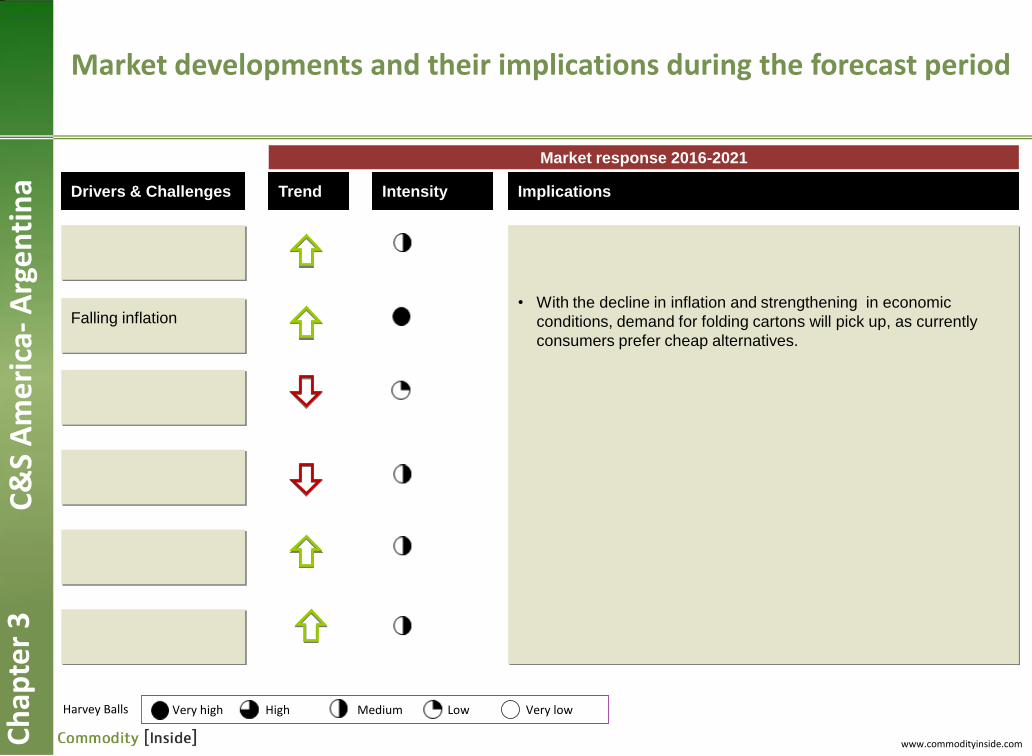
Market developments and their implications during the forecast period
Drivers & Challenges Intensity
Falling inflation
• With the decline in inflation and strengthening in economic
conditions, demand for folding cartons will pick up, as currently
consumers prefer cheap alternatives.
Harvey Balls
Implications
Very high Medium Low Very low High
Trend
Market response 2016-2021
Ch
apte
r 3
C
&S
Am
eri
ca-
Arg
en
tin
a
www.commodityinside.com

The food sector will continue to remain the largest consumer of folding cartons, accounting for nearly 70% of the demand.
•The population growth supported by a huge pool of expatriates will result in a stable growth in the mass grocery retails sector during our forecast period. The country recently unveiled its Vision 2030 which goals include economic diversification. This huge ambitious plan is partly a response to low oil prices. Manufacturing of finished products for both domestic and export market is among hundreds of other initiatives outlined in the plan which is expected to drive demand for folding cartons.
•Confectionary, bakery, dairy and dried food will be some of the major categories in the food sector to support demand for folding carton over the forecast period. Folding cartons will continue to grow in both primary and secondary packaging categories. Given competition among brand owners, folding carton will continue to be used as a marketing tool to add a premium image to the product.
• We expect that folding cartons will register a significant increase in ready meals, chilled food and food on the go in growth terms, though in volume terms demand will still be lower compared to matured countries. Some of the major factors which will support this trend will be young population (nearly half of Saudi population is under 25), busier lifestyle (unemployment is expected to decline), more women will be in employment (expected changes in the Nitaqat program).
ME
& A
fric
a- S
aud
i Ara
bia
C
hap
ter
3
www.commodityinside.com

Beverage multipack
Ch
apte
r 4
Fo
od
- B
eve
rage
mu
ltip
ack
Table 4.1: Folding carton demand in beverage multipack (tonnes, % change)
2013 2014 2015 2016 2017 2018 2019 2020 2021
Demand 0.59 0.63 0.65 0.68 0.70 0.72 0.74 0.76 0.78
% Change 5.42% 4.08% 3.73% 3.09% 2.89% 2.87% 2.76% 2.76%
0.0%
1.0%
2.0%
3.0%
4.0%
5.0%
6.0%
-
0.1
0.2
0.3
0.4
0.5
0.6
0.7
0.8
0.9
2013 2014 2015 2016 2017 2018 2019 2020 2021
Figure 4.1: Folding carton demand in beverage multipack (tonnes, %change)
Table 4.2: Folding carton demand in beverage multipack($ billions, % change)
2013 2014 2015 2016 2017 2018 2019 2020 2021
Demand
% Change 3.89% 0.78% 3.01% 2.54% 3.29% 4.26% 4.44% 4.31%
0.0%
0.5%
1.0%
1.5%
2.0%
2.5%
3.0%
3.5%
4.0%
4.5%
5.0%
-
0.2
0.4
0.6
0.8
1.0
1.2
1.4
1.6
2013 2014 2015 2016 2017 2018 2019 2020 2021
Figure 4.2: Folding carton demand in beverage multipack ($ billions, %change)
www.commodityinside.com

The beverage multipack market will continue to face competition from shrink films.
Ch
apte
r 4
Fo
od
- B
eve
rage
mu
lti-
pac
k • The multipack folding carton market is mainly driven by higher/premium products, where folding
cartons are used as a secondary packaging to enhance the presentation. However, we expect that shrink film to take some further share from multipack folding cartons. The shrink film market in the beverage sector is three times higher than the multipack folding cartons.
• TEXT REMOVED
www.commodityinside.com

• Drilling down further, one of the major
reasons behind the increased imports in
2015 was .......
TEXT REMOVED
The EU28 became a
net importer of folding
carton in 2015 …
0
500
1,000
1,500
2,000
2,500
2011 2012 2013 2014 2015
EU28_Intra EU28_Extra
Figure 5.6 Folding carton imports within and outside the EU 2011-2015 (000 tonnes)
-
500
1,000
1,500
2,000
2011 2012 2013 2014 2015 EU28_Intra EU28_Extra
Figure 5.7 Folding carton exports within and outside the EU28 2011-2015 (000 tonnes)
0
500
1,000
1,500
2,000
2,500
2011 2012 2013 2014 2015 Imports Exports
Figure 5.5: Folding carton imports and exports in the EU28 2011-2015 (000 tonnes)
Folding cartons trade in the EU28 remained almost steady since 2011 with the exception in 2015 when imports hiked, and the region became a net importer for the first time.
… though the required
additional tonnages
were sourced within the
region (mainly from
Germany).
0%
20%
40%
60%
80%
100%
2011 2012 2013 2014 2015
France Netherlands Germany
Czech Republic Spain Rest of EU28
Figure 5.8: % share of the top 5 importers of folding carton in the EU28 2011-2015 (000 tonnes)
0%
20%
40%
60%
80%
100%
2011 2012 2013 2014 2015 Germany Netherlands Belgium Poland Austria Rest of EU28
Figure 5.9: % share of top 5 exporters of folding carton in the EU28 2011-2015 (000 tonnes)
Looking at the historical trends, the EU28
exports to rest of the world did not make a
significant part of the trade. Despite the fact
that folding cartons are relatively cost
effective to transport (compared to
corrugated boxes/cases).
Ch
apte
r 5
T
rad
e a
nal
ysis

Short-lived Long-lived
Below will be some major implications on the UK folding carton industry after invoking Article 50.
Impact period/time span
Negotiation starts Negotiation ends
Lo
w
Hig
h
Negotiations process
Imp
ac
t in
ten
sit
y
1
3 4
7 2
Each number in the circle denotes its related impact. Explanation on the proceeding pages.
0 year 2nd year
6 5
Bre
xit
and
its
imp
licat
ion
s C
hap
ter
7
Figure 7.5: Brexit and its implication scenario
www.commodityinside.com
Opportunities and
competitive
advantages
Strategic direction
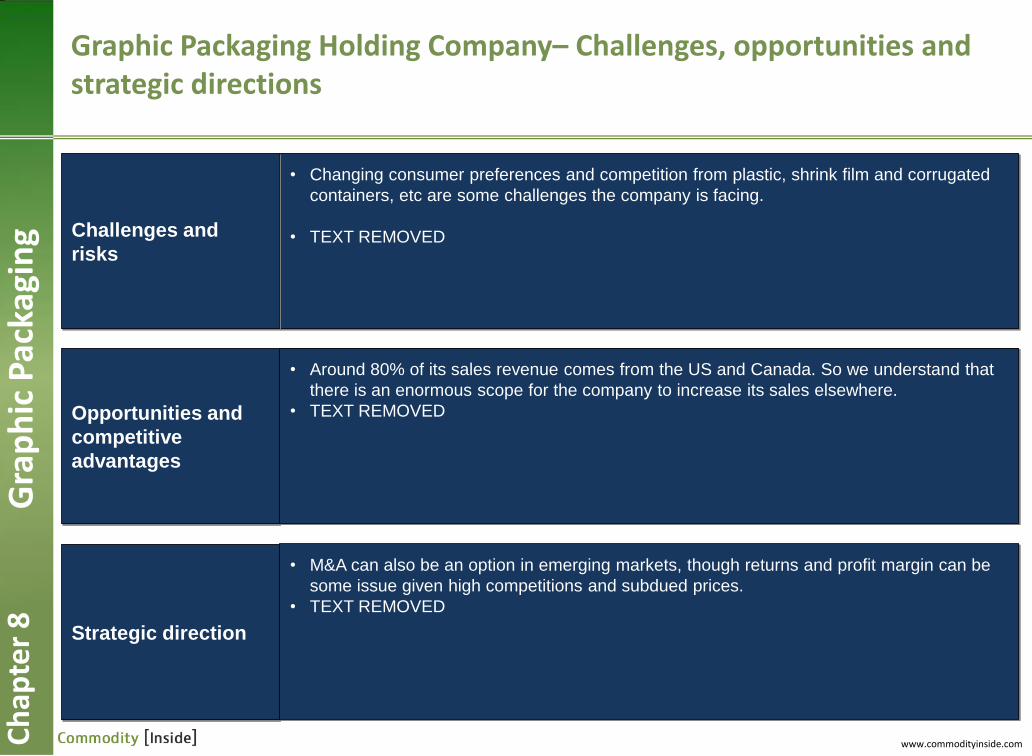
• Changing consumer preferences and competition from plastic, shrink film and corrugated
containers, etc are some challenges the company is facing.
• TEXT REMOVED Challenges and
risks
• Around 80% of its sales revenue comes from the US and Canada. So we understand that
there is an enormous scope for the company to increase its sales elsewhere.
• TEXT REMOVED
• M&A can also be an option in emerging markets, though returns and profit margin can be
some issue given high competitions and subdued prices.
• TEXT REMOVED
Graphic Packaging Holding Company– Challenges, opportunities and strategic directions
Ch
apte
r 8
G
rap
hic
Pac
kagi
ng
www.commodityinside.com

For further information about this report and additional research, please visit
www.commodityinside.com
or contact us at
www.commodityinside.com