Embed Size (px)
Citation preview
<#>
© 2012 Morningstar, Inc. All rights reserved.
In Search of SkillMorningstar Investment Management’s Approach to Selecting Managers
Bill HardingHead of Manager Research, Morningstar Investment Management
The Challenge
× Active management is zero-sum game: superior investors earn positive alpha, inferior investors generate negative alpha
× Average actively managed fund doesn’t capture alpha net of fees× Good news is that academic research reveals manager skill may exist× Challenge is to identify those superior managers beforehand and limit
exposure to inferior managers
Research on Performance Persistence
× Ibbotson and Patel (2002) found that funds with highest alpha against returns-based style benchmark outperform
× Peterson, Iachini, and Lam (2011) found evidence of persistence in alpha among separately managed accounts over 1 to 3-year periods
× Harlow and Brown (2006) found that selecting funds with higher past alpha and lower expenses significantly increases probability of identifying future superior managers
× Kosowski, Timmermann, Wermers, and White (2006) found significant persistence in alphas of top decile managers based on a bootstrap analysis that adjusts for non-normality in fund alphas
Research on Fund Characteristics
× Morningstar study of mutual fund stewardship (2011) found that funds with higher levels of manager ownership of funds’ shares earned higher risk-adjusted returns relative to category peers.
× Morningstar stewardship study (2011) revealed a more positive assessment of a firm’s culture led to better manager retention and better risk-adjusted performance.
× Morningstar and Kinnel (2010) found that funds with lower expense ratios tend to outperform.
× Cremers and Petajisto (2009) found that active share is a significant predicator of future alpha. Multivariate regressions revealed funds with highest active shares, smaller assets, and best one-year performance produces highest future alpha.
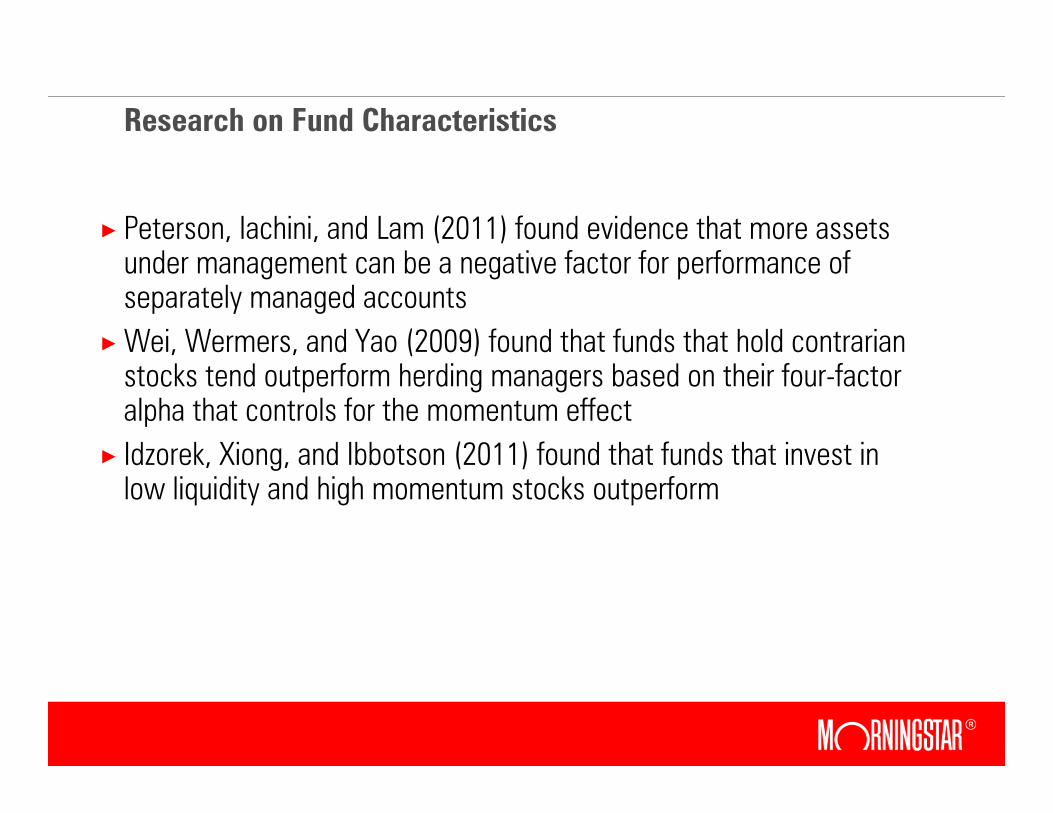
Research on Fund Characteristics
× Peterson, Iachini, and Lam (2011) found evidence that more assets under management can be a negative factor for performance of separately managed accounts
× Wei, Wermers, and Yao (2009) found that funds that hold contrarian stocks tend outperform herding managers based on their four-factor alpha that controls for the momentum effect
× Idzorek, Xiong, and Ibbotson (2011) found that funds that invest in low liquidity and high momentum stocks outperform
Manager Evaluation Process
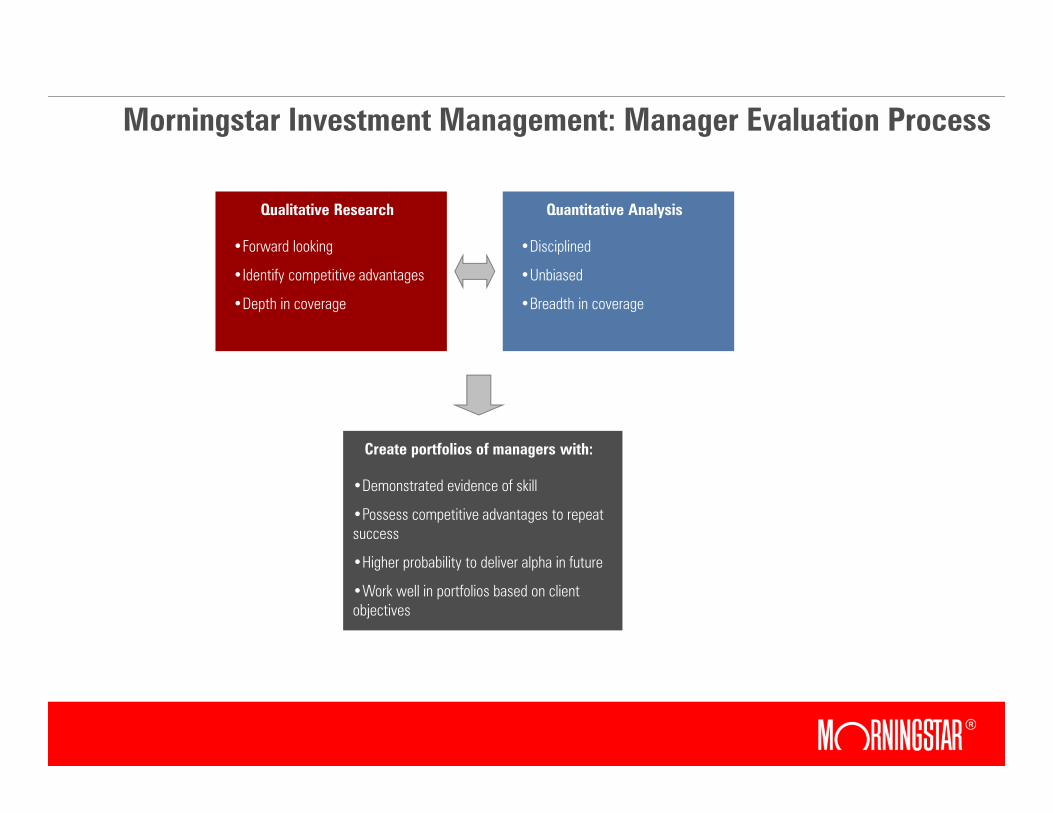
Morningstar Investment Management: Manager Evaluation Process
Quantitative AnalysisQualitative Research
•Disciplined
•Unbiased
•Breadth in coverage
•Forward looking
•Identify competitive advantages
•Depth in coverage
Create portfolios of managers with:
•Demonstrated evidence of skill
•Possess competitive advantages to repeat success
•Higher probability to deliver alpha in future
•Work well in portfolios based on client objectives
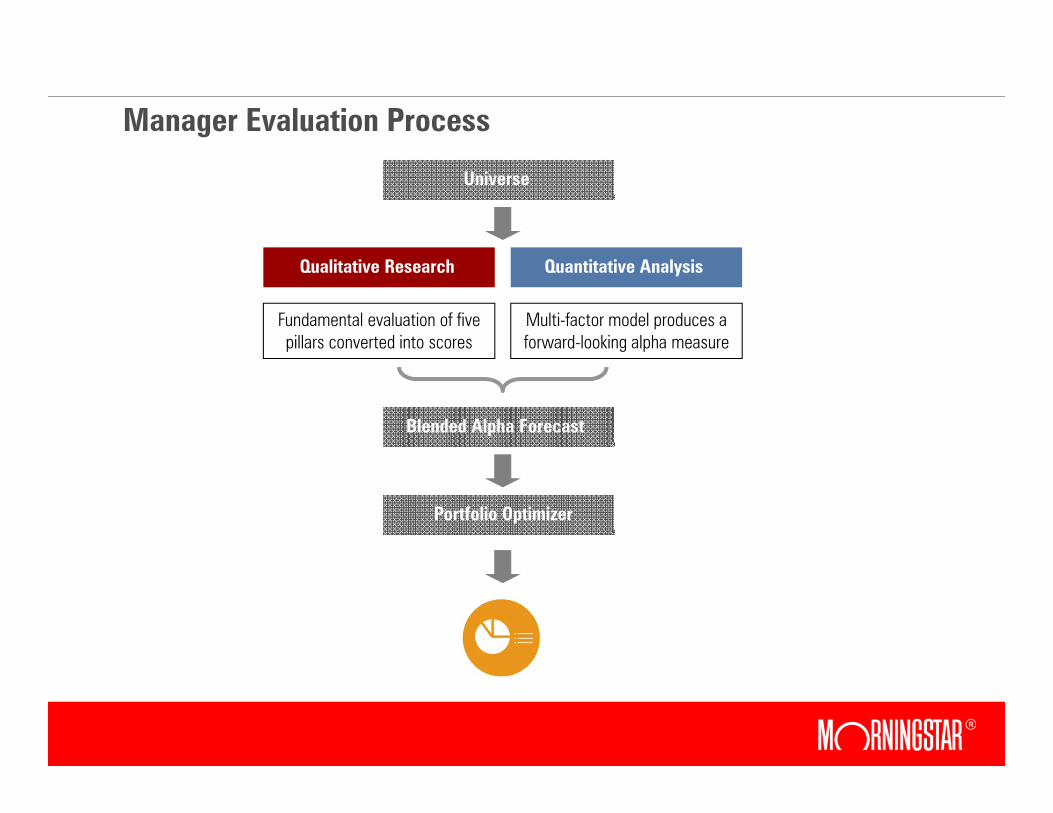
Manager Evaluation Process
Universe
Quantitative AnalysisQualitative Research
Fundamental evaluation of five pillars converted into scores
Multi-factor model produces a forward-looking alpha measure
Blended Alpha Forecast
Portfolio Optimizer
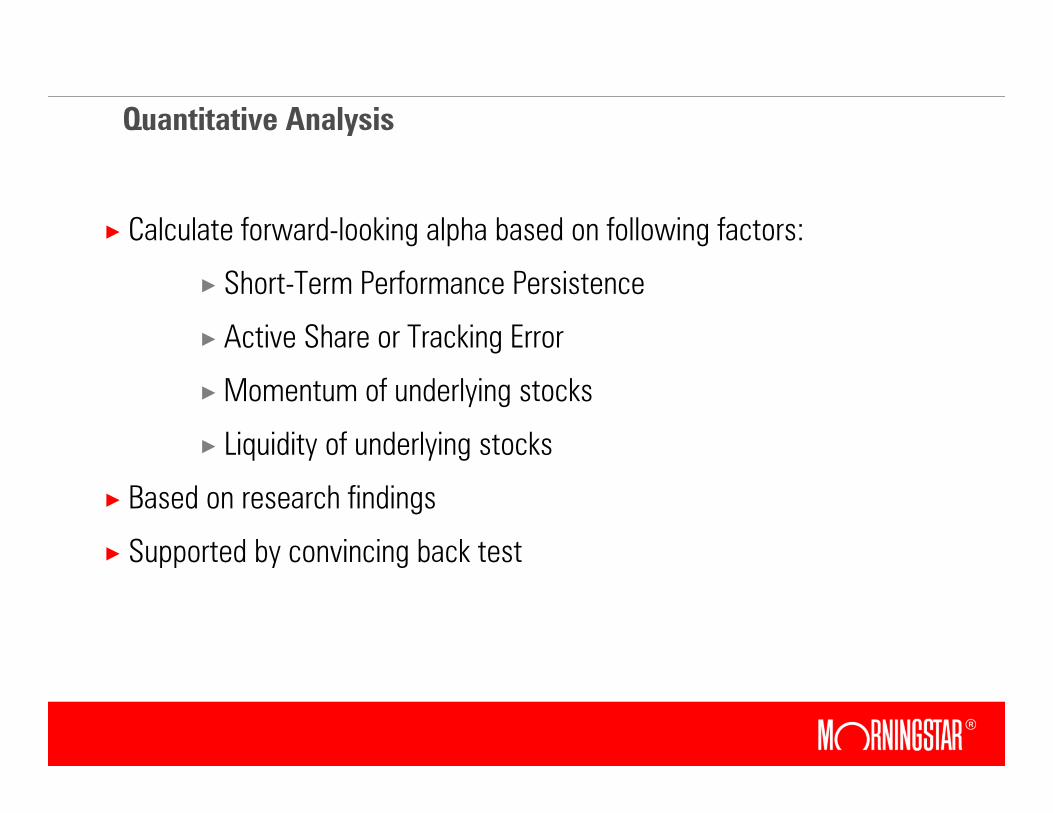
× Calculate forward-looking alpha based on following factors:
× Short-Term Performance Persistence
× Active Share or Tracking Error
× Momentum of underlying stocks
× Liquidity of underlying stocks
× Based on research findings
× Supported by convincing back test
Quantitative Analysis
Qualitative Research: Five Pillars
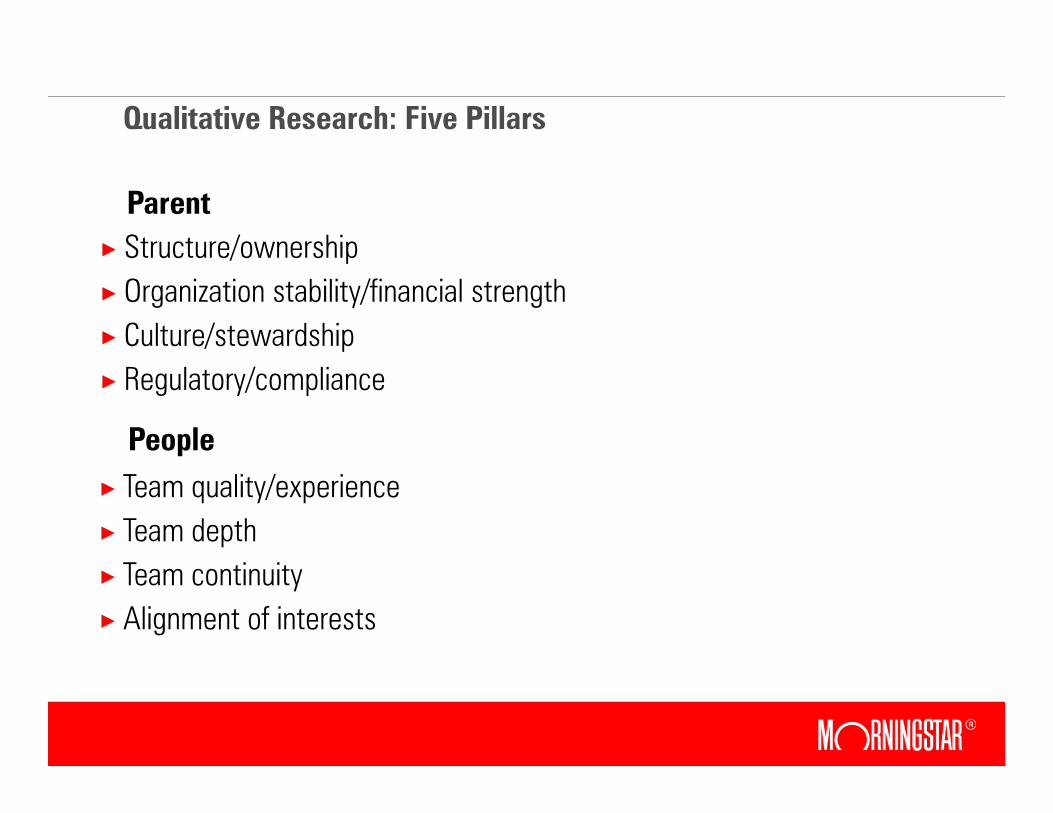
× Structure/ownership× Organization stability/financial strength× Culture/stewardship× Regulatory/compliance
Parent
People× Team quality/experience× Team depth× Team continuity× Alignment of interests
Qualitative Research: Five Pillars
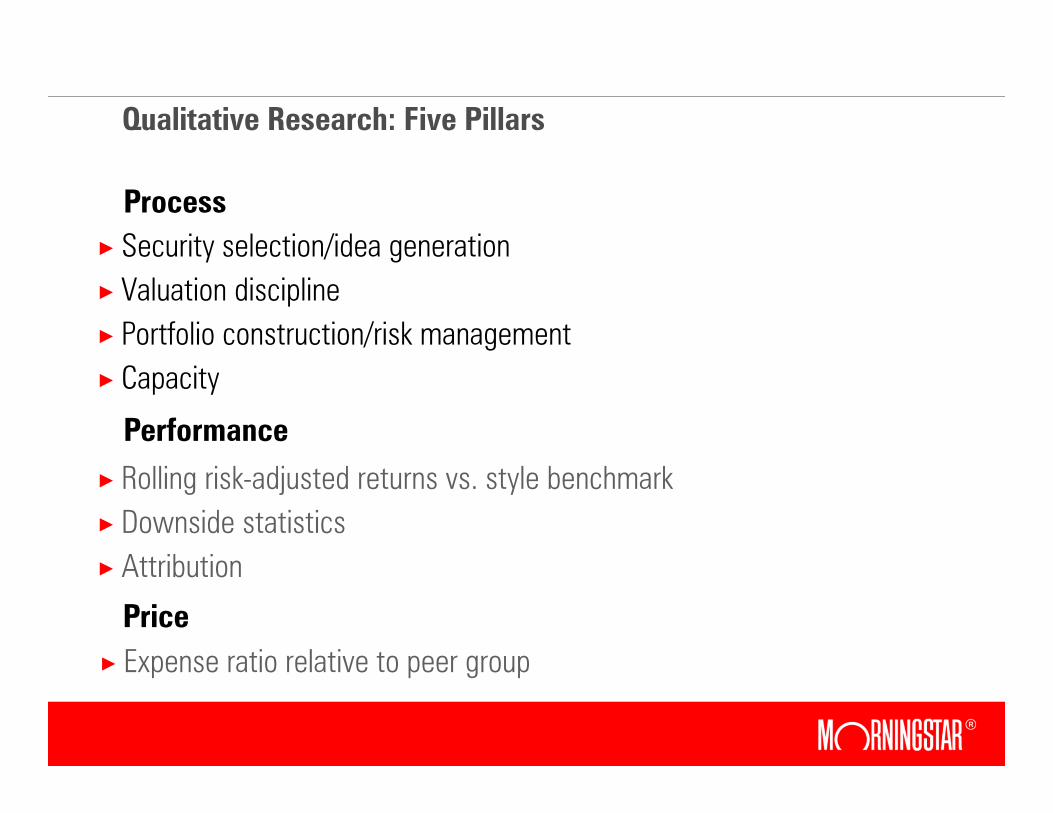
× Security selection/idea generation× Valuation discipline× Portfolio construction/risk management× Capacity
Process
Performance
× Rolling risk-adjusted returns vs. style benchmark× Downside statistics× Attribution
Price× Expense ratio relative to peer group
Portfolio Construction
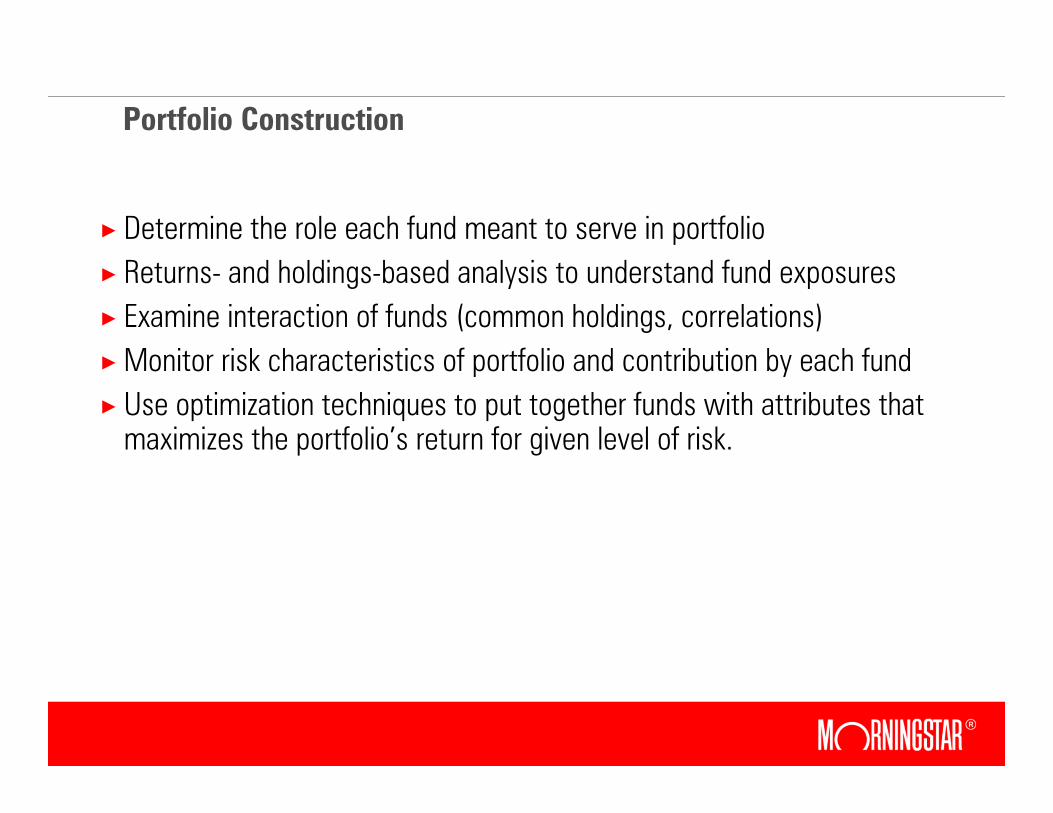
× Determine the role each fund meant to serve in portfolio× Returns- and holdings-based analysis to understand fund exposures× Examine interaction of funds (common holdings, correlations)× Monitor risk characteristics of portfolio and contribution by each fund× Use optimization techniques to put together funds with attributes that
maximizes the portfolio’s return for given level of risk.
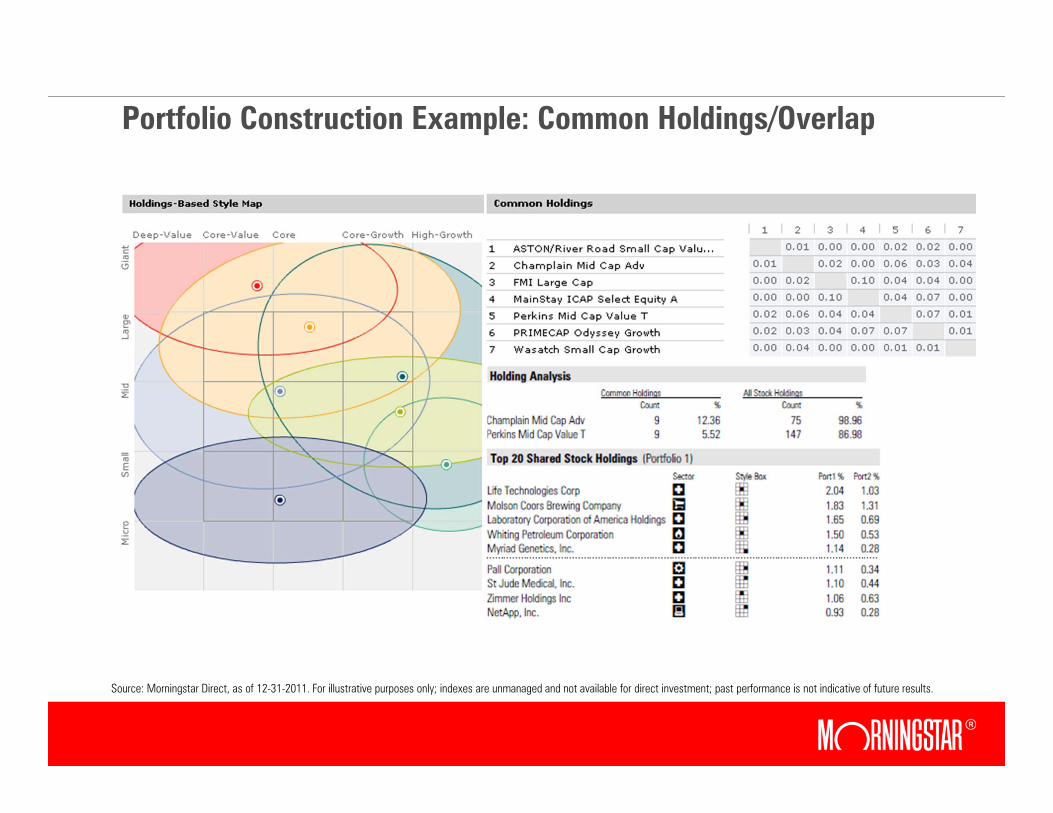
Portfolio Construction Example: Common Holdings/Overlap
Source: Morningstar Direct, as of 12-31-2011. For illustrative purposes only; indexes are unmanaged and not available for direct investment; past performance is not indicative of future results.
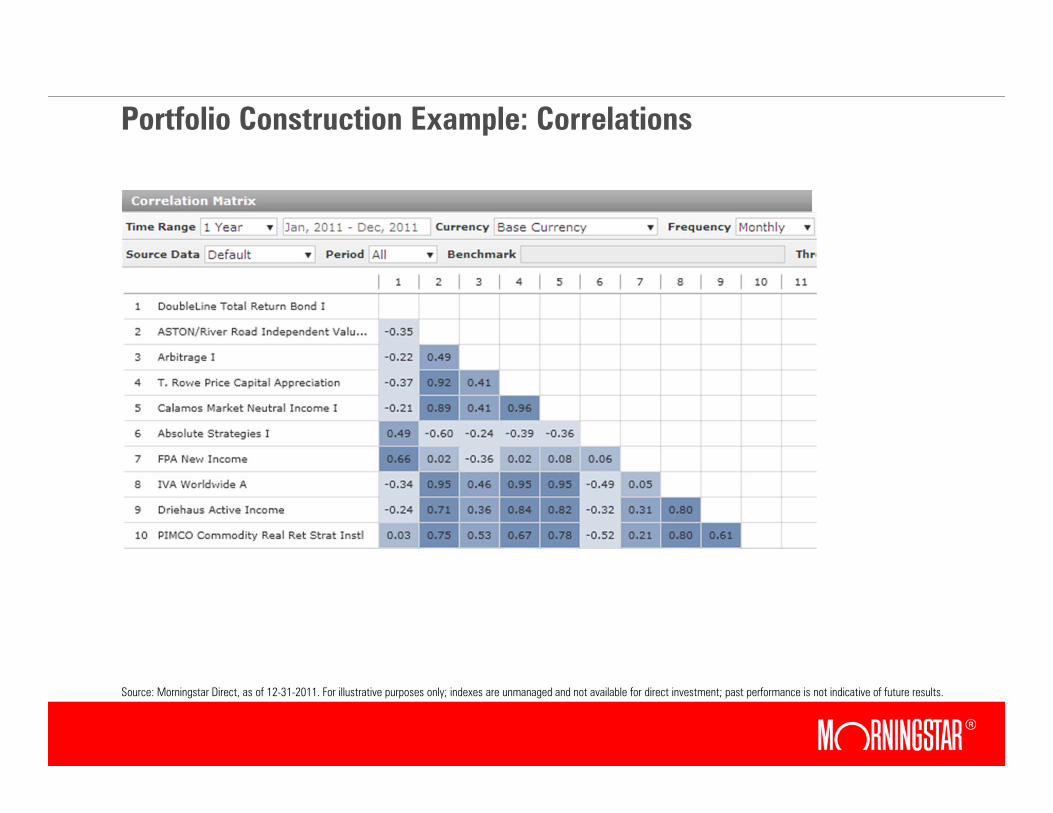
Portfolio Construction Example: Correlations
Source: Morningstar Direct, as of 12-31-2011. For illustrative purposes only; indexes are unmanaged and not available for direct investment; past performance is not indicative of future results.
Due Diligence Process
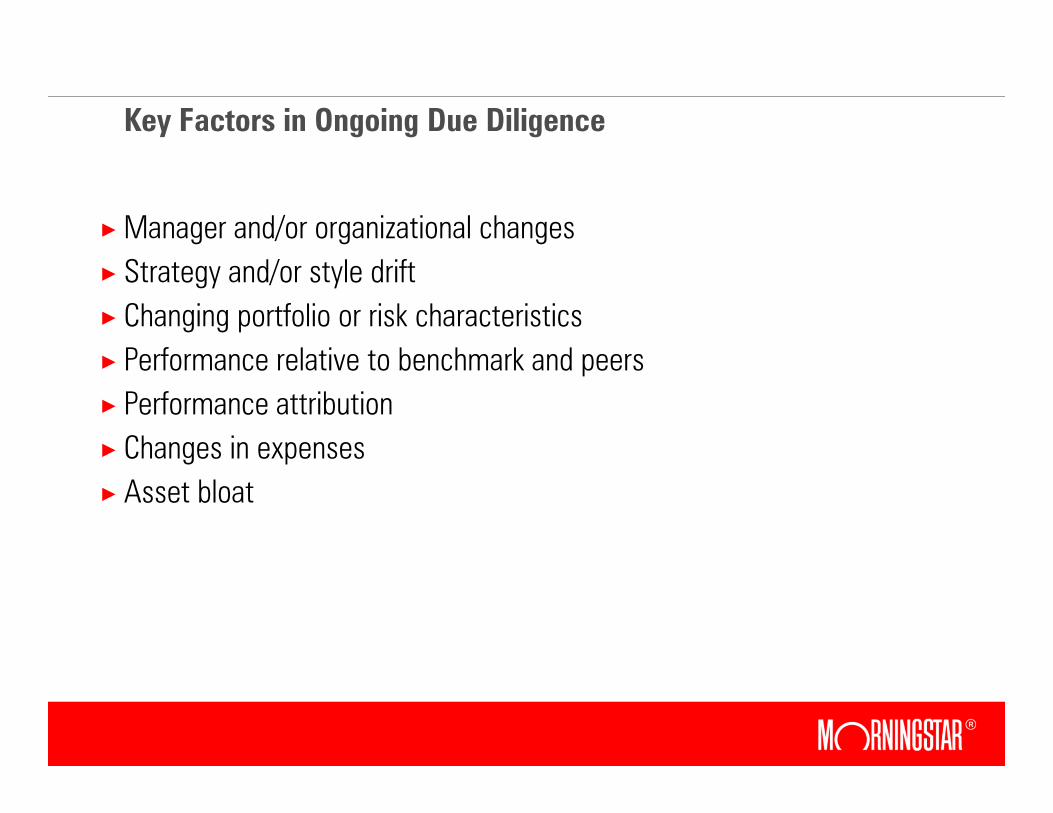
Key Factors in Ongoing Due Diligence
× Manager and/or organizational changes× Strategy and/or style drift × Changing portfolio or risk characteristics × Performance relative to benchmark and peers× Performance attribution× Changes in expenses× Asset bloat
Due Diligence Toolkit
× Qualitative research× Performance analysis and attribution× Holdings-based analysis× Return-based style analysis
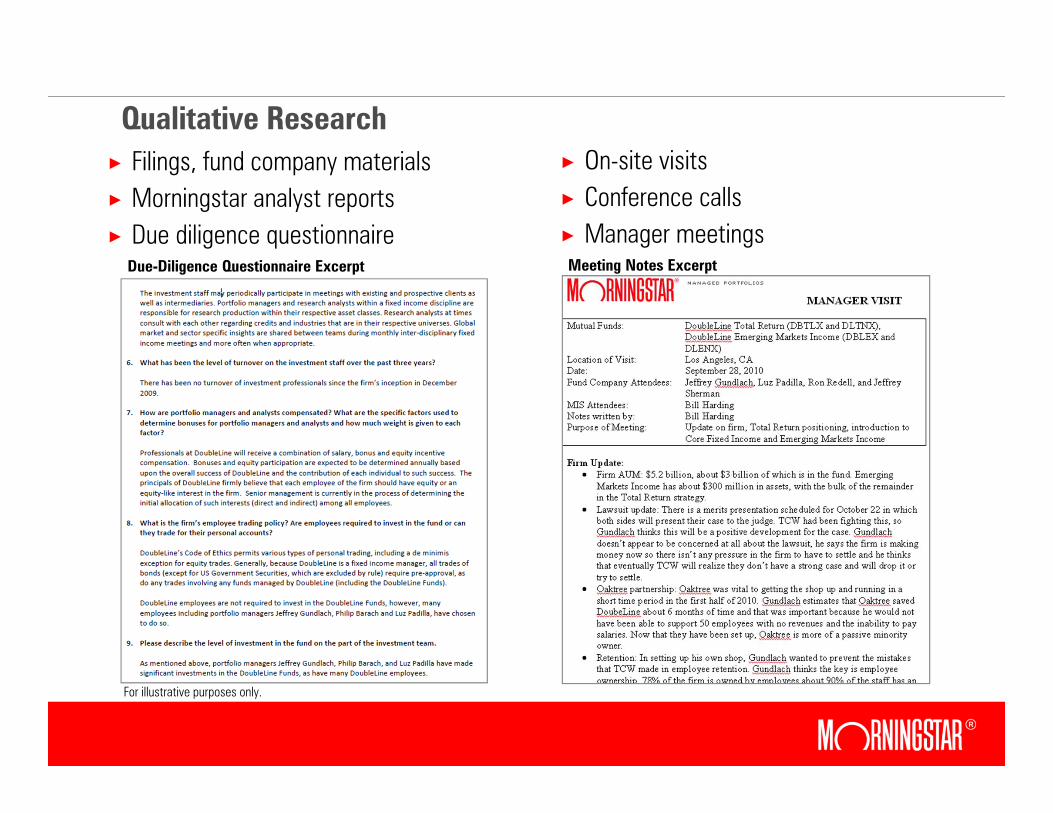
Qualitative Research × Filings, fund company materials× Morningstar analyst reports× Due diligence questionnaire
× On-site visits× Conference calls× Manager meetings
Due-Diligence Questionnaire Excerpt Meeting Notes Excerpt
For illustrative purposes only.
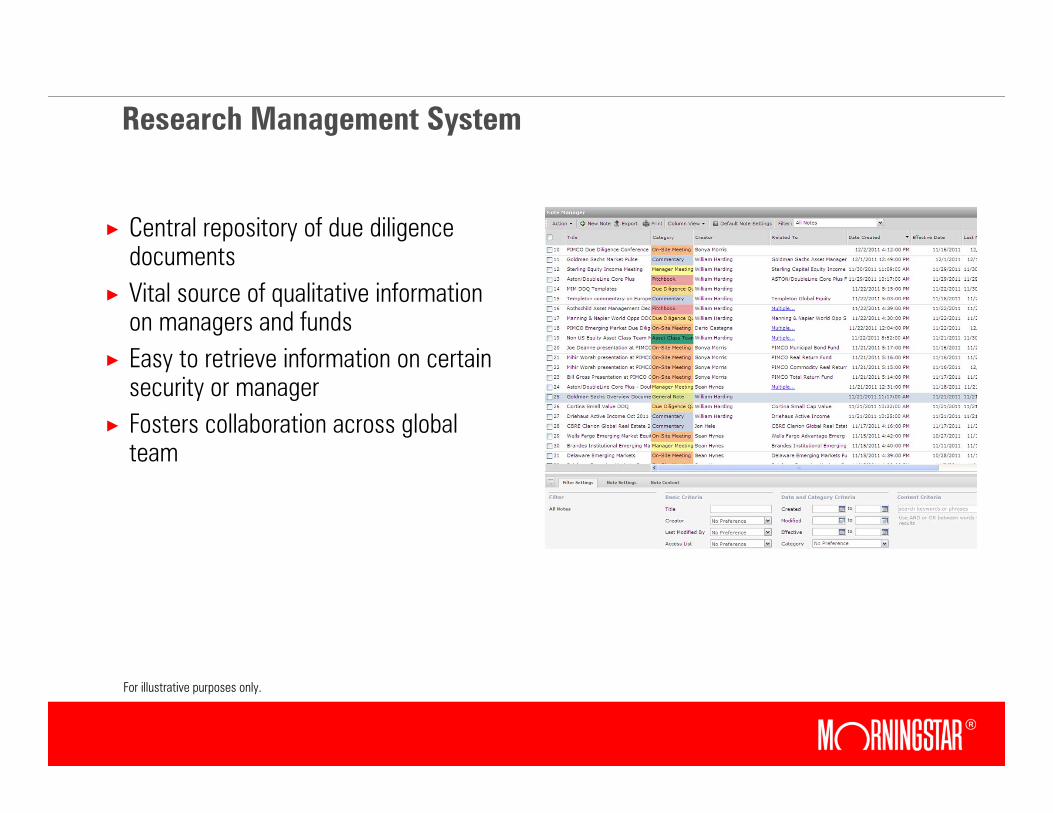
Research Management System
× Central repository of due diligence documents
× Vital source of qualitative information on managers and funds
× Easy to retrieve information on certain security or manager
× Fosters collaboration across global team
For illustrative purposes only.
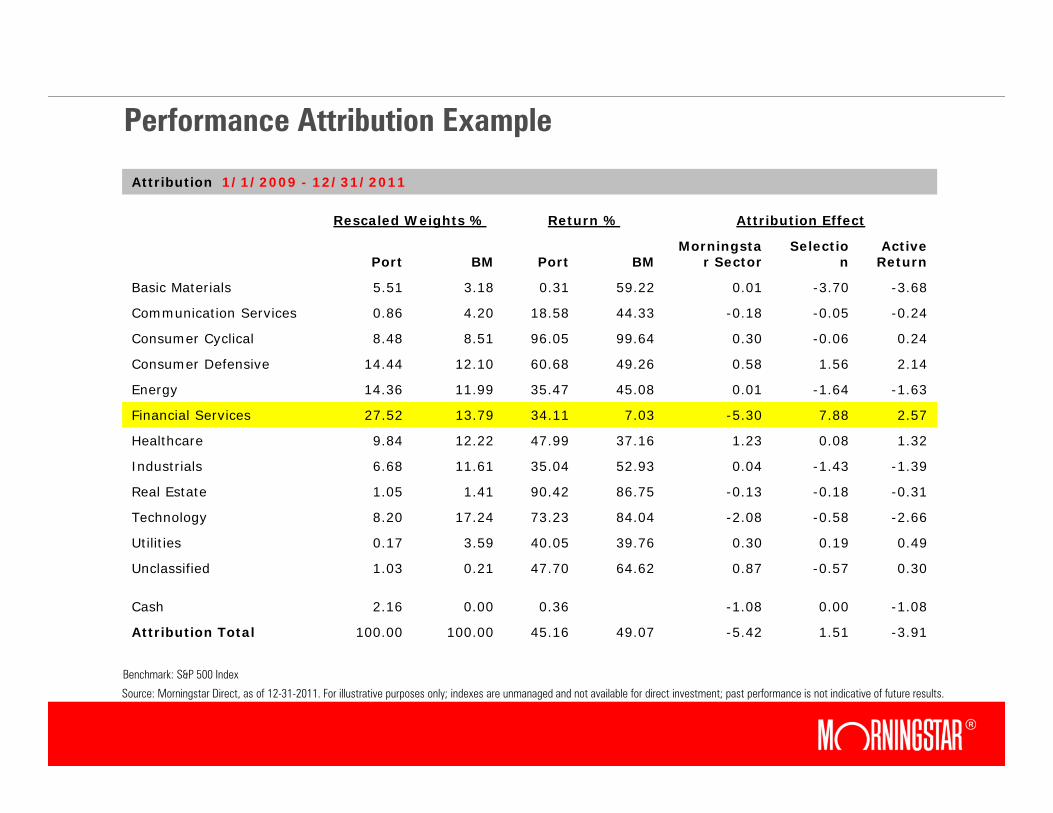
Performance Attribution Example
Source: Morningstar Direct, as of 12-31-2011. For illustrative purposes only; indexes are unmanaged and not available for direct investment; past performance is not indicative of future results.
Benchmark: S&P 500 Index
Attribution 1/1/2009 - 12/31/2011
Rescaled Weights % Return % Attribution Effect
Port BM Port BMMorningsta
r SectorSelectio
nActive
Return
Basic Materials 5.51 3.18 0.31 59.22 0.01 -3.70 -3.68
Communication Services 0.86 4.20 18.58 44.33 -0.18 -0.05 -0.24
Consumer Cyclical 8.48 8.51 96.05 99.64 0.30 -0.06 0.24
Consumer Defensive 14.44 12.10 60.68 49.26 0.58 1.56 2.14
Energy 14.36 11.99 35.47 45.08 0.01 -1.64 -1.63
Financial Services 27.52 13.79 34.11 7.03 -5.30 7.88 2.57
Healthcare 9.84 12.22 47.99 37.16 1.23 0.08 1.32
Industrials 6.68 11.61 35.04 52.93 0.04 -1.43 -1.39
Real Estate 1.05 1.41 90.42 86.75 -0.13 -0.18 -0.31
Technology 8.20 17.24 73.23 84.04 -2.08 -0.58 -2.66
Utilities 0.17 3.59 40.05 39.76 0.30 0.19 0.49
Unclassified 1.03 0.21 47.70 64.62 0.87 -0.57 0.30
Cash 2.16 0.00 0.36 -1.08 0.00 -1.08
Attribution Total 100.00 100.00 45.16 49.07 -5.42 1.51 -3.91
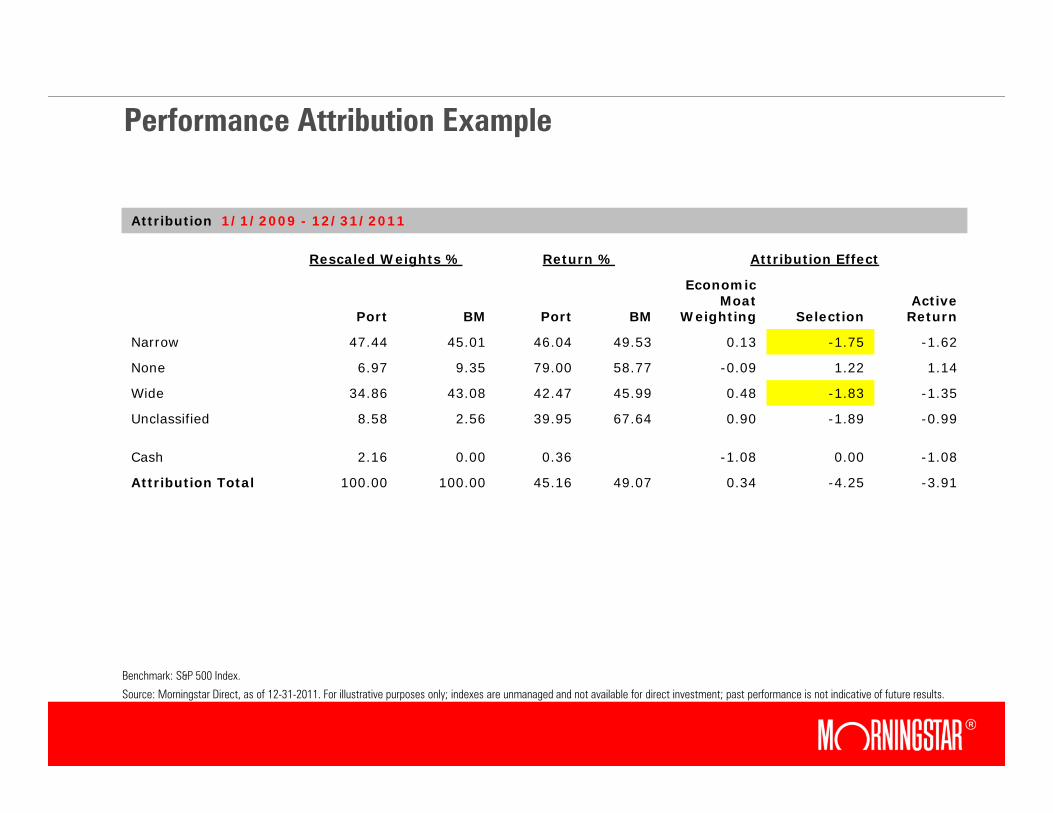
Performance Attribution Example
Source: Morningstar Direct, as of 12-31-2011. For illustrative purposes only; indexes are unmanaged and not available for direct investment; past performance is not indicative of future results.
Benchmark: S&P 500 Index.
Attribution 1/1/2009 - 12/31/2011
Rescaled Weights % Return % Attribution Effect
Port BM Port BM
Economic Moat
Weighting SelectionActive
Return
Narrow 47.44 45.01 46.04 49.53 0.13 -1.75 -1.62
None 6.97 9.35 79.00 58.77 -0.09 1.22 1.14
Wide 34.86 43.08 42.47 45.99 0.48 -1.83 -1.35
Unclassified 8.58 2.56 39.95 67.64 0.90 -1.89 -0.99
Cash 2.16 0.00 0.36 -1.08 0.00 -1.08
Attribution Total 100.00 100.00 45.16 49.07 0.34 -4.25 -3.91
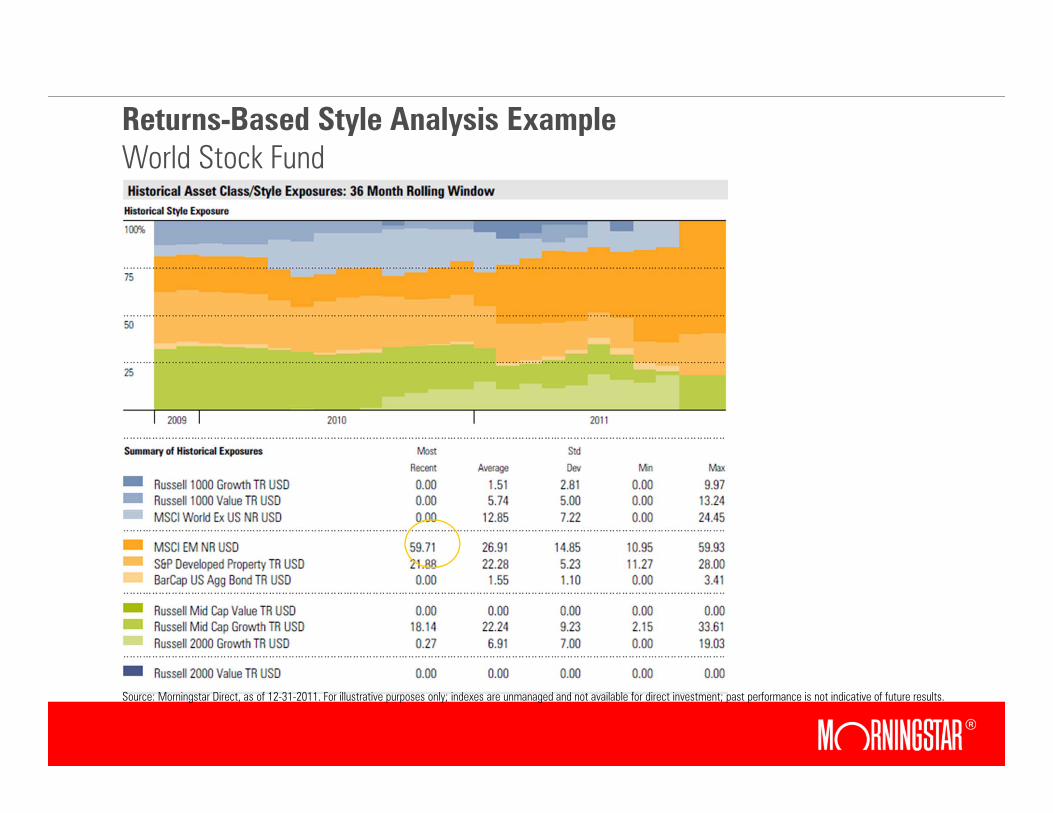
Returns-Based Style Analysis ExampleWorld Stock Fund
Source: Morningstar Direct, as of 12-31-2011. For illustrative purposes only; indexes are unmanaged and not available for direct investment; past performance is not indicative of future results.
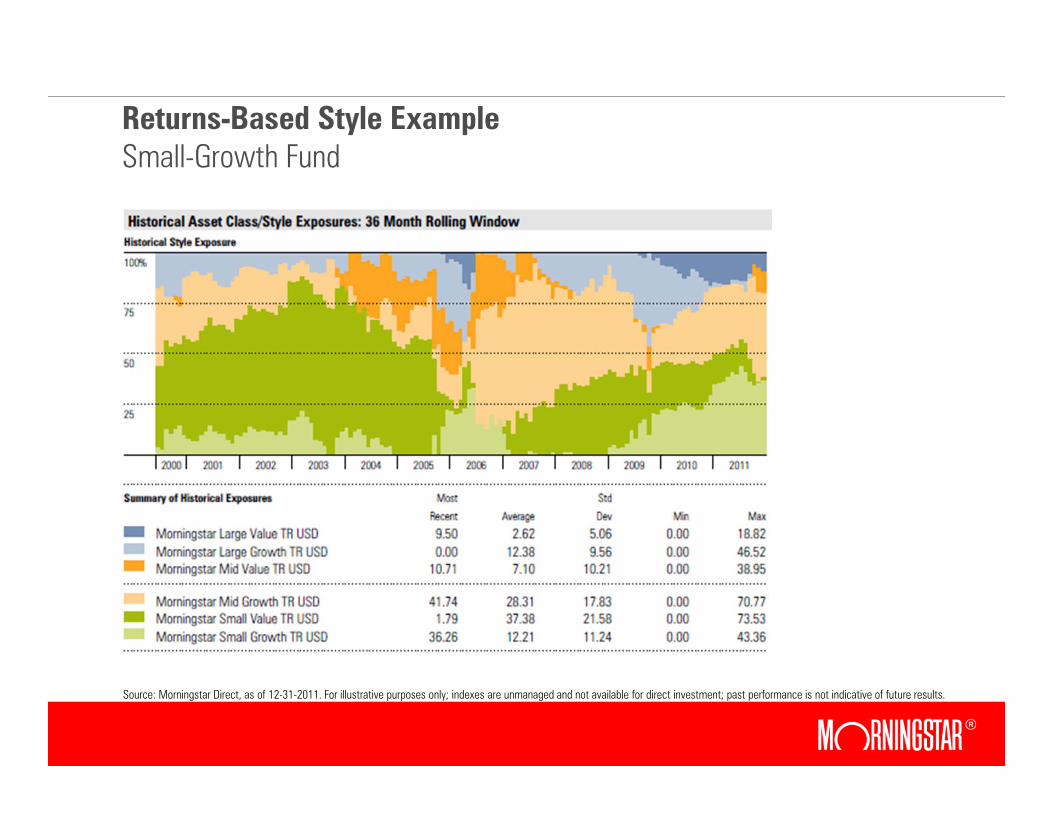
Returns-Based Style ExampleSmall-Growth Fund
Source: Morningstar Direct, as of 12-31-2011. For illustrative purposes only; indexes are unmanaged and not available for direct investment; past performance is not indicative of future results.
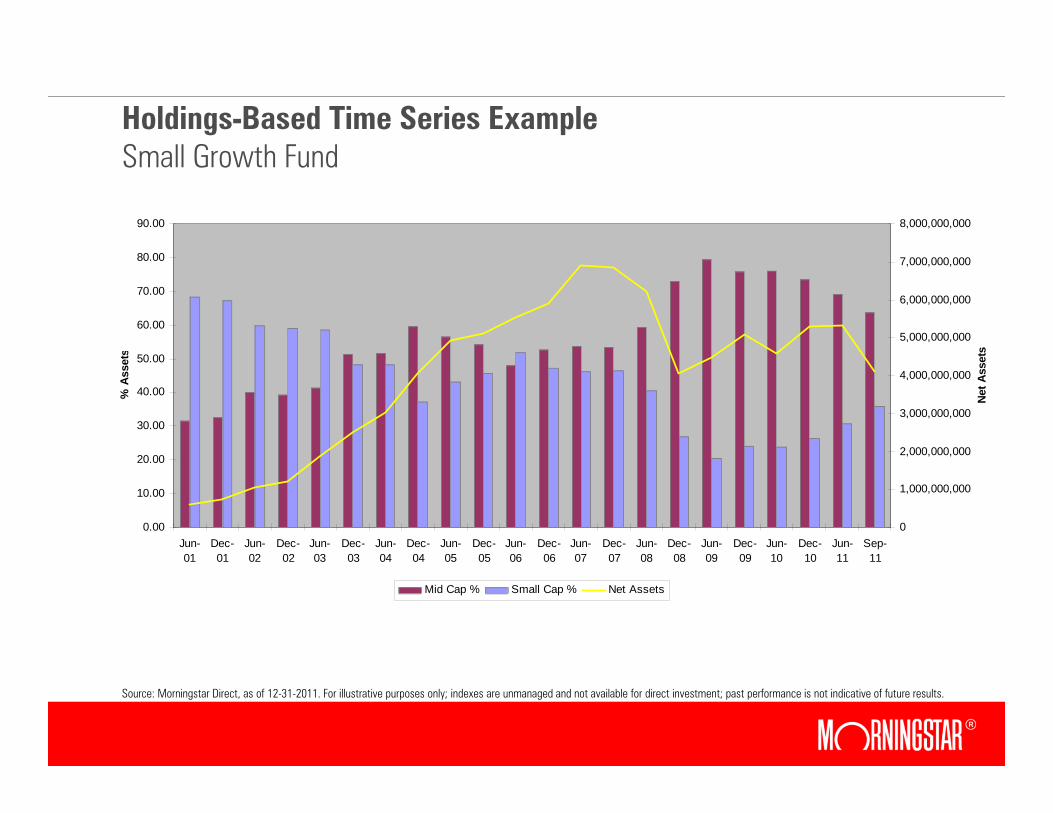
Holdings-Based Time Series ExampleSmall Growth Fund
0.00
10.00
20.00
30.00
40.00
50.00
60.00
70.00
80.00
90.00
Jun-01
Dec-01
Jun-02
Dec-02
Jun-03
Dec-03
Jun-04
Dec-04
Jun-05
Dec-05
Jun-06
Dec-06
Jun-07
Dec-07
Jun-08
Dec-08
Jun-09
Dec-09
Jun-10
Dec-10
Jun-11
Sep-11
% A
sset
s
0
1,000,000,000
2,000,000,000
3,000,000,000
4,000,000,000
5,000,000,000
6,000,000,000
7,000,000,000
8,000,000,000
Net A
sset
s
Mid Cap % Small Cap % Net Assets
Source: Morningstar Direct, as of 12-31-2011. For illustrative purposes only; indexes are unmanaged and not available for direct investment; past performance is not indicative of future results.
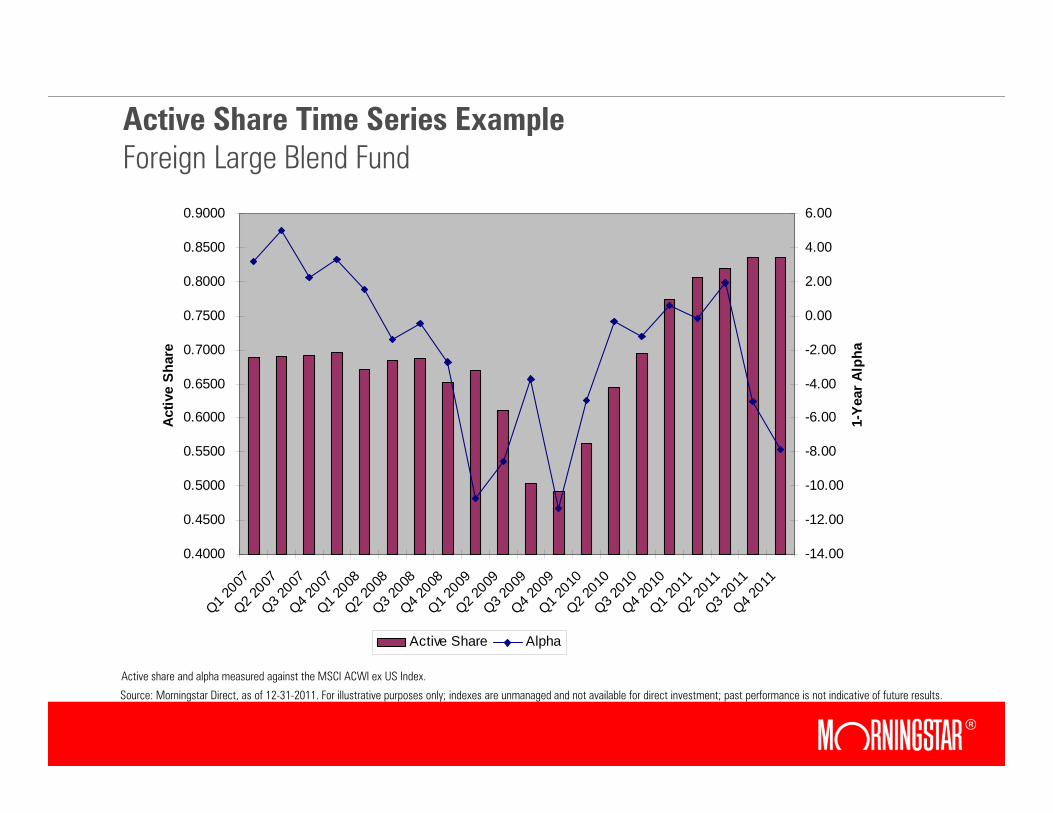
Active Share Time Series ExampleForeign Large Blend Fund
0.4000
0.4500
0.5000
0.5500
0.6000
0.6500
0.7000
0.7500
0.8000
0.8500
0.9000
Q1 2007
Q2 2007
Q3 2007
Q4 2007
Q1 2008
Q2 2008
Q3 2008
Q4 2008
Q1 2009
Q2 2009
Q3 2009
Q4 2009
Q1 2010
Q2 2010
Q3 2010
Q4 2010
Q1 2011
Q2 2011
Q3 2011
Q4 2011
Activ
e Sh
are
-14.00
-12.00
-10.00
-8.00
-6.00
-4.00
-2.00
0.00
2.00
4.00
6.00
1-Ye
ar A
lpha
Active Share Alpha
Source: Morningstar Direct, as of 12-31-2011. For illustrative purposes only; indexes are unmanaged and not available for direct investment; past performance is not indicative of future results.
Active share and alpha measured against the MSCI ACWI ex US Index.
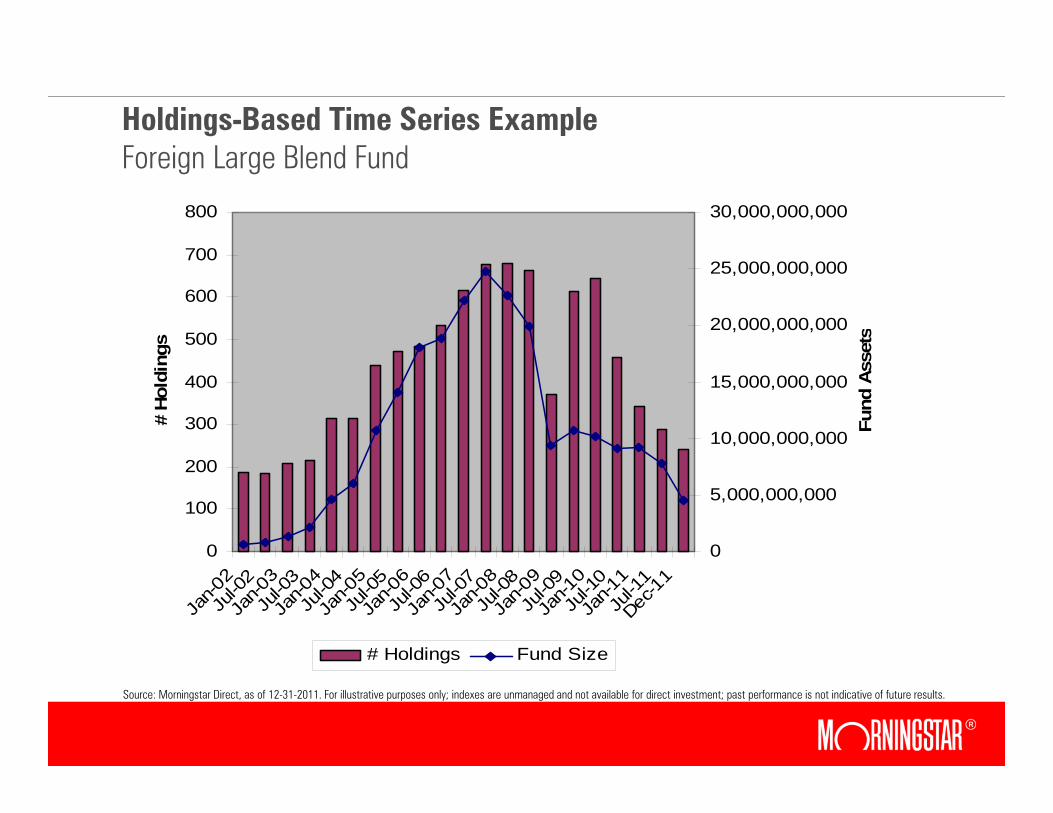
Holdings-Based Time Series ExampleForeign Large Blend Fund
0
100
200
300
400
500
600
700
800
Jan-0
2Ju
l-02
Jan-0
3Ju
l-03
Jan-0
4Ju
l-04
Jan-0
5Ju
l-05
Jan-0
6Ju
l-06
Jan-0
7Ju
l-07
Jan-0
8Ju
l-08
Jan-0
9Ju
l-09
Jan-1
0Ju
l-10
Jan-1
1Ju
l-11
Dec-1
1
# Ho
ldin
gs
0
5,000,000,000
10,000,000,000
15,000,000,000
20,000,000,000
25,000,000,000
30,000,000,000
Fund
Ass
ets
# Holdings Fund Size
Source: Morningstar Direct, as of 12-31-2011. For illustrative purposes only; indexes are unmanaged and not available for direct investment; past performance is not indicative of future results.

Questions
References
× Harlow, W. Van, and Keith Brown. 2006. “The Right Answer to the Wrong Question: Identifying Superior Active Portfolio Management”. Journal of Investment Management, vol.4, no. 4 (2006):1-26.
× Ibbotson, Roger, and Amita Patel. February 2002. Do Winners Repeat with Style? Available at www.ibbotson.com/research
× Idzorek, Thomas, James Xiong, and Roger Ibbotson. January 2011. “Combining Liquidity and Momentum to Pick Top-Performing Mutual Funds”. Available at www.ibbotson.com/research
× Cremers, Martijn and Antii Petajisto. 2009. “How Active is Your Fund Manager? A New Measure That Predicts Performance”, Review of Financial Studies, vol.22, no.9: 3329-3365.
References
× Kinnel, Russell. 2010. “How Expense Ratios and Star Ratings Predict Success.” Morningstar Advisor (August 10, 2010).
× Kosowski, Robert, Allan Timermann, Russ Wermers, and Hal White. 2006. “Can Mutual Fund ‘Stars’ Really Pick Stocks? New Evidence from a Bootstrap Analysis.” The Journal of Finance, vol. 61, no.6 (December 2006): 2551-2596.
× Lutton, Laura Pavlenko, Katie Rushkewicz, Kailin Liu, and Xin Ling. 2011. “2011 Mutual Fund Stewardship Grade Research Paper.” Available at http://corporate.morningstar.com/US/documents/MethodologyDocuments/ResearchPapers/StewardshipStudy.pdf
References
× Peterson, James, Michael Iachini, and Wynce Lam. 2011. “Identifying Characteristics to Predict Separately Managed Account Performance”, Financial Analysts Journal, 2011, v67, no.4: 30-40.
× Wei, Kelsey, Russ Wermers, and Tong Yao. 2008. “Uncommon Value” The Investment Performance of Contrarian Fund”, working paper available at http://www.cfr-cologne.de/download/researchseminar/WS0809/RussWermers_Contrarian 20081012.pdf
For information and/or illustrative purposes only. Not for public distribution. ©2012 Morningstar. All rights reserved. Morningstar Investment Management is a division of Morningstar. Morningstar Investment Management includes Morningstar Associates, Ibbotson Associates, and Morningstar Investment Services; all registered investment advisors and wholly owned subsidiaries of Morningstar, Inc. The information contained in this presentation is the proprietary material of Ibbotson Associates. Reproduction, transcription or other use by any means, in whole or in part, without the prior written consent of Ibbotson Associates, is prohibited.
The Morningstar name and logo are registered marks of Morningstar, Inc. The Ibbotson name and logo are registered marks of Ibbotson Associates, Inc.