Embed Size (px)
Citation preview
Journal of Physiology (1996), 497.1, pp.31-38
Ca2O sparks involving multiple Ca2O release sites along Z-linesin rat heart cells
Ian Parker *, Wei-Jin Zang and W. Gil Wier t
Department of Physiology, University of Maryland, School of Medicine, Baltimore,MD 21201 and *Laboratory of Cellular and Molecular Neurobiology, Department of
Psychobiology, University of California, Irvine, CA 92717, USA
1. High spatial resolution confocal imaging was used to investigate the fundamental nature of'Ca2+ sparks' in rat cardiac myocytes loaded with the fluorescent calcium indicator, fluo-3.
2. The sites at which calcium sparks occurred (Ca2+ release sites) were packed closely andirregularly in transverse planes along Z-lines (mean spacing between sites of 0-76 ,um). Incontrast, sites were spaced more regularly in the longitudinal direction, at intervals of18 ,um (i.e. the sarcomere length).
3. Diffusion of released Ca2+ was slower transversely (apparent diffusion coefficient, D,7-9 4Um2 s-) than longitudinally (D, 17 1 ,um2 s-).
4. Frequently, discrete sites several hundred nanometres apart transversely activated in nearsynchrony. The probability of transverse synchronous activity fell to low levels (< 20%) atsites separated by more than 1i0 um. Synchronous activation was not observed between siteson different Z-lines (i.e. separated longitudinally by 1f8 ,um).
5. High temporal resolution confocal microscopy (stationary spot) revealed Ca2+ sparks with'stepped' rises, consistent with multiple sites of origin.
6. We conclude that the Ca2+ spark as originally described is usually not an 'elementary' event,in the sense of being indivisible, but is often comprised of yet smaller, triggered units of Ca2+release.
Confocal fluorescence microscopy of cardiac myocytesloaded with Ca2+ indicator has revealed that Ca2+ liberationfrom the sarcoplasmic reticulum (SR) produces spatiallylocalized [Ca2+]i transients or Ca2+ 'sparks' (Cheng, Lederer& Cannell, 1993; see also Niggli & Lipp, 1992). Sparks occurspontaneously in resting cells, and can also be evoked byCa2+ influx through L-type plasma membrane Ca2+ channelsduring cellular depolarization (Lopez-Lopez, Shacklock,Balke & Wier, 1994, 1995; Cannell, Cheng & Lederer, 1995).In line-scan confocal images oriented along the long axis ofventricular cells, sparks are seen to arise at sites spacedregularly at 1 8 4um intervals corresponding to transversetubules (t-tubules) at Z-lines (Shacklock, Wier & Balke,1995). Each site appears to act as an autonomous functionalunit generating asynchronous sparks. Estimates of theamount of Ca2+ liberated during a spark led to the proposal(Cheng et al. 1993) that each unit is composed of only asingle functional ryanodine receptor channel (RyR), althoughthe alternative possibility, that sparks arise from more thanone channel, could not be eliminated (Cheng et al. 1993). Theconcept that the Ca2+ spark represents an elementary unit
of Ca2P release during excitation-contraction (E-C) coupling,triggered independently by Ca2+ influx through L-type Ca2+channels (L6pez-Lopez et at. 1994, 1995; Cannell et al.1995), is central in the 'local control' theory of cardiac E-Ccoupling (Stern, 1992; Wier, Egan, L6pez-Lopez & Balke,1994; for review, see Bootman & Berridge, 1995). Thisconcept helps to account for the graded control of Ca2+ releasewith depolarization, despite the inherently regenerativenature of Ca2+-induced Ca2+ release (CICR) from the SR.
This notion of elementary Ca2+ release events applies also tothe other major cellular Ca2+ signalling pathway, whichinvolves inositol trisphosphate receptors (InsP3Rs). In thatpathway also, spatially localized transient signals (Ca2+'puffs') closely resembling Ca2' sparks are seen (Yao, Choi &Parker, 1995; Bootman & Berridge, 1995). However, thepuff is not the elementary unit of InsP3-mediated Ca2+release, since yet smaller transients (Ca2+ 'blips') (Parker &Yao, 1996) have recently been resolved. The puff musttherefore involve Ca2P release through multiple channels.Similarly, it has been proposed recently that Ca2+ release in
t To whom correspondence should be addressed.
This manuscript was accepted as a Short Paper for rapid publication.
6060 31
32 I. Parker, W-J Z
the heart may involve unresolved unitary events (Ca2Pquarks) much smaller than the spark (Lipp & Niggli, 1996).Using high temporal resolution stationary point confocalmicroscopy, we have observed in rat ventricular cells smallunits of Ca2+ release (compared with sparks), which wetermed 'subsparks' (Parker & Wier, 1996). Our aim here wasto use confocal imaging to study spontaneous Ca2+ sparks inrat ventricular myocytes to determine whether the sparkcould be dissected into smaller, discrete, spatially andtemporally resolved release events. To this end weconstructed a 'home-made' confocal microscope utilizing ahigh-efficiency detector and simplified optical path, whichprovided a spatial resolution (-0 3 ,um) in line-scan modebetter than our BioRad MRC 600 system, and a sub-millisecond temporal resolution in stationary point mode.The major finding is that sparks generally involve Ca2+
,an(g and W 0. Wier J Physiol.497.1
release from two or more sites, which activate within a fewmilliseconds of each other, and which are packed closelytogether at a Z-line.
METHODSPreparation of cellsTwo-month-old Sprague-Dawley rats (200-300 g) were anaes-thetized with sodium pentobarbitone (17 mg kg-' injected i.P.). Thehearts were removed from the animals via mid-line thoracotomy,and single ventricular cells were obtained by an enzymatictechnique described in detail previously (Lopez-Lopez et al. 1995).The myocytes were loaded with the fluorescent Ca2+ indicator fluo-3 by incubation for > 30 min with 5/uM fluo-3 AM (MolecularProbes, Inc). Cells were imaged through a Nikon Diaphot invertedmicroscope with a x 60 plan-apo oil-immersion objective (NA, 1P4).Recordings of Ca2+ sparks were made in normal Tyrode solution
0
500 ms
10U)
0
6
5
0
Longitudinal scan D
tn 20
0
0
6 10z
0.0 0.5 1.0 1.5 20Distance between sites (tim)
Transverse scan
0.0 0.5 1.0 1.5 2.0Distance between sites (pm)
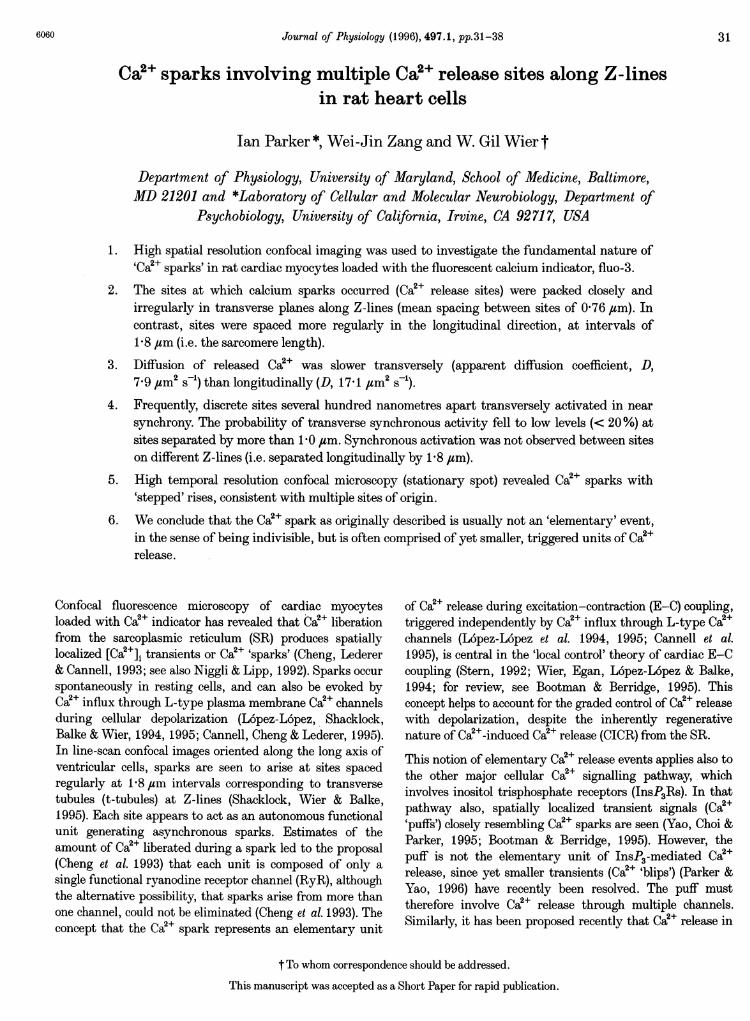
Figure 1. Calcium sparks visualized by line-scan imaging longitudinally and transversely across
fluo-3-loaded rat ventricular myocytesA and B, line-scan images showing distance along tlhe scan lines depicted vertically, and successive scan
lines at 3 ms intervals stacked from left to right; increasing Ca2+-dependent fluorescence is coded as
indicated by the colour bar. Lines at the right mark positions of all sites showing sparks throughout 25 srecording periods. The image in A was obtained with the scan line oriented along the long axis of a cell,and that in B by scanning transversely across a different cell. In B, asterisks indicate Ca2+ sparks arising atmultiple sites. The arrow indicates a Ca2P spark arising at only one site. C and D, distributions of minimalspacings between spark sites measured from 6 longitudinal and 28 transverse line-scan images, respectively.
A
B
C
Triggering of Ca2" sparks at Z-lines3
(composition, mM: NaCl, 140; dextrose, 10; Hepes, 10; KCl, 4 0;MgCl2, 1; CaCl2, 1; pH adjusted to 7 3-7 4 with NaOH) at roomtemperature (22 °C), with [Ca2+]. between 0 5 and 2 mm.
Confocal microscopyLine-scan images were obtained using a home-made confocalscanner, which provided a spatial resolution superior to our BioRadMRC 600 system and allowed continuous image recording for up to25 s. The 488 nm beam from a 100 mW argon ion laser(Omnichrome, Chino, CA, USA) was attenuated 10- to 100-fold andexpanded to overfill the objective back aperture. A galvanometer-driven mirror (Cambridge Technology, Watertown, MA, USA)repeatedly scanned the laser spot along a line about 20 1um longevery 3 ms. Cells were rotated to align the scan line along either thelong axis of the cell or transversely (parallel to the striations).Fluorescence emission was descanned by the same mirror, long-pass filtered at A > 515 nm and, after passing through a confocalaperture transmitting only the central peak of the Airy disc, wasfocused onto an avalanche diode photon counting module (SPCM-AQ-121; EG & G Canada Ltd, Dumberry, Vaudreuil, Quebec,Canada). The point-spread function, measured using 01 ,umfluorescent beads, was 0 31 ,um laterally (full width at half-
maximum after subtracting bead diameter) and 0 41 /am axially.Photon counts were integrated by a 30 kHz low-pass filter,combined with sync pulses marking the mirror fly-back, andsampled at 10 jus intervals (pixel size, 0 1 #sm) for gap-free storageon computer disk using the pCLAMP software package (AxonInstruments). Finally, line-scan images were constructed by customroutines written in the IDL programming language (ResearchSystems, Inc., Boulder, CO, USA). Stationary point confocalmicroscopy (Fig. 4C) was performed with the mirror stationary,and digitizing the fluorescence at 2 kHz. Fluorescence signals areexpressed as fractional increases above resting level (AF/FO).
RESULTSSparks visualized in longitudinal and transversescansImages of resting rat cardiac myocytes obtained by scanningthe confocal spot along the length of the cell showedspontaneous Ca2+ sparks (Fig. IA and C), which originatedat apparent point sources (< 400 nm diameter) spaced at
2.0
1.0
a) 0.0-C
X 2.0 -u)-IF
10 -
.0-2 0 2
Distance (Wum)
EVA
va
A& V A
VI a
* ,A 0
A. *vA A,A *
V
F
A
A
*Y.
AU.AaI i'A
a
- 1'' I ' I I *- I-r0 2 4 6
Square root time (ims°5)
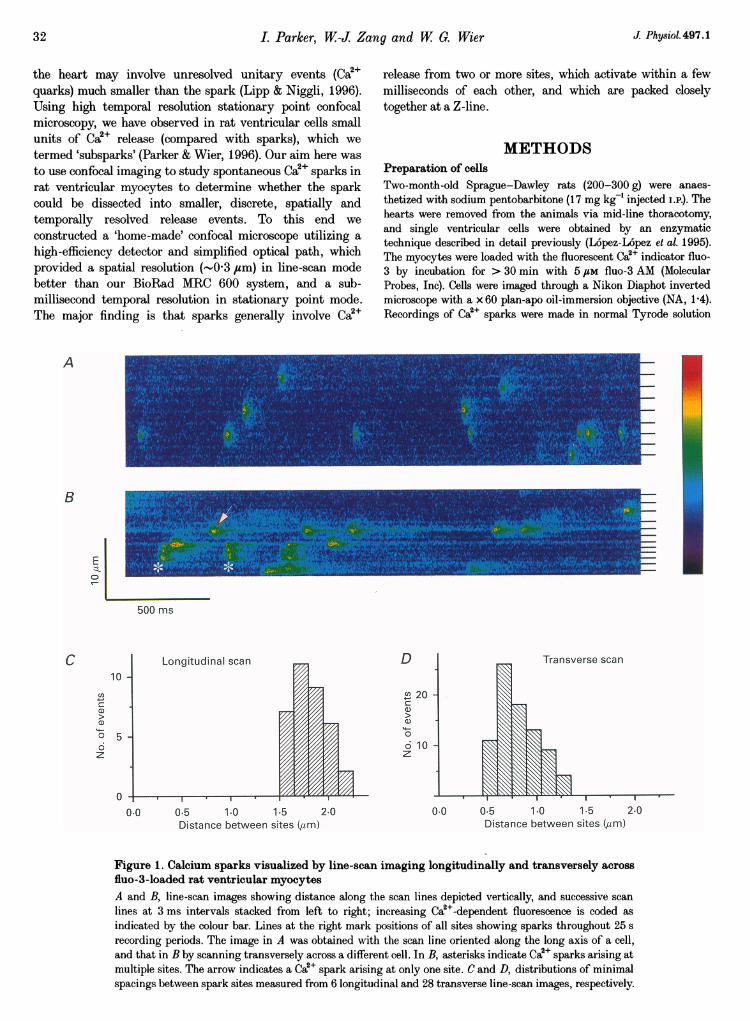
Figure 2. Longitudinal and transverse diffusion of Ca2+-activated fluorescence during Ca2+ sparksLine-scan images showing averages of 11 events at a single site scanned longitudinally (A) and 4 events at a
different site scanned transversely (B), constructed by aligning the rising phases of individual events anddisplayed after subtraction of background fluorescence. C and D, intensity profiles along the scan lines at 6,9, 12, 18, 27, 36, 48 and 78 ms after the beginning of the signals, normalized to the same maximalintensities. Profiles were averaged over 2, 3 or 5 adjacent scan lines and smoothed by a running average
over 5 pixels (05 ,um). The width of the profiles increases progressively with time. E and F, measurementsof the radial spread of the fluorescence signal at half-amplitude obtained from profiles like those in C and D,plotted against the square root of time, with t = 0 taken as 3 ms prior to the first detectable rise of Ca2+.
1 0A
B
a)0
a)
0C.)a1)
0 1o-aN
E0z I
E.
100 Ms8
J Physiol. 497.1 33
I. Parker, W-J Zang and W G. Wier
regular intervals of about 1P8 jum (bars in Fig. 1A) consistentwith Ca2+ release from discrete sites associated with thesarcomeric structure of the cell. Previous work has shownthat these sites are closely associated with transverse (t)-tubules and are thus at Z-lines (Shacklock et al. 1995). Thesesites were further marked by a small elevation in backgroundfluorescence (faint horizontal lines in Fig. 1A), possiblyresulting from compartmentalized or otherwise immobilizedCa2P-insensitive indicator (Tsugorka, Rios & Blatter, 1995).At each site, a Ca2+ spark occurred autonomously at leastonce during the 25 s period of this recording. Except duringpropagating Ca2+ waves (Takamatsu & Wier, 1990), wenever observed in such longitudinal scans instances where aspark at one site triggered a localized spark at an adjacentsite (> 100 records examined).
In contrast, transverse line-scan images (scanned at 90 degto the long axis of the cell) showed sparks with verydifferent characteristics. Spacings between spark sites
A a
i
5 im
(Fig. 1D) were smaller and less regular than in longitudinalscans (compare bars in Fig. 1A and B), and correlated witha closer and more heterogeneously distributed pattern ofbackground fluorescence. The sparks were also more variablein appearance, with some showing a more restricted spatialspread than in longitudinal scans (arrow), while others(asterisks) presented a 'blunt' appearance and appeared toarise through near-synchronous release of Ca+ at severaldiscrete, adjacent sites.
Longitudinal and transverse diffusion of Ca2eThe restricted spread of the Ca2+ signal in transverse scansof sparks that appeared to arise from single sites suggestedthat diffusion in myocytes is more restricted radially thanlongitudinally. Quantitative analysis was performed onaveraged images from multiple events at single sites scannedlongitudinally (Fig. 2A) and transversely (Fig. 2B). Bothsparks showed a characteristic 'comet tail' appearance and,consistent with a diffusional process, the spatial profiles of
b1.0
AF/F0
0-0
1.0
AF/Fo
o0o
500 ms
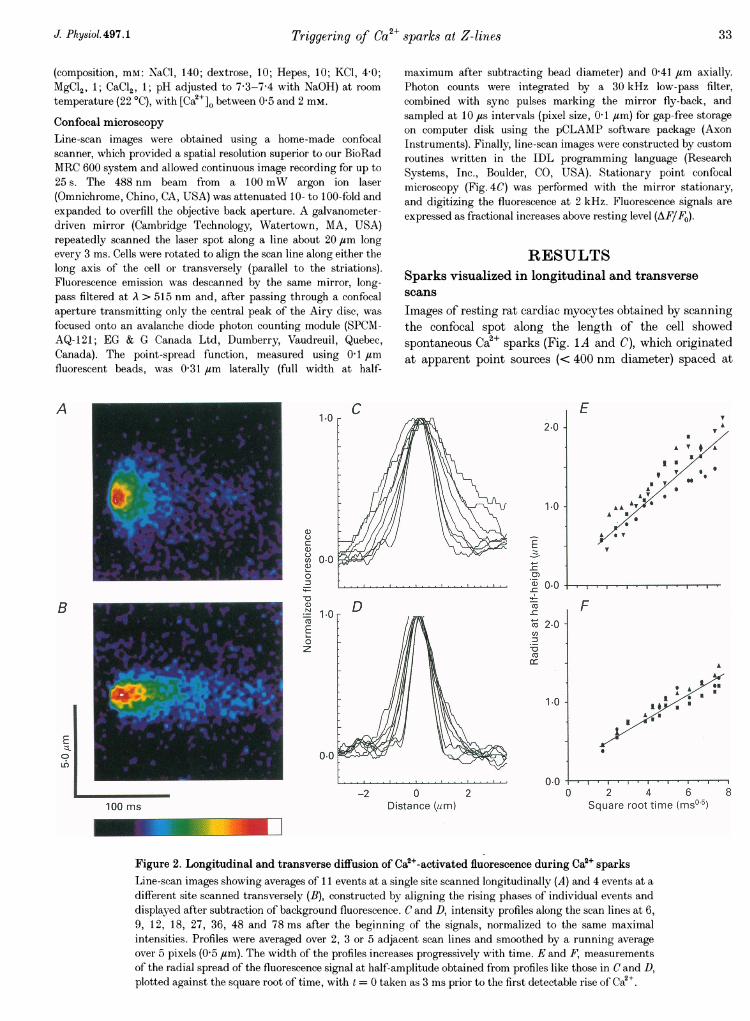
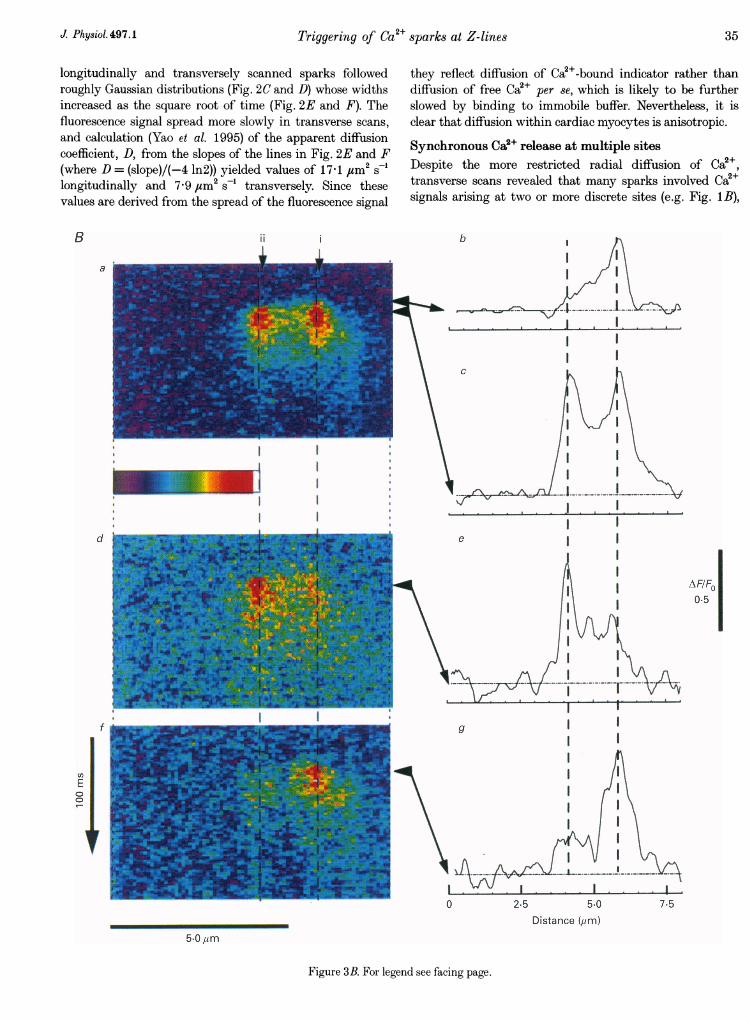
Figure 3. Analysis of coupled Oa2+ release from discrete transverse sites 1-4 j"m partA a (above), transverse line-scan image (background subtracted and smoothed by averaging over 5 pixelsalong the scan line) showing spontaneous events occurring synchronously at two sites, and examples ofevents involving only single sites (*). b and c, changes in fluorescence monitored at the two sites indicatedby i and ii in A a. Traces are an average over 5 pixels (500 nm) and are smoothed by a running average over3 lines (9 ms). Ba (on facing page), averaged, background-subtracted image formed from 34 eventsinvolving synchronous signals at both the sites marked in A a. Traces b and c show profiles of fluorescenceintensity (3 line average, smoothed over 5 pixels) along the scan line at times marked by the arrows in Ba.d-g, similar images and line profiles for averages of 5 (d) and 4 (f) events involving release at one or otherof the individual sites.
J Physiol.497.134
Triggering of Ca2" sparks at Z-lines3
longitudinally and transversely scanned sparks followedroughly Gaussian distributions (Fig. 2C and D) whose widthsincreased as the square root of time (Fig. 2E and F). Thefluorescence signal spread more slowly in transverse scans,and calculation (Yao et al. 1995) of the apparent diffusioncoefficient, D, from the slopes of the lines in Fig. 2E and F(where D = (slope)/(-4 In2)) yielded values of 17ff1 gUM2 s-longitudinally and 7-9 giM2 s-' transversely. Since thesevalues are derived from the spread of the fluorescence signal
B ii
they reflect diffusion of Cat-bound indicator rather thandiffusion of free Ca2+ per se, which is likely to be furtherslowed by binding to immobile buffer. Nevertheless, it isclear that diffusion within cardiac myocytes is anisotropic.
Synchronous Ca2+ release at multiple sitesDespite the more restricted radial diffusion of Ca2+,transverse scans revealed that many sparks involved Ca2+signals arising at two or more discrete sites (e.g. Fig. 1B),
b
c
II
I II I
-1
d
AF/F00.5
cDE
0C)
f g
ILI
L0
1L2 5 5*0
Distance (W]m)7.5
Figure 3B. For legend see facing page.
50 um
%
J Physiol. 497.1 35
IIIIIII
36 I. Parker, W-J Z
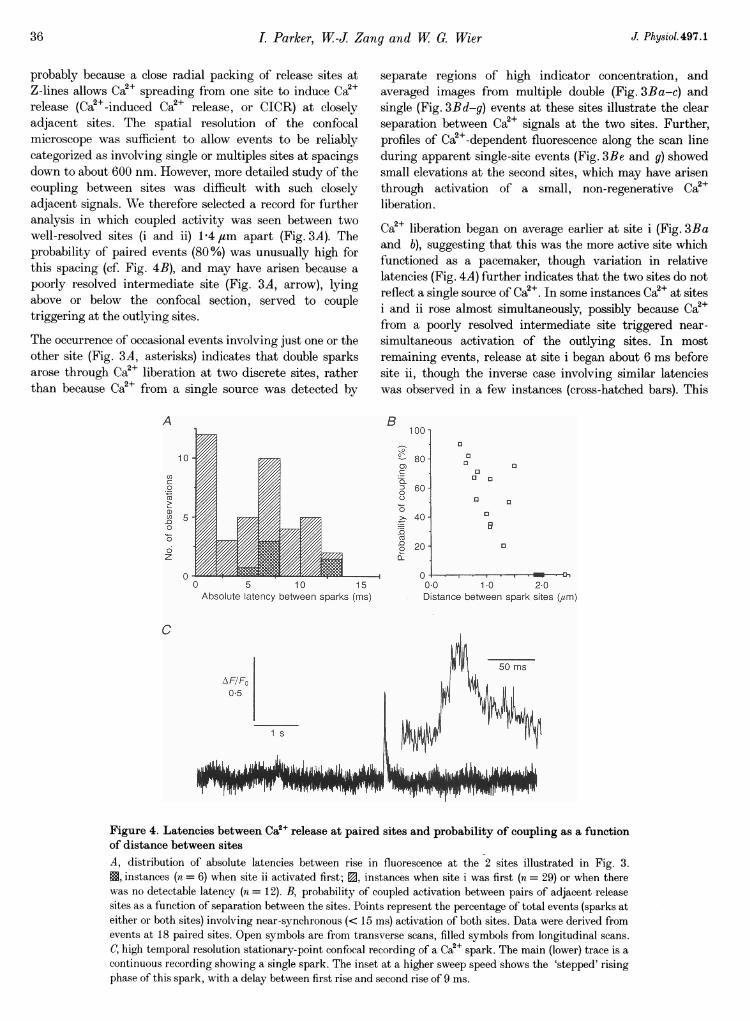
probably because a close radial packing of release sites atZ-lines allows Ca2+ spreading from one site to induce Ca2+release (Ca2+-induced Ca2+ release, or CICR) at closelyadjacent sites. The spatial resolution of the confocalmicroscope was sufficient to allow events to be reliablycategorized as involving single or multiples sites at spacingsdown to about 600 nmn. However, more detailed study of thecoupling between sites was difficult with such closelyadjacent signals. We therefore selected a record for furtheranalysis in which coupled activity was seen between twowell-resolved sites (i and ii) 14 ,um apart (Fig. 3A). Theprobability of paired events (80%) was unusually high forthis spacing (cf. Fig. 4B), and may have arisen because apoorly resolved intermediate site (Fig. 3A, arrow), lyingabove or below the confocal section, served to coupletriggering at the outlying sites.
The occurrence of occasional events involving just one or theother site (Fig. 3A, asterisks) indicates that double sparksarose through Ca2+ liberation at two discrete sites, ratherthan because Ca2+ from a single source was detected by
A
10
coc0
coa)
0
6z
0
,an
B100
1-
°- 80.cma)O 6000
?_ 40._
0 20L-
5 10 15Absolute latency between sparks (ms)
C
015
is
g and W C. Wier J Physiol. 497.1
separate regions of high indicator concentration, andaveraged images from multiple double (Fig. 3Ba-c) andsingle (Fig. 3Bd-g) events at these sites illustrate the clearseparation between Ca2+ signals at the two sites. Further,profiles of Ca2+-dependent fluorescence along the scan lineduring apparent single-site events (Fig. 3Be and g) showedsmall elevations at the second sites, which may have arisenthrough activation of a small, non-regenerative Ca2+liberation.
Ca2+ liberation began on average earlier at site i (Fig. 3Baand b), suggesting that this was the more active site whichfunctioned as a pacemaker, though variation in relativelatencies (Fig. 4A) further indicates that the two sites do notreflect a single source of Ca2+. In some instances Ca2+ at sitesi and ii rose almost simultaneously, possibly because Ca2+from a poorly resolved intermediate site triggered near-simultaneous activation of the outlying sites. In mostremaining events, release at site i began about 6 ms beforesite ii, though the inverse case involving similar latencieswas observed in a few instances (cross-hatched bars). This
aa
aaa
a aa
a a
- .I . -
0-0 1-0 2-0Distance between spark sites (.am)
Figure 4. Latencies between Ca2O release at paired sites and probability of coupling as a functionof distance between sitesA, distribution of absolute latencies between rise in fluorescence at the 2 sites illustrated in Fig. 3.X, instances (n = 6) when site ii activated first; 0, instances when site i was first (n = 29) or when therewas no detectable latency (n = 12). B, probability of coupled activation between pairs of adjacent releasesites as a function of separation between the sites. Points represent the percentage of total events (sparks ateither or both sites) involving near-synchronous (< 15 ms) activation of both sites. Data were derived fromevents at 18 paired sites. Open symbols are from transverse scans, filled symbols from longitudinal scans.C, high temporal resolution stationary-point confocal recording of a Ca2+ spark. The main (lower) trace is acontinuous recording showing a single spark. The inset at a higher sweep speed shows the 'stepped' risingphase of this spark, with a delay between first rise and second rise of 9 ms.
Triggering of Ca2, sparks at Z-lines
lag of about 6 ms over a distance of 1-4 gsm corresponds to a
velocity of roughly 230 ,um s-', about twice as fast as
reported for Ca2+ wave propagation (Takamatsu & Wier,1990; Cheng, Lederer, Lederer & Cannell, 1996).
The latency between Ca2+ signals provides a powerfulargument for release being triggered at spatially distinctsites. However, the brief times involved are barely resolvedby the line-scan technique, and then only in favourablecases like that in Fig. 3, with widely separated sites. Toresolve better the 'steps' in the rise of Ca2P sparks thatwould be expected from short latency coupling betweenrelease sites, we recorded continuously (2 kHz samplingrate) from a stationary confocal spot. In this recordingmode, steps were sometimes detected (Fig. 4C), probablybecause the confocal spot volume (--10"5 1) lay between twosites, one of which activated earlier (9 ms; Fig. 4C, inset)than the other.
Probability of coupling between sitesWell-resolved records were obtained in a total of twenty-one transverse line-scan images (total of 633 events in 17cells). Of these events, 32% apparently involved release fromonly a single site, 59% from two sites, 9% from three or more
sites. Thus, a majority of events involved multiple sites.Moreover, the values above probably underestimate both theproportion of events involving release at more than one siteand the average number of sites which activate synchronously,since separate sites displaced in the z-axis or separatedlaterally by < 600 nm would not have been resolved. Theprobability of synchronous release at adjacent sites declinedsteeply with increasing separation between sites (Fig. 4B),falling to zero by the sarcomere spacing at 1 8,um. Previousstudies of Ca2P sparks (Cheng et al. 1993; Shacklock et al.1995) have generally utilized longitudinal scanning with a
spatial resolution (0-5-0-8 um lateral, 1-2 Ism axial, pixelsize 0 27 jum) less good than achieved here (see Methods andFig. 1), so that resolution of discrete events separated byless than 10 ,um would have been more problematic.
DISCUSSIONThe major results are that Ca2+ released from the SRproduces sparks at discrete sites, which are packed at highdensity transversely across the cell as compared with theirlongitudinal spacing at the sarcomere length, and that twoor more such transvTerse sites often generate sparks in near
synchrony. These phenomena were not observed in previousstudies of Ca2P sparks (Cheng et al. 1993; Shacklock et al.1995), in part because recordings were generally madeutilizing longitudinal scanning. We discuss below the factthat longitudinal scanning is intrinsically less capable ofresolving nearly synchronous Ca2+ release at sites spacedclosely in the transverse direction. In addition, some of theprevious studies have cited a spatial resolution (0X5-0*8 ,mlateral, 1-2 #sm axial, nominal pixel size 0-27 #sm) less goodthan achieved here. Mlost importantly, however, longitudinalscanning of sites having nearly synchronous activity with
neighbouring sites at the same Z-line would produce onlysteps in the rising phase of the line-scan images of the Ca2+sparks, reflecting the delay between activation of the sitesand time for Ca2P to diffuse. This delay is usually short,however, compared with the typical time per scan line(2-4 ms) and would therefore be nearly impossible toresolve. In summary, multiple sites of release at a givenZ-line can be readily resolved in the spatial dimension withhigh-resolution transverse scanning, but not in the temporaldomain by longitudinal scanning. Thus, although Ca2P sparkswere originally proposed to arise from Ca2+ flux throughsingle RyRs (Cheng, et al. 1993), the finding that a majorityof Ca2+ release events involve two or more sites hundreds ofnanometres apart indicates that multiple RyRs or multipleclusters of RyRs must be involved.
In our transverse line-scan recordings, roughly two-thirdsof all events involved near-simultaneous release at two or(rarely) three discrete sites. This result is unlikely to havearisen as a result of Ca2+ overload, as the phenomenonpersists in cells bathed in low (0 5 mM) extracellular [Ca2+],and cells showed low frequencies of spontaneous Ca2+ waves(0 5 mM Ca2+, 0-6 waves min-'; 1P0 mM Ca2+, 1P0 wavesmin-'; 2-0 mm Ca2+, 2-8 waves min-). Also, it is likely thatthe mean number of sites involved in each event is higherthan suggested by the above value, since adjacent sitesabove or below one another, or displaced laterally by lessthan about 0-6 /,m, would not be separately resolved. Itremains to be determined, however, what factors limit theextent of synchronous activation to just a few neighbouringsites, rather than allowing propagation of a Ca2P wave atrelease sites across entire Z-discs.
Ca2P release sites were present at regular spacings of 18 ,umlongitudinally, and at more irregular spacing with a meanof about 0-76 ,um transversely, corresponding to an averageof about one site per femtolitre (10-'5) of cell volume.Further, sites of spark initiation matched closely to regionsof elevated resting fluo-3 fluorescence in both longitudinaland transverse scans (Fig. lA and B). Although the reasonfor these variations in resting fluorescence is not known,x-y confocal images of quiescent, fluo-3 loaded cells providea useful 'map' of the distribution of potential release sites(data not shown). There is little doubt that sparks ariselongitudinally at the position of the t-tubules (Shacklocket al. 1995). The lateral distribution of spark sites (Fig. 1B)also roughly matches to the 'beaded' appearance of t-tubulesalong the Z-lines, which may arise as the tubules snake inand out of the plane of the confocal section. In agreementwith these studies at the light microscopic level, electronmicrographs indicate that RyRs are organized in clusters(Ferguson, Schwartz & Franzini-Armstrong, 1984) at theterminal SR-transverse tubule junction. Longitudinally,junctions are separated by about 1P8 tsm but the transversespacings are substantially smaller (Amsellem, Delorme,Souchier & Ojeda, 1995).
One major question still remaining to be answered concernswhether the Ca2P signal at a single site (as we resolve it)
J Physiol. 497.1 37
38 I. Parker, WV-J Zang and V G. Wier J Physiol.497.1
involves opening of a single RyR, or the concerted activationof a tight cluster of several RyRs. On the one hand, ourestimate of the density of release sites (1 per 10-' 1)suggests that a single channel per site, passing a Ca2Pcurrent of 3 pA for 5 ms (IP5 x 10-14 C or 7-75 x 10-20 molof Ca2+) would be sufficient to account for the entire amountof Ca2+ released during an action potential (-1 x 10⁻⁴ mol 1-1of accessible cell volume or 1 x 1 0-'9 mol fl'; Sipido & Wier,1991). On the other hand, electron microscopic studiesindicate that RyRs are organized into clusters some tens ofnanometres in size, and it seems improbable that CaP+released through one channel would fail to activate otherchannels within the cluster while still triggering release atmuch more distant sites as much as 1 #tm away.
A possible reconciliatory explanation of the paradox raisedabove would be that, in fact, several RyRs within one ormore clusters at a Z-line are activated in a CaP+ spark, buteach RyR passes Ca2P fluxes smaller than described above(3 pA for 5 ms). On this basis, Ca2P release at one of themultiple foci observed in the present study could not beidentical to the Ca2P 'quark', which is a putative, very smallchange in [Ca'+]i that has been proposed to result from thegating of a single RyR (Lipp & Niggli, 1996). Rather, in ourfavoured explanation, each focus of release might consist ofseveral, as yet unresolved, Ca2P quarks. The alternative (andunlikely) possibility is that each focus of release along aZ-line involves the opening of only one channel (i.e. the'quark') within a cluster of otherwise 'silent' or unavailableRyRs, whilst still permitting the activation of an RyRw7ithin a neighbouring cluster.
In conclusion, therefore, it appears that a CaP+ spark is notthe elementary unit of Ca2+ liberation, but is oftencomposed of yet smaller, triggered units of Ca2+ releaseoccurring at discrete sites spaced at distances of severalhundred nanometres transversely across the cell, at theZ-discs. Preliminary results (I. Parker, C. W. Balke, W.-J.Zang & W. G. Wier, unpublished observations) indicate thata similar coupling of elemental release events occurs alsoduring Ca2P release evoked by depolarization. This would beexpected if Cam± release triggered at one site by CaP+ entrythrough an immediately adjacent L-type Ca2P channelserved, in turn, to trigger neighbouring release sites, andthe multiplicative effect of coupling between sites may servTeto enhance the overall 'gain' of E-C coupling (Stern, 1992;Wier et al. 1994).
AMSELLEM, J. A., DELORMIE, R., SOUCHIER, C. & OJEDA, C. (1995).Transverse-axial tubular system in guinea pig ventricularcardiomy-ocyte: 3D reconstruction, quantification and its possiblerole in K+ accumulation-depletion phenomenon in single cells.Biology of the Cell 85, 43-54.
BOOTMAN, A. D. & BERRIDGE, AI. J. (1995). The elemental principlesof calcium signals. Cell 83, 675-678.
CANNEL.L, AI. B., CHE.NG, H. & LEDERER, W. ,J. (1995). The control ofcalcium release in bleart muscle. Science 268, 1045-1049.
CHENG, H., LEDERER, W. J. & CANNELL, Al. B. (1993). Calciumsparks: Elementary events underlying excitation-contractioncoupling in heart muscle. Science 262, 740-744.
CHENG, H., LEDERER, Al. R., LEDERER, W. J., & CANNELL, M. B.(1996). Calcium sparks and [Ca2+]i waves in cardiac myocytes.American Journal of Physiology 270, C148-159.
FERGUSON, D. G., SCHWARTZ, H. W. III & FRANZINI-ARMSTRONG, C.(1984). Subunit structure of junctional feet in triads of skeletalmuscle: a freeze-drying, rotary-shadowing study. Journal of CellBiology 99, 1735-1742.
Lipp, P. & NIGGLI, E. (1996). Submicroscopic calcium signals asfundamental events of excitation-contraction coupling in guinea-pig cardiac myocytes. Journal of Physiology 492, 31-38.
L6PEZ-L6PEZ, J. R., SHACKLOCK, P. S., BALKE, C. W. & WIER, WV. G.(1994). Local, stochastic release of Ca2P in voltage-clamped rat heartcells: visualization with confocal microscopy. Journal of Physiology480, 21-29.
L6PEZ-L6PEz, J. R., SHACKLOCK, P. S., BALKE, C. W. & WIER, W. G.(1995). Local calcium transients triggered by single L-type calciumchannel currents in cardiac cells. Science 268, 1042-1045.
NIGGLI, E. & Lipp, P. (1992). Spatially restricted Ca2+-release incardiac myocytes revealed by confocal microscopy. Pfluigers Archiv420, suppl. 1, R81.
PARKER, I. & WIER, WV. G. (1996). Ca sparks studied by stationarypoint confocal femtofluorimetry. Journal of MIolecular and CellularCardiology 28, A132.
PARKER, I. & YAO, Y. (1996). Ca2P transients associated with openingsof inositol trisphosphate-gated channels in Xenopus oocytes. Journalof Physiology 491, 663-668.
SHACKLOCK, P. S., WIER, W. G. & BALKE, C. WX. (1995). Local Catransients (Ca2P sparks) originate at transverse tubules in rat heartcells. Journal of Physiology 487, 601-608.
SIPIDO, K. R. & WIER, WV. G. (1991). Flux of Ca across thesarcoplasmic reticulum of guinea-pig cardiac cells during excitation-contraction coupling. Journal of Physiology 435, 605-630.
STERN, M. D. (1992). Theory of excitation-contraction coupling incardiac muscle. Biophysical Journal 63, 497-517.
TAKAMATSU, T. & WIER, W. G. (1990). Calcium waves in mammalianheart: Quantification of origin, magnitude, waveform and velocity.FASEB Journal 4,1519-1525.
TSUGORKA, A., Rios, E. & BLATTER, L. A. (1995). Imaging elementaryevents of calcium release in skeletal muscle cells. Science 269,1723-1726.
WATIER, W G., EGAN, T. M., L6PEZ-L6PEZ, J. R. & BALKE, C. W.(1994). Local control of excitation-contraction coupling in rat heartcells. Journal of Physiology 474, 463-47 1.
YAO, Y., CHOI, J. & PARKER, I. (1995). Quantal puffs of intracellularCa2+ evoked by inositol trisphosphate in Xenopus oocytes. Journalof Physiology 482, 533-553.
AcknowledgementsFinancial support was provided by NIH grants to Ian Parker(GCI4807 1) and WV. Gil Wier (HLBI 29473 and HLBI 55280).
Author's email addressXV. G. Wier: [email protected]
Received 20 August 1996; accepted 23 September 1996.