Embed Size (px)
Citation preview

TARGET MARKET OPPORTUNITIES IN ASIA FOR VIRGIN OLIVE OIL Part of Asia Market Success, April 2016
IN-PROGRESS REVIEW DRAFT Pre-release copy of significant commercial value to industry Document contains incomplete & in-progress research for comment For named reviewer/firm only; do not duplicate or distribute
RECIPIENT
FIRM

IINNHHEERREENNTT LLIIMMIITTAATTIIOONNSS This work was commissioned by the Department of Agriculture and Food Western Australia (DAFWA), with funding through the State Government’s Royalties for Regions program and prepared by Coriolis. This work is based on secondary market research, analysis of information available or provided to Coriolis by our client, and a range of interviews with industry participants and industry experts. Coriolis have not independently verified this information and make no representation or warranty, express or implied, that such information is accurate or complete. Projected market information, analyses and conclusions contained herein are based (unless sourced otherwise) on the information described above and on Coriolis’ judgement, and should not be construed as definitive forecasts or guarantees of future performance or results. Neither Coriolis nor its officers, directors, shareholders, employees or agents accept any responsibility or liability to readers or recipients of this report other than DAFWA or people other than DAFWA who rely upon it (described below as Recipients) with respect to this document. Coriolis wishes to draw Recipients’ attention to the following limitations of the Coriolis document “Target Market Opportunities in Asia for the Western Australian Premium Products” (the Coriolis Document) including any accompanying presentation, appendices and commentary (the Coriolis Commentary): a. Coriolis has not been asked to independently verify or audit the information or material provided to it by or on behalf of the Client or any of the parties involved in the project; b. the information contained in the Coriolis Document or any Coriolis Commentary has been compiled from information and material supplied by third party sources and publicly available information which may (in part) be inaccurate or incomplete; c. Coriolis makes no representation, warranty or guarantee to Recipients, whether express or implied, as to the quality, accuracy, reliability, currency or completeness of the information provided in the Coriolis Document and any Coriolis Commentary or that reasonable care has been taken in compiling or preparing them; d. the analysis contained in the Coriolis Document and any Coriolis Commentary are subject to the key assumptions, further
qualifications and limitations included in the Coriolis Document and Coriolis Commentary, and are subject to significant uncertainties and contingencies, some of which, if not all, are outside the control of Coriolis; and e. any Coriolis Commentary accompanying the Coriolis document is an integral part of interpreting the Coriolis document. Consideration of the Coriolis document will be incomplete if it is reviewed in the absence of the Coriolis Commentary and Coriolis conclusions may be misinterpreted if the Coriolis document is reviewed in absence of the Coriolis Commentary. Coriolis is not responsible or liable in any way for any loss or damage incurred by any person or entity other than DAFWA relying on the information in, and the Recipient unconditionally and irrevocably releases Coriolis from liability for loss or damage of any kind whatsoever arising from, the Coriolis document or Coriolis Commentary including without limitation judgements, opinions, hypothesis, views, forecasts or any other outputs therein and any interpretation, opinion or conclusion that the Recipient may form as a result of examining the Coriolis document or Coriolis Commentary. The Coriolis document and any Coriolis Commentary may not be relied upon by the Recipient, and any use of, or reliance on that material by the Recipient is entirely at their own risk. Coriolis shall have no liability for any loss or damage arising out of any such use. AACCCCEESSSSIIBBIILLIITTYY Coriolis seeks to support the widest possible audience for this research. This document has been designed to be as accessible to as many users as possible. Any person – with or without any form of disability – should feel free to call the authors if any of the material cannot be understood or accessed. We welcome the opportunities to discuss our research with our readers and users. All photos used in this discussion document were either (1) purchased by Coriolis from a range of stock photography providers as documented, (2) received written permission to use Southern
Forest Food Council photo or (3) are low resolution, complete product/brand for illustrative purposes used under fair dealing/fair use for both “research and study” and “review and criticism”. Our usage of them complies with Australian law or their various license agreements (© Dollar Photo Club). CCOOPPYYRRIIGGHHTT Copyright © Western Australian Agriculture Authority, 2016 IIMMPPOORRTTAANNTT DDAAFFWWAA DDIISSCCLLAAIIMMEERR The Chief Executive Officer of the Department of Agriculture and Food and the State of Western Australia and their employees and agents (collectively and individually referred to below as DAFWA) accept no liability whatsoever, by reason of negligence or otherwise, arising from any use or release of information in this report or any error, inaccuracy or omission in the information. DAFWA does not make any representations or warranties about its quality, accuracy, reliability, currency, completeness or suitability for any particular purpose. Before using the information, you should carefully evaluate these things. The information is general in nature, is not tailored to the circumstances of individuals or businesses, and does not constitute financial, taxation, legal, business or management advice. We recommend before making any significant financial or business decisions, you obtain such advice from appropriate professionals who have taken into account your individual circumstances and objectives. The information in this report should not be presumed to reflect or indicate any present or future policies or decisions by the Government of Western Australia.
2
FFIINNAALL vv110000;; AApprriill 22001166

SCREENING OVERVIEW In Phase One of the Target Market Opportunities in Asia for WA Premium Products Report (TMO Report), extensive import/export trade data was fed through a multi-stage screening process to “hone-in” on potential opportunities for Western Australia; stakeholder interviews also fed into this process
3
STRUCTURE OF MULTI-STAGE SCREENING PROCESS USED IN THIS PROJECT Model; 2016
INDIVIDUAL FIRM ROLE & RESPONSIBILITY STAGE I STAGE II STAGE III STAGE IV
PLATFORM PRODUCT POSITIONING TARGET MARKET
FIT WITH WA
WA INDUSTRY-GOOD RESEARCH
9 PLATFORMS
679 TRADE CODES
47 QUAL/QUANT
SCREENS
Project does not attempt to address firm-level operational or executional activities: - R&D
- Product development
- Sourcing & supply chain
- Production & operations
- Marketing & branding
- Sales & sales structure
- Capital structure
- Negotiation
- Distributor appointment
20 OPPORTUNITIES
YOU ARE
HERE

4 This project is focused on “market demand” from the following twenty-four Asian/Middle Eastern markets
Note: Complete list for analysis purposes, some countries excluded from list if no/limited trade data available (e.g. Iran)
24 COUNTRIES DEFINED AS HIGH POTENTIAL TARGET MARKETS FOR WESTERN AUSTRALIA Target markets; 2015
MIDDLE EAST
Bahrain Egypt Israel
Jordan Kuwait
Lebanon Oman Qatar
Saudi Arabia UAE
24 defined target markets for this project
4
SOUTH ASIA
India Pakistan Sri Lanka
Western Australia
SE ASIA
China Hong Kong
Japan South Korea
Taiwan Indonesia Malaysia
Philippines Singapore Thailand Vietnam

PRODUCT PROFILE
HS Code 150910
Product Olive oil, virgin
Out-of-scope Non virgin olive oil, blends, dressings, supplements, etc. as all are covered under other screened trade codes
Origin Olive tree native to Mediterranean, oil being produced by 6,000 BC
Example ingredients
Olives
Forms/usage - Extensively used in Middle Eastern cuisines - Used in Asia when cooking Mediterranean cuisines - Cooking oil, ingredient, dressings, dip, marinating - Ingredient in cosmetics, pharmaceuticals, soaps, oil lamps
Drivers of consumer/market success
- Health benefits of virgin olive oil
- Flavour profile
- Status as premium oil to use as dip and dressings
WHAT IS THE PRODUCT? Virgin olive oil emerged in Phase I as one of twenty “high growth, high potential” opportunities for Western Australia; virgin olive oil is the first pressing of the fruit of the olive tree
5 Source: photo credit (Dollar Photo); Coriolis analysis
PRODUCT OVERVIEW Example; 2016

DOCUMENT STRUCTURE
What is the strategic situation in the market?
In this environment, what is the opportunity for Western Australia?
Who are the potential in-market partners?
Who are the key firms in Western Australia capable of delivering?
6

Western Australia is well-positioned to grow virgin olive oil exports to Asia
7
- Asian virgin olive oil imports are increasing, with import value growth being driven by rising volume across low/no FOB (free-on-board) price increases
- Asian & Middle Eastern import supply is effectively two countries: Spain and Italy
- Spain and Italy have been the drivers of export growth to Asia and the Middle East
- Spain leads in both absolute volume growth and rate of growth, followed closely by Italy
- Average FOB price to target Asian markets vary by supplier, with Australia achieving a slight discount to Italy, but a premium to Spain
- While virgin olive oil goes to a wide number of the target markets, East Asia is the key region; both Japan and China have large imports
- East Asia – in particular Japan – is driving regional import growth
- Market growth is coming from Japan, China, South Korea and Taiwan
- Average import prices vary by market, with Taiwan and Japan standing out as attractive
- Virgin olive oil consumption and aggregate imports appear strongly driven by income per capita; a number of markets appear to have long-run penetration upside (China in particular)
- Italy and Spain trade off leadership across most markets; Australia has pockets of strength, particularly in China
- Western Australia has clear opportunities for further virgin olive oil export growth in Asia, particular in East Asia
- Data supports new high value, premium olive oil opportunities being initially launched in (1) China, (2) Hong Kong and (3) Japan
- As a “Straw Man” for discussion, we identify a export market roll-out plan

Asian virgin olive oil imports are increasing, with import value growth being driven by rising volume across low/no FOB (free-on-board) price increases
0
20
40
60
80
100
120
140
200
4
200
5
200
6
200
7
200
8
200
9
2010
2011
2012
2013
2014
8 * Compound Annual Growth Rate; Source: UN Comtrade database; Coriolis analysis and classifications
VOLUME T; 000; 2004-2014
$-
$1.00
$2.00
$3.00
$4.00
$5.00
$6.00
200
4
200
5
200
6
200
7
200
8
200
9
2010
2011
2012
2013
2014
AVERAGE PRICE PER KILOGRAM US$; 2004-2014
$-
$100
$200
$300
$400
$500
$600
200
4
200
5
200
6
200
7
200
8
200
9
2010
2011
2012
2013
2014
VALUE US$m; 2004-2014
CAGR* 10%
CAGR 2%
CAGR 13%
TOTAL IMPORTS TO ASIA/MIDDLE EAST TARGET REGION (24 COUNTRIES)

Asian & Middle Eastern import supply is effectively two countries: Spain and Italy
9 NA/ME/CA = North Africa/Middle East/Central Asia; Note: data is as reported by sender (FOB), not receiver; Source: UN Comtrade database; Coriolis analysis and classifications
EXPORT VALUE BY SUPPLIER TO TARGET REGION US$m; FOB; 2014
Other
Australia
NA
/ME/C
A
Europe
$505 $23 $7
Greece $17
Australia $5
NA/ME/CA $23
Other $7
Turkey $33
Spain $265
$5 Other Europe
$6
Italy $184
TOTAL = US$541m

Spain and Italy have been the drivers of export growth to Asia and the Middle East
10 Note: data is as reported by sender (FOB), not receiver; Source: UN Comtrade database; Coriolis analysis and classifications
EXPORT VALUE BY SUPPLIER TO TARGET REGION US$m; FOB; 2004-2014
Italy
Spain
Other Europe
2007 2008 2009 2006 2004 2005
Other
2013 2014
Australia
2012 2010 2011
NA/ME/CA
Greece
10y ABS
Turkey
$107
$140
$411
$222
$385
$148
$265
$219
$331
$113
$92
+$16
$541
$510
$120
$193
$140
$476
$166
$77
$207
+$6
$81
+$18
$90
+$188
+$125
$176 $282
$346
+$5
$81
+$5
+$12
$242
$184
$90
$1
$1
$4
$2
$45
$28
$23
$37
$4
$7
$7
$5
$5
$4
$3
$6
$6
$80 $3 $2
$4
$5
$2
$0
$3
$1
$6
$84
$48
$81 $114
$5
$4
$18
$7
$6 $4
$4
$5
$33
$44
$2
$1
$4
$71
$59 $80 $82
$5
$5
$6
$5
$27
$15
$11
$19
$18
$8 $6
$9 $7
$17
$25 $17
$20
$22
$19
$15
$16 $18
CAGR 13%

Bubble scale: US$m; 2014 A bubble this size=
Spain leads in both absolute volume growth and rate of growth, followed closely by Italy
11 Note: data is as reported by sender (FOB), not receiver; Source: UN Comtrade database; Coriolis analysis and classifications
FIVE YEAR EXPORT GROWTH MATRIX: CHANGE IN VALUE VS. RATE OF GROWTH VS. ABSOLUTE VALUE US$m; 2009 vs. 2014
-20%
$100
15%
$80
25%
20%
-15%
10%
0%
$140 $160
-5%
-25% $120
-10%
5%
$-20 $-40 $-60 $0 $60 $40 $20
NA/ME/CA
Spain
$50m
Australia Greece
Turkey
Other
Other Europe
Italy
5y absolute change in value
5y CAGR

Average FOB price to target Asian markets vary by supplier, with Australia achieving a slight discount to Italy, but a premium to Spain
12 Note: data is as reported by sender (FOB), not receiver; Source: UN Comtrade database; Coriolis analysis and classifications
AVERAGE EXPORT VALUE COST CURVE BY SUPPLIER US$/kg; t; FOB; 2014
Australia
Greece
Italy Spain Turkey
Other
NA
/ME/C
A
Other Europe
$3.98 $3.93
$4.38
$5.34
$8.80
$5.94
$4.94
$5.15
Volume imported by defined target market
Average FOB
value

While virgin olive oil goes to a wide number of the target markets, East Asia is the key region; both Japan and China have large imports
13 Note: data is as reported by sender (FOB), not receiver; Source: UN Comtrade database; Coriolis analysis and classifications
IMPORT VALUE BY MARKET BY REGION US$m; FOB; 2014
NA/ME/CA East Asia Indian Sub SE Asia
China $125
$9 $29 $411
Other $4
Other $2
$91
Israel $18
Egypt $4
Singapore $5
India $7
Saudi Arabia $31
Bahrain $1
UAE $23
Kuwait $7
Qatar $3
South Korea $51
Japan $205
Hong Kong SAR $8
Taiwan $22
Vietnam $4
Thailand $7
Malaysia $4
Indonesia $4
Philippines $4
TOTAL = US$541m

East Asia – in particular Japan – is driving regional import growth
14 Note: data is as reported by sender (FOB), not receiver; Source: UN Comtrade database; Coriolis analysis and classifications
IMPORT VALUE BY MARKET BY REGION US$m; FOB; 2004-2014
South Korea
2012
Indonesia
United Arab Emirates
Malaysia
2013
Thailand
Israel
2006 2004
India
2011 2005
Hong Kong SAR
Qatar Bahrain
Singapore
2008 2007
Vietnam
Other ME
Philippines
Other Ind. Sub
Japan
2009
China
Kuwait
2010 2014
Saudi Arabia
Taiwan
Egypt
$1
$26
$42
$385 $1
$33
$1
$331
$33
$63
$49
$3
$84
$541
$1
$92 $95
$4
$3
$2
$75
$3
$4
$112
$186
$476
$1
$1
$411
$205
$510
$1
$112
$154
$130
$126
$27
$4
$4
$15
$136
$7
$21
$5
$3
$145
$3
$21
$5
$168
$5
$6
$25
$11 $5 $17
$13
$37 $29
$7
$81
$19
$7
$21
$48
$8
$21
$4
$242
$51
$1
$1
$5 $3
$1
$33
$346
$30
$1
$36
$282
$5
$14
$9 $166
$23
$2
$125
$22
$0
$7
$207
$7
$10 $0
$8
$2
$2
$1
$3
$1 $1
$2
$2
$2
$0 $1
$0
$11
$3 $3
$1
$1
$1
$5
$32
$34
$4
$5
$1 $1
$1
$23
$3 $3 $2
$1
$3
$3
$4
$3
$31
$7
$45
$12
$11
$17
$41
$4
$5
$15
$5
$11
$20
$14
$10
$18
$3 $5
$0
$14
$3
$4
$3 $2
$5
$6
$4
$2
$7
$4
$5
$6
$4
$1
$2
$4
$1 $1 $1
$3
$8
$1 $1
$1
$2
$1
$2
$3 $8
$6
$3
$3
$4
$1
$3
$7
$1
$1
$0
$2
$4
$4 $2
$1
$1
$3
$4
$3
$3
$3
$4
$0
$4
$0
$2
$4
$31
$35
$4
$2
$4 $4 $3
$12
$2
$29
$36
$1
$2
$3
$3
$2
$42
$1
$2
$7
$6
$4
$11
$3
$2 $2
$4
$5
$10
$4
$7
$7
$8
$5
$5
CAGR 13%

Bubble scale: US$m; 2014 A bubble this size=
Market growth is coming from Japan, China, South Korea and Taiwan
15 Note: data is as reported by sender (FOB), not receiver; Source: UN Comtrade database; Coriolis analysis and classifications
FIVE YEAR IMPORT GROWTH MATRIX: CHANGE IN VOLUME VS. RATE OF GROWTH VS. ABSOLUTE VALUE US$m; t; 2009 vs. 2014
-5%
-10%
5,000 0 -500 10,000 -15%
20,000 15,000
20%
15%
10%
35%
30%
25%
0%
5% UAE
$100m
Egypt
Kuwait
China
South Korea
Sri Lanka
Malaysia
Lebanon
Indonesia
Hong Kong SAR
Jordan
Japan
Israel
Singapore
India
Thailand
Vietnam
Bahrain
Saudi Arabia
Pakistan
Oman
Taiwan
Qatar
Philippines
5y absolute change in volume
5y CAGR

Average import prices vary by market, with Taiwan and Japan standing out as attractive
16 Note: data is as reported by sender (FOB), not receiver; Source: UN Comtrade database; Coriolis analysis and classifications
AVERAGE IMPORT VALUE COST CURVE BY MARKET/REGION US$/kg; t; FOB; 2014
Saudi Arabia
Qatar
Vietnam
China
Bahrain
Malaysia
Singapore
Om
an
Indonesia
Jordan
Pakistan
Taiw
an
Lebanon Sri Lanka
UA
E
India
Hong K
ong SAR
South Korea
Thailand
Japan
Egypt
Israel
Philippines K
uwait
$5.34
$4.74
$4
.65 $4
.58
$3.35
$3.02
$4.33
$4.95
$4.79
$4.96
$4.96
$5.21
$4.4
0
$4.55 $4
.35
$3.69
$3.96
$4.91
$4.0
5
$4.84
$4.51
Volume imported
Average import
value

Virgin olive oil consumption and aggregate imports appear strongly driven by income per capita; a number of markets appear to have long-run penetration upside (China in particular)
17 Note: data is as reported by sender (FOB), not receiver; Source: UN Comtrade database; Wikipedia (GDP/capita); Coriolis analysis and classifications
MARKET SIZE DRIVERS: GDP PER CAPITA VS. IMPORTS PER CAPITA VS. MARKET SIZE Kg; US$; t; 2014
$60,000
0.6
$50,000 $20,000 $0 $10,000 $40,000 $30,000
0.7
0.5
0.2
0.3
0.4
0.1
0.0
Taiwan
South Korea
Jordan
Lebanon
Malaysia
Kuwait
China
Sri Lanka
30,000
Bahrain
Hong Kong SAR
Japan
Israel
Indonesia Oman
Singapore
Thailand Vietnam
India
Qatar
Saudi Arabia
Philippines
Egypt Pakistan
United Arab Emirates
GDP per capita
Imports per capita
Bubble scale: tonnes; 2014 A bubble this size=

Italy and Spain trade off leadership across most markets; Australia has pockets of strength, particularly in China
18 Note: data is as reported by sender (FOB), not receiver; Source: UN Comtrade database; Coriolis analysis and classifications
IMPORT VALUE MARKET SHARE BY MARKET BY KEY SUPPLIER US$m; FOB; 2014
China
Philippines
Israel
Taiw
an
Pakistan
Jordan Lebanon
Egypt
UA
E
India Singapore
Hong K
ong SAR
South Korea
Vietnam
Bahrain
Saudi Arabia
Qatar
Om
an
Thailand
Japan
Kuw
ait
Malaysia
Indonesia
Sri Lanka
49%
14%
4%
28%
3%
20%
51%
16%
64% 68%
40%
49%
32%
0% 1%
23%
73%
28%
9%
10%
1%
15%
4%
3%
3%
1% 0%
8%
0% 17% 21%
2%
3%
1%
1%
4%
61%
15%
43%
3%
4%
1% 2%
10%
1%
22%
Total value of imports
Spain
Italy
Turkey Greece Other Europe NA/ME/CA Other Australia

Western Australia has clear opportunities for further virgin olive oil export growth in Asia, particularly in East Asia
19 Note: data is as reported by sender (FOB), not receiver; Source: UN Comtrade database; Coriolis analysis and classifications
AUSTRALIAN IMPORT VALUE MARKET SHARE VS. MARKET VALUE US$m; FOB; 2014
Singapore
Pakistan O
man
Hong K
ong SAR
Bahrain
Jordan
Malaysia
Taiw
an
Indonesia
Egypt
South Korea
Saudi Arabia
Thailand
UA
E Japan
Kuw
ait
Philippines
China
India
Lebanon
Vietnam
Israel
Sri Lanka
Qatar
0.0
%
0.0
%
3.1%
0.0
%
1.2%
0.0
%
0.0
%
0.0
%
0.0
%
0.0
%
0.7%
0.0
%
0.0
%
0.0
%
0.5%
0.4
%
0.0
%
0.4
%
0.0
%
0.0
%
1.1%
0.4
%
Total value of imports
Australian market share; Value; 14

Bubble scale: US$m; 2014 A bubble this size=
Data supports new high value, premium olive oil opportunities being initially launched in (1) China, (2) Hong Kong and (3) Japan
20 Note: data is as reported by sender (FOB), not receiver; Source: UN Comtrade database; Coriolis analysis and classifications
WHERE TO FOCUS FOR NEW HIGH VALUE, PREMIUM PRODUCTS: AU SHARE VS. AVERAGE VALUE VS. MARKET SIZE % of value; US$; US$m; 2014
2% 3%
$5.00
3% 1% 0% 1% 2%
$5.50
$4.00
$3.00
$4.50
4%
$3.50
Sri Lanka
$50
India
Lebanon
Jordan
Singapore
UAE
Malaysia
Indonesia
Saudi Arabia
Vietnam
China
Kuwait
Oman
Bahrain
Qatar
Thailand
Egypt
Israel
Philippines
Pakistan
Taiwan
South Korea
Hong Kong SAR
Japan
AU share of total import value
VALUE Average
FOB $/kg 2014
1
2
3

As a “Straw Man” for discussion, we identify a export market roll-out plan
21
PRELIMINARY “STRAW MAN” DEVELOPMENT & ROLLOUT PLAN FOR VIRGIN OLIVE OIL OPPORTUNITY Model; 2016
1 Export market launch in China
2 Expand into Hong Kong
3 Expand into Japan
0 Product development and testing
Potential in-market partners identified later in this document
- Growing middle-class with increasing income
- Japan & S. Korea suggest significant further consumption growth will occur driving market growth
- WA/AU already achieving the #3 market position

DOCUMENT STRUCTURE
What is the strategic situation in the market?
In this environment, what is the opportunity for Western Australia?
Who are the potential in-market partners?
Who are the key firms in Western Australia capable of delivering?
22

Western Australia can grow extra virgin olive oil exports to Asia, but innovation is required
23
IS THE MARKET DEVELOPED & COMPETITIVE?
- The flow of olive oil from the farm through to the consumer is relatively straight forward and simple
- Extra virgin olive oil prices are competitive in Asia; there is a premium for “origin” and organic in some markets
- Asian markets have a much less developed virgin olive oil range and offer than Western countries
- “Leading indicator” Western markets strongly suggest depth of range in Asian virgin olive oil markets will increase going forward
- Olive oil appears to support a market structure of ~5-6 brands and private label; global leaders exist (e.g. Colavita, Bertolli, Filippo Berio) and are in Asia
WHAT IS WA CAPABLE OF DELIVERING?
- A range of premium, value-adding product attributes emerged from our cross-country retailer survey
- Western Australian virgin olive oil producers need to continue to move forward and improve through new products
- Multiple potential positions exist to develop a premium extra virgin olive oil offer for Asia
- Products from other processors in other markets demonstrate what is possible in terms of developing a premium Western Australian extra virgin olive oil offer
- There are a wide range of potential product positions or claims available for a premium extra virgin olive oil product from Western Australia targeting Asia
- As a “Straw Man” for discussion, we identify an opportunity for a high value, premium extra virgin olive oil product with select characteristics for export market launch
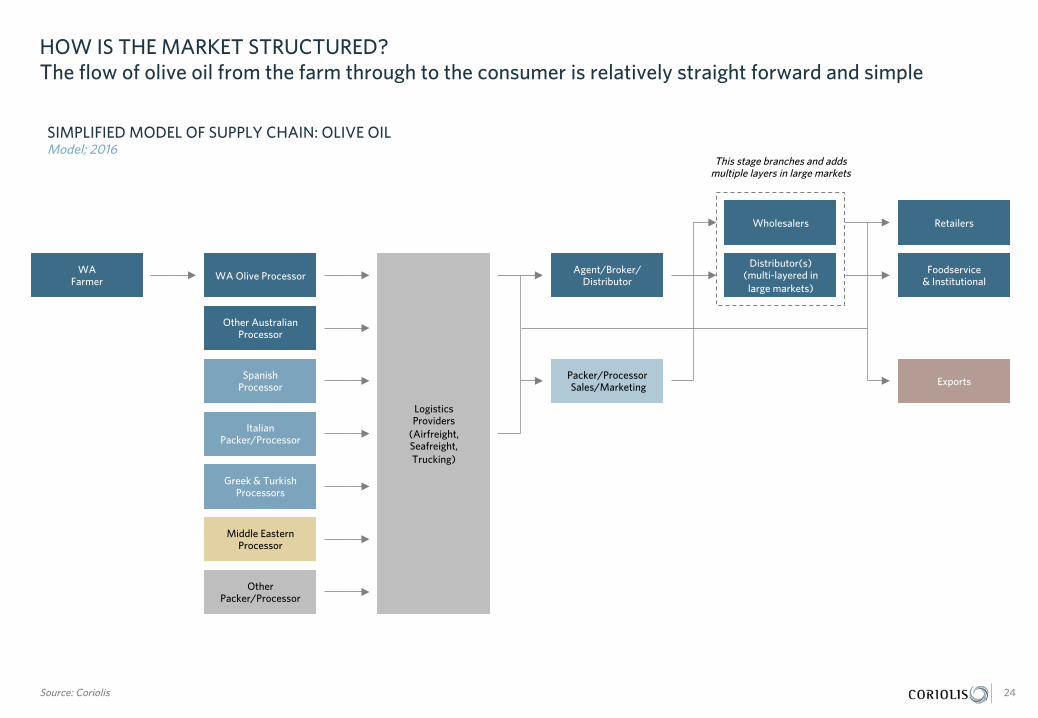
HOW IS THE MARKET STRUCTURED? The flow of olive oil from the farm through to the consumer is relatively straight forward and simple
24 Source: Coriolis
SIMPLIFIED MODEL OF SUPPLY CHAIN: OLIVE OIL Model; 2016
Retailers
Foodservice & Institutional
Exports
Wholesalers
Distributor(s) (multi-layered in large markets)
Agent/Broker/ Distributor
Packer/Processor Sales/Marketing
Logistics Providers
(Airfreight, Seafreight, Trucking)
WA Olive Processor
Other Australian Processor
WA Farmer
Spanish Processor
Italian Packer/Processor
Greek & Turkish Processors
Middle Eastern Processor
Other Packer/Processor
This stage branches and adds multiple layers in large markets

WHO IS THE COMPETITION? PRICING Extra virgin olive oil prices are competitive in Asia; there is a premium for “origin” and organic in some markets
$7.01
$13.72
$4.53 $5.80 $6.69 $6.18 $6.60
$7.88
$15.25
$4.21
$7.35 $8.04 $10.35
$12.78 $14.06
$17.89
$42.19
$2.75 $3.44 $5.15
$6.80 $7.56
Bertolli EVO
O
Tesco Sicilian EV
OO
Naturel EV
OO
Bertolli EVO
O
Colavita EV
OO
Naturel EV
OO
Farmgate EV
OO
Bertolli EVO
O
Waitrose EV
OO
O
rganic
Select EVO
O
Bertolli EVO
O
Filippo Berio EVO
O
De C
ecco EVO
O
Meridian EV
OO
O
rganic
Napa V
alley EVO
O
Organic
Filippo Berio Tuscany
EVO
O
Ardoino V
OO
La Espanola EVO
O
Coles A
ustralian EV
OO
Red Island EVO
O
Colavita EV
OO
Minerva K
alamata
EVO
O
25 Source: Coriolis from store checks
SHELF PRICE PER 500ML BOTTLE ACROSS SELECT SE ASIAN MARKETS AND AUSTRALIA: VIRGIN OLIVE OIL US$/500ml; Jan 2016
SELECT SE ASIAN RETAILERS AUSTRALIA
AU AU
Malaysia Thailand Singapore Hong Kong

WHAT IS ON THE SHELF? RANGE IN MARKET Asian markets have a much less developed virgin olive oil range and offer than Western countries
26 Source: Coriolis from store checks; photo credit (fair use/fair dealing; low resolution; complete product/brand for illustrative purposes); Coriolis analysis
EXAMPLE: ACTUAL 500ML VIRGIN OLIVE OIL RANGE ON SHELF Jan 2016
London: GDP/Capita US$75,200 Hong Kong: GDP/Capita US$40,169

IS THE MARKET DEVELOPED & COMPETITIVE? RANGE “Leading indicator” Western markets strongly suggest depth of range in Asian virgin olive oil markets will increase going forward
41 40 40
36 35
31
25 25
20 17
11 10 8
Coles (AU)
Wegmans (NY)
Waitrose (UK)
Tesco (UK)
Woolworths (AU)
Sainsbury (UK)
Safeway (CA)
Tesco (MY)
Park'N Shop (HK)
Fairprice (SG)
Cold Storage (SG)
Tesco (TH)
Wellcome (HK)
27 Source: Coriolis from store checks
NUMBER OF LINES ON SHELF: SELECT RETAILERS FROM ACROSS MULTIPLE MARKETS SKU; actual; Jan 2016
SE Asia Anglo-American
Average 15.2 sku/store
Average 35.4 sku/store
2 x

IS THE MARKET DEVELOPED & COMPETITIVE? SHARE DISTRIBUTION Olive oil appears to support a market structure of ~5-6 brands and private label; global leaders exist (e.g. Colavita, Bertolli, Filippo Berio) and are in Asia
28 Source: Coriolis from store checks
MARKET SHARE BY BRAND: SELECT RETAILERS FROM ACROSS MULTIPLE MARKETS SKU; actual; 2016
Private label 55%
Filippo Berio (IT)
7%
Goya (US) 7%
California Olive
Ranch(US) 8%
Colavita (IT) 5%
Other 18%
Wegman’s (NY) Waitrose (UK) Coles (AU)
Filippo Berio (IT) 20%
Naturel (SG) 16%
Colavita (IT) 16%
Bertolli (IT) 12%
Basso (IT) 12%
Borges(ES) 8%
Allegro (UAE)
8% Other 8%
Tesco (MY)
Private label 30%
Filippo Berio (IT) 25%
Borges(ES) 10%
Bertolli (IT) 5%
Other 30%
Park ‘N Shop (HK)
Private label 23%
Naturel (SG) 17%
Ravika (TR) 18%
Bertolli (IT) 12%
Borges(ES) 12%
Sumich (AU) 6%
Other 12%
Fairprice (SG)
Filippo Berio (IT) 27%
Private label 25%
Carbonell (ES) 8%
Castillo de Canena (ES)
5%
Colonna (IT) 5%
Other 30%
Cobram Estate (AU)
29%
Private label 15%
Red Island (AU) 12%
Moro (AU) 12%
Squeaky Gate (AU)
10%
La Espanola (ES) 7%
Ollo (AU) 5%
Other 10%

IS THE MARKET DEVELOPED & COMPETITIVE? PRODUCT ATTRIBUTES A range of premium, value-adding product attributes emerged from our cross-country retailer survey
22%
15%
8%
7%
5%
Premium 250mL size
Origin in title
Organic
Flavoured
Spray
29 Source: Coriolis from store checks
PERCENT OF OBSERVED PRODUCTS ON SHELF MAKING THE CLAIM ON PACK % of SKU; N=343; Jan 2016
- This provide very clear instruction on what product attributes are succeeding the most across markets
- Western Australian virgin olive oil producers looking to grow value and share should focus in these areas
- Packaging and promoting origin stand out, with many observed product SKU using these approaches
- Survey universe is all products in all listed retailers (across multiple countries)
TAKEAWAYS

WHAT IS WA CAPABLE OF DELIVERING? STRATEGIC DIRECTION Western Australian extra virgin olive oil producers need to continue to move forward and improve through new products
30
SUGGESTED STRATEGIC DIRECTION: WESTERN AUSTRALIAN VIRGIN OLIVE OIL Model; 2016
Generic olive oil/virgin olive oil
Extra virgin Premium bottle
and label Named region
Named olive varieties
Organic Provenance
Proven EVOO
Middle Eastern suppliers are here
WA suppliers are here in Asia
High growth, high potential opportunities
are here
USA & UK suppliers are here

WHAT IS WA CAPABLE OF DELIVERING? CLAIMS Multiple potential positions exist to develop a premium extra virgin olive oil offer for Asia
31 Source: Coriolis; photo credit (Dollar Photo and Southern Forests Food Council Inc.)
IDENTIFIED POTENTIAL PREMIUM POSITIONS Model; 2016
Organic Cold-pressed Pourers Heart healthy
Identified source region Gourmet varieties Range of sizes Reduces inflammation
Unadulterated Attractive packaging Dressings and marinades Lowers LDL-cholesterol
Track & trace Fresh Rich in antioxidants
High in vitamin E
Decreases blood pressure
Preventative of arthritis
Helps calcium absorption
HEALTH PROVENANCE INDULGENCE CONVENIENCE
Flavoured

WHAT IS WA CAPABLE OF DELIVERING? GLOBAL PEERS Products from other processors in other markets demonstrate what is possible in terms of developing a premium Western Australian extra virgin olive oil offer
32 Source: photo credit (fair use/fair dealing; low resolution; complete product/brand for illustrative purposes); Coriolis analysis
EXAMPLES OF PREMIUM PRODUCTS FROM OTHER MARKETS Select; 2016
Convenient Unique packaging Equal Exchange/Fairtrade Convenience
Healthy Origin in name Organic Pop up pourer in cap
100% olive oil spray Variety of olives named Origin in name “New & exclusive”
For dressings & flavouring Limited edition Region/variety in name
No added water “Exclusive selection” Supporting small farmers
No added alcohol Since 1981
No aerosol propellant
“Passion in every drop”
PDO
Low calorie cooking

WHAT IS A POTENTIAL WA OFFER? There are a wide range of potential product positions or claims available for a premium extra virgin olive oil product from Western Australia targeting Asia
33 Source: Coriolis; photo credit (Dollar Photo and Southern Forests Food Council Inc.)
HYPOTHETICAL EXAMPLE OF POTENTIAL PREMIUM PRODUCT FROM WA Model; 2016
High in antioxidants High in vitamin E
From Western Australia
Organic Unadulterated
Cold-pressed
Pourer container
Heart healthy
Attractive packaging
HEALTH
PROVENANCE
INDULGENCE
CONVENIENCE

WHAT IS THE IDENTIFIED OPPORTUNITY? As a “Straw Man” for discussion, we identify an opportunity for a high value, premium extra virgin olive oil product with select characteristics for export market launch
34
PRELIMINARY “STRAW MAN” DEVELOPMENT & ROLLOUT PLAN FOR VIRGIN OLIVE OIL OPPORTUNITY Model; 2016
CURRENT WA POSITIONING IN ASIA
IDENTIFIED HIGH GROWTH, HIGH VALUE OPPORTUNITY FOR WA
High in vitamin E
High in antioxidants
From Western Australia
Organic
Australian Flag
Unique packaging
Pourer in cap
Heart healthy
Origin and variety
From Australia
Standard bottle
POTENTIAL FUTURE PRODUCT LINE EXTENSION
Spray
Low calorie cooking

DOCUMENT STRUCTURE
What is the strategic situation in the market?
In this environment, what is the opportunity for Western Australia?
Who are the potential in-market partners?
Who are the key firms in Western Australia capable of delivering?
35

FOCUS MARKET – 1 – CHINA China has a robust and well-developed food retailing and foodservice sector
$601
$421
$450
$135
0%
10%
20%
30%
40%
50%
60%
70%
80%
90%
100%
Turnover Purchases
36 Source: Coriolis from a wide range of sources
TURNOVER & PURCHASES US$b; 2014
ESTIMATED WHOLESALE FOOD & FMCG PURCHASES US$b; 2014
Foodservice Retail
Supermarkets $126
$135
Traditional $71
Online $8
Foodservice $135
Wet markets $143
$421
Hypermarkets $63
Convenience $8
Foodservice
Retail 7m+ restaurants plus bars & clubs,
hotels/motels/etc., vending machines,
institutions (schools, hospitals, airline
caterers, prisons, etc.)
6.0%
7.0%
Retail
Foodservice
TURNOVER GROWTH RATE % Y-O-Y; CNY; 2013v2014
PRELIMINARY
PRELIMINARY
PRELIMINARY

FOCUS MARKET – 1 – CHINA Eighteen potential in-market partners are identified for Western Australian firms in China…
37 Source: Coriolis from a wide range of sources
POTENTIAL IN-MARKET PARTNERS – CHINA 2015 or as available
Firm CR Vanguard Sun Art Retail Group Wal-Mart China Lianhua Carrefour China Yonghui Superstores Nonggongshang
Ownership China Resources (SOE; China)
Listed; HK; Auchan and Ruentex group
Listed; USA Listed; HK; Bailian Group Co.
Listed; France Listed; Shanghai; Dairy Farm 20%; JD.com 10%;
China
Website www.crvanguard.com.hk www.crc.com.cn
www.sunartretail.com www.rt-mart.com.tw
www.wal-martchina.com www.samsclub.cn
lianhua.todayir.com
www.carrefour.cn www.carrefour.com.cn www.carrefour.com
www.yonghui.com.cn www.ngs1685.com
Annual sales Total/Food
US$15.2b (13) US$14.0b (14) US$11.0b (13) US$10.5b (13) US$7.1b (13) US$5.3b US$4.6b
Food store formats
Hypermarket Supermarket Convenience
Hypermarket Online
Hypermarket Warehouse Club Compact HM Supermarket
Hypermarkets Supermarket 4,600 Convenience 1,905
Hypermarket 236 Convenience 3 Online
Supermarket Supermarkets 2,644 Convenience 1,700
# of stores 4,637 264 423 6,900+ 239 351 2,644
Store fascia
- Alldays - Kedi

FOCUS MARKET – 1 – CHINA … continued
38 Source: Coriolis from a wide range of sources
POTENTIAL IN-MARKET PARTNERS – CHINA 2015 or as available
Firm HNA Group Wumart Stores Better-Life Jiajiayue Group A. Best Supermarket Metro Cash & Carry Lotte Mart
Ownership Private; China Public; China Public; China Public; China Public; China Listed; Germany Listed; Korea
Website www.hnagroup.com/ www.wumart.com www.bbg.com.cn
www.jiajiayue.com.cn www.abest-xyj.com www.metro.com.cn www.metrogroup.de
www.lotte.co.kr
Annual sales Total/Food
US$4.0b (13) US$3.3b (13) US$3.2b (13) US$2.9b US$2.7b US$2.7b (13) US$2.4b (13)
Food store formats
Hypermarkets Supermarkets Convenience
Hypermarkets Convenience
Hypermarkets Department stores Online
Hypermarket Supermarket Department store Convenience
Hypermarket Supermarket
Cash & Carry Hypermarkets Supermarkets
# of stores 482 547 445 601 116 75 110
Store fascia
Le Wan Jia Supermarket Jiangsu Chaoyue Supermarket Hunan Joindoor Supermarket

FOCUS MARKET – 1 – CHINA … continued
39 Source: Coriolis from a wide range of sources
POTENTIAL IN-MARKET PARTNERS – CHINA 2015 or as available
Firm Sinopec Group PetroChina Co. Dongguan Sugar & Liquor Group
Seven & I Holdings
Ownership Chinese government (SOE)
Chinese government (SOE)
Japan; listed
Website english.sinopec.com www.meiyijia.com.cn www.7-11.cn www.7andi.com www.sej.co.jp www.itoyokado.co.jp
Annual sales Total/Food
US$455b (14) US$49.1b US$17.5b
Food store formats
Easy Joy uSmile Meiyijia Seven&I 301 Area licensees 1,763 - DairyFarm 740 - Others ~1,063
# of stores 23,300 14,000 5,580 2,064
Store fascia

FOCUS MARKET – 2 – HONG KONG Hong Kong has a robust and well-developed food retailing and foodservice sector
$11.5
$8.0
$12.8
$3.9
0%
10%
20%
30%
40%
50%
60%
70%
80%
90%
100%
Turnover Purchases
40 Source: Coriolis from a wide range of sources
TURNOVER & PURCHASES US$b; 2014
ESTIMATED WHOLESALE FOOD & FMCG PURCHASES US$b; 2014
Retail Foodservice
$3.9 $8.0
Foodservice $3.9
CRA $0.3 CRE
$0.2
Wellcome $1.2
AEON $0.6
Drug stores $0.6
Wet markets, etc. $3.0
ParknShop $1.5
Other retail $0.6
Foodservice
Retail 14,000+ restaurants 1,000+ bars & clubs
1,050+ hotels Vending machines
Institutions (1,088 schools, 42 hospitals, 3 main airline
caterers, prisons, etc.)
6.7%
3.5%
Retail
Foodservice
TURNOVER GROWTH RATE % Y-O-Y; HK$; 2013v2014

FOCUS MARKET – 2 – HONG KONG Seven potential in-market partners are identified for Western Australian firms in Hong Kong
Firm Wellcome Park’N Shop CR Vanguard Dah Chong Hong 759 Stores AEON Stores Convenience Retail Asia
Ownership Dairy Farm International/Jardine Matheson
A.S. Watson/ Hutchison Whampoa
CRE/China Resources (SOE; China)
Dah Chong Hong/ CITIC Pacific/CITIC (SOE; China)
Private; Hong Kong (Lam Wai Chun)
AEON (Japan) Fung Group
Website www.wellcome.com.hk www.parknshop.com www.crvanguard.com.hk www.crc.com.cn
www.dch.com.hk
www.759store.com www.aeonstores.com.hk www.aeon.info
www.circlek.hk/en www.cr-asia.com
Annual sales (in HK)
$2.2b+ $2.8b ~$0.8b (food/FMCG) N/A N/A $0.8b $0.4b
Food store formats
Supermarkets 318 Convenience 921 Health & Beauty 369 Restaurants 676
Supermarkets 260+ Convenience
Supermarkets Convenience
Supermarkets Grocery 247+ Dept. stores (w/food) 8 Supermarkets 5
Convenience 600+ Bakery
# of stores Wellcome 280+ Marketplace 31 7-Eleven 900+ Olivers the Delicatessen ThreeSixty
ParknShop 175 PnS Superstore 50+ PnS Taste 10 PnS Fusion 14
CR Vanguard 100+ VanGo 79
DCH Food Mart 80+ DCH Food Mart Deluxe
759 Stores 247+ AEON 13 Circle K Saint Honore Cake
Store fascia
41 Source: Coriolis from a wide range of sources
POTENTIAL IN-MARKET PARTNERS – HONG KONG 2015 or as available

FOCUS MARKET – 3 – JAPAN Japan has a robust and well-developed food retailing and foodservice sector
$331
$232
$310
$93
0%
10%
20%
30%
40%
50%
60%
70%
80%
90%
100%
Turnover Purchases
42 Source: Coriolis from a wide range of sources
TURNOVER & PURCHASES US$b; 2014
ESTIMATED WHOLESALE FOOD & FMCG PURCHASES US$b; 2014
Foodservice Retail
Convenience $112.9
$93.0
Small grocers $27.5
Specialists $22.5
Foodservice $93.0
Other grocery $16.6
$287.1
Supermarkets $102.3
Online $5.3
Foodservice
Retail 711,000 restaurants, bars & clubs, 87,927 hotels/motels/etc., vending machines,
institutions (schools, hospitals, airline
caterers, prisons, etc.)
0.0%
2.4%
Retail
Foodservice
TURNOVER GROWTH RATE % Y-O-Y; JPY; 2013v2014

FOCUS MARKET – 3 – JAPAN Eight potential in-market partners are identified for Western Australian firms in Japan
43 Source: Coriolis from a wide range of sources
POTENTIAL IN-MARKET PARTNERS – JAPAN 2015 or as available
Firm AEON Retail Seven & I Holdings Uny Group Holdings Izumi Co. Ltd. Life Arcs Lawson Family Mart
Ownership Japan; listed Japan; listed Japan; listed Japan; listed Japan; listed Japan Japan; listed Japan; listed
Website www.aeon.info www.maxvalu.co.jp www.daiei.co.jp www.ministop.co.jp
www.7andi.com www.sej.co.jp www.itoyokado.co.jp
www.unygroup-hds.com www.uny.co.jp www.circleksunkus.jp
www.izumi.co.jp
www.lifecorp.jp www.arcs-g.co.jp www.lawson.jp
www.family.co.jp
Annual sales Total/Food
US$61.2b US$16.8b
US$49.1b US$17.5b
US$9.0b US$6.7b
US$4.7b US$2.1b
US$4.7b US$3.8b
US$4b US$4b
US$17.4b US$14b
Food store formats
Hypermarket Supermarket Department stores Convenience (3.4% share) Pharmacy/HBC
Convenience 17,900 (41% share) Supermarkets 185 Department stores
Supermarket Convenience (9.6% share) HBC Foodservice
Supermarkets Hypermarkets Malls
Supermarket Convenience 12,254 (20.5% share)
Convenience 9,975 (19% share)
# of stores 1,882 18,262 226 102 239 290 12,254 9,975 (JP) 16,970 (Global)
Store fascia

DOCUMENT STRUCTURE
What is the strategic situation in the market?
In this environment, what is the opportunity for Western Australia?
Who are the potential in-market partners?
Who are the key firms in Western Australia capable of delivering?
44

IDENTIFIED WA COMPANIES
AUSTRALIAN ORGANIC OLIVE OIL CO
DANDARAGAN ESTATE FINI OlIVES
ADDRESS: 6/41 King Edward Rd, Osborne Pk WA6017 ADDRESS: 7/97 Garling Street, O’Connor, WA 6163 ADDRESS: 237 Orange Springs Road, Gingin WA 6503
PHONE: 08 6336 8220 PHONE: 08 9214 9747 PHONE: 08 6253 8988
WEBSITE: www.goldengrange.com.au WEBSITE: www.dandaraganestate.com.au WEBSITE: www.finiolives.com.au/
45 Sources: Coriolis from a wide range of sources
FRANKLAND RIVER OLIVE COMPANY
SUMICH GROUP
ADDRESS: 1 McDowell St, Welshpool, WA 6160 ADDRESS: Mandogalup Rd, Mandogalup, WA 6167
PHONE: 08 9494 2044 PHONE: 08 9437 2066
WEBSITE: www.jingilli.net.au WEBSITE: www.sumich.com

AUSTRALIA Coriolis Australia Pty Ltd
PO Box 5831 St Georges Terrace
Perth, WA 6831 Australia
+61 8 9468 4691
NEW ZEALAND Coriolis (New Zealand) Limited
PO Box 90-509 Victoria Street West
Auckland, 1142 New Zealand
+64 9 623 1848
www.coriolisresearch.com
Coriolis is the leading Australasian management consulting firm specialising in the wider food value chain. We work on projects in agriculture, food and beverages, consumer packaged goods, retailing & foodservice. In other words, things you put in your mouth and places that sell them. WHERE WE WORK We focus on the Asia Pacific region, but look at problems with a global point-of-view. We have strong understanding of, and experience in, markets and systems in Australia, China, Japan, Malaysia, New Zealand, Singapore, South Korea, Thailand, the United Kingdom and the U.S. We regularly conduct international market evaluations and benchmarking. WHAT WE DO We help our clients assemble the facts needed to guide their big decisions. We develop practical, fact-based insights grounded in the real world that guide our clients decisions and actions. We make practical recommendations. We work with clients to make change happen. We assume leadership positions to implement change as necessary. HOW WE DO IT All of our team have worked across one-or-more parts of the wider food value chain, from farm-to-plate. As a result, our recommendations are grounded in the real world. Our style is practical and down-to-earth. We try to put ourselves in our clients’ shoes and focus on actions. We listen hard, but we are suspicious of the consensus. We provide an external, objective perspective. We are happy to link our fees to results. WHO WE WORK WITH We only work with a select group of clients we trust. We build long term relationships with our clients and more than 80% of our work comes from existing clients. Our clients trust our experience, advice and integrity.
Coriolis advises clients on growth strategy, mergers and acquisitions, operational improvement and organisational change. Typical assignments for clients include… FIRM STRATEGY & OPERATIONS We help clients develop their own strategy for growing sales and profits. We have a strong bias towards growth driven by new products, new channels and new markets. MARKET ENTRY We help clients identify which countries are the most attractive – from a consumer, a competition and a channel point-of-view. Following this we assist in developing a plan for market entry and growth. VALUE CREATION We help clients create value through revenue growth and cost reduction. TARGET IDENTIFICATION We help clients identify high potential acquisition targets by profiling industries, screening companies and devising a plan to approach targets. DUE DILIGENCE We help organisations make better decisions by performing consumer and market-focused due diligence and assessing performance improvement opportunities. EXPERT WITNESS We provide expert witness support to clients in legal cases and insurance claims. We assist with applications under competition/fair trade laws and regulations.