Embed Size (px)
Citation preview

1
IN PRESS: Accepted for publication in the International Journal of Human
and Ecological Risk Assessment, September 4, 2010.
Natural Gas Operations from a Public Health Perspective
Theo Colborn*, Carol Kwiatkowski, Kim Schultz, Mary Bachran
T. Colborn, Ph.D.
TEDX, The Endocrine Disruption Exchange
P.O. Box 1407, Paonia, CO 81428
Ph: 970-527-4082 Fx: 970-527-4082
Acknowledgments. We thank The New York Community Trust, the Winslow Foundation, and
the U.S. Environmental Protection Agency Grant No. EQ-97838701 for their support.
This data collection and analyses was partially funded through an EPA grant. EPA makes no
claims regarding the accuracy or completeness of the information in this article.
Competing interest declaration: The authors have no conflicts of interest.
Running head: Natural Gas Operations from a Public Health Perspective

2
Natural Gas Operations from a Public Health Perspective
ABSTRACT
In the 1990s, the U.S. rush to become energy self-sufficient led to rapid expansion in acreage
and intensity of natural gas operations across the western U.S. Modern technology to recover natural
gas depends on undisclosed amounts of toxic chemicals and the release of combustion materials and
other gases that may pose immediate and long term hazards to human health, water and air. We
compiled a list of products and chemicals used in natural gas operations, searched the literature for
their health effects, and categorized them according to standard toxicological categories. From this
we created a profile of possible health effects based on the number of chemicals associated with each
category. We demonstrated that toxic chemicals are used during both the fracturing and drilling
phases of gas operations, that there may be long term health effects that are not immediately
recognized, and that waste evaporation pits may contain numerous chemicals on the Superfund list.
Our findings show the difficulty of developing a water quality monitoring program. To protect public
health we recommend full disclosure of the contents of all products, extensive air and water
monitoring, a comprehensive human health study, and regulation of hydraulic fracturing under the
Safe Drinking Water Act.
Key words: drilling, health, hydraulic fracturing, natural gas, ozone, pollution
3
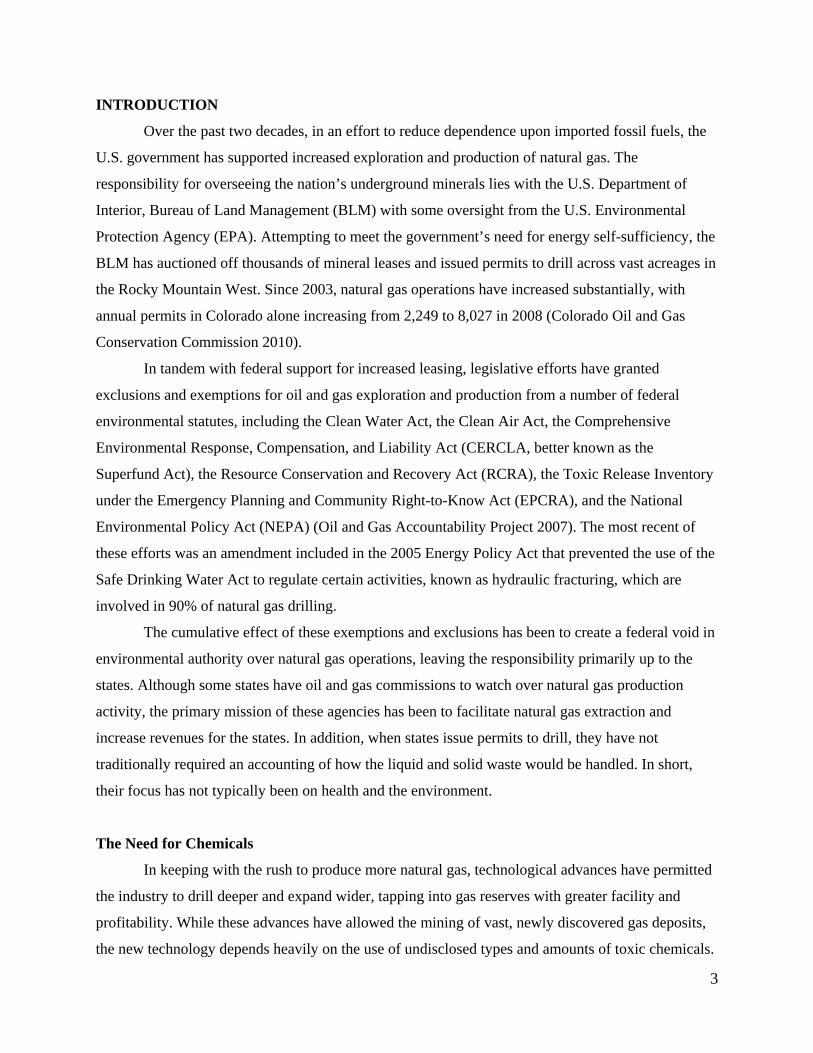
INTRODUCTION
Over the past two decades, in an effort to reduce dependence upon imported fossil fuels, the
U.S. government has supported increased exploration and production of natural gas. The
responsibility for overseeing the nation’s underground minerals lies with the U.S. Department of
Interior, Bureau of Land Management (BLM) with some oversight from the U.S. Environmental
Protection Agency (EPA). Attempting to meet the government’s need for energy self-sufficiency, the
BLM has auctioned off thousands of mineral leases and issued permits to drill across vast acreages in
the Rocky Mountain West. Since 2003, natural gas operations have increased substantially, with
annual permits in Colorado alone increasing from 2,249 to 8,027 in 2008 (Colorado Oil and Gas
Conservation Commission 2010).
In tandem with federal support for increased leasing, legislative efforts have granted
exclusions and exemptions for oil and gas exploration and production from a number of federal
environmental statutes, including the Clean Water Act, the Clean Air Act, the Comprehensive
Environmental Response, Compensation, and Liability Act (CERCLA, better known as the
Superfund Act), the Resource Conservation and Recovery Act (RCRA), the Toxic Release Inventory
under the Emergency Planning and Community Right-to-Know Act (EPCRA), and the National
Environmental Policy Act (NEPA) (Oil and Gas Accountability Project 2007). The most recent of
these efforts was an amendment included in the 2005 Energy Policy Act that prevented the use of the
Safe Drinking Water Act to regulate certain activities, known as hydraulic fracturing, which are
involved in 90% of natural gas drilling.
The cumulative effect of these exemptions and exclusions has been to create a federal void in
environmental authority over natural gas operations, leaving the responsibility primarily up to the
states. Although some states have oil and gas commissions to watch over natural gas production
activity, the primary mission of these agencies has been to facilitate natural gas extraction and
increase revenues for the states. In addition, when states issue permits to drill, they have not
traditionally required an accounting of how the liquid and solid waste would be handled. In short,
their focus has not typically been on health and the environment.
The Need for Chemicals
In keeping with the rush to produce more natural gas, technological advances have permitted
the industry to drill deeper and expand wider, tapping into gas reserves with greater facility and
profitability. While these advances have allowed the mining of vast, newly discovered gas deposits,
the new technology depends heavily on the use of undisclosed types and amounts of toxic chemicals.

4
Chemicals are used throughout operations to reach and release natural gas. First,
combinations of chemicals are added to the “muds” used to drill the bore hole. Chemicals are added
to increase the density and weight of the fluids to facilitate boring, to reduce friction, to facilitate the
return of drilling detritus to the surface, to shorten drilling time, and to reduce accidents. After
drilling, hydraulic fracturing (also known as fracking, frac’ing or stimulation) is done to break up the
zone in which the gas is trapped and make it easier for the methane to escape, increasing well
productivity. In the West, approximately a million or more gallons of fluid containing toxic
chemicals are injected underground during this operational stage. As with drilling, chemicals are
used in fracking fluids for many purposes (Table 1). One well can be fracked 10 or more times and
there can be up to 30 wells on one pad. An estimated 50% to 90% of the fracking fluid is returned to
the surface during well completion and subsequent production (B.C. Oil and Gas Commission 2001),
bringing with it toxic gasses, liquids, and solid material that are naturally present in underground oil
and gas deposits. Under some circumstances, none of the injected fluid is recovered.
In most regions of the country, raw natural gas comes out of the well along with water,
various liquid hydrocarbons including benzene, toluene, ethylbenzene, and xylene (as a group, called
BTEX), hydrogen sulfide (H2S), and numerous other organic compounds that have to be removed
from the gas. When the gas leaves the well it is passed through units called heater treaters that are
filled with triethylene glycol and/or ethylene glycol that absorbs the water from the gas. Once the
glycol solution becomes saturated with water, the heaters turn on and raise the temperature enough to
boil off the water, which is vented through a closed system and upon cooling, ends up in a nearby
tank labeled “produced water”. The glycol fluid, which has a higher boiling point than water, cools
and is reused. During the heating process at critical temperatures the oily substances that came up
with the gas become volatile and then re-condense into a separate holding tank. This is known as
“condensate” water. The contaminated water can be re-injected underground on the well pad or off
site, common practices in the eastern U.S., or hauled off the well pad to waste evaporation pits in the
West. Temporary pits are also constructed during drilling to hold the cuttings, used drilling mud
which is often re-used, and any other contaminated water that comes to the surface while drilling.
These reserve pits on well pads are supposed to be drained and covered with top soil or other suitable
material within a month after drilling stops.
An Unexpected Side Effect: Air Pollution
In addition to the land and water contamination issues, at each stage of production and
delivery tons of toxic volatile compounds (VOCs), including BTEX, other hydrocarbons, and

5
fugitive natural gas (methane), can escape and mix with nitrogen oxides (NOx) from the exhaust of
diesel-fueled, mobile, and stationary equipment, to produce ground-level ozone (CH2MHILL 2007;
Colorado Department of Public Health and Environment [CDPHE] 2007; URS 2008; U.S. Congress,
Office of Technology Assessment 1989). One highly reactive molecule of ground level ozone can
burn the deep alveolar tissue in the lungs, causing it to age prematurely. Chronic exposure can lead to
asthma, chronic obstructive pulmonary diseases (COPD), and is particularly damaging to children,
active young adults who spend time outdoors, and the aged (Islam et al. 2007; Tager et al. 2005;
Triche et al. 2006). Ozone combined with particulate matter less than 2.5 microns produces smog
(haze) which has been demonstrated to be harmful to humans as measured by emergency room
admissions during periods of elevation (Peng et al 2009). Gas field ozone has created a previously
unrecognized air pollution problem in rural areas, similar to that found in large urban areas, and can
spread up to 200 miles beyond the immediate region where gas is being produced (U.S. Congress,
Office of Technology Assessment 1989; Roberts 2008). Ozone not only causes irreversible damage
to the lungs, it is similarly damaging to conifers, aspen, forage, alfalfa, and other crops commonly
grown in the western U.S. (Booker, et al. 2009; Reich 1987; U.S. Congress, Office of Technology
Assessment 1989). Adding to this air pollution is the dust created by fleets of diesel trucks working
around the clock hauling the constantly accumulating condensate and produced water to large waste
facility evaporation pits on unpaved roads. Trucks are also used to haul the millions of gallons of
water from the source to the well pad.
PROJECT DESIGN
The following project grew from a 2004 request by OGAP (Oil and Gas Accountability
Project) to TEDX (The Endocrine Disruption Exchange) to explore the potential health effects of
chemicals used during drilling, fracking, processing, and delivery of natural gas. OGAP, a
project of Earthworks, is a national non-profit organization established in 1999 to watchdog the
oil and natural gas industry. TEDX is a non-profit organization dedicated to compiling and
disseminating technical information on chemicals that affect health and the environment.
Data Sources
In order to find out what chemicals were being used to extract natural gas, we took advantage
of the information on the Material Safety Data Sheets (MSDSs) that accompany each product used
during natural gas operations. MSDSs detailing specific products in use were provided by multiple

6
sources including the BLM, U.S. Forest Service, state departments, and the natural gas industry.
MSDSs are designed to inform those who handle, ship, and use products that contain dangerous
chemicals. They provide information about the physical and chemical characteristics of the chemicals
in a product, and the immediate and chronic health effects, in order to prevent injury while working
with the products. They are also designed to inform emergency response crews in case of accidents
or spills. In addition to the MSDSs, we also used State Tier II Reports that must be filed by storage
facilities under EPCRA. This relatively new Act sets a minimum amount above which a product that
contains a hazardous substance in a storage facility has to be reported. We also supplemented our
analysis with product information from disclosures in Environmental Impact Statements,
Environmental Assessment Statements, and accident and spill reports. At first we looked only at
what was taking place in Colorado and over the course of several years we acquired information
from Wyoming, New Mexico, Texas, Washington, Montana, Pennsylvania, and New York. The list
of products and chemicals quickly grew, making it apparent that hundreds of different products
serving many purposes were being used in natural gas operations across the country. The number of
chemical products manufacturers has also grown, making this a highly competitive industry.
It should be clear that our list of products is not complete, but represents only products and
chemicals that we were able to identify, through a variety of sources, as being used by industry
during natural gas operations. For most products, we cannot definitively say whether they were used
during drilling or during fracking. However, an accidental blow-out of the Crosby well in Wyoming
provided a unique opportunity to analyze the chemicals used during drilling, as fracking had not yet
begun on that well. When the blow-out occurred, methane and other gases, petroleum condensates,
and drilling fluids (muds) were released from fissures in the ground adjacent to the well. During the
58 hours the eruption took place, 25,000 square feet of soil surface in the area were contaminated.
The driller released copies of the MSDSs for the products used during the blow-out and later we
found the names of several more products from remedial action work plans to clean up the site
(Terracon 2007).
On another occasion we were provided data from a 2007 New Mexico study, sponsored by
19 oil and gas companies and conducted by a third party consultant and analytical laboratory. This
gave us the opportunity to explore the health effects of chemicals in samples of pit solids drawn from
six evaporation pits where gas operations were ceasing.

7
Data limitations
MSDSs and Tier II reports are fraught with gaps in information about the formulation of the
products. The U.S. Occupational Safety and Health Administration (OSHA) provides only general
guidelines for the format and content of MSDSs. The manufacturers of the products are left to
determine what information is revealed on their MSDSs. The forms are not submitted to OSHA for
review unless they are part of an inspection under the Hazard Communication Standard (U.S.
Department of Labor 1998). Some MSDSs report little to no information about the chemical
composition of a product. Those MSDSs that do may only report a fraction of the total composition,
sometimes less than 0.1%. Some MSDSs provide only a general description of the content, such as
“plasticizer”, “polymer”, while others describe the ingredients as “proprietary” or just a chemical
class. Under the present regulatory system all of the above “identifiers” are permissible.
Consequently, it is not surprising that a study by the U.S. General Accounting Office (1991) revealed
that MSDSs could easily be inaccurate and incomplete.
Tier II reports can be similarly uninformative, as reporting requirements vary from state to
state, county to county, and company to company. Some Tier II forms include only a functional
category name (e.g. “weight materials” or “biocides”) with no product name. The percent of the total
composition of the product is rarely reported on these forms.
The most critical limiting factor in our research was that Chemical Abstract Service (CAS)
numbers were often not provided on MSDSs. The American Chemical Society has established the
CAS number system to identify unique chemical substances. A single substance can have many
different names, but only one CAS number. CAS numbers identify substances that may be a single
chemical, an isomer of a chemical, a mixture of isomers, polymers, biological sequences, or a
mixture of related chemicals. For purposes of accuracy, our research into the health effects of
chemicals used in natural gas operations was restricted to only chemicals for which a CAS number
was available.
Health Effects
Information on the health effects associated with identified chemicals was obtained from
MSDSs, as well as government toxic chemical databases such as TOXNET and the Hazardous
Substances Database, and through literature searches of biomedical studies. Information available
for some chemicals is limited due to lack of access to studies performed on the toxicity of the
8
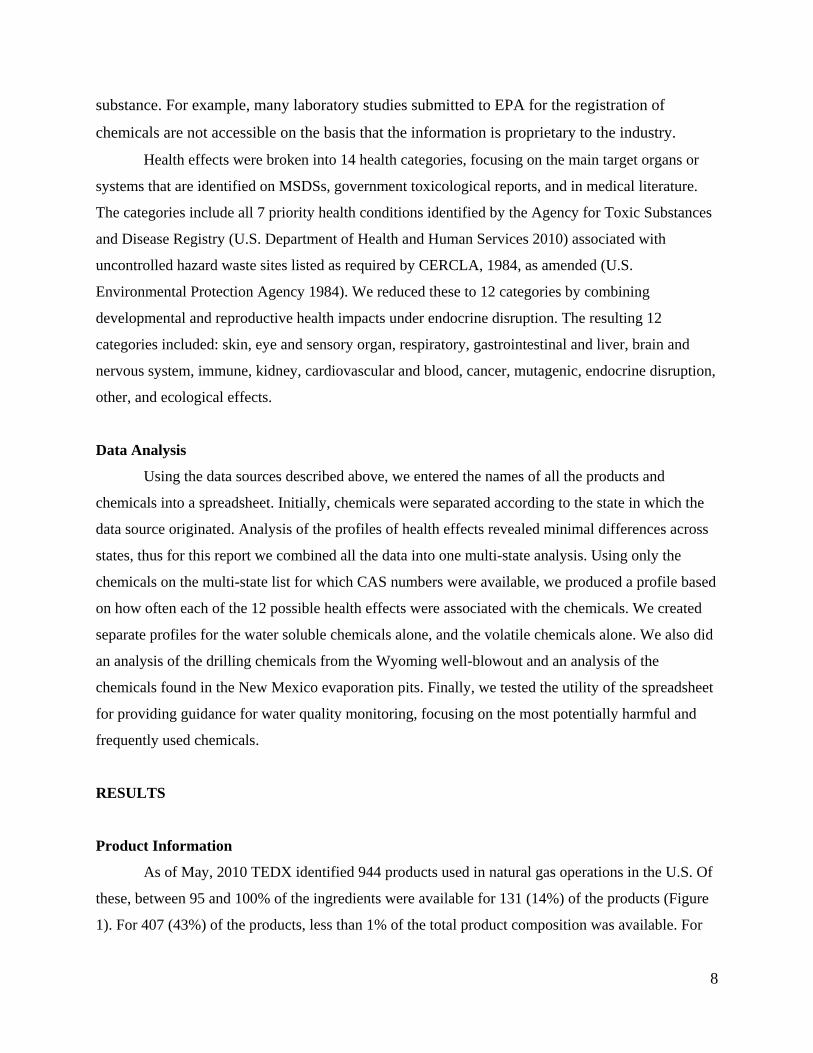
substance. For example, many laboratory studies submitted to EPA for the registration of
chemicals are not accessible on the basis that the information is proprietary to the industry.
Health effects were broken into 14 health categories, focusing on the main target organs or
systems that are identified on MSDSs, government toxicological reports, and in medical literature.
The categories include all 7 priority health conditions identified by the Agency for Toxic Substances
and Disease Registry (U.S. Department of Health and Human Services 2010) associated with
uncontrolled hazard waste sites listed as required by CERCLA, 1984, as amended (U.S.
Environmental Protection Agency 1984). We reduced these to 12 categories by combining
developmental and reproductive health impacts under endocrine disruption. The resulting 12
categories included: skin, eye and sensory organ, respiratory, gastrointestinal and liver, brain and
nervous system, immune, kidney, cardiovascular and blood, cancer, mutagenic, endocrine disruption,
other, and ecological effects.
Data Analysis
Using the data sources described above, we entered the names of all the products and
chemicals into a spreadsheet. Initially, chemicals were separated according to the state in which the
data source originated. Analysis of the profiles of health effects revealed minimal differences across
states, thus for this report we combined all the data into one multi-state analysis. Using only the
chemicals on the multi-state list for which CAS numbers were available, we produced a profile based
on how often each of the 12 possible health effects were associated with the chemicals. We created
separate profiles for the water soluble chemicals alone, and the volatile chemicals alone. We also did
an analysis of the drilling chemicals from the Wyoming well-blowout and an analysis of the
chemicals found in the New Mexico evaporation pits. Finally, we tested the utility of the spreadsheet
for providing guidance for water quality monitoring, focusing on the most potentially harmful and
frequently used chemicals.
RESULTS
Product Information
As of May, 2010 TEDX identified 944 products used in natural gas operations in the U.S. Of
these, between 95 and 100% of the ingredients were available for 131 (14%) of the products (Figure
1). For 407 (43%) of the products, less than 1% of the total product composition was available. For
9
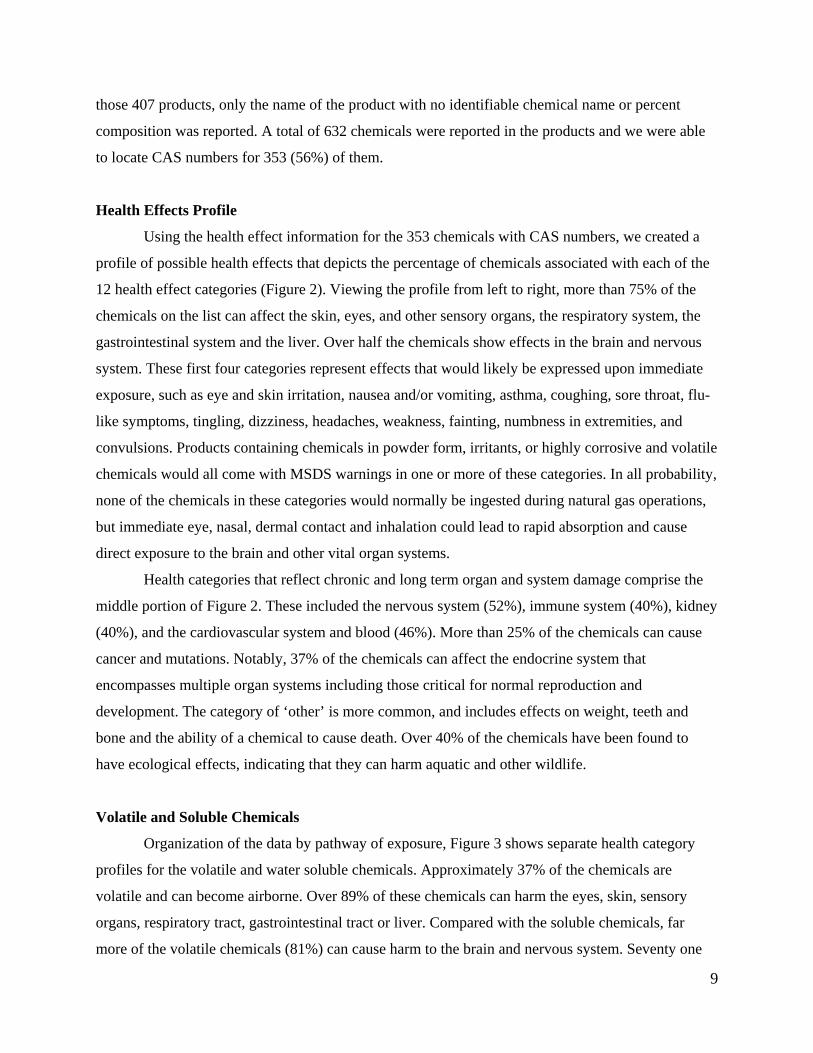
those 407 products, only the name of the product with no identifiable chemical name or percent
composition was reported. A total of 632 chemicals were reported in the products and we were able
to locate CAS numbers for 353 (56%) of them.
Health Effects Profile
Using the health effect information for the 353 chemicals with CAS numbers, we created a
profile of possible health effects that depicts the percentage of chemicals associated with each of the
12 health effect categories (Figure 2). Viewing the profile from left to right, more than 75% of the
chemicals on the list can affect the skin, eyes, and other sensory organs, the respiratory system, the
gastrointestinal system and the liver. Over half the chemicals show effects in the brain and nervous
system. These first four categories represent effects that would likely be expressed upon immediate
exposure, such as eye and skin irritation, nausea and/or vomiting, asthma, coughing, sore throat, flu-
like symptoms, tingling, dizziness, headaches, weakness, fainting, numbness in extremities, and
convulsions. Products containing chemicals in powder form, irritants, or highly corrosive and volatile
chemicals would all come with MSDS warnings in one or more of these categories. In all probability,
none of the chemicals in these categories would normally be ingested during natural gas operations,
but immediate eye, nasal, dermal contact and inhalation could lead to rapid absorption and cause
direct exposure to the brain and other vital organ systems.
Health categories that reflect chronic and long term organ and system damage comprise the
middle portion of Figure 2. These included the nervous system (52%), immune system (40%), kidney
(40%), and the cardiovascular system and blood (46%). More than 25% of the chemicals can cause
cancer and mutations. Notably, 37% of the chemicals can affect the endocrine system that
encompasses multiple organ systems including those critical for normal reproduction and
development. The category of ‘other’ is more common, and includes effects on weight, teeth and
bone and the ability of a chemical to cause death. Over 40% of the chemicals have been found to
have ecological effects, indicating that they can harm aquatic and other wildlife.
Volatile and Soluble Chemicals
Organization of the data by pathway of exposure, Figure 3 shows separate health category
profiles for the volatile and water soluble chemicals. Approximately 37% of the chemicals are
volatile and can become airborne. Over 89% of these chemicals can harm the eyes, skin, sensory
organs, respiratory tract, gastrointestinal tract or liver. Compared with the soluble chemicals, far
more of the volatile chemicals (81%) can cause harm to the brain and nervous system. Seventy one

10
percent of the volatile chemicals can harm the cardiovascular system and blood, and 66% can harm
the kidneys. Overall, the volatile chemicals produce a profile that displays a higher frequency of
health effects than the water soluble chemicals. In addition, because they vaporize, not only can they
be inhaled, but also ingested and absorbed through the skin, increasing the chance of exposures.
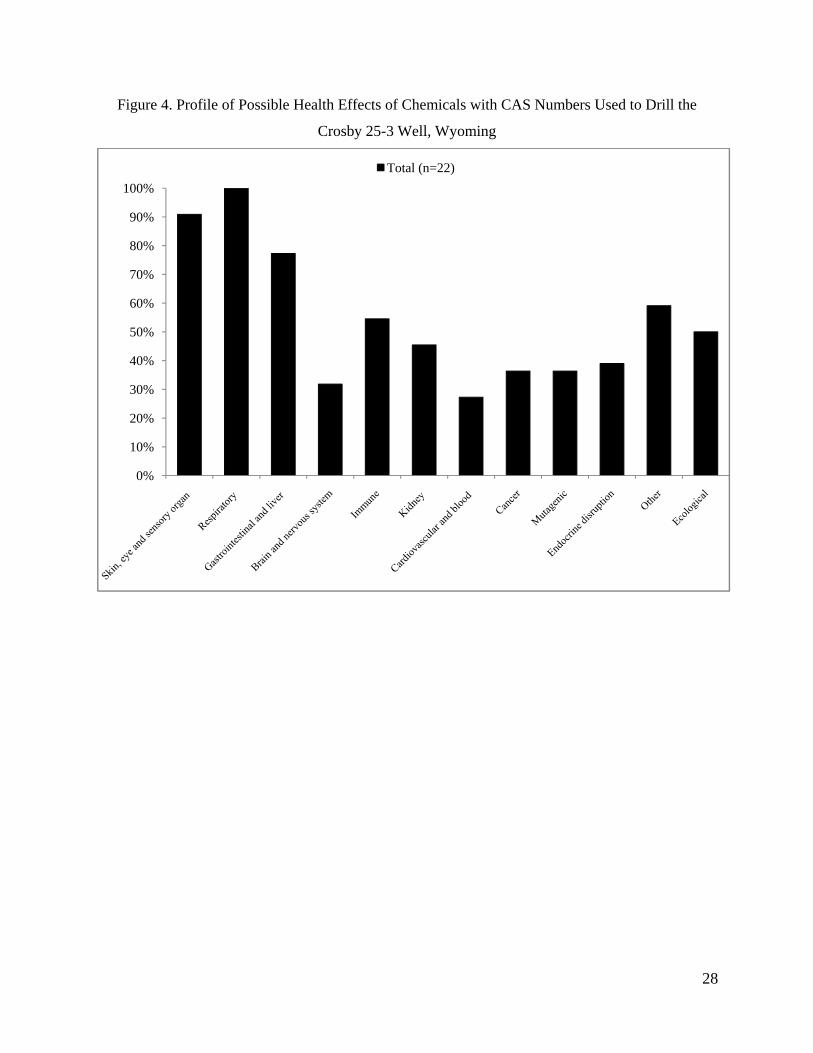
Drilling Chemicals
Figure 4 shows the profile for the 22 drilling chemicals identified from the well blow-out in
Wyoming. The profile was unique in the following ways. All of the chemicals used in the drilling
fluids were associated with respiratory effects. Nearly 60% were associated with ‘other’ effects, a
category that includes outright mortality as an end point. A relatively high percentage of chemicals
that affect the immune system were used.
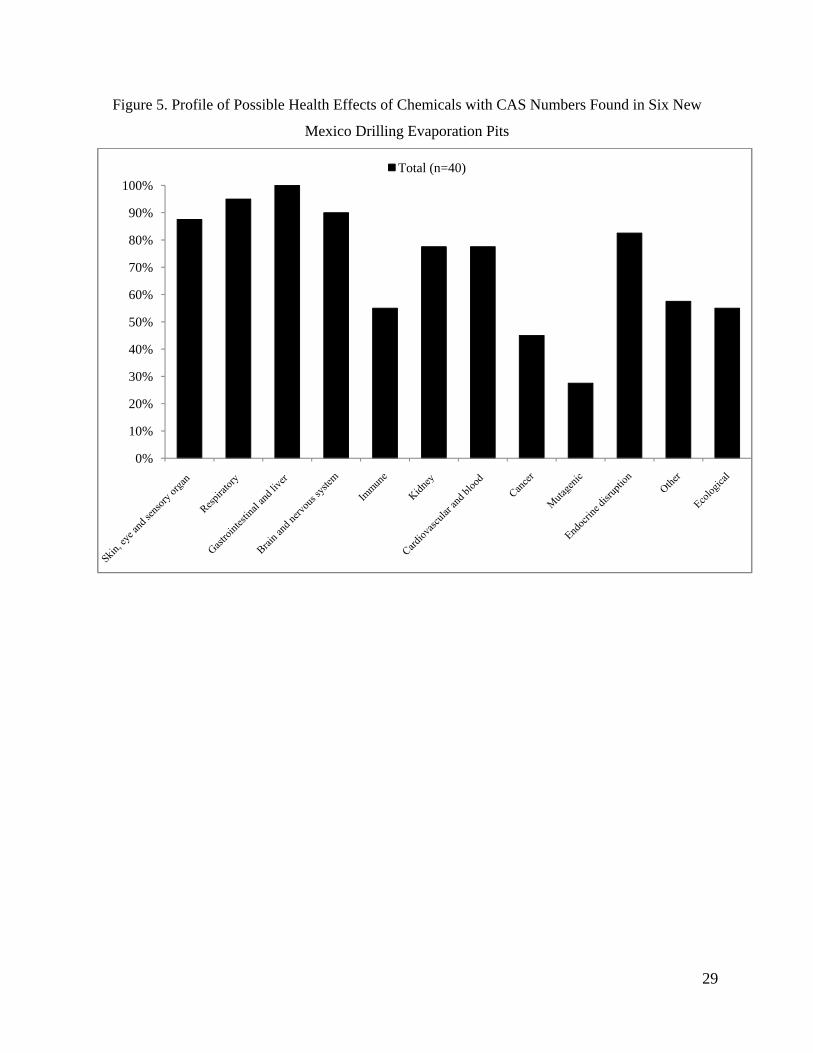
Evaporation Pit Chemicals
Figure 5 shows the health effects of the 40 chemicals and metals reported in the New Mexico
evaporation pits. These chemicals produced a health profile even more hazardous than the pattern
produced by the drilling and fracking chemicals. Upon further investigation, we discovered that 98%
of the 40 chemicals found in the pits are listed on EPA’s 2005 CERCLA (Superfund) list and 73%
are on the 2006 EPCRA List of Lists of reportable toxic chemicals. Of the nine chemicals found to be
over the New Mexico state limits, all are on the CERCLA list and all but one are on the EPCRA List
of Lists.
Analyses for water quality monitoring
For the purpose of water quality monitoring guidance, we analyzed the data according to the
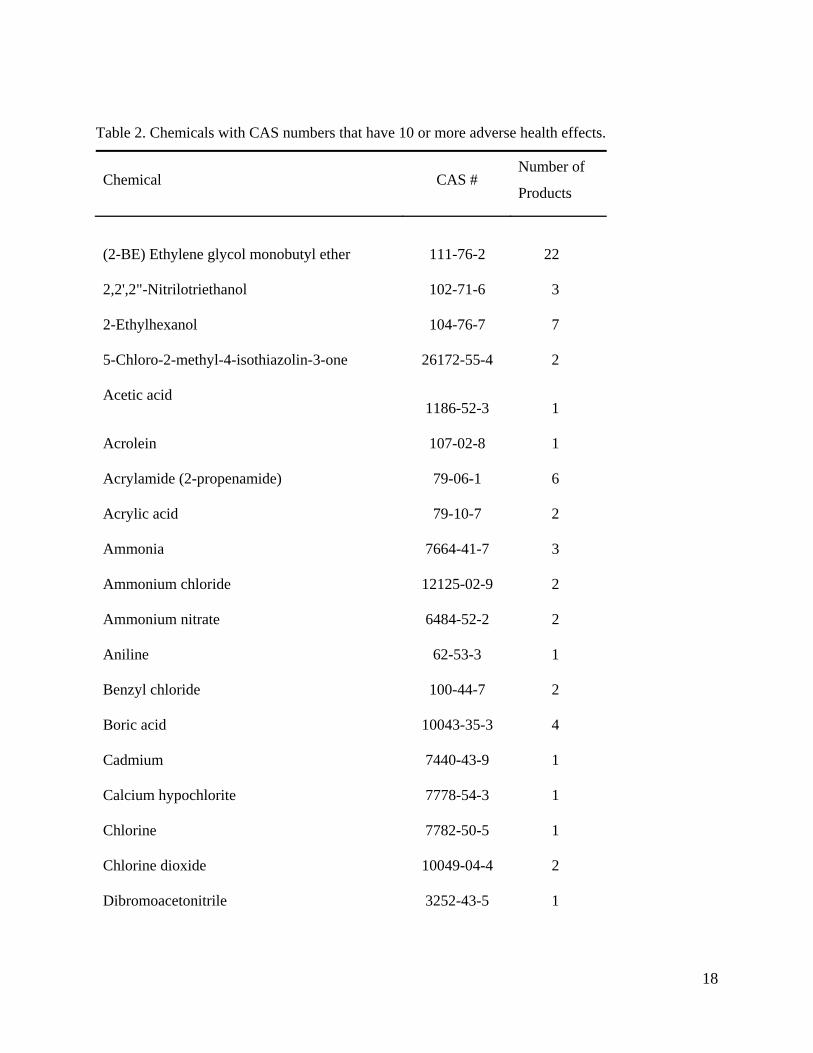
most potentially harmful chemicals and the most frequently used chemicals. Table 2 provides a list of
the most egregious chemicals, those with 10 or more health effects. Roughly half of these chemicals
are used in only one product on our list, making it impractical and a waste of time and money to try
to test water for the most harmful chemicals. A more practical approach would be to test for the most
frequently used chemicals. Although we do not know how often each product is used, we assume that
the more products that contain a given chemical, the more likely it is to be detected in a water
sample. Table 3 shows all the chemicals on our list that were found in at least seven different
products. Many of these chemicals are relatively harmless. The most frequently cited chemical was
crystalline silica (quartz) which was reported in 125 different products. Note that petroleum
distillates and a variety of alcohols are found in numerous products, as are several forms of

11
potassium, which is a relatively easy and inexpensive chemical to detect in water. This list may prove
useful in devising a water monitoring program. Regardless of how many health effects a chemical
has, elevated levels of frequently used chemicals found in a water source could provide evidence of
communication between natural gas operations and water resources.
DISCUSSION
Industry representatives have said there is little cause for concern because of the low
concentrations of chemicals used in their operations. Nonetheless, pathways that could deliver
chemicals in toxic concentrations at less than one part-per-million are not well studied and many of
the chemicals on the list should not be ingested at any concentration. Numerous systems, most
notably the endocrine system, are extremely sensitive to very low levels of chemicals, in parts-per-
billion or less. The damage may not be evident at the time of exposure but can have unpredictable
delayed, life-long effects on the individual and/or their offspring. Effects of this nature would be
much harder to identify than obvious impacts such as skin and eye irritation that occur immediately
upon contact. Health impairments could remain hidden for decades and span generations. Specific
outcomes could include reduced sperm production, infertility, hormone imbalances, and other sex-
related disorders. Further compounding this concern is the potential for the shared toxic action of
these contaminants, especially those affecting the same and/or multiple organ systems.
It was difficult to arrive at a ‘short list’ of chemicals that would be informative for water
quality monitoring because of the vast array of products constantly being developed, and the wide
selection of chemicals used in those products. We can, however, provide some guidance by pointing
out four types of chemicals that are used in a relatively high number of products. These include (1)
the silicas, which appear frequently as product components; (2) potassium based chemicals, which
are also found in numerous products, although with relatively low toxicity; (3) petroleum derived
products, which take on many different forms (including some without CAS numbers), and some of
which are toxic at low concentrations and might be detected with diesel or gasoline range organics
tests; and (4) the alcohols for which new detection technology is being developed, and because they
are among the chemicals with the most health effects.
Detection of increasing or elevated concentrations of these chemicals near gas operations
could indicate that communication between natural gas activities and a water resource such as a
domestic well, creek, pond, wetland, etc is occurring. If a longitudinal monitoring program were to
reveal any increase in concentration in one of these target groups, even if the concentrations were
well below any water quality standards, it should trigger more testing immediately.

12
For many years, drillers have insisted that they do not use toxic chemicals to drill for gas,
only guar gum, mud, and sand. While much attention is being given to chemicals used during
fracking, our findings indicate that drilling chemicals can be equally, if not more dangerous. What
we have learned about the chemicals used in the Crosby well blowout provides insight into why
citizens living nearby suffered severe respiratory distress, nausea and vomiting and had to be
evacuated from their homes for several days. It might also shed light on why other individuals living
near gas operations have experienced similar symptoms during the gas drilling phase (prior to
fracking).
From the first day the drill bit is inserted into the ground until the well is completed, toxic
materials are introduced into the borehole and returned to the surface along with produced water and
other extraction liquids. In the western U.S. it has been common practice to hold these liquids in
open evaporation pits until the wells are shut down, which could be up to 25 years. These pits have
rarely been examined to ascertain their chemical contents outside of some limited parameters
(primarily metals, chlorides, and radioactive materials). Our data reveal that extremely toxic
chemicals are found in evaporation pits and indeed, these and other similar sites may need to be
designated for Superfund cleanup. In the eastern U.S., and increasingly in the west, these chemicals
are being re-injected underground, creating yet another potential source of extremely toxic chemical
contamination. In other words, what ends up in evaporation pits in the West, will in other parts of the
country be injected underground.
RECOMMENDATIONS
TEDX has collected the names of nearly a thousand products used in natural gas operations
in the U.S. We have no idea how many more products are in use. We have health data on only a
small percentage of the chemicals in use because CAS numbers are often not provided on MSDSs
and without a CAS number it is impossible to search for health data. Working under the assumption
that our results underestimate the consequences of the health impacts to the labor force, residents
living in close proximity to the wells, and those dependent upon potable and agricultural water that
could be affected by natural gas operations, we make the following recommendations:
(1) Product labels and/or MSDSs must list the complete formulation of each product, including the
precise name and CAS number and amount of every chemical, as well as the composition of the
vehicle used to fill the product container. To prevent serious injury and mortality the products used
during natural gas operations should be exempt from confidentiality.

13
(2) If an ingredient does not have a CAS number it must be clearly defined, leaving no doubt about
its possible health impact(s).
3) Records should be kept for each drilling and fracking operation, listing the total volume of fluid
injected, the amount of each product used, the depth at which the products were introduced, and the
volume of fluid recovered.
4) The volume and concentration of all liquids and solids removed from the work sites should be
made available to the public. Without this information the full health and environmental hazards
posed by natural gas production cannot be predicted.
(5) Air quality monitoring for individual VOCs as well as ozone must become standard procedure in
any region where natural gas activity is taking place and must commence prior to initiation of
operations to establish baseline levels. Estimating tonnage of VOCs and NOx released and ignoring
ozone should no longer be the practice.
(6) Comprehensive water monitoring programs should be established in every gas play across the
U.S. both prior to and after gas production commences, that include new chemical species indicators
based on toxicity and mobility in the environment, and pollution of sub-surface and above-surface
domestic and agricultural water resources, and all domestically-used aquifers and underground
sources of drinking water.
(7) We recommend the development of labeled isotopic fingerprints of the chlorinated compounds in
products used to drill and fracture. Each manufacturer would have its own fingerprint. A plot of this
isotopic data found down gradient of a hydraulically fractured well would aid a state or federal
regulator in identifying the contamination source.
(8) Given the general consistency of reported adverse health effects by citizens and laborers across
many gas plays, public health authorities should establish an epidemiological monitoring program
that merges at the state and national level in order to increase power and be able to reach conclusions
early on. The design of the study should include environmental monitoring of air and water as well as
any health changes in those living and working in regions of natural gas operations. The health
monitoring should be able to detect early trends in parameters, such as asthma, hypertension,
chemical sensitization, chronic skin and eye irritation, and neurological alterations, to mention a few.
(9) As underground injection of waste is becoming the most frequent choice for waste disposal, rigid
accounting of the date, volume, and source of all materials, and the exact location in the geological
formation(s) in which it is injected should be become a part of permanent government records that
will be publicly available for future generations.

14
(10) Before a permit is issued to drill for natural gas, complete waste management plans should be
reviewed and approved and become part of the permit.
(11) The injection of hydraulic fracturing fluids should be regulated under the Safe Drinking Water
Act. This is needed to assure mechanical integrity of the injection wells and isolation of the injection
zone from underground sources of drinking water.

15
References
B.C. Oil and Gas Commission. 2001. Fracturing (Fracing) and disposal of fluids. Information Sheet
15. Available at:
http://www.ogc.gov.bc.ca/documents/publications/Fact%20Sheets/15_Fracturing%20(Fracin
g)%20and%20Disposal%20of%20Fluids.pdf
Booker F, Muntifering R, McGrath M, Burkey K, Decoteau D, Fiscus E, et al. 2009. The ozone
component of global change: potential effects on agricultural and horticultural plant yield,
product quality and interactions with invasive species. Journal of Integrative Plant Biology
51:337-351.
CH2MHILL. 2007. Review of oil and gas operation emissions and control options. Final report.
Prepared for: Colorado Department of Public Health and Environment Air Pollution Control
Division, Denver, CO.
Colorado Department of Public Health and Environment. 2007. Pit monitoring data for air quality.
Denver, CO.
Colorado Oil and Gas Conservation Commission. Staff Report January 11, 2010. Available at:
http://cogcc.state.co.us/
Islam T, Gauderman WJ, Berhane K, McConnell R, Avol E, Peters JM, et al. 2007. Relationship
between air pollution, lung function and asthma in adolescents. Thorax 62:957-963.
Oil and Gas Accountability Project. 2007. The oil and gas industry's exclusions and exemptions to
major federal environmental statutes. Available at:
http://www.earthworksaction.org/pubs/PetroleumExemptions1c.pdf
Peng RD, Bell ML, Geyh AS, McDermott A, Zeger SL, Samet JM, et al. 2009. Emergency
admissions for cardiovascular and respiratory diseases and the chemical composition of fine
particle air pollution. Environ Health Perspect 117:957-63.
Reich PB. 1987. Quantifying plant response to ozone: a unifying theory. Tree Physiol 3:63-91.
Roberts RE (US EPA Region 8). 2008. Revised draft supplemental environmental impact statement
for the Pinedale Anticline oil and gas exploration and development project, Sublette County,
Wyoming. CEQ #20070542, 14 February 2008 [Final EPA comments]. Letter to: Mr. Robert
A. Bennett, State Director, Bureau of Land Management, Wyoming State Office, 5353
Yellowstone Road, Cheyenne, Wyoming 82009.
Tager IB, Balmes J, Lurmann F, Ngo L, Alcorn S, Kunzli N. 2005. Chronic exposure to ambient
ozone and lung function in young adults. Epidemiology 16:751-759.
Terracon Consulting Engineers & Scientists. 2007. Remedial investigation work plan. Crosby 25-3

16
natural gas well release, Road 1AB, Clark, Park County, Wyoming. Final draft. Project No.
26067064.
Triche EW, Gent JF, Holford TR, Belanger K, Bracken MB, Beckett WS, et al. 2006. Low-level
ozone exposure and respiratory symptoms in infants. Environ Health Perspect 114:911-916.
U.S. Congress, Office of Technology Assessment. 1989. Catching Our Breath: Next Steps for
Reducing Urban Ozone. OTA-O-412. Office of Technology Assessment, Washington, DC.
U.S. Department of Health and Human Services, Agency for Toxic Substances and Disease Registry.
2010. Available at: http://www.atsdr.cdc.gov/
U.S. Department of Labor, OSHA. 1998. CPL 02-02-038 - CPL 2-2.38D - Inspection Procedures
for the Hazard Communication Standard. Available at:
http://www.osha.gov/pls/oshaweb/owadisp.show_document?p_table=DIRECTIVES&p_id=1
551#purp.
U.S. General Accounting Office. 1991. OSHA action needed to improve compliance with
Hazard communication standard. GAO/HRD-92-8. Available at:
http://archive.gao.gov/t2pbat7/145328.pdf
U.S. Environmental Protection Agency. 1984. Amendment to National Oil and Hazardous Substance
Contingency Plan; National Priorities List. Federal Register 49:19480-19482.
URS. 2008. Sampling and analysis plan for exploration and production. Pit solids and fluids in
Colorado energy basins. Revision B. Denver, CO.

17
Table 1. Functional categories of hydraulic fracturing chemicals.
Acids
To achieve greater injection ability or penetration and later to dissolve
minerals and clays to reduce clogging, allowing gas to flow to the surface.
Biocides To prevent bacteria that can produce acids that erode pipes and fittings and
break down gellants that ensure that fluid viscosity and proppant transport are
maintained. Biocides can produce hydrogen sulfide (H2S) a very toxic gas
that smells like rotten eggs.
Breakers To allow the breakdown of gellants used to carry the proppant, added near
the end of the fracking sequence to enhance flowback.
Clay stabilizers To create a fluid barrier to prevent mobilization of clays, which can plug
fractures.
Corrosion inhibitors To reduce the potential for rusting in pipes and casings.
Crosslinkers To thicken fluids often with metallic salts in order to increase viscosity and
proppant transport.
Defoamers To reduce foaming after it is no longer needed in order to lower surface
tension and allow trapped gas to escape.
Foamers To increase carrying-capacity while transporting proppants, and decreasing
the overall volume of fluid needed.
Friction reducers To make water slick and minimize the friction created under high pressure
and to increase the rate and efficiency of moving the fracking fluid.
Gellants To increase viscosity and suspend sand during proppant transport.
pH control To maintain the pH at various stages using buffers to ensure maximum
effectiveness of various additives.
Proppants To hold fissures open, allowing gas to flow out of the cracked formation,
usually composed of sand and occasionally glass beads.
Scale control To prevent build up of mineral scale that can block fluid and gas passage
through the pipes.
Surfactants To decrease liquid surface tension and improve fluid passage through pipes in
either direction.
18
Table 2. Chemicals with CAS numbers that have 10 or more adverse health effects.
Chemical CAS # Number of
Products
(2-BE) Ethylene glycol monobutyl ether 111-76-2 22
2,2',2"-Nitrilotriethanol 102-71-6 3
2-Ethylhexanol 104-76-7 7
5-Chloro-2-methyl-4-isothiazolin-3-one 26172-55-4 2
Acetic acid 1186-52-3 1
Acrolein 107-02-8 1
Acrylamide (2-propenamide) 79-06-1 6
Acrylic acid 79-10-7 2
Ammonia 7664-41-7 3
Ammonium chloride 12125-02-9 2
Ammonium nitrate 6484-52-2 2
Aniline 62-53-3 1
Benzyl chloride 100-44-7 2
Boric acid 10043-35-3 4
Cadmium 7440-43-9 1
Calcium hypochlorite 7778-54-3 1
Chlorine 7782-50-5 1
Chlorine dioxide 10049-04-4 2
Dibromoacetonitrile 3252-43-5 1

19
Diesel 2 68476-34-6 19
Diethanolamine 111-42-2 4
Diethylenetriamine 111-40-0 1
Dimethyl formamide 68-12-2 1
Epidian 25068-38-6 1
Ethanol (acetylenic alcohol) 64-17-5 8
Ethyl mercaptan 75-08-1 1
Ethylbenzene 100-41-4 7
Ethylene glycol 107-21-1 17
Ethylene oxide 75-21-8 2
Ferrous sulfate 7720-78-7 1
Formaldehyde 50-00-0 4
Formic acid 64-18-6 8
Fuel oil #2 68476-30-2 9
Glutaraldehyde 111-30-8 11
Glyoxal 107-22-2 2
Hydrodesulfurized kerosene 64742-81-0 1
Hydrogen sulfide 7783-06-4 1
Iron 7439-89-6 3
Isobutyl alcohol (2-methyl-1-propanol) 78-83-1 3
Isopropanol (propan-2-ol) 67-63-0 47
Kerosene 8008-20-6 3
Light naphthenic distillates, hydrotreated 64742-53-6 2
Mercaptoacidic acid 68-11-1 2
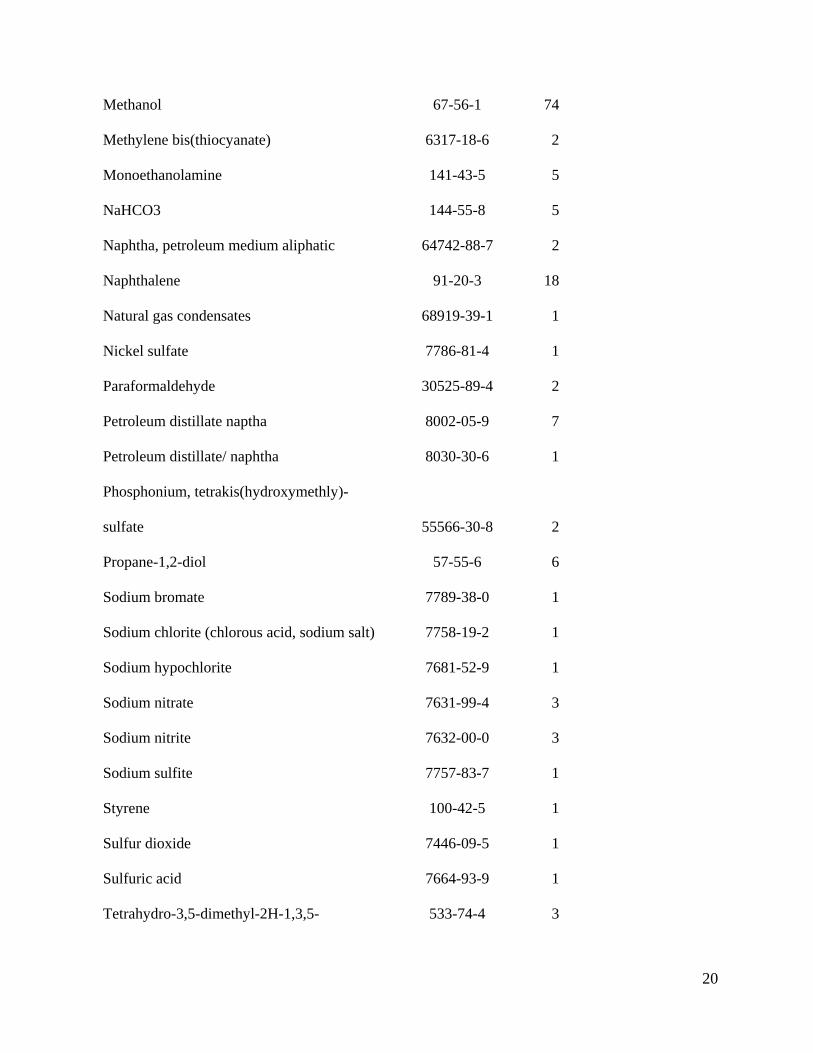
20
Methanol 67-56-1 74
Methylene bis(thiocyanate) 6317-18-6 2
Monoethanolamine 141-43-5 5
NaHCO3 144-55-8 5
Naphtha, petroleum medium aliphatic 64742-88-7 2
Naphthalene 91-20-3 18
Natural gas condensates 68919-39-1 1
Nickel sulfate 7786-81-4 1
Paraformaldehyde 30525-89-4 2
Petroleum distillate naptha 8002-05-9 7
Petroleum distillate/ naphtha 8030-30-6 1
Phosphonium, tetrakis(hydroxymethly)-
sulfate 55566-30-8 2
Propane-1,2-diol 57-55-6 6
Sodium bromate 7789-38-0 1
Sodium chlorite (chlorous acid, sodium salt) 7758-19-2 1
Sodium hypochlorite 7681-52-9 1
Sodium nitrate 7631-99-4 3
Sodium nitrite 7632-00-0 3
Sodium sulfite 7757-83-7 1
Styrene 100-42-5 1
Sulfur dioxide 7446-09-5 1
Sulfuric acid 7664-93-9 1
Tetrahydro-3,5-dimethyl-2H-1,3,5- 533-74-4 3

21
thiadiazine-2-thione (Dazomet)
Titanium dioxide 13463-67-7 2
Tributyl phosphate 126-73-8 1
Triethylene glycol 112-27-6 1
Urea 57-13-6 3
Xylene 1330-20-7 11

22
Table 3. Chemicals with CAS numbers found in the highest number of products
Chemical CAS # Number of
products
Number of
health effects
Crystalline silica, quartz 14808-60-7 125 7
Methanol 67-56-1 74 11
Isopropanol (propan-2-ol) 67-63-0 47 10
Petroleum distillate hydrotreated light 64742-47-8 26 6
(2-BE) Ethylene glycol monobutyl ether 111-76-2 22 11
Bentonite 1302-78-9 20 6
Diesel 2 68476-34-6 19 10
Naphthalene 91-20-3 18 12
Aluminum oxide 1344-28-1 17 3
Ethylene glycol 107-21-1 17 10
Sodium hydroxide 1310-73-2 17 5
Barite (BaSO4) 7727-43-7 15 5
Heavy aromatic petroleum naphtha (aromatic
solvent) 64742-94-5 15 5
Crystalline silica, cristobalite 14464-46-1 14 5
Mica 12001-26-2 14 3
Sodium chloride 7647-14-5 14 9

23
Crystalline silica, tridymite 15468-32-3 13 3
Hydrochloric acid (HCl) 7647-01-0 13 7
Glutaraldehyde 111-30-8 11 11
Xylene 1330-20-7 11 10
Guar gum 9000-30-0 10 3
Iron oxide (Fe203, diiron trioxide) 1309-37-1 10 5
Potassium chloride 7447-40-7 10 8
Potassium hydroxide 1310-58-3 10 7
Xanthan gum 11138-66-2 10 4
Fuel oil #2 68476-30-2 9 11
Hydrotreated heavy petroleum naphtha 64742-48-9 9 8
Limestone (calcium carbonate) 1317-65-3 9 2
Polyacrylamide/polyacrylate copolymer 25085-02-3 9 3
Sodium carboxymethylcellulose (polyanionic
cellulose) 9004-32-4 9 5
Calcium hydroxide 1305-62-0 8 8
Crystalline silica (silicon dioxide) 7631-86-9 8 4
Ethanol (acetylenic alcohol) 64-17-5 8 12

24
Formic acid 64-18-6 8 11
Graphite 7782-42-5 8 4
2-Ethylhexanol 104-76-7 7 11
Acetic acid 64-19-7 7 9
Asphaltite (gilsonite, hydrocarbon black solid) 12002-43-6 7 4
Butanol (n-butyl alcohol, butan-1-ol, 1-butanol) 71-36-3 7 8
Calcium carbonate (sized) 471-34-1 7 6
Calcium chloride 10043-52-4 7 8
Ethoxylated nonylphenol 9016-45-9 7 6
Ethylbenzene 100-41-4 7 11
Petroleum distillate naptha 8002-05-9 7 12
Propargyl alcohol (prop-2-yn-1-ol) 107-19-7 7 9
Tetramethylammonium chloride 75-57-0 7 8

25
Figure 1. Percent of Composition Disclosed for 944 Products Used in Natural Gas Operations
14%
30%
13%
43%
greater than 95% 51-95% 1-50% less than 1%

26
Figure 2. Profile of Possible Health Effects of Chemicals with CAS Numbers used in Natural Gas
Operations
0%
10%
20%
30%
40%
50%
60%
70%
80%
90%
100%Total (n=353)

27
Figure 3. Profile of Possible Health Effects of Soluble and Volatile Chemicals with CAS Numbers
Used in Natural Gas Operations
0%
10%
20%
30%
40%
50%
60%
70%
80%
90%
100%
Solubles (n=206) Volatiles (n=126)
28
Figure 4. Profile of Possible Health Effects of Chemicals with CAS Numbers Used to Drill the
Crosby 25-3 Well, Wyoming
0%
10%
20%
30%
40%
50%
60%
70%
80%
90%
100%Total (n=22)
29
Figure 5. Profile of Possible Health Effects of Chemicals with CAS Numbers Found in Six New
Mexico Drilling Evaporation Pits
0%
10%
20%
30%
40%
50%
60%
70%
80%
90%
100%Total (n=40)