Embed Size (px)
Citation preview
S1
Supporting Information
Polyhedral oligosilsesquioxane tethered perylene diimide for application
in optical limiting and rapid detection of fluoride ions
Tian Gao,a Wen-Fa Zhou,b Yang Zhao,a Lei Shen,b Wen-Ying Chang,c Rodney-Kudzai Musendo,a Er-Qiang Chen,c Ying-Lin Song*b and Xiang-Kui Ren*a
aSchool of Chemical Engineering and Technology, Tianjin University, Tianjin 300350, P. R. China.bSchool of Physical Science and Technology, Soochow University, Suzhou 215006, P. R. China.cBeijing National Laboratory for Molecular Sciences, College of Chemistry, Peking University, Beijing 100871, P. R. China.
Section 1. Materials and Methods
Perylene-3,4,9,10-tetracarboxylic acid dianhydride (PDA, 98%) was purchased from
Beijing HWRK company, and p-Aminopropylisobutyl POSS (AM0292, ≥97%) was
purchased from Hybrid Plastics. All the other chemicals were purchased from Jiangtian
Chemical Reagents Co. Ltd. and directly used without further purification.
1H, 13C and 29Si NMR spectra of the samples were recorded with a Bruker Avance
400 spectrometer at 298 K using deuterated chloroform (CDCl3) as the solvent and
tetramethylsilane (TMS) as the internal standard. High resolution mass spectra (HRMS)
were determined on an IonSpec 4.7 Tesla Fourier Transform Mass Spectrometer. Fourier
transform infrared spectroscopy (FT-IR) was performed with a Perkin-Elmer FTIR-100
spectrometer. UV/Vis absorption spectra were recorded on a Mapada UV-3200
spectrophotometer. Fluorescence spectra were obtained on a Hitachi FL-2500
luminescence spectrometer.
In order to investigate the nonlinear optical response of the two compounds,
femtoseconds Z-scan experiments (light source: OPA, Light Conversion ORPHEUS, 190
fs, 20 Hz) at 600 nm were conducted. The incident pulse laser was divided two parts, one
Electronic Supplementary Material (ESI) for Chemical Communications.This journal is © The Royal Society of Chemistry 2019
S2
is used to monitor the energy fluctuation of the incident pulse laser and the other is focused
by a focusing lens. The sample was placed at the precision mobile platform near the focal
plane and moved along the direction of Z (the direction of laser propagation). Finally, two
energy probes were used to record the laser energy variation.
Section 2. Synthesis
O OO
OOO
N OO
ONOR
R
a)
N OO
ONOR
R
N OO
ONOR
R
NO2
OSi SiOSiOSi
OOSi
OSiO O Si
OSiOO
OR=
NH2
N OO
ONOR
R
NH
b) c)
POSS-AMPDI
O
POSS-NH2PDI
POSS-PDI POSS-NO2PDIPDA
d)
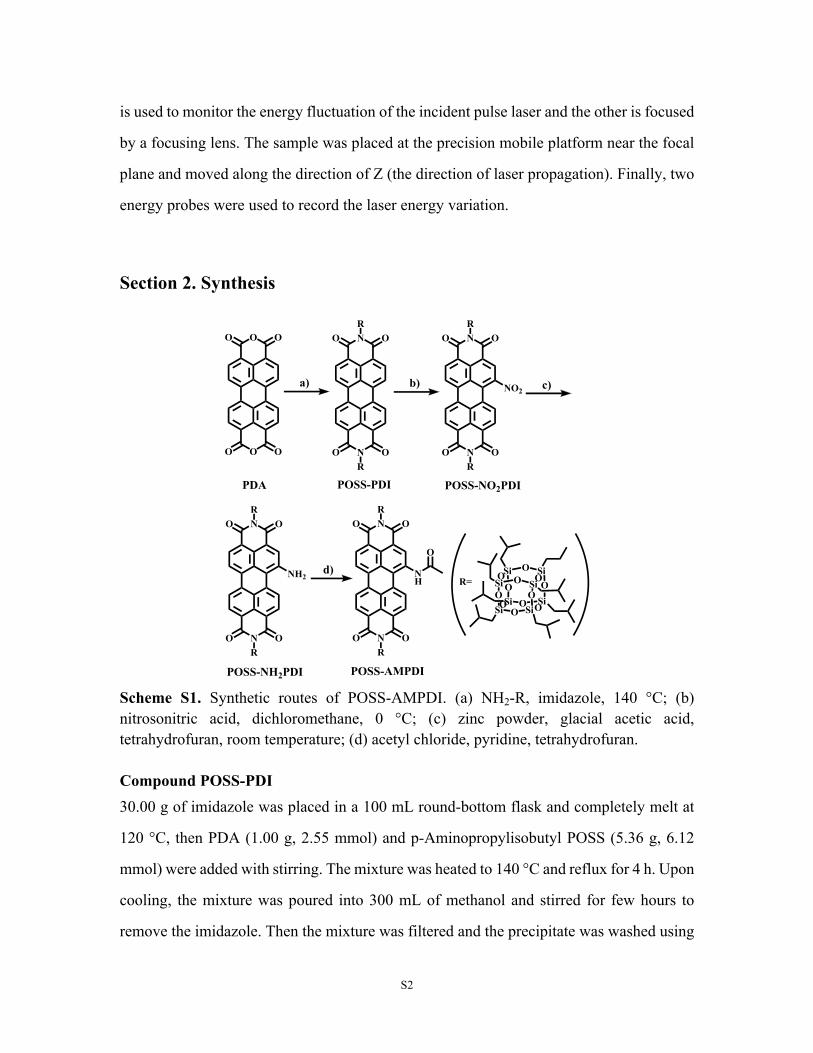
Scheme S1. Synthetic routes of POSS-AMPDI. (a) NH2-R, imidazole, 140 °C; (b) nitrosonitric acid, dichloromethane, 0 °C; (c) zinc powder, glacial acetic acid, tetrahydrofuran, room temperature; (d) acetyl chloride, pyridine, tetrahydrofuran.
Compound POSS-PDI30.00 g of imidazole was placed in a 100 mL round-bottom flask and completely melt at
120 °C, then PDA (1.00 g, 2.55 mmol) and p-Aminopropylisobutyl POSS (5.36 g, 6.12
mmol) were added with stirring. The mixture was heated to 140 °C and reflux for 4 h. Upon
cooling, the mixture was poured into 300 mL of methanol and stirred for few hours to
remove the imidazole. Then the mixture was filtered and the precipitate was washed using
S3
methanol. After dried at 50 °C under vacuum oven, the crude product was purified by
column chromatography on silica gel (dichloromethane/ethyl acetate = 1:6, V/V) to give
an orange solid (95%). 1H NMR (400 MHz, CDCl3) δ (TMS, ppm): 8.67 (s, 4H, ArH), 8.59
(s, 4H, ArH), 4.21 (t, 4H, -N-CH2-), 1.85 (m, 18H, -CH- and -CH2-), 0.94 (m, 84H, -CH3),
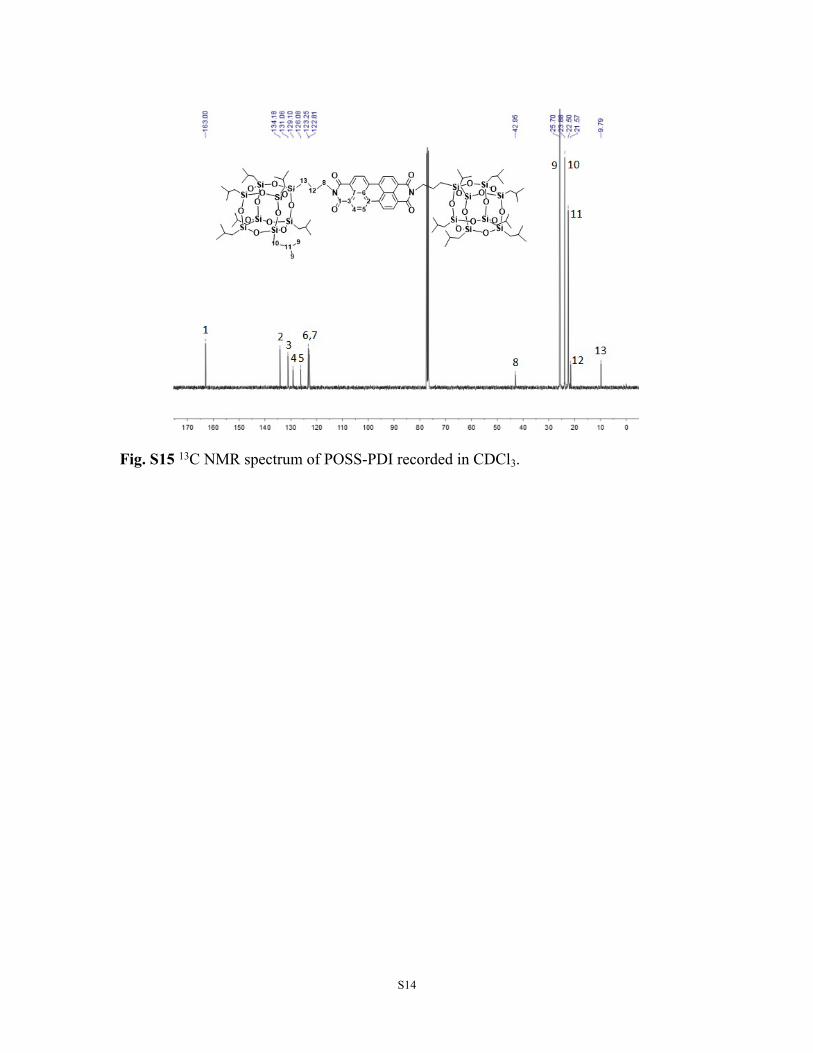
0.72 (t, 4H, -CH2-), 0.59 (m, 28H, -CH2-). 13C NMR (400 MHz, CDCl3) δ (TMS, ppm):
163.00, 134.18, 131.06, 129.10, 126.08, 123.25, 122.81, 42.95, 25.70, 23.88, 22.50, 21.57,
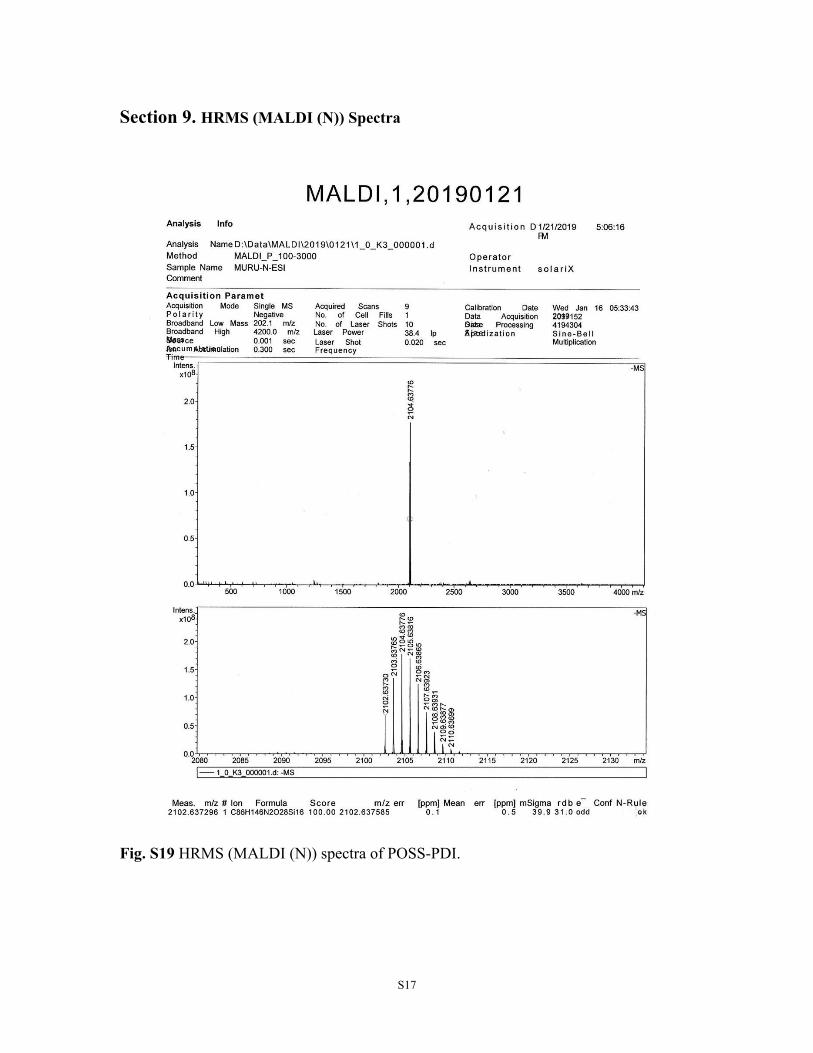
9.79. HRMS (MALDI (N), 100%) m/z calcd for C86H146N2O28Si16: 2102.6375, found
2102.6372.
Compound POSS-NO2PDIPOSS-PDI (1.00 g, 0.48 mmol), dichloromethane (40 mL) were placed in a 100 mL round-
bottom flask and stirred in ice bath for few minutes, then a previously prepared solution of
dichloromethane (5 mL) containing 2 mL of nitrosonitric acid was added dropwise to the
above solution under stirring. After about 1 hour, the mixture was poured into 300 mL of
methanol and stirred for two hours. The precipitate was filtered and then dried at 50 °C
under vacuum oven. The crude product was purified by column chromatography on silica
gel (dichloromethane/ethyl acetate = 1:1, V/V) to give an red solid (98%). 1H NMR (400
MHz, CDCl3) δ (TMS, ppm): 8.79 (s, 5H, ArH), 8.66 (s, 1H, ArH), 8.30 (s, 1H, ArH),
4.24 (t, 4H, -N-CH2-), 1.84 (m, 18H, -CH- and –CH2-), 0.97 (m, 84H, -CH3), 0.72 (t, 4H,
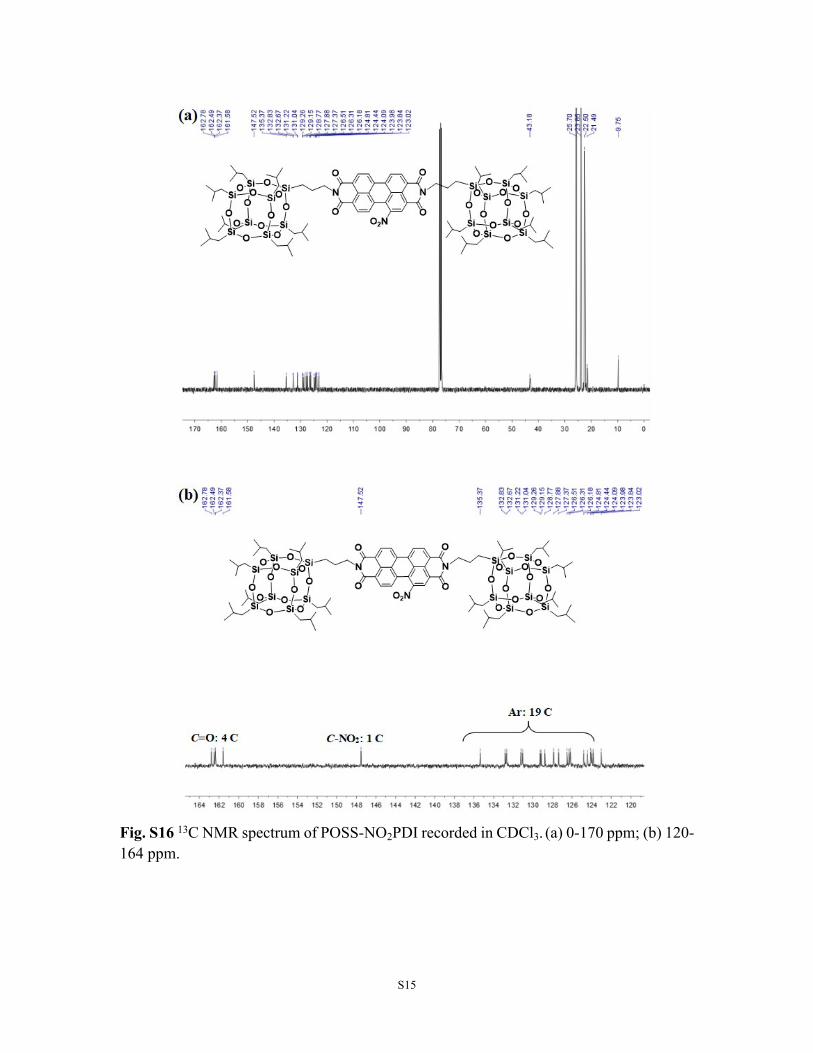
-CH2-), 0.60 (m, 28H, -CH2-). 13C NMR (400 MHz, CDCl3) δ (TMS, ppm): 162.78, 162.49,
162.37, 161.58, 147.52, 135.37, 132.83, 132.67, 131.22, 131.04, 129.26, 129.15, 128.77,
127.88, 127.37, 126.51, 126.31, 126.18, 124.81, 124.44, 124.09, 123.98, 123.84, 123.02,
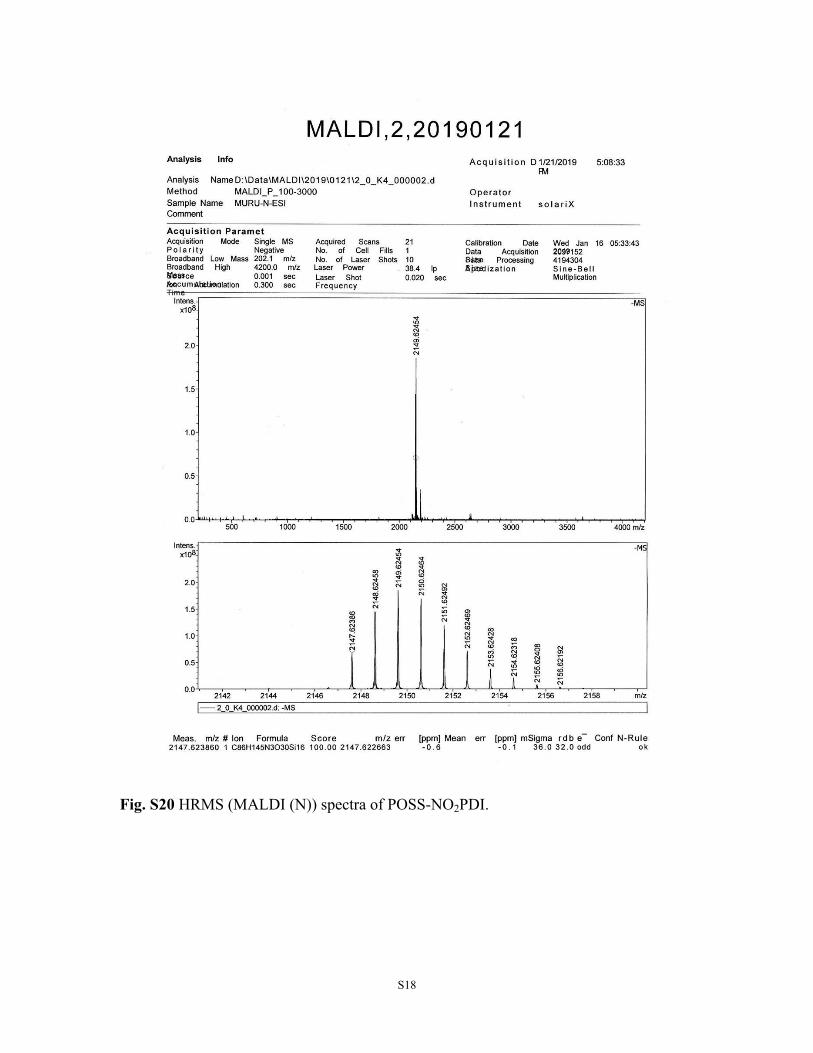
43.18, 25.70, 23.88, 22.50, 21.49, 9.75. HRMS (MALDI (N), 100%) m/z calcd for
C86H145N3O30Si16: 2147.6226, found 2147.6238.
Compound POSS-NH2PDITo a 100 mL round-bottom flask, POSS-NO2PDI (0.5 g, 1.6 mmol), Zn powder (0.9 g, 15
mmol), ethylic acid (3 mL, 50 mmol) and 20 mL tetrahydrofuran were added. The reaction
S4
mixture was stirred for 24 h at room temperature and then the zinc powder was removed
by filtration. After the removal of the tetrahydrofuran, the crude product was dissolved in
dichloromethane and washed with 5% NaOH (w/w) aqueous solution. After the solvent
was removed, the obtained solid was was purified by column chromatography on silica gel
(dichloromethane/ethyl acetate = 2:1, V/V) to give an purple solid (68%). 1H NMR (400
MHz, CDCl3) δ (TMS, ppm): 8.89 (d, 1H, ArH), 8.68 (m, 2H, ArH), 8.52 (m, 3H, ArH),
8.18 (s, 1H, ArH), 5.17 (s, 2H, -NH2), 4.21 (m, 4H, -N-CH2-), 1.86 (m, 18H, -CH- and –
CH2-), 0.95 (m, 84H, -CH3), 0.76 (t, 4H, -CH2-), 0.60 (m, 28H, -CH2-). 13C NMR (400
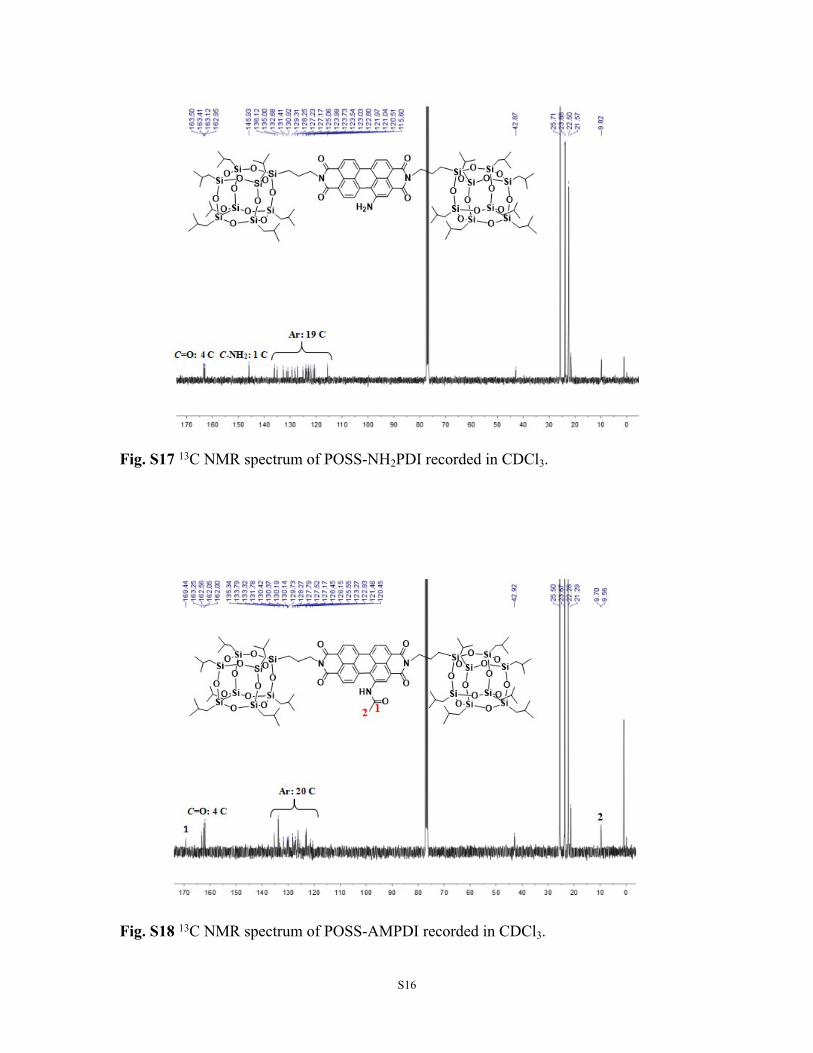
MHz, CDCl3) δ (TMS, ppm): 163.50, 163.41, 163.12, 162.95, 145.93, 136.12, 135.00,
132.68, 131.41, 130.92, 129.31, 128.25, 127.23, 127.17, 125.06, 123.99, 123.73, 123.54,
123.03, 122.80, 121.97, 121.04, 120.51, 111.60, 42.87, 25.71, 23.88, 22.50, 21.51, 9.82.
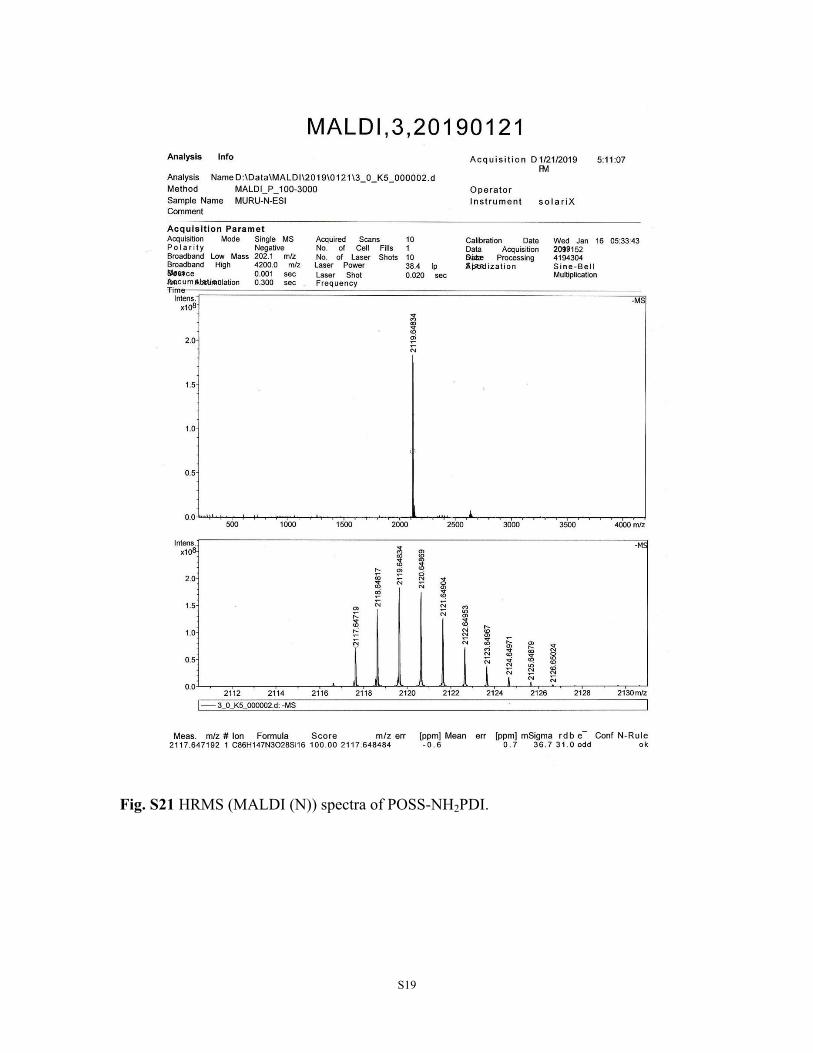
HRMS (MALDI (N), 100%) m/z calcd for C86H147N3O28Si16: 2117.6484, found
2117.6471.
Compound POSS-AMPDI
A mixture of POSS-NH2PDI (0.2 g, 0.095 mmol) and 2 mL of pyridine was dissolved in
20 mL of tetrahydrofuran and then cooled in ice bath. Afterward, a previously prepared
solution of tetrahydrofuran (5 mL) containing 1.5 mL of acetyl chloride was added
dropwise to the above solution with stirring. 30 minutes later, the reaction mixture was
moved to room temperature and kept stirring for 24 hours. After the solvent was removed,
The crude product was purified by silica gel column chromatography with
(dichloromethane/ethyl acetate = 2:1, V/V) as eluent to give an red solid (33%). 1H NMR
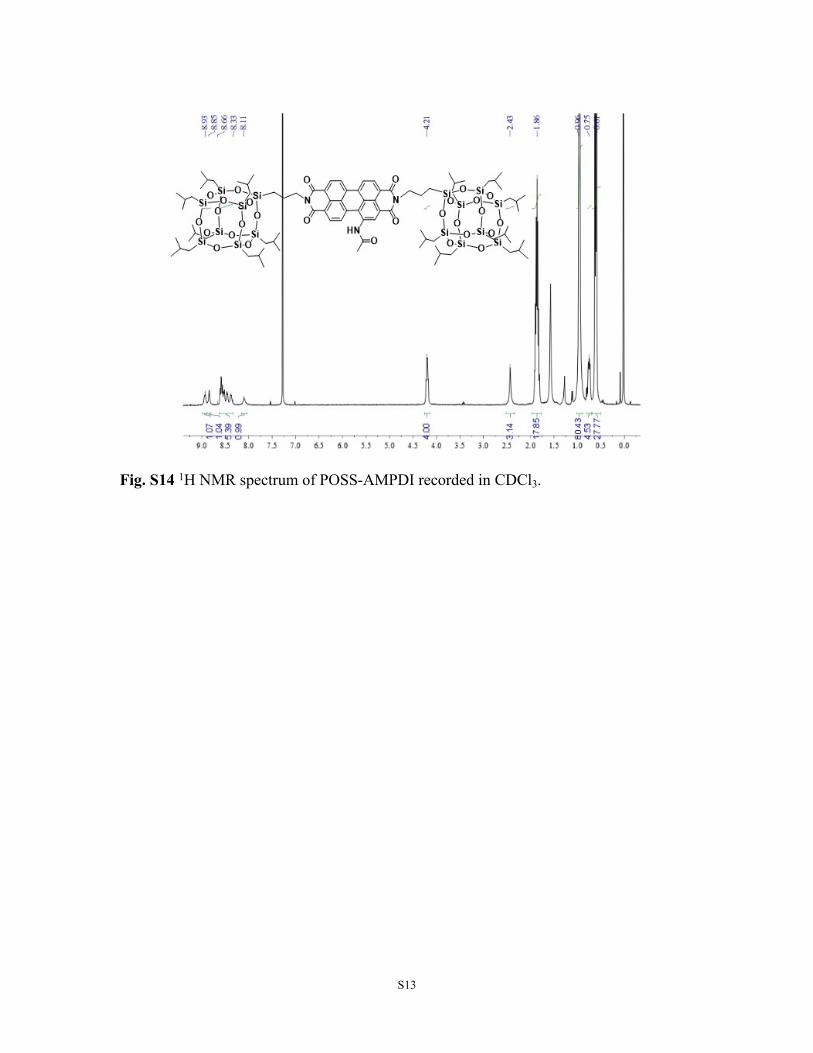
(400 MHz, CDCl3) δ (TMS, ppm): 8.93 (s, 1H, -NH-), 8.85 (s, 1H, ArH), 8.66-8.34 (m,
5H, ArH), 8.11 (s, 1H, ArH), 4.21 (s, 4H, -N-CH2-), 2.43 (s, 3H, -CH3), 1.86 (m, 18H, -
CH- and -CH2-), 0.96 (m, 84H, -CH3), 0.83-0.69 (m, 4H, -CH2-), 0.61 (m, 28H, -CH2-).
13C NMR (400 MHz, CDCl3) δ (TMS, ppm): 169.44, 163.25, 162.56, 162.06, 135.34,
133.79, 133.32, 131.78, 130.42, 130.37, 130.19, 130.14, 129.73, 128.27, 127.79, 127.52,
127.17, 126.45, 126.15, 125.55, 123.27, 122.93, 121.46, 120.45, 42.92, 25.50, 23.67,
S5
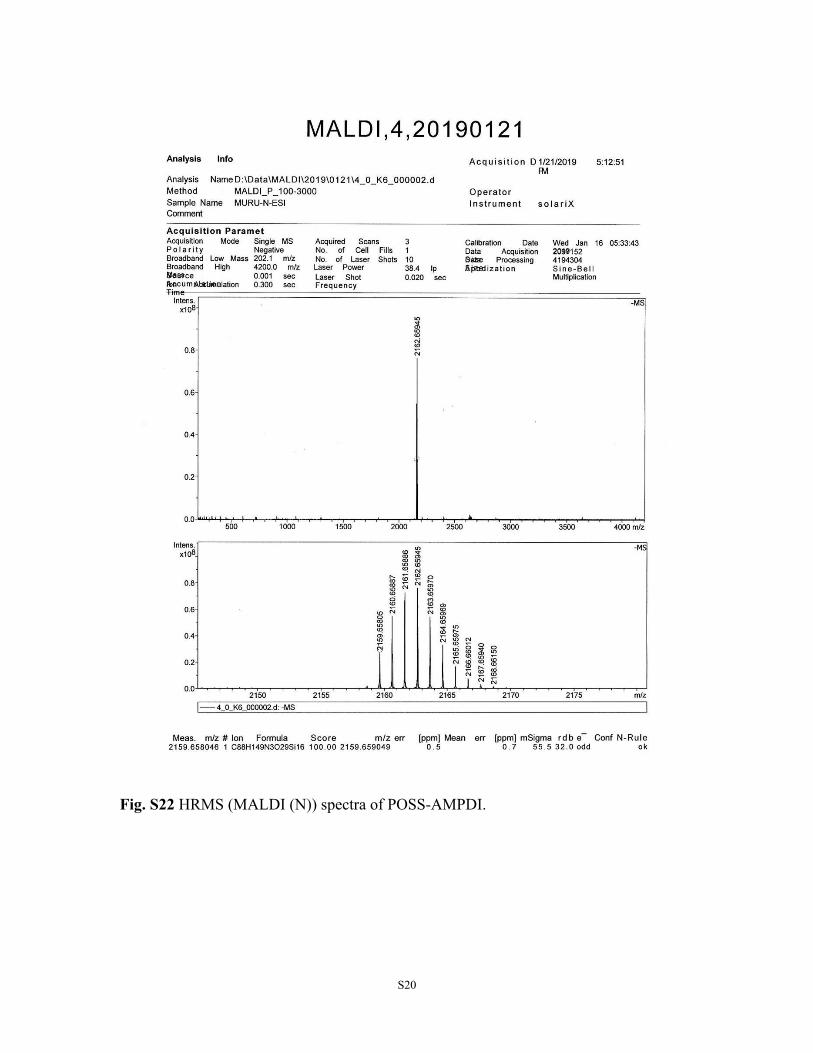
22.28, 21.29, 9.70, 9.56. HRMS (MALDI (N), 100%) m/z calcd for C88H149N3O29Si16:
2159.6590, found 2159.6580.
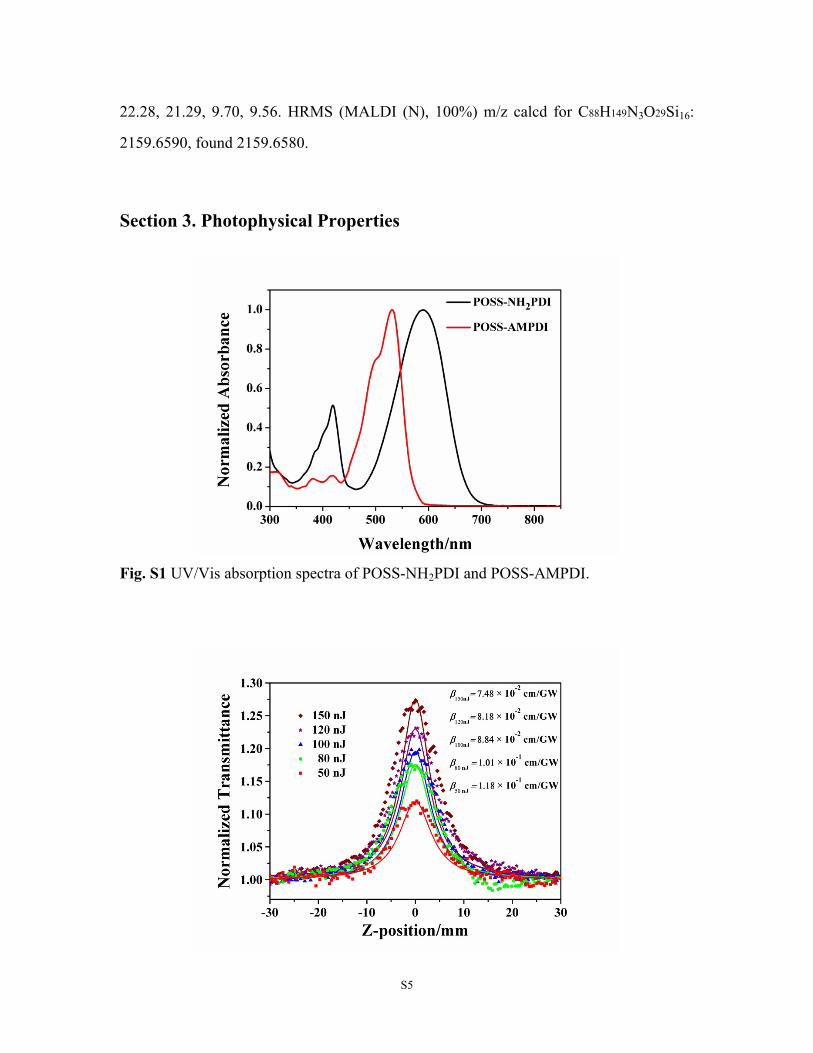
Section 3. Photophysical Properties
Fig. S1 UV/Vis absorption spectra of POSS-NH2PDI and POSS-AMPDI.
S6
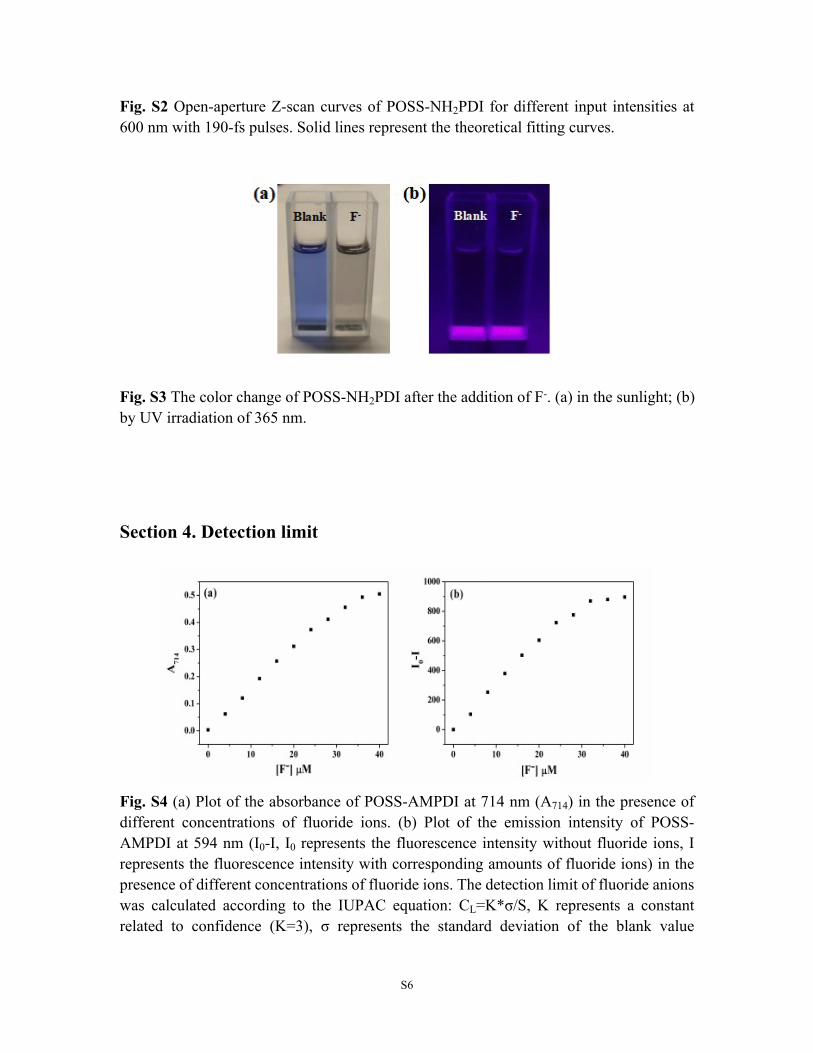
Fig. S2 Open-aperture Z-scan curves of POSS-NH2PDI for different input intensities at 600 nm with 190-fs pulses. Solid lines represent the theoretical fitting curves.
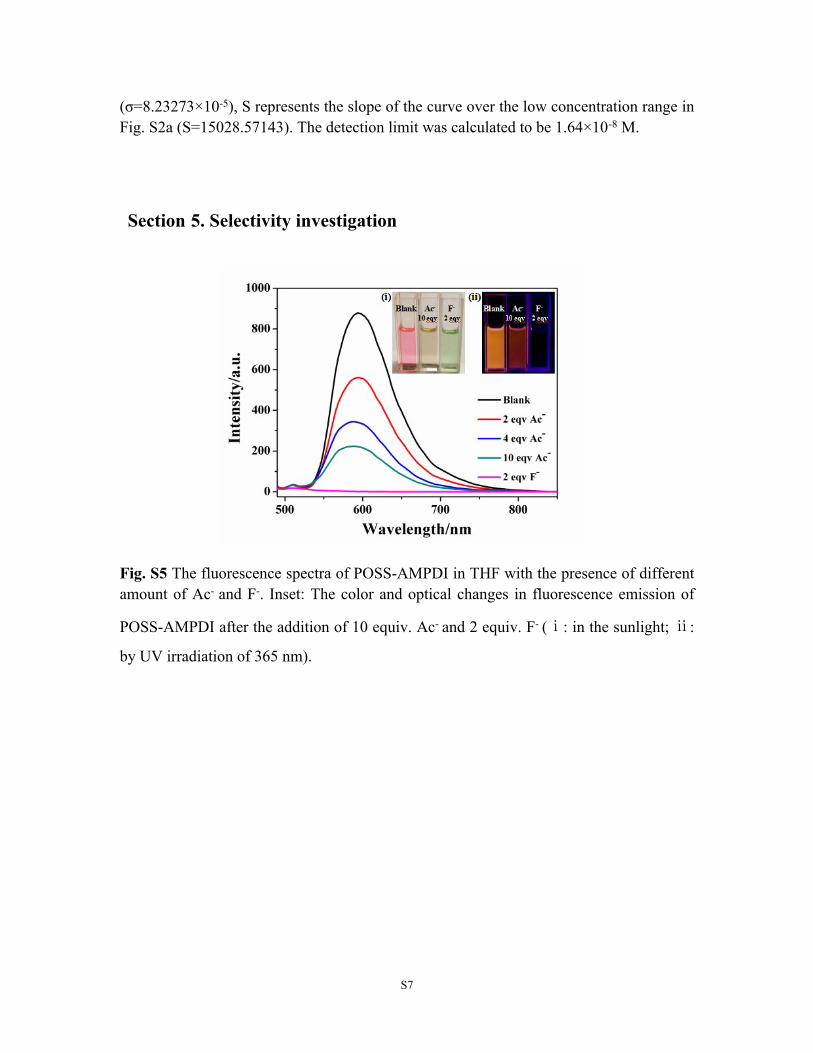
Fig. S3 The color change of POSS-NH2PDI after the addition of F-. (a) in the sunlight; (b) by UV irradiation of 365 nm.
Section 4. Detection limit
Fig. S4 (a) Plot of the absorbance of POSS-AMPDI at 714 nm (A714) in the presence of different concentrations of fluoride ions. (b) Plot of the emission intensity of POSS-AMPDI at 594 nm (I0-I, I0 represents the fluorescence intensity without fluoride ions, I represents the fluorescence intensity with corresponding amounts of fluoride ions) in the presence of different concentrations of fluoride ions. The detection limit of fluoride anions was calculated according to the IUPAC equation: CL=K*σ/S, K represents a constant related to confidence (K=3), σ represents the standard deviation of the blank value
S7
(σ=8.23273×10⁻⁵), S represents the slope of the curve over the low concentration range in Fig. S2a (S=15028.57143). The detection limit was calculated to be 1.64×10⁻⁸ M.
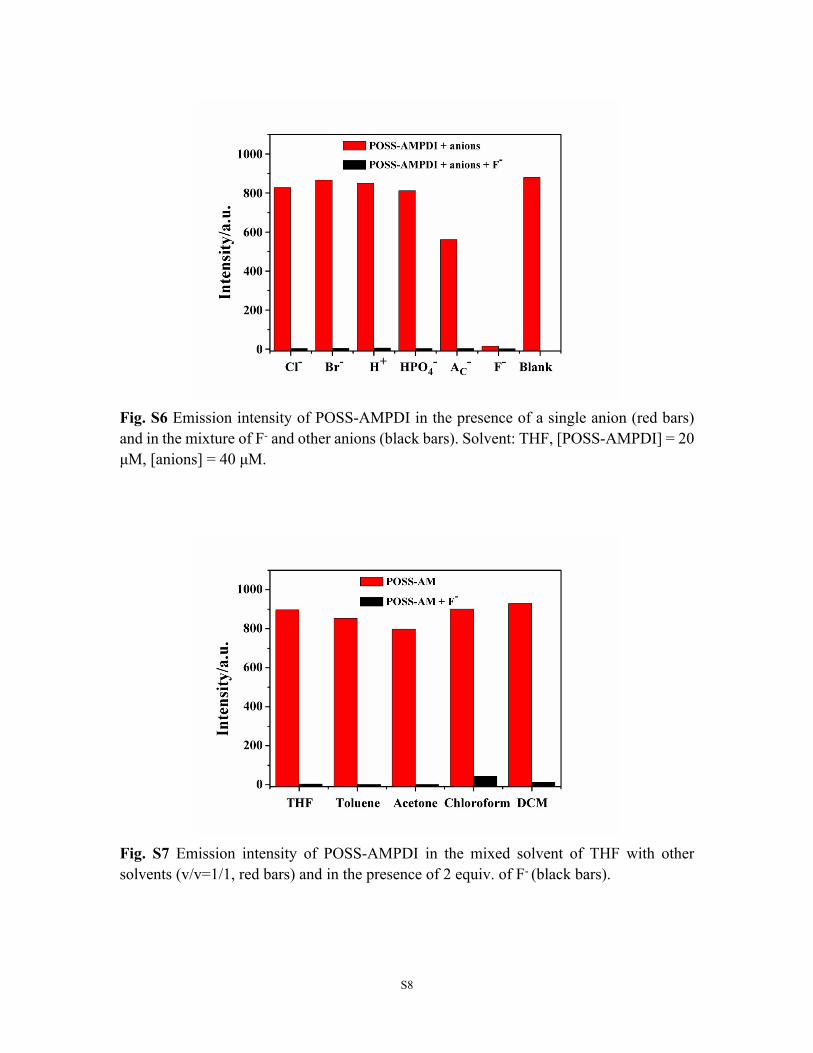
Section 5. Selectivity investigation
Fig. S5 The fluorescence spectra of POSS-AMPDI in THF with the presence of different amount of Ac- and F-. Inset: The color and optical changes in fluorescence emission of
POSS-AMPDI after the addition of 10 equiv. Ac- and 2 equiv. F- (ⅰ: in the sunlight; ⅱ:
by UV irradiation of 365 nm).
S8
Fig. S6 Emission intensity of POSS-AMPDI in the presence of a single anion (red bars) and in the mixture of F- and other anions (black bars). Solvent: THF, [POSS-AMPDI] = 20 μM, [anions] = 40 μM.
Fig. S7 Emission intensity of POSS-AMPDI in the mixed solvent of THF with other solvents (v/v=1/1, red bars) and in the presence of 2 equiv. of F- (black bars).
S9
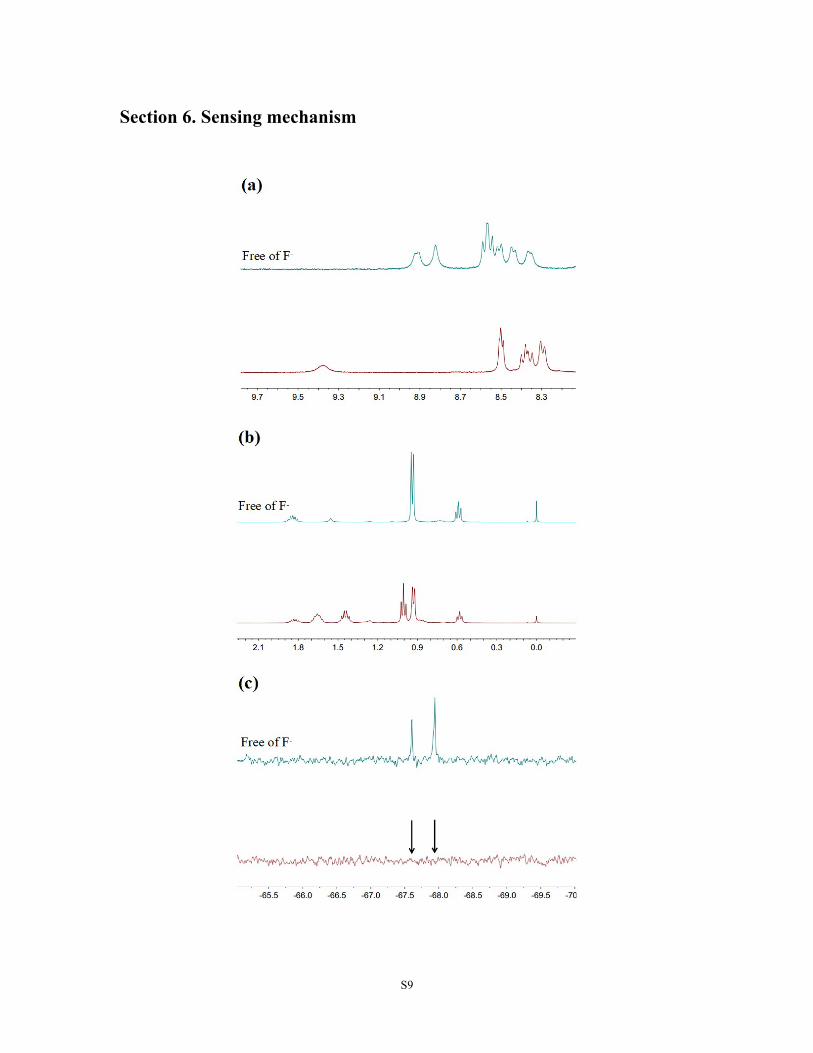
Section 6. Sensing mechanism
S10
Fig. S8 (a) 1H NMR spectra (ranged 8.1-9.7 ppm) of POSS-AMPDI in CDCl3 (upper) and the solute after the addition of 2 equiv. TBAF (below). (b) 1H NMR spectra (ranged 0-2.1 ppm ) of POSS-AMPDI in CDCl3 (upper) and the solute after the addition of 2 equiv. TBAF (below). The peaks corresponding to aromatic protons (between 8.25 to 8.60 ppm) changed to some extent. This may be related to both the PDI electric cloud distribution distortion induced by the N-H deprotonation and the PDI aggregation induced by POSS collapse. The peaks corresponding to isobutyl and Si-CH2 of POSS (between 0.5 to 2.0 ppm) also exhibit distinct change, indicating the fluoride-triggered POSS collapse. (c) 29Si NMR spectra of POSS-AMPDI in CDCl3 (upper) and the solute after the addition of 2 equiv. TBAF (below) in CDCl3.
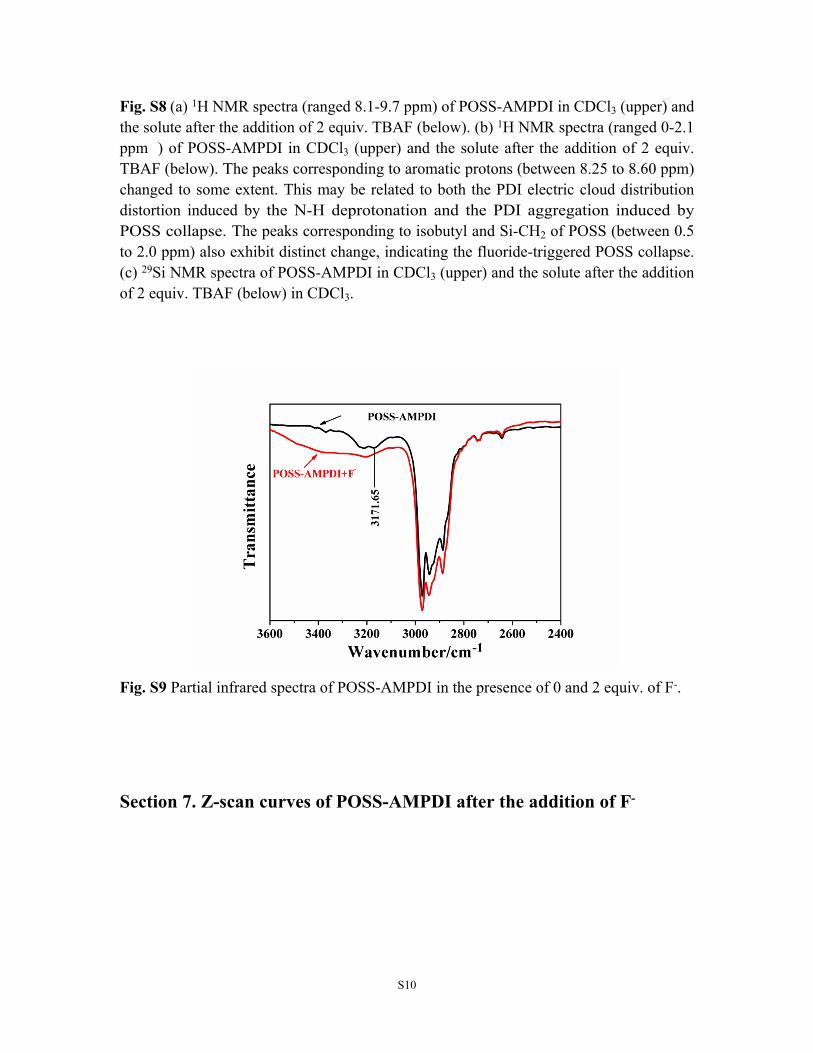
Fig. S9 Partial infrared spectra of POSS-AMPDI in the presence of 0 and 2 equiv. of F-.
Section 7. Z-scan curves of POSS-AMPDI after the addition of F-
S11
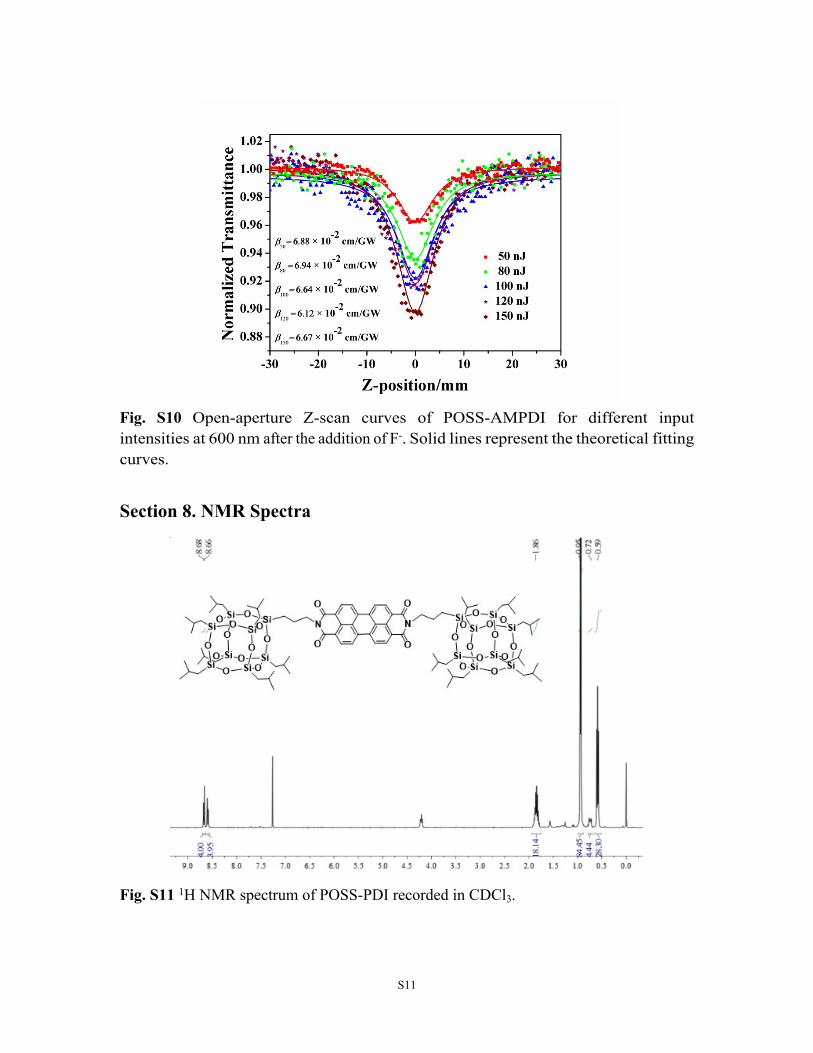
Fig. S10 Open-aperture Z-scan curves of POSS-AMPDI for different input intensities at 600 nm after the addition of F-. Solid lines represent the theoretical fitting curves.
Section 8. NMR Spectra
Fig. S11 1H NMR spectrum of POSS-PDI recorded in CDCl3.
S12
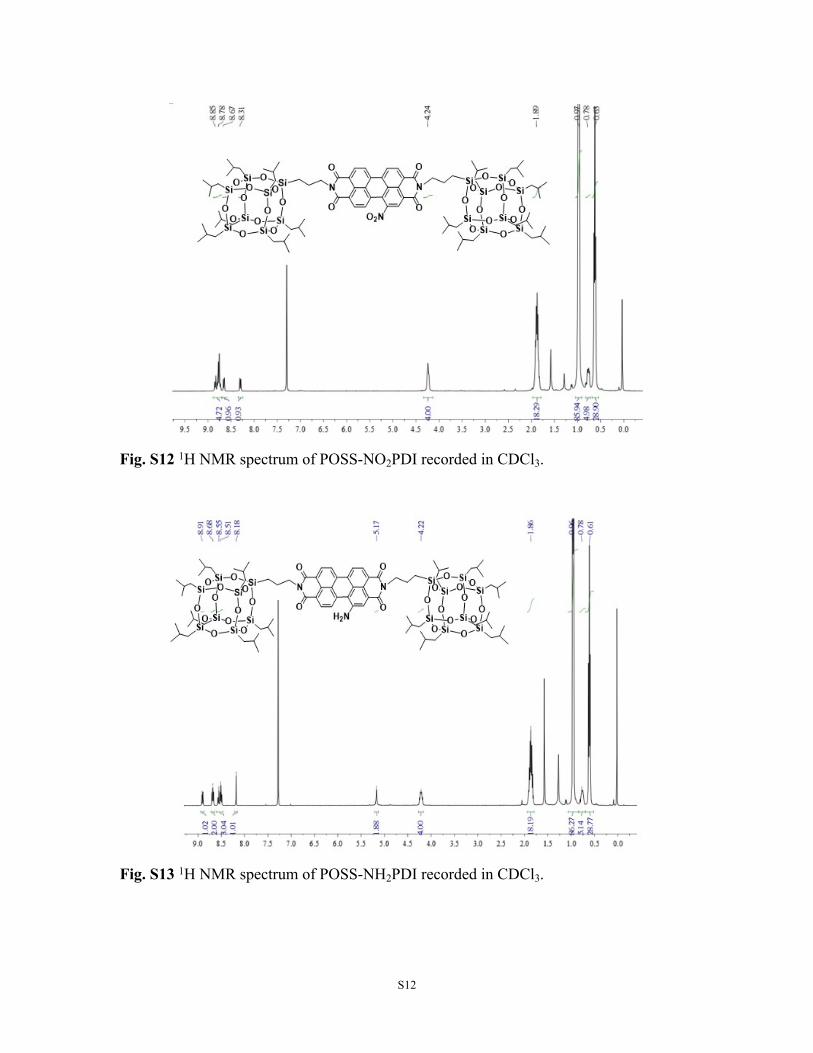
Fig. S12 1H NMR spectrum of POSS-NO2PDI recorded in CDCl3.
Fig. S13 1H NMR spectrum of POSS-NH2PDI recorded in CDCl3.
S13
Fig. S14 1H NMR spectrum of POSS-AMPDI recorded in CDCl3.
S14
Fig. S15 13C NMR spectrum of POSS-PDI recorded in CDCl3.
S15
Fig. S16 13C NMR spectrum of POSS-NO2PDI recorded in CDCl3. (a) 0-170 ppm; (b) 120-164 ppm.
S16
Fig. S17 13C NMR spectrum of POSS-NH2PDI recorded in CDCl3.
Fig. S18 13C NMR spectrum of POSS-AMPDI recorded in CDCl3.
S17
Section 9. HRMS (MALDI (N)) Spectra
Fig. S19 HRMS (MALDI (N)) spectra of POSS-PDI.
S18
Fig. S20 HRMS (MALDI (N)) spectra of POSS-NO2PDI.
S19
Fig. S21 HRMS (MALDI (N)) spectra of POSS-NH2PDI.
S20
Fig. S22 HRMS (MALDI (N)) spectra of POSS-AMPDI.


![Response Surface Methodology for Adsorption of Fluoride Ion … · metal ions in aqueous solutions (e.g. [13-18]). Design of experiments (DOE) and response surface methodology (RSM)](https://img.pdfslide.us/doc/110x75/60027e27964565029e585194/response-surface-methodology-for-adsorption-of-fluoride-ion-metal-ions-in-aqueous.jpg)


![Chemistry · (v) number of moles of fluoride ion in 1000 cm3 of water _____[5] (f) The presence of fluoride ions in domestic water supplies is regarded as beneficial by some, but](https://img.pdfslide.us/doc/110x75/5ebba8833100553d390ac9b7/chemistry-v-number-of-moles-of-fluoride-ion-in-1000-cm3-of-water-5-f.jpg)