Embed Size (px)
Citation preview
2016 GROWTH SLOWS DOWN TO 12.5%;
INDIA STILL FASTEST GROWING MARKET
2017 GROWTH EXPECTED TO BE
13.5% ON THE BACK OF SLOW FIRST FOUR MONTHS
PITCH MADISON ADVERTISING REPORT 2017
IN NOVEMBER AND DECEMBER...
Sam Balsara Vikram Sakhuja Nilesh Bagaria
TSUNAMI IN NOVEMBER AND DECEMBER...
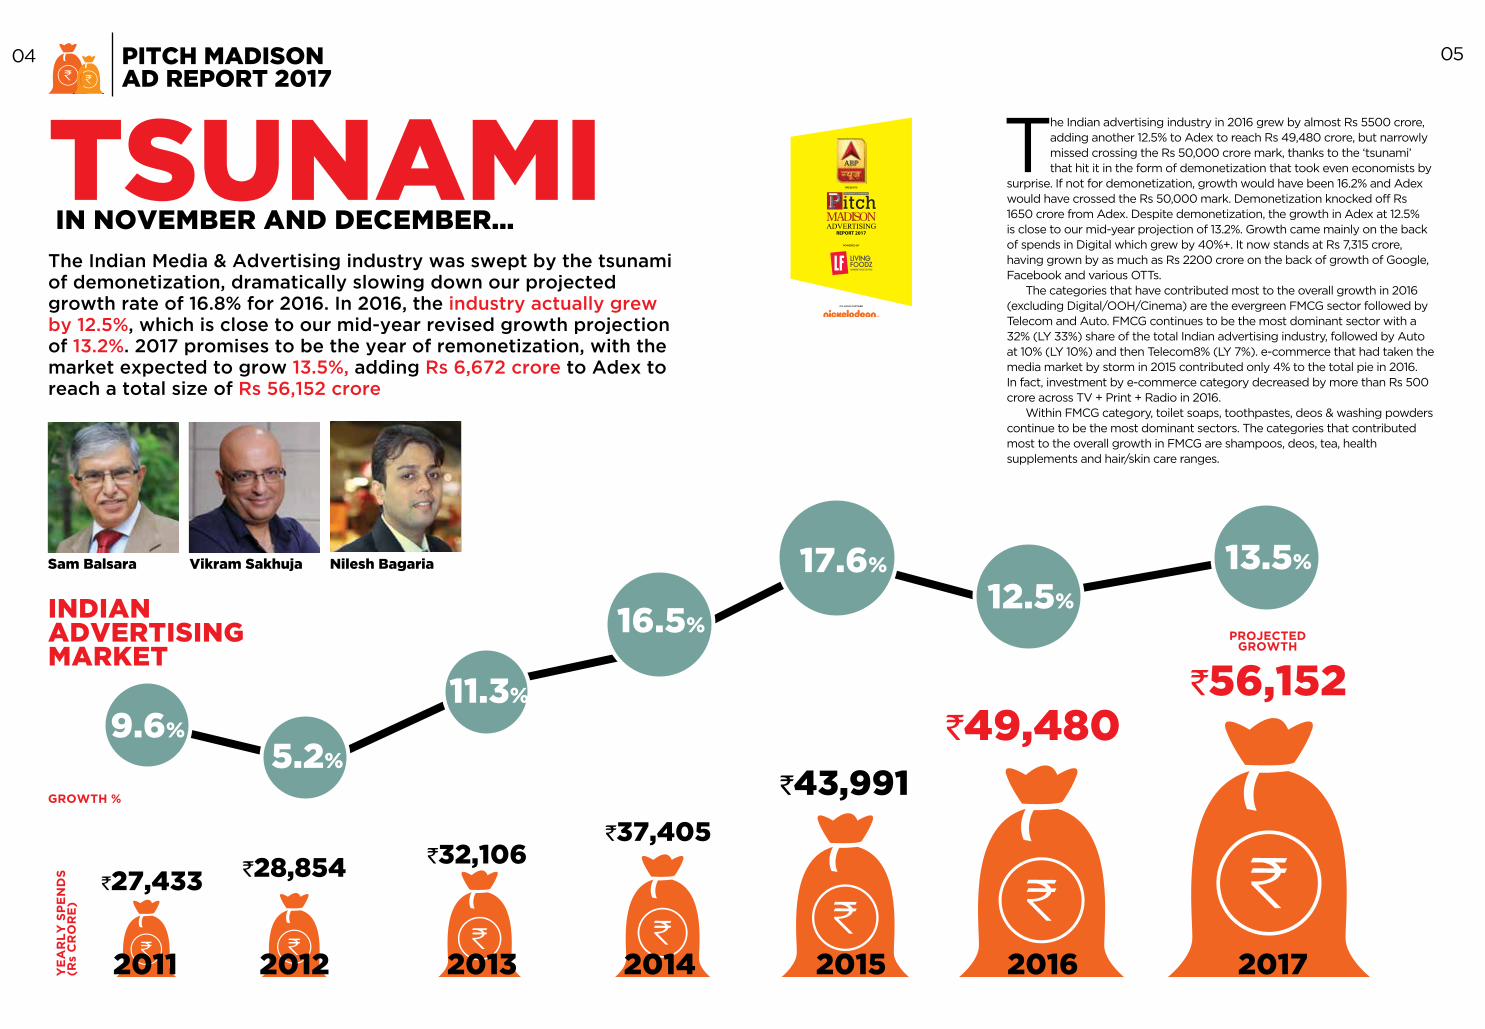
The Indian Media & Advertising industry was swept by the tsunami of demonetization, dramatically slowing down our projected growth rate of 16.8% for 2016. In 2016, the industry actually grew by 12.5%, which is close to our mid-year revised growth projection of 13.2%. 2017 promises to be the year of remonetization, with the market expected to grow 13.5%, adding Rs 6,672 crore to Adex to reach a total size of Rs 56,152 crore
The Indian advertising industry in 2016 grew by almost Rs 5500 crore, adding another 12.5% to Adex to reach Rs 49,480 crore, but narrowly missed crossing the Rs 50,000 crore mark, thanks to the ‘tsunami’ that hit it in the form of demonetization that took even economists by
surprise. If not for demonetization, growth would have been 16.2% and Adex would have crossed the Rs 50,000 mark. Demonetization knocked off Rs 1650 crore from Adex. Despite demonetization, the growth in Adex at 12.5% is close to our mid-year projection of 13.2%. Growth came mainly on the back of spends in Digital which grew by 40%+. It now stands at Rs 7,315 crore, having grown by as much as Rs 2200 crore on the back of growth of Google, Facebook and various OTTs.
The categories that have contributed most to the overall growth in 2016 (excluding Digital/OOH/Cinema) are the evergreen FMCG sector followed by Telecom and Auto. FMCG continues to be the most dominant sector with a 32% (LY 33%) share of the total Indian advertising industry, followed by Auto at 10% (LY 10%) and then Telecom8% (LY 7%). e-commerce that had taken the media market by storm in 2015 contributed only 4% to the total pie in 2016. In fact, investment by e-commerce category decreased by more than Rs 500 crore across TV + Print + Radio in 2016.
Within FMCG category, toilet soaps, toothpastes, deos & washing powders continue to be the most dominant sectors. The categories that contributed most to the overall growth in FMCG are shampoos, deos, tea, health supplements and hair/skin care ranges.
`27,433 `28,854 `32,106`37,405
`43,991
`49,480
GROWTH %
YE
AR
LY
SP
EN
DS
(R
s C
RO
RE
)
2011 2012 2013 2014 2015 2016 2017
9.6%
5.2%
12.5%
11.3%
16.5%
17.6%
INDIAN ADVERTISING MARKET
PITCH MADISON AD REPORT 2017
`56,152
13.5%
PROJECTED GROWTH
04 05
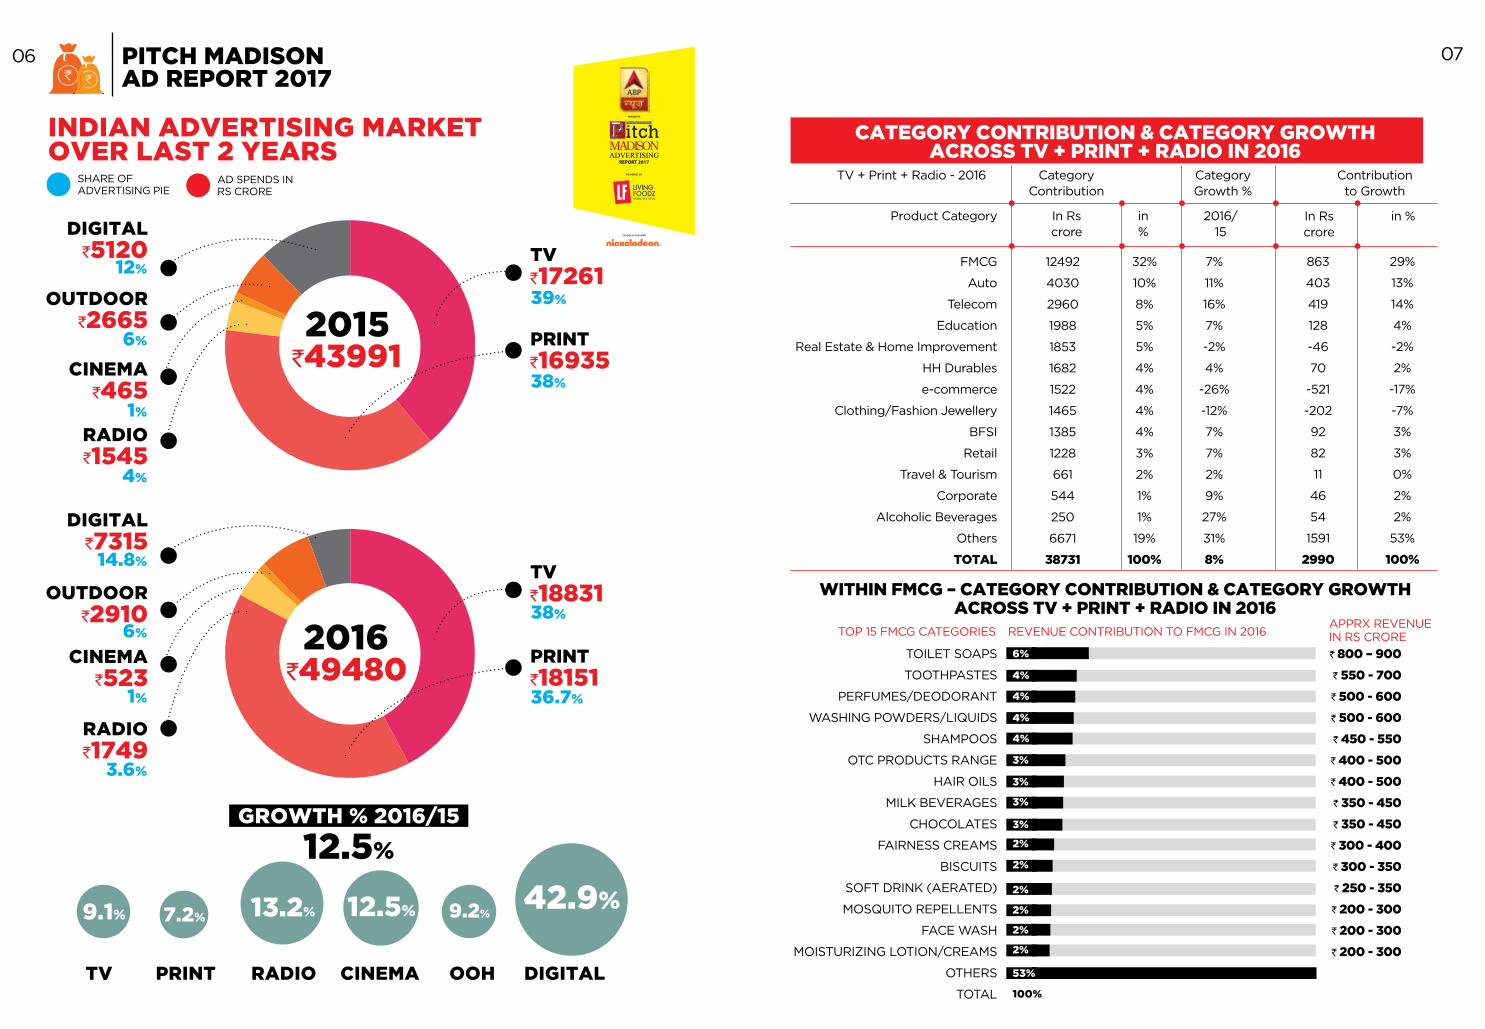
CATEGORY CONTRIBUTION & CATEGORY GROWTH ACROSS TV + PRINT + RADIO IN 2016
WITHIN FMCG – CATEGORY CONTRIBUTION & CATEGORY GROWTH ACROSS TV + PRINT + RADIO IN 2016
FMCG
Auto
Telecom
Education
Real Estate & Home Improvement
HH Durables
e-commerce
Clothing/Fashion Jewellery
BFSI
Retail
Travel & Tourism
Corporate
Alcoholic Beverages
Others
TOTAL
TOILET SOAPS
TOOTHPASTES
PERFUMES/DEODORANT
WASHING POWDERS/LIQUIDS
SHAMPOOS
OTC PRODUCTS RANGE
HAIR OILS
MILK BEVERAGES
CHOCOLATES
FAIRNESS CREAMS
BISCUITS
SOFT DRINK (AERATED)
MOSQUITO REPELLENTS
FACE WASH
MOISTURIZING LOTION/CREAMS
OTHERS
TOTAL
` 800 – 900
` 550 - 700
` 500 - 600
` 500 - 600
` 450 - 550
` 400 - 500
` 400 - 500
` 350 - 450
` 350 - 450
` 300 - 400
` 300 - 350
` 250 - 350
` 200 - 300
` 200 - 300
` 200 - 300
12492
4030
2960
1988
1853
1682
1522
1465
1385
1228
661
544
250
6671
38731
32%
10%
8%
5%
5%
4%
4%
4%
4%
3%
2%
1%
1%
19%
100%
7%
11%
16%
7%
-2%
4%
-26%
-12%
7%
7%
2%
9%
27%
31%
8%
863
403
419
128
-46
70
-521
-202
92
82
11
46
54
1591
2990
29%
13%
14%
4%
-2%
2%
-17%
-7%
3%
3%
0%
2%
2%
53%
100%
TV + Print + Radio - 2016
Product Category
Category Contribution
In Rs crore
in %
Category Growth %
2016/ 15
Contribution to Growth
in %In Rs crore
INDIAN ADVERTISING MARKET OVER LAST 2 YEARS
GROWTH % 2016/15
PITCH MADISON AD REPORT 2017
2015
2016
TV
TV
CINEMA
CINEMA
OUTDOOR
OUTDOOR
DIGITAL
DIGITAL
RADIO
RADIO
`17261
`18831
`465
`523
`2665
`2910
`5120
`7315
`16935
`18151
`1545
`1749
`43991
`49480
39%
38%
36.7%
38%
4%
3.6%
1%
6%
14.8%
1%
6%
12%
6%
4%
4%
4%
4%
3%
3%
3%
3%
2%
2%
2%
2%
2%
2%
53%
100%
TOP 15 FMCG CATEGORIES REVENUE CONTRIBUTION TO FMCG IN 2016APPRX REVENUE IN RS CRORE
TV PRINT RADIO CINEMA OOH DIGITAL
9.1% 7.2% 13.2% 12.5% 9.2%42.9%
12.5%
06 07
SHARE OF ADVERTISING PIE
AD SPENDS IN RS CRORE
YEAR
2016
2017
GROWTH %
JAN-APR
16600
17969
8%
MAY-OCT
26570
30380
14%
NOV-DEC
6310
7807
24%
TOTAL
49480
56152
13.5%
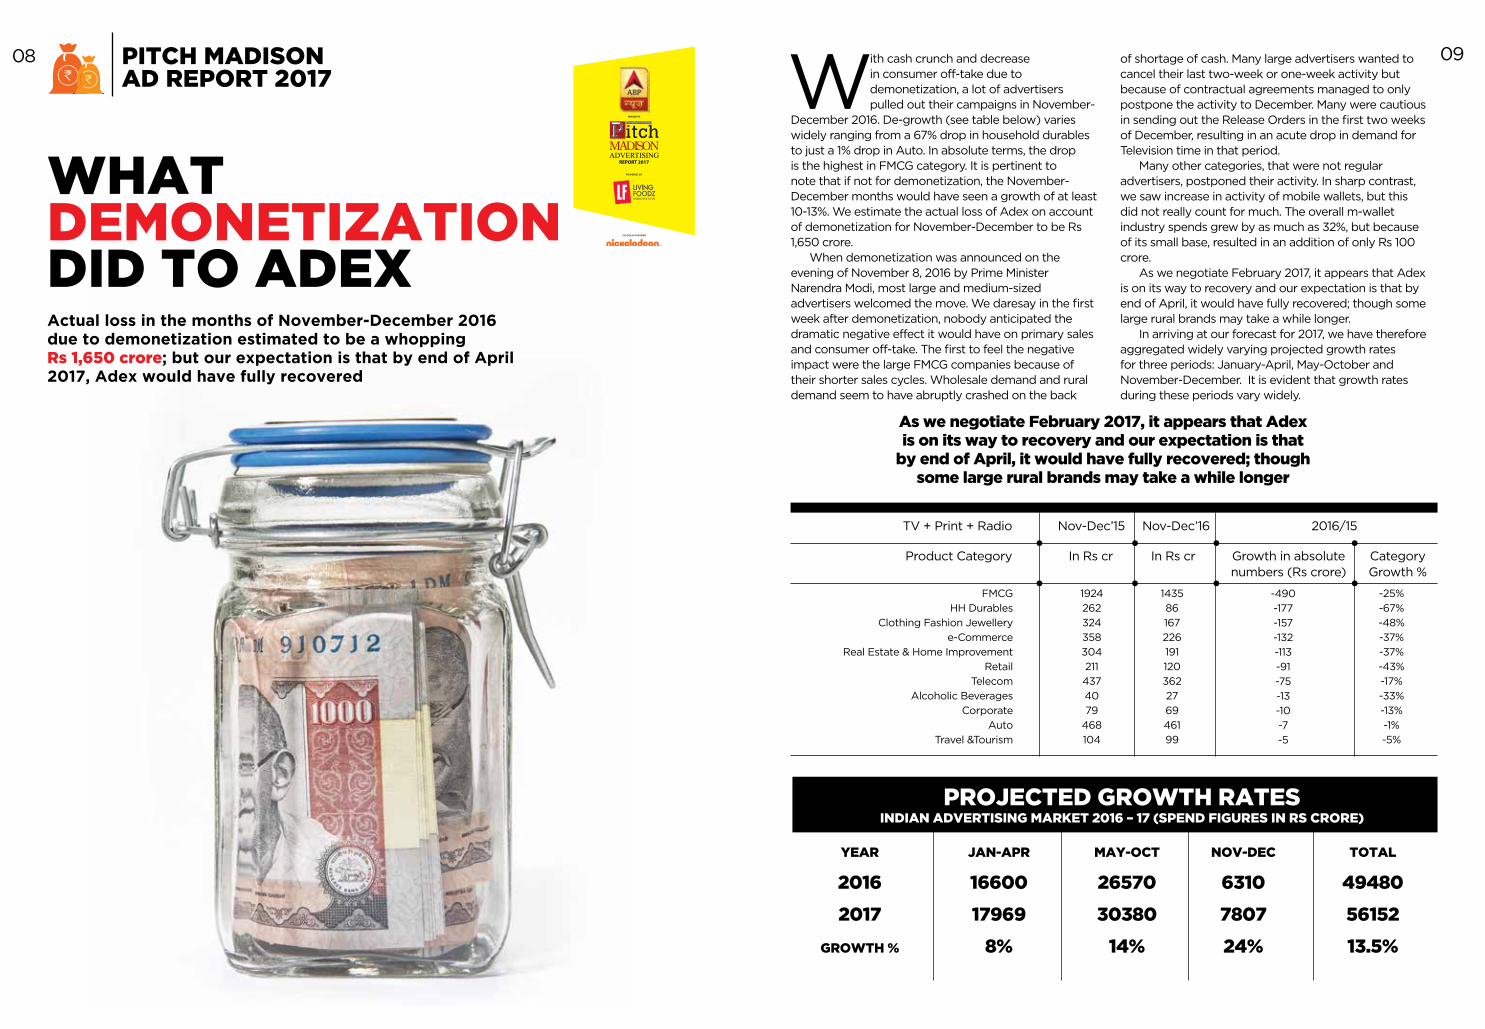
WHAT DEMONETIZATION DID TO ADEXActual loss in the months of November-December 2016 due to demonetization estimated to be a whopping Rs 1,650 crore; but our expectation is that by end of April 2017, Adex would have fully recovered
With cash crunch and decrease in consumer off-take due to demonetization, a lot of advertisers pulled out their campaigns in November-
December 2016. De-growth (see table below) varies widely ranging from a 67% drop in household durables to just a 1% drop in Auto. In absolute terms, the drop is the highest in FMCG category. It is pertinent to note that if not for demonetization, the November-December months would have seen a growth of at least 10-13%. We estimate the actual loss of Adex on account of demonetization for November-December to be Rs 1,650 crore.
When demonetization was announced on the evening of November 8, 2016 by Prime Minister Narendra Modi, most large and medium-sized advertisers welcomed the move. We daresay in the first week after demonetization, nobody anticipated the dramatic negative effect it would have on primary sales and consumer off-take. The first to feel the negative impact were the large FMCG companies because of their shorter sales cycles. Wholesale demand and rural demand seem to have abruptly crashed on the back
of shortage of cash. Many large advertisers wanted to cancel their last two-week or one-week activity but because of contractual agreements managed to only postpone the activity to December. Many were cautious in sending out the Release Orders in the first two weeks of December, resulting in an acute drop in demand for Television time in that period.
Many other categories, that were not regular advertisers, postponed their activity. In sharp contrast, we saw increase in activity of mobile wallets, but this did not really count for much. The overall m-wallet industry spends grew by as much as 32%, but because of its small base, resulted in an addition of only Rs 100 crore.
As we negotiate February 2017, it appears that Adex is on its way to recovery and our expectation is that by end of April, it would have fully recovered; though some large rural brands may take a while longer.
In arriving at our forecast for 2017, we have therefore aggregated widely varying projected growth rates for three periods: January-April, May-October and November-December. It is evident that growth rates during these periods vary widely.
FMCG
HH Durables
Clothing Fashion Jewellery
e-Commerce
Real Estate & Home Improvement
Retail
Telecom
Alcoholic Beverages
Corporate
Auto
Travel &Tourism
1924
262
324
358
304
211
437
40
79
468
104
1435
86
167
226
191
120
362
27
69
461
99
-490
-177
-157
-132
-113
-91
-75
-13
-10
-7
-5
-25%
-67%
-48%
-37%
-37%
-43%
-17%
-33%
-13%
-1%
-5%
TV + Print + Radio
Product Category
Nov-Dec’15
In Rs cr
Nov-Dec’16
Growth in absolute numbers (Rs crore)
2016/15
Category Growth %
In Rs cr
PROJECTED GROWTH RATESINDIAN ADVERTISING MARKET 2016 – 17 (SPEND FIGURES IN RS CRORE)
As we negotiate February 2017, it appears that Adex is on its way to recovery and our expectation is that
by end of April, it would have fully recovered; though some large rural brands may take a while longer
PITCH MADISON AD REPORT 2017
08 09
PITCH MADISON AD REPORT 2017
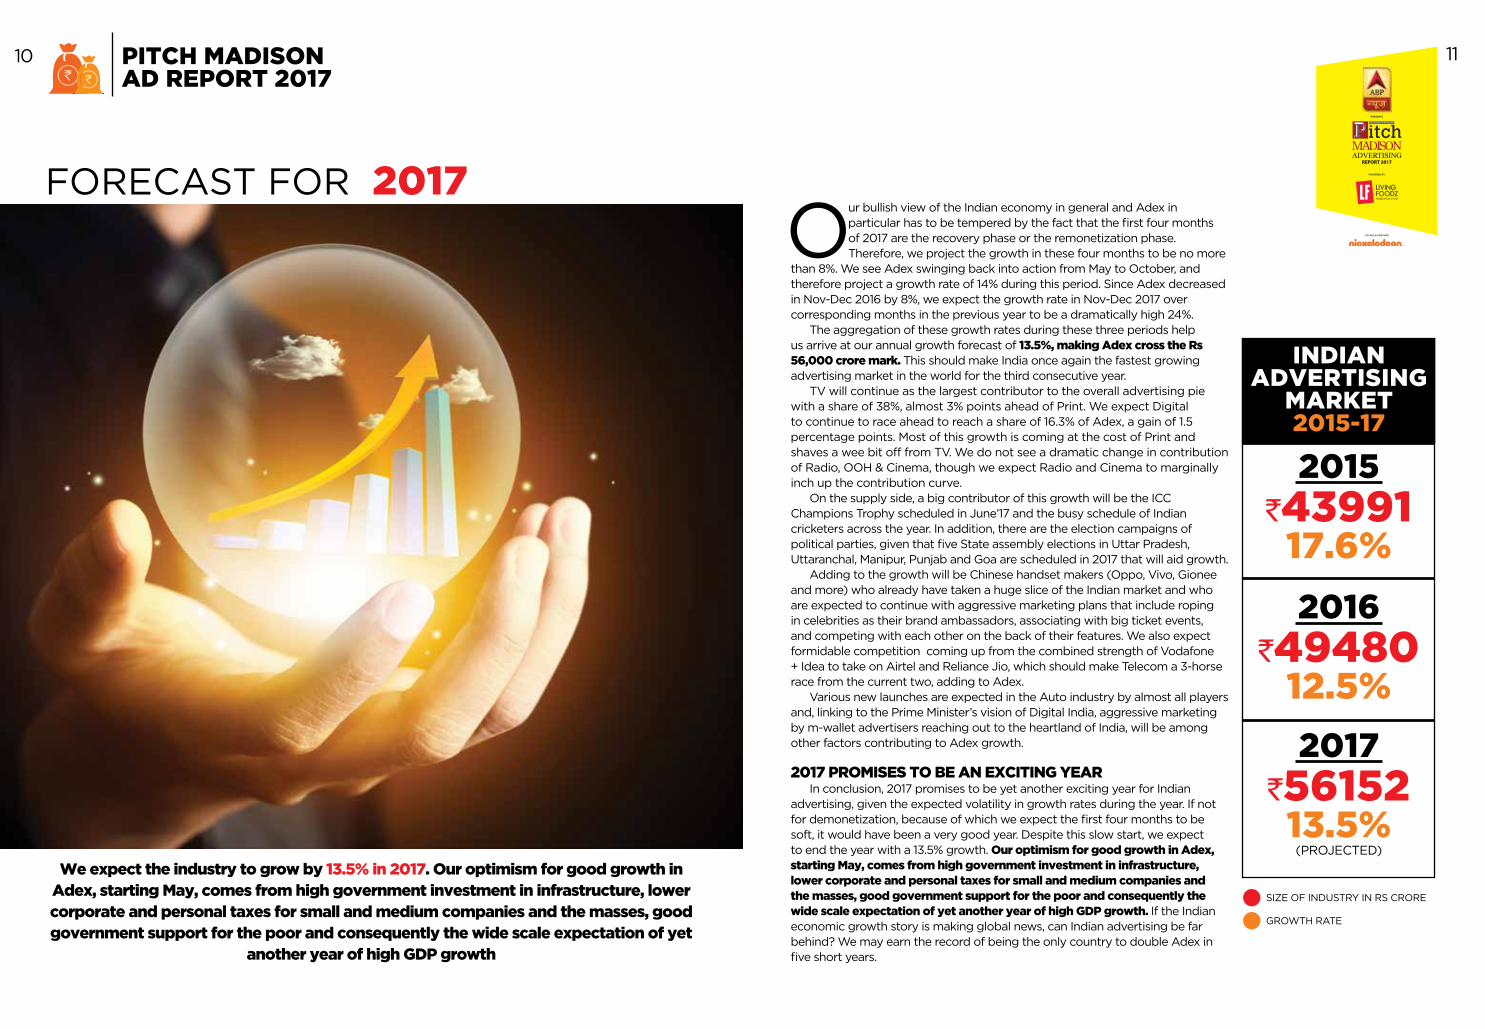
FORECAST FOR 2017
Our bullish view of the Indian economy in general and Adex in particular has to be tempered by the fact that the first four months of 2017 are the recovery phase or the remonetization phase. Therefore, we project the growth in these four months to be no more
than 8%. We see Adex swinging back into action from May to October, and therefore project a growth rate of 14% during this period. Since Adex decreased in Nov-Dec 2016 by 8%, we expect the growth rate in Nov-Dec 2017 over corresponding months in the previous year to be a dramatically high 24%.
The aggregation of these growth rates during these three periods help us arrive at our annual growth forecast of 13.5%, making Adex cross the Rs 56,000 crore mark. This should make India once again the fastest growing advertising market in the world for the third consecutive year.
TV will continue as the largest contributor to the overall advertising pie with a share of 38%, almost 3% points ahead of Print. We expect Digital to continue to race ahead to reach a share of 16.3% of Adex, a gain of 1.5 percentage points. Most of this growth is coming at the cost of Print and shaves a wee bit off from TV. We do not see a dramatic change in contribution of Radio, OOH & Cinema, though we expect Radio and Cinema to marginally inch up the contribution curve.
On the supply side, a big contributor of this growth will be the ICC Champions Trophy scheduled in June’17 and the busy schedule of Indian cricketers across the year. In addition, there are the election campaigns of political parties, given that five State assembly elections in Uttar Pradesh, Uttaranchal, Manipur, Punjab and Goa are scheduled in 2017 that will aid growth.
Adding to the growth will be Chinese handset makers (Oppo, Vivo, Gionee and more) who already have taken a huge slice of the Indian market and who are expected to continue with aggressive marketing plans that include roping in celebrities as their brand ambassadors, associating with big ticket events, and competing with each other on the back of their features. We also expect formidable competition coming up from the combined strength of Vodafone + Idea to take on Airtel and Reliance Jio, which should make Telecom a 3-horse race from the current two, adding to Adex.
Various new launches are expected in the Auto industry by almost all players and, linking to the Prime Minister’s vision of Digital India, aggressive marketing by m-wallet advertisers reaching out to the heartland of India, will be among other factors contributing to Adex growth.
2017 PROMISES TO BE AN EXCITING YEAR In conclusion, 2017 promises to be yet another exciting year for Indian
advertising, given the expected volatility in growth rates during the year. If not for demonetization, because of which we expect the first four months to be soft, it would have been a very good year. Despite this slow start, we expect to end the year with a 13.5% growth. Our optimism for good growth in Adex, starting May, comes from high government investment in infrastructure, lower corporate and personal taxes for small and medium companies and the masses, good government support for the poor and consequently the wide scale expectation of yet another year of high GDP growth. If the Indian economic growth story is making global news, can Indian advertising be far behind? We may earn the record of being the only country to double Adex in five short years.
INDIAN ADVERTISING
MARKET 2015-17
2015
2016
2017
17.6%
12.5%
13.5%
`43991
`49480
`56152
We expect the industry to grow by 13.5% in 2017. Our optimism for good growth in Adex, starting May, comes from high government investment in infrastructure, lower corporate and personal taxes for small and medium companies and the masses, good government support for the poor and consequently the wide scale expectation of yet
another year of high GDP growth
10 11
(PROJECTED)
SIZE OF INDUSTRY IN RS CRORE
GROWTH RATE
TELEVISION
2013 2014 2015 2016 2017PROJECTED GROWTH
`12,419`14,158
`17,261`18,831
`21,296GROWTH %
YE
AR
LY
SP
EN
DS
(R
s C
RO
RE
)
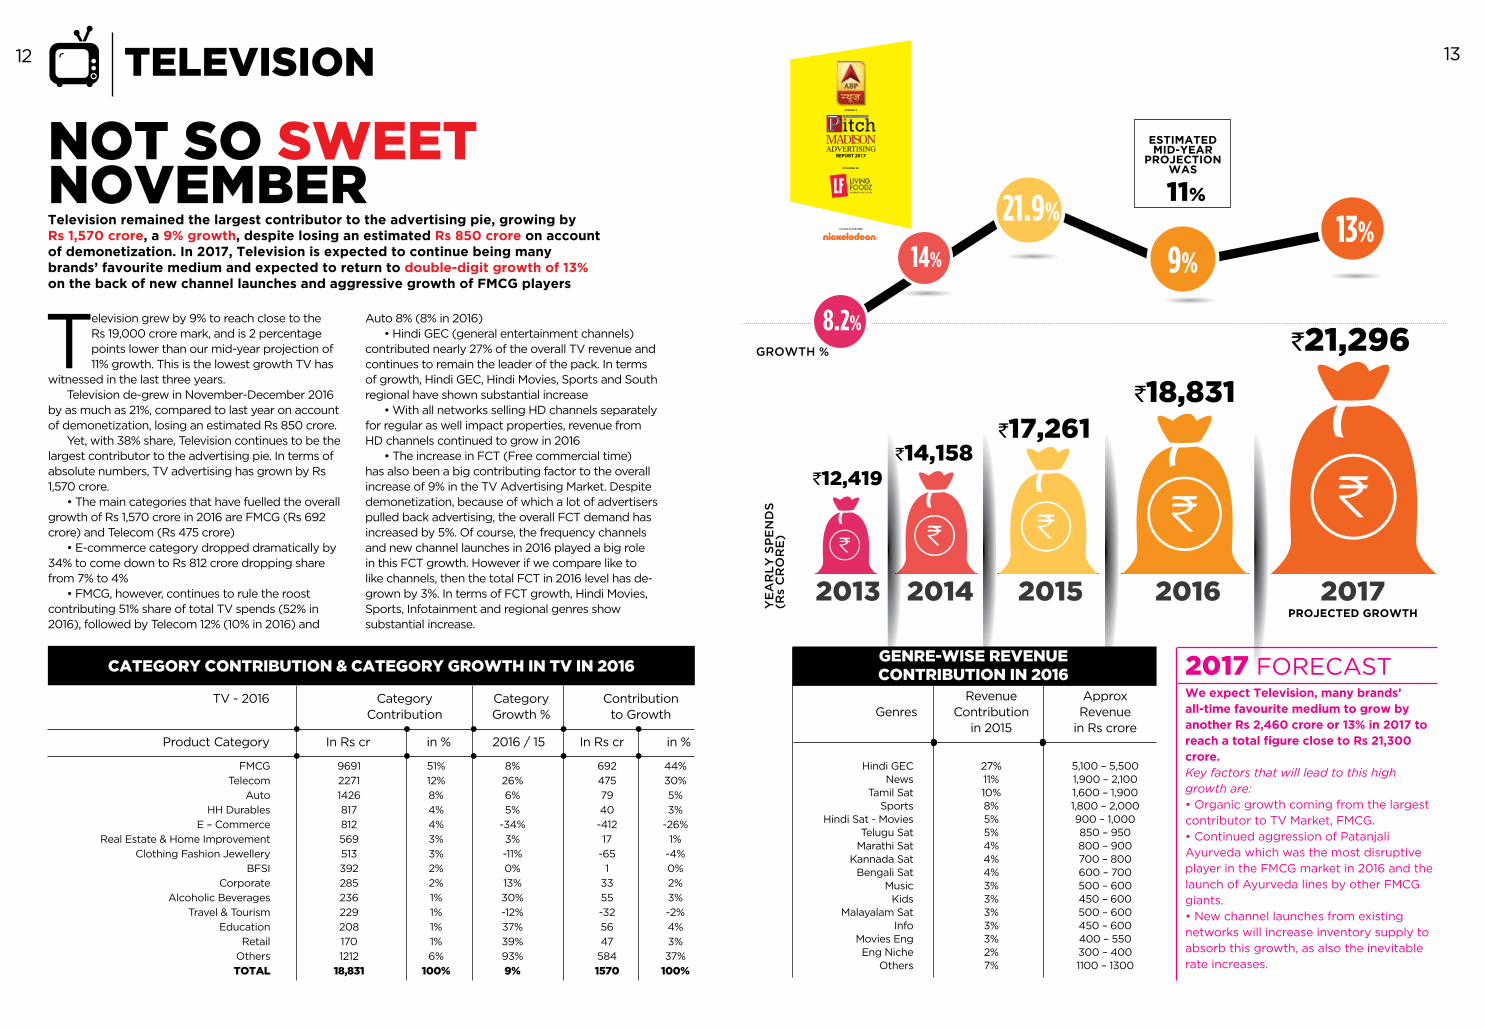
NOT SO SWEET NOVEMBERTelevision remained the largest contributor to the advertising pie, growing by Rs 1,570 crore, a 9% growth, despite losing an estimated Rs 850 crore on account of demonetization. In 2017, Television is expected to continue being many brands’ favourite medium and expected to return to double-digit growth of 13% on the back of new channel launches and aggressive growth of FMCG players
Television grew by 9% to reach close to the Rs 19,000 crore mark, and is 2 percentage points lower than our mid-year projection of 11% growth. This is the lowest growth TV has
witnessed in the last three years.Television de-grew in November-December 2016
by as much as 21%, compared to last year on account of demonetization, losing an estimated Rs 850 crore.
Yet, with 38% share, Television continues to be the largest contributor to the advertising pie. In terms of absolute numbers, TV advertising has grown by Rs 1,570 crore.
• The main categories that have fuelled the overall growth of Rs 1,570 crore in 2016 are FMCG (Rs 692 crore) and Telecom (Rs 475 crore)
• E-commerce category dropped dramatically by 34% to come down to Rs 812 crore dropping share from 7% to 4%
• FMCG, however, continues to rule the roost contributing 51% share of total TV spends (52% in 2016), followed by Telecom 12% (10% in 2016) and
Auto 8% (8% in 2016)• Hindi GEC (general entertainment channels)
contributed nearly 27% of the overall TV revenue and continues to remain the leader of the pack. In terms of growth, Hindi GEC, Hindi Movies, Sports and South regional have shown substantial increase
• With all networks selling HD channels separately for regular as well impact properties, revenue from HD channels continued to grow in 2016
• The increase in FCT (Free commercial time) has also been a big contributing factor to the overall increase of 9% in the TV Advertising Market. Despite demonetization, because of which a lot of advertisers pulled back advertising, the overall FCT demand has increased by 5%. Of course, the frequency channels and new channel launches in 2016 played a big role in this FCT growth. However if we compare like to like channels, then the total FCT in 2016 level has de-grown by 3%. In terms of FCT growth, Hindi Movies, Sports, Infotainment and regional genres show substantial increase.
GENRE-WISE REVENUE CONTRIBUTION IN 2016
Hindi GECNews
Tamil SatSports
Hindi Sat - MoviesTelugu Sat
Marathi SatKannada Sat
Bengali SatMusic
KidsMalayalam Sat
InfoMovies EngEng Niche
Others
27%11%10%8%5%5%4%4%4%3%3%3%3%3%2%7%
5,100 – 5,5001,900 – 2,1001,600 – 1,9001,800 – 2,000900 – 1,000850 – 950800 – 900700 – 800600 – 700500 – 600450 – 600500 – 600450 – 600400 – 550300 – 4001100 – 1300
GenresRevenue
Contribution in 2015
Approx Revenue
in Rs crore
We expect Television, many brands’ all-time favourite medium to grow by another Rs 2,460 crore or 13% in 2017 to reach a total figure close to Rs 21,300 crore.Key factors that will lead to this high growth are:• Organic growth coming from the largest contributor to TV Market, FMCG.• Continued aggression of Patanjali Ayurveda which was the most disruptive player in the FMCG market in 2016 and the launch of Ayurveda lines by other FMCG giants.• New channel launches from existing networks will increase inventory supply to absorb this growth, as also the inevitable rate increases.
2017 FORECASTCATEGORY CONTRIBUTION & CATEGORY GROWTH IN TV IN 2016
FMCG
Telecom
Auto
HH Durables
E – Commerce
Real Estate & Home Improvement
Clothing Fashion Jewellery
BFSI
Corporate
Alcoholic Beverages
Travel & Tourism
Education
Retail
Others
TOTAL
9691
2271
1426
817
812
569
513
392
285
236
229
208
170
1212
18,831
51%
12%
8%
4%
4%
3%
3%
2%
2%
1%
1%
1%
1%
6%
100%
8%
26%
6%
5%
-34%
3%
-11%
0%
13%
30%
-12%
37%
39%
93%
9%
692
475
79
40
-412
17
-65
1
33
55
-32
56
47
584
1570
44%
30%
5%
3%
-26%
1%
-4%
0%
2%
3%
-2%
4%
3%
37%
100%
TV - 2016
Product Category
Category Contribution
in %
Category Growth %
2016 / 15
Contribution to Growth
in %In Rs crIn Rs cr
ESTIMATEDMID-YEAR
PROJECTION WAS
11%
12 13
13%9%
21.9%
8.2%
14%
2013 2014 2015 2016 2017PROJECTED
GROWTH
`13,167`15274
`16935`18,151
`19,869
GROWTH %
YE
AR
LY
SP
EN
DS
(R
s C
RO
RE
)
10%
16%
PRINTESTIMATEDMID-YEAR
PROJECTION WAS
10%
PRINT - LANGUAGE WISE PUBLICATION VOLUME IN CC IN 2016 ( CC IN MN)
HindiEnglishMarathiTelugu
TamilGujarati
KannadaMalayalam
OriyaBengaliPunjabi
AssameseUrdu
TOTAL
116.882.228.422.723.314.712.410.88.74.72.42.41.3331
119.888.529.323.621.913.813.310.79.25.32.72.51.2
342
3%8%3%4%-6%-6%7%-1%5%13%13%3%-8%3%
35%26%9%7%6%4%4%3%3%2%1%1%
Language Yr 2015 Yr 2016Growth %( Yr 16 /
15 )
Contribution in %
(2016)
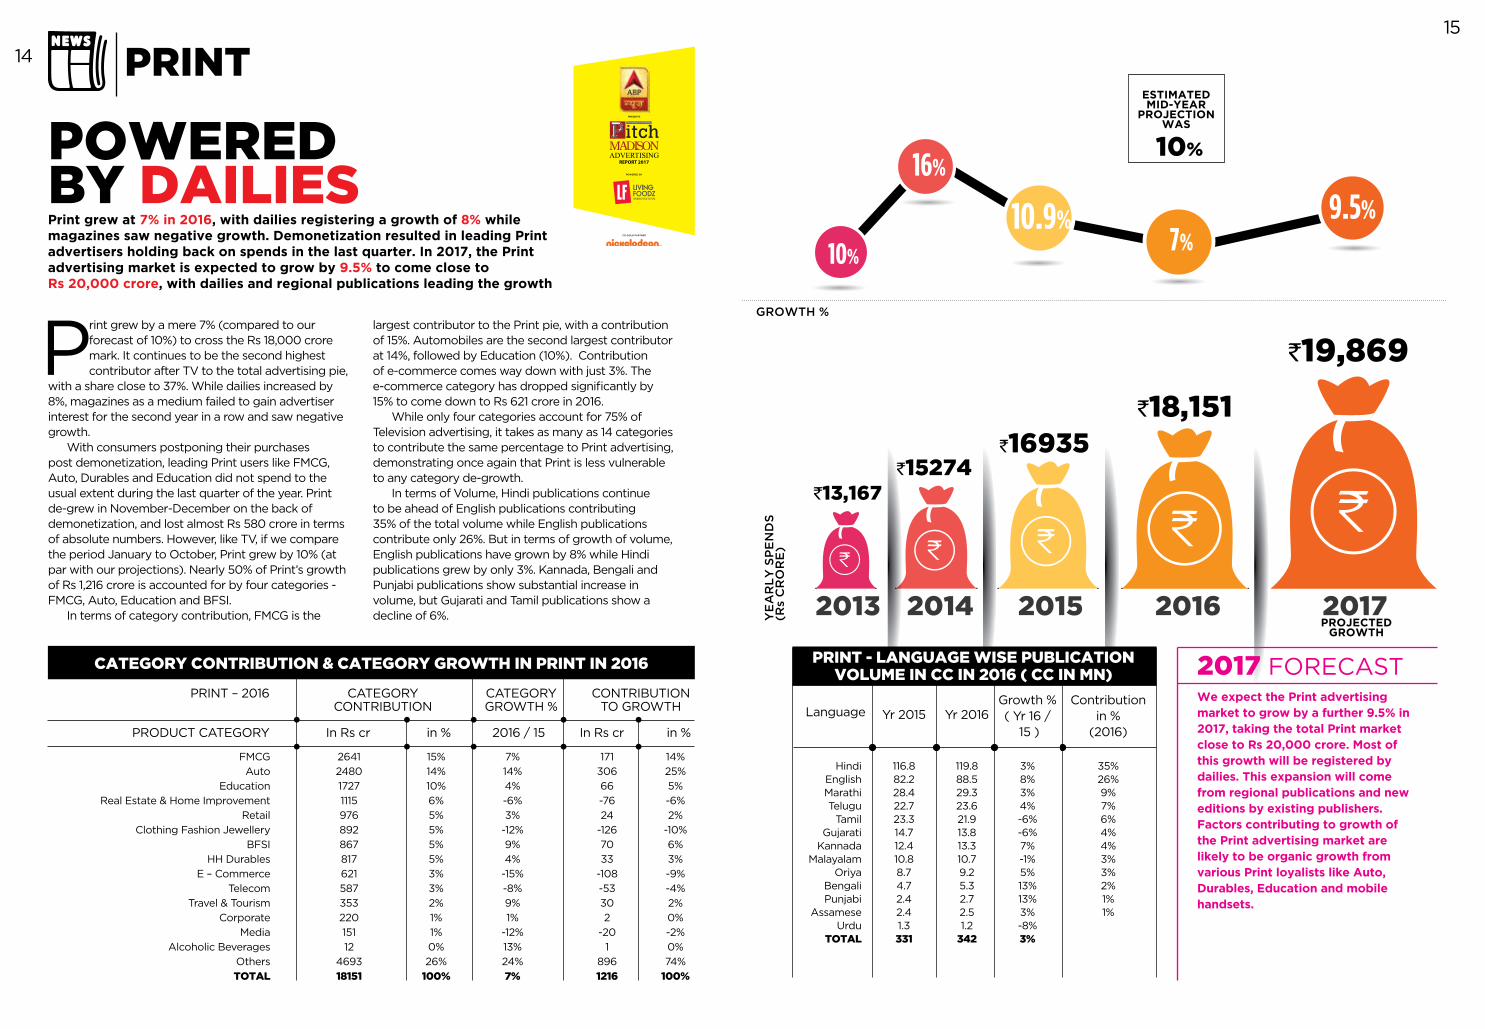
We expect the Print advertising market to grow by a further 9.5% in 2017, taking the total Print market close to Rs 20,000 crore. Most of this growth will be registered by dailies. This expansion will come from regional publications and new editions by existing publishers. Factors contributing to growth of the Print advertising market are likely to be organic growth from various Print loyalists like Auto, Durables, Education and mobile handsets.
2017 FORECASTCATEGORY CONTRIBUTION & CATEGORY GROWTH IN PRINT IN 2016
FMCG
Auto
Education
Real Estate & Home Improvement
Retail
Clothing Fashion Jewellery
BFSI
HH Durables
E – Commerce
Telecom
Travel & Tourism
Corporate
Media
Alcoholic Beverages
Others
TOTAL
2641
2480
1727
1115
976
892
867
817
621
587
353
220
151
12
4693
18151
15%
14%
10%
6%
5%
5%
5%
5%
3%
3%
2%
1%
1%
0%
26%
100%
7%
14%
4%
-6%
3%
-12%
9%
4%
-15%
-8%
9%
1%
-12%
13%
24%
7%
171
306
66
-76
24
-126
70
33
-108
-53
30
2
-20
1
896
1216
14%
25%
5%
-6%
2%
-10%
6%
3%
-9%
-4%
2%
0%
-2%
0%
74%
100%
PRINT – 2016
PRODUCT CATEGORY
CATEGORY CONTRIBUTION
in %
CATEGORY GROWTH %
2016 / 15
CONTRIBUTION TO GROWTH
in %In Rs crIn Rs cr
POWERED BY DAILIESPrint grew at 7% in 2016, with dailies registering a growth of 8% while magazines saw negative growth. Demonetization resulted in leading Print advertisers holding back on spends in the last quarter. In 2017, the Print advertising market is expected to grow by 9.5% to come close to Rs 20,000 crore, with dailies and regional publications leading the growth
Print grew by a mere 7% (compared to our forecast of 10%) to cross the Rs 18,000 crore mark. It continues to be the second highest contributor after TV to the total advertising pie,
with a share close to 37%. While dailies increased by 8%, magazines as a medium failed to gain advertiser interest for the second year in a row and saw negative growth.
With consumers postponing their purchases post demonetization, leading Print users like FMCG, Auto, Durables and Education did not spend to the usual extent during the last quarter of the year. Print de-grew in November-December on the back of demonetization, and lost almost Rs 580 crore in terms of absolute numbers. However, like TV, if we compare the period January to October, Print grew by 10% (at par with our projections). Nearly 50% of Print’s growth of Rs 1,216 crore is accounted for by four categories - FMCG, Auto, Education and BFSI.
In terms of category contribution, FMCG is the
largest contributor to the Print pie, with a contribution of 15%. Automobiles are the second largest contributor at 14%, followed by Education (10%). Contribution of e-commerce comes way down with just 3%. The e-commerce category has dropped significantly by 15% to come down to Rs 621 crore in 2016.
While only four categories account for 75% of Television advertising, it takes as many as 14 categories to contribute the same percentage to Print advertising, demonstrating once again that Print is less vulnerable to any category de-growth.
In terms of Volume, Hindi publications continue to be ahead of English publications contributing 35% of the total volume while English publications contribute only 26%. But in terms of growth of volume, English publications have grown by 8% while Hindi publications grew by only 3%. Kannada, Bengali and Punjabi publications show substantial increase in volume, but Gujarati and Tamil publications show a decline of 6%.
14
15
10.9%7%
9.5%
2013 2014 2015 2016 2017PROJECTED
GROWTH
`3,050`3,970
`5,120`7,315
`9,144GROWTH %
YE
AR
LY
SP
EN
DS
(R
s C
RO
RE
)
`5,889 cr
`3,255 cr
TOTAL INTERNETEXCLUDING SEARCH
2017 PROJECTED
TOTAL INTERNETSPENDS ON SEARCH
2017 PROJECTED
32% 30% 29%
43%
DIGITAL
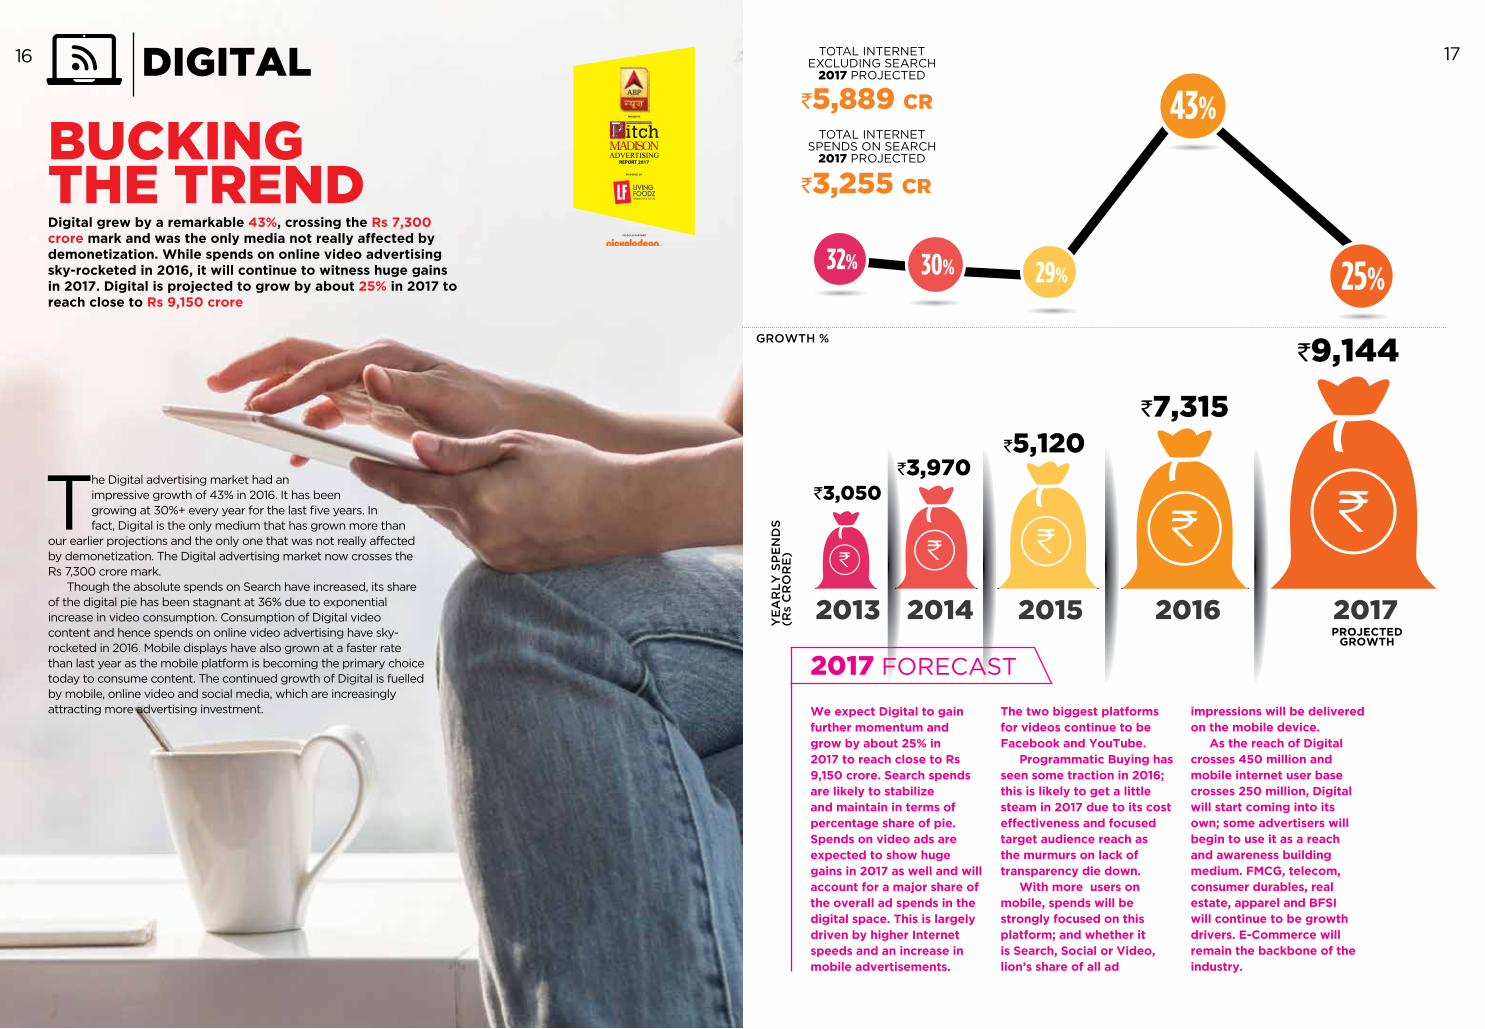
BUCKING THE TRENDDigital grew by a remarkable 43%, crossing the Rs 7,300 crore mark and was the only media not really affected by demonetization. While spends on online video advertising sky-rocketed in 2016, it will continue to witness huge gains in 2017. Digital is projected to grow by about 25% in 2017 to reach close to Rs 9,150 crore
The Digital advertising market had an impressive growth of 43% in 2016. It has been growing at 30%+ every year for the last five years. In fact, Digital is the only medium that has grown more than
our earlier projections and the only one that was not really affected by demonetization. The Digital advertising market now crosses the Rs 7,300 crore mark.
Though the absolute spends on Search have increased, its share of the digital pie has been stagnant at 36% due to exponential increase in video consumption. Consumption of Digital video content and hence spends on online video advertising have sky-rocketed in 2016. Mobile displays have also grown at a faster rate than last year as the mobile platform is becoming the primary choice today to consume content. The continued growth of Digital is fuelled by mobile, online video and social media, which are increasingly attracting more advertising investment. We expect Digital to gain
further momentum and grow by about 25% in 2017 to reach close to Rs 9,150 crore. Search spends are likely to stabilize and maintain in terms of percentage share of pie. Spends on video ads are expected to show huge gains in 2017 as well and will account for a major share of the overall ad spends in the digital space. This is largely driven by higher Internet speeds and an increase in mobile advertisements.
The two biggest platforms for videos continue to be Facebook and YouTube.
Programmatic Buying has seen some traction in 2016; this is likely to get a little steam in 2017 due to its cost effectiveness and focused target audience reach as the murmurs on lack of transparency die down.
With more users on mobile, spends will be strongly focused on this platform; and whether it is Search, Social or Video, lion’s share of all ad
impressions will be delivered on the mobile device.
As the reach of Digital crosses 450 million and mobile internet user base crosses 250 million, Digital will start coming into its own; some advertisers will begin to use it as a reach and awareness building medium. FMCG, telecom, consumer durables, real estate, apparel and BFSI will continue to be growth drivers. E-Commerce will remain the backbone of the industry.
2017 FORECAST
16 17
25%
2013 2014 2015 2016 2017PROJECTED GROWTH
`1,097`1,285
`1,545`1,749
`2,008GROWTH %
YE
AR
LY
SP
EN
DS
(R
s C
RO
RE
)
RADIO
GROWTH IS IN THE AIR
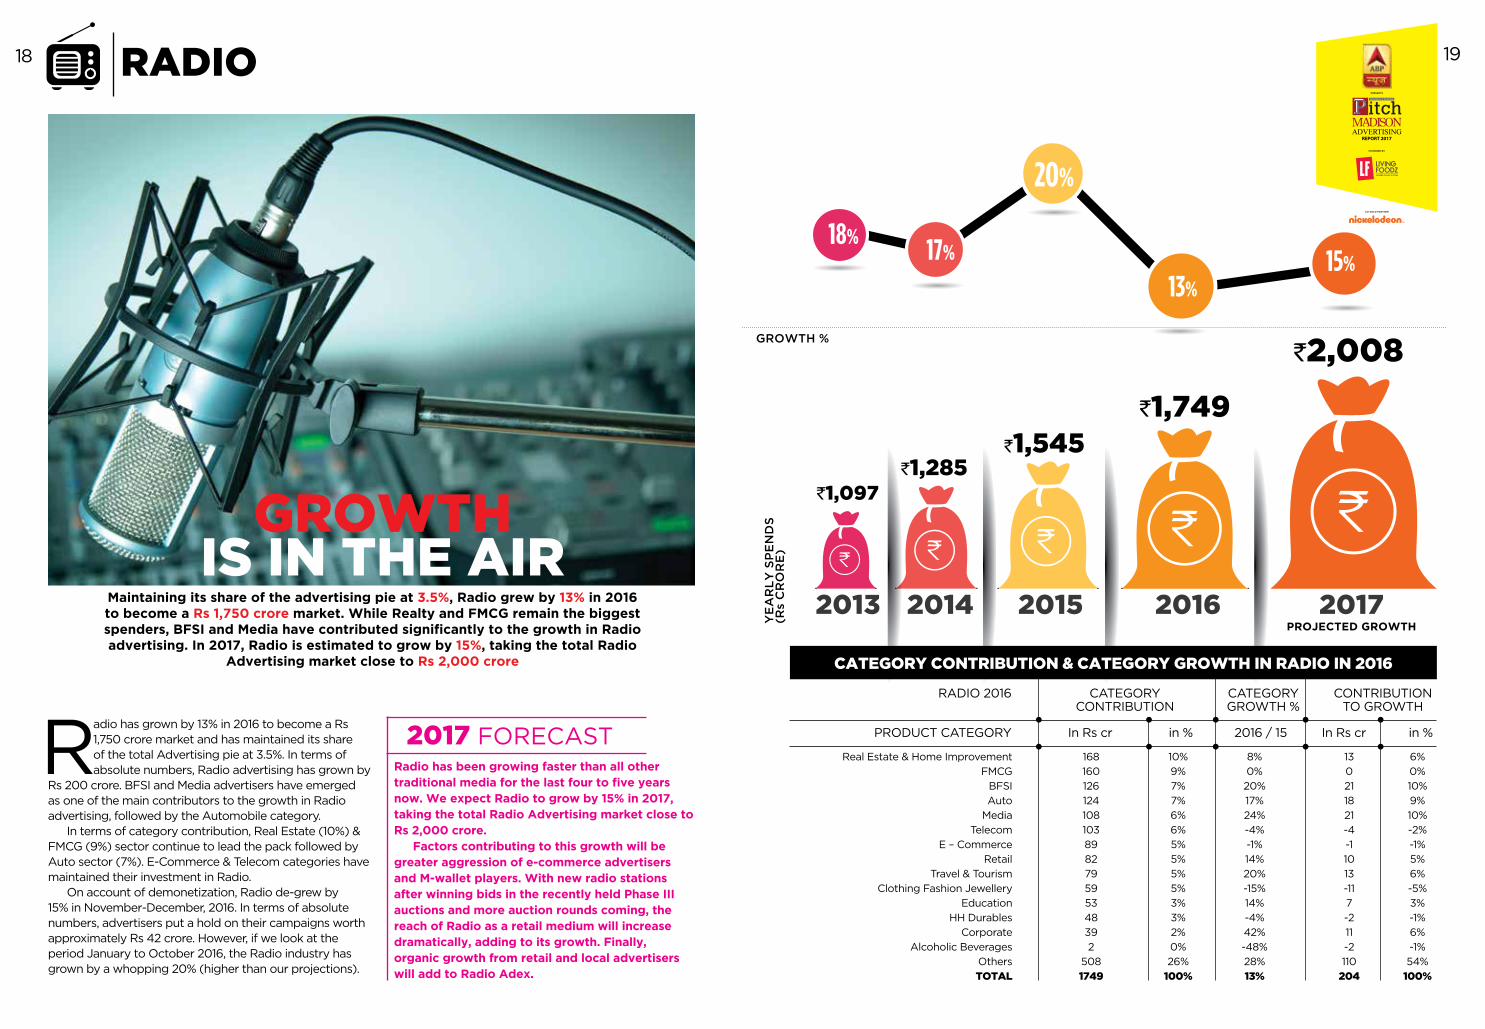
Maintaining its share of the advertising pie at 3.5%, Radio grew by 13% in 2016 to become a Rs 1,750 crore market. While Realty and FMCG remain the biggest spenders, BFSI and Media have contributed significantly to the growth in Radio advertising. In 2017, Radio is estimated to grow by 15%, taking the total Radio
Advertising market close to Rs 2,000 crore
Radio has grown by 13% in 2016 to become a Rs 1,750 crore market and has maintained its share of the total Advertising pie at 3.5%. In terms of absolute numbers, Radio advertising has grown by
Rs 200 crore. BFSI and Media advertisers have emerged as one of the main contributors to the growth in Radio advertising, followed by the Automobile category.
In terms of category contribution, Real Estate (10%) & FMCG (9%) sector continue to lead the pack followed by Auto sector (7%). E-Commerce & Telecom categories have maintained their investment in Radio.
On account of demonetization, Radio de-grew by 15% in November-December, 2016. In terms of absolute numbers, advertisers put a hold on their campaigns worth approximately Rs 42 crore. However, if we look at the period January to October 2016, the Radio industry has grown by a whopping 20% (higher than our projections).
Radio has been growing faster than all other traditional media for the last four to five years now. We expect Radio to grow by 15% in 2017, taking the total Radio Advertising market close to Rs 2,000 crore.
Factors contributing to this growth will be greater aggression of e-commerce advertisers and M-wallet players. With new radio stations after winning bids in the recently held Phase III auctions and more auction rounds coming, the reach of Radio as a retail medium will increase dramatically, adding to its growth. Finally, organic growth from retail and local advertisers will add to Radio Adex.
2017 FORECAST
CATEGORY CONTRIBUTION & CATEGORY GROWTH IN RADIO IN 2016
Real Estate & Home Improvement
FMCG
BFSI
Auto
Media
Telecom
E – Commerce
Retail
Travel & Tourism
Clothing Fashion Jewellery
Education
HH Durables
Corporate
Alcoholic Beverages
Others
TOTAL
168
160
126
124
108
103
89
82
79
59
53
48
39
2
508
1749
10%
9%
7%
7%
6%
6%
5%
5%
5%
5%
3%
3%
2%
0%
26%
100%
8%
0%
20%
17%
24%
-4%
-1%
14%
20%
-15%
14%
-4%
42%
-48%
28%
13%
13
0
21
18
21
-4
-1
10
13
-11
7
-2
11
-2
110
204
6%
0%
10%
9%
10%
-2%
-1%
5%
6%
-5%
3%
-1%
6%
-1%
54%
100%
RADIO 2016
PRODUCT CATEGORY
CATEGORY CONTRIBUTION
in %
CATEGORY GROWTH %
2016 / 15
CONTRIBUTION TO GROWTH
in %In Rs crIn Rs cr
18 19
18%17%
20%
13%15%
2013 2014 2015 2016 2017PROJECTED
GROWTH
`2,027`2,333
`2,665`2,910
`3,234GROWTH %
YE
AR
LY
SP
EN
DS
(R
s C
RO
RE
)
8.8%
15.1%
14.2%
9%
11%
OOH
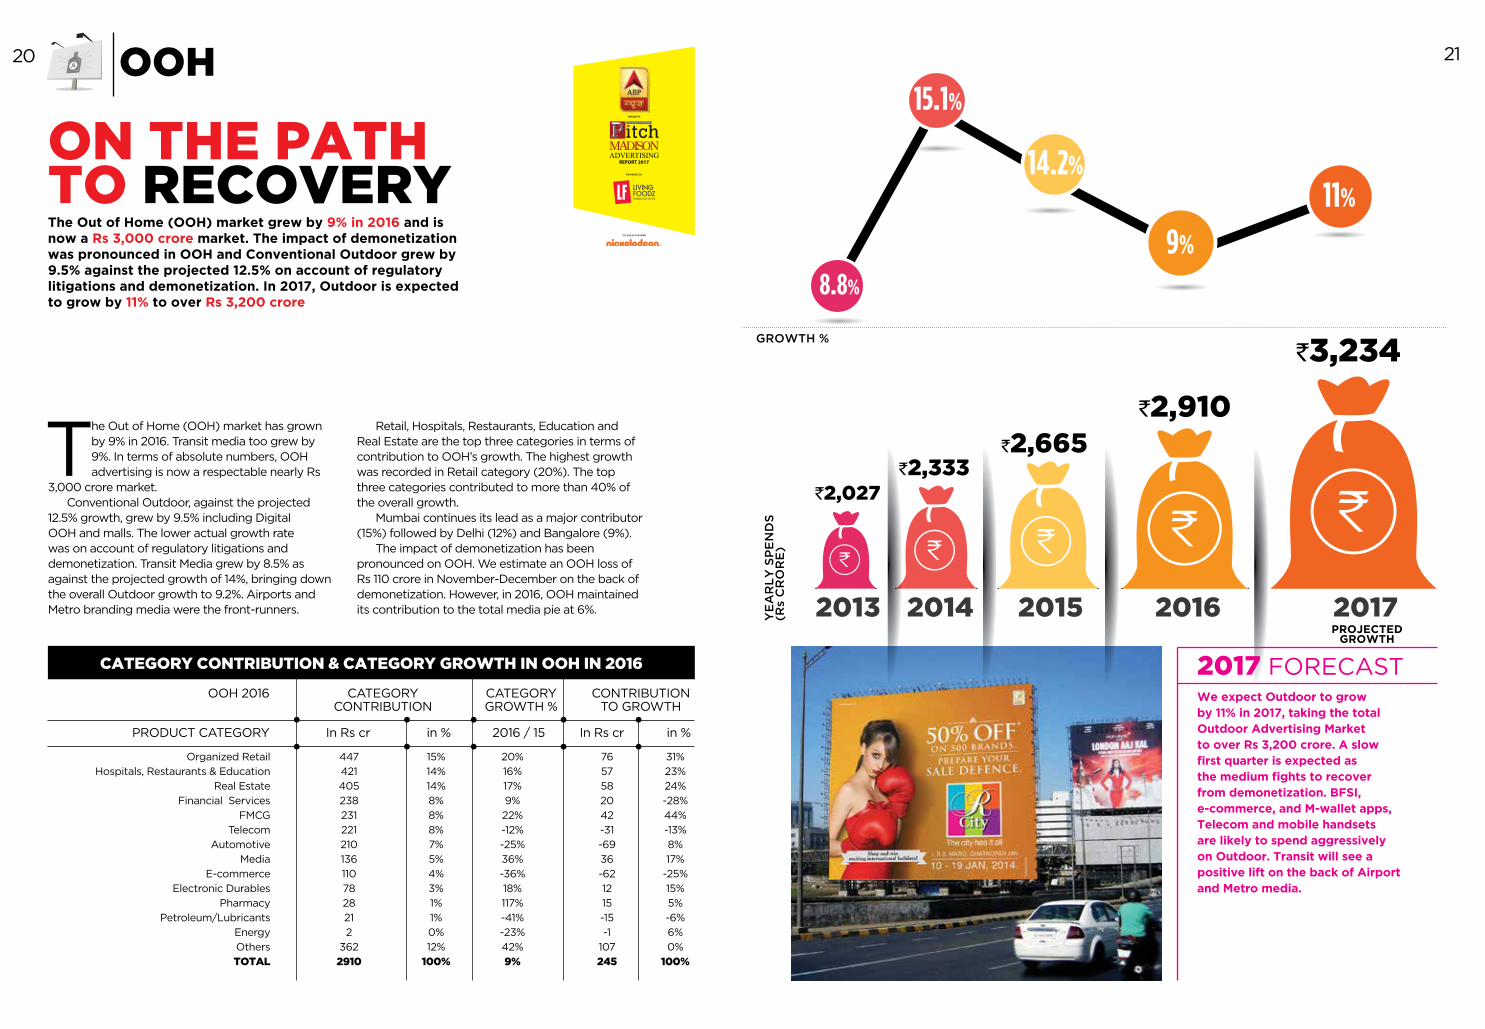
ON THE PATH TO RECOVERY The Out of Home (OOH) market grew by 9% in 2016 and is now a Rs 3,000 crore market. The impact of demonetization was pronounced in OOH and Conventional Outdoor grew by 9.5% against the projected 12.5% on account of regulatory litigations and demonetization. In 2017, Outdoor is expected to grow by 11% to over Rs 3,200 crore
The Out of Home (OOH) market has grown by 9% in 2016. Transit media too grew by 9%. In terms of absolute numbers, OOH advertising is now a respectable nearly Rs
3,000 crore market. Conventional Outdoor, against the projected
12.5% growth, grew by 9.5% including Digital OOH and malls. The lower actual growth rate was on account of regulatory litigations and demonetization. Transit Media grew by 8.5% as against the projected growth of 14%, bringing down the overall Outdoor growth to 9.2%. Airports and Metro branding media were the front-runners.
Retail, Hospitals, Restaurants, Education and Real Estate are the top three categories in terms of contribution to OOH’s growth. The highest growth was recorded in Retail category (20%). The top three categories contributed to more than 40% of the overall growth.
Mumbai continues its lead as a major contributor (15%) followed by Delhi (12%) and Bangalore (9%).
The impact of demonetization has been pronounced on OOH. We estimate an OOH loss of Rs 110 crore in November-December on the back of demonetization. However, in 2016, OOH maintained its contribution to the total media pie at 6%.
CATEGORY CONTRIBUTION & CATEGORY GROWTH IN OOH IN 2016
Organized Retail
Hospitals, Restaurants & Education
Real Estate
Financial Services
FMCG
Telecom
Automotive
Media
E-commerce
Electronic Durables
Pharmacy
Petroleum/Lubricants
Energy
Others
TOTAL
447
421
405
238
231
221
210
136
110
78
28
21
2
362
2910
15%
14%
14%
8%
8%
8%
7%
5%
4%
3%
1%
1%
0%
12%
100%
20%
16%
17%
9%
22%
-12%
-25%
36%
-36%
18%
117%
-41%
-23%
42%
9%
76
57
58
20
42
-31
-69
36
-62
12
15
-15
-1
107
245
31%
23%
24%
-28%
44%
-13%
8%
17%
-25%
15%
5%
-6%
6%
0%
100%
OOH 2016
PRODUCT CATEGORY
CATEGORY CONTRIBUTION
in %
CATEGORY GROWTH %
2016 / 15
CONTRIBUTION TO GROWTH
in %In Rs crIn Rs cr
We expect Outdoor to grow by 11% in 2017, taking the total Outdoor Advertising Market to over Rs 3,200 crore. A slow first quarter is expected as the medium fights to recover from demonetization. BFSI, e-commerce, and M-wallet apps, Telecom and mobile handsets are likely to spend aggressively on Outdoor. Transit will see a positive lift on the back of Airport and Metro media.
2017 FORECAST
20 21
2013 2014 2015 2016 2017PROJECTED
GROWTH
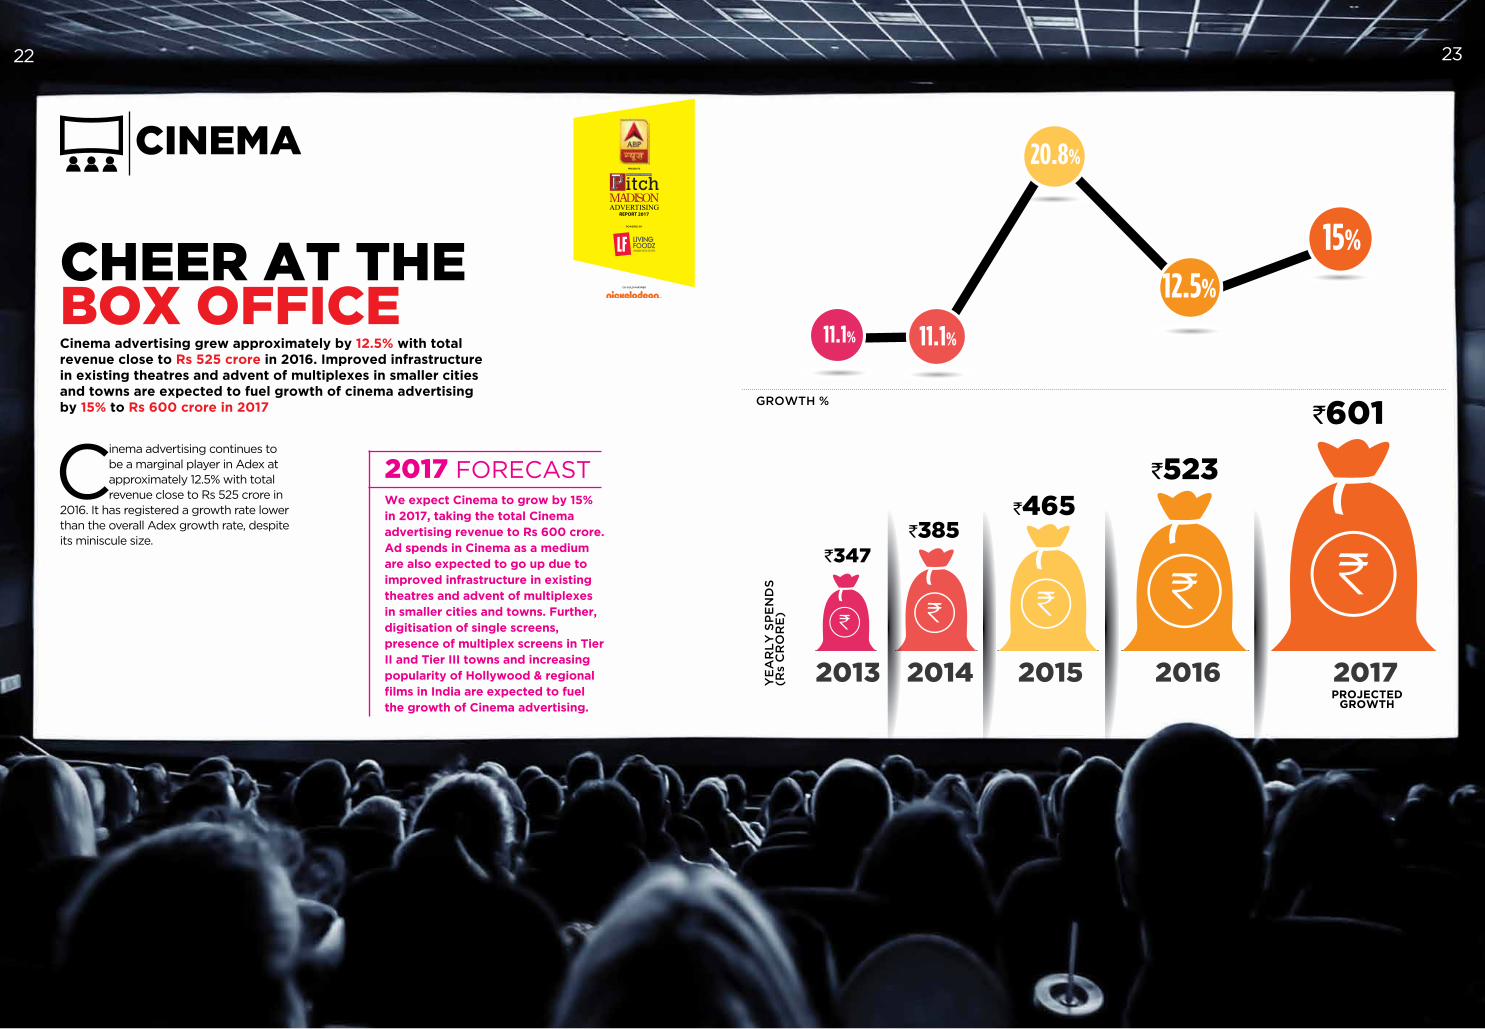
`347`385
`465`523
`601GROWTH %
YE
AR
LY
SP
EN
DS
(R
s C
RO
RE
)
CINEMA
CHEER AT THE BOX OFFICECinema advertising grew approximately by 12.5% with total revenue close to Rs 525 crore in 2016. Improved infrastructure in existing theatres and advent of multiplexes in smaller cities and towns are expected to fuel growth of cinema advertising by 15% to Rs 600 crore in 2017
Cinema advertising continues to be a marginal player in Adex at approximately 12.5% with total revenue close to Rs 525 crore in
2016. It has registered a growth rate lower than the overall Adex growth rate, despite its miniscule size.
We expect Cinema to grow by 15% in 2017, taking the total Cinema advertising revenue to Rs 600 crore. Ad spends in Cinema as a medium are also expected to go up due to improved infrastructure in existing theatres and advent of multiplexes in smaller cities and towns. Further, digitisation of single screens, presence of multiplex screens in Tier II and Tier III towns and increasing popularity of Hollywood & regional films in India are expected to fuel the growth of Cinema advertising.
2017 FORECAST
22 23
11.1% 11.1%
20.8%
12.5%
15%
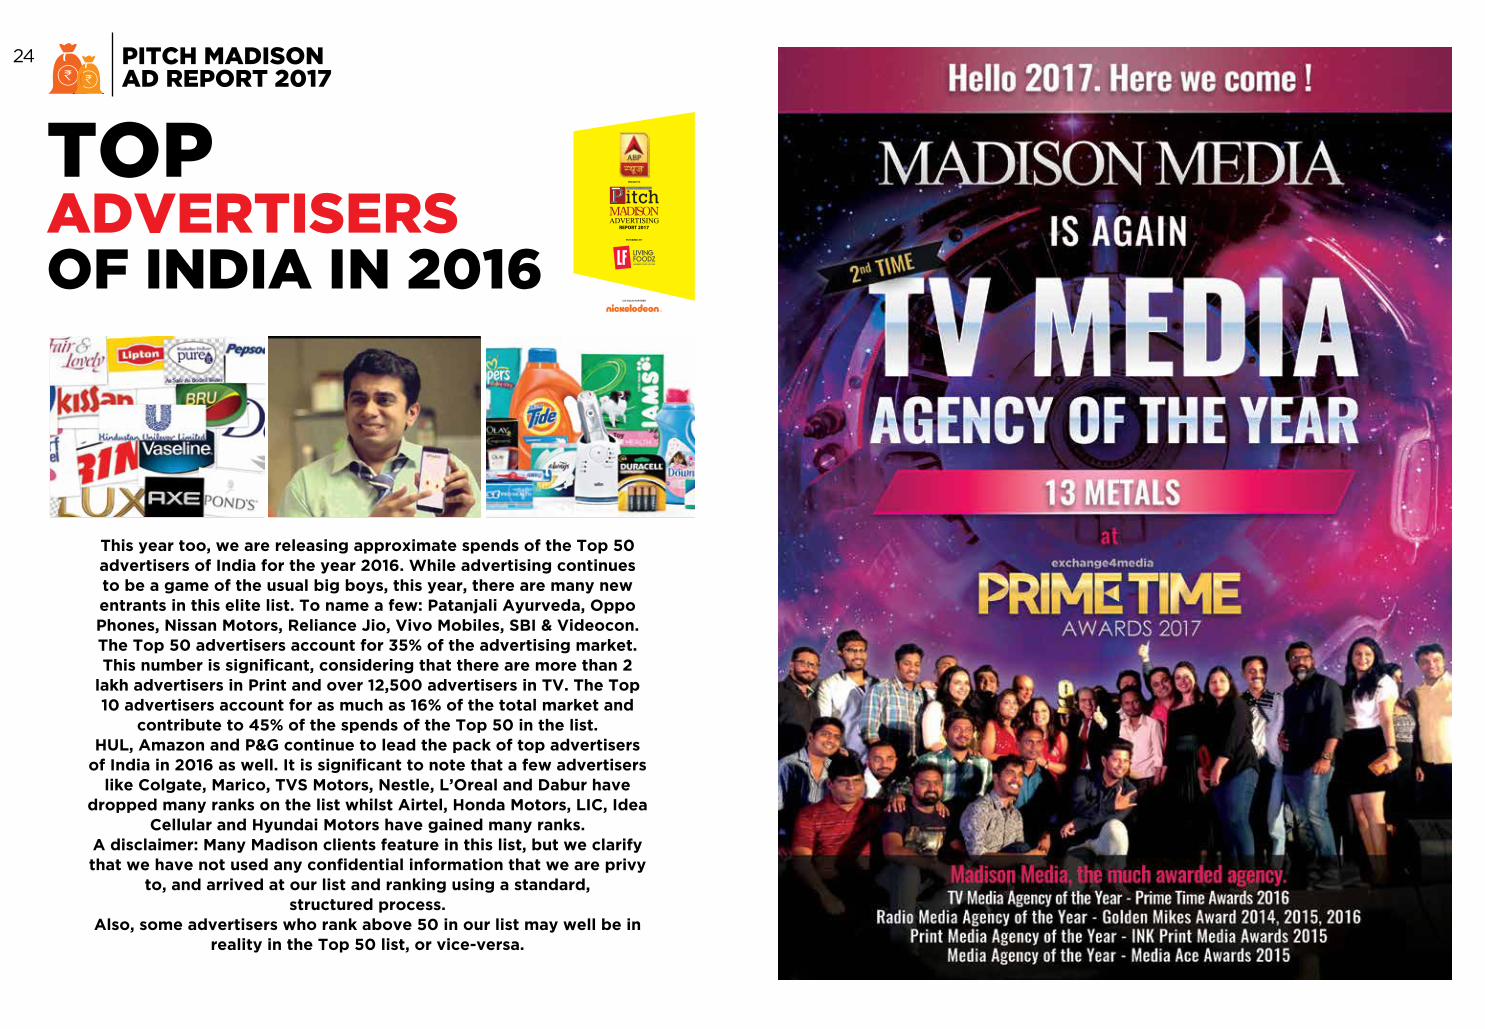
This year too, we are releasing approximate spends of the Top 50 advertisers of India for the year 2016. While advertising continues to be a game of the usual big boys, this year, there are many new entrants in this elite list. To name a few: Patanjali Ayurveda, Oppo Phones, Nissan Motors, Reliance Jio, Vivo Mobiles, SBI & Videocon.The Top 50 advertisers account for 35% of the advertising market. This number is significant, considering that there are more than 2
lakh advertisers in Print and over 12,500 advertisers in TV. The Top 10 advertisers account for as much as 16% of the total market and
contribute to 45% of the spends of the Top 50 in the list. HUL, Amazon and P&G continue to lead the pack of top advertisers
of India in 2016 as well. It is significant to note that a few advertisers like Colgate, Marico, TVS Motors, Nestle, L’Oreal and Dabur have
dropped many ranks on the list whilst Airtel, Honda Motors, LIC, Idea Cellular and Hyundai Motors have gained many ranks.
A disclaimer: Many Madison clients feature in this list, but we clarify that we have not used any confidential information that we are privy
to, and arrived at our list and ranking using a standard, structured process.
Also, some advertisers who rank above 50 in our list may well be in reality in the Top 50 list, or vice-versa.
TOP ADVERTISERS OF INDIA IN 2016
PITCH MADISON AD REPORT 2017
24
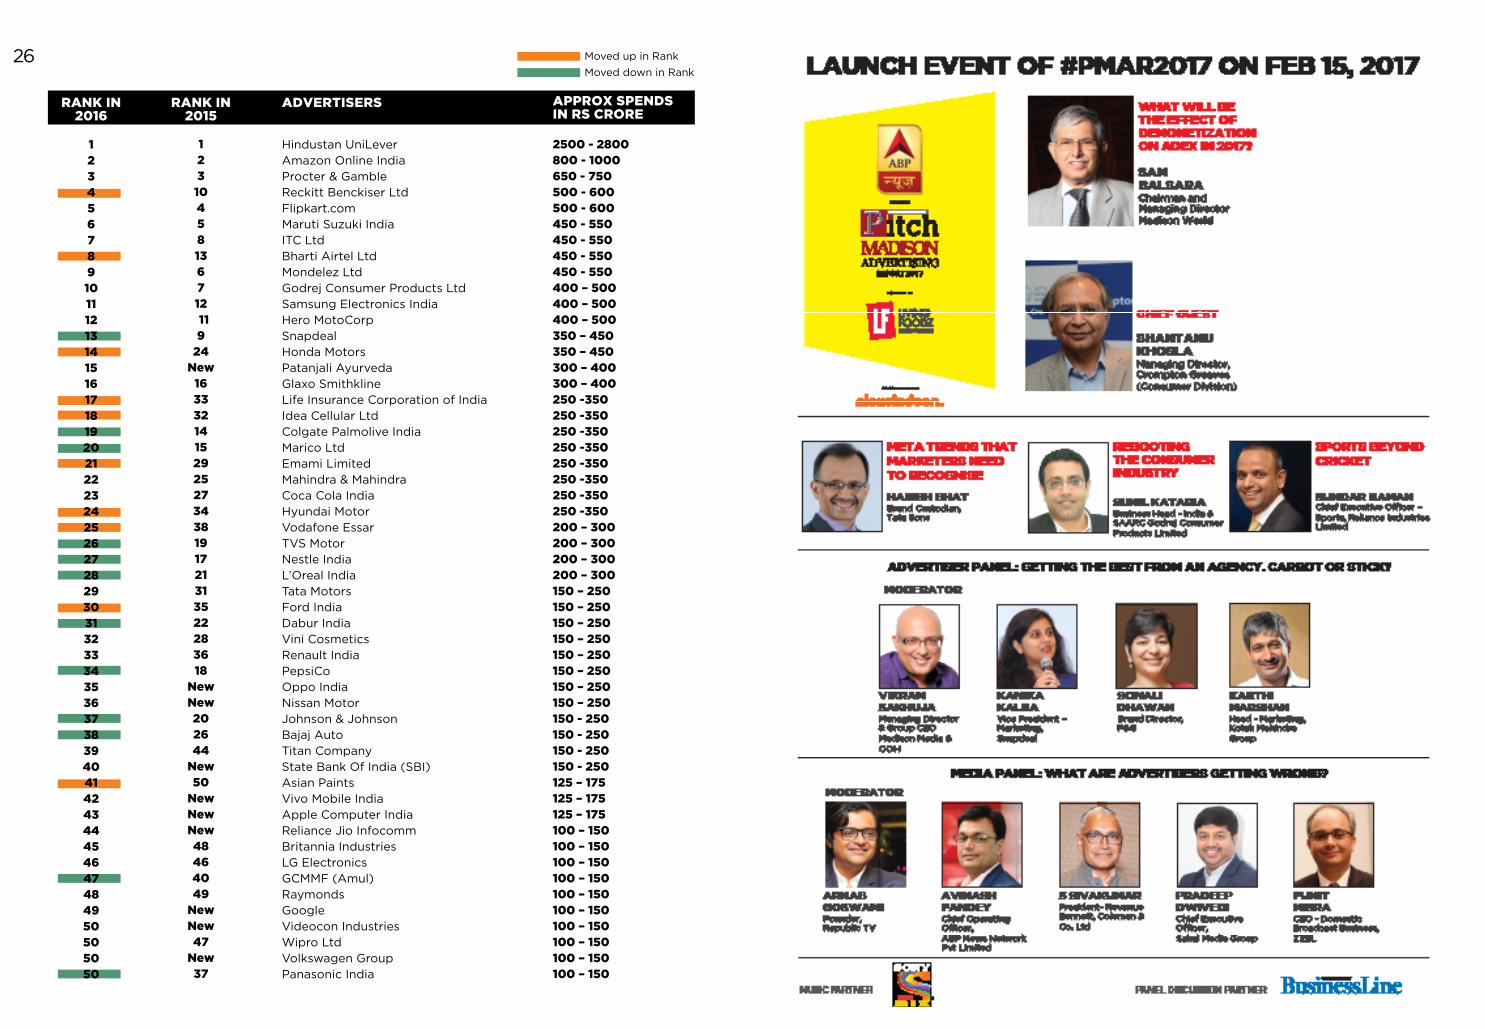
Hindustan UniLeverAmazon Online India Procter & GambleReckitt Benckiser LtdFlipkart.comMaruti Suzuki IndiaITC LtdBharti Airtel LtdMondelez LtdGodrej Consumer Products LtdSamsung Electronics IndiaHero MotoCorpSnapdealHonda MotorsPatanjali AyurvedaGlaxo SmithklineLife Insurance Corporation of IndiaIdea Cellular LtdColgate Palmolive IndiaMarico LtdEmami LimitedMahindra & MahindraCoca Cola IndiaHyundai MotorVodafone EssarTVS MotorNestle IndiaL’Oreal IndiaTata MotorsFord IndiaDabur IndiaVini CosmeticsRenault IndiaPepsiCoOppo IndiaNissan MotorJohnson & JohnsonBajaj AutoTitan CompanyState Bank Of India (SBI)Asian Paints Vivo Mobile IndiaApple Computer IndiaReliance Jio InfocommBritannia IndustriesLG Electronics GCMMF (Amul)RaymondsGoogleVideocon IndustriesWipro LtdVolkswagen Group Panasonic India
2500 - 2800800 - 1000650 - 750500 - 600500 - 600450 - 550450 - 550450 - 550450 - 550400 – 500400 – 500400 – 500350 – 450350 – 450300 – 400300 – 400250 -350250 -350250 -350250 -350250 -350250 -350250 -350250 -350200 – 300200 – 300200 – 300200 – 300150 – 250150 – 250150 – 250150 – 250150 – 250150 – 250150 – 250150 – 250150 - 250150 - 250150 - 250150 - 250125 – 175125 – 175125 – 175100 – 150100 – 150100 – 150100 – 150100 – 150100 – 150100 – 150100 – 150100 – 150100 – 150
12310458136712¬119
24New
16333214152925273438191721313522283618
NewNew202644
New50
NewNewNew48464049
NewNew47
New37
APPROX SPENDS IN RS CRORE
ADVERTISERSRANK IN 2016
RANK IN 2015
1234567891011121314151617181920212223242526272829303132333435363738394041424344454647484950505050
Moved up in Rank
Moved down in Rank26