Embed Size (px)
Citation preview
OECD Science, Technology and Industry Working Papers2000/01
Cross-Border Mergersand Acquisitions: Their Role
in Industrial Globalisation
Nam-Hoon Kang,Sara Johansson
https://dx.doi.org/10.1787/137157251088
Unclassified DSTI/DOC(2000)1
Organisation de Coopération et de Développement Economiques OLIS : 07-Jan-2000Organisation for Economic Co-operation and Development Dist. : 10-Jan-2000__________________________________________________________________________________________
English text onlyDIRECTORATE FOR SCIENCE, TECHNOLOGY AND INDUSTRY
STI WORKING PAPERS2000/1Cross-border Mergers and Acquisitions: Their Role in Industrial Globalisation
Nam-Hoon Kang and Sara Johansson
Unclassified
DST
I/DO
C(2000)1
English
textonly
86036
Document complet disponible sur OLIS dans son format d'origine
Complete document available on OLIS in its original format
DSTI/DOC(2000)1
2
STI Working Paper Series
The Working Paper series of the OECD Directorate for Science, Technology and Industry of the OECD isdesigned to make available to a wider readership selected studies prepared by staff in the Directorate or byoutside consultants working on OECD projects. The papers included in the series are of a technical andanalytical nature and deal with issues of data, methodology and empirical analysis in the areas of work ofthe DSTI. The Working Papers are generally available only in their original language – English orFrench – with a summary in the other.
Comment on the papers is invited, and should be sent to the Directorate for Science, Technology andIndustry, OECD, 2 rue André Pascal, 75775 Paris Cedex 16, France.
The opinions expressed in these papers are the sole responsibility of the author(s) and do not necessarilyreflect those of the OECD or of the governments of its Member countries.
http://www.oecd.org/dsti/sti/prod/sti_wp.htm
Copyright OECD, 2000Applications for permission to reproduce or translate all or part of this material should be made to:Head of Publication Service, OECD, 2 rue André-Pascal, 75775 Paris, Cedex 16, France.
DSTI/DOC(2000)1
3
CROSS-BORDER MERGERS AND ACQUISITIONS: THEIR ROLE IN INDUSTRIALGLOBALISATION
Nam-Hoon Kang and Sara Johansson
This paper examines recent trends and drivers of cross-border mergers and acquisitions (M&As)which grew six-fold in 1991-98 and now account for more than 85% of foreign direct investment. They areprompted by a range of factors, including excess capacity and increased competition in traditionalindustries and new market opportunities in high-technology sectors. However, the main driver of M&As inplace of greenfield investment is the need to acquire complementary intangible assets –technology, humanresources, brand names, etc. In allowing for global industrial restructuring and efficiency gains, cross-border M&As can yield dividends in terms of company performance and profits. The extent to which theyresult in benefits for home and host countries is argued to be strongly influenced by policy frameworks.
--------------------
FUSIONS ET ACQUISITIONS INTERNATIONALES : LEUR ROLE DANS LAMONDIALISATION DE L’INDUSTRIE
Nam-Hoon Kang et Sara Johansson
Le présent document analyse les tendances récentes en matière de fusions et acquisitions (F-A)internationales, ainsi que les éléments moteurs de ces regroupements, qui se sont multipliés par six entre1991 et 1998 pour représenter actuellement plus de 85 % des investissements directs étrangers. Ils résultentd’une série de facteurs, notamment les surcapacités et l’intensification de la concurrence dans les activitéstraditionnelles ainsi que des nouveaux débouchés qui s’offrent dans les secteurs de haute technologie.Toutefois, le principal facteur qui conduit les entreprises à préférer les F-A aux nouveaux investissementsest la nécessité d’acquérir des actifs incorporels complémentaires – technologie, ressources humaines,marques commerciales, etc. Les F-A internationales, qui sont à l’origine d’une restructuration industrielle àl’échelle mondiale et de gains d’efficience, peuvent avoir des effets positifs sur les résultats des entreprises.On fait valoir que les avantages qu’elles peuvent présenter pour les pays d’origine et les pays d’accueildépendent, dans une large mesure, des cadres d’action de ces pays.
DSTI/DOC(2000)1
4
TABLE OF CONTENTS
SUMMARY ....................................................................................................................................................5
INTRODUCTION...........................................................................................................................................6
RECENT TRENDS IN CROSS-BORDER M&As.........................................................................................7
Overall trends...............................................................................................................................................7Inward cross-border M&As .........................................................................................................................9Outward cross-border M&As ....................................................................................................................11
M&As AS AN ENTRY MODE FOR DIRECT INVESTMENT .................................................................14
Modes of inward FDI.................................................................................................................................14Modes of outward FDI...............................................................................................................................18
CROSS-BORDER M&As BY SECTOR ......................................................................................................20
Sectoral trends............................................................................................................................................20Automobiles...............................................................................................................................................21Steel ...........................................................................................................................................................23Telecommunications ..................................................................................................................................24Oil and gas .................................................................................................................................................27Pharmaceuticals .........................................................................................................................................29
THE DRIVING FORCES BEHIND CROSS-BORDER M&As ..................................................................30
Macro-level factors ....................................................................................................................................30Industry-level factors .................................................................................................................................31Firm-level factors.......................................................................................................................................31Technology-related factors ........................................................................................................................32Government-related factors .......................................................................................................................33
PERFORMANCE EFFECTS OF CROSS-BORDER M&As.......................................................................34
CONCLUSIONS ...........................................................................................................................................37
BIBLIOGRAPHY .........................................................................................................................................39
DSTI/DOC(2000)1
5
SUMMARY
Cross-border mergers and acquisitions (M&As) have rapidly increased in recent years, acceleratingthe globalisation of industry and reshaping industrial structure at the international level. In the 1990s, therehas been a marked tendency in foreign direct investment towards mergers and acquisitions rather thengreenfield investment. The value of cross-border M&As grew more than six-fold in the period 1991-98,with an increasing tendency towards very large-scale unions. Although non-OECD countries haveincreased their share of cross-border mergers and acquisitions, they primarily involve OECD countries andfirms. M&As are taking place in a range of industries – including mature manufacturing sectors, high-technology fields and service sectors – and reflect a need to restructure and strengthen globalcompetitiveness in core businesses.
The driving forces underlying the trend to cross-border M&As are complex and vary by sector.Prolonged economic growth in countries such as the United States increases the capital available forindustrial purchases abroad and attracts more inward investment, while the globalisation of financialmarkets is also a factor. In some mature industrial sectors, international competition and market pressuresdue to excess capacity and falling demand are driving restructuring. Technological change, particularly ininformation technology, facilitates the international expansion of firms, which are also seeking to capturenew market opportunities in fast-changing technologies and to pool research and development costs.Enterprises increasingly seek to exploit intangible assets – technology, human resources, brand names –through geographical diversification and acquisition of complementary assets in other countries.Government policies such as investment liberalisation, privatisation and regulatory reform are alsoincreasing the number of and access to industrial targets for acquisition.
Cross-border mergers and acquisitions can yield dividends in terms of company performance andprofits as well as benefits for home and host countries when successful industrial restructuring leads togreater efficiency without undue market concentration. Benefits from such M&As are increasinglyintangible and found in economy-wide spillover effects. They can help revitalise ailing firms and localeconomies and create jobs through the restructuring process, acquisition of technology and productivitygrowth. Yet countries have differed widely in their openness to M&As involving foreign firms. And insome cases, poorly functioning factor and product markets may impede the realisation of the favourableimpacts of M&As in terms of economic growth and job creation. Government policies – in areas such asinvestment, competition, labour and technology – need to promote sufficient flexibility to enable firms toengage in necessary restructuring at the international level.
DSTI/DOC(2000)1
6
INTRODUCTION
Cross-border mergers and acquisitions (M&As), i.e. those taking place between firms of differentnational origin or home countries, have grown rapidly in the 1990s. A merger and acquisition, strictlydefined, occurs when an operating enterprise acquires control over the whole or a part of the business ofanother enterprise. The share of cross-border M&As in overall M&As has increased dramatically in the1990s. While there have long been many M&As targeting SMEs, the 1990s have seen an explosion in, andgeographical widening of, the number and value of mega-mergers among well-known multinationals.Recent examples include the British Petroleum-Amoco and Exxon-Mobil mergers in the petroleumindustry, the Daimler-Benz-Chrysler and Renault-Nissan unions in the automotive industry, the Astra ABand Zeneca Group Plc merger in pharmaceuticals, and the Vodafone Group Plc and AirtouchCommunications merger in telecommunications.
Cross-border M&As must now be included among the fundamental mechanisms of industrialglobalisation. The overwhelming share of flows of foreign direct investment, which are the prime vehiclefor deep-rooted business engagement across international borders, now consists of mergers andacquisitions rather than greenfield investment. This has been accompanied by more diverse forms ofcollaboration between enterprises, such as informal alliances for research and development and otherstrategic purposes. Meanwhile, new channels for globalisation such as electronic commerce aresupplementing more traditional modes of trade and foreign investment. And a wider range of sectors,particularly many service sectors, and countries, increasingly non-OECD countries, are represented in thecurrent wave of industrial globalisation.
This paper aims to increase understanding of the changing patterns of industrial globalisation, thedriving forces behind the recent surge of cross-border M&As, and their impact on industry andimplications for government policies. The study follows up recent OECD/DSTI work on globalisation,which looks at the implications of globalisation for firm and sector performance and examines governmentpolicies implemented to fully realise the benefits of globalisation (OECD, 1999a; 1999b). It alsocomplements the analyses of trends in foreign direct investment (OECD, 1999b) and of the competitionaspects of mergers and acquisitions (OECD, 1988; OECD, 1994) carried out by OECD/DAFFE.
This paper first reviews recent trends in cross-border M&As in terms of value, number andgeographical patterns during the period 1991-98; analyses the modes of entry for direct investments acrosscountries, including cross-border M&As; and examines the main features of international M&As in majorindustries such as the automotive, telecommunications, steel, oil and gas, and pharmaceuticals. The paperproceeds to identify the main driving forces of cross-border M&As, including macro-, industry- and firm-level factors as well as new technologies and government actions. The final section discusses the potentialimpacts of cross-border M&As on firm and industry performance and highlights some implications forgovernment policies.
DSTI/DOC(2000)1
7
RECENT TRENDS IN CROSS-BORDER M&As
Overall trends
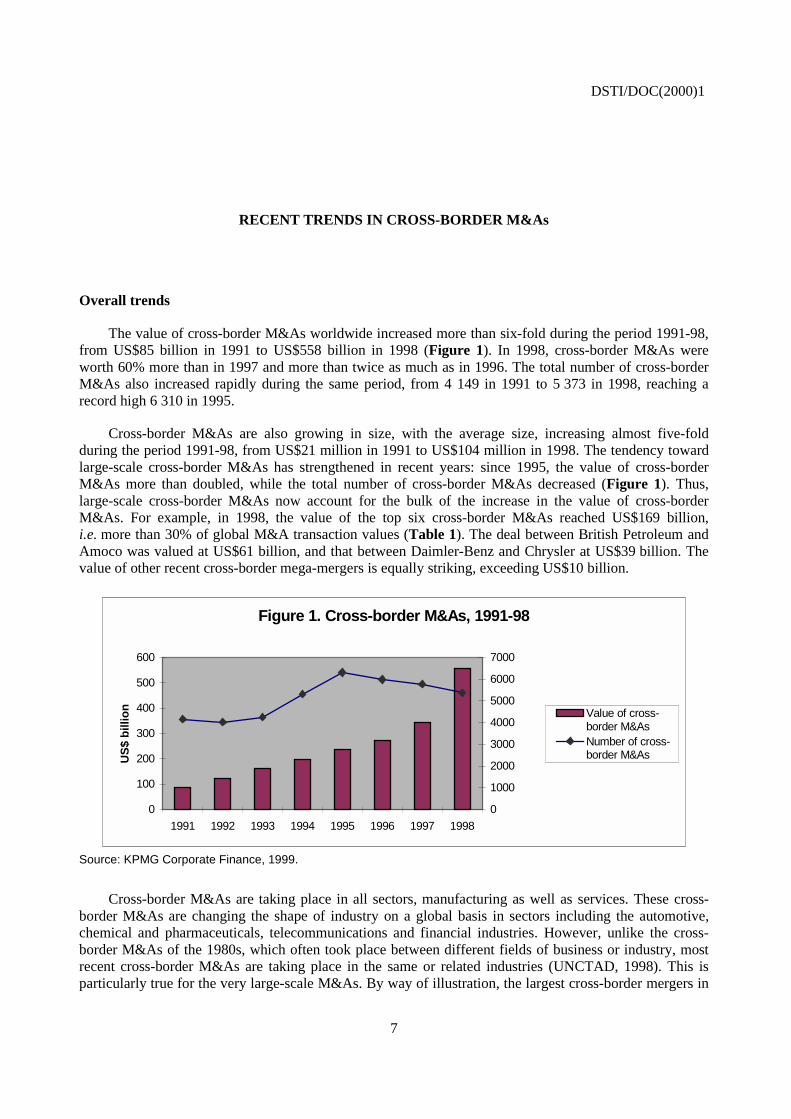
The value of cross-border M&As worldwide increased more than six-fold during the period 1991-98,from US$85 billion in 1991 to US$558 billion in 1998 (Figure 1). In 1998, cross-border M&As wereworth 60% more than in 1997 and more than twice as much as in 1996. The total number of cross-borderM&As also increased rapidly during the same period, from 4 149 in 1991 to 5 373 in 1998, reaching arecord high 6 310 in 1995.
Cross-border M&As are also growing in size, with the average size, increasing almost five-foldduring the period 1991-98, from US$21 million in 1991 to US$104 million in 1998. The tendency towardlarge-scale cross-border M&As has strengthened in recent years: since 1995, the value of cross-borderM&As more than doubled, while the total number of cross-border M&As decreased (Figure 1). Thus,large-scale cross-border M&As now account for the bulk of the increase in the value of cross-borderM&As. For example, in 1998, the value of the top six cross-border M&As reached US$169 billion,i.e. more than 30% of global M&A transaction values (Table 1). The deal between British Petroleum andAmoco was valued at US$61 billion, and that between Daimler-Benz and Chrysler at US$39 billion. Thevalue of other recent cross-border mega-mergers is equally striking, exceeding US$10 billion.
Figure 1. Cross-border M&As, 1991-98
0
100
200
300
400
500
600
1991 1992 1993 1994 1995 1996 1997 1998
US
$b
illio
n
0
1000
2000
3000
4000
5000
6000
7000
Value of cross-border M&AsNumber of cross-border M&As
Source: KPMG Corporate Finance, 1999.
Cross-border M&As are taking place in all sectors, manufacturing as well as services. These cross-border M&As are changing the shape of industry on a global basis in sectors including the automotive,chemical and pharmaceuticals, telecommunications and financial industries. However, unlike the cross-border M&As of the 1980s, which often took place between different fields of business or industry, mostrecent cross-border M&As are taking place in the same or related industries (UNCTAD, 1998). This isparticularly true for the very large-scale M&As. By way of illustration, the largest cross-border mergers in
DSTI/DOC(2000)1
8
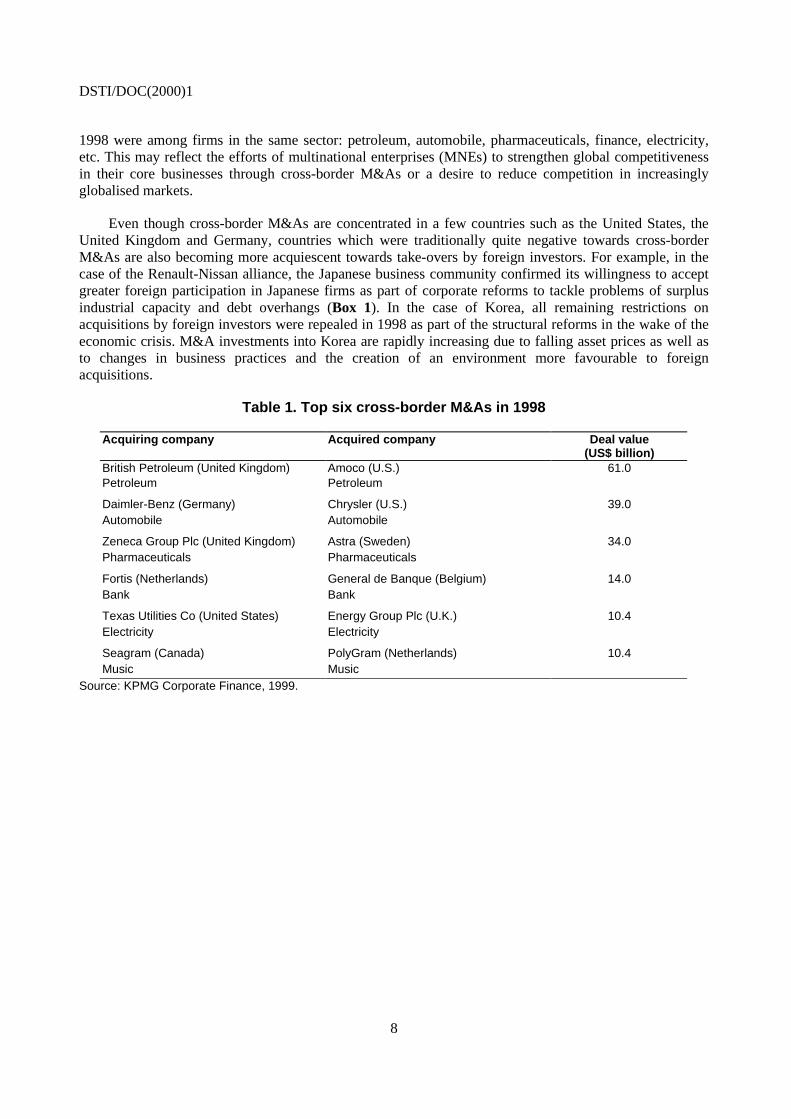
1998 were among firms in the same sector: petroleum, automobile, pharmaceuticals, finance, electricity,etc. This may reflect the efforts of multinational enterprises (MNEs) to strengthen global competitivenessin their core businesses through cross-border M&As or a desire to reduce competition in increasinglyglobalised markets.
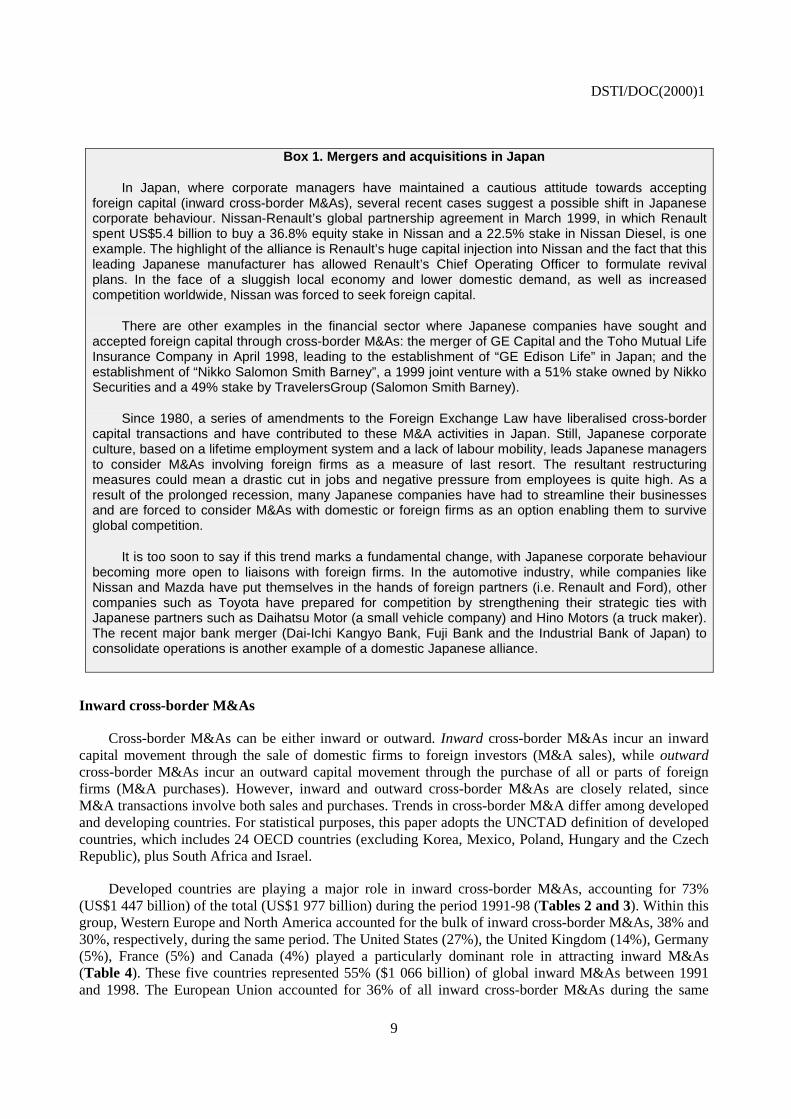
Even though cross-border M&As are concentrated in a few countries such as the United States, theUnited Kingdom and Germany, countries which were traditionally quite negative towards cross-borderM&As are also becoming more acquiescent towards take-overs by foreign investors. For example, in thecase of the Renault-Nissan alliance, the Japanese business community confirmed its willingness to acceptgreater foreign participation in Japanese firms as part of corporate reforms to tackle problems of surplusindustrial capacity and debt overhangs (Box 1). In the case of Korea, all remaining restrictions onacquisitions by foreign investors were repealed in 1998 as part of the structural reforms in the wake of theeconomic crisis. M&A investments into Korea are rapidly increasing due to falling asset prices as well asto changes in business practices and the creation of an environment more favourable to foreignacquisitions.
Table 1. Top six cross-border M&As in 1998
Acquiring company Acquired company Deal value(US$ billion)
British Petroleum (United Kingdom) Amoco (U.S.) 61.0Petroleum Petroleum
Daimler-Benz (Germany) Chrysler (U.S.) 39.0Automobile Automobile
Zeneca Group Plc (United Kingdom) Astra (Sweden) 34.0Pharmaceuticals Pharmaceuticals
Fortis (Netherlands) General de Banque (Belgium) 14.0Bank Bank
Texas Utilities Co (United States) Energy Group Plc (U.K.) 10.4Electricity Electricity
Seagram (Canada) PolyGram (Netherlands) 10.4Music Music
Source: KPMG Corporate Finance, 1999.
DSTI/DOC(2000)1
9
Box 1. Mergers and acquisitions in Japan
In Japan, where corporate managers have maintained a cautious attitude towards acceptingforeign capital (inward cross-border M&As), several recent cases suggest a possible shift in Japanesecorporate behaviour. Nissan-Renault’s global partnership agreement in March 1999, in which Renaultspent US$5.4 billion to buy a 36.8% equity stake in Nissan and a 22.5% stake in Nissan Diesel, is oneexample. The highlight of the alliance is Renault’s huge capital injection into Nissan and the fact that thisleading Japanese manufacturer has allowed Renault’s Chief Operating Officer to formulate revivalplans. In the face of a sluggish local economy and lower domestic demand, as well as increasedcompetition worldwide, Nissan was forced to seek foreign capital.
There are other examples in the financial sector where Japanese companies have sought andaccepted foreign capital through cross-border M&As: the merger of GE Capital and the Toho Mutual LifeInsurance Company in April 1998, leading to the establishment of “GE Edison Life” in Japan; and theestablishment of “Nikko Salomon Smith Barney”, a 1999 joint venture with a 51% stake owned by NikkoSecurities and a 49% stake by TravelersGroup (Salomon Smith Barney).
Since 1980, a series of amendments to the Foreign Exchange Law have liberalised cross-bordercapital transactions and have contributed to these M&A activities in Japan. Still, Japanese corporateculture, based on a lifetime employment system and a lack of labour mobility, leads Japanese managersto consider M&As involving foreign firms as a measure of last resort. The resultant restructuringmeasures could mean a drastic cut in jobs and negative pressure from employees is quite high. As aresult of the prolonged recession, many Japanese companies have had to streamline their businessesand are forced to consider M&As with domestic or foreign firms as an option enabling them to surviveglobal competition.
It is too soon to say if this trend marks a fundamental change, with Japanese corporate behaviourbecoming more open to liaisons with foreign firms. In the automotive industry, while companies likeNissan and Mazda have put themselves in the hands of foreign partners (i.e. Renault and Ford), othercompanies such as Toyota have prepared for competition by strengthening their strategic ties withJapanese partners such as Daihatsu Motor (a small vehicle company) and Hino Motors (a truck maker).The recent major bank merger (Dai-Ichi Kangyo Bank, Fuji Bank and the Industrial Bank of Japan) toconsolidate operations is another example of a domestic Japanese alliance.
Inward cross-border M&As
Cross-border M&As can be either inward or outward. Inward cross-border M&As incur an inwardcapital movement through the sale of domestic firms to foreign investors (M&A sales), while outwardcross-border M&As incur an outward capital movement through the purchase of all or parts of foreignfirms (M&A purchases). However, inward and outward cross-border M&As are closely related, sinceM&A transactions involve both sales and purchases. Trends in cross-border M&A differ among developedand developing countries. For statistical purposes, this paper adopts the UNCTAD definition of developedcountries, which includes 24 OECD countries (excluding Korea, Mexico, Poland, Hungary and the CzechRepublic), plus South Africa and Israel.
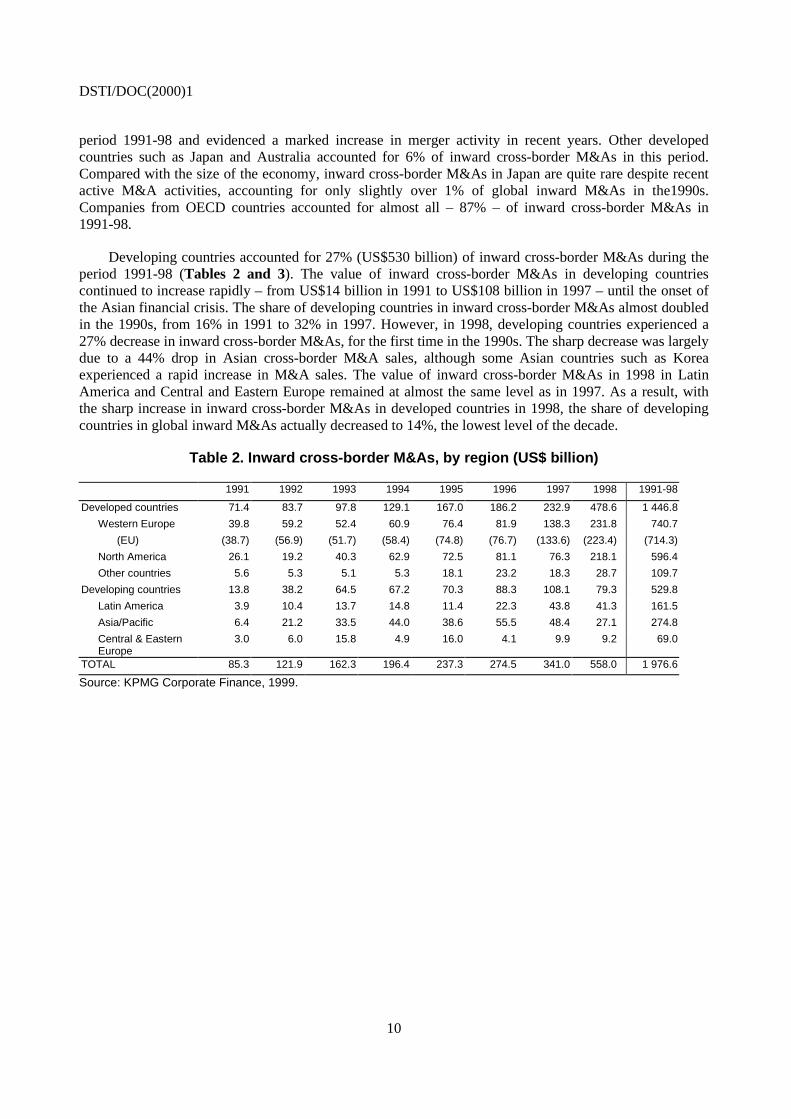
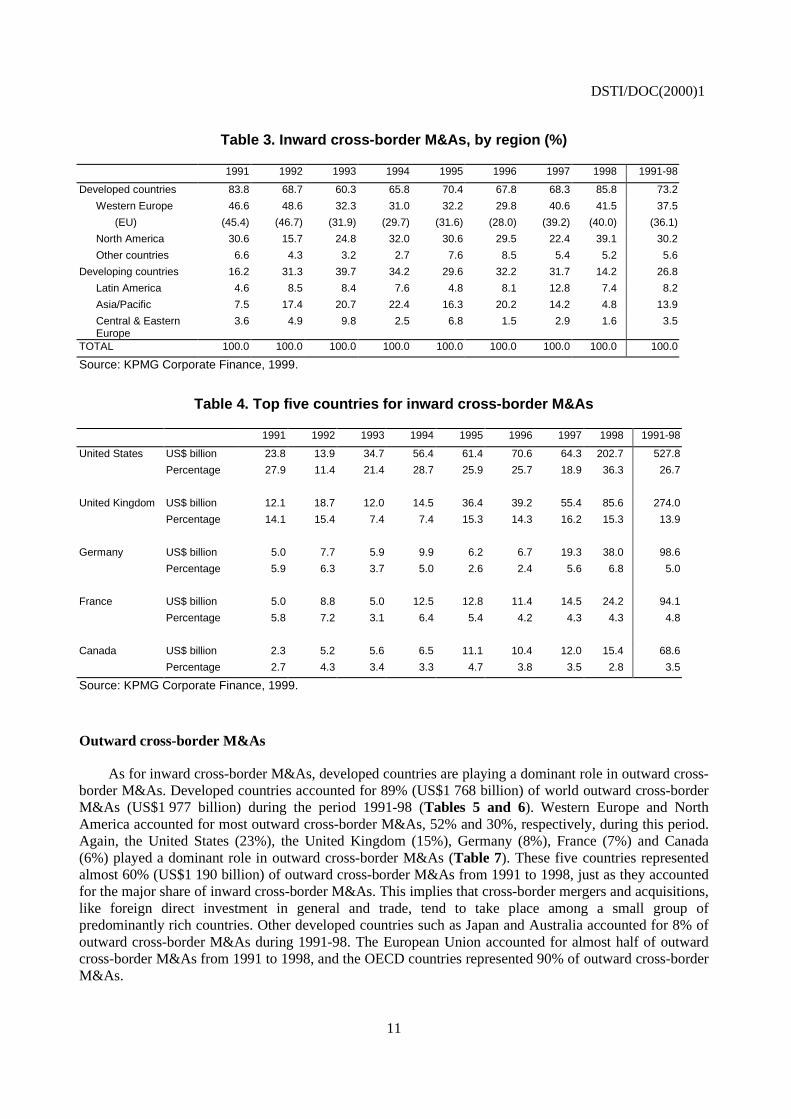
Developed countries are playing a major role in inward cross-border M&As, accounting for 73%(US$1 447 billion) of the total (US$1 977 billion) during the period 1991-98 (Tables 2 and 3). Within thisgroup, Western Europe and North America accounted for the bulk of inward cross-border M&As, 38% and30%, respectively, during the same period. The United States (27%), the United Kingdom (14%), Germany(5%), France (5%) and Canada (4%) played a particularly dominant role in attracting inward M&As(Table 4). These five countries represented 55% ($1 066 billion) of global inward M&As between 1991and 1998. The European Union accounted for 36% of all inward cross-border M&As during the same
DSTI/DOC(2000)1
10
period 1991-98 and evidenced a marked increase in merger activity in recent years. Other developedcountries such as Japan and Australia accounted for 6% of inward cross-border M&As in this period.Compared with the size of the economy, inward cross-border M&As in Japan are quite rare despite recentactive M&A activities, accounting for only slightly over 1% of global inward M&As in the1990s.Companies from OECD countries accounted for almost all – 87% – of inward cross-border M&As in1991-98.
Developing countries accounted for 27% (US$530 billion) of inward cross-border M&As during theperiod 1991-98 (Tables 2 and 3). The value of inward cross-border M&As in developing countriescontinued to increase rapidly – from US$14 billion in 1991 to US$108 billion in 1997 – until the onset ofthe Asian financial crisis. The share of developing countries in inward cross-border M&As almost doubledin the 1990s, from 16% in 1991 to 32% in 1997. However, in 1998, developing countries experienced a27% decrease in inward cross-border M&As, for the first time in the 1990s. The sharp decrease was largelydue to a 44% drop in Asian cross-border M&A sales, although some Asian countries such as Koreaexperienced a rapid increase in M&A sales. The value of inward cross-border M&As in 1998 in LatinAmerica and Central and Eastern Europe remained at almost the same level as in 1997. As a result, withthe sharp increase in inward cross-border M&As in developed countries in 1998, the share of developingcountries in global inward M&As actually decreased to 14%, the lowest level of the decade.
Table 2. Inward cross-border M&As, by region (US$ billion)
1991 1992 1993 1994 1995 1996 1997 1998 1991-98
Developed countries 71.4 83.7 97.8 129.1 167.0 186.2 232.9 478.6 1 446.8
Western Europe 39.8 59.2 52.4 60.9 76.4 81.9 138.3 231.8 740.7
(EU) (38.7) (56.9) (51.7) (58.4) (74.8) (76.7) (133.6) (223.4) (714.3)
North America 26.1 19.2 40.3 62.9 72.5 81.1 76.3 218.1 596.4
Other countries 5.6 5.3 5.1 5.3 18.1 23.2 18.3 28.7 109.7
Developing countries 13.8 38.2 64.5 67.2 70.3 88.3 108.1 79.3 529.8
Latin America 3.9 10.4 13.7 14.8 11.4 22.3 43.8 41.3 161.5
Asia/Pacific 6.4 21.2 33.5 44.0 38.6 55.5 48.4 27.1 274.8
Central & EasternEurope
3.0 6.0 15.8 4.9 16.0 4.1 9.9 9.2 69.0
TOTAL 85.3 121.9 162.3 196.4 237.3 274.5 341.0 558.0 1 976.6
Source: KPMG Corporate Finance, 1999.
DSTI/DOC(2000)1
11
Table 3. Inward cross-border M&As, by region (%)
1991 1992 1993 1994 1995 1996 1997 1998 1991-98
Developed countries 83.8 68.7 60.3 65.8 70.4 67.8 68.3 85.8 73.2
Western Europe 46.6 48.6 32.3 31.0 32.2 29.8 40.6 41.5 37.5
(EU) (45.4) (46.7) (31.9) (29.7) (31.6) (28.0) (39.2) (40.0) (36.1)
North America 30.6 15.7 24.8 32.0 30.6 29.5 22.4 39.1 30.2
Other countries 6.6 4.3 3.2 2.7 7.6 8.5 5.4 5.2 5.6
Developing countries 16.2 31.3 39.7 34.2 29.6 32.2 31.7 14.2 26.8
Latin America 4.6 8.5 8.4 7.6 4.8 8.1 12.8 7.4 8.2
Asia/Pacific 7.5 17.4 20.7 22.4 16.3 20.2 14.2 4.8 13.9
Central & EasternEurope
3.6 4.9 9.8 2.5 6.8 1.5 2.9 1.6 3.5
TOTAL 100.0 100.0 100.0 100.0 100.0 100.0 100.0 100.0 100.0
Source: KPMG Corporate Finance, 1999.
Table 4. Top five countries for inward cross-border M&As
1991 1992 1993 1994 1995 1996 1997 1998 1991-98
United States US$ billion 23.8 13.9 34.7 56.4 61.4 70.6 64.3 202.7 527.8
Percentage 27.9 11.4 21.4 28.7 25.9 25.7 18.9 36.3 26.7
United Kingdom US$ billion 12.1 18.7 12.0 14.5 36.4 39.2 55.4 85.6 274.0
Percentage 14.1 15.4 7.4 7.4 15.3 14.3 16.2 15.3 13.9
Germany US$ billion 5.0 7.7 5.9 9.9 6.2 6.7 19.3 38.0 98.6
Percentage 5.9 6.3 3.7 5.0 2.6 2.4 5.6 6.8 5.0
France US$ billion 5.0 8.8 5.0 12.5 12.8 11.4 14.5 24.2 94.1
Percentage 5.8 7.2 3.1 6.4 5.4 4.2 4.3 4.3 4.8
Canada US$ billion 2.3 5.2 5.6 6.5 11.1 10.4 12.0 15.4 68.6
Percentage 2.7 4.3 3.4 3.3 4.7 3.8 3.5 2.8 3.5
Source: KPMG Corporate Finance, 1999.
Outward cross-border M&As
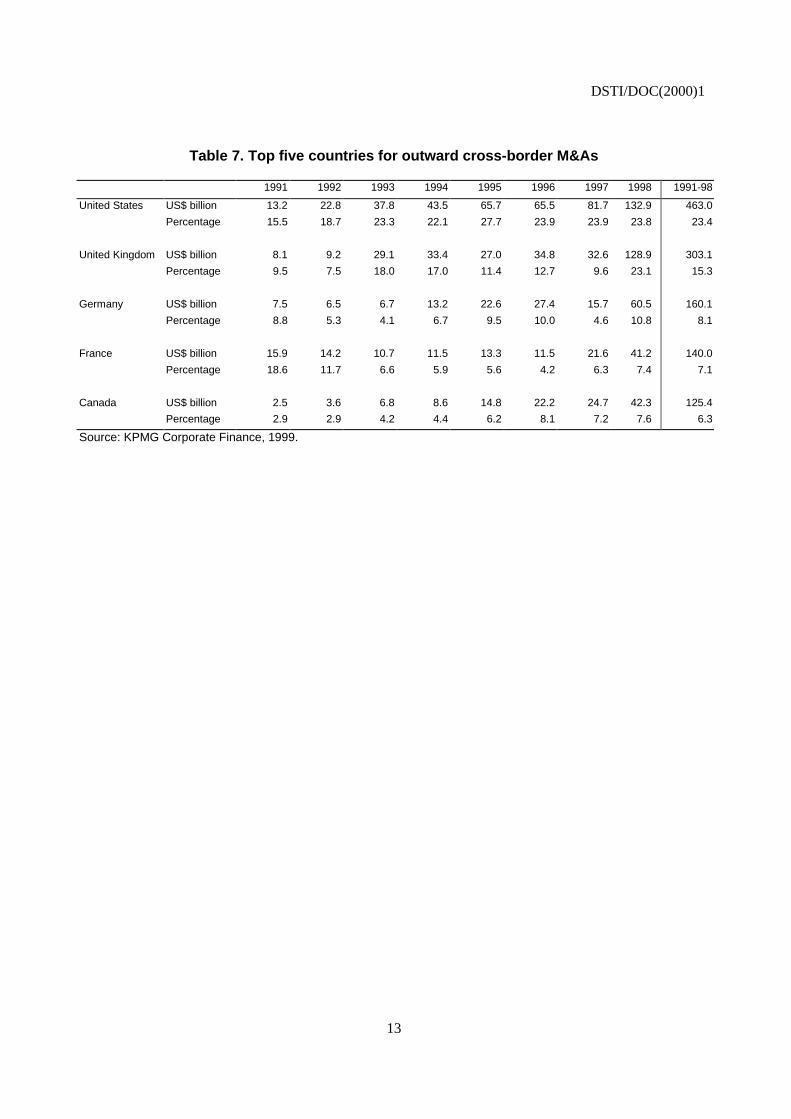
As for inward cross-border M&As, developed countries are playing a dominant role in outward cross-border M&As. Developed countries accounted for 89% (US$1 768 billion) of world outward cross-borderM&As (US$1 977 billion) during the period 1991-98 (Tables 5 and 6). Western Europe and NorthAmerica accounted for most outward cross-border M&As, 52% and 30%, respectively, during this period.Again, the United States (23%), the United Kingdom (15%), Germany (8%), France (7%) and Canada(6%) played a dominant role in outward cross-border M&As (Table 7). These five countries representedalmost 60% (US$1 190 billion) of outward cross-border M&As from 1991 to 1998, just as they accountedfor the major share of inward cross-border M&As. This implies that cross-border mergers and acquisitions,like foreign direct investment in general and trade, tend to take place among a small group ofpredominantly rich countries. Other developed countries such as Japan and Australia accounted for 8% ofoutward cross-border M&As during 1991-98. The European Union accounted for almost half of outwardcross-border M&As from 1991 to 1998, and the OECD countries represented 90% of outward cross-borderM&As.
DSTI/DOC(2000)1
12
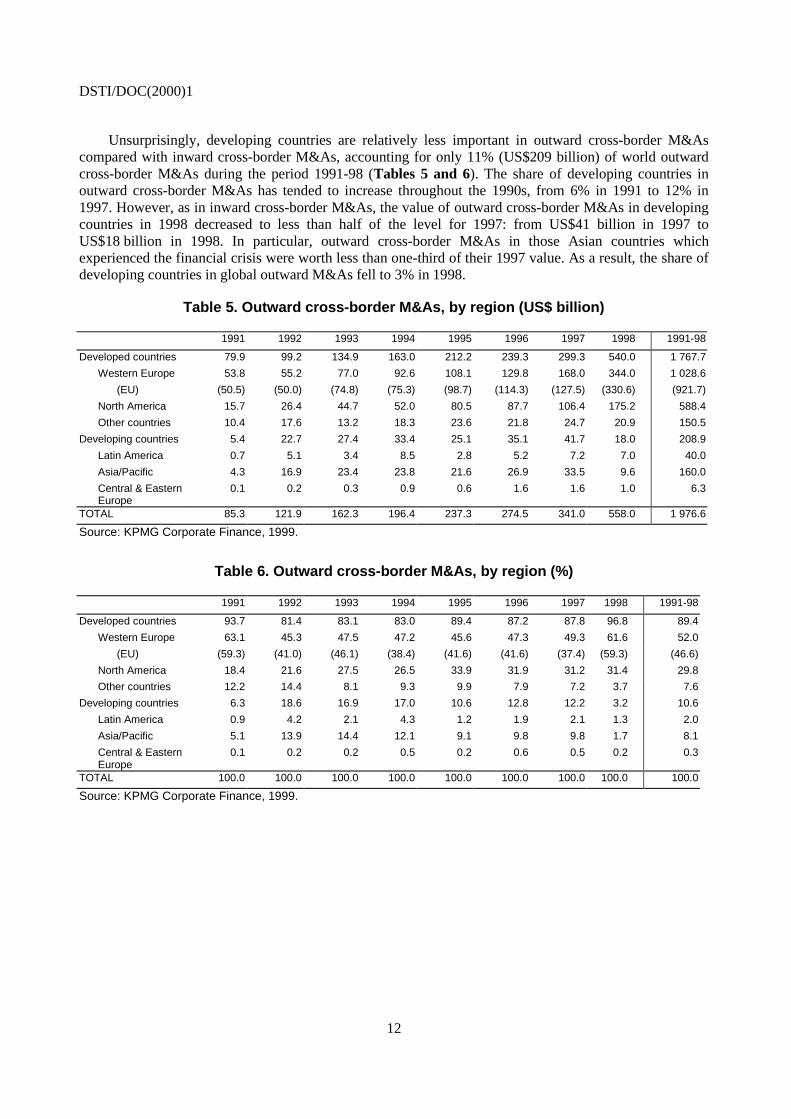
Unsurprisingly, developing countries are relatively less important in outward cross-border M&Ascompared with inward cross-border M&As, accounting for only 11% (US$209 billion) of world outwardcross-border M&As during the period 1991-98 (Tables 5 and 6). The share of developing countries inoutward cross-border M&As has tended to increase throughout the 1990s, from 6% in 1991 to 12% in1997. However, as in inward cross-border M&As, the value of outward cross-border M&As in developingcountries in 1998 decreased to less than half of the level for 1997: from US$41 billion in 1997 toUS$18 billion in 1998. In particular, outward cross-border M&As in those Asian countries whichexperienced the financial crisis were worth less than one-third of their 1997 value. As a result, the share ofdeveloping countries in global outward M&As fell to 3% in 1998.
Table 5. Outward cross-border M&As, by region (US$ billion)
1991 1992 1993 1994 1995 1996 1997 1998 1991-98
Developed countries 79.9 99.2 134.9 163.0 212.2 239.3 299.3 540.0 1 767.7
Western Europe 53.8 55.2 77.0 92.6 108.1 129.8 168.0 344.0 1 028.6
(EU) (50.5) (50.0) (74.8) (75.3) (98.7) (114.3) (127.5) (330.6) (921.7)
North America 15.7 26.4 44.7 52.0 80.5 87.7 106.4 175.2 588.4
Other countries 10.4 17.6 13.2 18.3 23.6 21.8 24.7 20.9 150.5
Developing countries 5.4 22.7 27.4 33.4 25.1 35.1 41.7 18.0 208.9
Latin America 0.7 5.1 3.4 8.5 2.8 5.2 7.2 7.0 40.0
Asia/Pacific 4.3 16.9 23.4 23.8 21.6 26.9 33.5 9.6 160.0
Central & EasternEurope
0.1 0.2 0.3 0.9 0.6 1.6 1.6 1.0 6.3
TOTAL 85.3 121.9 162.3 196.4 237.3 274.5 341.0 558.0 1 976.6
Source: KPMG Corporate Finance, 1999.
Table 6. Outward cross-border M&As, by region (%)
1991 1992 1993 1994 1995 1996 1997 1998 1991-98
Developed countries 93.7 81.4 83.1 83.0 89.4 87.2 87.8 96.8 89.4
Western Europe 63.1 45.3 47.5 47.2 45.6 47.3 49.3 61.6 52.0
(EU) (59.3) (41.0) (46.1) (38.4) (41.6) (41.6) (37.4) (59.3) (46.6)
North America 18.4 21.6 27.5 26.5 33.9 31.9 31.2 31.4 29.8
Other countries 12.2 14.4 8.1 9.3 9.9 7.9 7.2 3.7 7.6
Developing countries 6.3 18.6 16.9 17.0 10.6 12.8 12.2 3.2 10.6
Latin America 0.9 4.2 2.1 4.3 1.2 1.9 2.1 1.3 2.0
Asia/Pacific 5.1 13.9 14.4 12.1 9.1 9.8 9.8 1.7 8.1
Central & EasternEurope
0.1 0.2 0.2 0.5 0.2 0.6 0.5 0.2 0.3
TOTAL 100.0 100.0 100.0 100.0 100.0 100.0 100.0 100.0 100.0
Source: KPMG Corporate Finance, 1999.
DSTI/DOC(2000)1
13
Table 7. Top five countries for outward cross-border M&As
1991 1992 1993 1994 1995 1996 1997 1998 1991-98
United States US$ billion 13.2 22.8 37.8 43.5 65.7 65.5 81.7 132.9 463.0
Percentage 15.5 18.7 23.3 22.1 27.7 23.9 23.9 23.8 23.4
United Kingdom US$ billion 8.1 9.2 29.1 33.4 27.0 34.8 32.6 128.9 303.1
Percentage 9.5 7.5 18.0 17.0 11.4 12.7 9.6 23.1 15.3
Germany US$ billion 7.5 6.5 6.7 13.2 22.6 27.4 15.7 60.5 160.1
Percentage 8.8 5.3 4.1 6.7 9.5 10.0 4.6 10.8 8.1
France US$ billion 15.9 14.2 10.7 11.5 13.3 11.5 21.6 41.2 140.0
Percentage 18.6 11.7 6.6 5.9 5.6 4.2 6.3 7.4 7.1
Canada US$ billion 2.5 3.6 6.8 8.6 14.8 22.2 24.7 42.3 125.4
Percentage 2.9 2.9 4.2 4.4 6.2 8.1 7.2 7.6 6.3
Source: KPMG Corporate Finance, 1999.
DSTI/DOC(2000)1
14
M&As AS AN ENTRY MODE FOR DIRECT INVESTMENT
When undertaking direct investment in a foreign country, a firm can choose between different modesof entry. Broadly speaking, the alternative options can be divided into mergers and acquisitions orgreenfield investment (Caves, 1982). That is, a firm may either acquire an existing local firm (M&A mode)or establish a new plant (greenfield mode) in the host country. Furthermore, in the case of M&A mode, afirm can either acquire more than 50% of the shares of the acquired firm (majority M&A) or engage in anacquisition of a minority share-holding (minority M&A).
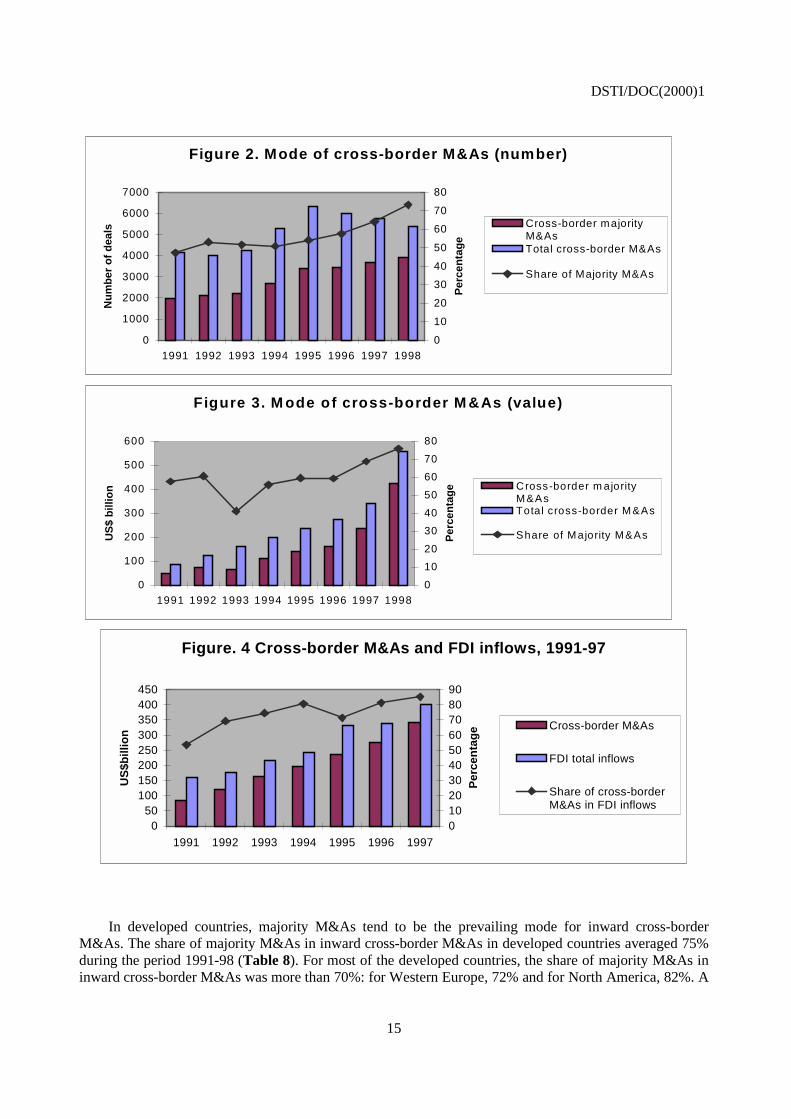
Although entry modes for direct investment depend on a variety of firm and industry characteristics,there has been a marked tendency towards more mergers and acquisitions – in particular, more majorityM&As – and less greenfield investments in the 1990s (UNCTAD, 1998). For example, the share ofmajority M&As in world cross-border M&As continued to increase throughout the 1990s, in terms of bothnumber and value. The share of majority M&As in cross-border M&As in terms of number of dealsincreased rapidly from 48% in 1991 to 73% in 1998 (Figure 2). In terms of deal value, the share ofmajority M&As in cross-border M&As also increased from 58% in 1991 to 76% in 1998 (Figure 3).Furthermore, the value of all cross-border M&As in relation to world foreign direct investment (FDI)inflows rose from 53.7% in 1991 to 85.3% in 1997 (Figure 4). This means that cross-border M&As areplaying a dominant role in increasing flows of foreign direct investment in the1990s.
Modes of inward FDI
Analysis of the modes of entry for FDI across countries shows quite different patterns betweendeveloped and developing countries. Cross-border M&As, in particular majority M&As, play a dominantrole in FDI inflows for developed countries, but other modes of FDI inflows such as greenfield investmentare more important for developing countries. That is, as an entry mode into markets, cross-border majorityM&As are preferred to minority M&As and greenfield investment in developed countries, while indeveloping countries, greenfield investment and cross-border minority M&As are preferred to cross-bordermajority M&As.
DSTI/DOC(2000)1
15
Figure 2. Mode of cross-border M&As (number)
0
1000
2000
3000
4000
5000
6000
7000
1991 1992 1993 1994 1995 1996 1997 1998
Nu
mb
ero
fd
eals
0
10
20
30
40
50
60
70
80
Per
cen
tag
e
Cross-border majorityM&AsTotal cross-border M&As
Share of Majority M&As
Figure 3. M ode of cross-border M &As (value)
0
100
200
300
400
500
600
1991 1992 1993 1994 1995 1996 1997 1998
US
$b
illio
n
0
10
20
30
40
50
60
70
80P
erce
nta
ge Cross-border m ajority
M&AsTotal cross-border M&As
Share of Majority M&As
Figure. 4 Cross-border M&As and FDI inflows, 1991-97
050
100150200250300350400450
1991 1992 1993 1994 1995 1996 1997
US
$bill
ion
0102030405060708090
Per
cen
tag
e Cross-border M&As
FDI total inflows
Share of cross-borderM&As in FDI inflows
In developed countries, majority M&As tend to be the prevailing mode for inward cross-borderM&As. The share of majority M&As in inward cross-border M&As in developed countries averaged 75%during the period 1991-98 (Table 8). For most of the developed countries, the share of majority M&As ininward cross-border M&As was more than 70%: for Western Europe, 72% and for North America, 82%. A
DSTI/DOC(2000)1
16
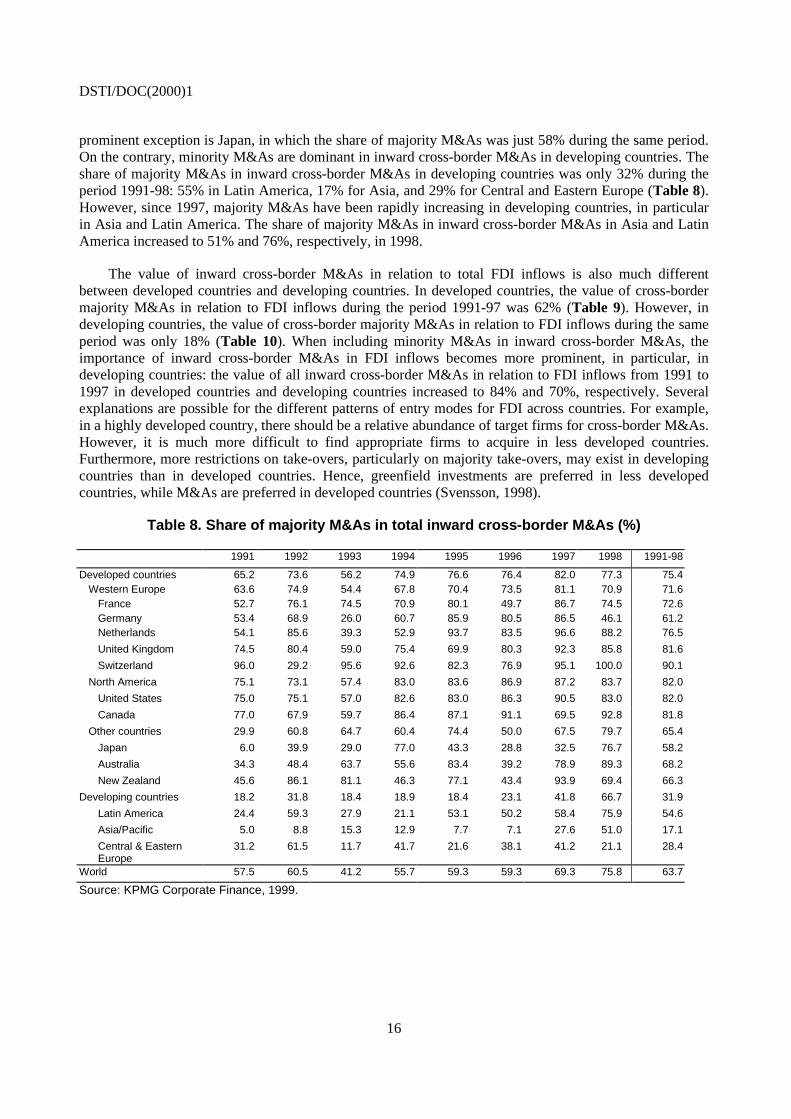
prominent exception is Japan, in which the share of majority M&As was just 58% during the same period.On the contrary, minority M&As are dominant in inward cross-border M&As in developing countries. Theshare of majority M&As in inward cross-border M&As in developing countries was only 32% during theperiod 1991-98: 55% in Latin America, 17% for Asia, and 29% for Central and Eastern Europe (Table 8).However, since 1997, majority M&As have been rapidly increasing in developing countries, in particularin Asia and Latin America. The share of majority M&As in inward cross-border M&As in Asia and LatinAmerica increased to 51% and 76%, respectively, in 1998.
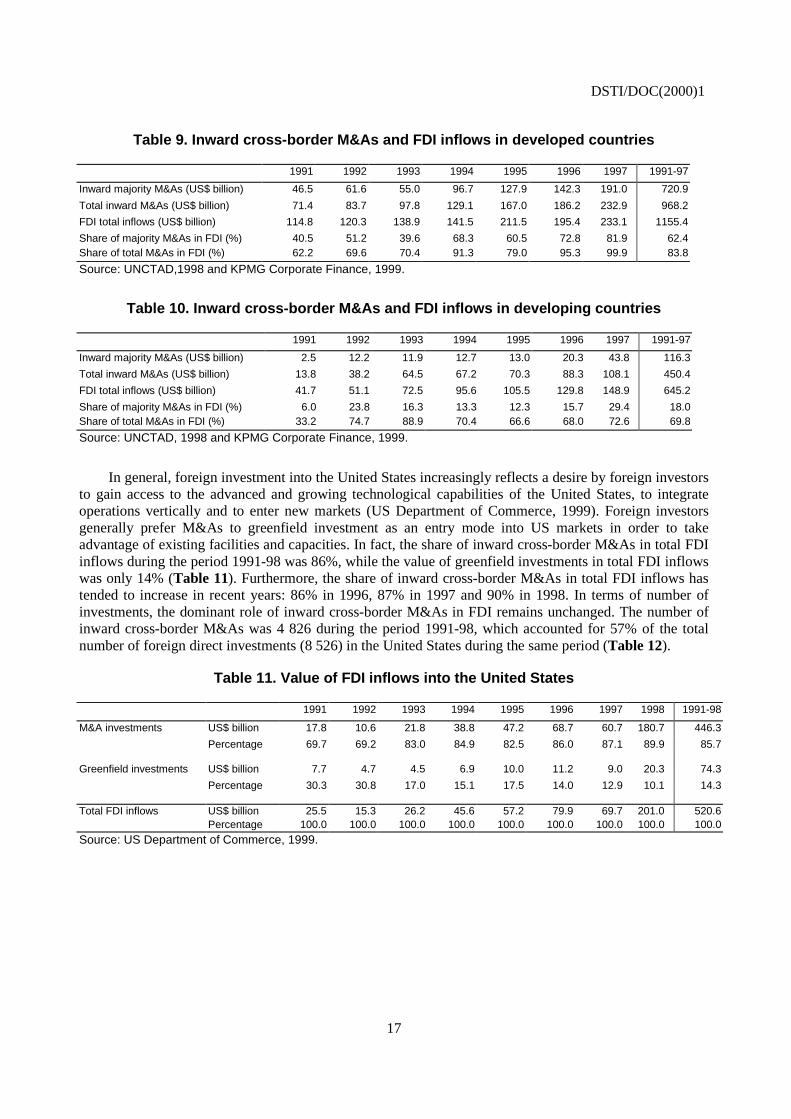
The value of inward cross-border M&As in relation to total FDI inflows is also much differentbetween developed countries and developing countries. In developed countries, the value of cross-bordermajority M&As in relation to FDI inflows during the period 1991-97 was 62% (Table 9). However, indeveloping countries, the value of cross-border majority M&As in relation to FDI inflows during the sameperiod was only 18% (Table 10). When including minority M&As in inward cross-border M&As, theimportance of inward cross-border M&As in FDI inflows becomes more prominent, in particular, indeveloping countries: the value of all inward cross-border M&As in relation to FDI inflows from 1991 to1997 in developed countries and developing countries increased to 84% and 70%, respectively. Severalexplanations are possible for the different patterns of entry modes for FDI across countries. For example,in a highly developed country, there should be a relative abundance of target firms for cross-border M&As.However, it is much more difficult to find appropriate firms to acquire in less developed countries.Furthermore, more restrictions on take-overs, particularly on majority take-overs, may exist in developingcountries than in developed countries. Hence, greenfield investments are preferred in less developedcountries, while M&As are preferred in developed countries (Svensson, 1998).
Table 8. Share of majority M&As in total inward cross-border M&As (%)
1991 1992 1993 1994 1995 1996 1997 1998 1991-98
Developed countries 65.2 73.6 56.2 74.9 76.6 76.4 82.0 77.3 75.4Western Europe 63.6 74.9 54.4 67.8 70.4 73.5 81.1 70.9 71.6
France 52.7 76.1 74.5 70.9 80.1 49.7 86.7 74.5 72.6Germany 53.4 68.9 26.0 60.7 85.9 80.5 86.5 46.1 61.2Netherlands 54.1 85.6 39.3 52.9 93.7 83.5 96.6 88.2 76.5
United Kingdom 74.5 80.4 59.0 75.4 69.9 80.3 92.3 85.8 81.6
Switzerland 96.0 29.2 95.6 92.6 82.3 76.9 95.1 100.0 90.1
North America 75.1 73.1 57.4 83.0 83.6 86.9 87.2 83.7 82.0
United States 75.0 75.1 57.0 82.6 83.0 86.3 90.5 83.0 82.0
Canada 77.0 67.9 59.7 86.4 87.1 91.1 69.5 92.8 81.8
Other countries 29.9 60.8 64.7 60.4 74.4 50.0 67.5 79.7 65.4
Japan 6.0 39.9 29.0 77.0 43.3 28.8 32.5 76.7 58.2
Australia 34.3 48.4 63.7 55.6 83.4 39.2 78.9 89.3 68.2
New Zealand 45.6 86.1 81.1 46.3 77.1 43.4 93.9 69.4 66.3
Developing countries 18.2 31.8 18.4 18.9 18.4 23.1 41.8 66.7 31.9
Latin America 24.4 59.3 27.9 21.1 53.1 50.2 58.4 75.9 54.6
Asia/Pacific 5.0 8.8 15.3 12.9 7.7 7.1 27.6 51.0 17.1
Central & EasternEurope
31.2 61.5 11.7 41.7 21.6 38.1 41.2 21.1 28.4
World 57.5 60.5 41.2 55.7 59.3 59.3 69.3 75.8 63.7
Source: KPMG Corporate Finance, 1999.
DSTI/DOC(2000)1
17
Table 9. Inward cross-border M&As and FDI inflows in developed countries
1991 1992 1993 1994 1995 1996 1997 1991-97
Inward majority M&As (US$ billion) 46.5 61.6 55.0 96.7 127.9 142.3 191.0 720.9
Total inward M&As (US$ billion) 71.4 83.7 97.8 129.1 167.0 186.2 232.9 968.2
FDI total inflows (US$ billion) 114.8 120.3 138.9 141.5 211.5 195.4 233.1 1155.4
Share of majority M&As in FDI (%) 40.5 51.2 39.6 68.3 60.5 72.8 81.9 62.4Share of total M&As in FDI (%) 62.2 69.6 70.4 91.3 79.0 95.3 99.9 83.8
Source: UNCTAD,1998 and KPMG Corporate Finance, 1999.
Table 10. Inward cross-border M&As and FDI inflows in developing countries
1991 1992 1993 1994 1995 1996 1997 1991-97
Inward majority M&As (US$ billion) 2.5 12.2 11.9 12.7 13.0 20.3 43.8 116.3
Total inward M&As (US$ billion) 13.8 38.2 64.5 67.2 70.3 88.3 108.1 450.4
FDI total inflows (US$ billion) 41.7 51.1 72.5 95.6 105.5 129.8 148.9 645.2
Share of majority M&As in FDI (%) 6.0 23.8 16.3 13.3 12.3 15.7 29.4 18.0Share of total M&As in FDI (%) 33.2 74.7 88.9 70.4 66.6 68.0 72.6 69.8
Source: UNCTAD, 1998 and KPMG Corporate Finance, 1999.
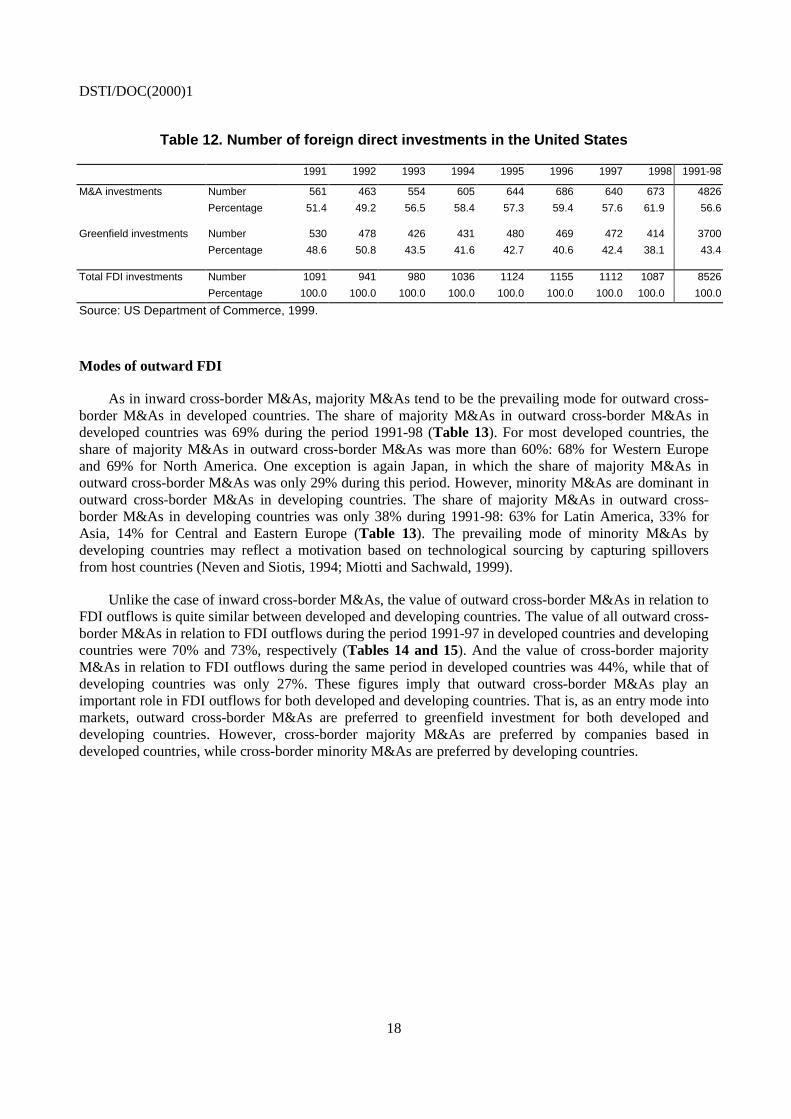
In general, foreign investment into the United States increasingly reflects a desire by foreign investorsto gain access to the advanced and growing technological capabilities of the United States, to integrateoperations vertically and to enter new markets (US Department of Commerce, 1999). Foreign investorsgenerally prefer M&As to greenfield investment as an entry mode into US markets in order to takeadvantage of existing facilities and capacities. In fact, the share of inward cross-border M&As in total FDIinflows during the period 1991-98 was 86%, while the value of greenfield investments in total FDI inflowswas only 14% (Table 11). Furthermore, the share of inward cross-border M&As in total FDI inflows hastended to increase in recent years: 86% in 1996, 87% in 1997 and 90% in 1998. In terms of number ofinvestments, the dominant role of inward cross-border M&As in FDI remains unchanged. The number ofinward cross-border M&As was 4 826 during the period 1991-98, which accounted for 57% of the totalnumber of foreign direct investments (8 526) in the United States during the same period (Table 12).
Table 11. Value of FDI inflows into the United States
1991 1992 1993 1994 1995 1996 1997 1998 1991-98
M&A investments US$ billion 17.8 10.6 21.8 38.8 47.2 68.7 60.7 180.7 446.3
Percentage 69.7 69.2 83.0 84.9 82.5 86.0 87.1 89.9 85.7
Greenfield investments US$ billion 7.7 4.7 4.5 6.9 10.0 11.2 9.0 20.3 74.3
Percentage 30.3 30.8 17.0 15.1 17.5 14.0 12.9 10.1 14.3
Total FDI inflows US$ billion 25.5 15.3 26.2 45.6 57.2 79.9 69.7 201.0 520.6Percentage 100.0 100.0 100.0 100.0 100.0 100.0 100.0 100.0 100.0
Source: US Department of Commerce, 1999.
DSTI/DOC(2000)1
18
Table 12. Number of foreign direct investments in the United States
1991 1992 1993 1994 1995 1996 1997 1998 1991-98
M&A investments Number 561 463 554 605 644 686 640 673 4826
Percentage 51.4 49.2 56.5 58.4 57.3 59.4 57.6 61.9 56.6
Greenfield investments Number 530 478 426 431 480 469 472 414 3700
Percentage 48.6 50.8 43.5 41.6 42.7 40.6 42.4 38.1 43.4
Total FDI investments Number 1091 941 980 1036 1124 1155 1112 1087 8526
Percentage 100.0 100.0 100.0 100.0 100.0 100.0 100.0 100.0 100.0
Source: US Department of Commerce, 1999.
Modes of outward FDI
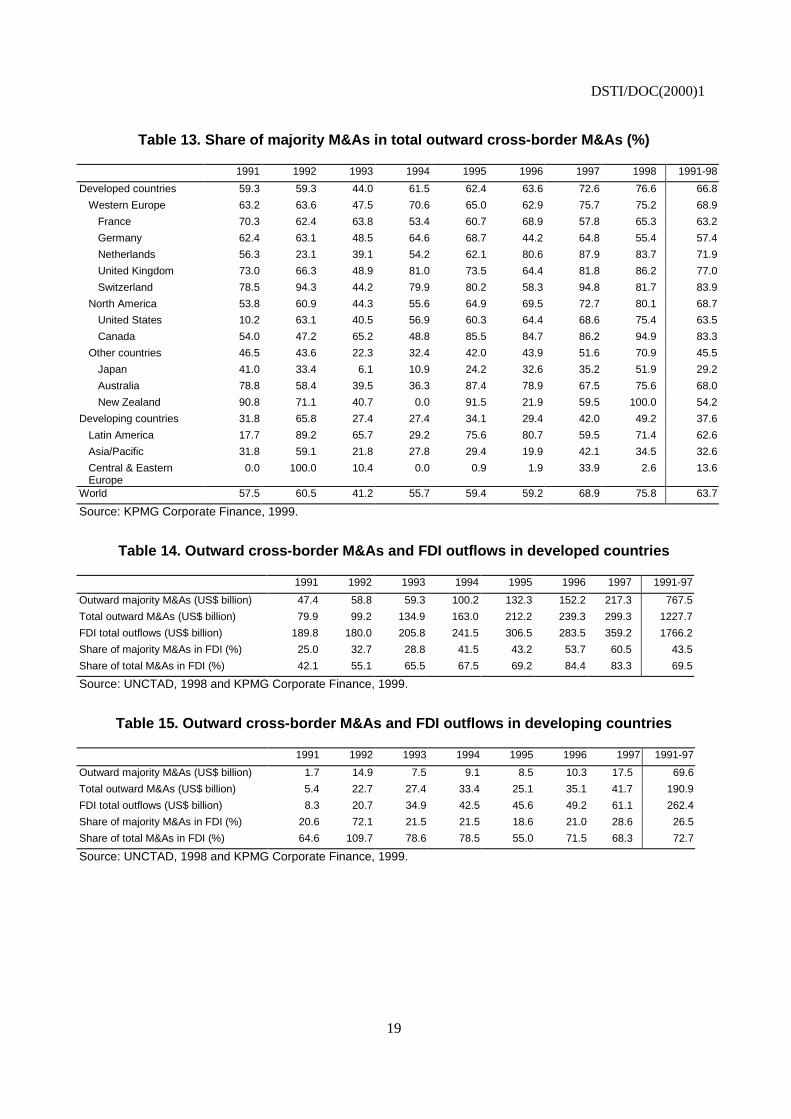
As in inward cross-border M&As, majority M&As tend to be the prevailing mode for outward cross-border M&As in developed countries. The share of majority M&As in outward cross-border M&As indeveloped countries was 69% during the period 1991-98 (Table 13). For most developed countries, theshare of majority M&As in outward cross-border M&As was more than 60%: 68% for Western Europeand 69% for North America. One exception is again Japan, in which the share of majority M&As inoutward cross-border M&As was only 29% during this period. However, minority M&As are dominant inoutward cross-border M&As in developing countries. The share of majority M&As in outward cross-border M&As in developing countries was only 38% during 1991-98: 63% for Latin America, 33% forAsia, 14% for Central and Eastern Europe (Table 13). The prevailing mode of minority M&As bydeveloping countries may reflect a motivation based on technological sourcing by capturing spilloversfrom host countries (Neven and Siotis, 1994; Miotti and Sachwald, 1999).
Unlike the case of inward cross-border M&As, the value of outward cross-border M&As in relation toFDI outflows is quite similar between developed and developing countries. The value of all outward cross-border M&As in relation to FDI outflows during the period 1991-97 in developed countries and developingcountries were 70% and 73%, respectively (Tables 14 and 15). And the value of cross-border majorityM&As in relation to FDI outflows during the same period in developed countries was 44%, while that ofdeveloping countries was only 27%. These figures imply that outward cross-border M&As play animportant role in FDI outflows for both developed and developing countries. That is, as an entry mode intomarkets, outward cross-border M&As are preferred to greenfield investment for both developed anddeveloping countries. However, cross-border majority M&As are preferred by companies based indeveloped countries, while cross-border minority M&As are preferred by developing countries.
DSTI/DOC(2000)1
19
Table 13. Share of majority M&As in total outward cross-border M&As (%)
1991 1992 1993 1994 1995 1996 1997 1998 1991-98
Developed countries 59.3 59.3 44.0 61.5 62.4 63.6 72.6 76.6 66.8
Western Europe 63.2 63.6 47.5 70.6 65.0 62.9 75.7 75.2 68.9
France 70.3 62.4 63.8 53.4 60.7 68.9 57.8 65.3 63.2
Germany 62.4 63.1 48.5 64.6 68.7 44.2 64.8 55.4 57.4
Netherlands 56.3 23.1 39.1 54.2 62.1 80.6 87.9 83.7 71.9
United Kingdom 73.0 66.3 48.9 81.0 73.5 64.4 81.8 86.2 77.0
Switzerland 78.5 94.3 44.2 79.9 80.2 58.3 94.8 81.7 83.9
North America 53.8 60.9 44.3 55.6 64.9 69.5 72.7 80.1 68.7
United States 10.2 63.1 40.5 56.9 60.3 64.4 68.6 75.4 63.5
Canada 54.0 47.2 65.2 48.8 85.5 84.7 86.2 94.9 83.3
Other countries 46.5 43.6 22.3 32.4 42.0 43.9 51.6 70.9 45.5
Japan 41.0 33.4 6.1 10.9 24.2 32.6 35.2 51.9 29.2
Australia 78.8 58.4 39.5 36.3 87.4 78.9 67.5 75.6 68.0
New Zealand 90.8 71.1 40.7 0.0 91.5 21.9 59.5 100.0 54.2
Developing countries 31.8 65.8 27.4 27.4 34.1 29.4 42.0 49.2 37.6
Latin America 17.7 89.2 65.7 29.2 75.6 80.7 59.5 71.4 62.6
Asia/Pacific 31.8 59.1 21.8 27.8 29.4 19.9 42.1 34.5 32.6
Central & EasternEurope
0.0 100.0 10.4 0.0 0.9 1.9 33.9 2.6 13.6
World 57.5 60.5 41.2 55.7 59.4 59.2 68.9 75.8 63.7
Source: KPMG Corporate Finance, 1999.
Table 14. Outward cross-border M&As and FDI outflows in developed countries
1991 1992 1993 1994 1995 1996 1997 1991-97
Outward majority M&As (US$ billion) 47.4 58.8 59.3 100.2 132.3 152.2 217.3 767.5
Total outward M&As (US$ billion) 79.9 99.2 134.9 163.0 212.2 239.3 299.3 1227.7
FDI total outflows (US$ billion) 189.8 180.0 205.8 241.5 306.5 283.5 359.2 1766.2
Share of majority M&As in FDI (%) 25.0 32.7 28.8 41.5 43.2 53.7 60.5 43.5
Share of total M&As in FDI (%) 42.1 55.1 65.5 67.5 69.2 84.4 83.3 69.5
Source: UNCTAD, 1998 and KPMG Corporate Finance, 1999.
Table 15. Outward cross-border M&As and FDI outflows in developing countries
1991 1992 1993 1994 1995 1996 1997 1991-97
Outward majority M&As (US$ billion) 1.7 14.9 7.5 9.1 8.5 10.3 17.5 69.6
Total outward M&As (US$ billion) 5.4 22.7 27.4 33.4 25.1 35.1 41.7 190.9
FDI total outflows (US$ billion) 8.3 20.7 34.9 42.5 45.6 49.2 61.1 262.4
Share of majority M&As in FDI (%) 20.6 72.1 21.5 21.5 18.6 21.0 28.6 26.5
Share of total M&As in FDI (%) 64.6 109.7 78.6 78.5 55.0 71.5 68.3 72.7
Source: UNCTAD, 1998 and KPMG Corporate Finance, 1999.
DSTI/DOC(2000)1
20
CROSS-BORDER M&As BY SECTOR
Sectoral trends
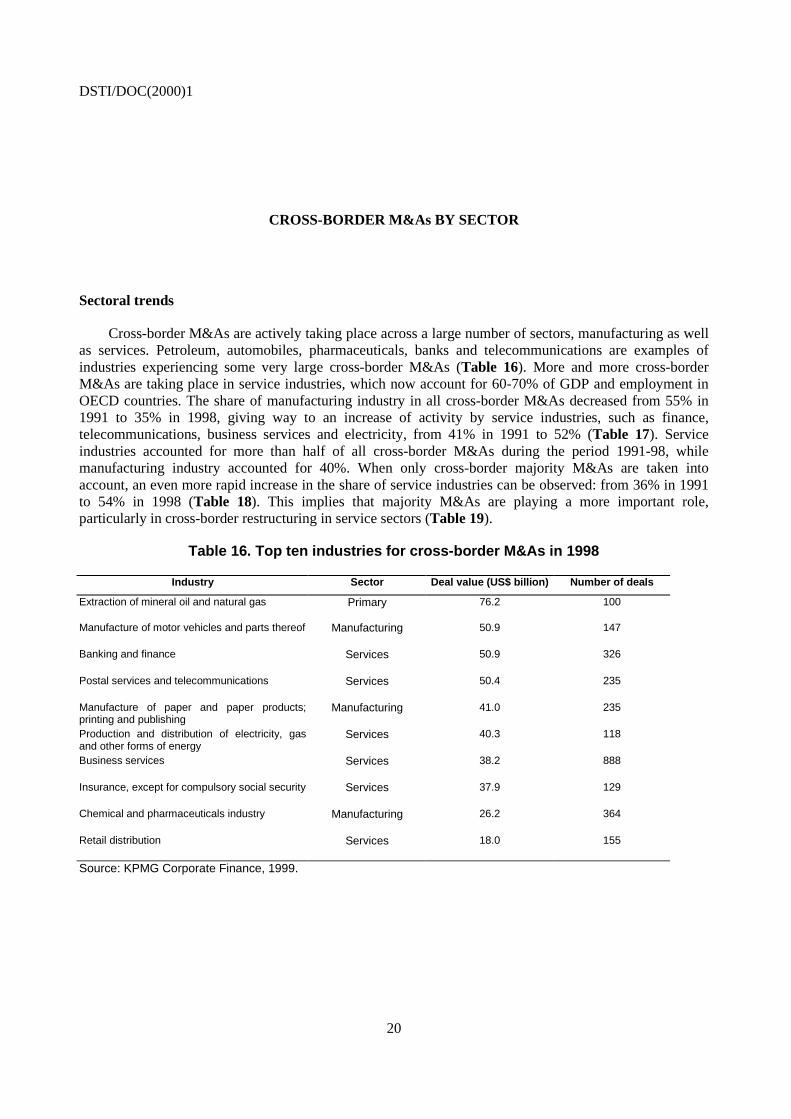
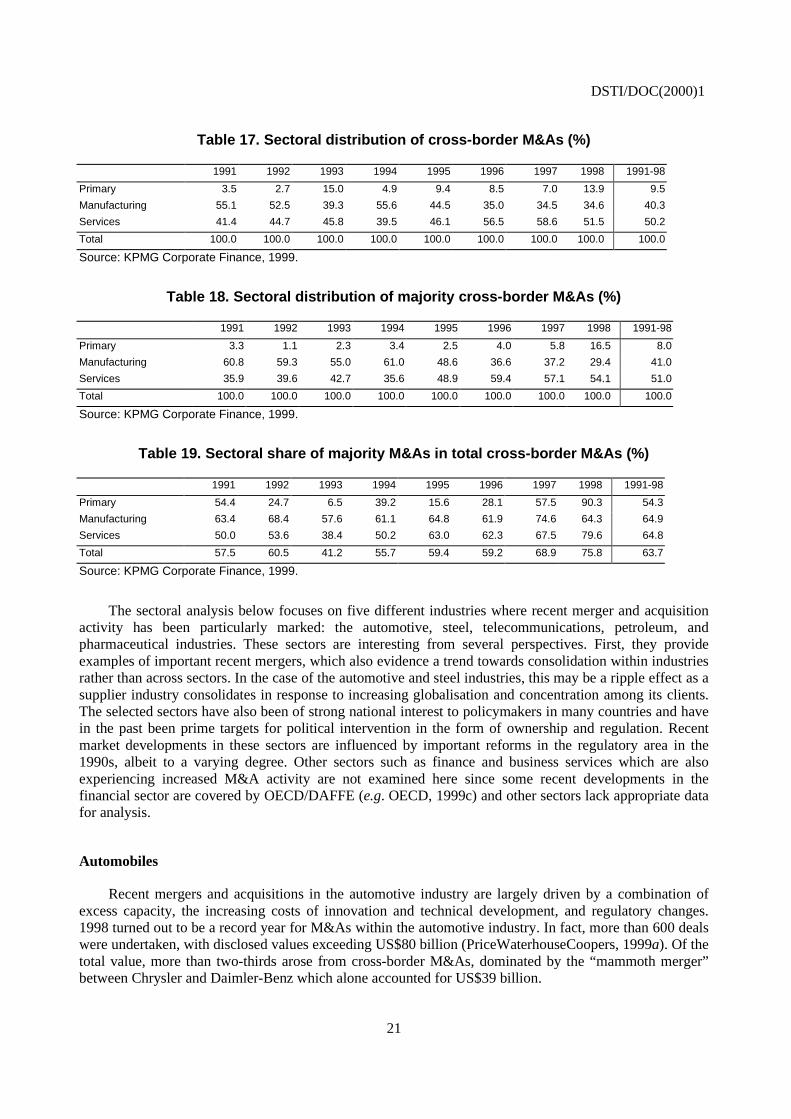
Cross-border M&As are actively taking place across a large number of sectors, manufacturing as wellas services. Petroleum, automobiles, pharmaceuticals, banks and telecommunications are examples ofindustries experiencing some very large cross-border M&As (Table 16). More and more cross-borderM&As are taking place in service industries, which now account for 60-70% of GDP and employment inOECD countries. The share of manufacturing industry in all cross-border M&As decreased from 55% in1991 to 35% in 1998, giving way to an increase of activity by service industries, such as finance,telecommunications, business services and electricity, from 41% in 1991 to 52% (Table 17). Serviceindustries accounted for more than half of all cross-border M&As during the period 1991-98, whilemanufacturing industry accounted for 40%. When only cross-border majority M&As are taken intoaccount, an even more rapid increase in the share of service industries can be observed: from 36% in 1991to 54% in 1998 (Table 18). This implies that majority M&As are playing a more important role,particularly in cross-border restructuring in service sectors (Table 19).
Table 16. Top ten industries for cross-border M&As in 1998
Industry Sector Deal value (US$ billion) Number of deals
Extraction of mineral oil and natural gas Primary 76.2 100
Manufacture of motor vehicles and parts thereof Manufacturing 50.9 147
Banking and finance Services 50.9 326
Postal services and telecommunications Services 50.4 235
Manufacture of paper and paper products;printing and publishing
Manufacturing 41.0 235
Production and distribution of electricity, gasand other forms of energy
Services 40.3 118
Business services Services 38.2 888
Insurance, except for compulsory social security Services 37.9 129
Chemical and pharmaceuticals industry Manufacturing 26.2 364
Retail distribution Services 18.0 155
Source: KPMG Corporate Finance, 1999.
DSTI/DOC(2000)1
21
Table 17. Sectoral distribution of cross-border M&As (%)
1991 1992 1993 1994 1995 1996 1997 1998 1991-98
Primary 3.5 2.7 15.0 4.9 9.4 8.5 7.0 13.9 9.5
Manufacturing 55.1 52.5 39.3 55.6 44.5 35.0 34.5 34.6 40.3
Services 41.4 44.7 45.8 39.5 46.1 56.5 58.6 51.5 50.2
Total 100.0 100.0 100.0 100.0 100.0 100.0 100.0 100.0 100.0
Source: KPMG Corporate Finance, 1999.
Table 18. Sectoral distribution of majority cross-border M&As (%)
1991 1992 1993 1994 1995 1996 1997 1998 1991-98
Primary 3.3 1.1 2.3 3.4 2.5 4.0 5.8 16.5 8.0
Manufacturing 60.8 59.3 55.0 61.0 48.6 36.6 37.2 29.4 41.0
Services 35.9 39.6 42.7 35.6 48.9 59.4 57.1 54.1 51.0
Total 100.0 100.0 100.0 100.0 100.0 100.0 100.0 100.0 100.0
Source: KPMG Corporate Finance, 1999.
Table 19. Sectoral share of majority M&As in total cross-border M&As (%)
1991 1992 1993 1994 1995 1996 1997 1998 1991-98
Primary 54.4 24.7 6.5 39.2 15.6 28.1 57.5 90.3 54.3
Manufacturing 63.4 68.4 57.6 61.1 64.8 61.9 74.6 64.3 64.9
Services 50.0 53.6 38.4 50.2 63.0 62.3 67.5 79.6 64.8
Total 57.5 60.5 41.2 55.7 59.4 59.2 68.9 75.8 63.7
Source: KPMG Corporate Finance, 1999.
The sectoral analysis below focuses on five different industries where recent merger and acquisitionactivity has been particularly marked: the automotive, steel, telecommunications, petroleum, andpharmaceutical industries. These sectors are interesting from several perspectives. First, they provideexamples of important recent mergers, which also evidence a trend towards consolidation within industriesrather than across sectors. In the case of the automotive and steel industries, this may be a ripple effect as asupplier industry consolidates in response to increasing globalisation and concentration among its clients.The selected sectors have also been of strong national interest to policymakers in many countries and havein the past been prime targets for political intervention in the form of ownership and regulation. Recentmarket developments in these sectors are influenced by important reforms in the regulatory area in the1990s, albeit to a varying degree. Other sectors such as finance and business services which are alsoexperiencing increased M&A activity are not examined here since some recent developments in thefinancial sector are covered by OECD/DAFFE (e.g. OECD, 1999c) and other sectors lack appropriate datafor analysis.
Automobiles
Recent mergers and acquisitions in the automotive industry are largely driven by a combination ofexcess capacity, the increasing costs of innovation and technical development, and regulatory changes.1998 turned out to be a record year for M&As within the automotive industry. In fact, more than 600 dealswere undertaken, with disclosed values exceeding US$80 billion (PriceWaterhouseCoopers, 1999a). Of thetotal value, more than two-thirds arose from cross-border M&As, dominated by the “mammoth merger”between Chrysler and Daimler-Benz which alone accounted for US$39 billion.
DSTI/DOC(2000)1
22
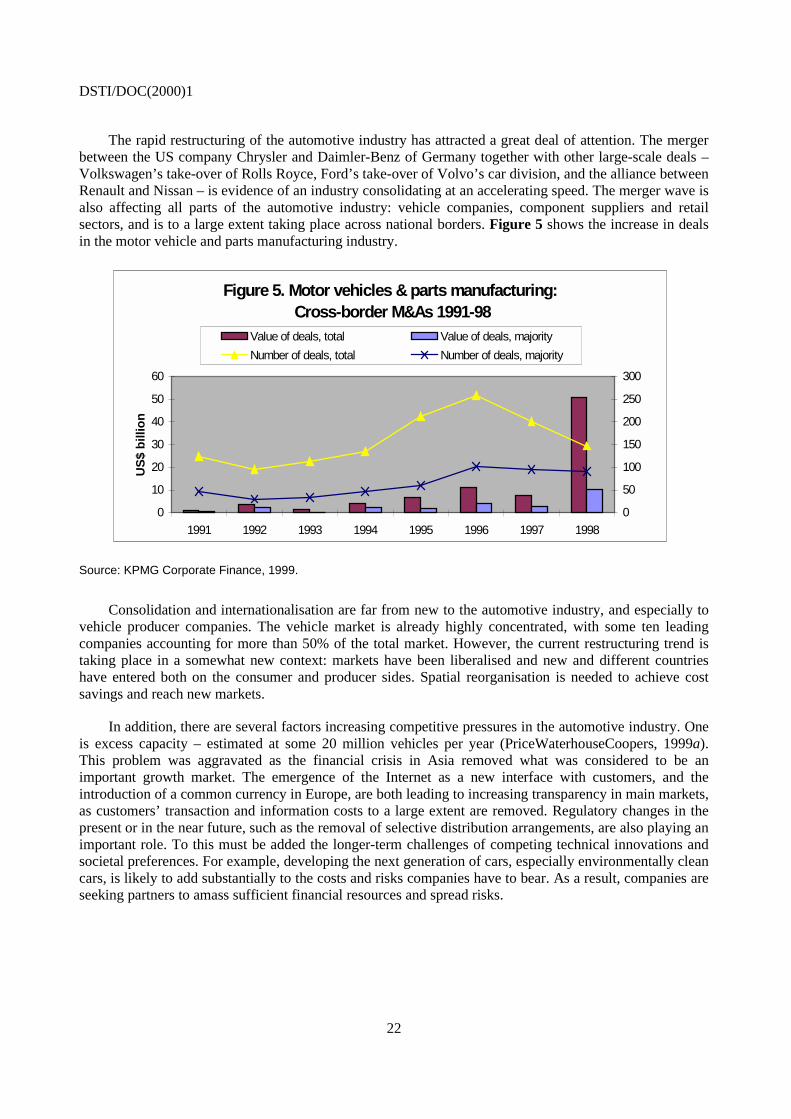
The rapid restructuring of the automotive industry has attracted a great deal of attention. The mergerbetween the US company Chrysler and Daimler-Benz of Germany together with other large-scale deals –Volkswagen’s take-over of Rolls Royce, Ford’s take-over of Volvo’s car division, and the alliance betweenRenault and Nissan – is evidence of an industry consolidating at an accelerating speed. The merger wave isalso affecting all parts of the automotive industry: vehicle companies, component suppliers and retailsectors, and is to a large extent taking place across national borders. Figure 5 shows the increase in dealsin the motor vehicle and parts manufacturing industry.
Figure 5. Motor vehicles & parts manufacturing:Cross-border M&As 1991-98
0
10
20
30
40
50
60
1991 1992 1993 1994 1995 1996 1997 1998
US
$b
illio
n
0
50
100
150
200
250
300
Value of deals, total Value of deals, majority
Number of deals, total Number of deals, majority
Source: KPMG Corporate Finance, 1999.
Consolidation and internationalisation are far from new to the automotive industry, and especially tovehicle producer companies. The vehicle market is already highly concentrated, with some ten leadingcompanies accounting for more than 50% of the total market. However, the current restructuring trend istaking place in a somewhat new context: markets have been liberalised and new and different countrieshave entered both on the consumer and producer sides. Spatial reorganisation is needed to achieve costsavings and reach new markets.
In addition, there are several factors increasing competitive pressures in the automotive industry. Oneis excess capacity – estimated at some 20 million vehicles per year (PriceWaterhouseCoopers, 1999a).This problem was aggravated as the financial crisis in Asia removed what was considered to be animportant growth market. The emergence of the Internet as a new interface with customers, and theintroduction of a common currency in Europe, are both leading to increasing transparency in main markets,as customers’ transaction and information costs to a large extent are removed. Regulatory changes in thepresent or in the near future, such as the removal of selective distribution arrangements, are also playing animportant role. To this must be added the longer-term challenges of competing technical innovations andsocietal preferences. For example, developing the next generation of cars, especially environmentally cleancars, is likely to add substantially to the costs and risks companies have to bear. As a result, companies areseeking partners to amass sufficient financial resources and spread risks.
DSTI/DOC(2000)1
23
Steel
Cross-border M&As in the steel sector appear to be driven by both unfavourable market conditionsand the fact that national governments have reduced their stake in and control over the companies. Sincethe 1970s, the steel industry has experienced significant changes regarding growth rates, organisation,technology, regulation and employment. For example, global steel production has risen by approximately30% in the past 25 years. Employment, however, has been almost halved in the same period in the majorsteel producing countries, excluding China. Steel jobs have declined most radically in EU membercountries, where estimated employment today is around one-third of that in 1975.
These changes reflect a variety of factors influencing competitiveness in the steel market. One ischanges in steel-making processes and technologies. For example, technological advancement now enablesmuch smaller units (so called mini-mills) to operate economically. A second relates to new entrants. Whiledeveloped countries still account for the bulk of steel production, new countries, notably China, Korea, andIndia, have entered the market and are now among the ten largest producers worldwide. A third factor ischanges in political intervention: the steel industry has seen a sharp reduction of state ownership andsubsidies. The transfer from the public sphere of influence to private ownership is a relatively recentphenomenon. In the 15 EU member countries, state ownership has been reduced from 50% to 5% (in termsof crude steel output) during the 1990s. Subsidies have consequently fallen dramatically but remain anissue in several countries.
Long-run trends notwithstanding, the steel industry has seen some drastic developments in the lasttwo years. In particular, the financial crisis which hit Asia in 1997 and Russia and Latin America in 1998led to a deterioration in market conditions as steel demand contracted and imports were reduced. Thecollapse in domestic demand meant that Asian countries could no longer absorb exports from the NIS andthe European Union. Russian exports were re-directed to destinations in North America and the EU. Pricesfor key steel products plunged in 1998. The massive shift in market conditions and in regional focus dealt amajor blow to the steel trading system.
Market conditions are therefore putting pressure on steel companies to offer a wider range ofproducts, exploit synergies and reduce costs. These competitive pressures are reflected in a wave ofmergers and acquisitions. In Europe, the consolidation trend, including several cross-border deals, isparticularly remarkable. The recent merger between British Steel and Dutch Hoogovens (Box 2) follows awave of mergers on the European continent. In the past two years, two German firms have merged(Thyssen and Krupp); Usinor, a French company, has taken over Belgium’s Cockerill Sambre; British-Indian ISPAT has bought parts in Thyssen; and Arbed from Luxembourg has bought parts of SpanishAceralia. With the BS-Hoogovens merger, Europe will have four globally very important steel groups.
The current consolidation in the European steel industry results from several factors. First,unfavourable market conditions are forcing companies to enhance cost effectiveness. Second, privatisationand a move away from state involvement are opening up more avenues for foreign investment. Third, theintroduction of the euro is expected to put additional downward pressure on steel prices in the EU byintroducing more transparency in pricing as well as integrated financial markets.
DSTI/DOC(2000)1
24
Box 2. British Steel and Hoogovens
In June 1999, British Steel announced an all-paper bid for Hoogovens. The deal between the British giantand the Dutch company followed a series of mergers in the European steel market: Thyssen and Krupp(Germany), Usinor (France) and Cockerill Sambre (Belgium), and Arbed (Luxemburg) and Aceralia(Spain). The new merger makes British Steel-Hoogovens the largest steelmaker in Europe.
The British Steel-Hoogovens merger is not merely a reaction to a recession in markets and overcapacity inthe steel market: both companies had already undertaken cost cuts and considerably restructured theirbusinesses during the 1990s. For example, British Steel had shed 7 000 jobs in the previous two years.Instead, the following have been cited as the main reasons for the merger:
• A highly internationalised customer group driving the need for a global presence. In particular,globalisation in the automotive industry is seen as a major impetus to increase regional coverage andthe ability to service clients wherever needed.
• The increasing need for R&D and technological innovation to deliver steel products adapted tocustomer need – lighter, more environmentally friendly, better design, etc.
The merger is expected to lead to an integration of technical expertise and an enlarged range of products,increased cost efficiency through exploitation of synergies, wider geographic spread and with it a betterdistribution and service centre network as well as diversification of currency risk. In particular, British Steel,whose exports have been harmed by the strength of the British pound in recent years, is likely to benefitfrom a portfolio partly based on sales in euros.
However, the ongoing concentration in steel production might also be a consequence of the structureof production and ownership in customer markets. The main steel clients are the construction, automotiveand domestic appliance industries. The two latter are characterised by a global presence and a high degreeof concentration. As mentioned, the top ten producers in the automotive industry now represent over 50%of global production, whereas in the steel sector the equivalent is around one-third. As a consequence ofglobalisation in industries on the demand side, steel producers are being moved to organise global deliveryof services. Because of concentration in those industries, moreover, there is from the perspective of steelproducers an imbalance in bargaining power, which in turn is affecting prices and terms of delivery.
Telecommunications
The telecommunications sector is the best example of how rapid technological developments incombination with regulatory reform both enable and force companies to seek new partners across nationaland technical borders. The telecommunications market is becoming increasingly complex in terms ofproducts and services as well as actors. Technological advances and regulatory reform are changing thetraditional borders of who is doing what and where. Incumbents in the telecommunications market arehaving to deal with or adapt to new technologies (e.g. ATM switches) and new communication patternsand means (e.g. Internet replacing conventional telephony). In addition, competition, stimulated byregulatory reform, has meant that the incumbent former monopolies need to respond to customer needs andshareholder demands. The telecommunications sector is also becoming “denationalised” since manycountries have opened up partly or wholly to foreign ownership.
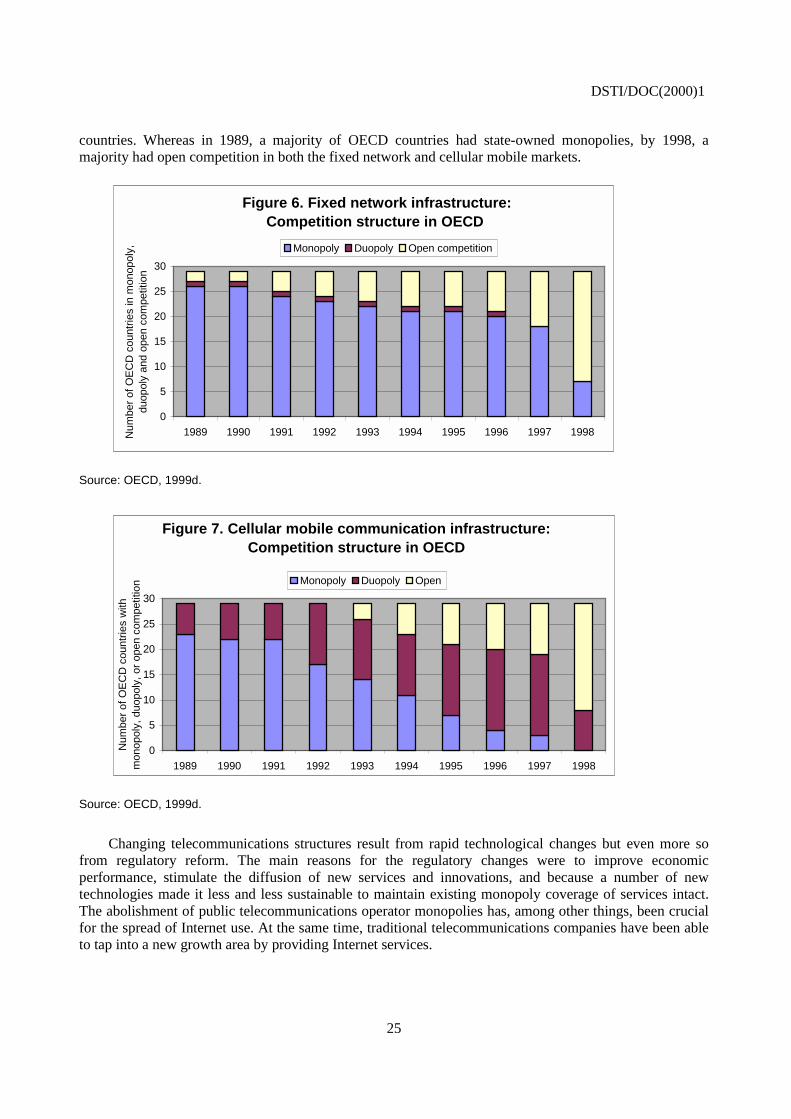
The telecommunications market structure has changed dramatically in the last decade. Several OECDMember countries have opened up or are in the process of opening up their fixed network infrastructuremarkets to competition as well as issuing licences to new entrants in the cellular mobile communicationmarket. Figures 6 and 7 illustrate the liberalisation trend during the 1990s in these two segments in OECD
DSTI/DOC(2000)1
25
countries. Whereas in 1989, a majority of OECD countries had state-owned monopolies, by 1998, amajority had open competition in both the fixed network and cellular mobile markets.
Figure 6. Fixed network infrastructure:Competition structure in OECD
0
5
10
15
20
25
30
1989 1990 1991 1992 1993 1994 1995 1996 1997 1998Num
ber
ofO
EC
Dco
untr
ies
inm
onop
oly,
duop
oly
and
open
com
petit
ion
Monopoly Duopoly Open competition
Source: OECD, 1999d.
Figure 7. Cellular mobile communication infrastructure:Competition structure in OECD
0
5
10
15
20
25
30
1989 1990 1991 1992 1993 1994 1995 1996 1997 1998
Num
ber
ofO
EC
Dco
untr
ies
with
mon
opol
y,du
opol
y,or
open
com
petit
ion Monopoly Duopoly Open
Source: OECD, 1999d.
Changing telecommunications structures result from rapid technological changes but even more sofrom regulatory reform. The main reasons for the regulatory changes were to improve economicperformance, stimulate the diffusion of new services and innovations, and because a number of newtechnologies made it less and less sustainable to maintain existing monopoly coverage of services intact.The abolishment of public telecommunications operator monopolies has, among other things, been crucialfor the spread of Internet use. At the same time, traditional telecommunications companies have been ableto tap into a new growth area by providing Internet services.
DSTI/DOC(2000)1
26
The challenge for new entrants with technologically advanced high capacity networks is to reach andwin over customers in a market where brand-name and position tend to be very important. Incumbents,often former monopolies, in contrast, may need to absorb new technology. The need for operators tosupply a widening range of services has led to more joint ventures and alliances as well as mergers andacquisitions by companies wishing to gain in size and influence. However, in view of the rapidly changingenvironment, the number of mergers and acquisitions across borders has remained relatively low, althoughthere are many cross-border agreements and various forms of alliances in place. These alliances are inlarge part a consequence of the globalisation of service industries (e.g. banking and finance) and a need toprovide multinationals with an end-to-end service.
A large share of telecommunications mergers have taken place in the United States, wherepartnerships are created among regional and long-distance carriers to achieve economies of scale. Thederegulation of the US telecommunications industry in 1996 was intended to increase competition but hasin fact resulted in a rush towards consolidation which is transforming the communications industry. MCIwas taken over by Worldcom (long distance) in 1998, Nynex merged with Bell Atlantic (regional), BellAtlantic and GTE are proposing to merge, as are SBC Communications and Ameritech (regional). AT&Thas taken over TCI and MediaOne group (two important US cable companies). It is important to note thatwhile mergers and take-overs are taking place within the telecommunications industry, it is an industrywhich is undergoing constant change in terms of products, services and participants, largely due totechnological developments.
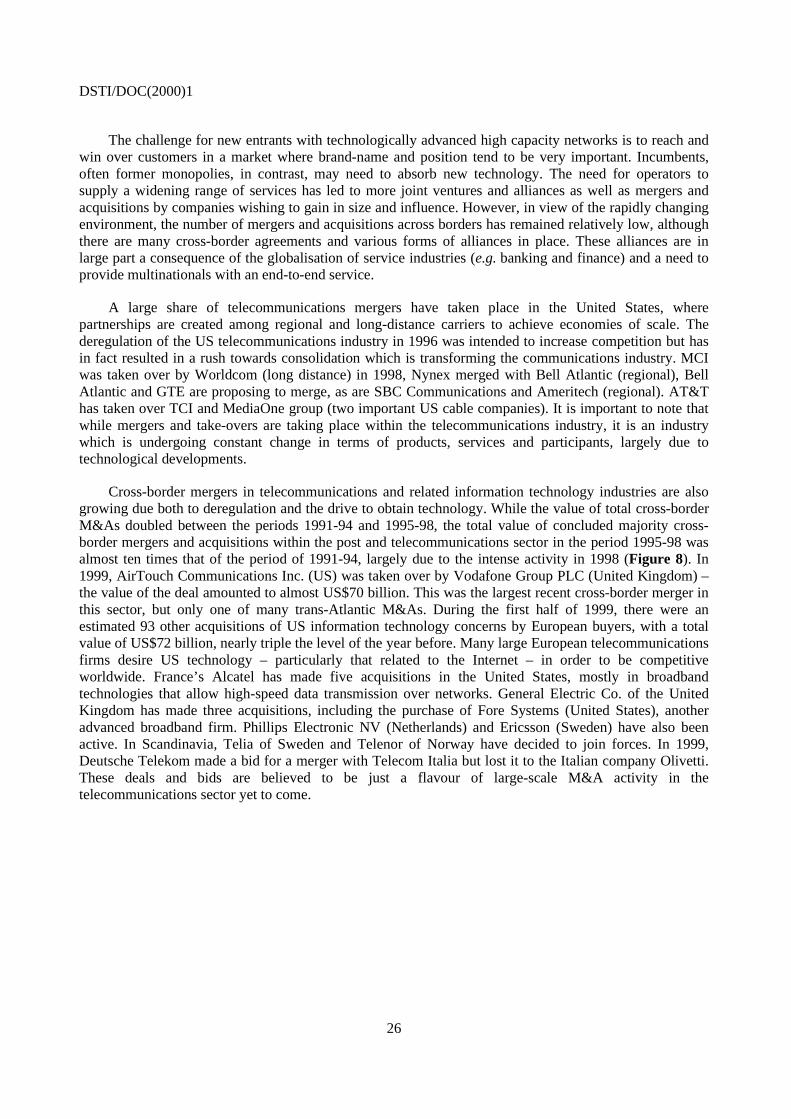
Cross-border mergers in telecommunications and related information technology industries are alsogrowing due both to deregulation and the drive to obtain technology. While the value of total cross-borderM&As doubled between the periods 1991-94 and 1995-98, the total value of concluded majority cross-border mergers and acquisitions within the post and telecommunications sector in the period 1995-98 wasalmost ten times that of the period of 1991-94, largely due to the intense activity in 1998 (Figure 8). In1999, AirTouch Communications Inc. (US) was taken over by Vodafone Group PLC (United Kingdom) –the value of the deal amounted to almost US$70 billion. This was the largest recent cross-border merger inthis sector, but only one of many trans-Atlantic M&As. During the first half of 1999, there were anestimated 93 other acquisitions of US information technology concerns by European buyers, with a totalvalue of US$72 billion, nearly triple the level of the year before. Many large European telecommunicationsfirms desire US technology – particularly that related to the Internet – in order to be competitiveworldwide. France’s Alcatel has made five acquisitions in the United States, mostly in broadbandtechnologies that allow high-speed data transmission over networks. General Electric Co. of the UnitedKingdom has made three acquisitions, including the purchase of Fore Systems (United States), anotheradvanced broadband firm. Phillips Electronic NV (Netherlands) and Ericsson (Sweden) have also beenactive. In Scandinavia, Telia of Sweden and Telenor of Norway have decided to join forces. In 1999,Deutsche Telekom made a bid for a merger with Telecom Italia but lost it to the Italian company Olivetti.These deals and bids are believed to be just a flavour of large-scale M&A activity in thetelecommunications sector yet to come.
DSTI/DOC(2000)1
27
Figure 8. Post and telecommunications
0
10
20
30
40
50
60
1991 1992 1993 1994 1995 1996 1997 1998
US
$b
illio
n
0
50
100
150
200
250
Value of deals, total Value of deals, majority
Number of deals, total Number of deals, majority
Source: KPMG Corporate Finance, 1999.
Oil and gas
Market trends and a need for restructuring are driving the increasing number of large-scale dealsbetween companies in the oil and gas industry. Being of fundamental strategic importance to producercountries, the oil industry has gone through various stages of ownership and organisational structures. The1970s saw the age of nationalism, where natural resources were nationalised, foreign concessions takenover and consortia halted, and the OPEC cartel regulated supply. In the 1980s followed an age of hostiletake-overs and rescuing “white knights” – in fact, the still-standing record for deals in the oil industry datesback to 1984 when Texaco took over Getty Oil, Gulf was overtaken by Chevron, and Mobil acquiredSuperior Oil. A privatisation trend throughout the 1990s has brought private capital and foreign investorsback into the arena and led to several mega-mergers (although it should be noted that the public sectoroften still plays a large role in the oil sector). Today, as oil prices remain low, managers are hard pressed toimprove financial performance.
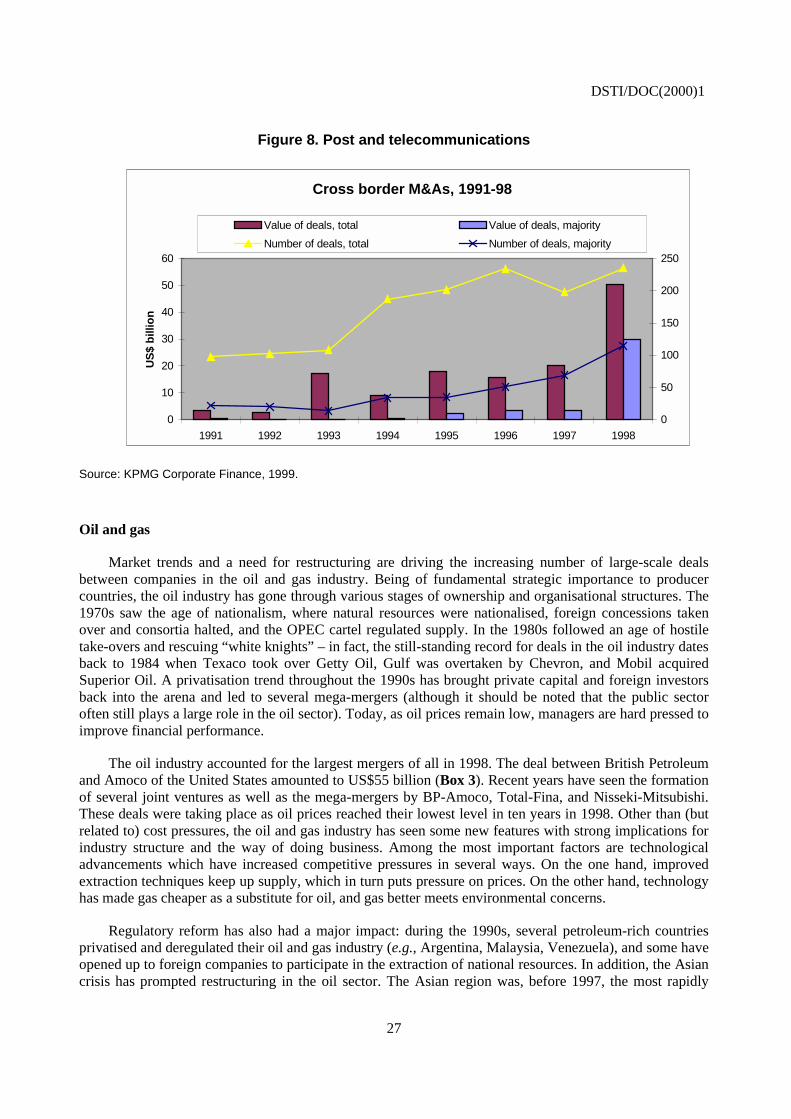
The oil industry accounted for the largest mergers of all in 1998. The deal between British Petroleumand Amoco of the United States amounted to US$55 billion (Box 3). Recent years have seen the formationof several joint ventures as well as the mega-mergers by BP-Amoco, Total-Fina, and Nisseki-Mitsubishi.These deals were taking place as oil prices reached their lowest level in ten years in 1998. Other than (butrelated to) cost pressures, the oil and gas industry has seen some new features with strong implications forindustry structure and the way of doing business. Among the most important factors are technologicaladvancements which have increased competitive pressures in several ways. On the one hand, improvedextraction techniques keep up supply, which in turn puts pressure on prices. On the other hand, technologyhas made gas cheaper as a substitute for oil, and gas better meets environmental concerns.
Regulatory reform has also had a major impact: during the 1990s, several petroleum-rich countriesprivatised and deregulated their oil and gas industry (e.g., Argentina, Malaysia, Venezuela), and some haveopened up to foreign companies to participate in the extraction of national resources. In addition, the Asiancrisis has prompted restructuring in the oil sector. The Asian region was, before 1997, the most rapidly
Cross border M&As, 1991-98
DSTI/DOC(2000)1
28
growing source of demand for oil; however, demand has fallen considerably in the wake of the economicdifficulties experienced by the region. Moreover, the OPEC cartel has not been able to repeat the supplycuts of the 1970s, and today there are more non-OPEC-based low-cost producers willing to increaseproduction in the event of higher prices.
Box 3. British Petroleum and Amoco
In 1998, British Petroleum of the United Kingdom and Amoco of the United States merged their oil-relatedbusinesses. The deal put two companies, who as separate entities were considered to be in the top of thesecond division in terms of size, among the super oil and gas companies Exxon and Royal Dutch/Shell.The new company will be the world’s largest petroleum producer – but still with only 2% of the market.
The merger is expected to deliver both cost efficiencies amounting to US$2 billion in the coming two yearsand increased market opportunities. BP has already cut its workforce by half since the beginning of the1990s, and additional cuts are planned to reduce overlaps and benefit from synergies. For BP, the dealmarks a need to increase its presence in geographical and product markets with better growth potential.With Amoco, BP captures an important part of the US petroleum market and also strengthens its positionin gas extraction in North and South America. There is also improved vertical integration. The strength ofBP lies in upstream activities – finding and extracting oil – whereas Amoco is considered to be better at thedownstream part of the oil business, i.e. refining, distribution and marketing. BP-Amoco are expecting toincrease competitiveness through the exchange of complementary intangible assets across theorganisation.
The new company is now expected to acquire Arco, an US oil and gas company, in an acquisition whichwould amount to US$26 billion. This acquisition, in turn, would lead to a further penetration of the gasbusiness in the United States. Total savings are expected to amount to US$1 billion.
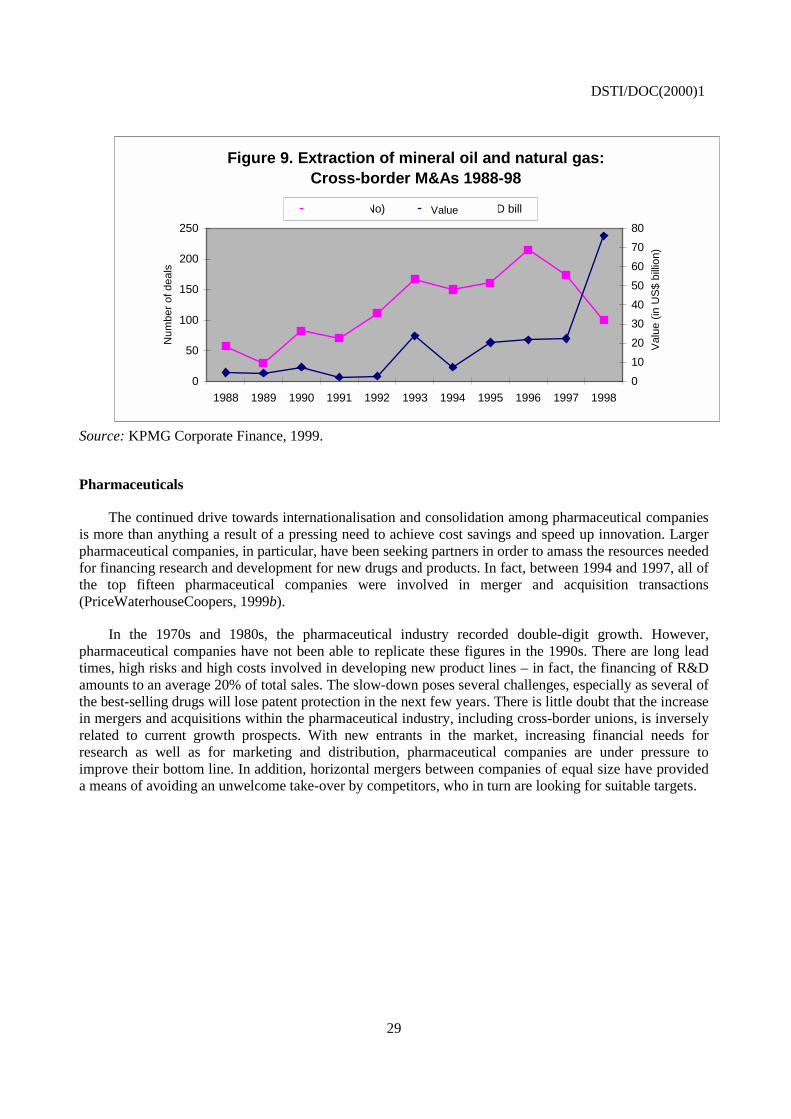
The current market situation is thus requiring the oil industry to reinvent and restructure itself. Indeed,whereas global M&A activities have gained momentum throughout the 1990s, the surge in oil sectorM&As took place in the last few years during which oil prices have plunged (Figure 9). It is still acomparatively fragmented market. Today, however, oil companies are forced to look for partners to exploitsynergies, access new sources and reduce overheads. Oil companies are also buying into other fuels,especially gas. The deals are sometimes defensive in nature in that, as a result of hard times, there is a needto achieve maximum cost efficiency and create lean companies. At the same time, companies, andespecially second-tier companies, have a choice to make: either to find a suitable partner for merger andjoin ranks with the handful of mega-companies or to focus on a special geographical or technical niche(and risk being taken over). In short, oil companies are now being forced to choose in which league theywant to compete.
There may also be a case for size in the oil industry, i.e. that there are economies of scale in theproduction and distribution of oil. Cross-border mergers between companies with different regionaloutreach will result in the spreading of political and financial risk. More capital will increase the ability tobid for large deals without having to look for partnerships for each occasion. Increased size increases theability to take risks in exploration and production. In addition, mergers may give access to newer andcheaper oil fields generally outside Europe and North America.
DSTI/DOC(2000)1
29
Figure 9. Extraction of mineral oil and natural gas:Cross-border M&As 1988-98
0
50
100
150
200
250
1988 1989 1990 1991 1992 1993 1994 1995 1996 1997 1998
Num
ber
ofde
als
0
10
20
30
40
50
60
70
80
Val
ue(in
US
$bi
llion
)
deals (No) value USD bill
Source: KPMG Corporate Finance, 1999.
Pharmaceuticals
The continued drive towards internationalisation and consolidation among pharmaceutical companiesis more than anything a result of a pressing need to achieve cost savings and speed up innovation. Largerpharmaceutical companies, in particular, have been seeking partners in order to amass the resources neededfor financing research and development for new drugs and products. In fact, between 1994 and 1997, all ofthe top fifteen pharmaceutical companies were involved in merger and acquisition transactions(PriceWaterhouseCoopers, 1999b).
In the 1970s and 1980s, the pharmaceutical industry recorded double-digit growth. However,pharmaceutical companies have not been able to replicate these figures in the 1990s. There are long leadtimes, high risks and high costs involved in developing new product lines – in fact, the financing of R&Damounts to an average 20% of total sales. The slow-down poses several challenges, especially as several ofthe best-selling drugs will lose patent protection in the next few years. There is little doubt that the increasein mergers and acquisitions within the pharmaceutical industry, including cross-border unions, is inverselyrelated to current growth prospects. With new entrants in the market, increasing financial needs forresearch as well as for marketing and distribution, pharmaceutical companies are under pressure toimprove their bottom line. In addition, horizontal mergers between companies of equal size have provideda means of avoiding an unwelcome take-over by competitors, who in turn are looking for suitable targets.
Value
DSTI/DOC(2000)1
30
THE DRIVING FORCES BEHIND CROSS-BORDER M&As
Firms engage in cross-border M&A activity for several reasons: among them, to strengthen theirmarket position, expand their businesses, seek useful resources such as complementary intangible assets orrealise efficiency gains by restructuring their businesses on a global basis (UNCTAD, 1998). The growthin cross-border M&As is part of an overall surge in M&As at both national and international levels due totheir inherent advantages over other forms of investment. Through M&As, investors can exploit synergeticeffects between their own assets and those of already-established firms. M&As enable firms to quicklyrealise new market opportunities and establish an immediate critical mass in a particular market. They canalso serve to eliminate actual or potential competitors which, at the international level, are becoming moreimportant as barriers to trade and investment fall. Virtually all developed countries and many developingcountries have competition laws which prohibit anti-competitive mergers; horizontal mergers, particularlythose occurring in highly concentrated markets, are generally subject to fairly close scrutiny bycompetition authorities to verify efficiency effects, although this may not always be 100% effective(OECD, 1996a).
Mergers and acquisitions are not a new phenomenon, although their motives and characteristics maychange over time. They have tended to occur in waves throughout this century, with periodic increases inM&A activity when stock market prices were high (Mueller, 1989). Economic recessions or booms canaffect the level of global M&A activity and its regional focus. Industry characteristics such as growthprospects, market structure and competition are a strong influence on cross-border mergers. Slow growth,over-capacity and increased competition in global markets typically drive industrial restructuring and oftenmake M&As preferable to greenfield investments. Increased competitive pressures can push companies toseek equal partners where costly overlaps can be reduced and synergies exploited.
Technological change works both as a pull and push factor for cross-border M&As: by promotinginternational expansion through falling communication and transport costs; by creating new businesses andmarkets; by rapidly changing market conditions; or by increasing the costs of research and development.Technical competence and market know-how, flexibility and ability to innovate increasingly are becomingcorporate strategic assets, while at the same time the speed of technological development is pressing on.Companies are being forced to look for partners from whom intangible assets such as these can be obtainedand absorbed. In addition, government policies such as liberalisation, privatisation and regulatory reforminfluence cross-border unions by opening up opportunities and increasing the availability of favourableM&A targets. These driving forces behind cross-border M&As can be loosely grouped into factors at themacroeconomic, industry and firm-level, as well as technological and government-related factors.
Macro-level factors
Economic growth influences both the supply of and demand for cross-border M&As. Economicexpansion in home countries increases earnings and equity prices and hence the pool of capital availablefor investment abroad. Similarly, an economic boom in host countries increases the short-term profitabilityof potential target firms for acquisition. The prolonged economic expansion in major countries such as theUnited States and the United Kingdom has played an important role in the continued and rapid increase of
DSTI/DOC(2000)1
31
both inward and outward cross-border M&As in the 1990s. In fact, the United States and the UnitedKingdom became the largest merger investors and recipients in the 1990s as their economies strengthened.
Conversely, slower economic growth tends to work against cross-border mergers. As the Japaneseeconomy continued to experience recession, outward FDI from Japan, including outward M&A purchases,rapidly slowed in the 1990s. Outward acquisitions by Asian countries, which experienced a seriouseconomic recession due to the currency crisis of 1997-98, also sharply decreased in 1998. At present,inward M&As are increasing in Japan and many Asian countries, particularly Korea, due to falling assetprices as well as changes in business practices and an environment more favourable to foreign acquisitions.The level and direction of international M&A activity is influenced by a host of factors including drivers atthe level of the industry and firm.
Industry-level factors
Although cross-border M&As are taking place actively across almost all industries, recent large-scaleunions have tended to be concentrated in a few major sectors, such as petroleum, automobiles, finance andtelecommunications. These are the sectors which are experiencing intensified global competition andmarket pressures from falling commodity prices (petroleum), excess capacity in key markets(automobiles), and/or deregulation and rapid technological change (banks and telecommunications).
Unlike the M&A deals of the 1980s, which were often about capturing new markets or supposedlyundervalued and unrelated businesses, many of the international mega-mergers of the 1990s take placewithin the same industry for the purpose of restructuring. This kind of union typically involvesconsolidation and scrapping of capacities on a global scale to improve international efficiency andcompetitiveness. Intensified global competition and market pressures are forcing firms to concentrate ontheir core business activities. The trend towards cross-border mergers and acquisitions partly results fromgrowing sales of non-core operations or affiliates and the acquisition of similar operations (divisions,affiliates or firms that have similar businesses) beyond national borders (UNCTAD, 1998).
Firm-level factors
According to theories of trade and industry location, a firm needs to have a firm-specific competitiveadvantage (ownership advantage) in foreign markets in order to successfully undertake foreign directinvestment (Dunning, 1977). This competitive advantage generally arises from the existence of firm-specific intangible assets such as production knowledge and skills, marketing capabilities and brand namesor superior management capabilities. These intangible assets are quasi-public goods with large economiesof scale and scope, and hence can be applied repeatedly and simultaneously to multiple locations andbusinesses in a non-rivalry manner. Thus, as a firm accumulates more and more intangible assets, the firmhas stronger incentives to exploit them through geographical diversification (FDI) or other modes ofinternalisation (Morck and Yeung, 1999).
Empirical research identifies several firm-level factors that influence the choice of entry modes inmaking foreign direct investments. First, it has been observed that M&As are more desirable the greaterthe organisational and managerial skill of a firm, while greenfield operations are more preferable thegreater the technological skill of the firm (Andersson and Svensson, 1994). Here, organisational andmanagerial skill is associated with the ability to absorb and utilise existing knowledge, while technologicalskill is related to technology development and the ability to innovate with respect to investment in researchand development. Since the international experience of a firm is generally related to organisational andmanagerial skills, firms with more international experience tend to favour take-overs. A firm’s previouspresence in a host country also increases the attractiveness of take-overs. That is, if a firm already has
DSTI/DOC(2000)1
32
established affiliates in the host country, this increases the benefits of take-overs relative to greenfieldoperations, since a new investment in plant and equipment may increase capacity and competition in thehost country market which may lead to lower prices and profits, hurting the firm’s existing affiliates. Thisresult implies that as multinational operations increase, the trend toward increased use of take-overs maybe strengthened.
Firm strategies vis à vis competitors may further affect the modes of entry. If a firm does not possesssufficient intangible assets to be competitive, it may seek them in the asset bundle of an existing local firmthrough acquisition. On the other hand, if a firm has technological and competitive advantages that itfirmly wishes to retain control over, it may prefer greenfield investment to M&A (Yamawaki, 1994;Andersson, 1993). For instance, it has been observed that Japanese MNEs when entering Europe havecontinued to rely on greenfield investments in industries where they have superior competitiveness,whereas their reliance on M&A in an industry tends to be stronger the higher the relative competitivenessof the European industry. Furthermore, the former investments have tended to be undertaken in Europeancountries with relatively low competitiveness in these sectors, whereas the latter have been undertaken inthe countries which are more competitive, e.g., greenfield investment in semiconductors and transporttargeting particularly the United Kingdom compared to M&A in chemicals focusing on Germany and theNetherlands.
A recent study concentrating on cross-border M&As between the United States and four Europeancountries (Vasconcellos and Kish, 1998) outlines the factors which might motivate cross-border M&As atthe firm level. One impetus is risk spreading: in order to reduce risk, firms acquire companies in othereconomies on the basis that the covariance of industry returns across economies is likely to be smaller thanwithin one economy. De facto differences in cyclical conditions at a specific point in time can also favouracquisitions – for example, a relatively strong stock market increases the means available to companies forpurchases and renders foreign targets cheaper. However, this may only be true when the economies inquestion are not highly integrated. Companies which are unable to develop technology in-house due totime or resource constraints can also choose M&A as a means for acquiring technological and humanresources. Among the factors which might deter acquisitions are information asymmetries – lack of reliableinformation about prospective acquisitions may dissuade potential buyers. Such information gaps can bemore serious across borders. Where potential targets have monopolistic power, take-over attempts are alsolikely to be resisted.
Technology-related factors
Technological change has had different types of effects in stimulating cross-border M&As. On theone hand, falling communication and transport costs have favoured international expansion of firmsseeking to exploit and consolidate their competitive advantages. In particular, recent developments ininformation technology tend to expand the range and span of corporate control, making the optimum sizeof firms larger than previously possible. Multinational enterprises can expand their size and achieve moredominant market positions through acquisitions beyond national borders, while maintaining efficiency andflexibility in their management through new information and communications technologies. On the otherhand, the soaring costs of R&D, coupled with the uncertainties of technological change, have forced firmsto co-operate with others in global markets through various unions and strategic alliances in order to fundresearch expenditures for new products. For example, the large R&D costs required to develop newgenerations of drugs is considered the major driving force for recent M&As in the pharmaceuticals sector.
Technological change tends to shorten product life cycles and promote new entrants with innovativetechnology, which alters competitive conditions and market structure as seen in the case oftelecommunications and steel. Technological change also creates new businesses and markets, such as in
DSTI/DOC(2000)1
33
telecommunications and information-related industries. Mergers and acquisitions can be a quick and easyway to react to competitors and acquire entry into new sectors and markets. The recent surge of cross-border alliances in the telecommunications, media and information industries reflects the efforts of firms tocapture new markets created by new technologies, particularly the growth of the Internet, and to providemore integrated global services. Furthermore, investors in many sectors tend to prefer foreign acquisitionsrather than greenfield investments because local firms may provide intangible assets such as a distributionnetwork, an established brand name or market share, and/or in-depth knowledge of local customs andregulations.
Government-related factors
Liberalisation of international capital movements and investments coupled with new investmentincentives have promoted the rapid increase and spread of foreign direct investment, particularly cross-border M&As. For example, in the case of Korea, all remaining restrictions on acquisitions by foreigninvestors were repealed in 1998 as one of the structural reforms in the wake of the economic crisis. As aresult, the share of M&A investments in total FDI inflows into Korea increased to 53% in 1998.Regulatory reform and deregulation in such industries as telecommunications (the WTO agreement onbasic telecommunications services came into effect in 1998), electricity and finance are playing animportant role in the dramatic increases in M&As in both developed and developing countries. Theseindustries are beginning to open up to foreign investors in many countries and full or majority ownershipby foreigners is gradually being allowed. Privatisation is also contributing to cross-border merger activityby increasing M&A targets and opening up economies to increased competition. Significant increases ininward M&As in Latin America and in Central and Eastern Europe are linked to privatisation of stateenterprises in telecommunications, energy and other sectors. In the case of Brazil, partly due to theprivatisation of public enterprises, inward M&As increased rapidly in recent years: from US$4.7 billion in1996 to US$12.6 billion in 1997 and US$24.8 billion in 1998.
The promotion of regional integration, as in Europe and North America, also provides opportunitiesfor expansion through cross-border M&As. In particular, the introduction of the euro may accelerate thecurrent widespread wave of M&As throughout the business sector of the euro-zone. Cross-border M&Asin Western Europe reached US$229 billion in 1998 compared to US$138 billion in 1997. The newcommon currency will reduce exchange rate risk and transaction costs across the European Union whichwill support trade and business expansion. On the other hand, the euro will increase transparency of pricesacross the European Union, which will add to competition and price discipline and promote industrialrestructuring, including the cross-border merger of firms. However, fundamental location decisions forforeign investment and mergers in Europe will likely remain dependent on factors linked to economicgeography, including the relative cost of production factors and the proximity to core markets (Miyake andThomsen, 1999).
DSTI/DOC(2000)1
34
PERFORMANCE EFFECTS OF CROSS-BORDER M&As
The general effect of cross-border M&A activities tends to be a re-organisation of industrial assetsand production structures on a global basis. This can lead to greater overall efficiency without necessarilysignificantly greater production capacity (OECD, 1996b). Cross-border M&As facilitate the internationalmovement of capital, technology, goods and services, and the integration of affiliates into global networks.Furthermore, such M&As can bring about efficiency gains through economies of scale and scope. Studiesof the performance effects of foreign direct investment, which increasingly consists of M&As, confirmeconomy-wide positive benefits particularly as regards improved productivity in host countries.
Cross-border M&As can also have positive impacts on growth and employment, particularly ifgovernments have policies which facilitate the associated industrial restructuring. In general, M&As canhave the following types of economic effects from the perspective of host countries (as compared togreenfield investments):
− Capital accumulation: Greenfield investments contribute to capital accumulation in thenearer term by establishing new plants, while M&As can contribute in the longer term. Asnew foreign owners expand their businesses in host countries, they may undertake newinvestments in plant and equipment. M&As may also contribute to capital accumulation in abroader sense, i.e. in terms of intangible capital such as advanced technology andmanagement skills, rather than merely physical capital.
− Employment creation: Similarly, greenfield investments tend immediately to create newjobs, while M&As undertaken for the purpose of restructuring often incur layoffs but maycontribute to employment gains in the longer term. M&A deals sometimes succeed by cuttingcapacity, which may mean a loss of product lines and jobs but which could also be essentialfor the survival of operations. In the long run, new foreign owners may expand theirbusinesses in the host country after successful restructuring, creating new employmentopportunities.
− Technology transfer: M&As as well as greenfield investments can incur positive spilloversby promoting the transfer of new technology, advanced management skills and other forms ofintangible assets to the host country. Foreign direct investment, in general, can have afavourable influence on industrial innovative capacity through technology transfer anddissemination.
− Competition: Greenfield investments increase competition in the host country by adding newentrants into markets, while initially M&As may decrease competition or at best may notalter market structure. However, firms acquired by foreign investors may initiate competitionwith incumbents in the host country with the help of financial resources and advancedmanagement know-how from parent companies. Furthermore, if inefficient target firms,which otherwise may be forced to exit, are acquired and restructured by foreign investors,M&As may enhance competition in the host country.
− Efficiency gains: M&As and greenfield investments can enhance efficiency in the hostcountry through technology transfer, industrial restructuring and enhancing competition. For
DSTI/DOC(2000)1
35
example, according to one study of foreign take-overs of British firms, foreign acquisitionsraised productivity (output per employee) as well as real wages, mainly due to higherinvestment per employee by the new foreign owners.
The gains from M&As for individual firms may differ from their overall economic effects, withfindings to date somewhat mixed. In terms of shareholder value, there is broad evidence that mergers entaila gain for the acquired firm, whereas the shareholders of the acquiring firm may break even at best (Caves,1989). There is a tendency for the shares of the acquiring firm to rise in the year of the merger, only tosubside and fall to zero or negative values in subsequent years. According to past studies, many mergersseem to have negative effects on productivity ex post; the observed gains from sell-offs and spin-offs ofbusinesses may be related to the removal of the inefficiencies associated with assembling them in the firstplace. It is important to bear in mind, however, that many of these results pertain to mergers undertaken forthe purpose of corporate diversification, with technical and managerial inefficiencies increasing when theacquiring companies lacked necessary competence in the particular industry of the acquired firm.
Earlier studies of mergers and acquisitions in the 1960s, 1970s and 1980s suggest that mergers weremore closely linked to excess funds than to cost savings or marketing synergies. Studies of USconglomerate mergers, where companies often lack a complete understanding of the firms they areacquiring, have shown that more than half of the acquired companies are sold off or liquidated within adecade. Studies of mergers in Japan, where managers have traditionally preferred internal growth andlooser forms of alliances, show that the M&A trend increased in the 1980s, but there was no evidence thatthe mergers improved profitability or growth for acquiring firms (Odagiri and Hase, 1989). Similar reviewsin European countries prompted doubts about M&As as generators of improved company performance(Mueller, 1980).
However, the bulk of these studies of the performance effects of M&As examined the period before1990. For most of these studies, questions have also been raised about the ability to accurately measure thefull benefits (or costs) of mergers. There are difficulties in estimating how the firms concerned would haveperformed in the absence of a merger. For example, firms may face a strategic choice in a race to be thefirst mover or to be acquired. There are problems in using profitability or share value as a test of efficiencygains. And there are contradictory findings for conglomerate mergers vs. horizontal mergers where theformer tend to show more negative results. Moreover, these results relate to mergers and acquisitions at thenational level, and it is unclear to what extent they would be relevant to cross-border M&As.
The existence of unprofitable mergers might also be explained by the fact that factors other thanmaximising shareholder value are driving strategic decisions. There is a substantial literature suggestingthat managerial incentives and objectives may differ from those of shareholders. For example, althoughprofitability decreases, mergers can help to maximise firm size or permanence and reduce business risk, allof which tend to be important objectives for managers if not for shareholders. In fact, acquisitions drivenby diversification and growth motives tend to result in lower acquirer returns (Morck et al., 1990). In sum,M&As may be undertaken for strategic reasons without being in the interest of either the firm or theoverall economy.
There has been little analysis of the performance effects of cross-border M&As or comparing theeffects of cross-border mergers to those of greenfield investments abroad. Recent M&As have tended to beamong same-sector firms rather than among those in different sectors (which could alter observedimpacts). Different factors, particularly the quest for global-level efficiency and the desire to mergeintangible assets, are now driving a large share of M&As. Recent research shows that intangibles such astechnological capacity may have an important influence on merger outcomes. The possession or lack offirm-specific intangible assets – including human and managerial resources, research capacity andtechnology, and product marks and brand names – can affect the performance of companies undertaking

DSTI/DOC(2000)1
36
mergers. Geographic and cross-industry diversifications tend to increase firm value in the presence ofintangible assets but decrease firm value in their absence (Morck and Yeung, 1999). In addition, the fullefficiency effects of M&As across international borders can only be assessed in the longer term. Cross-border M&As motivated by the desire to restructure in response to the globalisation of markets and a needfor economies of scale should have positive efficiency effects for OECD firms and economies in thepresence of properly functioning product and labour markets. However, the competition effects of suchmergers must also be carefully monitored.
DSTI/DOC(2000)1
37
CONCLUSIONS
In the 1990s, cross-border M&As are increasing in both frequency and size. The current wave ofM&As, while involving a wider range of countries, is mostly taking place in the OECD area. Cross-borderunions are occurring in all sectors, with some of the larger mergers seen in mature industrial sectors whereadjustment to over-capacity and reduced growth prospects is urgently needed. Cross-border M&As areappearing in many high-technology sectors in order to pool resources and abilities to remain competitiveand innovative. They are particularly characteristic of service sectors which, as a result of regulatoryreform, privatisation and liberalisation of trade and investment regimes, are now able to restructure morefreely at both the national and international levels. Unlike previous decades, these mergers are motivatedby the desire to consolidate capacities to serve global markets and fully benefit from scale economies. Theconcentration of resources on core competencies and the full utilisation of intangible assets are key to thecompetitive strategies of multinational firms. These are aims that may be better achieved through cross-border M&As than through other types of foreign investment.
Cross-border M&As can yield dividends in terms of company performance and profits as well asbenefits for home and host countries when successful industrial restructuring leads to greater efficiencywithout undue market concentration. International M&As can play a role in revitalising ailing firms andlocal economies and creating jobs through the restructuring process, acquisition of technology andproductivity growth. Yet, countries have differed widely in their openness to foreign direct investment,including cross-border M&As, and in the benefits they have realised from the ongoing globalisation ofindustry. Government policies and corporate culture caused some countries to be largely closed to foreignacquisitions until recently. Japan, Korea and some European countries have been slow to encourageindustrial restructuring through cross-border M&A although this is changing. Other countries, such as theUnited States and the United Kingdom, may realise efficiency improvements through such merger activityin the nearer term. Regulatory reform, privatisation and more equitable treatment of foreign firms in publicprocurement and other government programmes now signal a new openness which is encouraging moreinternational merger activity. The ongoing liberalisation of foreign investment regimes indicates that abroader range of countries could realise benefits from cross-border M&As.
However, countries which are hosts to a high level of cross-border M&A activity may not all benefitequally. The government policies and related framework conditions to garner positive spillover effectsfrom inward and outward foreign investment may not be in place. Poorly functioning factor and productmarkets could impede industrial restructuring through M&As and dampen any favourable impacts in termsof economic expansion and job creation. Flexible labour markets are essential for facilitating thecontraction, expansion and alterations of activities and employment which may stem from cross-borderM&As. The challenge for governments is to have appropriate frameworks in place to attract foreigninvestment, including M&As, and to realise efficiency gains and positive spillovers from theinterconnections between domestic and foreign firms.
Globalisation of industry through cross-border mergers and acquisitions has broader implications forindustry-related policies. As more domestic firms are taken over by foreign companies or acquire foreigncompanies and the interdependency of national economies increases, the relevance and effectiveness ofnational policies may decrease. Through international mergers, the nationality of firms is becoming evenmore vague. Multinational firms are more than ever footloose, with terms such as home and host countries

DSTI/DOC(2000)1
38
becoming meaningless. The firms themselves have facilities and employees in diverse countries, servemany national markets and purchase supplies and components worldwide. They are showing less loyalty toparticular countries and increasing resentment towards country-level regulations and restrictions whichmay hinder their activities and prevent them from realising the gains from cross-border investments. Thegrowing wave of cross-border M&A – driven by intangible as well as tangible factors – will demandgreater co-operation among countries in formulating industry-related policies which take into account theever-increasing international nature of firms.
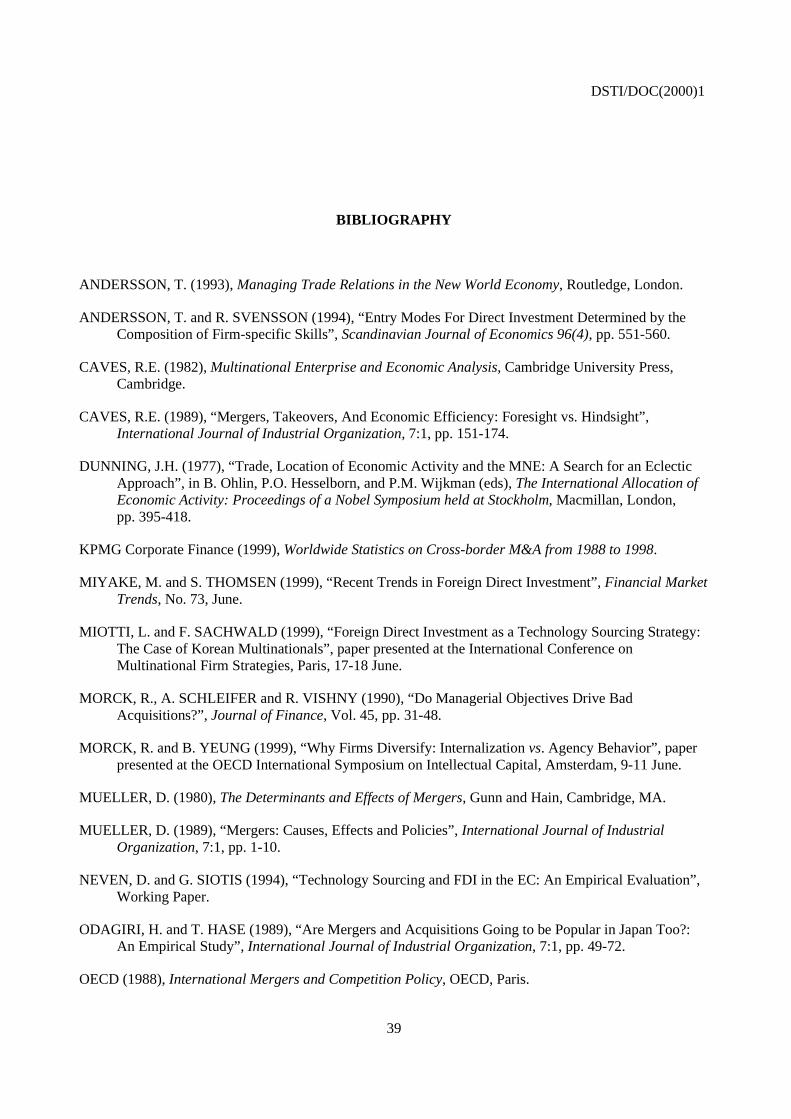
DSTI/DOC(2000)1
39
BIBLIOGRAPHY
ANDERSSON, T. (1993), Managing Trade Relations in the New World Economy, Routledge, London.
ANDERSSON, T. and R. SVENSSON (1994), “Entry Modes For Direct Investment Determined by theComposition of Firm-specific Skills”, Scandinavian Journal of Economics 96(4), pp. 551-560.
CAVES, R.E. (1982), Multinational Enterprise and Economic Analysis, Cambridge University Press,Cambridge.
CAVES, R.E. (1989), “Mergers, Takeovers, And Economic Efficiency: Foresight vs. Hindsight”,International Journal of Industrial Organization, 7:1, pp. 151-174.
DUNNING, J.H. (1977), “Trade, Location of Economic Activity and the MNE: A Search for an EclecticApproach”, in B. Ohlin, P.O. Hesselborn, and P.M. Wijkman (eds), The International Allocation ofEconomic Activity: Proceedings of a Nobel Symposium held at Stockholm, Macmillan, London,pp. 395-418.
KPMG Corporate Finance (1999), Worldwide Statistics on Cross-border M&A from 1988 to 1998.
MIYAKE, M. and S. THOMSEN (1999), “Recent Trends in Foreign Direct Investment”, Financial MarketTrends, No. 73, June.
MIOTTI, L. and F. SACHWALD (1999), “Foreign Direct Investment as a Technology Sourcing Strategy:The Case of Korean Multinationals”, paper presented at the International Conference onMultinational Firm Strategies, Paris, 17-18 June.
MORCK, R., A. SCHLEIFER and R. VISHNY (1990), “Do Managerial Objectives Drive BadAcquisitions?”, Journal of Finance, Vol. 45, pp. 31-48.
MORCK, R. and B. YEUNG (1999), “Why Firms Diversify: Internalization vs. Agency Behavior”, paperpresented at the OECD International Symposium on Intellectual Capital, Amsterdam, 9-11 June.
MUELLER, D. (1980), The Determinants and Effects of Mergers, Gunn and Hain, Cambridge, MA.
MUELLER, D. (1989), “Mergers: Causes, Effects and Policies”, International Journal of IndustrialOrganization, 7:1, pp. 1-10.
NEVEN, D. and G. SIOTIS (1994), “Technology Sourcing and FDI in the EC: An Empirical Evaluation”,Working Paper.
ODAGIRI, H. and T. HASE (1989), “Are Mergers and Acquisitions Going to be Popular in Japan Too?:An Empirical Study”, International Journal of Industrial Organization, 7:1, pp. 49-72.
OECD (1988), International Mergers and Competition Policy, OECD, Paris.
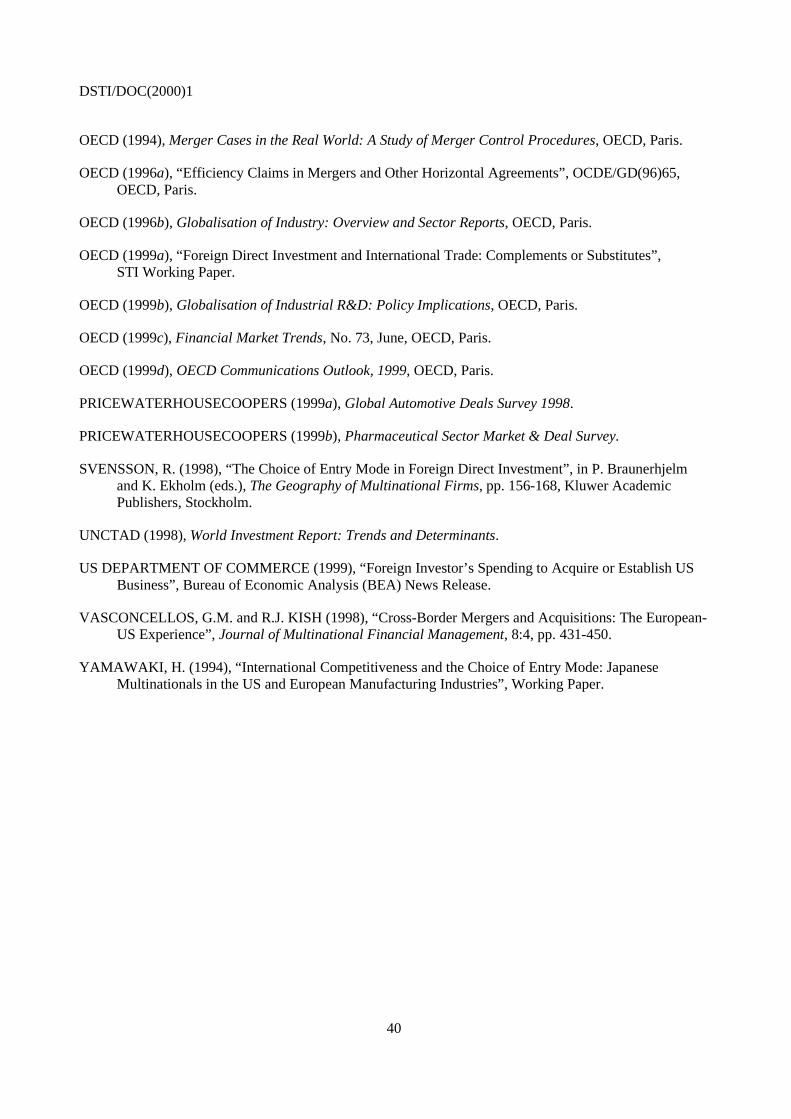
DSTI/DOC(2000)1
40
OECD (1994), Merger Cases in the Real World: A Study of Merger Control Procedures, OECD, Paris.
OECD (1996a), “Efficiency Claims in Mergers and Other Horizontal Agreements”, OCDE/GD(96)65,OECD, Paris.
OECD (1996b), Globalisation of Industry: Overview and Sector Reports, OECD, Paris.
OECD (1999a), “Foreign Direct Investment and International Trade: Complements or Substitutes”,STI Working Paper.
OECD (1999b), Globalisation of Industrial R&D: Policy Implications, OECD, Paris.
OECD (1999c), Financial Market Trends, No. 73, June, OECD, Paris.
OECD (1999d), OECD Communications Outlook, 1999, OECD, Paris.
PRICEWATERHOUSECOOPERS (1999a), Global Automotive Deals Survey 1998.
PRICEWATERHOUSECOOPERS (1999b), Pharmaceutical Sector Market & Deal Survey.
SVENSSON, R. (1998), “The Choice of Entry Mode in Foreign Direct Investment”, in P. Braunerhjelmand K. Ekholm (eds.), The Geography of Multinational Firms, pp. 156-168, Kluwer AcademicPublishers, Stockholm.
UNCTAD (1998), World Investment Report: Trends and Determinants.
US DEPARTMENT OF COMMERCE (1999), “Foreign Investor’s Spending to Acquire or Establish USBusiness”, Bureau of Economic Analysis (BEA) News Release.
VASCONCELLOS, G.M. and R.J. KISH (1998), “Cross-Border Mergers and Acquisitions: The European-US Experience”, Journal of Multinational Financial Management, 8:4, pp. 431-450.
YAMAWAKI, H. (1994), “International Competitiveness and the Choice of Entry Mode: JapaneseMultinationals in the US and European Manufacturing Industries”, Working Paper.