Embed Size (px)
Citation preview

MARCH 2016
HVS Singapore | 6 Temasek Boulevard, #23-01A Suntec City Tower Four, Singapore
HVS.com
IN FOCUS:
SINGAPORE
Eva Shen Huijun Analyst – Consulting & Valuation Ho Mei Leng Associate Director Chee Hok Yean Managing Partner

IN FOCUS: SINGAPORE | PAGE 1
The Republic of Singapore is a metropolitan
city-state and island country in Southeast Asia with a total land area of 714.3 square kilometres. It is situated at the southern tip of the Malayan Peninsula, between Malaysia and Indonesia. With an estimated population of 5.5 million, Singapore has established itself as a global commercial, financial, and transportation hub in the region. According to World Travel & Tourism Council, the direct and indirect contribution of Travel & Tourism to Singapore Gross Domestic Product (GDP) was 4.9% and 10.1%, respectively of the total GDP in 2014, making tourism one of the key supporting industries for the economy. Amongst the numerous international tourism awards and accolades received, Singapore has consistently ranked as one of the top destinations for various travel segments, which include leisure, business and meetings, incentives, conferences, and exhibitions (MICE). Despite its limited land space, Singapore has also managed to introduce new tourism attractions such as the Gardens by the Bay, River Safari, and the National Gallery.
Economic Outlook
In 2015, amidst weak global and regional market performance, Singapore’s economy grew at the lowest rate since rebounding from the financial crisis in 2009. Real GDP growth was 2.1% in 2015. The Singapore dollar weakened against the US dollar to a six-year low at the start of 2016 due to devaluation in Chinese yuan and increase in US interest rates. However, as compared to the currency performance of its neighbouring countries such as Malaysia and Indonesia, the Singapore dollar remains a strong currency in the region.
Given the linkages between Singapore’s and China’s economy and the uncertainty of the latter, weaker global trade performance and poor growth in the Southeast Asia region, growth is expected to remain slow in 2016. However, as pro-growth policies underlie Singapore’s development, long-term growth is expected to pick up given adjustments to economic policy in response to international developments.
2011 2012 2013 2014 2015 2016 2017 2018 2019 2020
Real GDP growth (%) 6.2 3.4 4.4 2.9 2.1 2.2 3.3 3.4 3.9 4.0
Consumer price inflation (av %) 5.3 4.5 2.4 1.0 0.5 1.0 1.8 2.2 2.3 2.5
Current-account balance (% of GDP) 22.0 17.2 17.9 19.1 26.6 24.0 22.8 22.9 21.9 20.6
Short-term interest rate (av %) 0.39 0.38 0.40 0.46 1.13 - - - - -
Exchange rate US$:S$ (av for period) 1.26 1.25 1.25 1.27 1.38 1.42 1.39 1.37 1.36 1.35
Source: Department of Statistics Singapore, the World Bank, Economist Intelligence Unit, Dec-Jan 2015/16
Actual Forecast
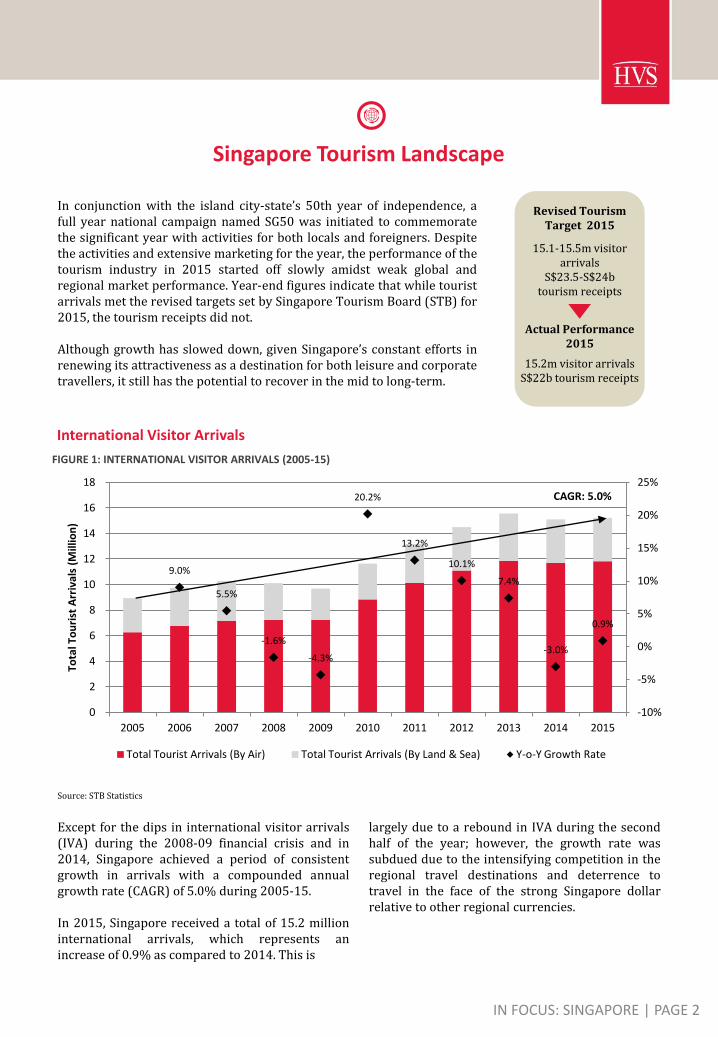
In conjunction with the island city-state’s 50th year of independence, a full year national campaign named SG50 was initiated to commemorate the significant year with activities for both locals and foreigners. Despite the activities and extensive marketing for the year, the performance of the tourism industry in 2015 started off slowly amidst weak global and regional market performance. Year-end figures indicate that while tourist arrivals met the revised targets set by Singapore Tourism Board (STB) for 2015, the tourism receipts did not. Although growth has slowed down, given Singapore’s constant efforts in renewing its attractiveness as a destination for both leisure and corporate travellers, it still has the potential to recover in the mid to long-term.
IN FOCUS: SINGAPORE | PAGE 2
Singapore Tourism Landscape
9.0%
5.5%
-1.6%
-4.3%
20.2%
13.2%
10.1%
7.4%
-3.0%
0.9%
-10%
-5%
0%
5%
10%
15%
20%
25%
0
2
4
6
8
10
12
14
16
18
2005 2006 2007 2008 2009 2010 2011 2012 2013 2014 2015
Tota
l To
uri
st A
rriv
als
(Mill
ion
)
FIGURE 1: INTERNATIONAL VISITOR ARRIVALS (2005-15)
Total Tourist Arrivals (By Air) Total Tourist Arrivals (By Land & Sea) Y-o-Y Growth Rate
Except for the dips in international visitor arrivals (IVA) during the 2008-09 financial crisis and in 2014, Singapore achieved a period of consistent growth in arrivals with a compounded annual growth rate (CAGR) of 5.0% during 2005-15. In 2015, Singapore received a total of 15.2 million international arrivals, which represents an increase of 0.9% as compared to 2014. This is
15.2m visitor arrivals S$22b tourism receipts
15.1-15.5m visitor arrivals
S$23.5-S$24b tourism receipts
Revised Tourism Target 2015
Actual Performance 2015
International Visitor Arrivals
Source: STB Statistics
CAGR: 5.0%
largely due to a rebound in IVA during the second half of the year; however, the growth rate was subdued due to the intensifying competition in the regional travel destinations and deterrence to travel in the face of the strong Singapore dollar relative to other regional currencies.

Average Length of Stay and Source Markets
Historically, the average length of stay (ALS) of travellers to Singapore was 3.8 days. However, this average is expected to dip slightly as day trips and shorter corporate trips to Singapore become more common. This may be due to the changing travel habits of travellers from nearby source markets. Top international source markets in 2015 remained consistent with 2014 rankings. The top five source markets made up 53% of all IVA in 2015, with Indonesia (17.9%) as the largest in-bound market, followed by China (13.8%), Malaysia (7.7%), Australia (6.9%) and India (6.7%). While the Indonesian arrivals contracted by 9.7% in 2015 as compared to 2014 due to the economic and political situation in Indonesia, the strong growth in Chinese and Indian arrivals picked up the slack. As a result, arrivals from the top five source markets grew marginally by 0.8% as compared to 2014.
2,731,690
2,106,164
1,171,077
1,043,568
1,013,986
-20%
-15%
-10%
-5%
0%
5%
10%
15%
20%
25%
30%
5% 10% 15% 20% 25%
Gro
wth
Co
mp
are
d t
o 2
01
4 (
%)
Percentage of Total Arrivals (%)
FIGURE 2: TOP 5 SOURCE MARKETS (2015)
Source: STB Statistics
IN FOCUS: SINGAPORE | PAGE 3
Changi Airport
Changi Airport, the internationally acclaimed airport in Singapore, logged a healthy performance in 2015. It handled a record 55.4 million passengers, which represents an increase of 2.5% as compared to the previous year. Serving more than 100 airlines and connecting with some 320 destinations, Changi Airport is one of the most well connected airports in the South East Asia region. This strengthens Singapore’s position as a transportation and transit hub. However, the benefits to the local tourism industry and to hotels in particular, depend on the proportion of passengers who are retained as overnight visitors. According to the MasterCard Global Destination Cities Index 2015 estimate, Singapore received 11.9 million overnight visitors. This amounts to around 21% of the passengers who pass through Changi Airport.
55.4 million passengers
100 + airlines 320 destinations
Record Performance for Changi Airport
2015

Singapore Hotel Market
Singapore hotel market can be considered as non-seasonal given the diversity of its consumer base. Leisure and corporate travel patterns complement each other and contribute to considerably high demand for hotels in Singapore. This leads to higher market-wide average daily rate (ADR) and occupancy rate (OCC) as compared to other regional destination cities. According to STB, in 2014, there were 220 gazetted hotels with a total of 50,676 available rooms. While URA figures in 4Q2014 indicated a total of 5,864 hotel rooms under construction in 2015, actually only about 4,000 rooms opened, as per HVS tracking of major new hotel openings. The balance hotel rooms were under construction or believed to be delayed.
FIGURE 3: SINGAPORE HOTEL ROOMS PIPELINE (2016-20)
Hotel Rooms Pipeline Total 2016 2017 2018 2019 2020 >2020
Total 8,514 2,731 2,973 1,026 1,568 216 -
Under Construction 7,712 2,731 2,973 590 1,202 216 -
Planned 802 - - 436 366 - -
Source: Urban Redevelopment Authority
According to Urban Redevelopment Authority Singapore figures in 4Q2015, a total of 5,704 hotel rooms are expected to be constructed in 2016 and 2017 (Fig. 3). The CAGR for total available room nights (ARN) during 2011-15 was 4.2% while that for occupied room nights (ORN) during the same time period was 4.0%. Marketwide hotel performance was softer in 2015 as compared to the previous years. Average occupancy rate came in at 85.0%, which is on par with 2014 performance. However, standard average room rate decreased by 4.8%, from SGD 258 in 2014 to SGD 246 in 2015. The dynamics of occupancy and rate have resulted in a decrease of 5.3% in RevPar from SGD 221 in 2014 to SGD 209 in 2015, which marks the third consecutive year of correction in marketwide RevPar.
86.0%
87.0%
86.3%
85.5%
85.0%
85%
85%
86%
86%
87%
87%
88%
0
50
100
150
200
250
300
2011 2012 2013 2014 2015
Jan-Dec Jan-Dec Jan-Dec Jan-Dec Jan-Dec
Occ
up
ancy
Rat
e (
%)
Ro
om
Rat
e (
S$)
FIGURE 4: SINGAPORE OVERALL HOTEL PERFORMANCE (2011-15)
Average Room Rate (S$) Revenue per Available Room (Revpar) (S$) Average Occupancy Rate (%)
Source: STB Statistics
IN FOCUS: SINGAPORE | PAGE 4

Key Factors for Decrease in ADR
Corporate demand from large
accounts in the oil and gas industry
fell due to the recent volatility in the
industry. This has led to lower room
demand and cut in the hotels’ price
premium.
Singapore has been increasingly perceived as an expensive destination relative to other regional cities; this may have dampened the travel demand and pushed hoteliers to decrease their rates.
Regional currencies such as Indonesian
rupiah and Malaysian ringgit have
weakened significantly against the
Singapore dollar, which has led visitors
from these main feeder markets to cut
down on overnight stays or turn to more
economic accommodation alternatives.
IN FOCUS: SINGAPORE | PAGE 5
88.1% 87.5%
86.5% 85.9%
87.1% 86.1%
86.6%
84.9% 85.5%
84.2%
80.0% 79.3%
74%
76%
78%
80%
82%
84%
86%
88%
90%
0
50
100
150
200
250
300
350
400
450
500
2013 2014 2015 2013 2014 2015 2013 2014 2015 2013 2014 2015
Luxury Upscale Mid-Tier Economy
Occ
up
ancy
Rat
e (
%)
Sin
gap
ore
Do
llar
(S$
)
FIGURE 5: SINGAPORE HOTEL PERFORMANCE BY SEGMENT (2013-15)
Average Room Rate (S$) RevPar (S$) Occupancy Rate (%)
Comparing performance across the segments, the luxury segment has managed to retain high rates, averaging SGD 449, while maintaining the occupancy in the high 80% range. Upscale hotels had the least decrease in OCC and ADR in 2015 as compared to the 2014 performance. The mid-tier hotels’ OCC had improved by 0.7% from 84.9% in 2014 to 85.5% in 2015. However, the improvement in occupancy is contrasted by a decrease of 5.6% in ADR. Meanwhile, economy hotels have seen a similar decrease in OCC as the mid-tier hotels while the ADR has improved as compared to 2013 rates.
Source: STB Statistics
However, given that the magnitude of the decrease is considerably small, there should be no pressing concern regarding the long-term sustainable revenue generation. Despite short-term headwinds, Singapore remains a hotspot for hotel industry with strong fundaments for future growth. Looking forward, 2016 sets out to be an eventful year with major events such as Singapore Airshow and Food & Hotel Asia Expo, which are likely to boost hotel demand.

Based on recorded transactions, in recent years,
hospitality asset investments in Singapore peaked
in 2013 with total transaction sale volume
achieving more than SGD 2,900 million and
involving 13 assets. Majority of the buyers involved
in hospitality asset transactions are Singapore-
based companies, with occasional foreign investors
from the region.
Most recent notable transactions are:
Acquisition of BIG Hotel by Gaw Capital from
ERC Holdings for approximately SGD 203
million.
Acquisition of Capri by Fraser Changi City by
Frasers Centrepoint from Ascendas Group
for approximately SGD 203.4 million.
Source: HVS Research, RCA
Hospitality Transactions
800
850
900
950
1,000
1,050
1,100
0
500
1,000
1,500
2,000
2,500
3,000
3,500
2011 2012 2013 2014 2015
Tho
usa
nd
(S$
)
Mill
ion
(S$
)
FIGURE 6: SINGAPORE HOTEL TRANSACTION (2011-15)
Total Hotel Transaction Volume (Sales Price at Time of Sale; Million S$) Average Price per Unit (Thousand S$)
IN FOCUS: SINGAPORE | PAGE 6
Some key hospitality transactions include: Gaw Capital bought the BIG Hotel at approximately SGD 203 million in 2015. Frasers Centrepoint bought Capri by Fraser Changi City at SGD203.4 million in 2015.
‘
’

Singapore Hotel Market Outlook 2016
Total Sample Set Results on Key Performance Indicators
Occupancy: 2.2% Average Rate: 3.8% Total Revenue: 3.4%
At the start of 2016, HVS conducted the Hotel Industry Professional Opinion Survey: Singapore, to collect professional opinions on the performance of the Singapore market for the year. The survey was sent out to Property-Based, Corporate Level and External Hospitality professionals. The Property-Based professionals represented a range of hotel segments varying from Luxury to Economy. The respondents were asked to gauge the expected percentage change of three key indicators: Occupancy Rate, Average Daily Rate, and Total Revenue in 2016 as compared to 2015.
By the end of the surveying period, we received 82 responses from hospitality industry professionals from a selected list of 180 respondents who are experienced in the Singapore market. The following section outlines the findings of the results.
Luxury Upper
Upscale Upscale Midscale Economy
Occupancy Rate Change (%) -1.2 -2.1 -2.3 -4.9 -3.0
ADR Change (%) -2.3 -4.2 -4.1 -4.7 -8.3
Total Revenue Change (%) -2.4 -2.9 -2.2 -6.0 -10.3
-12.0
-10.0
-8.0
-6.0
-4.0
-2.0
0.0
Pe
rce
nta
ge C
han
ge (
%)
FIGURE 7: AVERAGE PERCENTAGE CHANGE ON KEY INDICATORS BY HOTEL SEGMENT FOR 2016
Occupancy Rate Change (%) ADR Change (%) Total Revenue Change (%)
Source: HVS Survey and Research
IN FOCUS: SINGAPORE | PAGE 7

Property Based Professional
Corporate Level Professional
External Hospitality Professional
Occupancy Rate Change (%) -2.2 -2.8 -0.9
ADR Change (%) -4.0 -3.5 -3.1
Total Revenue Change (%) -3.2 -4.7 -0.9
-5.0 -4.5 -4.0 -3.5 -3.0 -2.5 -2.0 -1.5 -1.0 -0.5 0.0
Pe
rce
nta
ge C
han
ge (
%)
FIGURE 8: AVERAGE PERCENTAGE CHANGE ON KEY INDICATORS BY PROFESSIONAL TITLE FOR 2016
Occupancy Rate Change (%) ADR Change (%) Total Revenue Change (%)
Source: HVS Survey and Research
The findings indicate that the market professionals are expecting a slight decline in hotel performance across all key indicators in 2016. The expected decline is most pronounced in the Economy segment given the significant increase in supply and intensifying competition.
In general, the market sentiment is slightly pessimistic towards the hotel industry performance in 2016. This is mainly due to macro reasons such as the uncertainty in global and regional economy, currency fluctuation in the region and concerns with the Chinese market, which is Singapore’s top trading partner.
On a micro level, new hotel supply, intensified competition, decrease in corporate demand and labour shortage are issues that will affect the hotel industry’s ability to maintain current OCC and ADR levels. In view of the numerous initiatives by STB to promote Singapore, it is likely that despite the pessimism at the start of 2016, hotel performance may maintain at current levels.
The respondents also shared their views on which factors/events would impact Singapore's travel accommodation industry the most in 2016. A closer analysis on the responses yielded the following word cloud with the most frequently cited factors emphasized in red.
IN FOCUS: SINGAPORE | PAGE 8

Established Hub in the Southeast Asia Region
Singapore has established itself as a global commercial, financial and transportation hub in the region,
given its consistent improvement on infrastructure and business environment. Demand should remain
stable or rebound in the mid to long-term. For 2016, STB forecasts tourism receipts to be in the range of
S$22.0 to $22.4 billion and international visitor arrivals in the range of 15.2 to 15.7 million.
Uncertainty in Global Environment
Being an open economy, Singapore is highly affected by global and regional economic performance and
sentiments. As hotel performance is closely linked to the economic performance, uncertainty in global
economic environment will impact performance expectation negatively.
Moderation in Occupancy & Rate
Growth in arrivals will remain low while hotel supply increases, particularly in the mid-tier and economy
segment. This may lead to pressure on occupancy and average rate.
Attempts to Rejuvenate Tourism Products to Increase Attractiveness as a Destination
STB has deepened its collaboration with major inbound markets such as China and Japan through new
initiatives to boost arrival numbers. Furthermore, STB will continue to pull in demand by growing
secondary cities in top source markets and anchoring pipeline of business events.
Initiatives to Boost Hotels
Especially for the hotel industry, STB has introduced Hotel Sector Manpower Plan and Experience Step-
Up Fund which aim to improve the industry’s competitiveness. The combination of new initiatives and
industry’s well-established foundations will enable hotel performance to recover in the mid to long term.
What’s Next
IN FOCUS: SINGAPORE | PAGE 9

HVS Singapore | 6 Temasek Boulevard, #23-01A Suntec City Tower Four, Singapore
HVS.com
About HVS HVS, the world’s leading consulting and services organization focused on the hotel, mixed-use, shared ownership, gaming, and leisure industries, celebrated its 35th anniversary last year. Established in 1980, the company performs 4,500+ assignments each year for hotel and real estate owners, operators, and developers worldwide. HVS principals are regarded as the leading experts in their respective regions of the globe. Through a network of more than 35 offices and more than 500 professionals, HVS provides an unparalleled range of complementary services for the hospitality industry. HVS.com
Superior Results through Unrivalled Hospitality
Intelligence. Everywhere. HVS ASIA PACIFIC is represented by eight offices in Singapore, Bangkok, Beijing, Hong Kong, Jakarta, New Delhi, Shanghai and Shenzhen. HVS also hosts three of the main annual industry events in the region, namely the China Hotel Investment Conference (CHIC), Hotel Investment Conference - South Asia (HICSA) and the Tourism, Hotel Investment & Networking Conference (THINC) Indonesia. Additionally, HVS publishes a wide range of leading research reports, articles and surveys, which can be downloaded from our online library (HVS.com/Library). HVS SINGAPORE team has worked on a broad array of projects that include economic studies, hotel valuations, operator search and management contract negotiation, development strategies for new brands, asset management, research reports and investment advisory for hotels, resorts, serviced residences and branded residential development projects.
About the Authors
Eva Shen is an Analyst with HVS Singapore. She graduated as the valedictorian of her class while earning a Bachelor of Science Degree (Merit) in International Hospitality Management from École hôtelière de Lausanne. Previously, she was involved in
hospitality-related operational and consultancy work in Singapore and China. As part of the consulting and valuation team, she specializes in research and analysis for markets in Southeast Asian region. [email protected]
Hok Yean CHEE is the Managing Partner of HVS Singapore. She has 30 years of experience in more than 30 markets across 19 countries in Asia Pacific, providing real estate investment advisory services for a wide spectrum of property assets. Her forte lies in providing investment advisory on hotels and
serviced apartments including brokerage, strategic analyses, operator search, market feasibility studies, valuations and litigation support. [email protected]
Ho Mei Leng is the Associate Director with HVS Singapore and she brings with her professional real estate experience of some 20 years to the firm. Apart from Sales and Marketing, she has experience in the hotel and hospitality advisory services including market and feasibility studies, operator search, market studies, operator search, market research and
valuations [email protected]