Embed Size (px)
Citation preview
Subscriber access provided by Aix Marseille Universités
Analytical Chemistry is published by the American Chemical Society. 1155Sixteenth Street N.W., Washington, DC 20036
Technical Note
Nanoaperture-Enhanced Signal-to-Noise Ratioin Fluorescence Correlation Spectroscopy
Je#ro#me Wenger, Davy Ge#rard, Heykel Aouani, Herve# Rigneault,Bryan Lowder, Steve Blair, Eloi#se Devaux, and Thomas W. Ebbesen
Anal. Chem., 2009, 81 (2), 834-839 • DOI: 10.1021/ac8024015 • Publication Date (Web): 19 December 2008
Downloaded from http://pubs.acs.org on January 15, 2009
More About This Article
Additional resources and features associated with this article are available within the HTML version:
• Supporting Information• Access to high resolution figures• Links to articles and content related to this article• Copyright permission to reproduce figures and/or text from this article
Nanoaperture-Enhanced Signal-to-Noise Ratio inFluorescence Correlation Spectroscopy
Jerome Wenger,* Davy Gerard, Heykel Aouani, and Herve Rigneault
Institut Fresnel, Aix-Marseille Universite, CNRS, Domaine Universitaire de Saint-Jerome,13397 Marseille Cedex 20, France
Bryan Lowder and Steve Blair
University of Utah, Electrical and Computer Engineering Department, 50 South Central Campus Drive,Room 3280, Salt Lake City, Utah
Eloıse Devaux and Thomas W. Ebbesen
Institut de Science et d‘Ingenierie Supramoleculaire, Universite Louis Pasteur, CNRS, 8 Allee G. Monge,67000 Strasbourg, France
The fluorescence enhancement found in gold nanoaper-tures is demonstrated to increase the signal-to-noise ratio(SNR) in fluorescence correlation spectroscopy (FCS).Starting from a general discussion on noise in FCSexperiments, we show that fluorescence enhancementleads to a dramatic increase in the SNR. This predictionis confirmed by experiments where we report an experi-mental gain in SNR of about 1 order of magnitude,corresponding to a 100-fold reduction of the experimentduration. This technique is then applied to monitor thekinetics of a fast enzymatic cleavage reaction. This set ofexperiments evidence the feasibility of FCS analysis withfast integration times of about 1 s, opening the way to themonitoring of a variety of biochemical reactions at reducedtime scales.
Fluorescence correlation spectroscopy (FCS) is a powerful andversatile tool for the analysis of biomolecular interactions.1,2 FCScan in principle provide information about any molecular dynamicprocess that induces a change in fluorescence intensity, includingtranslational and rotational diffusion, molecular concentrations,chemical kinetics, and binding reactions.3,4 It is based on thestatistical analysis of fluorescence intensity fluctuations and iscommonly performed by computing the second order temporalcorrelation of the fluorescence trace to construct the so-calledautocorrelation function (ACF). The two detection events involvedin the ACF have nonzero physical correlations only if theyoriginate from the same molecule. This highlights the single
molecule nature of FCS, even though this technique does not relyon the explicit tracking of individual molecules.
Noise and statistical accuracy in FCS are important consider-ations. First, the understanding of signal-to-noise ratio enablesoptimization of the experimental apparatus. Second, properweighting procedures based on statical estimates for the noiseenable more accurate analysis. Therefore, several authors haveconsidered the issue of determining the expected noise in FCSsince Koppel’s seminal contribution in 1974.5-13 Two physicalphenomena contribute to the noise in FCS: the quantum natureof light that induces shot noise and the stochastic nature of thefluorescence fluctuation process itself. A major result from Koppel’swork is that the signal-to-noise ratio (SNR) in FCS does notdepend>on the total detected fluorescence but on the fluorescencecount rate per molecule (CRM) times the square root of the totalexperiment acquisition time Ttot and the correlator channel mini-mum width ∆τ: SNR ∝ CRM(Ttot∆τ)1/2. This further emphasizesthe single molecule nature of FCS and provides guidelines toimprove the statistical accuracy in FCS. For a fixed experimentalapparatus, one can either increase the excitation power to raisethe CRM or wait for longer integration times Ttot. However, bothof these strategies have significant practical limitations. First,saturation and photobleaching limit the CRM increase to a certainextent. Second, because of the square root dependence of theSNR on the acquisition time, increasing Ttot to a few hundredseconds has only a minor influence on the SNR.
* To whom correspondence should be addressed. E-mail: [email protected].
(1) Eigen, M.; Rigler, R. Proc. Natl. Acad. Sci. U.S.A. 1994, 91, 5740–5747.(2) Briddon, S. J.; Hill, S. J. Trends Pharmacol. Sci. 2007, 28, 637–645.(3) Rigler, R.; Elson, E. S. Fluorescence Correlation Spectroscopy, Theory and
Applications; Springer: Berlin, Germany, 2001.(4) Zander, C. Enderlein, J.; Keller, R. A. Single-Molecule Detection in Solution:
Methods and Applications; VCH-Wiley: New York, 2002.
(5) Koppel, D. E. Phys. Rev. A 1974, 10, 1938–1945.(6) Geerts, H. J. Biochem. Biophys. Methods 1983, 7, 255–261.(7) Qian, H. Biophys. Chem. 1990, 38, 49–57.(8) Kask, P.; Gunther, R.; Axhausen, P. Eur. Biophys. J. 1997, 25, 163–169.(9) Meseth, U.; Wohland, T.; Rigler, R.; Vogel, H. Biophys. J. 1999, 76, 1619–
1631.(10) Wohland, T.; Rigler, R.; Vogel, H. Biophys. J. 2001, 80, 2987–2999.(11) Saffarian, S.; Elson, E. L. Biophys. J. 2003, 84, 2030–2042.(12) Enderlein, J.; Gregor, I.; Patra, D.; Fitter, J. J. Fluoresc. 2005, 15, 415–
422.(13) Rao, R.; Langoju, R.; Gosch, M.; Rigler, P.; Serov, A.; Lasser, T. J. Phys.
Chem. A 2006, 110, 10674–10682.
Anal. Chem. 2009, 81, 834–839
10.1021/ac8024015 CCC: $40.75 2009 American Chemical Society834 Analytical Chemistry, Vol. 81, No. 2, January 15, 2009Published on Web 12/19/2008
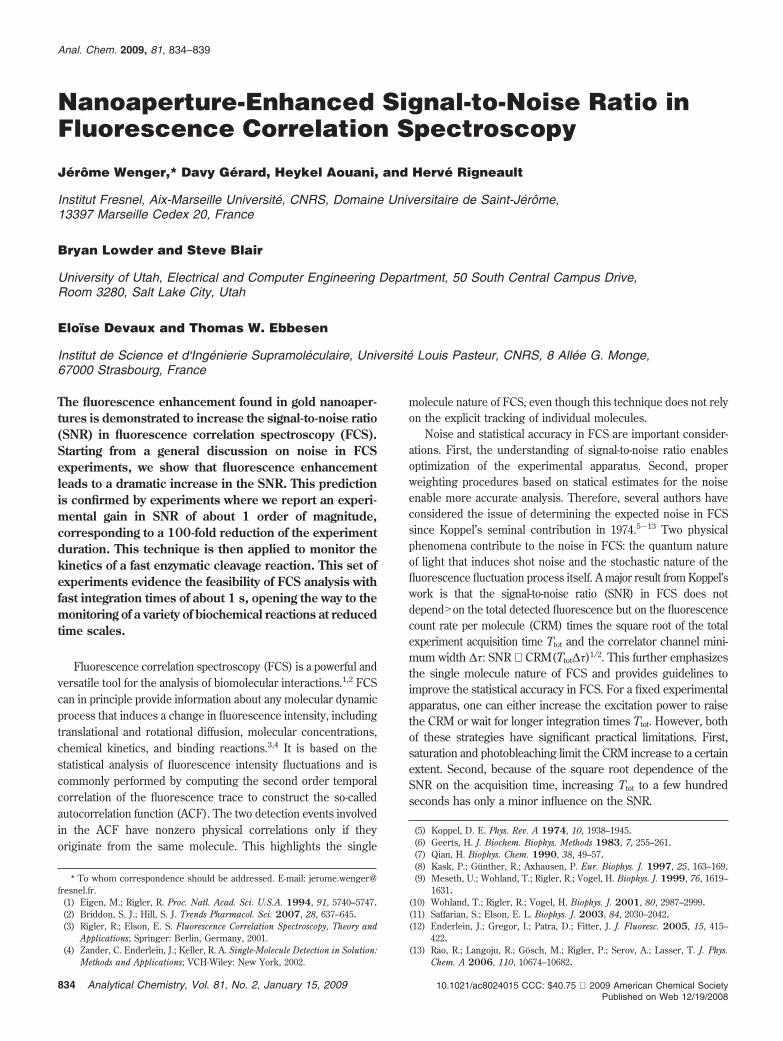
Nanophotonics offers new opportunities to further improve thedetection of single fluorescent molecules.14 The CRM can beincreased more than 10 times by tailoring the photonic environ-ment.15 Simultaneously, the detection volume can be reduced tolower the background noise and provide an enlarged domain ofmolecular concentrations for FCS. Among the many differentnanophotonics techniques that have been implemented recently(see ref 16 for a review), nanometer-size apertures milled in anopaque metallic film stand out as promising tools.17,18 As il-lustrated on Figure 1, the nanoaperture acts as a pinhole filterdirectly placed into the object plane of a standard invertedmicroscope. When the aperture diameter is reduced below thecutoff diameter of the excitation mode in the aperture, the lightinside the structure is confined to a rapidly decaying evanescentmode, with a decay length of a few tens of nanometers. Althoughthe concept appears very simple, such nanoapertures exhibitattractive properties for biophotonics, such as localization ofexcitation light,17,19,20 strong isolation from emission producedby species located outside the aperture,21,22 and an increase inthe fluorescence signal.23,24
Studies on nanoaperture-enhanced fluorescence point out thatfor a properly tailored aperture, CRM greater than a few hundredsof thousands photons per second can be readily obtained,25,26
whereas for a single molecule in open solution, fluorescencesaturation prevents the count rate from exceeding a few tens ofthousands of counts per second. It is therefore anticipated thatthe nanoaperture-enhanced CRM will yield a much higher SNRin FCS experiments. However, no experimental demonstration hashitherto been presented. In this article, we present the firstdetailed discussion on the SNR increase when performing FCSin a properly designed nanoaperture. We report an experimentalgain in SNR of about 1 order of magnitude and discuss theevolution of the SNR for an arbitrary lag time. Last, we apply thisSNR increase to follow the kinetics of a fast enzymatic cleavagereaction.
The paper is outlined as follows. In the Theory section, wegive a theoretical background on the noise in FCS. Noisemeasurements corresponding to a generic situation in FCS arepresented in Noise in FCS with Nanoapertures. A specificapplication to an enzymatic cleavage reaction is described inApplication to Enzymatic Cleavage Reaction. Finally in Conclusionwe summarize our contributions.
THEORYIn an FCS experiment, the temporal fluctuations F(t) of the
fluorescence signal are recorded, and the autocorrelation (ACF)of this signal is computed:
G(τ)) ⟨F(t) . F(t+ τ)⟩⟨F(t)⟩2 (1)
(14) Craighead, H. G. Nature 2006, 442, 387–393.(15) Fort, E.; Gresillon, S. J. Phys. D: Appl. Phys. 2008, 41, 013001.(16) Blom, H.; Kastrup, L.; Eggeling, C. Curr. Pharm. Biotechnol. 2006, 7, 51–
66.(17) Levene, M. J.; Korlach, J.; Turner, S. W.; Foquet, M.; Craighead, H. G.;
Webb, W. W. Science 2003, 299, 682–686.(18) Lenne, P. F.; Rigneault, H.; Marguet, D.; Wenger, J. Histochem. Cell Biol.
2008, 130, 795–805.(19) Samiee, K. T.; Moran-Mirabal, J. M.; Cheung, Y. K.; Craighead, H. G.
Biophys. J. 2006, 90, 3288–3299.(20) Wenger, J.; Gerard, D.; Lenne, P.-F.; Rigneault, H.; Dintinger, J.; Ebbesen,
T. W.; Boned, A.; Conchonaud, F.; Marguet, D. Opt. Express 2006, 14,12206–12216.
(21) Liu, Y.; Bishop, J.; Williams, L.; Blair, S.; Herron, J. Nanotechnology 2004,15, 1368–1374.
(22) Moran-Mirabal, J. M.; Torres, A. J.; Samiee, K. T.; Baird, B.; Craighead,H. G. Nanotechnology 2007, 18, 195101.
(23) Liu, Y.; Blair, S. Opt. Lett. 2003, 28, 507–509.(24) Rigneault, H.; Capoulade, J.; Dintinger, J.; Wenger, J.; Bonod, N.; Popov,
E.; Ebbesen, T. W.; Lenne, P.-F. Phys. Rev. Lett. 2005, 95, 117401.(25) Gerard, D.; Wenger, J.; Bonod, N.; Popov, E.; Rigneault, H.; Mahdavi, F.;
Blair, S.; Dintinger, J.; Ebbesen, T. W. Phys. Rev. B 2008, 77, 045413.(26) Wenger, J.; Gerard, D.; Bonod, N.; Popov, E.; Rigneault, H.; Dintinger, J.;
Mahboub, O.; Ebbesen, T. W. Opt. Express 2008, 16, 3008–3020.
Figure 1. Schematics of the experimental setup and electronmicrograph of a 120 nm aperture milled in a gold film.
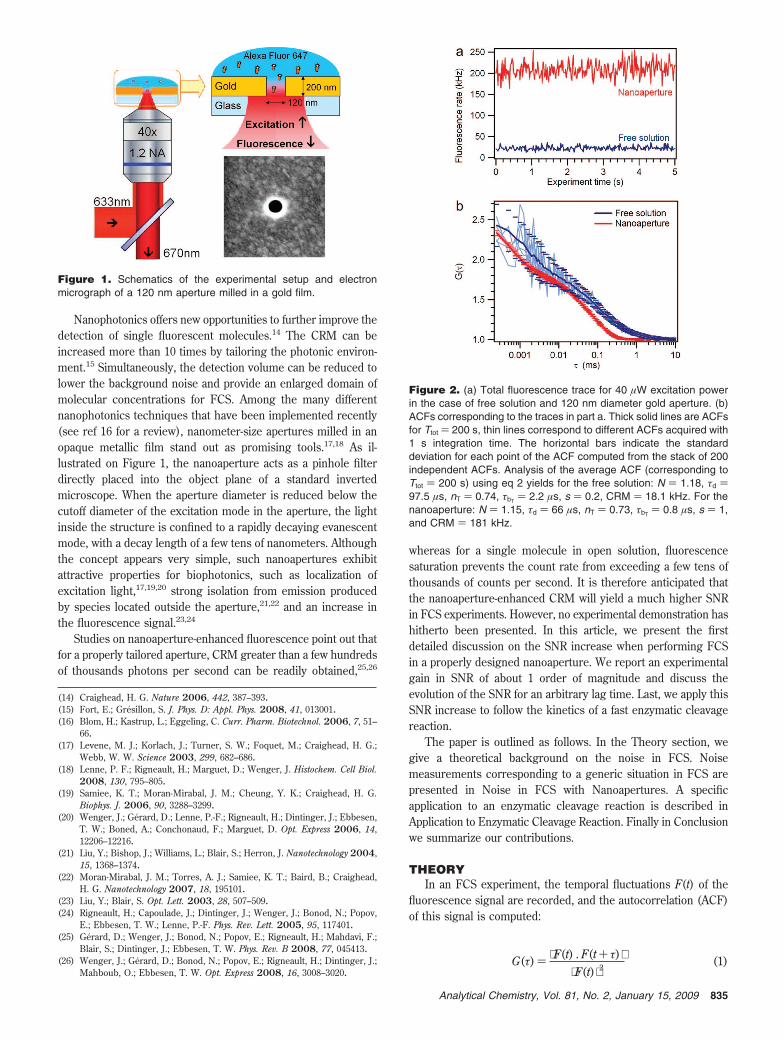
Figure 2. (a) Total fluorescence trace for 40 µW excitation powerin the case of free solution and 120 nm diameter gold aperture. (b)ACFs corresponding to the traces in part a. Thick solid lines are ACFsfor Ttot ) 200 s, thin lines correspond to different ACFs acquired with1 s integration time. The horizontal bars indicate the standarddeviation for each point of the ACF computed from the stack of 200independent ACFs. Analysis of the average ACF (corresponding toTtot ) 200 s) using eq 2 yields for the free solution: N ) 1.18, τd )97.5 µs, nT ) 0.74, τbT ) 2.2 µs, s ) 0.2, CRM ) 18.1 kHz. For thenanoaperture: N ) 1.15, τd ) 66 µs, nT ) 0.73, τbT ) 0.8 µs, s ) 1,and CRM ) 181 kHz.
835Analytical Chemistry, Vol. 81, No. 2, January 15, 2009
where τ is the delay (lag) time, and ⟨ .⟩ stands for time averaging.For free Brownian three-dimensional diffusion and Gaussianmolecular detection efficiency, the ACF can be expressed as3,4
G(τ)) 1+ 1N(1-
⟨B⟩⟨F⟩ )2[1+ nT exp(- τ
τbT)]g(τ) (2)
with
g(τ)) 1
(1+ τ ⁄ τd)√1+ s2τ ⁄ τd
(3)
where N is the total number of fluorescent molecules, ⟨F⟩ the totalsignal, ⟨B⟩ the background noise, nT the amplitude of the darkstate population, τbT the dark state blinking time, τd the meandiffusion time, and s the ratio of transversal to axial dimensionsof the analysis volume. We note that strictly speaking, theassumption of a free 3D-diffusion model is not fulfilled withinan aperture. However, this discrepancy can be taken intoaccount by setting the aspect ratio s as a free parameter: itconverges to a value close to unity for each run. As alreadypointed out in refs 25 and 26, this model fits the experimentaldata remarkably well. Lastly, the count rate per molecule iscomputed as CRM ) (⟨F⟩ - ⟨B⟩)/N.
Koppel considered the case of a large number of molecules inthe observation volume N . 1, small duration of the countinginterval compared to the diffusion time ∆τ , τd, negligiblebackground, uniform illumination, and exponential form of theACF. Under these assumptions, the signal-to-noise ratio for thefirst channel of the ACF is obtained from Koppel’s eq 40:
SNRτf0 )CRM√Ttot∆τ
(1+ 4CRM∆τ+ 2CRM2τd∆τ2)1⁄2
=CRM√Ttot∆τ (4)
As discussed in the introduction, the SNR is proportional to thecount rate per molecule times the square root of the totalmeasurement time.
To compute the noise in the ACF at longer lag times, we usethe same procedure as Meseth and co-workers,9 and Wohlandand co-workers.10 The standard deviation of the experimentalpoints in the ACF are computed according to a generalization ofKoppel’s eq 34 with proper normalization:
σ2(G(τ))) 1MN2[ (1+ g2(∆τ))(1+ g2(τ))
1- g2(∆τ)+ 2mg2(τ)] +
1M[2(1+ g2(τ))
N⟨n⟩+ 1
⟨n⟩2(1+ g(τ)N )] (5)
where M ) Ttot/∆τ, m ) τ/∆τ, and ⟨n⟩ the average count rateper correlator channel of width ∆τ. This estimation of thestandard deviation is only an approximation of the real noise,but it has previously been demonstrated to be qualitativelycorrect.9,10 We point out that care must be taken to model thecase of multitau correlators commonly used in FCS, as ∆τ is anonlinear function of the lag time τ.
Interestingly, taking eq 5 in the limit where τ f 0 and ∆τ f0 provides a formula for the generalized SNR for the first channelof the ACF for the most common experimental conditions for FCS:Gaussian molecular detection efficiency, 3D Brownian diffusion,negligible background, and small width of the counting intervalbut without any assumption on the number of molecules N. Aftersome basic algebra, one obtains
SNRτf0=CRM√Ttot∆τ
(1+ 1 ⁄ N)1⁄2 (6)
This formula is very close to eq 4 derived by Koppel; althoughthe supplementary 1/N term in the denominator accounts for thedependence on the number of molecules. Similar scaling wasalready obtained by Qian:7 SNR ∝ N1/2 if N , 1. The physicalinterpretation of this term is that when N , 1, a significantfraction of the measurement time is wasted waiting for adetection event. In the next section, we will present noisemeasurements corresponding to three-dimensional Browniandiffusion of a molecular dye, which is a common case in FCS.
NOISE IN FCS WITH NANOAPERTURESFor the FCS experiments in nanoapertures, we coated 200 nm
thick gold films on conventional glass microscope coverslips(thickness 150 µm) by thermal evaporation. A 15 nm thickchromium layer ensures adhesion between gold and the glasssubstrate. Circular apertures of 120 nm diameter were then milledby a focused ion beam (FEI Strata DB235). This diameter waschosen so as to yield the optimum fluorescence enhancement forAlexa Fluor 647 (A647) dyes excited at 633 nm.25 Our customFCS setup is based on an inverted confocal microscope with a1.2 NA microscope objective. The setup has already been detailedin refs 25 and 26, and it is schematically recalled in Figure 1 forcompleteness. A droplet of 50 µL of water solution containing A647molecules was deposited either on top of the nanoaperture sampleor on a standard microscope coverslip for the reference case offree solution. As usual in confocal FCS, the droplet acts as areservoir of molecules that are constantly diffusing in and out ofthe observation volume. This strongly limits photobleachingeffects. The excitation power was set to 40 µW at 633 nmwavelength. We stress that all the data presented here have beenmeasured at this rather low excitation intensity to ensure that thedyes are well below saturation. The detection was performedwithin the 650-690 nm spectral window, covering about 70% ofA647 fluorescence spectrum. The experimental ACFs werecomputed with a ALV-GmbH ALV6000 hardware multitau corr-elator, with a minimum channel width of 250 ns.
To investigate the SNR in FCS while using nanoapertures, weconducted 200 successive acquisitions of Ttot ) 1 s duration.Figure 2a presents a snapshot of the raw fluorescence signal forthe free solution and the nanoaperture. Figure 2b displays severalACFs for Ttot ) 1 s integration, together with the average ACFcorresponding to Ttot ) 200 s. To ensure a direct comparisonbetween the SNRs for both cases, we kept the average numberof molecules in each observation volume as close as possibleby choosing appropriate dilutions. We obtained N ) 1.18molecules for the free solution and N ) 1.15 for the nanoap-erture. This avoids artifacts brought by the dependence of the
836 Analytical Chemistry, Vol. 81, No. 2, January 15, 2009
SNR on N, as shown by eq 6. With comparison of thefluorescence levels in Figure 2a and given that the number ofmolecules probed by FCS are equivalent, it is clear that the CRMis dramatically increased within the nanoaperture, which testifiesto the fluorescence enhancement brought by the nanoaperture.Numerical analysis of the average ACF using eq 2 yields CRM )18.1 kHz for the free solution and CRM ) 181 kHz for thenanoaperture, corresponding to a fluorescence rate enhancementof 10. It is also apparent from the raw ACFs in Figure 2 that theSNR in the case of Ttot ) 1 s is far better for the nanoaperturethan for the free solution. Hereafter, we will focus on thequantitative evaluation of the SNR increase while using thenanoaperture.
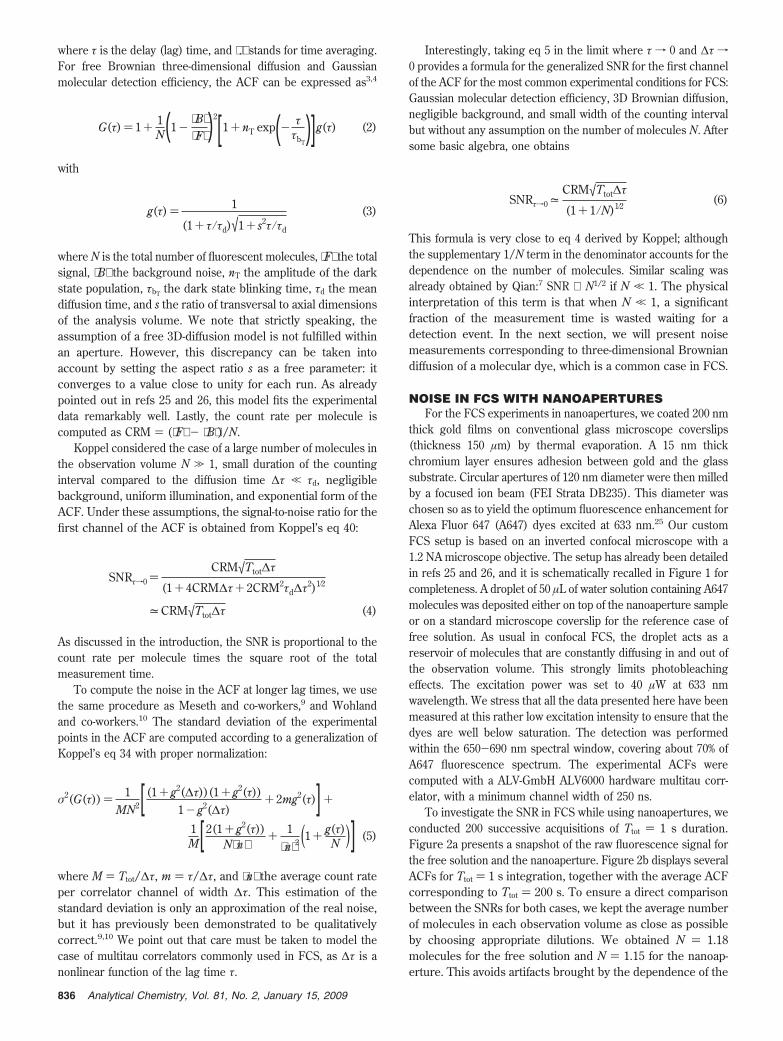
Figure 3 provides a closer look at the statistical distribution ofthe first channel of the ACF G(0). Histograms of G(0) obtainedfor 200 runs on free solution or 120 nm aperture are presented.From this data, the mean and the standard deviation of G(0) canbe inferred, yielding a SNR of 8.7 for free solution, while SNR )65.4 for the nanoaperture. The nanostructure brings therefore again on SNR of 7.5, which immediately contributes to better FCSdata analysis. These figures are to be compared to the theoreticalpredictions according to Koppel’s generalized formula eq 6 whichyields a SNR of 6.7 for free solution and 66.2 for the nanoaperture,in very good agreement with the experimental measurements.
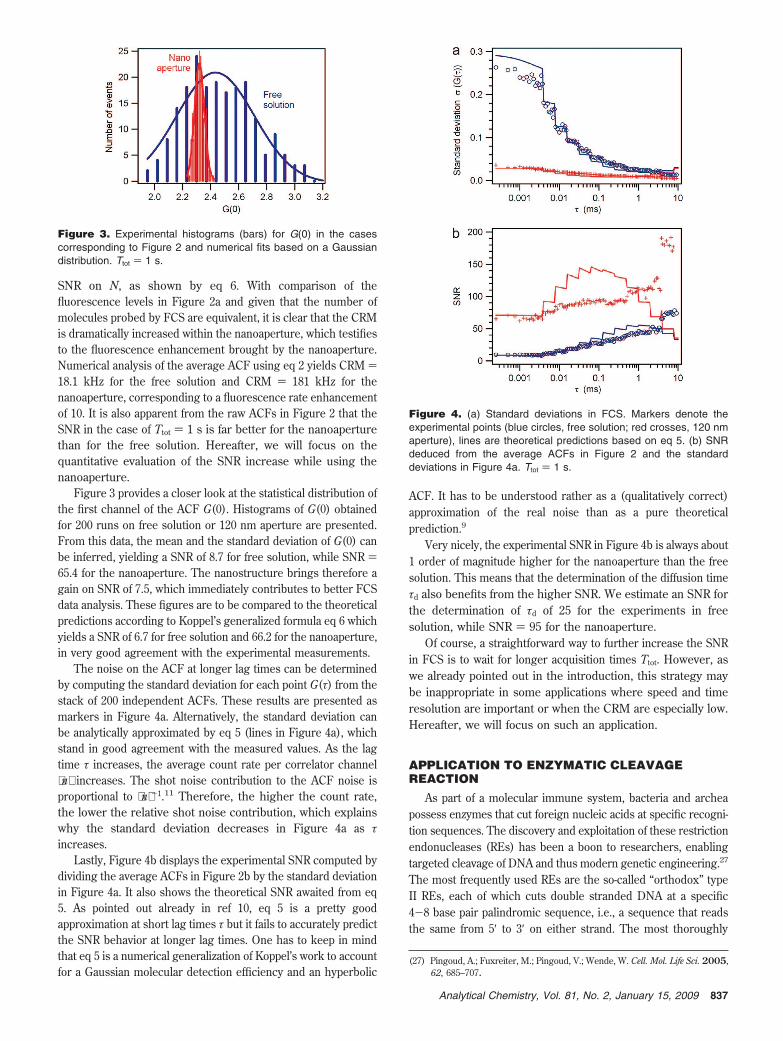
The noise on the ACF at longer lag times can be determinedby computing the standard deviation for each point G(τ) from thestack of 200 independent ACFs. These results are presented asmarkers in Figure 4a. Alternatively, the standard deviation canbe analytically approximated by eq 5 (lines in Figure 4a), whichstand in good agreement with the measured values. As the lagtime τ increases, the average count rate per correlator channel⟨n⟩ increases. The shot noise contribution to the ACF noise isproportional to ⟨n⟩-1.11 Therefore, the higher the count rate,the lower the relative shot noise contribution, which explainswhy the standard deviation decreases in Figure 4a as τincreases.
Lastly, Figure 4b displays the experimental SNR computed bydividing the average ACFs in Figure 2b by the standard deviationin Figure 4a. It also shows the theoretical SNR awaited from eq5. As pointed out already in ref 10, eq 5 is a pretty goodapproximation at short lag times τ but it fails to accurately predictthe SNR behavior at longer lag times. One has to keep in mindthat eq 5 is a numerical generalization of Koppel’s work to accountfor a Gaussian molecular detection efficiency and an hyperbolic
ACF. It has to be understood rather as a (qualitatively correct)approximation of the real noise than as a pure theoreticalprediction.9
Very nicely, the experimental SNR in Figure 4b is always about1 order of magnitude higher for the nanoaperture than the freesolution. This means that the determination of the diffusion timeτd also benefits from the higher SNR. We estimate an SNR forthe determination of τd of 25 for the experiments in freesolution, while SNR ) 95 for the nanoaperture.
Of course, a straightforward way to further increase the SNRin FCS is to wait for longer acquisition times Ttot. However, aswe already pointed out in the introduction, this strategy maybe inappropriate in some applications where speed and timeresolution are important or when the CRM are especially low.Hereafter, we will focus on such an application.
APPLICATION TO ENZYMATIC CLEAVAGEREACTION
As part of a molecular immune system, bacteria and archeapossess enzymes that cut foreign nucleic acids at specific recogni-tion sequences. The discovery and exploitation of these restrictionendonucleases (REs) has been a boon to researchers, enablingtargeted cleavage of DNA and thus modern genetic engineering.27
The most frequently used REs are the so-called “orthodox” typeII REs, each of which cuts double stranded DNA at a specific4-8 base pair palindromic sequence, i.e., a sequence that readsthe same from 5′ to 3′ on either strand. The most thoroughly
(27) Pingoud, A.; Fuxreiter, M.; Pingoud, V.; Wende, W. Cell. Mol. Life Sci. 2005,62, 685–707.
Figure 3. Experimental histograms (bars) for G(0) in the casescorresponding to Figure 2 and numerical fits based on a Gaussiandistribution. Ttot ) 1 s.
Figure 4. (a) Standard deviations in FCS. Markers denote theexperimental points (blue circles, free solution; red crosses, 120 nmaperture), lines are theoretical predictions based on eq 5. (b) SNRdeduced from the average ACFs in Figure 2 and the standarddeviations in Figure 4a. Ttot ) 1 s.
837Analytical Chemistry, Vol. 81, No. 2, January 15, 2009
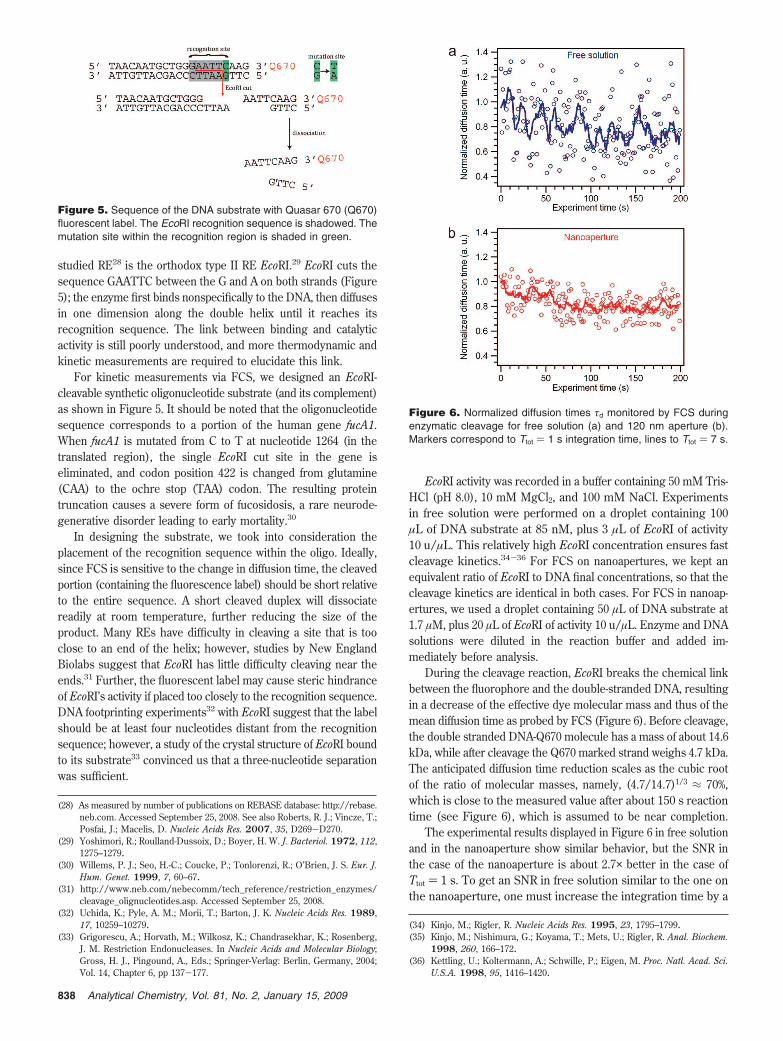
studied RE28 is the orthodox type II RE EcoRI.29 EcoRI cuts thesequence GAATTC between the G and A on both strands (Figure5); the enzyme first binds nonspecifically to the DNA, then diffusesin one dimension along the double helix until it reaches itsrecognition sequence. The link between binding and catalyticactivity is still poorly understood, and more thermodynamic andkinetic measurements are required to elucidate this link.
For kinetic measurements via FCS, we designed an EcoRI-cleavable synthetic oligonucleotide substrate (and its complement)as shown in Figure 5. It should be noted that the oligonucleotidesequence corresponds to a portion of the human gene fucA1.When fucA1 is mutated from C to T at nucleotide 1264 (in thetranslated region), the single EcoRI cut site in the gene iseliminated, and codon position 422 is changed from glutamine(CAA) to the ochre stop (TAA) codon. The resulting proteintruncation causes a severe form of fucosidosis, a rare neurode-generative disorder leading to early mortality.30
In designing the substrate, we took into consideration theplacement of the recognition sequence within the oligo. Ideally,since FCS is sensitive to the change in diffusion time, the cleavedportion (containing the fluorescence label) should be short relativeto the entire sequence. A short cleaved duplex will dissociatereadily at room temperature, further reducing the size of theproduct. Many REs have difficulty in cleaving a site that is tooclose to an end of the helix; however, studies by New EnglandBiolabs suggest that EcoRI has little difficulty cleaving near theends.31 Further, the fluorescent label may cause steric hindranceof EcoRI’s activity if placed too closely to the recognition sequence.DNA footprinting experiments32 with EcoRI suggest that the labelshould be at least four nucleotides distant from the recognitionsequence; however, a study of the crystal structure of EcoRI boundto its substrate33 convinced us that a three-nucleotide separationwas sufficient.
EcoRI activity was recorded in a buffer containing 50 mM Tris-HCl (pH 8.0), 10 mM MgCl2, and 100 mM NaCl. Experimentsin free solution were performed on a droplet containing 100µL of DNA substrate at 85 nM, plus 3 µL of EcoRI of activity10 u/µL. This relatively high EcoRI concentration ensures fastcleavage kinetics.34-36 For FCS on nanoapertures, we kept anequivalent ratio of EcoRI to DNA final concentrations, so that thecleavage kinetics are identical in both cases. For FCS in nanoap-ertures, we used a droplet containing 50 µL of DNA substrate at1.7 µM, plus 20 µL of EcoRI of activity 10 u/µL. Enzyme and DNAsolutions were diluted in the reaction buffer and added im-mediately before analysis.
During the cleavage reaction, EcoRI breaks the chemical linkbetween the fluorophore and the double-stranded DNA, resultingin a decrease of the effective dye molecular mass and thus of themean diffusion time as probed by FCS (Figure 6). Before cleavage,the double stranded DNA-Q670 molecule has a mass of about 14.6kDa, while after cleavage the Q670 marked strand weighs 4.7 kDa.The anticipated diffusion time reduction scales as the cubic rootof the ratio of molecular masses, namely, (4.7/14.7)1/3 ≈ 70%,which is close to the measured value after about 150 s reactiontime (see Figure 6), which is assumed to be near completion.
The experimental results displayed in Figure 6 in free solutionand in the nanoaperture show similar behavior, but the SNR inthe case of the nanoaperture is about 2.7× better in the case ofTtot ) 1 s. To get an SNR in free solution similar to the one onthe nanoaperture, one must increase the integration time by a
(28) As measured by number of publications on REBASE database: http://rebase.neb.com. Accessed September 25, 2008. See also Roberts, R. J.; Vincze, T.;Posfai, J.; Macelis, D. Nucleic Acids Res. 2007, 35, D269-D270.
(29) Yoshimori, R.; Roulland-Dussoix, D.; Boyer, H. W. J. Bacteriol. 1972, 112,1275–1279.
(30) Willems, P. J.; Seo, H.-C.; Coucke, P.; Tonlorenzi, R.; O’Brien, J. S. Eur. J.Hum. Genet. 1999, 7, 60–67.
(31) http://www.neb.com/nebecomm/tech_reference/restriction_enzymes/cleavage_olignucleotides.asp. Accessed September 25, 2008.
(32) Uchida, K.; Pyle, A. M.; Morii, T.; Barton, J. K. Nucleic Acids Res. 1989,17, 10259–10279.
(33) Grigorescu, A.; Horvath, M.; Wilkosz, K.; Chandrasekhar, K.; Rosenberg,J. M. Restriction Endonucleases. In Nucleic Acids and Molecular Biology;Gross, H. J., Pingound, A., Eds.; Springer-Verlag: Berlin, Germany, 2004;Vol. 14, Chapter 6, pp 137-177.
(34) Kinjo, M.; Rigler, R. Nucleic Acids Res. 1995, 23, 1795–1799.(35) Kinjo, M.; Nishimura, G.; Koyama, T.; Mets, U.; Rigler, R. Anal. Biochem.
1998, 260, 166–172.(36) Kettling, U.; Koltermann, A.; Schwille, P.; Eigen, M. Proc. Natl. Acad. Sci.
U.S.A. 1998, 95, 1416–1420.
Figure 5. Sequence of the DNA substrate with Quasar 670 (Q670)fluorescent label. The EcoRI recognition sequence is shadowed. Themutation site within the recognition region is shaded in green.
Figure 6. Normalized diffusion times τd monitored by FCS duringenzymatic cleavage for free solution (a) and 120 nm aperture (b).Markers correspond to Ttot ) 1 s integration time, lines to Ttot ) 7 s.
838 Analytical Chemistry, Vol. 81, No. 2, January 15, 2009
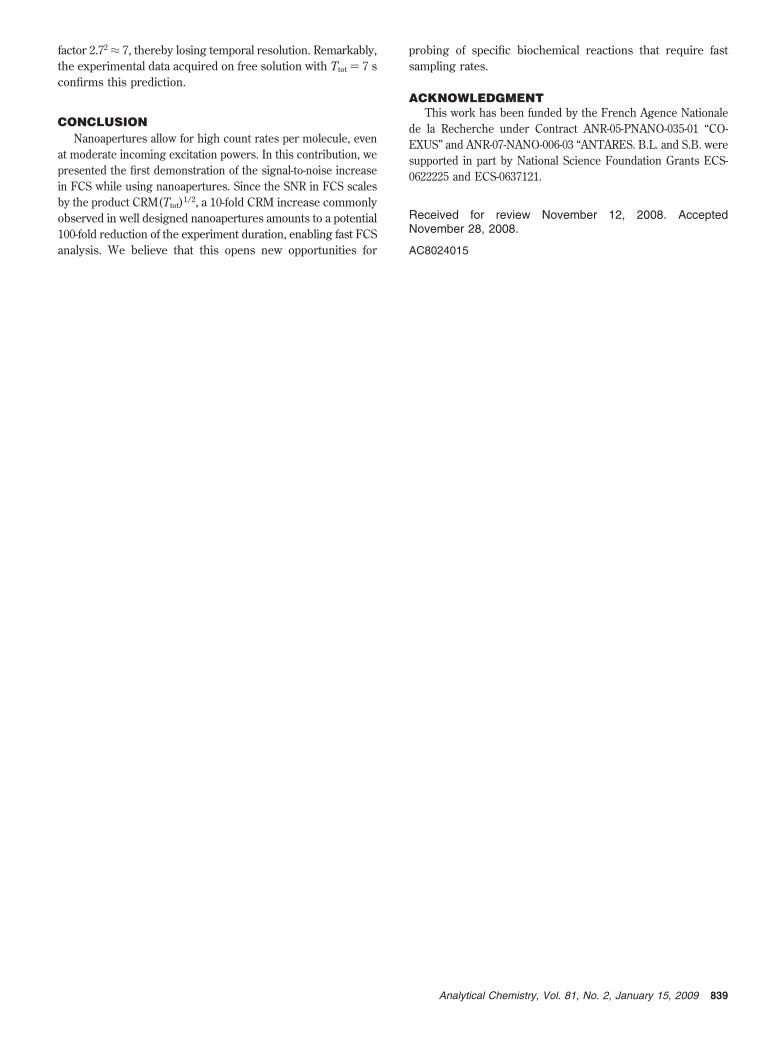
factor 2.72 ≈ 7, thereby losing temporal resolution. Remarkably,the experimental data acquired on free solution with Ttot ) 7 sconfirms this prediction.
CONCLUSIONNanoapertures allow for high count rates per molecule, even
at moderate incoming excitation powers. In this contribution, wepresented the first demonstration of the signal-to-noise increasein FCS while using nanoapertures. Since the SNR in FCS scalesby the product CRM(Ttot)1/2, a 10-fold CRM increase commonlyobserved in well designed nanoapertures amounts to a potential100-fold reduction of the experiment duration, enabling fast FCSanalysis. We believe that this opens new opportunities for
probing of specific biochemical reactions that require fastsampling rates.
ACKNOWLEDGMENTThis work has been funded by the French Agence Nationale
de la Recherche under Contract ANR-05-PNANO-035-01 “CO-EXUS” and ANR-07-NANO-006-03 “ANTARES. B.L. and S.B. weresupported in part by National Science Foundation Grants ECS-0622225 and ECS-0637121.
Received for review November 12, 2008. AcceptedNovember 28, 2008.
AC8024015
839Analytical Chemistry, Vol. 81, No. 2, January 15, 2009