Embed Size (px)
Citation preview
Center for Information Services and High Performance Computing (ZIH)
Guido Juckeland ([email protected])
Center for Information Services and High Performance Computing (ZIH)
In-Depth Performance Analysis for OpenACC/CUDA/OpenCL Applications
with Score-P and VampirHands-on-Lab @ GTC2015
Agenda
Motivation
Performance Analysis 101
Generating Traces with Score-P
Visualizing Traces with Vampir
Special Treat: OpenACC Tracing
Looking a Little Deeper
Guido Juckeland 2
Center for Information Services and High Performance Computing (ZIH)
Guido Juckeland ([email protected])
Center for Information Services and High Performance Computing (ZIH)
Motivation
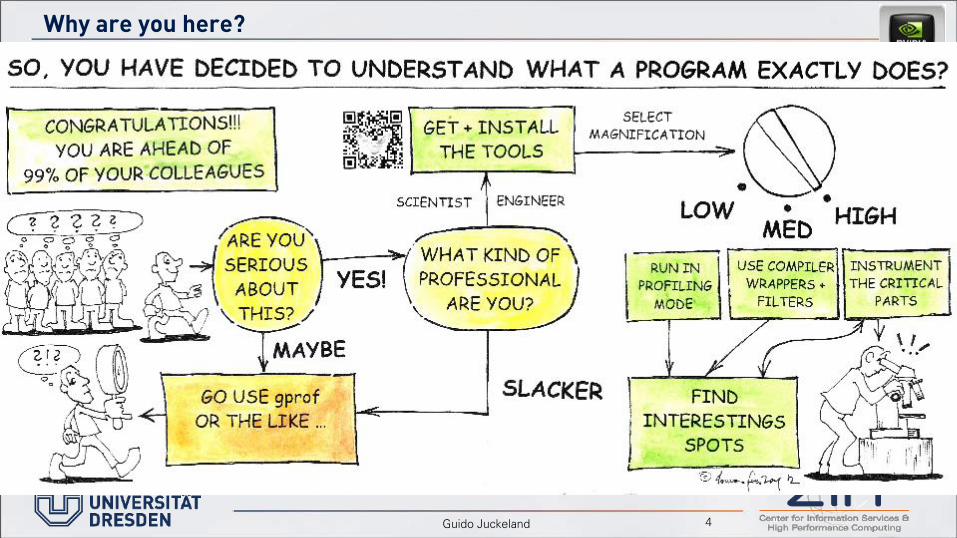
Why are you here?
4Guido Juckeland
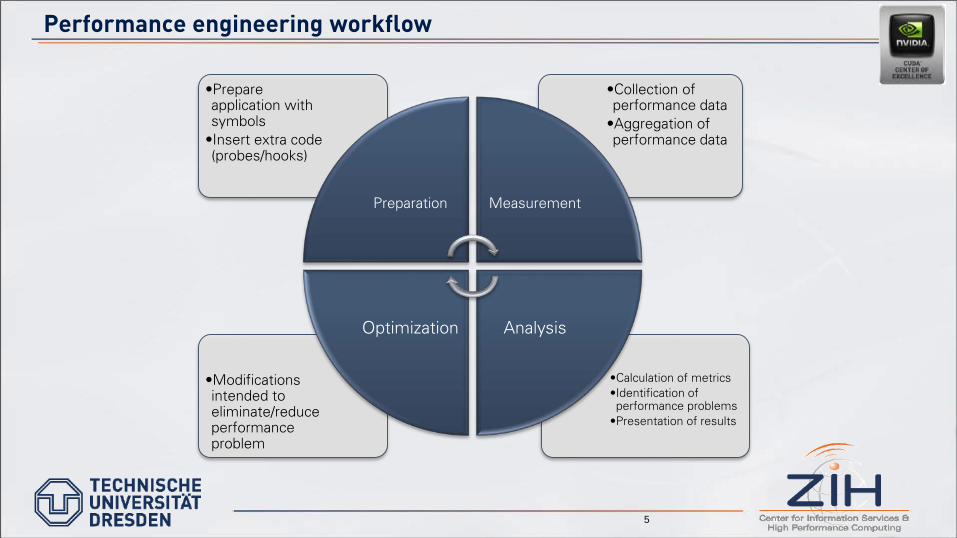
Performance engineering workflow
•Calculation of metrics•Identification of performance problems•Presentation of results
•Modifications intended to eliminate/reduce performance problem
•Collection of performance data•Aggregation of performance data
•Prepare application with symbols•Insert extra code (probes/hooks)
Preparation Measurement
AnalysisOptimization
5

Center for Information Services and High Performance Computing (ZIH)
Guido Juckeland ([email protected])
Center for Information Services and High Performance Computing (ZIH)
Performance Analysis 101
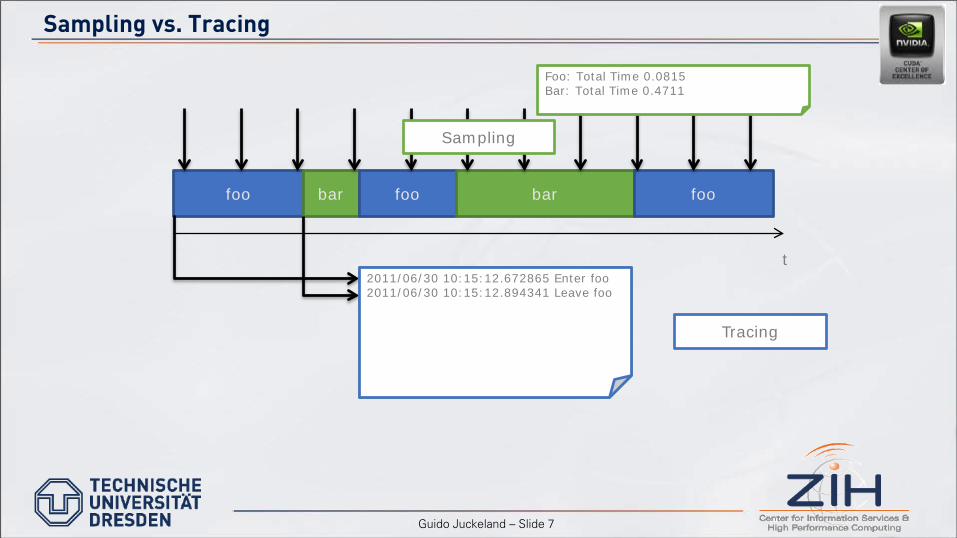
Sampling vs. Tracing
foo
t
bar foo bar foo
Sampling
2011/06/30 10:15:12.672865 Enter foo2011/06/30 10:15:12.672865 Enter foo2011/06/30 10:15:12.894341 Leave foo
Tracing
Foo: Total Time 0.0815Bar: Total Time 0.4711
Guido Juckeland – Slide 7
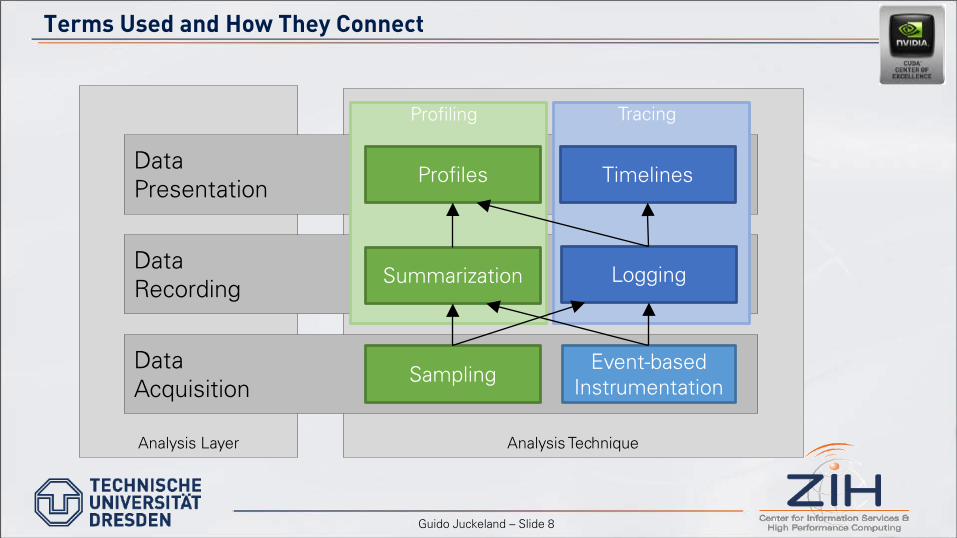
Terms Used and How They Connect
Analysis Layer Analysis Technique
DataAcquisition
DataRecording
DataPresentation
Profiling Tracing
Profiles Timelines
Summarization Logging
Sampling Event-basedInstrumentation
Guido Juckeland – Slide 8
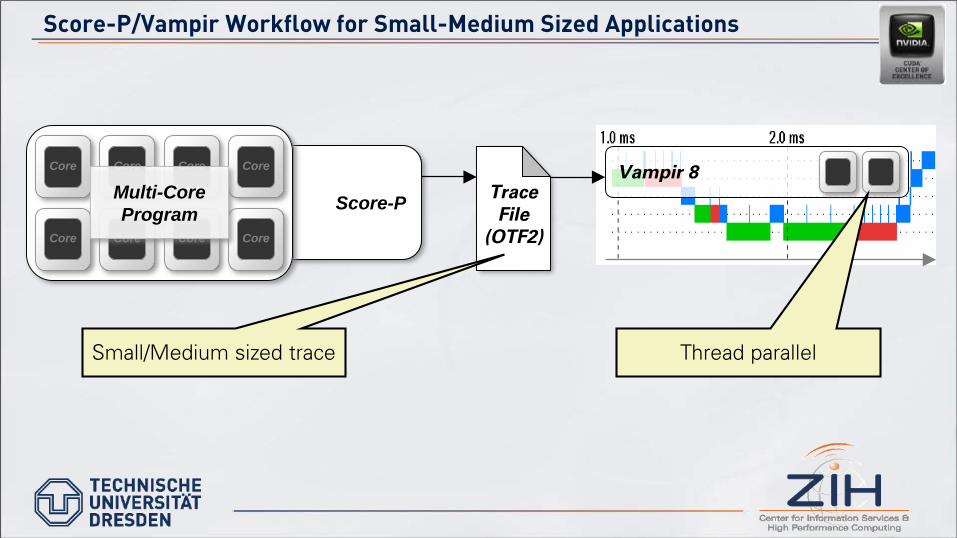
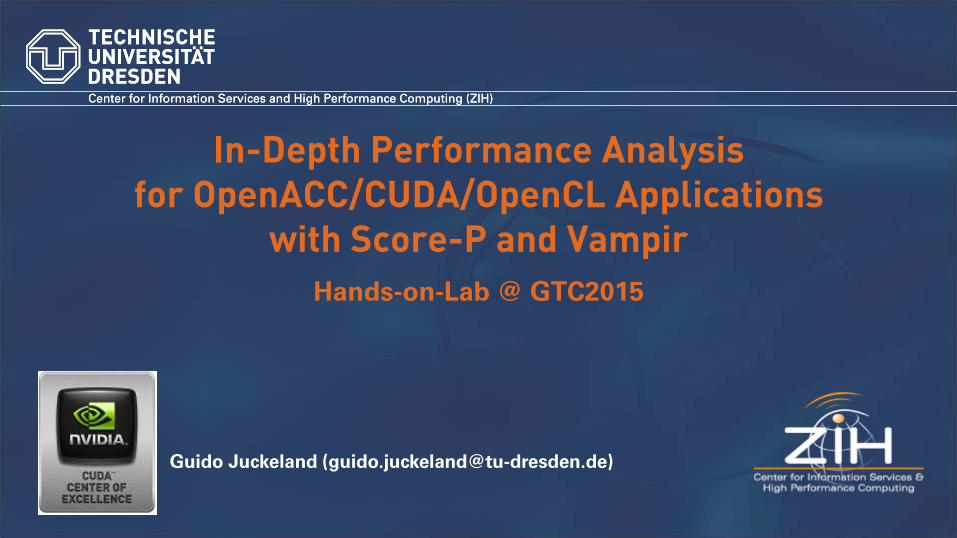
Score-P/Vampir Workflow for Small-Medium Sized Applications
Score-P TraceFile
(OTF2)
Vampir 8Core Core
Core CoreCore Core
CoreCore
Multi-CoreProgram
Thread parallelSmall/Medium sized trace
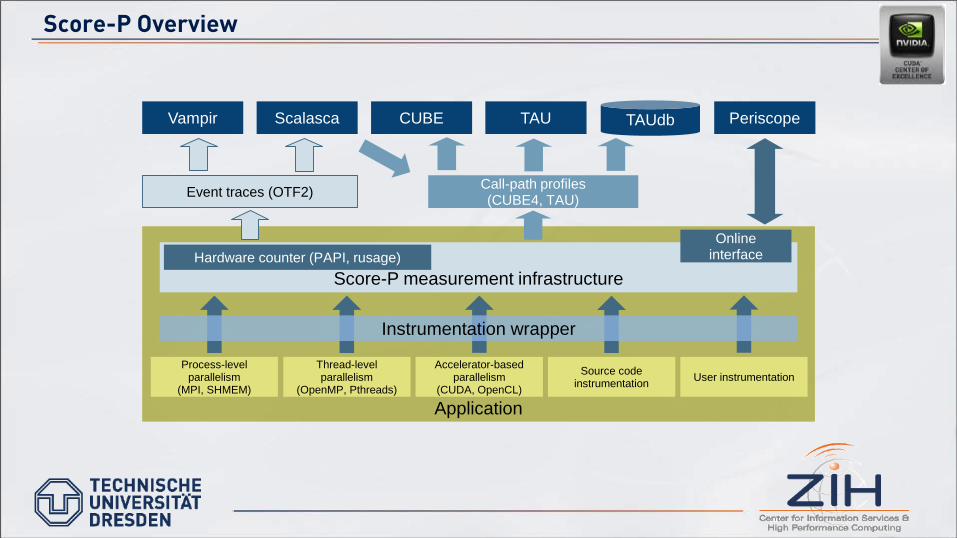
Score-P Overview
Application
Vampir Scalasca PeriscopeTAU
Accelerator-based parallelism
(CUDA, OpenCL)
Score-P measurement infrastructure
Event traces (OTF2)
User instrumentation
Call-path profiles (CUBE4, TAU)
Online interfaceHardware counter (PAPI, rusage)
Process-level parallelism
(MPI, SHMEM)
Thread-level parallelism
(OpenMP, Pthreads)
Instrumentation wrapper
Source code instrumentation
CUBE TAUdb
Partners
• Forschungszentrum Jülich, Germany
• German Research School for Simulation Sciences, Aachen, Germany
• Gesellschaft für numerische Simulation mbH Braunschweig, Germany
• RWTH Aachen, Germany
• Technische Universität Dresden, Germany
• Technische Universität München, Germany
• University of Oregon, Eugene, USA
Center for Information Services and High Performance Computing (ZIH)
Guido Juckeland ([email protected])
Center for Information Services and High Performance Computing (ZIH)
Hands-on: CUDA Tracing in Your Own AWS Instance
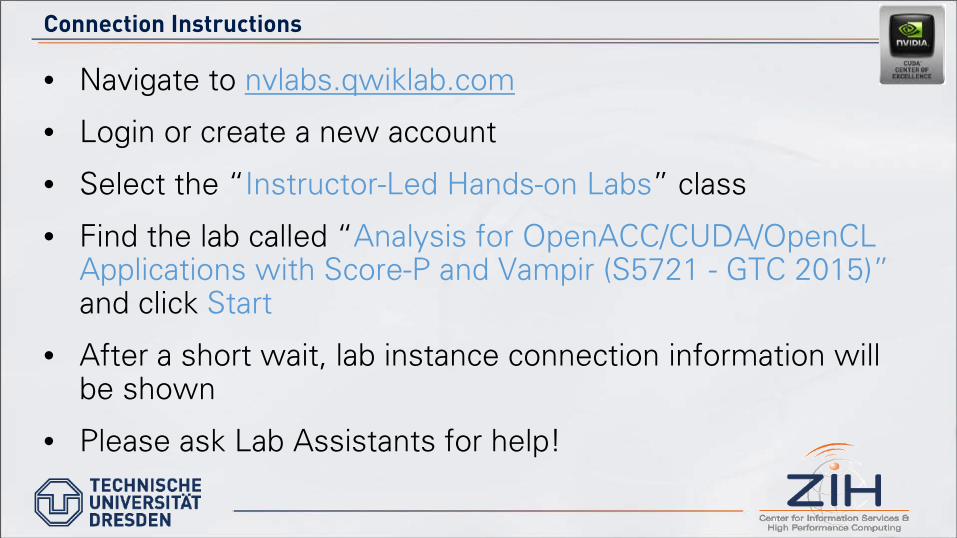
Connection Instructions
• Navigate to nvlabs.qwiklab.com
• Login or create a new account
• Select the “Instructor-Led Hands-on Labs” class
• Find the lab called “Analysis for OpenACC/CUDA/OpenCLApplications with Score-P and Vampir (S5721 - GTC 2015)” and click Start
• After a short wait, lab instance connection information will be shown
• Please ask Lab Assistants for help!
Performance Analysis Steps
1. Reference preparation for validation
2. Program instrumentation
3. Event trace collection
4. Event trace examination & analysis

Start a Terminal
15Guido Juckeland
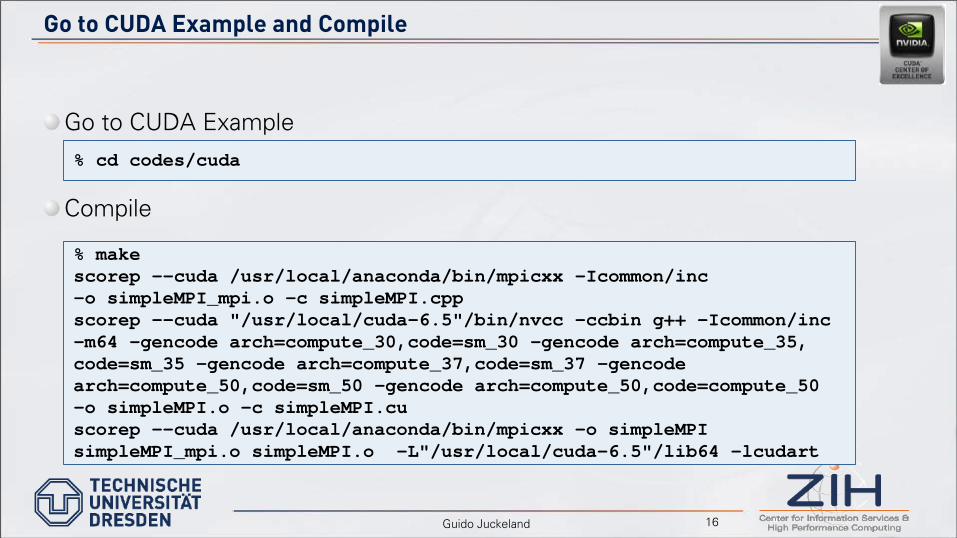
Go to CUDA Example and Compile
16Guido Juckeland
Go to CUDA Example
Compile
% cd codes/cuda
% makescorep --cuda /usr/local/anaconda/bin/mpicxx -Icommon/inc-o simpleMPI_mpi.o -c simpleMPI.cppscorep --cuda "/usr/local/cuda-6.5"/bin/nvcc -ccbin g++ -Icommon/inc-m64 -gencode arch=compute_30,code=sm_30 -gencode arch=compute_35,code=sm_35 -gencode arch=compute_37,code=sm_37 -gencodearch=compute_50,code=sm_50 -gencode arch=compute_50,code=compute_50 -o simpleMPI.o -c simpleMPI.cuscorep --cuda /usr/local/anaconda/bin/mpicxx -o simpleMPIsimpleMPI_mpi.o simpleMPI.o -L"/usr/local/cuda-6.5"/lib64 -lcudart
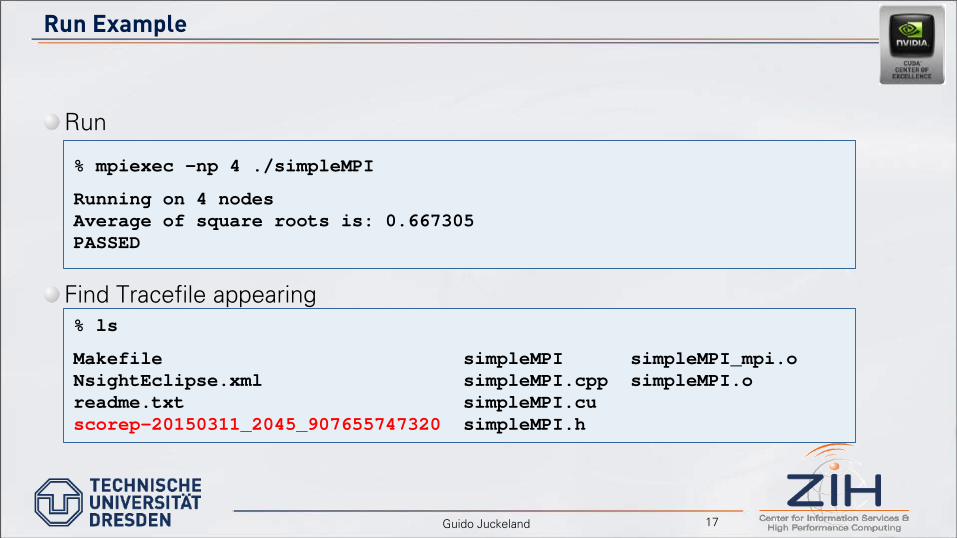
Run Example
17Guido Juckeland
Run
Find Tracefile appearing
% mpiexec -np 4 ./simpleMPI
Running on 4 nodesAverage of square roots is: 0.667305PASSED
% ls
Makefile simpleMPI simpleMPI_mpi.oNsightEclipse.xml simpleMPI.cpp simpleMPI.oreadme.txt simpleMPI.cuscorep-20150311_2045_907655747320 simpleMPI.h
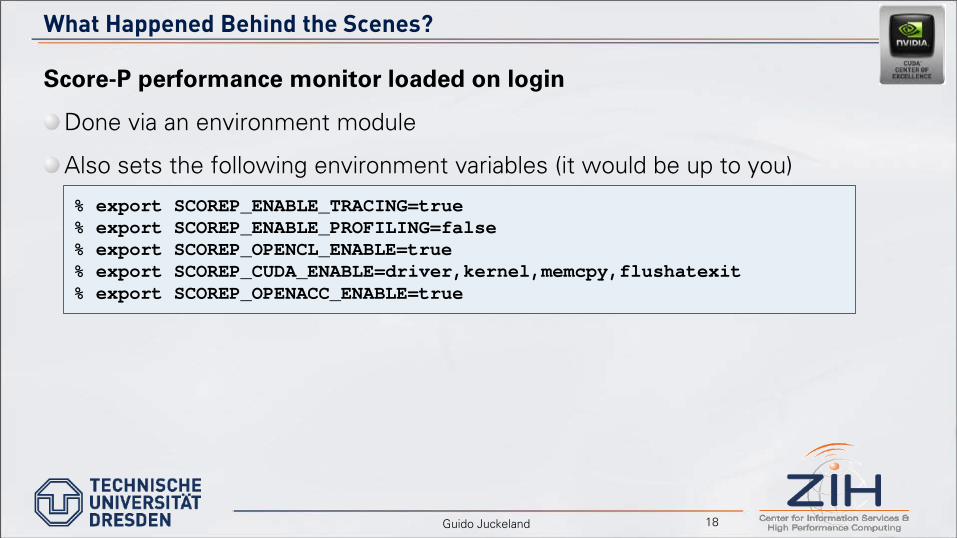
What Happened Behind the Scenes?
18Guido Juckeland
Score-P performance monitor loaded on login
Done via an environment module
Also sets the following environment variables (it would be up to you)
% export SCOREP_ENABLE_TRACING=true% export SCOREP_ENABLE_PROFILING=false% export SCOREP_OPENCL_ENABLE=true% export SCOREP_CUDA_ENABLE=driver,kernel,memcpy,flushatexit% export SCOREP_OPENACC_ENABLE=true
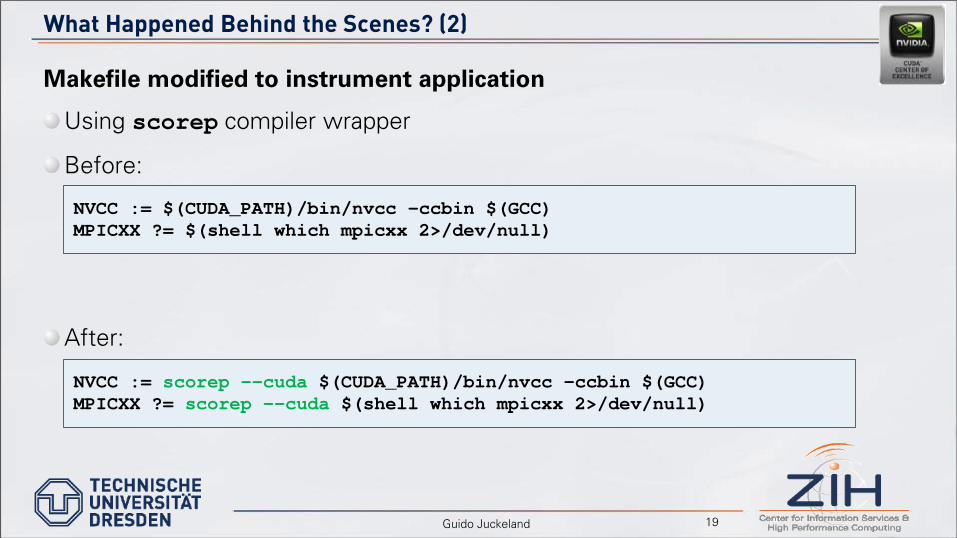
What Happened Behind the Scenes? (2)
19Guido Juckeland
Makefile modified to instrument application
Using scorep compiler wrapper
Before:
After:
NVCC := $(CUDA_PATH)/bin/nvcc -ccbin $(GCC)MPICXX ?= $(shell which mpicxx 2>/dev/null)
NVCC := scorep --cuda $(CUDA_PATH)/bin/nvcc -ccbin $(GCC)MPICXX ?= scorep --cuda $(shell which mpicxx 2>/dev/null)
Center for Information Services and High Performance Computing (ZIH)
Guido Juckeland ([email protected])
Center for Information Services and High Performance Computing (ZIH)
Trace Visualization with Vampir
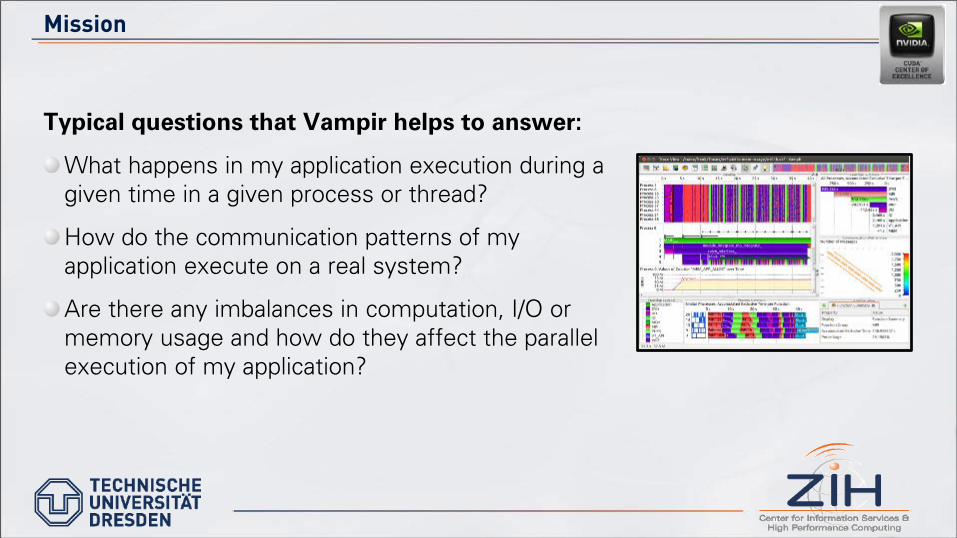
Mission
Typical questions that Vampir helps to answer:
What happens in my application execution during a given time in a given process or thread?
How do the communication patterns of my application execute on a real system?
Are there any imbalances in computation, I/O or memory usage and how do they affect the parallel execution of my application?
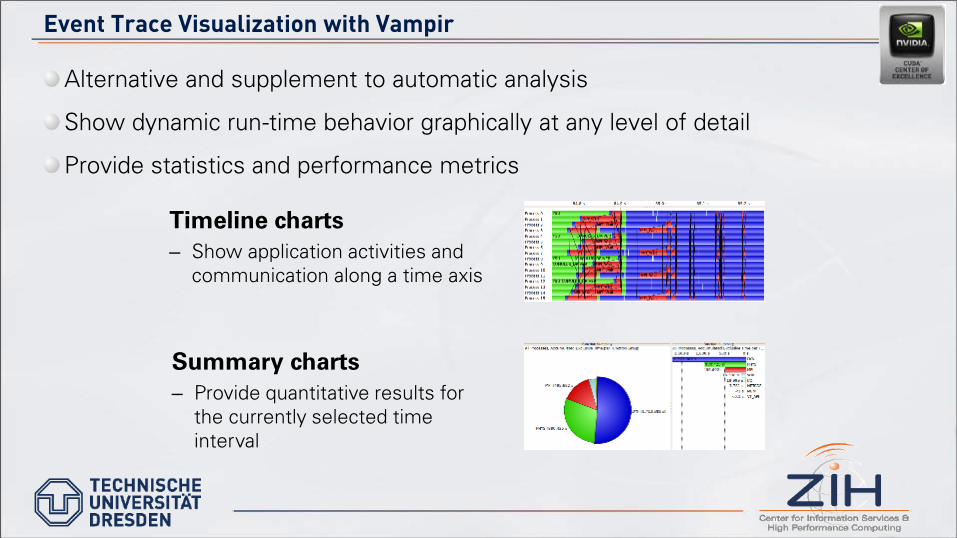
Event Trace Visualization with Vampir
Alternative and supplement to automatic analysis
Show dynamic run-time behavior graphically at any level of detail
Provide statistics and performance metrics
Timeline charts– Show application activities and
communication along a time axis
Summary charts– Provide quantitative results for
the currently selected time interval
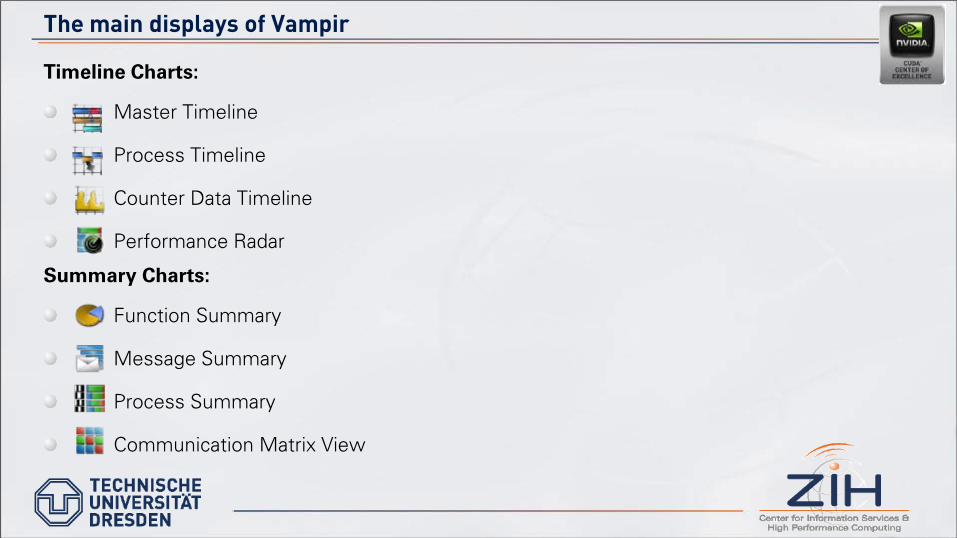
The main displays of Vampir
Timeline Charts:
Master Timeline
Process Timeline
Counter Data Timeline
Performance Radar
Summary Charts:
Function Summary
Message Summary
Process Summary
Communication Matrix View
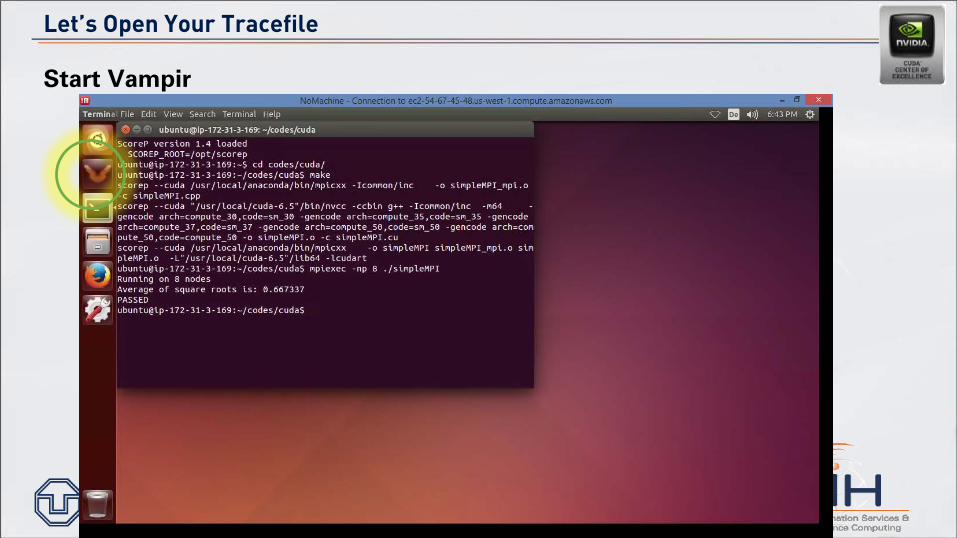
Let’s Open Your Tracefile
24Guido Juckeland
Start Vampir
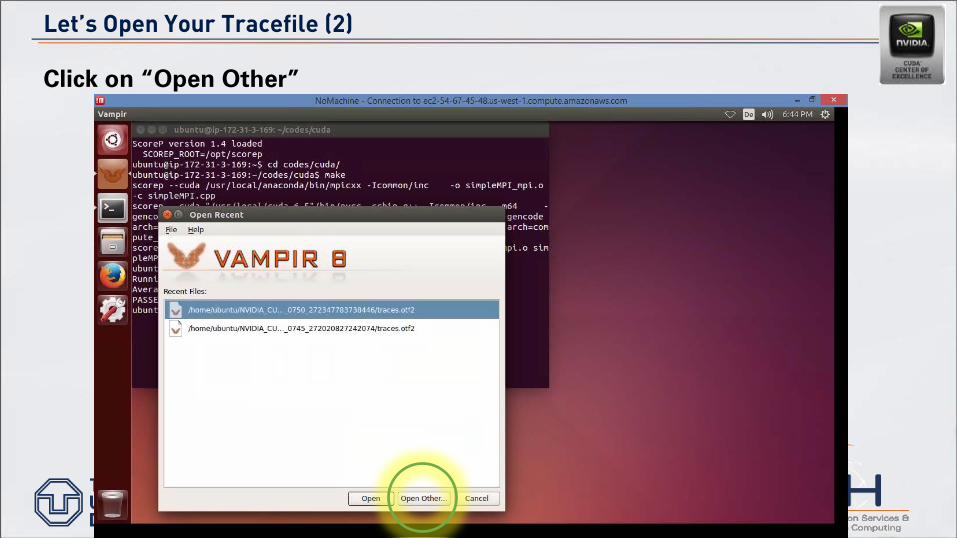
Let’s Open Your Tracefile (2)
25Guido Juckeland
Click on “Open Other”
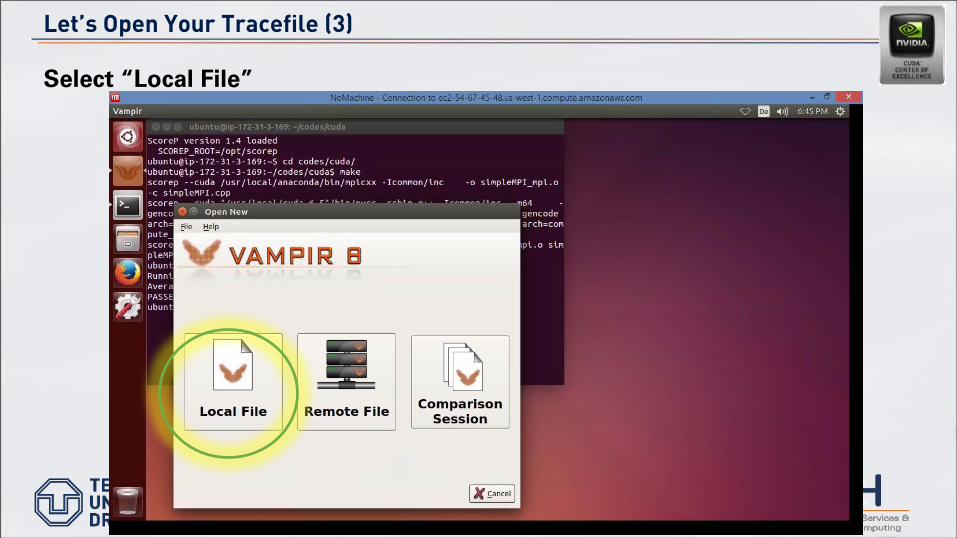
Let’s Open Your Tracefile (3)
26Guido Juckeland
Select “Local File”
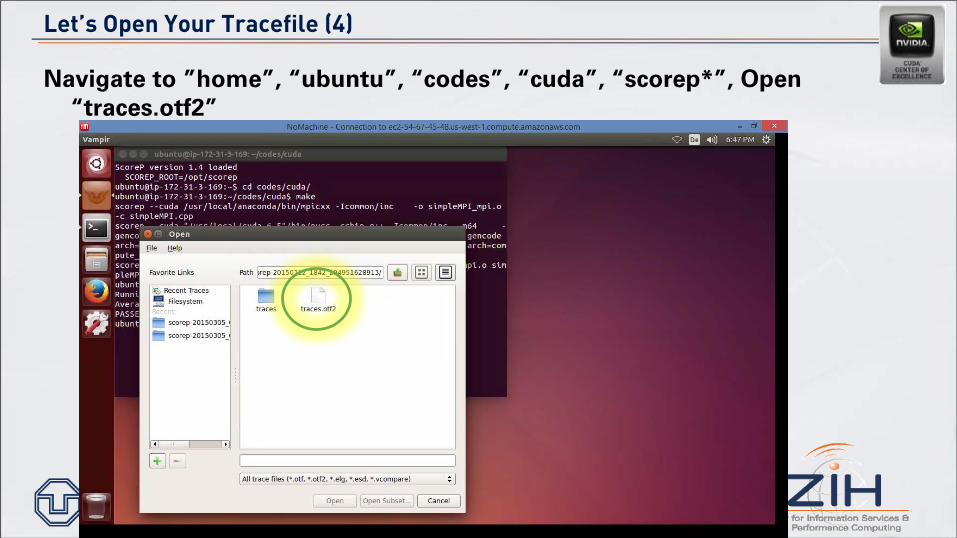
Let’s Open Your Tracefile (4)
27Guido Juckeland
Navigate to ”home”, “ubuntu”, “codes”, “cuda”, “scorep*”, Open “traces.otf2”
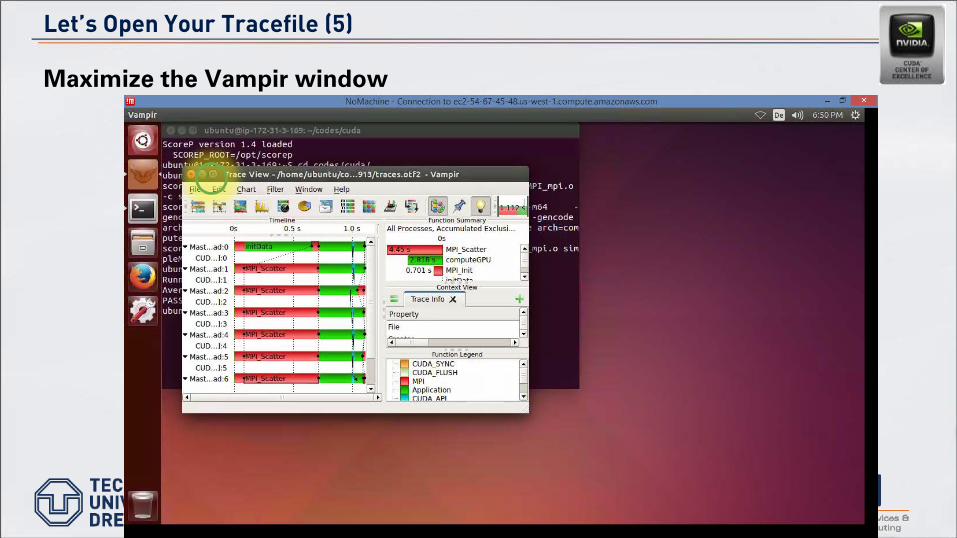
Let’s Open Your Tracefile (5)
28Guido Juckeland
Maximize the Vampir window
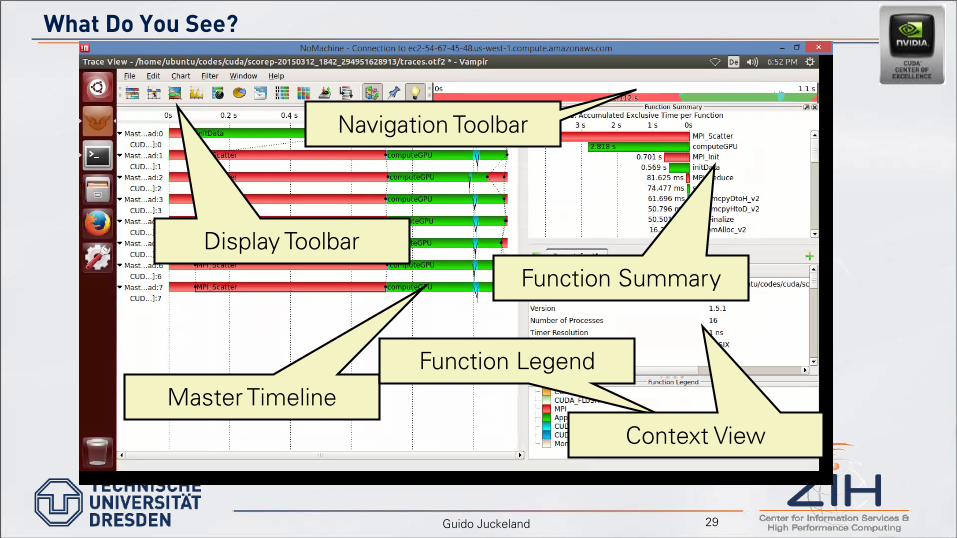
What Do You See?
29Guido Juckeland
Master Timeline
Navigation Toolbar
Function Summary
Function Legend
Display Toolbar
Context View
Demo
30Guido Juckeland
Clicking on anything provides details in the context view
Zooming is done by click, hold, release
– Horizontal (Undo: Ctrl+Z, Reset: Ctrl+R)
– Vertical (Undo: Ctrl+Z, Reset: Ctrl+Shift+R)
Navigation Toolbar provides ways of sliding and zooming
Adding more displays via display toolbar
Moving displays around, dock to any border
Now you go ahead!
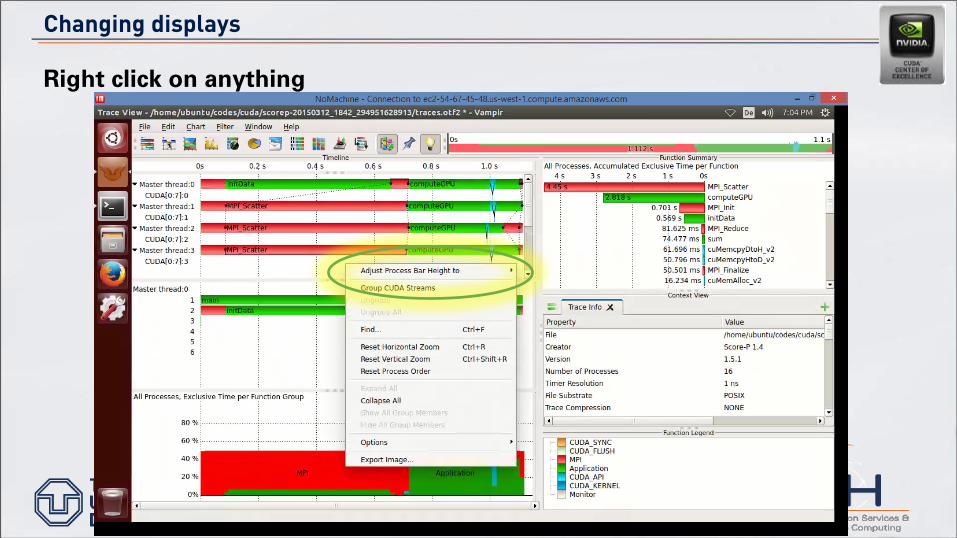
Changing displays
31Guido Juckeland
Right click on anything
Tasks
32Guido Juckeland
Right click into Master Timline
Adjust Process Bar Height to fit Chart Height
Determine length of initialization phase
Determine length of compute phase
Determine kernel runtime
Determine message sizes
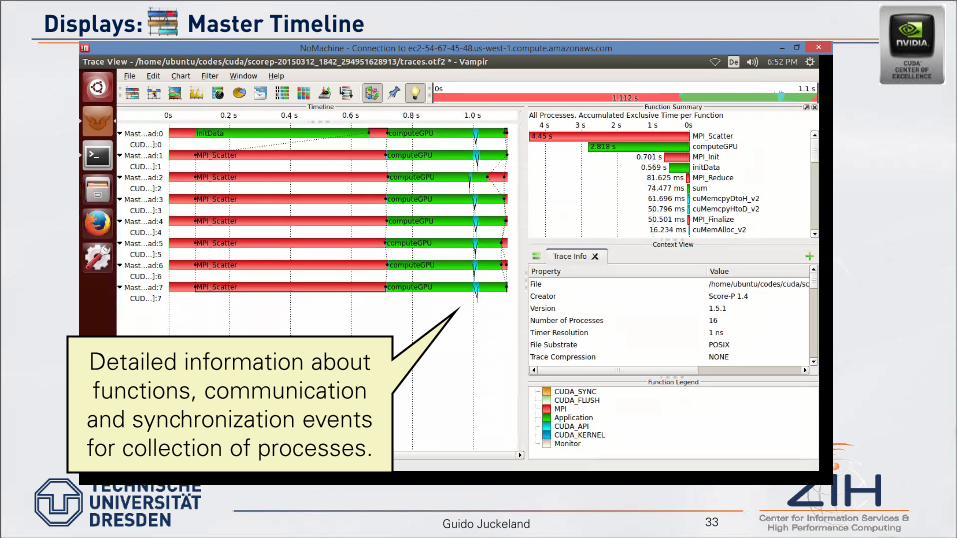
Displays: Master Timeline
33Guido Juckeland
Detailed information about functions, communication and synchronization events for collection of processes.
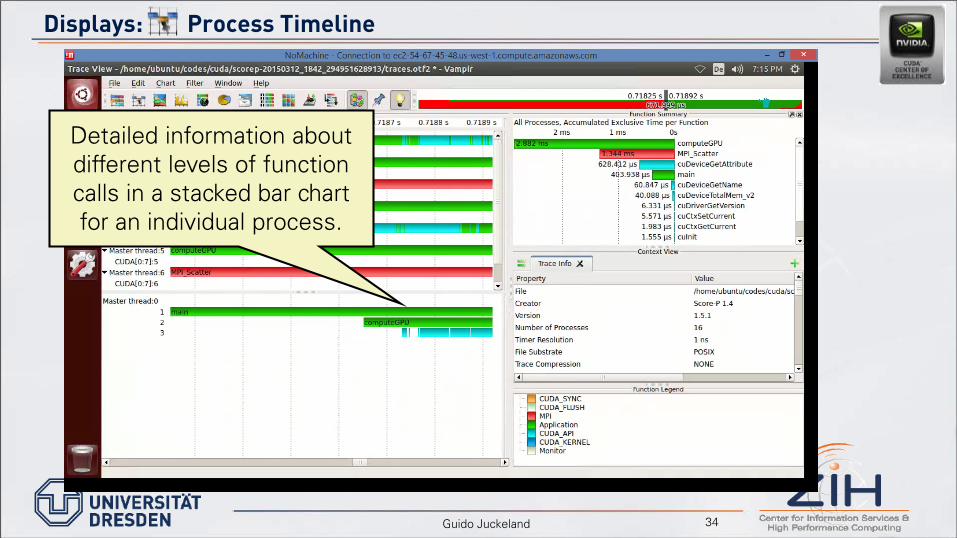
Displays: Process Timeline
34Guido Juckeland
Detailed information about different levels of function calls in a stacked bar chart for an individual process.
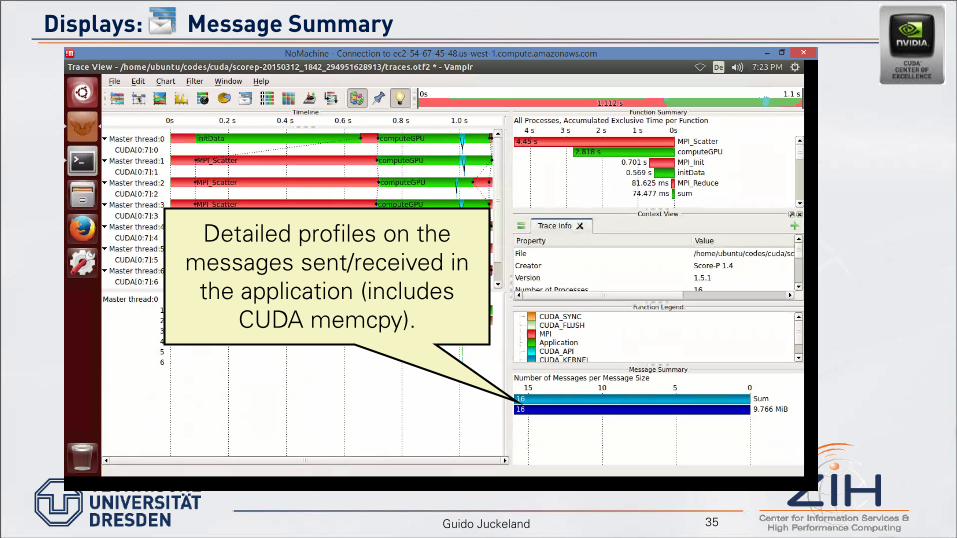
Displays: Message Summary
35Guido Juckeland
Detailed profiles on the messages sent/received in
the application (includes CUDA memcpy).
Profiling At Its Best
36Guido Juckeland
All displays are updated to the currently zoomed time interval
Function Summary
– Include/exclude functions
– Change metric
– Select processes used for profile
Message Summary
– Change metric
– Select only specific senders/receivers
There Is an Example Trace to Play With
Go and look under /home/ubuntu/traces/cuda for more traces
Now go and play with your or my trace –tell me how to improve the application
Guido Juckeland 37
Center for Information Services and High Performance Computing (ZIH)
Guido Juckeland ([email protected])
Center for Information Services and High Performance Computing (ZIH)
A Look Ahead: OpenACC Tracing
Disclaimer
39Guido Juckeland
Your are looking at a prototype
Only works with PGI compilers and developer version of Score-P
If you find it cool – talk to your OpenACC compiler vendor
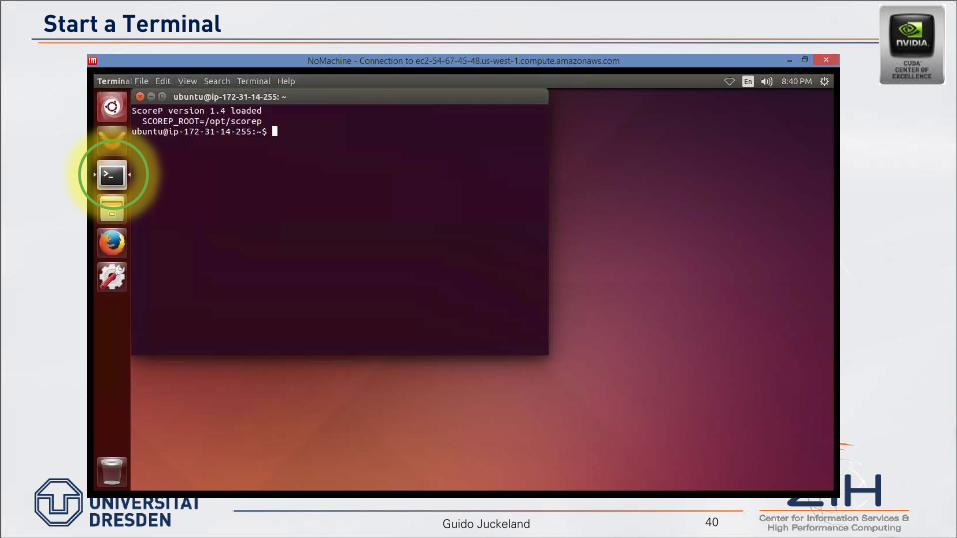
Start a Terminal
40Guido Juckeland
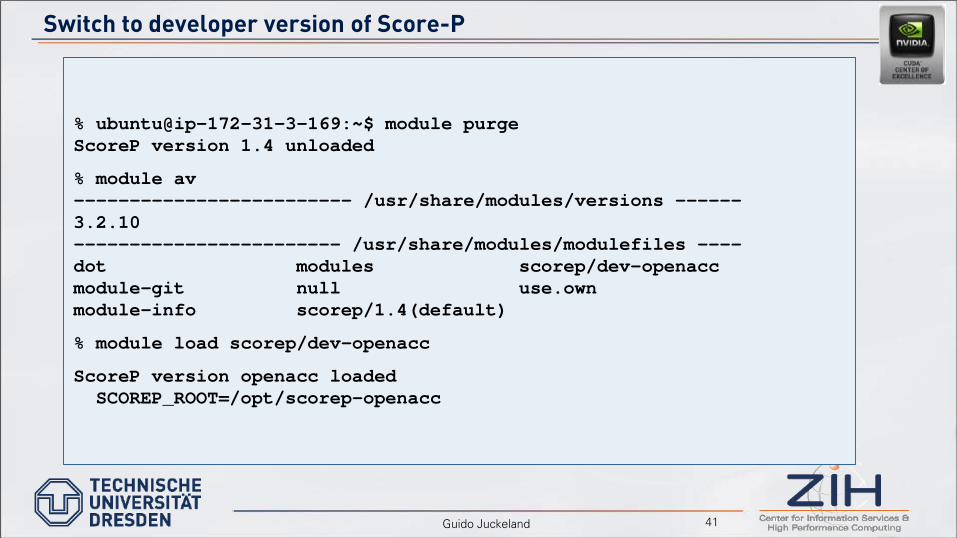
Switch to developer version of Score-P
41Guido Juckeland
% ubuntu@ip-172-31-3-169:~$ module purgeScoreP version 1.4 unloaded
% module av------------------------- /usr/share/modules/versions ------3.2.10------------------------ /usr/share/modules/modulefiles ----dot modules scorep/dev-openaccmodule-git null use.ownmodule-info scorep/1.4(default)
% module load scorep/dev-openacc
ScoreP version openacc loadedSCOREP_ROOT=/opt/scorep-openacc
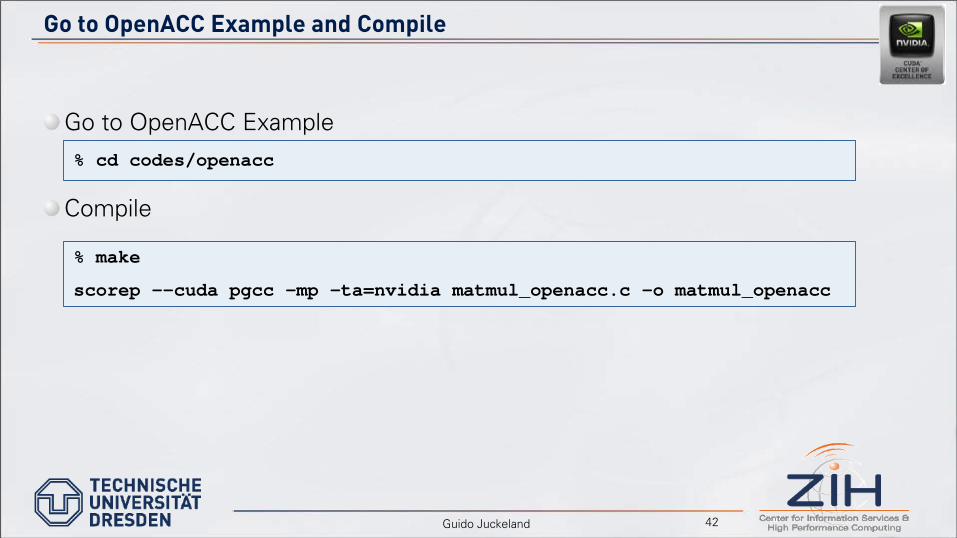
Go to OpenACC Example and Compile
42Guido Juckeland
Go to OpenACC Example
Compile
% cd codes/openacc
% make
scorep --cuda pgcc -mp -ta=nvidia matmul_openacc.c -o matmul_openacc
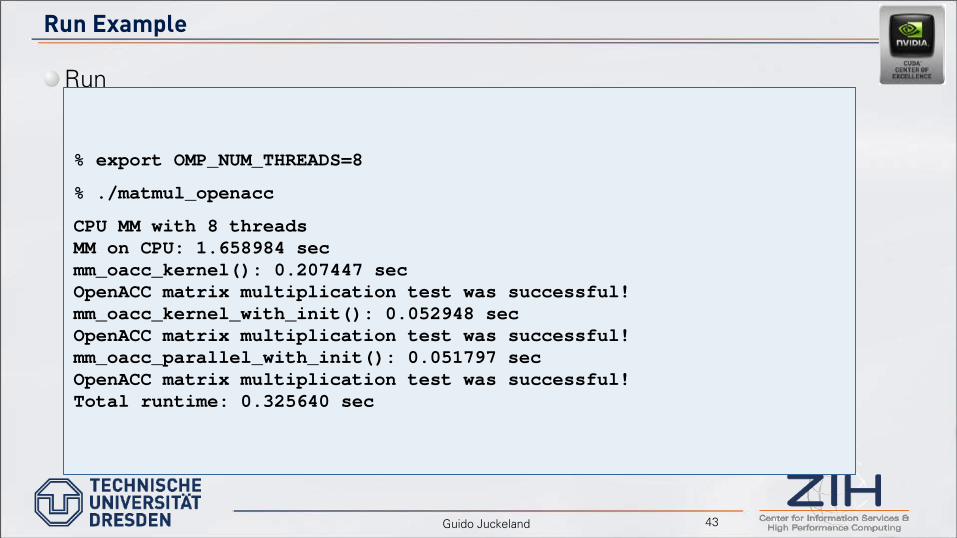
Run Example
43Guido Juckeland
Run
% export OMP_NUM_THREADS=8
% ./matmul_openacc
CPU MM with 8 threadsMM on CPU: 1.658984 sec mm_oacc_kernel(): 0.207447 sec OpenACC matrix multiplication test was successful!mm_oacc_kernel_with_init(): 0.052948 sec OpenACC matrix multiplication test was successful!mm_oacc_parallel_with_init(): 0.051797 sec OpenACC matrix multiplication test was successful!Total runtime: 0.325640 sec
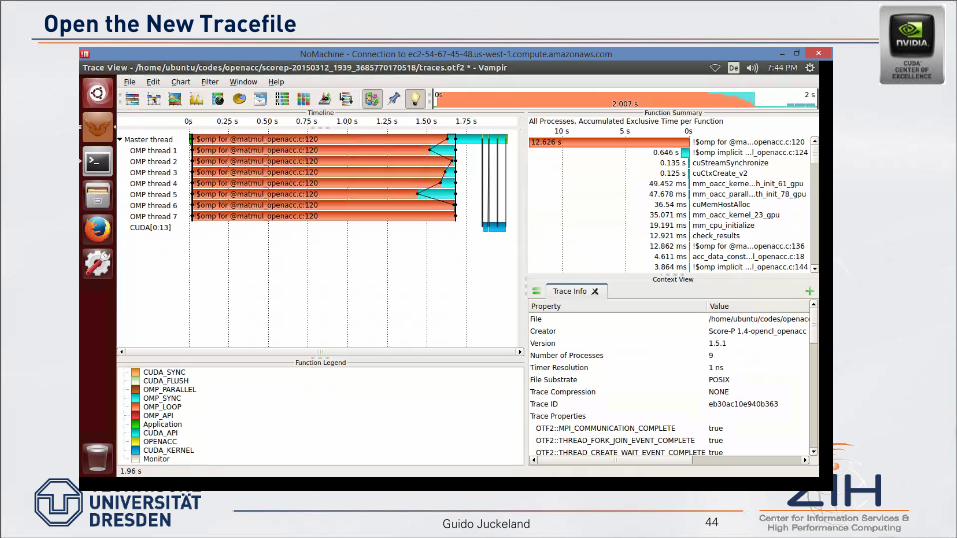
Open the New Tracefile
44Guido Juckeland
There Is an Example Trace to Play With
Go and look under /home/ubuntu/traces/openacc for more traces
Now go and play with your or my trace –tell me how to improve the application
Guido Juckeland 45
Center for Information Services and High Performance Computing (ZIH)
Guido Juckeland ([email protected])
Center for Information Services and High Performance Computing (ZIH)
Looking a Little Further
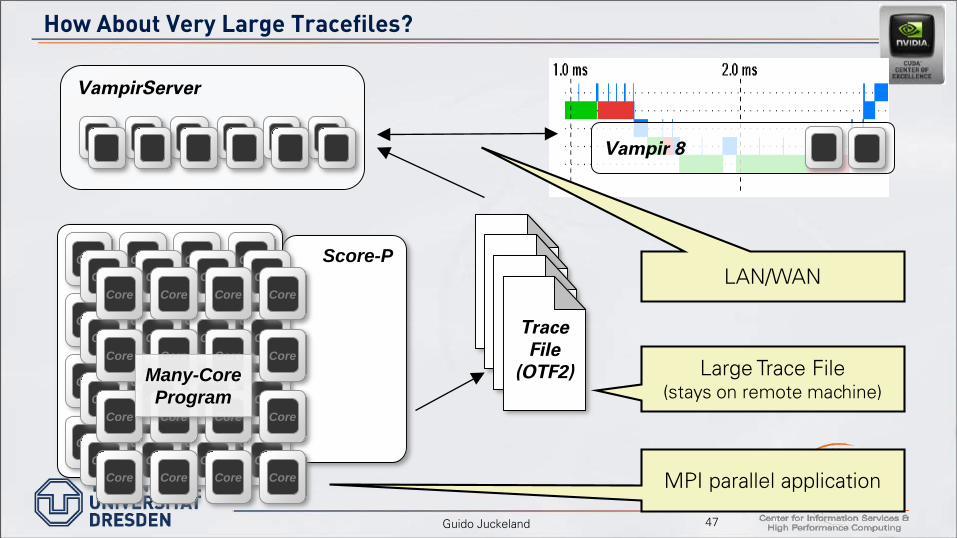
How About Very Large Tracefiles?
47Guido Juckeland
Score-P
Vampir 8
TraceFile
(OTF2)
VampirServer
CPU CPU CPU CPU
CPU CPU CPU CPU
CPU CPU CPU CPU
CPU CPU CPU CPU
CPU CPU CPU CPU
CPU CPU CPU CPU
CPU CPU CPU CPU
CPU CPU CPU CPU
Core Core Core Core
Core Core Core Core
Core Core Core Core
Core Core Core Core
Many-CoreProgram
Large Trace File(stays on remote machine)
MPI parallel application
LAN/WAN
Wrap Up
48Guido Juckeland
Performance Analysis is valuable
Use “easy” tools first
Score-P can record any concurrent activity
Vampir can visualize all that activity
The rest is experience and up to you
Vampir is available at http://www.vampir.eu,get support via [email protected]