Embed Size (px)
Citation preview
In-Depth Lab Report
Evaluation of a Nanomaterial Handling Enclosure conducted at the Alice Hamilton Laboratories
Kevin H. Dunn, MS, CIH
Alberto Garcia, MS
Joseph DeCapite
Division of Applied Research and Technology Engineering and Physical Hazards Branch EPHB Report No. 364-11a NIOSH Alice Hamilton Laboratory Cincinnati, OH 45213
November 2013
DEPARTMENT OF HEALTH AND HUMAN SERVICES Centers for Disease Control and Prevention National Institute for Occupational Safety and Health
EPHB Report No. 364-11a
Page ii
Site Surveyed: NIOSH Alice Hamilton Laboratory Lab
NAICS Code: 921190
Survey Dates: Conducted between 12/2012 and 3/2013
Surveys Conducted By: Kevin H. Dunn
Alberto Garcia Joseph DeCapite
Employer Representatives N/A Contacted
Contractor Representatives: N/A
EPHB Report No. 364-11a
Page iii
Disclaimer The findings and conclusions in this report are those of the authors and do not necessarily represent the views of NIOSH. Mention of any company or product does not constitute endorsement by NIOSH. In addition, citations to websites external to NIOSH do not constitute NIOSH endorsement of the sponsoring organizations or their programs or products. Furthermore, NIOSH is not responsible for the content of these websites. All Web addresses referenced in this document were accessible as of the publication date.
EPHB Report No. 364-11a
Page iv
Table of Contents
Disclaimer ........................................................................................ iii Abstract ............................................................................................ v
Introduction ...................................................................................... 1
Background for Control Technology Studies ........................................... 1
Background for this Study ................................................................... 2
Methodology...................................................................................... 4
Results ............................................................................................. 9
Discussion ....................................................................................... 12
Conclusions and Recommendations .................................................... 13
References ...................................................................................... 14
EPHB Report No. 364-11a
Page v
Abstract
Many users have adopted the laboratory fume hood as the primary exposure control given its ubiquitous nature and history as a standard control used in most research laboratories. New lower flow hoods are being marketed and used for the manipulation of nanomaterials. The use of lower flows may reduce the impact of turbulence and the body wake on the potential for fume hood leakage. However, there is little information on their performance. A study was conducted by engineers at the NIOSH Alice Hamilton Labs to evaluate the performance of a new “nano” fume hood under varying room ventilation conditions and for three different exhaust flows. For the study, a tracer gas test protocol adapted from the European fume hood test method was used (European Committee for Standardization (CEN) 2003). A static test procedure using a full-size manikin was conducted. Samplers were placed in the manikin breathing zone as well as at the left and right corner of the hood to assess potential leakage at areas known to have high turbulence. Hood exhaust flow rates of 242, 348 and 445 ft3/min were used to represent a range of average hood face velocities of 59, 81 and 96 ft/min, respectively. In addition, all conditions were tested with the room air conditioner on and off to assess the impact of the supply air on the hood’s containment effectiveness. During the tracer gas tests conducted in this study, leakage out of the hood was only noted when the room air conditioner was on. Hood face velocity measurements showed that temporal variations increased when the room air conditioner was on resulting in an increase in turbulence intensity, especially near the side of the hood adjacent to the supply air diffuser. When the room air conditioner was turned off, tracer gas tests showed good containment across all hood exhaust flows. However, when the room air conditioner was turned on, the tracer gas tests showed leakage for both the low and medium exhaust flows. This indicates that the additional turbulence created by a diffuser above the hood can result in leakage even with face velocities in the range recommended by consensus standards.
EPHB Report No. 364-11a
Page 1
Introduction
Background for Control Technology Studies
The National Institute for Occupational Safety and Health (NIOSH) is the primary Federal agency engaged in occupational safety and health research. Located in the Department of Health and Human Services, it was established by the Occupational Safety and Health Act of 1970. This legislation mandated NIOSH to conduct research and education programs separate from the standard setting and enforcement functions carried out by the Occupational Safety and Health Administration (OSHA) in the Department of Labor. An important area of NIOSH research deals with methods for controlling occupational exposure to potential chemical and physical hazards. The Engineering and Physical Hazards Branch (EPHB) of the Division of Applied Research and Technology (DART) has been given the lead within NIOSH to study the engineering aspects of health hazard prevention and control.
Since 1976, EPHB has conducted a number of assessments of health hazard control technology on the basis of industry, common industrial process, or specific control techniques. Examples of these completed studies include the foundry industry; various chemical manufacturing or processing operations; spray painting; and the recirculation of exhaust air. The objective of each of these studies has been to document and evaluate effective control techniques for potential health hazards in the industry or process of interest and to create a more general awareness of the need for or availability of an effective system of hazard controls.
These studies involve a number of steps or phases. Initially, a series of walk-through surveys is conducted to select plants or processes with effective and potentially transferable control techniques. Next, in-depth surveys are conducted to determine both the control parameters and the effectiveness of these controls. The reports from these in-depth surveys are then used as a basis for preparing technical reports and journal articles on effective hazard control measures. Ultimately, the information from these research activities builds the database of publicly available information on hazard control techniques for use by professionals responsible for preventing occupational illness and injury.
EPHB Report No. 364-11a
Page 2
Background for this Study Occupational health risks associated with manufacturing and using nanomaterials are not yet clearly understood. However, initial toxicological data indicate that there is reason for caution. Pulmonary inflammation has been observed in animals exposed to titanium dioxide (TiO2) and carbon nanotubes (CNT) (Shvedova, Kisin et al. 2005, Chou, Hsiao et al. 2008, Rossi, Pylkkanen et al. 2010). Other studies have shown that nanoparticles can translocate to the circulatory system and to the brain and cause oxidative stress (Elder, Gelein et al. 2006, Wang, Liu et al. 2008). Perhaps the most troubling finding is that CNTs can elicit asbestos-like responses in mice (Poland, Duffin et al. 2008, Takagi, Hirose et al. 2008). In light of these results, it is important for producers and users of engineered nanomaterials (ENMs) to reduce employee exposure and manage risks appropriately.
Many universities and research labs have developed specialized guides for working with nanomaterials in recent years (Hallock, Greenley et al. 2009). A recent international survey of nanomaterials firms and laboratories reported that all organizations participating in the survey described using some type of engineering control (Conti, Killpack et al. 2008). The most common exposure control used was the traditional laboratory fume hood; two thirds of firms reported the use of the fume hood to reduce hazardous airborne exposure to workers. These devices have been in use for many years in research laboratories to protect workers from chemical and biological hazards.
Recent research has shown that the laboratory fume hood may allow releases of nanomaterials during their handling and manipulation (Tsai, Ada et al. 2009). Tsai et al. evaluated exposures related to the handling (i.e., scooping and pouring) of powder nanoalumina and nanosilver in a constant air volume (CAV) hood, a bypass hood, and a variable air volume (VAV) hood. The CAV fume hood face velocity varies inversely with sash height while the bypass and VAV hoods were developed to maintain a more constant face velocity independent of sash position. Tsai et al. found that the CAV hood allowed the release of significant amounts of nanoparticles during pouring and transferring activities involving nanoalumina. The particles that escaped the fume hood were circulated to the general room air and were not cleared by the general ventilation system for 1/2–2 hours. New lower flow hoods adapted from ventilated balance enclosures are being marketed primarily by pharmaceutical containment companies and used for the manipulation of nanomaterials. The use of lower flows may reduce the impact of turbulence and the body wake on the potential for fume hood leakage. However, there is little information on their performance in the scientific literature.
EPHB Report No. 364-11a
Page 3
A common method used to evaluate the performance of a fume hood is the quantitative tracer gas test. These tests are sometimes conducted with a manikin placed in front of the hood to simulate the effect of the user on the airflow patterns surrounding the face of the hood. For these tests, a tracer gas (typically sulfur hexafluoride [SF6]) is released inside the hood using a dispersion device. The performance of the hood is evaluated by measuring the tracer gas concentration at the breathing zone (BZ) of the manikin or at the hood opening. Traditional designs for laboratory fume hoods create airflow patterns that form recirculation regions inside the hood. In addition, the presence of a manikin in front of the hood has been shown to increase the leakage or BZ concentrations (Guffey and Barnea 1994, Johnson, Fletcher et al. 1996, Greenley, DiBerardinis et al. 1999, Tseng, Huang et al. 2006). Airflow around the manikin/worker creates a negative pressure region downstream of the worker, which may provide a mechanism for the transport out of the hood as well as into the breathing zone of the worker (George, Flynn et al. 1990, Kim and Flynn 1991).
The methodology used is critical in accurately evaluating fume hood containment effectiveness. The predominant test protocol used worldwide to evaluate the effectiveness of laboratory fume hood cabinets is ASHRAE 110 (ASHRAE 1995). This protocol has been in use since 1985 and is based on measuring the concentration of a tracer gas in the BZ of a manikin while tracer gas is released inside the cabinet. Recent studies have suggested that this methodology may be insufficient for describing the containment effectiveness of the fume hood (Tseng, Huang et al. 2006). Tseng et al. evaluated airflow patterns in and around a conventional fume hood and noted the areas of greatest leakage occurred around the doorsill and side posts of the hood. The flow patterns near the bottom of the hood exhibited unsteady, 3-dimensional recirculation zones near the right corner and bottom opening of the hood. The authors suggest that containment leakage from these areas would be very likely given the highly turbulent flow fields in these regions of the hood.
Tseng et al. evaluated the results of British, European, and American protocols for tracer gas testing for a traditional laboratory fume hood. This testing showed that airflow patterns and the performance of the hood are integrally related (Tseng, Huang et al. 2007). They showed that the choice of source position, hood design, and presence of a manikin are important to a careful evaluation of the fume hood. The American standard evaluates fume hood performance based on the traditional industrial hygiene precept of evaluating operator BZ exposure. This method failed to detect serious leakages due to the placement of the sampler in the breathing zone versus at the sides and base of the hood face where leakage is most likely to occur. The British standard, despite taking samples across the hood face, was
EPHB Report No. 364-11a
Page 4
deficient due to combining these samples in a plenum prior to analysis thus averaging the spatial variability and damping out the effect of local leaks. Tseng et al. concluded that the use of a method which better evaluates the spatial containment of the hood on a region-by-region basis was recommended. This approach will more likely identify hood containment deficiencies which arise from aerodynamic design factors such as high face velocity variability.
This study evaluated the performance of a new “nano” fume hood under varying room ventilation conditions and three exhaust flows. For the testing, a tracer gas test protocol adapted from the European fume hood test method was used for evaluation (European Committee for Standardization (CEN) 2003). A static test procedure using a full-size manikin was conducted. Samplers were placed in the manikin breathing zone, as well as, at the left and right corners of the hood to assess leakage from the hood at areas known to have high turbulence. In addition, all conditions were tested with the room air conditioner on and off to assess the impact of the supply air on the containment effectiveness. The results of the tracer gas containment tests are compared for all test conditions.
Methodology Description of Hood and Laboratory Space The “nano” fume hood evaluated was the Flow Sciences model FS10300 Top Mounted Balance Enclosure System (Leland, NC) with a FS4700 series internal fan filtration unit (referred to as the nano hood). This enclosure was designed to protect workers during handling of active pharmaceutical ingredients and to provide low turbulence environment for the weighing of materials on microbalances. These types of benchtop ventilated balance enclosures retail for approximately $5,000-15,000 depending on size and configuration. The enclosure evaluated in this study has interior dimensions of 20 inches (in) (height) x 32 in (width) with an internal working depth of 30 in and a face opening of 9.5 in (height) by 32 in (width). It is constructed out of cast acrylic with a phenolic resin base. The enclosure includes a variety of features to reduce turbulence and improve containment performance. Molded airfoils are included at both side posts, at the base of the hood inlet, and along the bottom of the hood sash. The hood is exhausted through an integral HEPA filter/fan unit which was connected to a facility exhaust fan through a thimble fitting. This hood was located in a laboratory which was 10.5 feet (ft) wide by 22 ft deep with a ceiling height of 9.4 ft. A ceiling-mounted, recirculating room air conditioner provided heating and cooling for the lab; one 2 x 2 ft ceiling diffuser was drawing in air from the room while the second 2 x 2 ft diffuser was supplying conditioned air to the room. The
EPHB Report No. 364-11a
Page 5
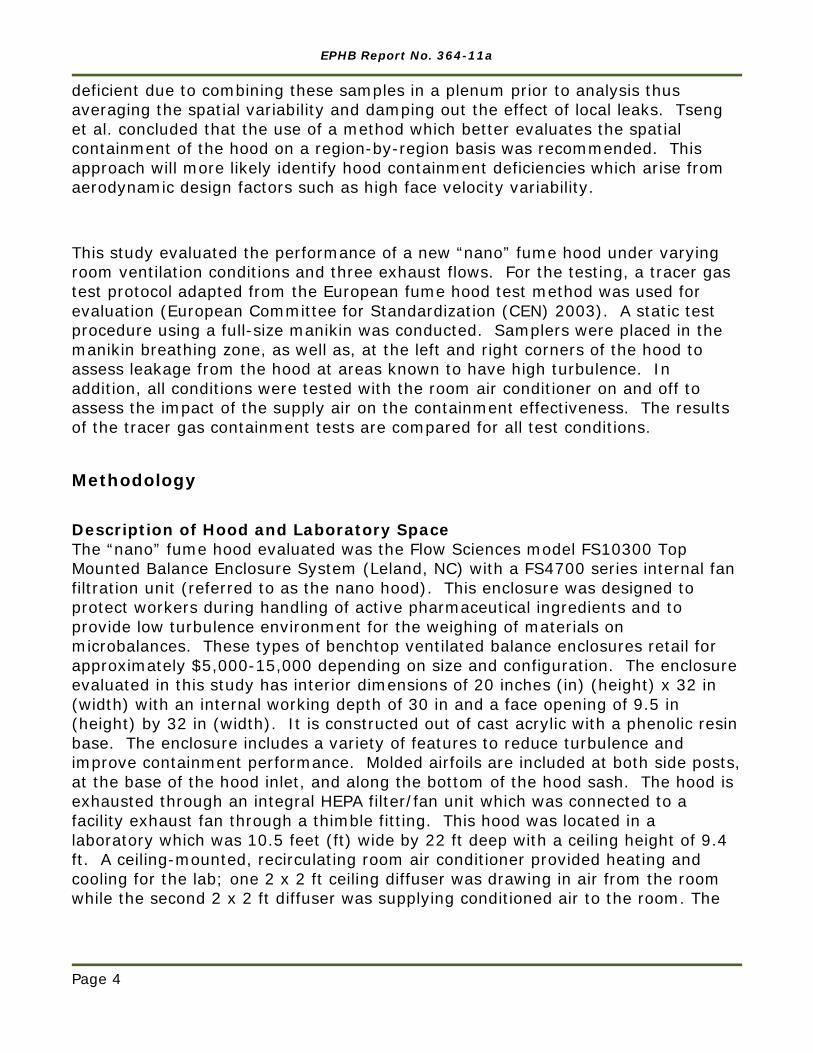
supply air diffuser was located approximately 6 feet above the center of the hood and 2 feet to the left of the hood face center (Figure 1).
Figure 1. Test room showing nanomaterial hood and room air diffuser.
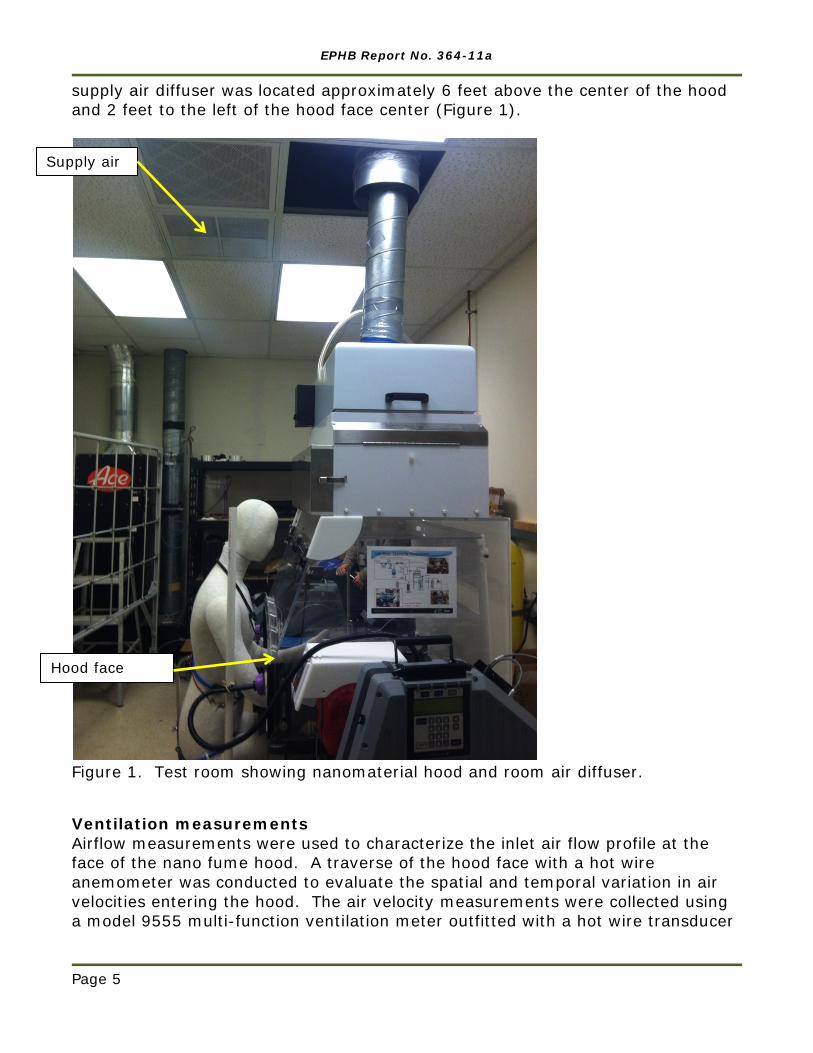
Ventilation measurements Airflow measurements were used to characterize the inlet air flow profile at the face of the nano fume hood. A traverse of the hood face with a hot wire anemometer was conducted to evaluate the spatial and temporal variation in air velocities entering the hood. The air velocity measurements were collected using a model 9555 multi-function ventilation meter outfitted with a hot wire transducer
Supply air
Hood face
EPHB Report No. 364-11a
Page 6
(TSI, Inc. Shoreview, MN) with a range of 30 to 9,999 ft/min, an accuracy of 3% of reading or 3 feet per minute (ft/min) and a response time of 200 milliseconds (ms). These measurements were conducted without a manikin in place and with the hood free of clutter and internal obstructions. The velocity profile was measured at the mid-plane of the hood face—at a distance of 4.7 in. from the hood base. Measurements were made in 7 evenly spaced increments of 4.25 in. starting at a distance of 3 in. from the left side airfoil (see Figure 2). Air velocity data were logged each second for 1 minute to characterize temporal variability. The temporal variations in air velocity are often referred to as the turbulence intensity which is shown by Equation 1 (Versteeg and Malalasekera 2007):
𝐼 = 𝑢′
𝑈 (1)
Where u’ = standard deviation of the velocity readings
U = average velocity
The turbulence intensity is a relative measure of the unsteadiness of the airflow and was calculated to evaluate the impact of the room air conditioner on variability in hood inlet airflow.
Figure 2. Hood face velocity traverse points.
EPHB Report No. 364-11a
Page 7
Hood exhaust flow rates were measured using two orthogonal 10-point Pitot traverses with a model 9555 multi-function ventilation meter outfitted with an electronic manometer (TSI, Inc. Shoreview, MN) having an accuracy of 1% of reading or +/- 0.005 inches of water gauge. Supply air diffuser volumetric flow was measured using a model EBT731 Alnor air capture hood (TSI, Inc. Shoreview, MN).
Tracer gas measurements
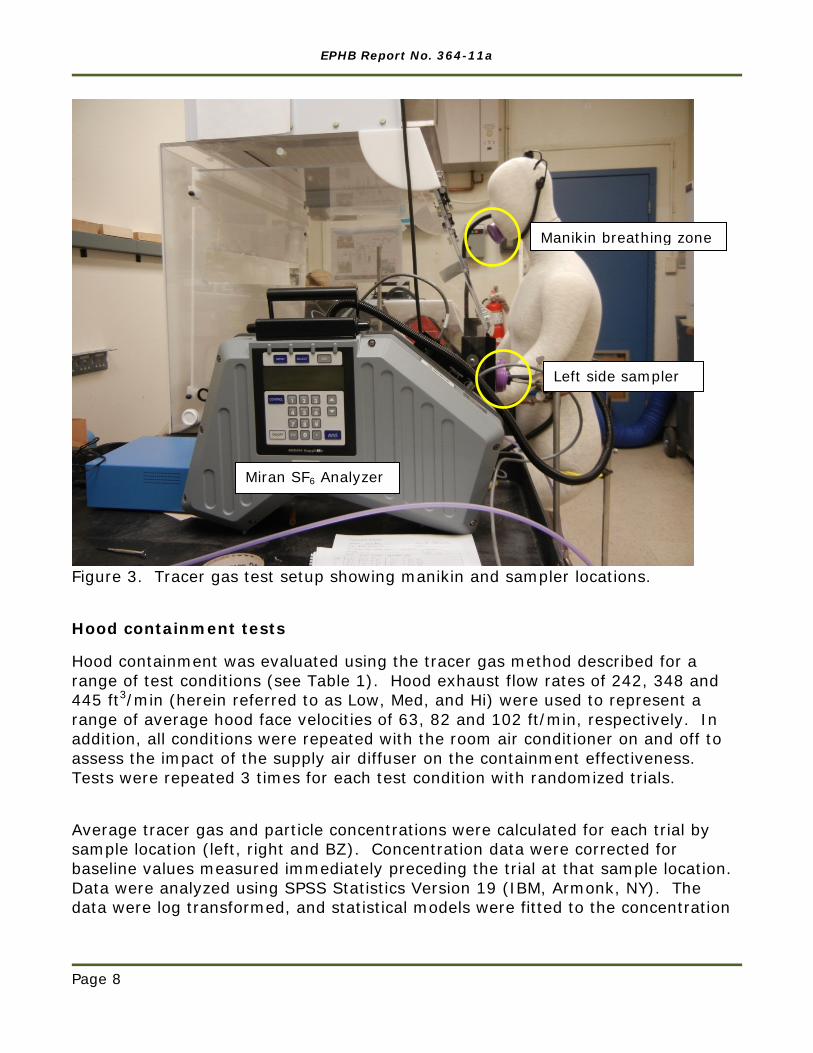
Tracer gas experiments were conducted to assess containment effectiveness of the nano hood. For this testing, a tracer gas release point was set up inside the hood which consisted of a sintered bronze cylinder measuring approximately 0.39 in. diameter by 0.79 in. height (exhaust muffler, Speedaire, model 1A326). This disperser was positioned at the midpoint of the hood opening (16 in. from each side)—4.7 in from the hood base (vertical) and 6 in. inside the hood opening for the nano hood. This location was chosen to be representative of good work practice, i.e. location work at least 6 in from the hood face and towards the center of the hood opening. A model GFC37 mass flow controller (Aalborg Instruments and Controls Inc., Orangeburg, NY) was used to meter a mixture of 10% SF6/99% nitrogen (by volume) at a flow rate of 2 liters per minute (lpm). SF6 concentration data was logged at three sample points throughout the test, including: the left and right sides at hood face opening, and at the manikin breathing zone. The side samplers were located just outside the hood face 3.5 in. from the side airfoil (to the center of the sampler) and 3.5 in from the hood base (Figure 3) to the center of the sampler. All samples were analyzed using three MIRAN 205B XL Sapphire portable ambient air analyzers (Thermo Environmental Instruments, Franklin, MA). A baseline concentration was taken for each trial for 1 min prior to the release of tracer gas. The tracer gas dispersion was started and data were collected for 4 min--the first 30 s of data were removed to allow for stabilization of the mass flow controller and the following 3 min of data were used for analysis.
EPHB Report No. 364-11a
Page 8
Figure 3. Tracer gas test setup showing manikin and sampler locations.
Hood containment tests
Hood containment was evaluated using the tracer gas method described for a range of test conditions (see Table 1). Hood exhaust flow rates of 242, 348 and 445 ft3/min (herein referred to as Low, Med, and Hi) were used to represent a range of average hood face velocities of 63, 82 and 102 ft/min, respectively. In addition, all conditions were repeated with the room air conditioner on and off to assess the impact of the supply air diffuser on the containment effectiveness. Tests were repeated 3 times for each test condition with randomized trials.
Average tracer gas and particle concentrations were calculated for each trial by sample location (left, right and BZ). Concentration data were corrected for baseline values measured immediately preceding the trial at that sample location. Data were analyzed using SPSS Statistics Version 19 (IBM, Armonk, NY). The data were log transformed, and statistical models were fitted to the concentration
Manikin breathing zone
Left side sampler
Miran SF6 Analyzer
EPHB Report No. 364-11a
Page 9
data. Bonferroni multiple comparison tests were conducted to evaluate the differences in concentrations between hood exhaust flows.
Results
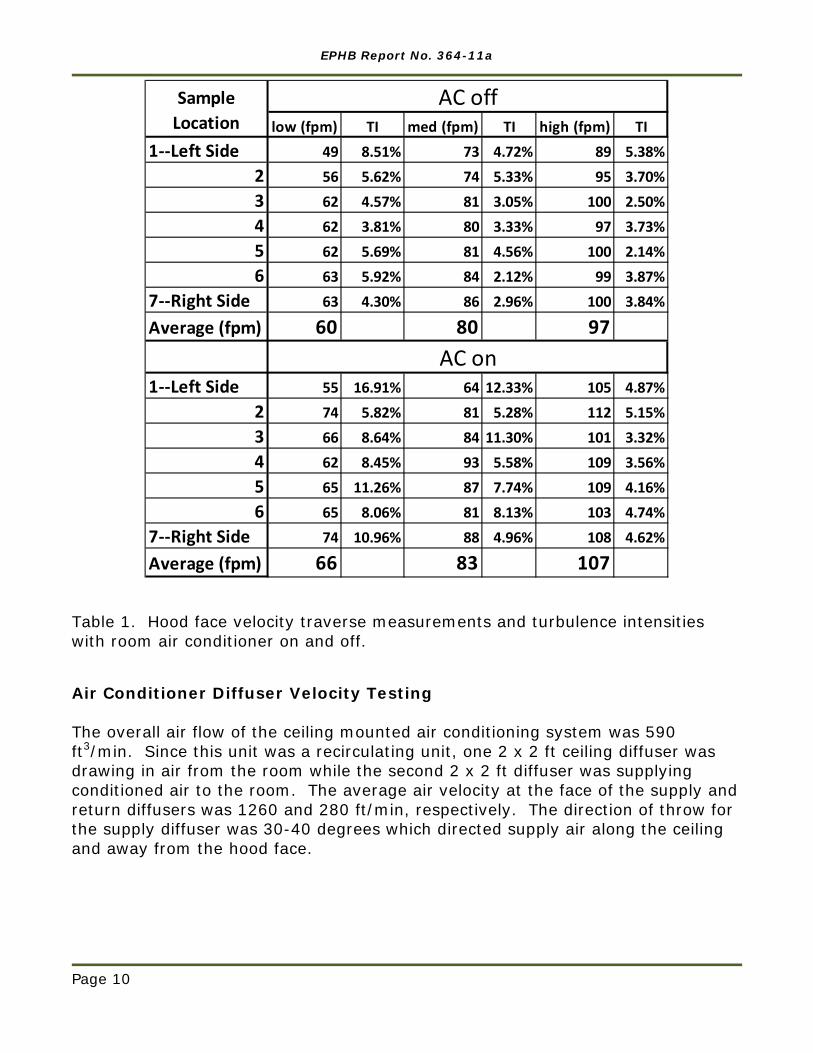
Hood Face Velocity Testing The face velocities of the nano hood are shown in Table 1 and consist of 7 measurements across the face of the hood. These measurements were taken with and without the room ventilation system turned on at each exhaust flow (LO: 63, MED: 82 and HI: 102 ft/min average face velocity). In addition, turbulence intensity (TI) values are provided for each sample location for both room ventilation conditions. When the room ventilation was turned on, the turbulence intensity across the hood face increased especially at the lowest face velocity condition. When the exhaust air flow was set at the lowest setting (LO), the face velocity turbulence intensities ranged from 5-8% when the room ventilation was off. When the room ventilation was turned on, the turbulence intensities increased to a range of 8-16%. At the medium exhaust air flow (MED), the turbulence intensity also increased from a range of 2-5% to a range of 5-12% with the ventilation system off and on, respectively. For both of these exhaust air flows, the highest variability occurred on the left side of the hood, closest to the room supply air diffuser outlet. At the highest exhaust air flow (HI), turbulence intensity was less affected by the room air supply.
EPHB Report No. 364-11a
Page 10
Table 1. Hood face velocity traverse measurements and turbulence intensities with room air conditioner on and off.
Air Conditioner Diffuser Velocity Testing The overall air flow of the ceiling mounted air conditioning system was 590 ft3/min. Since this unit was a recirculating unit, one 2 x 2 ft ceiling diffuser was drawing in air from the room while the second 2 x 2 ft diffuser was supplying conditioned air to the room. The average air velocity at the face of the supply and return diffusers was 1260 and 280 ft/min, respectively. The direction of throw for the supply diffuser was 30-40 degrees which directed supply air along the ceiling and away from the hood face.
low (fpm) TI med (fpm) TI high (fpm) TI1--Left Side 49 8.51% 73 4.72% 89 5.38%
2 56 5.62% 74 5.33% 95 3.70%3 62 4.57% 81 3.05% 100 2.50%4 62 3.81% 80 3.33% 97 3.73%5 62 5.69% 81 4.56% 100 2.14%6 63 5.92% 84 2.12% 99 3.87%
7--Right Side 63 4.30% 86 2.96% 100 3.84%
Average (fpm) 60 80 97
1--Left Side 55 16.91% 64 12.33% 105 4.87%2 74 5.82% 81 5.28% 112 5.15%3 66 8.64% 84 11.30% 101 3.32%4 62 8.45% 93 5.58% 109 3.56%5 65 11.26% 87 7.74% 109 4.16%6 65 8.06% 81 8.13% 103 4.74%
7--Right Side 74 10.96% 88 4.96% 108 4.62%
Average (fpm) 66 83 107
AC off
AC on
Sample Location
EPHB Report No. 364-11a
Page 11
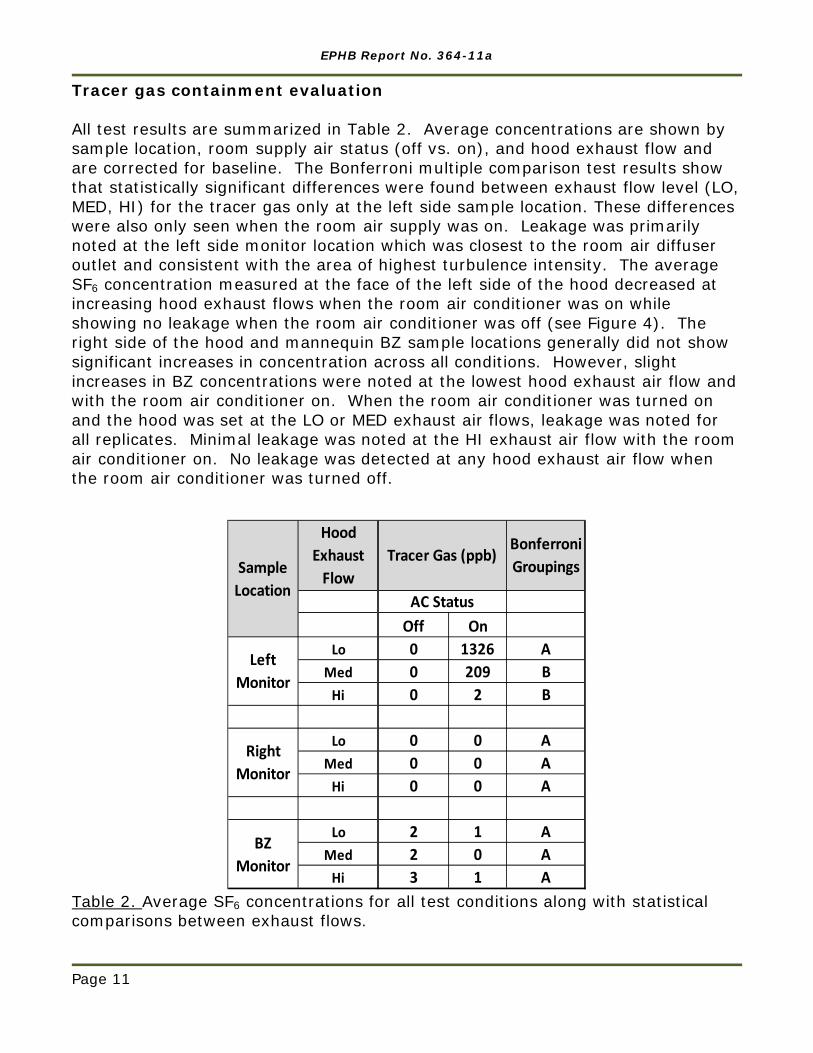
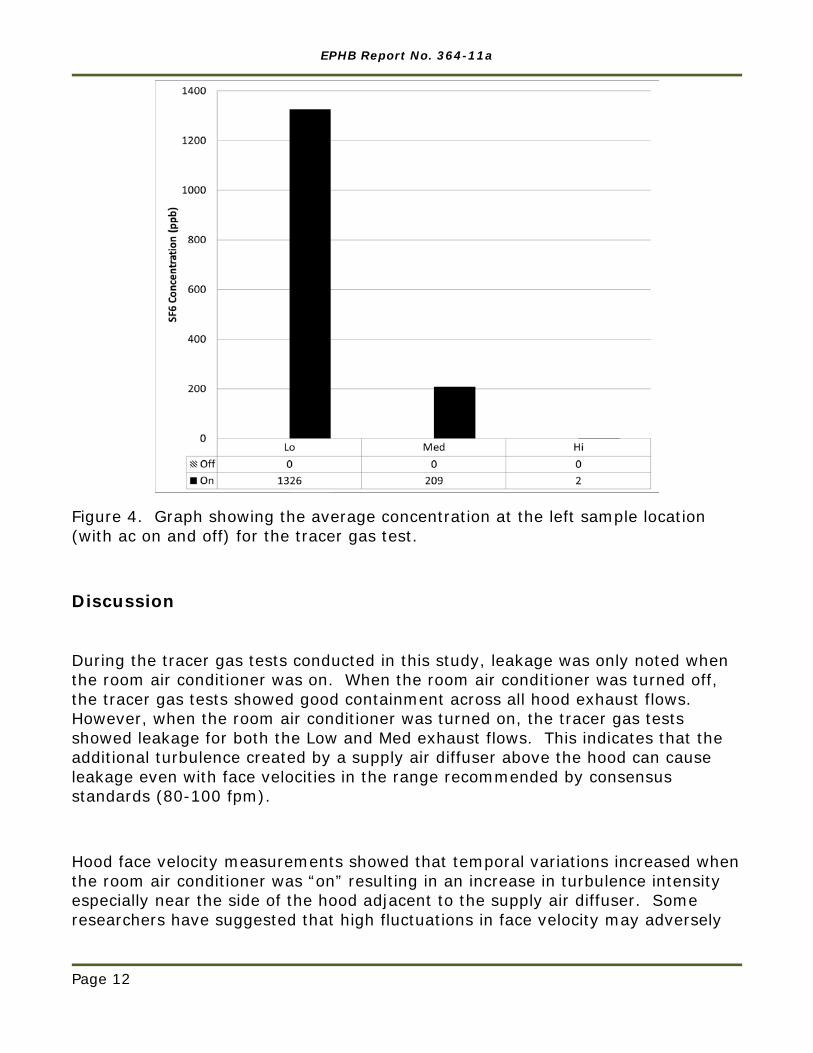
Tracer gas containment evaluation All test results are summarized in Table 2. Average concentrations are shown by sample location, room supply air status (off vs. on), and hood exhaust flow and are corrected for baseline. The Bonferroni multiple comparison test results show that statistically significant differences were found between exhaust flow level (LO, MED, HI) for the tracer gas only at the left side sample location. These differences were also only seen when the room air supply was on. Leakage was primarily noted at the left side monitor location which was closest to the room air diffuser outlet and consistent with the area of highest turbulence intensity. The average SF6 concentration measured at the face of the left side of the hood decreased at increasing hood exhaust flows when the room air conditioner was on while showing no leakage when the room air conditioner was off (see Figure 4). The right side of the hood and mannequin BZ sample locations generally did not show significant increases in concentration across all conditions. However, slight increases in BZ concentrations were noted at the lowest hood exhaust air flow and with the room air conditioner on. When the room air conditioner was turned on and the hood was set at the LO or MED exhaust air flows, leakage was noted for all replicates. Minimal leakage was noted at the HI exhaust air flow with the room air conditioner on. No leakage was detected at any hood exhaust air flow when the room air conditioner was turned off.
Table 2. Average SF6 concentrations for all test conditions along with statistical comparisons between exhaust flows.
Off OnLo 0 1326 A
Med 0 209 BHi 0 2 B
Lo 0 0 AMed 0 0 A
Hi 0 0 A
Lo 2 1 AMed 2 0 A
Hi 3 1 A
Right Monitor
BZ Monitor
AC Status
Sample Location
Left Monitor
Hood Exhaust
FlowTracer Gas (ppb)
Bonferroni Groupings
EPHB Report No. 364-11a
Page 12
Figure 4. Graph showing the average concentration at the left sample location (with ac on and off) for the tracer gas test.
Discussion
During the tracer gas tests conducted in this study, leakage was only noted when the room air conditioner was on. When the room air conditioner was turned off, the tracer gas tests showed good containment across all hood exhaust flows. However, when the room air conditioner was turned on, the tracer gas tests showed leakage for both the Low and Med exhaust flows. This indicates that the additional turbulence created by a supply air diffuser above the hood can cause leakage even with face velocities in the range recommended by consensus standards (80-100 fpm).
Hood face velocity measurements showed that temporal variations increased when the room air conditioner was “on” resulting in an increase in turbulence intensity especially near the side of the hood adjacent to the supply air diffuser. Some researchers have suggested that high fluctuations in face velocity may adversely
EPHB Report No. 364-11a
Page 13
impact the performance of fume hood enclosures (Fletcher and Johnson 1992, Altemose, Flynn et al. 1998, Tseng, Huang et al. 2010). Tseng et al. noted that the turbulent flow field in the region of the doorsill and side posts results in complex boundary layer interactions which result in the leakage of contaminants out of the hood (Tseng, Huang et al. 2006). Flow separation and recirculation zones around these regions result in diffusion and leakage of contaminants from fume hoods. Altemose et al. noted that temporal fluctuations in face velocity were more strongly related to containment than spatial variation across the hood face (Altemose, Flynn et al. 1998). This study showed that leakage occurred around the edge of the hood due to additional turbulence in the areas caused by the interaction of flow with the hood structure consistent with previous studies (Caplan and Knutson 1982, Fletcher and Johnson 1992, Tseng, Huang et al. 2010).
Other research has also shown the impact of room air conditioning (or makeup air) on the performance of fume hood containment (Caplan and Knutson 1982, DiBerardinis, First et al. 1991, Altemose, Flynn et al. 1998). Altemose et al. found that the magnitude of cross draft velocities relative to hood face velocity is an important factor in determining whether a hood will leak. Likewise, Caplan and Knutson suggested that the terminal velocity of supply air jets is as important as hood face velocity in hood containment effectiveness noting that the center of the hood experiences better containment than the sides (Caplan and Knutson 1982).
Conclusions and Recommendations
This study evaluated the containment effectiveness of a new nanomaterial handling enclosure using a tracer gas test method. The impact of a room air conditioner was demonstrated with containment being adversely impacted during the use of room air ventilation located near the face of the hood. This effect was amplified at the Low and Med hood exhaust flows where the impact of the room air on hood face velocity fluctuations was significant. At the Hi exhaust flow, the impact of the room air conditioner on face velocity fluctuations was minimal. These findings reinforce the recommendations that supply air terminals be placed as far away from hoods and other exhaust devices as practical (ANSI/AIHA 2002).
EPHB Report No. 364-11a
Page 14
References Altemose, B. A., M. R. Flynn and J. Sprankle (1998). "Application of a tracer gas challenge with a human subject to investigate factors affecting the performance of laboratory fume hoods." Am Ind Hyg Assoc J 59(5): 321-327.
ANSI/AIHA (2002). Laboratory Ventilation. Fairfax, VA, American Industrial Hygiene Association.
ASHRAE (1995). Method of testing performance of laboratory fume hoods. Atlanta, GA, American Society of Heating Refrigerating and Air-Conditioning Engineers.
Caplan, K. J. and G. W. Knutson (1982). "Influence of room air supply on laboratory hoods." Am Ind Hyg Assoc J 43(10): 738-746.
Chou, C. C., H. Y. Hsiao, Q. S. Hong, C. H. Chen, Y. W. Peng, H. W. Chen and P. C. Yang (2008). "Single-walled carbon nanotubes can induce pulmonary injury in mouse model." Nano Lett 8(2): 437-445.
Conti, J. A., K. Killpack, G. Gerritzen, L. Huang, M. Mircheva, M. Delmas, B. H. Hathorn, R. P. Appelbaum and P. A. Holden (2008). "Health and Safety Practices in the Nanomaterials Workplace: Results from an International Survey." Environ Sci Technol 42(9): 3155-3162.
DiBerardinis, L. J., M. W. First and R. E. Ivany (1991). "Field Results of an in-place, quantitative performance test for laboratory fume hoods." Appl Occup Environ Hyg 6(3): 227-231.
Elder, A., R. Gelein, V. Silva, T. Feikert, L. Opanashuk, J. Carter, R. Potter, A. Maynard, Y. Ito, J. Finkelstein and G. Oberdorster (2006). "Translocation of inhaled ultrafine manganese oxide particles to the central nervous system." Environ Health Perspect 114(8): 1172-1178.
European Committee for Standardization (CEN) (2003). Fume cupboards-Part 3: Type test methods (EN 14175-3:2003). Brussels, CEN.
Fletcher, B. and A. Johnson (1992). "Containment testing of fume cupboards—II. Test room measurements." Ann Occup Hyg 36(4): 395-405.
George, D. K., D. K. Flynn and R. Goodman (1990). "The impact of boundary layer separation on local exhaust design and worker exposure." Appl Occup Environ Hyg 5: 501-209.
EPHB Report No. 364-11a
Page 15
Greenley, P. L., L. J. DiBerardinis and F. A. Lorch (1999). "Containment testing for occupied and unoccupied laboratory chemical hoods." ASHRAE Trans. 105(1): 733-737.
Guffey, S. E. and N. Barnea (1994). "Effects of face velocity, flanges, and mannikin position on the effectiveness of a benchtop enclosure hood in the absence of crossdrafts." Am Ind Hyg Assoc J 55(2): 132-139.
Hallock, M. F., P. Greenley, L. DiBerardinis and D. Kallin (2009). "Potential risks of nanomaterials and how to safely handle materials of uncertain toxicity." Journal of Chemical Health and Safety 16(1): 16-23.
Johnson, A. E., B. Fletcher and C. J. Saunders (1996). "Air movement around a worker in a low-speed flow field." Ann Occup Hyg 40(1): 57-64.
Kim, T. H. and M. R. Flynn (1991). "Airflow pattern around a worker in a uniform freestream." Am Ind Hyg Assoc J 52(7): 287-296.
Poland, C. A., R. Duffin, I. Kinloch, A. Maynard, W. A. H. Wallace, A. Seaton, V. Stone, S. Brown, W. MacNee and K. Donaldson (2008). "Carbon nanotubes introduced into the abdominal cavity of mice show asbestos-like pathogenicity in a pilot study." Nature Nanotechnology 3: 423-428.
Rossi, E. M., L. Pylkkanen, A. J. Koivisto, M. Vippola, K. A. Jensen, M. Miettinen, K. Sirola, H. Nykasenoja, P. Karisola, T. Stjernvall, E. Vanhala, M. Kiilunen, P. Pasanen, M. Makinen, K. Hameri, J. Joutsensaari, T. Tuomi, J. Jokiniemi, H. Wolff, K. Savolainen, S. Matikainen and H. Alenius (2010). "Airway exposure to silica-coated TiO2 nanoparticles induces pulmonary neutrophilia in mice." Toxicol Sci 113(2): 422-433.
Shvedova, A. A., E. R. Kisin, R. Mercer, A. R. Murray, V. J. Johnson, A. I. Potapovich, Y. Y. Tyurina, O. Gorelik, S. Arepalli, D. Schwegler-Berry, A. F. Hubbs, J. Antonini, D. E. Evans, B. K. Ku, D. Ramsey, A. Maynard, V. E. Kagan, V. Castranova and P. Baron (2005). "Unusual inflammatory and fibrogenic pulmonary responses to single-walled carbon nanotubes in mice." Am J Physiol Lung Cell Mol Physiol 289(5): L698-708.
Takagi, A., A. Hirose, T. Nishimura, N. Fukumori, A. Ogata, N. Ohashi, S. Kitajima and J. Kanno (2008). "Induction of mesothelioma in p53+/- mouse by intraperitoneal application of multi-wall carbon nanotube." J Toxicol Sci 33(1): 105-116.
EPHB Report No. 364-11a
Page 16
Tsai, S. J., E. Ada, J. Isaacs and M. J. Ellenbecker (2009). "Airborne nanoparticle exposures associated with the manual handling of nanoalumina in fume hoods." J Nanopart Res 11(1): 147-161.
Tseng, L. C., R. F. Huang and C. C. Chen (2010). "Significance of face velocity fluctuation in relation to laboratory fume hood performance." Ind Health 48(1): 43-51.
Tseng, L. C., R. F. Huang, C. C. Chen and C. P. Chang (2006). "Correlation between airflow patterns and performance of a laboratory fume hood." J Occup Environ Hyg 3: 694-706.
Tseng, L. C., R. F. Huang, C. C. Chen and C. P. Chang (2007). "Aerodynamics and performance verifications of test methods for laboratory fume cupboards." Ann Occup Hyg 51(2): 173-187.
Versteeg, H. K. and W. Malalasekera (2007). An Introduction to Computational Fluid Dynamics: The Finite Volume Method. Essex, Pearson Education Limited.
Wang, J., Y. Liu, F. Jiao, F. Lao, W. Li, Y. Gu, Y. Li, C. Ge, G. Zhou, B. Li, Y. Zhao, Z. Chai and C. Chen (2008). "Time-dependent translocation and potential impairment on central nervous system by intranasally instilled TiO(2) nanoparticles." Toxicology 254(1-2): 82-90.

Delivering on the Nation’s promise: Safety and health at work for all people through research and prevention.
To receive NIOSH documents or other information about occupational safety and health topics, contact NIOSH at
1-800-CDC-INFO (1-800-232-4636)
TTY: 1-888-232-6348
E-mail: [email protected]
or visit the NIOSH Web site at www.cdc.gov/niosh
For a monthly update on news at NIOSH, subscribe to NIOSH eNews by visiting www.cdc.gov/niosh/eNews
SAFER ● HEALTHIER ● PEOPLE