Embed Size (px)
Citation preview

International Journal of Mechanical & Mechatronics Engineering IJMME-IJENS Vol:14 No:05 51
144105-2929-IJMME-IJENS © October 2014 IJENS I J E N S
Abstract— The size and distribution of in-cylinder soot
particles affect the sizes of soot particles emitted from exhaust
tailpipes as well as the soot in oil. The simulation work reported
in this paper focuses on the study of soot formation and
movement inside a diesel engine with in-depth analysis of soot
particles in the squish region. Soot particles in the squish region
have high potential to be deposited onto the cylinder wall, and
subsequently penetrate into engine lubrication system and
contaminate the oil. The prediction of a soot particle pathline and
size distribution was performed using post-processed in-cylinder
combustion data from Kiva-3v computational fluid dynamics
(CFD) simulations with a series of Matlab routines. Only soot
oxidation and soot surface growth process were considered in this
study. Coagulation and agglomeration of soot particles were not
taken into account. Soot particles were tracked from 8 crank
angle (CA) degree after top dead center (ATDC) as soot starts to
form in high concentration until 120 CA degree ATDC at exhaust
valve opening (EVO). The soot particle size and its distribution
were analyzed at different crank angles. In the squish region, the
most dominant soot particle size was 20-50 nm at earlier crank
angle and in 10-20 nm range at 120 CA ATDC. The percentage of
soot loss in the squish region was analyzed to be 23.2 % and the
soot loss was higher at earlier crank angle until 10 CA degree
ATDC due to high rate of oxidation.
Index Term— soot, particle tracking, squish region, in-
cylinder soot size
I. INTRODUCTION
The study and investigation of combustion and soot inside a
diesel engine cylinder had been conducted by researcher via
experiment [1], [2] and simulation [3], [4]. This research
gains the attention of the researcher due to the rule, restriction
and regulation enforcement to reduce the exhaust gas emission
produce by diesel engine [5]. The exhaust gases produced can
lead the severe health complication to human [6]-[8] and plant
This work was supported in part by the the Ministry of Higher Education
of Malaysia and Universiti Kebangsaan Malaysia under FRGS/1/2013/TK01/UKM/02/2 and GGPM-2011-055 research grants.
Muhammad Ahmar Zuber. is with Department of Mechanical and
Materials Engineering, National University of Malaysia 43600 Bangi, Malaysia (e-mail: [email protected]).
Wan Mohd Faizal Wan Mahmood is with Department of Mechanical and
Materials Engineering, National University of Malaysia 43600 Bangi, Malaysia (e-mail: [email protected]).
Zulkhairi Zainol Abidin is with Department of Mechanical and Materials
Engineering, National University of Malaysia 43600 Bangi, Malaysia (e-mail: [email protected]).
Zambri Harun is with Department of Mechanical and Materials
Engineering, National University of Malaysia 43600 Bangi, Malaysia (e-mail: [email protected]).
[9], sulfation of building stones [10] and damage the engine.
Soot damage the engine by increase the engine wear by
degrading the oil that reduces the flow ability of the oil and
cause the need to change the oil frequently [11]-[14]. Thus it
is important to understand soot formation, behavior and
movement inside the engine cylinder until emission so counter
measure action can be taken to reduce the soot and exhaust
gases emission.
Exhaust gas emission from a direct injection diesel engines
consist of carbon monoxide (CO), nitrogen oxide (NOx),
sulfur dioxide (SO2), unburned hydrocarbons (UHC) [15] and
particulate matter (PM) [16], [17]. Particulate matter
composed of 10 % of fuel, 16 % of oil, 10 % of combination
sulfuric acid and water and, 64 % of soot [18].
A modelling of soot formation with detailed chemistry and
physics had been conducted by [1] and a series of model
containing the gas-phase reaction, aromatic chemistry, soot
particle coagulation, soot particle aggregation and surface
growth were produce. According to [19] the soot formation
can divided to four major processes: homogeneous nucleation
of soot particles, particle coagulation, particle surface
reactions and particle agglomeration. On the other hand, some
researcher focus on the soot properties [20], soot mechanism
[2], [4], in-cylinder soot particle movement [3] and soot size
[21]. While [22] characterize the soot formation reaction by
four steps: 1.Particle nucleation, 2.Particle surface growth,
3.Particle surface oxidation, 4.Particle coagulation 5.PAH
deposition on the particle surface.
Various experimental studies had been conducted by [1],
[2], [20], [21], [23]-[25] to understand the formation and
behavior of soot inside engine cylinder. An in-cylinder soot
formation and oxidation had been carried out by [23] using the
two-dimensional Laser-Induced Incandescence (LII) and the
result showed that at 2° CA ATDC the soot start to form and
soot concentration start to increase at 6° to 12° CA ATDC.
But after 12° CA ATDC soot concentration intensity start to
decrease. An experiment was conducted to study the
hygroscopic properties of carbon and diesel soot particles by
[20]. They use diesel engine to produce soot particle and spark
discharge between two graphite electrodes to produce carbon
particle. The particle size found to be at 20-500 nm and the
primary carbon particle at 10 nm and primary soot particle at
25 nm.
Soot particle mass, size and distribution were effected by
engine load, operation mode and type of fuel. A study by [21]
In-Cylinder Soot Particle Distribution in Squish
Region of a Direct Injection Diesel Engine
Muhammad A. Zuber, Wan Mohd F. Wan Mahmood, Zulkhairi Zainol Abidin. and Zambri Harun., Department of Mechanical and Materials Engineering, Faculty of Engineering and Built Environment, Universiti
Kebangsaan Malaysia, Bangi, Malaysia

International Journal of Mechanical & Mechatronics Engineering IJMME-IJENS Vol:14 No:05 52
144105-2929-IJMME-IJENS © October 2014 IJENS I J E N S
on the particle size distribution during emission concluded that
the engine that operate at higher load produce larger soot
particle size with wider size distribution. This happened due to
the nucleation process, condensation in exhaust emission,
coagulation and agglomeration of soot particle with water
content in exhaust gases. At higher engine load, more soot
were produce because of the increase of sulfur, ash, heavy
hydrocarbon and aromatic content. While [24] recorded that
soot embedding with hydrocarbon (e.g., Polycyclic Aromatic
Hydrocarbon, PAH) can produce soot particle with smaller
size. The different in-size of soot particle by different
researcher is due to the different type of measurement
techniques or machines use. Each measurement technique or
machines has its own merit.
As oppose to the experimental method, some of the
researcher [1], [3], [4], [22], [25]-[34] study the soot formation
and behavior by conducting a simulation with mathematical
modeling. Pang et al. [30] conducted a simulation on the soot
precursor formation mechanism using CFD software Ansys-
Fluent with chemistry solver, Chemkin-CFD. A detailed
chemistry soot models for internal combustion engine were
used in a CFD simulation using Kiva reported by [1]. As PAH
was treated as a soot precursor in the simulation and the soot
particle size was 2 nm with 667200 numbers of soot particle
were recorded at 60° CA ATDC. Another research by [4] was
performed with various injections timing model result shown
that the soot concentration is high at 0-30° CA ATDC for all
cases and the multidimensional model they used was very
helpful. Puduppakkam et al. [28] use moment method with
FORTE CFD software to track soot formation and evolution
inside a direct injection diesel engine. The findings showed
that the density of soot particle was peak at 10° CA ATDC
and decrease afterward. While at 30-40° CA ATDC soot with
larger size were found and the size decrease afterward. The
drop of soot density after 10° CA ATDC is contributed by
three factors, firstly lower soot nucleation after CA 10° that
decrease soot density, second is the soot coagulation occur
that reduce the soot particle number and lastly soot oxidation
occur that reduce the soot density.
A simulation on soot formation characteristic using Kiva-
3v2 were conducted by [22] and state that soot density and
soot particle size significantly increase at earlier engine
combustion and drop down until it stabilize at certain number.
Soot with smaller size in range 5-40 nm were produce at
earlier engine combustion due to the pyrolysis reactions and
polymerization of the hydrocarbon fuel. In middle engine
combustion the numbers of large size of soot particle increase
rapidly due to the coagulation, condensation, surface growth
and deposition of PAHs as PAHs contribute to increase of soot
particle surface growth. At late engine combustion the size
distribution stabilizes at peak of 5-20 nm under the influence
of continues oxidation reaction. Rao & Honnery [32] use a
multi-step soot model to predict the soot formation and
mechanism inside the diesel engine cylinder. They found both
soot particle number and diameter increase at earlier crank
angle to the peak and start to decrease after that. They also
found that average particle diameter is in the range of soot
particle diameter found in the literature and typical diesel
engine. At earlier combustion in engine, soot formation in the
head of spray can be neglected due to high temperature and
soot formation is limited to the beginning of diffusion burn
phase but after that oxidation will take place.
Work on the soot formation in the diesel engine and their
interest is in the crevice near the cylinder wall were studied by
[31], [33], [34]. At start of the ignition the soot and at the end
of expansion stroke the soot more likely to be transported to
the wall liner and crevice region by the squish motion. The
soot transport to the wall liner is depended on the soot density
and recirculation of charge this can be reduced by early
injection of fuel [34].
The prediction the soot particle size and distribution in this
paper was achieved by post processing the result obtained
from simulation using CFD software, Kiva-3v. Kiva-3v
software was chosen due to its flexibility to be adapted and
modified according to the user preference model. The Kiva-3v
CFD code has open architecture that allows researchers to
understand, investigate and amend the codes [29]. Kiva-3v can
be used to simulate air flow, fuel sprays, and combustion in
practical combustion devices. Originally, Kiva was intended
for three dimensions simulation for modelling flows in
gasoline and diesel engine. It was then expanded on other
combustion devices such as turbines and furnaces. Kiva
features the ability to calculate air flows in complex
geometries with fuel spray dynamics and evaporation, mixing
of fuel and air, and combustion with resultant heat release and
exhaust-product formation [35]. Hong et al. [36] used Kiva-3v
to develop soot model using realistic physical and chemical
equations as bases with reasonable cost and produced
excellent agreement with experiment.
This simulation is in the limit of expansion stroke using a
series of algorithm to predict it size and pathline. It is expected
from this paper that soot particle size distribution in the squish
region at different crank angles can be determined so that
further investigated on soot deposition onto the cylinder wall
can be performed.
II. METHOD
The simulation of combustion inside the engine cylinder
was perform by using Kiva-3v CFD software. The result of the
simulation can be found on [29] as this paper is the extended
work from [3]. The details on the sub-model, mesh
configuration, fuel injector specification and test condition is
available at [29]. The specification of engine used in Kiva-3v
as shown in Table I and type of bowl use in this simulation is
bowl in type as in Fig. 1. All the important parameter from
Kiva-3v result such as temperature, pressure, bulk gas
velocity, soot, diesel fuel and oxygen concentration were
extracted to be used in Matlab routine to calculate soot
pathline and size.
The prediction of soot pathline and size is limited to the
domain of stroke expansion only. The domain is at inlet valve
closing until before exhaust valve opening.

International Journal of Mechanical & Mechatronics Engineering IJMME-IJENS Vol:14 No:05 53
144105-2929-IJMME-IJENS © October 2014 IJENS I J E N S
A. Soot Pathline
The assumptions made to calculate and predict the soot
particle pathline are that the soot particle movement follows
the velocity vector of bulk flow field at the point where the
particle is located and the soot was massless. Since the soot is
assumed to be massless, the effect of gravity or drag forces
can neglected. The position of soot is identify by crank angle
(CA) were calculated by using the velocity vector solved in
Kiva-3v. In the model used to calculate the soot particle
pathline, the fourth-order Runge-Kutta method and trilinear
technique were employed for better accuracy. Equation for the
next time step soot particle position can be described as
follows;
(1)
where donated as the current particle position and as the
current time step. represents the time interval
between the current time and the next time step. Soot particles
are counted as deposited at the cylinder wall at their last
location if the calculated position to be out of the calculation
domain.
B. Soot Particle Size
In the calculation of soot particle size, the assumptions
made are, soot particle to be in spherical shape with uniform
density of 2 g/cm3 for the entire time step and the soot mass
spread uniformly onto the surface of existing soot particle
considered as the surface growth process. The radius of soot
particle at a given time step can be obtained by rearranged the
density formula as follows;
(2)
where is the soot particle radius, is the soot particle mass
and is the soot particle density at that time step.
The soot particle mass, , at each time step was calculated
by using a combination of Hiroyasu’s soot formation and
Nagle-Strickland Constable soot oxidation models. The rate
for soot formation according to Hiroyasu’s model as below;
(3)
where is the concentration of soot formed and is the
time step interval. is donated a soot particle formation
multiplication factor. represents the concentration of fuel
vapor, which was considered the source of soot formation, and
is the pressure. Activation energy for soot formation is
12500 cal/mole denoted by , and is the temperature
inside the engine cylinder with gas constant, = 1.987
cal/mole-K. The current time step is represented by i.
Nagel-Strickland Constable (NSC) soot oxidation process
equation can be written as follows;
(4)
where, in this NSC formula, assumptions are made based on
two types of side on the carbon surface, a more reactive side
namely A, and a less reactive side, B. is the fraction of
surface covered by A and 1- is the fraction covered by B.
The following values are adopted for the constants [29]:
(5)
(6)
(7)
(8)
Similarly, mass loss due to surface oxidation was assumed to
occur uniformly on the surface of soot particles.
Soot particle size calculated in this paper depended on two
parameters. The first parameter is the starting size of soot
particle radius and in this paper the value for soot particle size
at 8° CA ATDC was taken as 10×10-9
m. This value was chose
as in literature it was in the size range [22]. The second
parameter is the soot particle formation multiplication factor
and the value was set to 2×10-11
similar to the coefficient set
by [29]. The value of 2×10-11
is an indication of the inverse
value of soot particle density (particle/cm3) as each tracked
Fig. 1. Half side of engine cylinder showing the bowl configuration
TABLE I SPECIFICATION OF THE ENGINE USE
Parameter Specification
Engine type 4 valve DI diesel
Bore Stroke 86. 0 86. 0 mm
Squish height 1. 297140330 mm
Compression Ratio 18. 2 : 1
Displacement 500 cm3
Piston Geometry Bowl-in-piston

International Journal of Mechanical & Mechatronics Engineering IJMME-IJENS Vol:14 No:05 54
144105-2929-IJMME-IJENS © October 2014 IJENS I J E N S
soot particle was assumed to be a single particle among a
cluster of soot particles in a cubic volume.
Fig. 2 showed the domains for selected starting point of
soot at 8° CA ATDC within the combustion volume engine
chamber. The 8° CA was chose based on the high rate of soot
formation in the engine cylinder at this time frame [3]. The
shaded area with tones of grey to black represents the soot
concentration distribution from the result of CFD simulation.
The points selected inside the domain were calculated to
predict the pathline and size distribution.
III. RESULTS AND DISCUSSION
A. Soot Pathlines
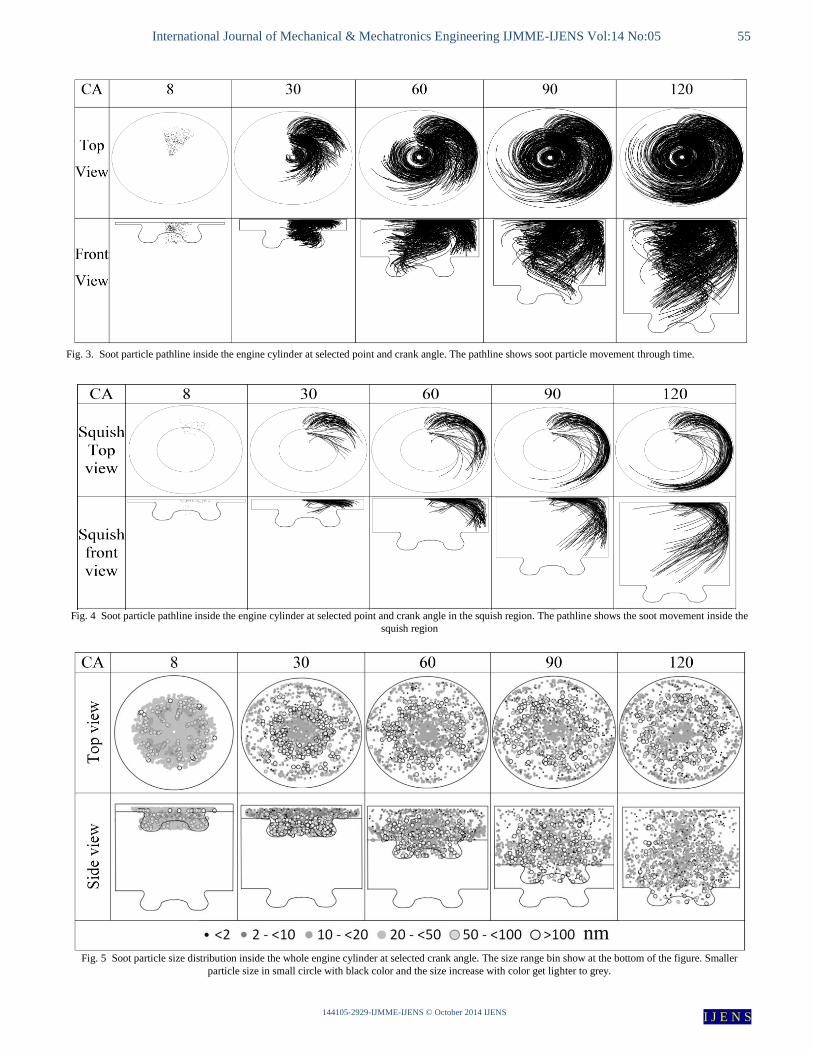
Fig. 3 shows the pathlines of soot inside the cylinder and
the pathlines were selected at one of the spray location as a
representative to all the pathlines. It was too confusing to
determine which particle of interest that went to the squish
region near cylinder wall by just looking at these pathlines. It
is almost impossible to show all the pathlines in one figure as
there are too many lines that mix together and become too
dense to distinguish from one another. The soot particle
pathlines followed the swirl direction in bulk gas motion.
In this paper squish region was defined as the region above
and outside of the cylinder bowl near the cylinder wall. The
squish region was defined as an area bigger than 3.4 cm radius
from the engine cylinder central axis up to cylinder wall. The
soot particle pathlines for the particles that travelled into the
squish region was shown in Fig. 4. Soot that travelled to the
squish region was observed to have originated from the
cylinder bowl but most of soot came from the bowl rim area.
B. Soot Particle Size
The size of soot particles represents soot diameter in
nanometers (nm). Soot particles of different sizes were
classified to the respective size ranges with different bin
numbers as shown in Table II.
Soot particle size distribution inside the engine cylinder as
shown in Fig. 5 and 6. Fig. 5 showed the soot size distribution
in the whole cylinder and Fig. 6 showed the soot size
distribution in the squish region. From the Fig. 5 and 6, it can
be observed that at 8° CA ATDC the concentration of soot is
high and packed near the center of the cylinder following the
spray profile. In the case of squish region in Fig. 6, the soot
particle spread out near the cylinder wall. After that soot
concentration start to decrease and the soot dispersed out to
the entire area in the cylinder due to the increasing combustion
chamber volume. The decrease of soot concentration and
particle number was influence by the soot oxidation that
occurred afterward [22], [28], [32]. This can be further
explained in Fig. 7 and 8. The surface growth in the whole
cylinder (Fig. 7) and squish region (Fig. 8) showed that at
earlier crank angle, the surface growth was dominant but was
taken over by oxidation as early as 10° CA degree ATDC
[22].
As earlier as 30 ° CA ATDC it can be seen that smaller soot
particles went near to the wall boundary and these particles
may be deposited at the cylinder wall boundary layer via soot
deposition mechanism [3], [34]. About 59.1 % of soot
transported near wall boundary was from bowl rim area and
40.9 % was from the inside the cylinder bowl area but very
close to the bowl rim. The comparison between the whole
cylinder and squish region size distribution at later crank
angle, found that in squish region the soot particles were in
smaller size range near cylinder wall and larger soot particle
size can be found in the bowl region or farther from cylinder
wall. This shows that in squish region the soot surface mass
was loss due to the high oxidation as explained before and as
in shown in Fig. 8. Table III and IV show the distribution and
the percentage of soot particle quantities in each soot size bin
with average soot particle size. Soot particle average size at
start of the crank angle was 25 nm and increase to 40 nm
through the combustion and reached 30 nm just before the
exhaust valve opening. Fig. 9 shows the soot particle size
distribution at 8° CA ATDC and Fig. 10 shows the
TABLE II
SIZE RANGE BIN
Bin number Size range (nm)
1 < 2
2 2 – <10
3 10 – <20
4 20 – <50
5 50 – <100
6 >100
The size range bin used to classified the soot particle
into group according to size for easier understanding.
(a)
(b)
Fig. 2. Half side and full top view of the in-cylinder volume for the
selection of starting points in at 8° CA ATDC
International Journal of Mechanical & Mechatronics Engineering IJMME-IJENS Vol:14 No:05 55
144105-2929-IJMME-IJENS © October 2014 IJENS I J E N S
start of the crank angle was 25 nm and increased to 40 nm
Fig. 3. Soot particle pathline inside the engine cylinder at selected point and crank angle. The pathline shows soot particle movement through time.
Fig. 4 Soot particle pathline inside the engine cylinder at selected point and crank angle in the squish region. The pathline shows the soot movement inside the
squish region
Fig. 5 Soot particle size distribution inside the whole engine cylinder at selected crank angle. The size range bin show at the bottom of the figure. Smaller
particle size in small circle with black color and the size increase with color get lighter to grey.

International Journal of Mechanical & Mechatronics Engineering IJMME-IJENS Vol:14 No:05 56
144105-2929-IJMME-IJENS © October 2014 IJENS I J E N S
distribution at 120° CA ATDC. In the whole cylinder the size
distribution at crank angle 8° the soot particle size shows
Gaussian distribution characteristic with size peak at 20-50 nm
and about 69.29 % of soot particle were in the size range. At
the start of combustion, the soot particle size distribution fall
near the initial diameter of soot particle set. As the crank angle
progress, the soot particle move around and experience
oxidation process. Thus at 20° CA ATDC to late crank angle
the soot particle size peak shifted to 10-20 nm with second
peak at size higher than 100 nm and shows a bimodal
characteristic. About 47.54 % of soot particles were in size
range of 10-20 nm at crank angle 20-120 and this can be
considered as the primary size of soot [20]. The soot
distribution range widens but the number of soot particle
decreases as combustion progresses.
To further understand the relation between soot particle
number and time step or crank angle, Fig. 11 was provided.
The soot particle number started at around 3500 particles, then
the number dropped to below 1500 particles at 30° CA ATDC.
After that soot particle number slowly decreased until around
Fig. 7 Surface growth rate and oxidation rate versus crank angle in whole
cylinder. The data recorded in this paper start at 8° to 120° CA ATDC.
TABLE III SOOT PARTICLE SIZE DISTRIBUTION IN THE WHOLE CYLINDER
CA Percentage of soot size distribution in nm (%) Soot
average size
(nm) <2 2-10 10-20 20-50 50-100 >100
8 0.00 0.33 24.74 69.29 5.25 0.39 25.8
30 1.34 9.93 50.88 18.16 5.36 14.32 38.5
60 3.47 16.85 48.68 13.59 5.83 11.58 33.7
90 5.47 17.56 48.76 12.51 5.40 10.31 30.9
120 6.72 17.63 47.54 12.72 6.14 9.25 29.8
Soot particle size distribution according to the size bin at selected crank
angle. The value showed in percentage of particle number at that instant CA.
TABLE IV
SOOT PARTICLE SIZE DISTRIBUTION IN THE SQUISH REGION
CA
Size (nm) (%) Average
Size (nm) <2 2-<10 10-<20 20-<50 50-<100 >100
8 0.00 0.00 4.61 93.00 0.85 1.54 25.2
30 2.27 18.18 54.34 22.31 1.03 1.86 18.5
60 8.81 20.04 50.22 19.60 0.88 0.44 15.5
90 7.32 22.62 50.11 19.07 0.44 0.44 15.1
120 7.33 23.33 49.56 18.89 0.44 0.44 14.9
Soot particle size distribution according to the size bin at selected crank angle. The value showed in percentage of particle number at that instant CA.
Fig. 8 Surface growth rate and oxidation rate versus crank angle in squish
region. The data recorded in this paper start at 8° to 120° CA ATDC.
Fig. 6 Soot particle size distribution inside the squish region in the engine cylinder at selected crank angle. The size range bin show at the bottom of the figure.
Smaller particle size in small circle with black color and the size increase with color get lighter to grey.

International Journal of Mechanical & Mechatronics Engineering IJMME-IJENS Vol:14 No:05 57
144105-2929-IJMME-IJENS © October 2014 IJENS I J E N S
1000 particle at 120° CA ATDC. For the squish region soot
particle number started at around 500 particle and dropped
significantly to 120 particles at 120° CA ATDC. Fig. 12
explains the soot particle average size in the squish region and
in the entire cylinder. At earlier combustion process in the
squish region, the soot oxidation rate increases rapidly after 8°
CA ATDC [4] to overcome the surface growth of soot. Soot
particle average size in the squish region slowly decreased
from 25 nm at 8 CA ATDC to 15 nm at exhaust valve
opening (EVO). Soot particle size in the whole cylinder
displayed a different result, where the soot particle average
size at inlet valve closing (IVC) was 25 nm and increase to 40
nm at 30° CA ATDC. Beyond that the soot average size starts
to decrease to 30 nm at EVO. The oxidation process started to
dominate the overall soot formation process at higher crank
angle, namely 30º CA ATDC, thus reduced the overall soot
intensity, size and particles.
IV. CONCLUSION
Soot particle distribution with different size bins in an
engine cylinder with a focus on soot in the squish regions has
been successfully predicted by post-processing CFD
simulation data using sets of Matlab routines. Surface growth
and soot oxidation were the only processes considered in the
present Investigation. The soot particle size in the squish
region decreased rapidly from the start of tracking calculation
to about 30° CA ATDC. After that the soot particle size
decreased slowly due to the slower rate of soot oxidation
process. The dominant soot size at the start was in the range of
20-50 nm and shifted to 2-10 nm at the end of the cycle. Soot
particles near the wall cylinder were observed to be in smaller
size range compare to other regions inside the engine cylinder.
The soot particles in the squish region have high possibilities
to be deposited onto the cylinder walls through one or various
transfer mechanisms.
ACKNOWLEDGMENT
The authors would like to express their gratitude to the
Ministry of Higher Education of Malaysia and National
University of Malaysia for supporting this research through
their research grants of GGPM-2011-055 and
FRGS/1/2013/TK01/UKM/02/2.
REFERENCES
[1] S. Mosbach, M. S. Celnik, A. Raj, M. Kraft, H. R. Zhang, S. Kubo, and
K. O. Kim, ―Towards a detailed soot model for internal combustion engines”, Combust. Flame, vol. 156, no. 6, pp. 1156–1165, Jan. 2009.
[2] B. Menkiel, ―Investigation of soot processes in an optical diesel engine,‖
Ph.D. dissertation, School of Eng. and Design, Brunel University, 2012. [3] W. M. F. Wan Mahmood, A. Larocca, P. J. Shayler, I. Pegg, and F.
Bonatesta, ―Predicted Paths of Soot Particles in the Cylinders of a Direct
Injection Diesel Engine,‖ SAE International, no. 2012-01-0148, Apr. 2012.
[4] Z. Han, A. Uludogan, G. Hampson, and R. Reitz, ―Mechanism of soot
Fig. 9 Soot particle size distribution at 8° CA ATDC. The distribution
exhibit Gaussian distribution.
Fig. 10 Soot particle size distribution at 120° CA ATDC. The distribution
exhibited bimodal distribution.
Fig. 11 Soot particle number in decimal against the crank angle. Soot
particle numbers reduce as the crank angle increase.
Fig. 12 Soot particle average size in nanometer against the crank angle.
Whole cylinder and squish region exhibited different behavior.

International Journal of Mechanical & Mechatronics Engineering IJMME-IJENS Vol:14 No:05 58
144105-2929-IJMME-IJENS © October 2014 IJENS I J E N S
and NOx emission reduction using multiple-injection in a diesel engine,‖
SAE Transactions, no. 960633, Feb. 1996. [5] T. V. Johnson, ―Diesel Emission Control in Review-The Last 12
Months,‖ SAE Int. J. Fuels Lubr., no. 2003-01-0039, pp. 68-81, Mar.
2003. [6] N. Englert, ―Fine particles and human health a review of
epidemiological studies,‖ Toxicol. Lett. vol. 149, pp. 235–42, 2004.
[7] B. Brunekreef, and S. T. Holgate, ―Air pollution and health,‖ Lancet, vol. 360, pp. 1233–1242, Oct. 2002.
[8] N. Künzli, R. Kaiser, S. Medina, M. Studnicka, O. Chanel, P. Filliger,
and H. Sommer, ―Public-health impact of outdoor and traffic-related air pollution: a European assessment,‖ Lancet, vol. 356, pp. 795–801, Sept.
2000.
[9] M. D. Thomas, Effects of Air Pollution on Plants, in Air Pollution World Health Organization Monograph Series No. 46, Columbia University
Press, New York, 1961, pp. 233-278.
[10] C. Rodriguez-Navarro, and E. Sebastian, ―Role of particulate matter from vehicle exhaust on porous building stones (limestone) sulfation,‖
Sci. Total Environ., vol. 187, pp. 79–91, Mar. 1996.
[11] S. Aldajah, O. O. Ajayi, G. R. Fenske, and I. L. Goldblatt, ―Effect of exhaust gas recirculation (EGR) contamination of diesel engine oil on
wear,‖ Wear, vol. 263, pp. 93–98, May 2007.
[12] S. George, S. Balla, and M. Gautam, ―Effect of diesel soot contaminated oil on engine wear,‖ Wear, vol. 262, pp. 1113–1122, 2007.
[13] S. George, S. Balla, V. Gautam, and M. Gautam, ―Effect of diesel soot
on lubricant oil viscosity,‖ Tribol. Int., vol. 40, pp. 809–818, 2007. [14] M. Gautam, K. Chitoor, M. Durbha, and J. C. Summers, ―Effect of
diesel soot contaminated oil on engine wear — investigation of novel oil formulations,‖ Tribology International, vol. 32, no. 12, pp. 687–699,
Oct. 1999.
[15] J. B. Heywood, Internal combustion engine fundamentals, McGraw-Hill, Michigan, 1988.
[16] K. Kannan, and M. Udayakumar, ―NOx and HC emission control using
water emulsified diesel in single cylinder diesel engine,‖ J. Eng. Appl.Sci., vol. 4, no. 8, pp. 59–62, Oct. 2009.
[17] W. Wei, and L. Na, ―Study on Exhaust Emission and its Control
Techniques in Diesel Engine,‖ 2011 Fourth International Conference on Intelligent Computation Technology and Automation, vol. 2, pp. 710–
713, 2011.
[18] T. Kawatani, K. Mori, I. Fukano, K. Sugawara, and T. Kayama,
―Technology for Meeting the 1994 USA Exhaust Emission Regulations
on Heavy-Duty Diesel Engine,‖ SAE Papers, no. 932654, Oct. 1993.
[19] M. Frenklach, ―Reaction mechanism of soot formation in flames,‖ Phys. Chem. Chem. Phys., vol. 4, pp. 2028-2037, Feb. 2002.
[20] E. Weingartner, H. Burtscher, and U. Baltenspergertx, ―Hygroscopic
properties of carbon and diesel soot particles,‖ Atmos. Environ., vol. 31, pp. 2311-2327, May 1997.
[21] A. Sarvi, J. Lyyränen, J. Jokiniemi, and R. Zevenhoven, ―Particulate
emissions from large-scale medium-speed diesel engines: 1. Particle size distribution,‖ Fuel Process Technol., vol. 92, pp. 1855–1861, May 2011.
[22] X. Cheng, L. Chen, F. Yan, and S. Dong, ―Study on soot formation
characteristics in the diesel combustion process based on an improved detailed soot model,‖ Energy Conversion and Management, vol. 75, pp.
1–10, May 2013.
[23] S. Schraml, C. Heimgatner, C. Fettes, and A. Leipertz, ―Investigation of In-Cylinder Soot Formation and Oxidation by Means of Two-
Dimensional Laser-Induced Incandescence (LII),‖ 10th International
Symposium on Application of Laser Techniques to Fluid Mechanics,
Lisbon, 2000.
[24] J. R. Needham, D. M. Doyle, S. A. Faulkner, and H. D. Freeman,
―Technology for 1994,‖ SAE paper, no. 891949, Sept. 1989. [25] R. Finesso, D. Misul, and E. Spessa, ―Development and validation of a
semi-empirical model for the estimation of particulate matter in diesel
engines,‖ Energy Conversion and Management, vol. 84, pp. 374–389, Apr. 2014.
[26] R. P. Hessel, D. E. Foster, R. R. Steeper, S, M, Aceves, and D. L.
Flowers, ―Pathline analysis of full-cycle four-stroke HCCI engine combustion using CFD and multi-zone modelling,‖ SAE Papers, no.
2008-01-0048, Apr. 2008.
[27] M. Bissoli, A. Cuoci, A. Frassoldati, T. Faravelli, E. Ranzi, T. Lucchini, G. D’Errico, and F. Contino, ―Detailed Kinetic Analysis of HCCI
Combustion Using a New Multi-Zone Model and CFD
Simulations,‖ SAE Int. J. Engines, vol. 6, pp. 1594-1609, Sept. 2013. [28] K. Puduppakkam, A. Modak, and C. Naik, ―Soot Particle Tracking with
FORTÉ CFD Using Method of Moments and a Detailed Soot Chemistry
Mechanism,‖ presented at the International Multidimensional Engine
Modeling User’s Group Meeting, Detroit, Michigan, Apr. 15, 2013. [29] Wan Mohd Faizal Wan Mahmood, ―Computational Studies of Soot
Paths to Cylinder Wall Layers of a Direct Injection Diesel Engine,‖
Ph.D. dissertation, Nottingham University, 2011. [30] K. M Pang, H. K. Ng, and S. Gan, ―Development of an integrated
reduced fuel oxidation and soot precursor formation mechanism for CFD
simulations of diesel combustion,‖ Fuel, vol. 90, no. 9, pp. 2902–2914, May 2011.
[31] K. M. Pang, H. K. Ng, and S. Gan, ―Simulation of temporal and spatial
soot evolution in an automotive diesel engine using the Moss–Brookes soot model,‖ Energy Conversion and Management, vol. 58, pp. 171–
184, Feb. 2012.
[32] V. Rao, and D. Honnery, ―Application of a multi-step soot model in a thermodynamic diesel engine model,‖ Fuel, vol. 135, pp. 269–278, July
2014.
[33] S. M. Tan, H. K. Ng, and S. Gan, ―CFD modelling of soot entrainment via thermophoretic deposition and crevice flow in a diesel engine,‖
Journal of Aerosol Science, vol. 66, pp. 83–95, Aug. 2013.
[34] S. M. Tan, H. K. Ng, and S. Gan, ―Computational study of crevice soot entrainment in a diesel engine,‖ Applied Energy, vol. 102, pp. 898–907,
Nov. 2013.
[35] D.C. Amsden, and A.A. Amsden, ―The KIVA Story: A Paradigm of Technology Transfer,‖ IEEE Transactions on Professional
Communication, vol. 36, no. 4, pp. 190-195. Dec. 1993.
[36] S. Hong, M.S. Wooldridge, H.G. Im, D.N. Assanis, and H. Pitsch, ―Development and Application of a Comprehensive Soot Model for 3D
Reacting Flow Studies in a Diesel Engine,‖ Combustion and Flame, vol. 143, pp. 11-26, Apr. 2005