Embed Size (px)
Citation preview

Research Collection
Doctoral Thesis
Optics at high pressures in charge-density-wave systems
Author(s): Lavagnini, Michela
Publication Date: 2009
Permanent Link: https://doi.org/10.3929/ethz-a-005824963
Rights / License: In Copyright - Non-Commercial Use Permitted
This page was generated automatically upon download from the ETH Zurich Research Collection. For moreinformation please consult the Terms of use.
ETH Library
Diss. ETH No. 18267
Optics at high pressures inCharge-Density-Wave systems
A dissertation submitted to theSWISS FEDERAL INSTITUTE OF TECHNOLOGY
ZURICH
for the degree ofDOCTOR OF SCIENCES
presented by
MICHELA LAVAGNINIDipl. Phys. La Sapienza-Roma
born on the 8th of December, 1978Frascati (Roma) - Italy
accepted on the recommendation of
Prof. Dr. L. Degiorgi, examinerProf. Dr. B. Batlogg, co-examiner
Prof. Dr. T. Giamarchi, co-examiner
2009


A Mamma, Papi e a mio f ratello Marco

Contents
Glossary v
Abstract vii
Riassunto ix
Introduction 1
1 Theory 51.1 The Charge Density Wave instability . . . . . . . . . . . . . . . . . . . . 5
1.1.1 The response function of a Fermi gas . . . . . . . . . . . . . . . 61.1.2 The Kohn anomaly and the Peierls transition . . . . . . . . . . . 91.1.3 The mean eld theory . . . . . . . . . . . . . . . . . . . . . . . 131.1.4 The electrodynamic response of the CDW system . . . . . . . . . 15
1.2 The physics in low dimension: from Fermi to Tomonaga-Luttinger Liquid 211.2.1 Fermi Liquids . . . . . . . . . . . . . . . . . . . . . . . . . . . . 211.2.2 Tomonaga-Luttinger Liquids . . . . . . . . . . . . . . . . . . . . 23
2 Experimental techniques 312.1 Introduction . . . . . . . . . . . . . . . . . . . . . . . . . . . . . . . . . 312.2 Optical functions and Reectivity . . . . . . . . . . . . . . . . . . . . . 33
2.2.1 Kramers-Kronig dispersion relations . . . . . . . . . . . . . . . . 352.3 Raman scattering . . . . . . . . . . . . . . . . . . . . . . . . . . . . . . 37
2.3.1 The Raman tensor . . . . . . . . . . . . . . . . . . . . . . . . . 402.4 High pressure technique . . . . . . . . . . . . . . . . . . . . . . . . . . 41
2.4.1 The Diamond Anvil Cell . . . . . . . . . . . . . . . . . . . . . . 41
i
ii Contents
2.4.2 Ruby uorescence for pressure determination . . . . . . . . . . . 462.5 Experimental setup . . . . . . . . . . . . . . . . . . . . . . . . . . . . . 48
2.5.1 Reectivity measurements at ambient pressure . . . . . . . . . . 482.5.2 High Pressure Infrared setup at ELETTRA . . . . . . . . . . . . 522.5.3 Raman measurements at ambient pressure . . . . . . . . . . . . . 572.5.4 High pressure Raman setup . . . . . . . . . . . . . . . . . . . . 60
2.6 Procedure for the analysis of the Reectivity spectra . . . . . . . . . . . . 622.6.1 The Lorenz-Drude model . . . . . . . . . . . . . . . . . . . . . . 622.6.2 Kramers-Kronig transformation and extrapolation of the Reec-
tivity data . . . . . . . . . . . . . . . . . . . . . . . . . . . . . . 64
3 Materials 693.1 Sample preparation . . . . . . . . . . . . . . . . . . . . . . . . . . . . . 693.2 Crystal structure . . . . . . . . . . . . . . . . . . . . . . . . . . . . . . . 70
3.2.1 Role of the rare-earth ion . . . . . . . . . . . . . . . . . . . . . . 713.3 Electronic structure . . . . . . . . . . . . . . . . . . . . . . . . . . . . . 72
3.3.1 Tight-binding model . . . . . . . . . . . . . . . . . . . . . . . . 723.3.2 LMTO band structure . . . . . . . . . . . . . . . . . . . . . . . 75
3.4 Experimental evidences for the CDW state in RETen . . . . . . . . . . . 783.4.1 ARPES . . . . . . . . . . . . . . . . . . . . . . . . . . . . . . . 783.4.2 Resistivity . . . . . . . . . . . . . . . . . . . . . . . . . . . . . 813.4.3 X-ray diffraction . . . . . . . . . . . . . . . . . . . . . . . . . . 83
4 Results and Discussion 854.1 Optical spectroscopy on RETen (n=2,3) . . . . . . . . . . . . . . . . . . 86
4.1.1 RETe3 at ambient pressure . . . . . . . . . . . . . . . . . . . . . 864.1.2 CeTe3 under applied pressure . . . . . . . . . . . . . . . . . . . 904.1.3 LaTe2 and CeTe2 at ambient pressure . . . . . . . . . . . . . . . 954.1.4 IR spectra of LaTe2 under applied pressure . . . . . . . . . . . . 974.1.5 The optical estimation of the CDW gap . . . . . . . . . . . . . . 984.1.6 The optical estimation of the fraction of the ungapped FS . . . . . 1014.1.7 Power-law behavior of σ1(ω) above the CDW gap . . . . . . . . 104
4.2 Raman spectroscopy on RETe3 . . . . . . . . . . . . . . . . . . . . . . . 1114.2.1 RETe3 at ambient pressure and under applied pressure . . . . . . 1114.2.2 Calculated Raman-active modes and lattice displacements . . . . 116
Contents iii
4.2.3 Evidence for coupling between phonons and CDW condensate . . 120
Conclusions and outlook 123
A Murnaghan equation 127
B Effect of the high frequency extrapolation of R(ω) 129
C Summary of the Lorentz-Drude analysis 131
D Raman active phonon modes in RETe3 135
Bibliography 137
Acknowledgement 143
Curriculum vitae 145
List of Publications 147


Glossary
1D One-dimensional2D Two-dimensional3D Three-dimensionalARPES Angle-resolved photoemission spectroscopyBCS Bardeen-Cooper-SchriefferCDW Charge Density WaveDAC Diamond Anvil CellDOS Density of statesFIR Far InfraredFL Fermi liquidFS Fermi surfaceFT Fourier transformIR InfraredKK Kramers-KronigLD Lorentz-DrudeM-H Mott-HubbardMIR Mid infraredNIR Near infraredMCT Mercury Cadium Telluride DetectorsRE Rare-earthSP Single particleTLL Tomonaga-Luttinger LiquidUV UltravioletVIS Visible
v

Abstract
Low-dimensionality in strongly correlated systems is one of the primary topic of inves-tigation in the ongoing solid state physics research. Prototype low-dimensional systemsgenerally provide the playground for thoroughly studying a large variety of phenomena,like broken symmetry ground states and novel quantum states. In this respect, the two-dimensional (2D) layered rare-earth (RE) tellurides were recently revisited as examples ofweakly coupled electronically-driven charge-density-wave (CDW) systems whose prop-erties can be tuned by chemical and applied pressure. RETen (n=2,3) exhibit an unidirec-tional incommensurate CDW already existing at room temperature, partially gapping theFermi surface (FS) and coexisting with a metallic state due to the remaining ungappedfree charge carriers.
Optical methods are well-suited experimental tools in order to shed light on the in-trinsic physical properties of the CDW broken symmetry ground state. In the presentthesis both the electronic excitations and the lattice dynamics of these CDW systems areinvestigated with Infrared and Raman-scattering experiments. These optical studies areperformed, at room temperature, as a function of the lattice compression achieved by ex-ternally applied pressure.
We collected optical data at ambient pressure in a very broad spectral range (fromthe far infrared up to the ultraviolet) on RETe2 and infrared spectra at high pressures onLaTe2, CeTe3 and NdTe3. We extract the energy scale of the single particle excitationacross the CDW gap, as well as the residual metallic spectral weight within the Drudecomponent. We nd that the CDW collective state gaps a large portion of the FS. TheCDW gap decreases upon compressing the lattice, so that a release of additional chargecarriers occurs, inducing a shift of weight from the gap feature into the metallic com-ponent of the optical response. This signals a reduction in the quality of nesting upon
vii
viii Abstract
compressing the lattice, therefore indicating a lesser impact of the CDW condensate onthe electronic properties of the RE telluride systems. At frequencies above the CDWgap we also identify a power-law behavior of the optical conductivity σ1(ω) suggestiveof a Tomonaga-Luttinger liquid scenario at high-energy scales. This emphasizes a non-negligible contribution of 1D correlation effects in the physics of these 2D compounds.The lattice compression induces a decrease of the exponent of the power-law in RETe3
so that a crossover from a weakly interacting to a non-interacting electron gas systemis envisaged. This seems, however, to be of less relevance in the single layered RE di-tellurides.
Additionally we report Raman-scattering investigations on the RETe3 series at am-bient pressure as well as on LaTe3, CeTe3 and NdTe3 as a function of applied pressure.The observed phonon peaks are ascribed to the Raman-active modes for both the undis-torted and the distorted lattice in the CDW state by means of a rst-principles calculation.The latter also predicts the Kohn anomaly in the phonon dispersion, driving the CDWtransition. The integrated intensity of the two most prominent modes scales as a charac-teristic power of the CDW-gap amplitude upon compressing the lattice, which providesclear evidence for the tight coupling between the CDW condensate and the vibrationalmodes.
Riassunto
La bassa dimensionalitá in sistemi a forte correlazione elettronica é uno dei principali temidi indagine nella ricerca attuale di sica dello stato solido. I prototipi di sistemi a bassadimensionalitá forniscono in genere un ottimo mezzo per studiare a fondo una grandevarietá di fenomeni, come sistemi a rottura spontanea di simmetria e nuovi stati quan-tistici. A questo proposito, i telluridi di terre rare (RE), composti bi-dimensionali (2D)con una struttura a strati, sono stati recentemente riconsiderati in quanto rappresentano unesempio di sistema debolmente correlato in cui la formazione di onde di densitá di carica(CDW) é indotta da una instabilitá elettronica e le cui proprietá possono essere modi-cate attraverso la pressione chimica e la pressione esterna (meccanica). RETen (n=2,3)mostrano la presenza di una CDW incommensurabile e unidirezionale giá a temperaturaambiente, che apre una gap parziale nella supercie di Fermi e coesiste con uno statometallico dovuto ai portatori liberi di carica residui.
La spettroscopia ottica é una tecnica sperimentale particolarmente adatta a far lucesulle proprietá siche intrinseche dei sistemi a rottura spontanea di simmetria come iCDW. Nel presente lavoro di tesi lo spettro di eccitazione elettronico e la dinamica retico-lare di questi sistemi CDW vengono indagati con esperimenti di infrarosso e di scatteringRaman. Questi studi ottici vengono realizzati, a temperatura ambiente, in funzione dellacompressione reticolare ottenuta con l'applicazione della pressione esterna.
I dati ottici sono stati raccolti a pressione ambiente in un ampio intervallo spettrale(dal lontano infrarosso all'ultravioletto) su RETe2 e nell'infrarosso ad alta pressione suLaTe2, CeTe3 and NdTe3. É stata estratta l'energia che corrisponde all'eccitazione di sin-gola particella attraverso la gap CDW, e il peso spettrale metallico residuo che é contenutonella componente di Drude. É stato osservato che lo stato collettivo CDW apre una gapin una grande porzione della supercie di Fermi. Comprimendo il reticolo la gap CDW
ix
x Riassunto
decresce mentre il numero dei portatori di carica aumenta, e questo comporta uno sposta-mento di peso spettrale dalla gap alla componente metallica della risposta ottica. Questorisultato segnala una riduzione della qualitá del nesting della supercie di Fermi in seguitoalla compressione reticolare che indica quindi un impatto minore del condensato CDWsulle proprietá elettroniche del sistema terra rara tellurio. A frequenze piú alte rispettoalla gap CDW abbiamo identicato un andamento a legge di potenza della conducibilitáottica σ1(ω) indicativo di un comportamento tipico di un liquido di Tomonaga-Luttingera grandi scale di energia. Questo evidenzia la presenza di un contributo non trascurabiledegli effetti di correlazione 1D nella sica di questi composti 2D. La compressione reti-colare induce una diminuzione dell'esponente della potenza nei RETe3 in modo da poterimmaginare un passaggio da un sistema di elettroni a debole interazione ad uno non in-teragente. Questo sembra, tuttavia, essere meno rilevante nei ditelluridi.
Riportiamo inoltre indagini con la spettroscopia Raman su RETe3 a pressione am-biente e su LaTe3, CeTe3 e NdTe3 in funzione della pressione applicata. I picchi fonon-ici osservati vengono assegnati a modi Raman attivi sia nella struttura non-distorta chein quella distorta dello stato CDW, attraverso calcoli da principi primi. Questi ultimipredicono inoltre l'anomalia di Kohn nella dispersione fononica che induce la transizioneCDW. L'intensitá integrata dei due modi principali decresce in funzione della compres-sione reticolare con una caratteristica legge di potenza rispetto all'ampiezza della gapCDW, il che fornisce una chiara evidenza di un forte accoppiamento tra il condensatoCDW e i modi vibrazionali.
Introduction
The physical properties of low-dimensional systems have fascinated researchers for agreat part of the last century, and have recently become one of the primary topic of in-vestigation in condensed matter research. This is even more true since the discoveryof superconductivity at high temperature in the two-dimensional (2D) layered copper-oxide materials (HTC) [1], which specially induced a revival of interest for issues onlow-dimensional interacting electron gases. In a strictly one-dimensional (1D) interactingelectron system, the Fermi-liquid (FL) state is indeed replaced by a state where inter-actions play a crucial role, and which is generally referred to as a Tomonaga-Luttingerliquid (TLL) [2, 3]. According to the predictions of the TLL theoretical framework, the1D state is characterized by features such as spin-charge separation and the breakdown ofthe quasi-particle concept. The non-FL nature of the TLL is also manifested by the non-universal power-law decay of the various correlation functions. The exponent of suchpower-laws reects the nature and strength of the electronic interaction. It is important toemphasize that the TLL, which in principle describes so-called gapless 1D fermion sys-tems, may be unstable towards the formation of a spin and charge gap [4].
The rst experimental evidence for a TLL state in real low-dimensional materialswas achieved in the quasi-1D linear-chain organic Bechgaard salts through optical inves-tigations [5]. These systems were intensively investigated because they offer the uniquepossibility to tune the effective dimensionality of the electron gas by lattice compres-sion. Upon chemical or applied pressure, the Bechgaard salts display a dimensionality-driven crossover from a 1D Mott-insulator to an incipient 2D Fermi-liquid. Besides op-tics, dc-transport as well as angle-resolved-photoemission-spectroscopy (ARPES) resultssupplied so far the most compelling signature for the realization of the TLL in these 1Dsystems, revealing the predicted power-law behaviors [6, 7]. It was nevertheless pointed
1
2 Introduction
out that the TLL theory can be only applied for a truly 1D scenario but caution shouldbe placed in addressing situations approaching a 2D limit since a rigorous theoretical ap-proach, accounting for the dimensionality crossover, is still missing. On the other hand,the FL theory is usually valid in higher than one dimension but seems to break down inseveral notable exceptions, like in several correlated metals and in the HTSC as clearlyshown with optical results [8]. This leads to the question, to which extent the effectivedimensionality of the interacting electron gas affects the electronic properties in thosemetals.
Besides the breakdown of the conventional FL scenario and the development ofnovel quantum state as sketched above, low-dimensional systems are also unstable to-wards electronic instabilities, driving them through peculiar phase transitions into bro-ken symmetry ground states, like spin- and charge-density-wave (SDW and CDW). Theformation of the collective CDW (SDW) state is a typical consequence of the electron-phonon (electron-electron) interaction in a system displaying good nesting properties ofthe FS. The CDW state, rst predicted by the pioneering work of Peierls [9], and the SDWstate, put forward by Overhauser [10], have been observed by now in a large wealth ofreal materials. Mainly depending from the degree of the FS nesting, such broken sym-metry ground states can be seen in any dimensions [11]. Obviously the most favorableconditions, leading to the largest effects and most astonishing evidence of the CDW state,are achieved in quasi-one dimensional systems. Nonetheless, CDWs have been observedin transition-metal dichalcogenides and trichalcogenides [12], in the ladder compoundsSr14−xCaxCu24O41 [13], and in some HTSC [14] (where they are known as "stripes") aswell, suggesting that similar effects are to be expected also in layered quasi-2D systems.A recent theoretical study [15] conrms that this is indeed the case, and that two orthog-onal CDWs may even combine to generate a checkerboardlike charge pattern.
As for the normal state properties, the interplay between effective dimensionalityand strength of the electronic correlations as well as the role played by the coupling be-tween the electron gas and the lattice dynamics are decisive in order to fully understandthe onset of these broken symmetry ground states. Shedding light on these issues is ofparamount importance for the controlled design of novel materials. There is then thequest for alternative low-dimensional systems, allowing a broader and more general per-spective on these issues and which can be viewed as model materials, supplying an idealplayground in condensed matter in order to test novel concepts for the physics in low di-mensions.
Introduction 3
The 2D layered rare-earth (RE) tri-telluride and the related di-telluride compounds arewell suited to that purpose and fulll a variety of prerequisites. Their average crystalstructure is weakly orthorhombic, consisting of layers of square-planar Te sheets (singlelayer for RETe2 and double layer for RETe3), separated by insulating corrugated RETeslabs, which act as charge reservoirs for the Te planes. They exhibit an unidirectionalincommensurate CDW, residing within the Te planes and stable across the rare-earth se-ries [16]. The transition temperature TCDW is well above room temperature and decreasesby compressing the lattice [17]. Band structure calculations [16, 18] reveal that the elec-tronic bands at the Fermi level derive from the Te px and py in-plane orbitals, leading toa very simple FS. The parallel hopping t‖, along the extended direction of the p-orbital,is much larger than the transverse hopping t⊥. Therefore, the system can be thought asan array of weakly interacting chains along the parallel direction crossed by an equiva-lent array along the perpendicular one. Such conguration determines a hidden quasi-1Delectronic character in these quasi-2D systems. Large part of the open quasi-1D FS isnested by a single wave vector in the base plane of the reciprocal lattice [19]. This nestingappears to be the driving mechanism for the CDW instability [20]. Owing to the 2D char-acter of these compounds, the gap is not isotropic and shows a wave-vector dependence.In particular, since the CDW modulation wave-vector does not nest the whole FS, thereare parts of it which are not gapped. Therefore, the CDW state coexists with the metallicphase due to the free charge carriers at the ungapped FS regions.
This work presents a comprehensive optical and Raman study on these low dimensionalCDW systems. Optical spectroscopic methods are an ideal tool in order to investigateCDW systems, since it generally reveals all features characterizing the excitation spec-trum of both normal and broken symmetry ground state. Infrared spectroscopy is ableto detect the opening of the CDW gap in the charge excitation spectrum and the pres-ence of the residual metallic contribution due to the imperfect FS nesting of the quasi-2Drare-earth tellurides. Furthermore, a careful analysis of the electronic excitation spectrumallows to study the impact of the direct interaction between electrons. For instance, apossible signature of the TLL state would result in a characteristic power-law behavior,governing the shape of the optical conductivity σ1(ω) above the CDW gap. Raman spec-troscopy is very suitable to address the issue of the coupling between the lattice dynamicsand CDW condensate. This spectroscopy is particularly of relevance in the materials ad-dressed here, where the presence of the remaining metallic contribution prevents to detect
4 Introduction
the vibrational modes in the infrared-absorption experiment as the corresponding signalsare overwhelmed by the metallic Drude term.
From a broader prospective, it is extremely useful and interesting when studying theCDW systems to investigate the evolution of both electronic excitation and lattice dynam-ics as a function of the in-plane lattice parameter. Such investigations can be in principlerealized by chemical substitution or by externally applied pressure. The application ofpressure is indeed a direct way to study the impact of the lattice compression, since thechanges in the electrodynamic and Raman response can be monitored while the CDWstate is continuously suppressed by tuning the interchain coupling and thus altering theFS nesting conditions.
We thus collected optical data at ambient pressure in a very broad spectral range onRETe2 and infrared spectra at high pressure on selected members of the RETe2 and RETe3
series (LaTe2, CeTe3 and NdTe3). The analysis of our optical data allows to address boththe gapping of the FS, as well as the high-frequencies decay of σ1(ω) above the CDWgap. Additionally we report Raman-scattering investigations on the RETe3 series at am-bient pressure as well as on LaTe3, CeTe3 and NdTe3 as a function of applied pressure.Our data, supported by rst-principles calculations, allow us to identify the Raman-activemodes for both the undistorted and the distorted CDW phase. Moreover, we will provideevidence for the tight coupling between the CDW condensate and the vibrational modes.
This Thesis is organized as follows: in the rst chapter, a theoretical introduction on thePeierls transition and on the resulting CDW ground state will be complemented by a briefoverview of the main concepts of the physics of a 1D interacting electron gas. The secondchapter is dedicated to the description of the employed optical and Raman experimentaltechniques and the adopted methods for analyzing the data. A brief summary of the mostrelevant physical properties of the investigated systems, RETen (n=2,3), will be presentedin chapter three. We then display and discuss the results of our investigations on rare-earthdi- and tri-tellurides in chapter four. Finally, a short summary of our major ndings and afew future perspectives will conclude this thesis.
1 Theory
1.1 The Charge Density Wave instability
It was rst pointed out by Peierls (1955) that a one-dimensional (1D) metal coupled to theunderlying lattice is not stable at low temperatures [9]. The ground state of the coupledelectron-phonon system is characterized by a gap in the excitation spectrum and by a col-lective mode formed by electron-hole pairs involving the wave vector q = 2kF , kF beingthe Fermi wavevector. The new broken-symmetry ground state results from the selfcon-sistent rearrangement of the electronic charge density in response to the static modulationof the ionic position. The lattice distortion is induced by the softening of a phonon ofwavelength λ = π/kF [21].
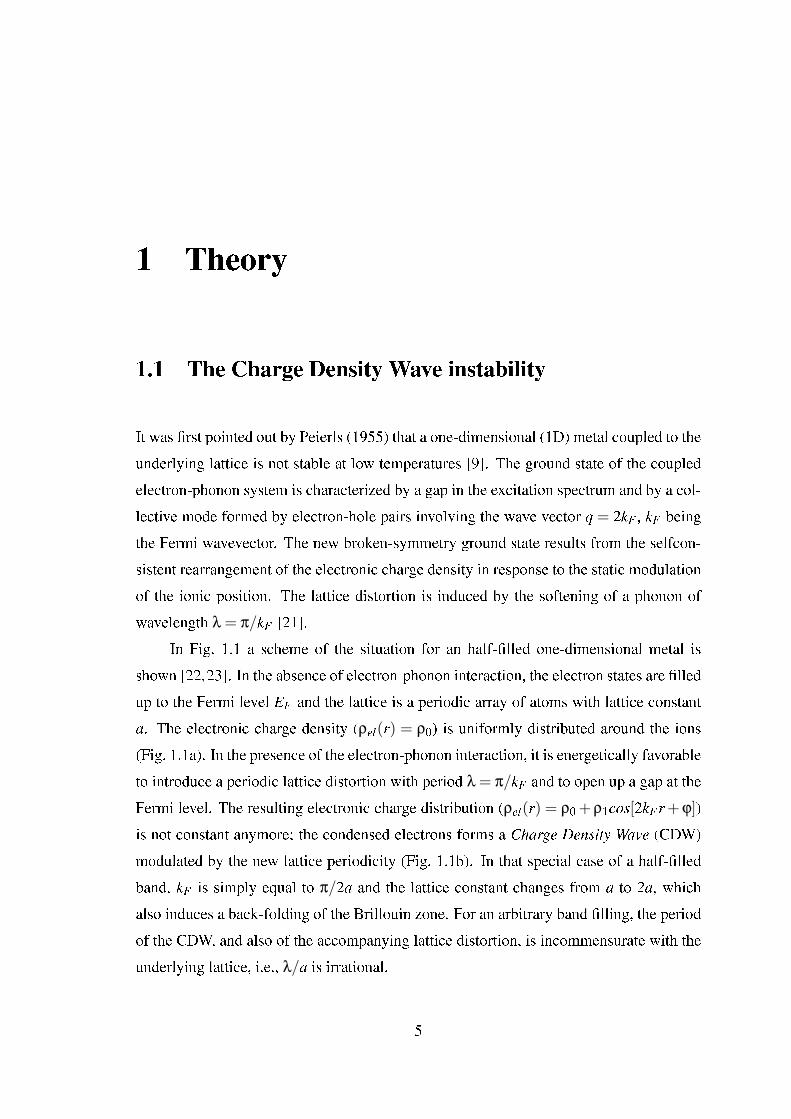
In Fig. 1.1 a scheme of the situation for an half-lled one-dimensional metal isshown [22,23]. In the absence of electron-phonon interaction, the electron states are lledup to the Fermi level EF and the lattice is a periodic array of atoms with lattice constanta. The electronic charge density (ρel(r) = ρ0) is uniformly distributed around the ions(Fig. 1.1a). In the presence of the electron-phonon interaction, it is energetically favorableto introduce a periodic lattice distortion with period λ = π/kF and to open up a gap at theFermi level. The resulting electronic charge distribution (ρel(r) = ρ0 + ρ1cos[2kFr + ϕ])is not constant anymore; the condensed electrons forms a Charge Density Wave (CDW)modulated by the new lattice periodicity (Fig. 1.1b). In that special case of a half-lledband, kF is simply equal to π/2a and the lattice constant changes from a to 2a, whichalso induces a back-folding of the Brillouin zone. For an arbitrary band lling, the periodof the CDW, and also of the accompanying lattice distortion, is incommensurate with theunderlying lattice, i.e., λ/a is irrational.
5
6 1. Theory
Figure 1.1: Peierls distortion in a 1D metal with a half-lled band: (a) normal state; (b)CDW state (see text) [23].
1.1.1 The response function of a Fermi gas
The particular topology of the Fermi surface (FS) in one dimensional systems leads to aresponse to an external perturbation which is dramatically different from that obtained inhigher dimensions [22]. The response of an electron gas to a time independent potentialφ
φ(r) =Z
φ(q)eiqrdq (1.1)
1.1 The Charge Density Wave instability 7
is usually treated within the framework of the linear response theory. The rearrangementof the charge density, expressed in terms of an induced charge
ρind(r) =Z
ρind(q)eiqrdq, (1.2)
is related to φ in the Fourier space through
ρind(q) = χ(q)φ(q). (1.3)
χ(q) is the so-called Lindhard response function, which is given in d-dimension by:
χ(q) =Z ddk
(2π)d ·fk− fk+qεk− εk+q
(1.4)
with fk = f (εk) being the Fermi function. The situation is interesting for a strictly 1Delectron gas. For wavevector near 2kF , χ(q) can be evaluated by assuming a linear dis-persion relation around the Fermi energy EF :
εk−EF = (hvF)(k− kF). (1.5)
Thus, the integral in equation 1.4 becomes:
χ(q) =−e2n(EF)ln∣∣∣∣q+2kFq−2kF
∣∣∣∣ (1.6)
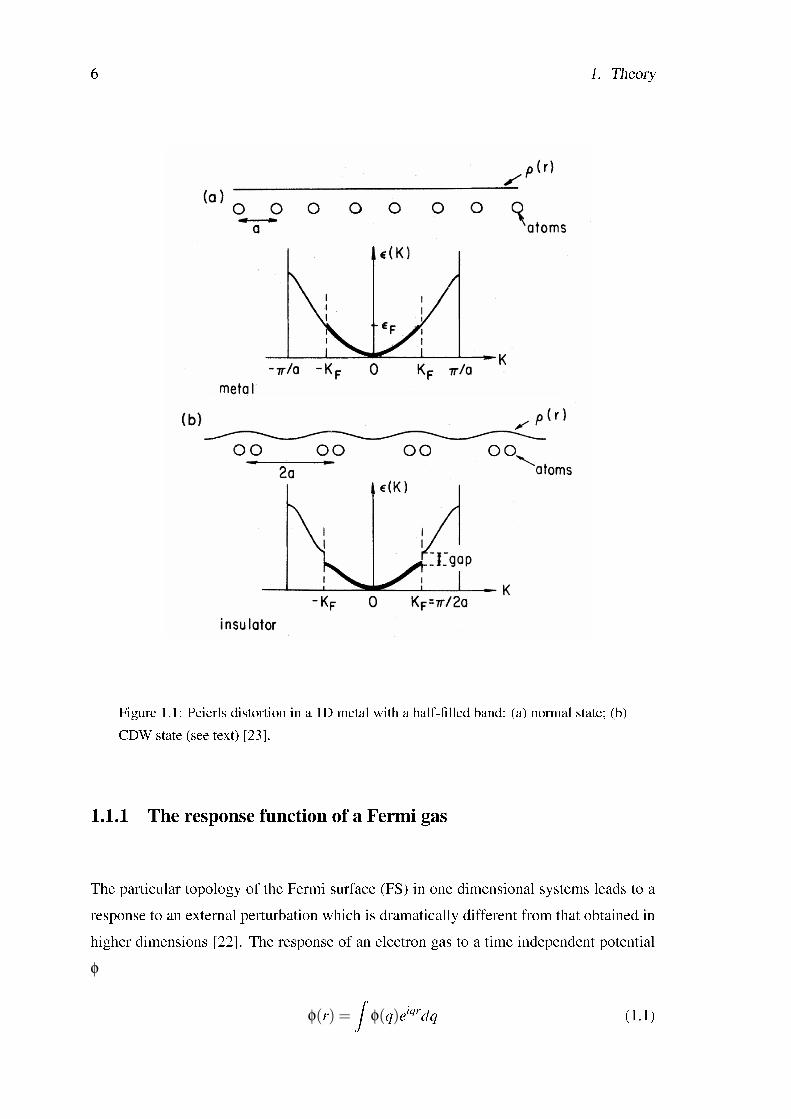
where n(EF) is the density of state at the Fermi level. For q = 2kF , χ(q) shows a singu-larity. In Fig. 1.2 the response function χ(q) for a 1D metal evaluated for all q values isshown together with that for the two-dimensional (2D) and three-dimensional (3D) elec-tron gas. While in the 1D case at q = 2kF the response function diverges, in 2D it presentsa discontinuity in the rst derivative and in 3D it is continuous even in the rst deriva-tive. The Lindhard function dramatically depends on the dimensionality of the system.This is the consequence of changing the topology of the Fermi surface (FS) when thedimensionality is reduced.
8 1. Theory
Figure 1.2: Wavevector dependence of the Lindhard response function χ(q) for a onedimensional (1D), two-dimensional (2D) and three dimensional (3D) free electron gasat zero temperature [22].
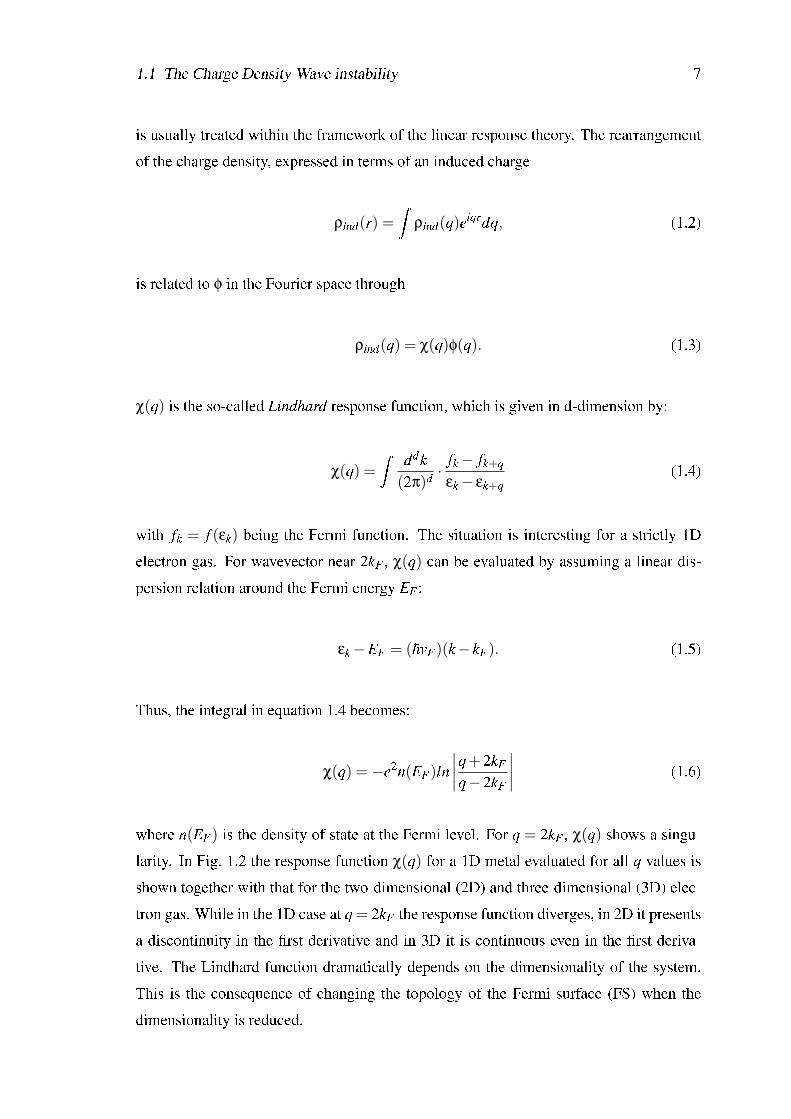
Figure 1.3: Fermi surface topology for 1D and 2D free electron gas (left). Warping ofthe Fermi surface in the case of quasi-1D gas (right). The arrows indicate pairs of states,one full and one empty, differing by the wavevector q = 2kF [22].
1.1 The Charge Density Wave instability 9
While the FS of a free electron gas is a sphere in the 3D case, it becomes a circle in 2Dand in the 1D limit it consists only of two points at +kF and −kF (Fig. 1.3). This impliesthat in the 1D case the entire Fermi surface can be connected with one single wavevectorq = 2kF . Such condition is usually referred as "perfect nesting". Looking at equation 1.4,the most signicant contribution to the integral comes from pairs of states (one full, oneempty) which differ by q = 2kF and have the same energy, thus giving a divergent contri-bution to χ(q). However in higher dimensions the number of such states (i.e. the nestingcondition) is signicantly reduced, as shown in Fig. 1.3, leading to the removal of thesingularity at q = 2kF .
At nite temperatures the singularity is removed and the equation 1.4 becomes(x = εk/2kBT )
χ(q = 2kF ,T ) =−e2n(EF)Z ε0/2kBT
0
tanhxx dx (1.7)
where ε0 is an arbitrary cutoff energy and kB is the Boltzmann constant. By calculatingthe integrals one nds
χ(q = 2kF ,T ) =−e2n(EF)ln1.14ε0kBT . (1.8)
χ(2kF) has indeed a logarithmic divergence as T → 0.
1.1.2 The Kohn anomaly and the Peierls transition
In the previous section (1.1.1) we have described the response function of a low dimen-sional electron gas to an external perturbation. As next step we consider the origin of suchperturbation leading to the 2kF anomaly. Let us consider a 1D free electron gas coupled tothe underlying chain of ions through electron-phonon coupling. That system is describedby the Fröhlich Hamiltonian, given by [22]
H = ∑k
εkakak +∑
qhωq(b
qbq +1/2)+∑kq
gq(b−q +bq)a
k+qak. (1.9)
The rst term represents the Hamiltonian of the electron gas where ak and ak are the
creation and annihilation operators for the electronic state with energy εk = (hk)2/2m.
10 1. Theory
The second term describes the lattice vibrations with bq and bq being the creation and
annihilation operators for phonons of wavevector q and normal mode frequency ωq. Thethird terms is that related to the electron-phonon interaction with gq being the electron-phonon coupling constant dened as:
gq = i(
h2Mωq
)1/2|q|Vq (1.10)
where M is the ionic mass and Vq is the Fourier transform of the potential V (r) of asingle atom. The effect of the electron-phonon interaction on the lattice vibrations canbe described by establishing the equation of motion of the normal coordinates. For smallamplitude displacements
h2Qq =−[[Qq,H],H] (1.11)
where we have made use of the normal coordinate expression
Qq =(
h2Mωq
)1/2(bq +b
−q). (1.12)
Inserting the Hamiltonian (eq. 1.9) and utilizing the commutation relations [Qq,Pq′ ] =
ihδq,q′ , equation 1.11 becomes
Qq =−ω2qQq−g
(2ωqMh
)1/2ρq (1.13)
where we assume g independent of q, and ρq = ∑k ak+qak being the q-th component of the
electron density. The second term on the right hand side of equation 1.13 is an effectiveforce associated with the lattice dynamics and arises as a consequence of electron-phononinteractions. The term g(2Mωq
h )Qq can be identied with an applied potential φq whichgives, through equation 1.3, a density uctuation
ρq = χ(q,T )g(2Mωq
h
)Qq (1.14)
where χ(q,T ) is the Lindhard response function. With this mean-eld approximation the
1.1 The Charge Density Wave instability 11
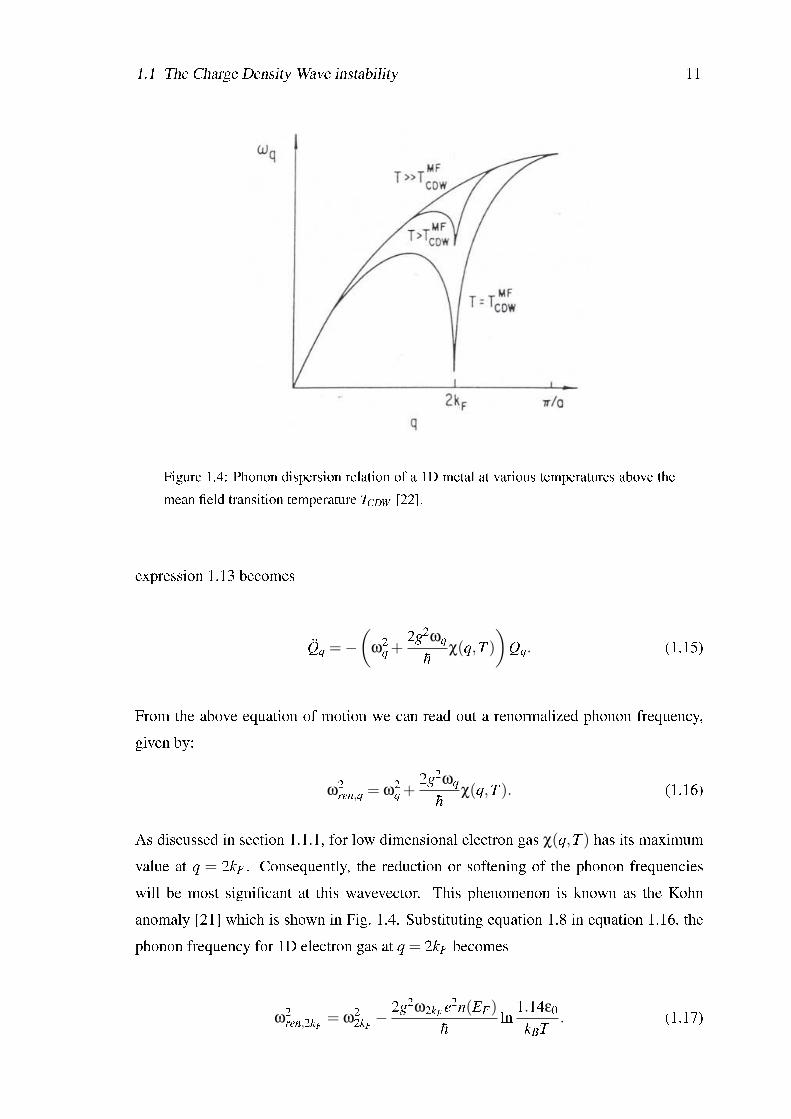
Figure 1.4: Phonon dispersion relation of a 1D metal at various temperatures above themean eld transition temperature TCDW [22].
expression 1.13 becomes
Qq =−(
ω2q +
2g2ωqh χ(q,T )
)Qq. (1.15)
From the above equation of motion we can read out a renormalized phonon frequency,given by:
ω2ren,q = ω2
q +2g2ωq
h χ(q,T ). (1.16)
As discussed in section 1.1.1, for low dimensional electron gas χ(q,T ) has its maximumvalue at q = 2kF . Consequently, the reduction or softening of the phonon frequencieswill be most signicant at this wavevector. This phenomenon is known as the Kohnanomaly [21] which is shown in Fig. 1.4. Substituting equation 1.8 in equation 1.16, thephonon frequency for 1D electron gas at q = 2kF becomes
ω2ren,2kF = ω2
2kF −2g2ω2kF e2n(EF)
h ln 1.14ε0kBT . (1.17)
12 1. Theory
With decreasing temperature, the renormalized phonon frequency goes to zero and this de-nes the transition temperature T MF
CDW , exactly when a frozen-in distortion occurs (Fig. 1.4).The resulting mean eld temperature is given by:
kBT MFCDW = 1.14ε0e−1/λ (1.18)
where λ is the dimensionless electron-phonon coupling constant
λ =2g2e2n(EF)
hω2kF. (1.19)
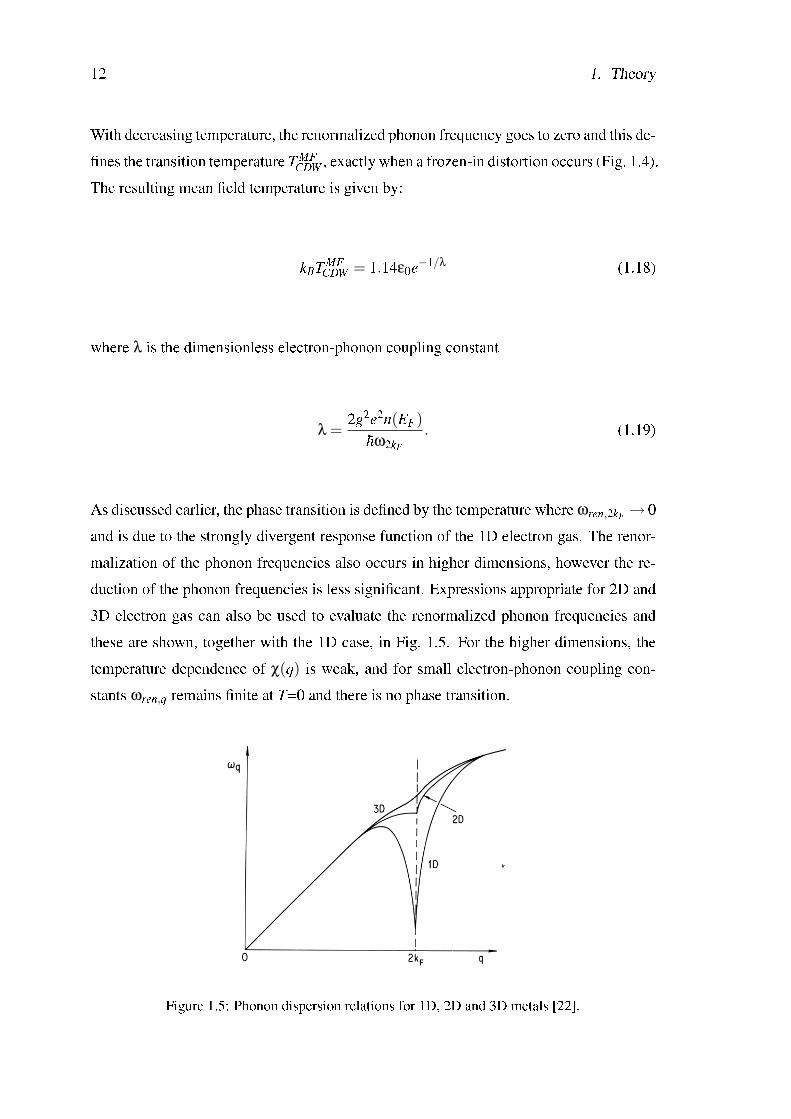
As discussed earlier, the phase transition is dened by the temperature where ωren,2kF → 0and is due to the strongly divergent response function of the 1D electron gas. The renor-malization of the phonon frequencies also occurs in higher dimensions, however the re-duction of the phonon frequencies is less signicant. Expressions appropriate for 2D and3D electron gas can also be used to evaluate the renormalized phonon frequencies andthese are shown, together with the 1D case, in Fig. 1.5. For the higher dimensions, thetemperature dependence of χ(q) is weak, and for small electron-phonon coupling con-stants ωren,q remains nite at T=0 and there is no phase transition.
Figure 1.5: Phonon dispersion relations for 1D, 2D and 3D metals [22].
1.1 The Charge Density Wave instability 13
1.1.3 The mean eld theory
The Peierls transition also has a remarkable inuence on the energy spectrum of the elec-trons. A periodic potential with a wavevector q = 2kF creates a band gap at kF in theconduction band as a consequence of the CDW formation. At T=0 electrons occupy allstates below the gap ∆. The decrease of electron energy near the gap will result in thedecrease in the total energy of electrons in the bands. The perturbed electronic energy Ek
correspond to:
Ek−EF = sign(k− kF)[(hvF)2(k− kF)2 +∆2]1/2 (1.20)
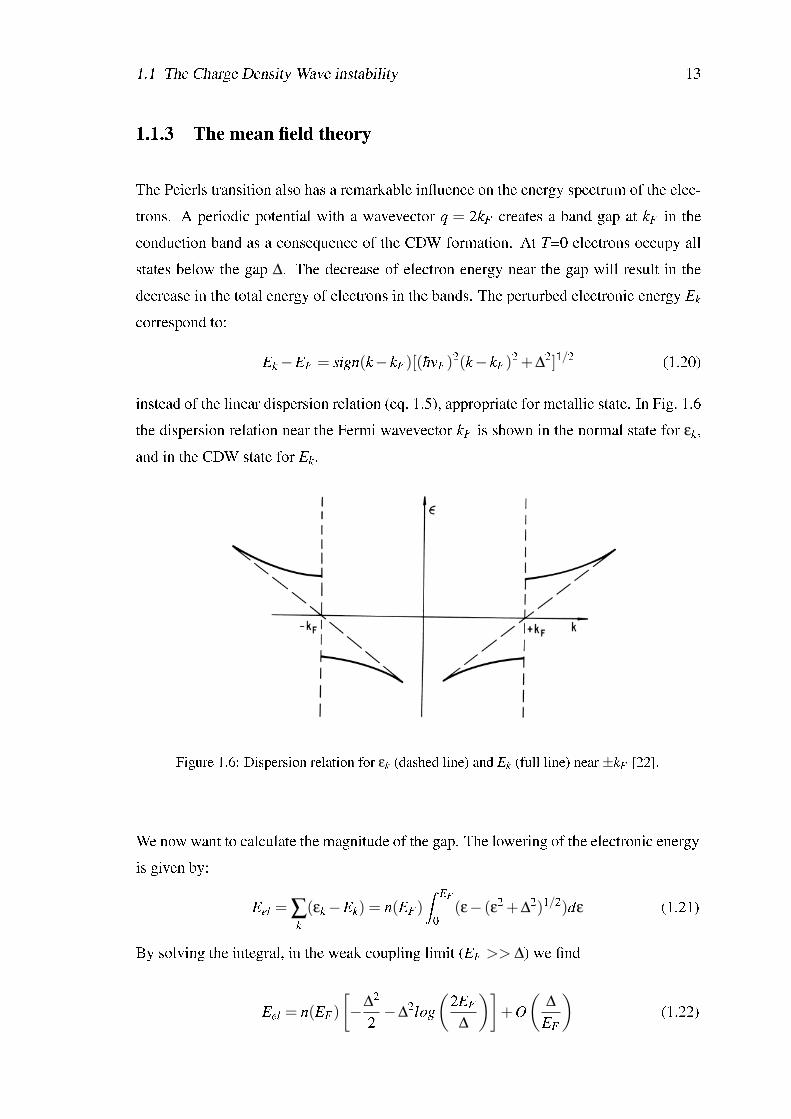
instead of the linear dispersion relation (eq. 1.5), appropriate for metallic state. In Fig. 1.6the dispersion relation near the Fermi wavevector kF is shown in the normal state for εk,and in the CDW state for Ek.
Figure 1.6: Dispersion relation for εk (dashed line) and Ek (full line) near ±kF [22].
We now want to calculate the magnitude of the gap. The lowering of the electronic energyis given by:
Eel = ∑k
(εk−Ek) = n(EF)Z EF
0(ε− (ε2 +∆2)1/2)dε (1.21)
By solving the integral, in the weak coupling limit (EF >> ∆) we nd
Eel = n(EF)[−∆2
2 −∆2log(
2EF∆
)]+O
(∆
EF
)(1.22)
14 1. Theory
On the other hand, the lattice distortion < u(x) > leads to an increase in the elastic energy,given by [22]:
Elatt =N2 Mω2
2kF < u(x) >2=
∆2n(EF)λ
(1.23)
where λ is the dimensionless coupling constant dened in equation 1.19. The total energychange is thus:
Etot = Eel +Elatt = n(EF)[−∆2
2 −∆2log(
2EF∆
)+
∆2
λ
]. (1.24)
By minimizing the above equation, we get:
∆ = 2EFe−1/λ. (1.25)
With the help of equation 1.18, and by equating ε0 ≈ EF one nds the well knownBardeen-Cooper-Schrieffer (BCS) relation [24]:
2∆ = 3.52kBT MFCDW . (1.26)
So far the discussion of the CDW ground state was at temperature T = 0. At nite tem-perature, thermally induced transitions across the gap lead to a screening of the electron-phonon interaction and eventually to the suppression of the CDW state. We consider theequation 1.16 for ωren,2kF = 0,
ω2kF =−2g2
h χ(2kF ,T ). (1.27)
Because of the CDW gap, the response function is different from that of a metallic 1Dband and for q = 2kF is given by (equation 1.7):
χ(2kF ,T ) = n(EF)Z ε0
0tanh
(Ek
2kBT
)dεkEk
(1.28)
1.1 The Charge Density Wave instability 15
where ε0 is a cutoff energy and Ek = (εk + ∆)1/2. Using the denition of λ in equa-tion 1.19 we nd the same expression which describes the temperature dependence of thesuperconducting gap within the framework of the BCS theory [24]:
1λ
=Z ε0
0tanh
(Ek
2kBT
)dεkEk
. (1.29)
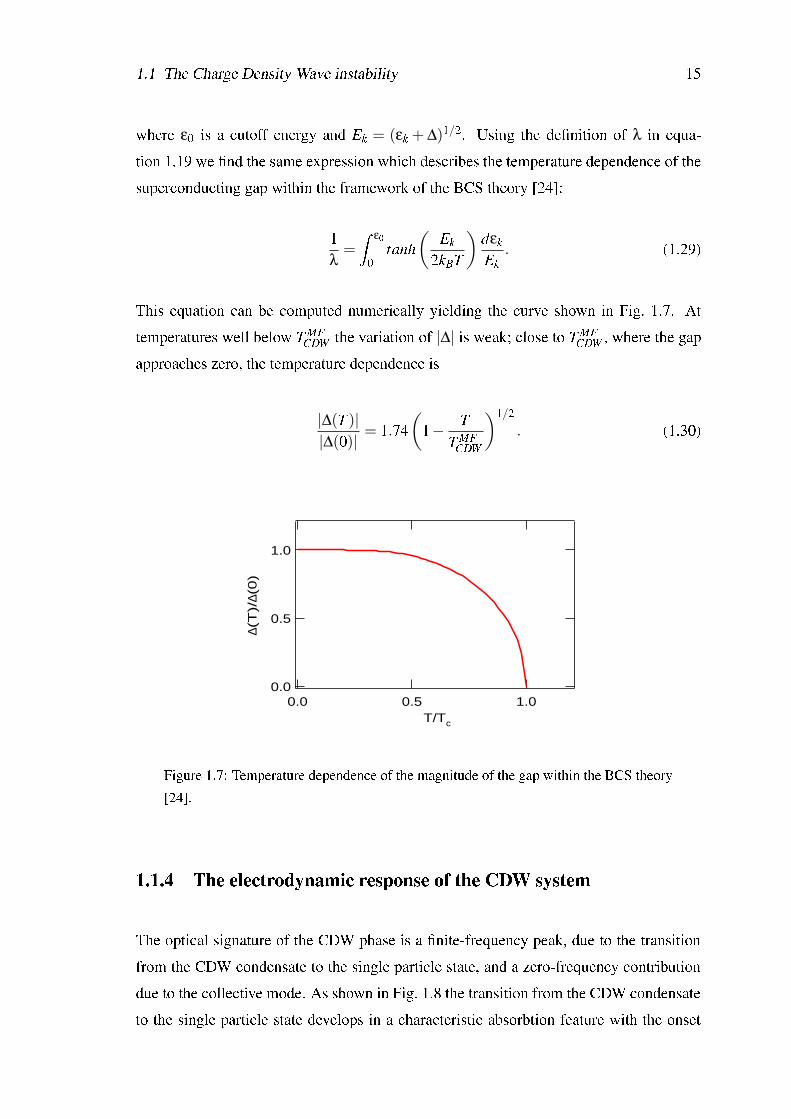
This equation can be computed numerically yielding the curve shown in Fig. 1.7. Attemperatures well below T MF
CDW the variation of |∆| is weak; close to T MFCDW , where the gap
approaches zero, the temperature dependence is
|∆(T )||∆(0)| = 1.74
(1− T
T MFCDW
)1/2. (1.30)
1.0
0.5
0.0
∆(T
)/∆(
0)
1.00.50.0T/Tc
Figure 1.7: Temperature dependence of the magnitude of the gap within the BCS theory[24].
1.1.4 The electrodynamic response of the CDW system
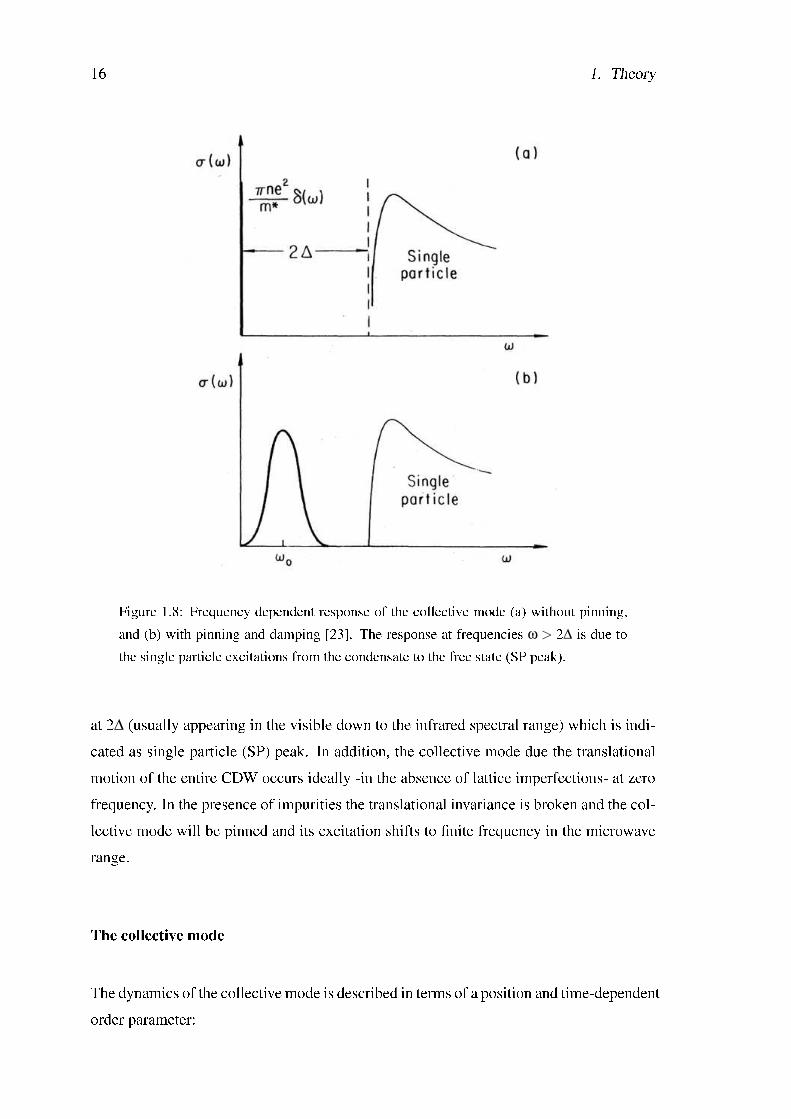
The optical signature of the CDW phase is a nite-frequency peak, due to the transitionfrom the CDW condensate to the single particle state, and a zero-frequency contributiondue to the collective mode. As shown in Fig. 1.8 the transition from the CDW condensateto the single particle state develops in a characteristic absorbtion feature with the onset
16 1. Theory
Figure 1.8: Frequency dependent response of the collective mode (a) without pinning,and (b) with pinning and damping [23]. The response at frequencies ω > 2∆ is due tothe single particle excitations from the condensate to the free state (SP peak).
at 2∆ (usually appearing in the visible down to the infrared spectral range) which is indi-cated as single particle (SP) peak. In addition, the collective mode due the translationalmotion of the entire CDW occurs ideally -in the absence of lattice imperfections- at zerofrequency. In the presence of impurities the translational invariance is broken and the col-lective mode will be pinned and its excitation shifts to nite frequency in the microwaverange.
The collective mode
The dynamics of the collective mode is described in terms of a position and time-dependentorder parameter:
1.1 The Charge Density Wave instability 17
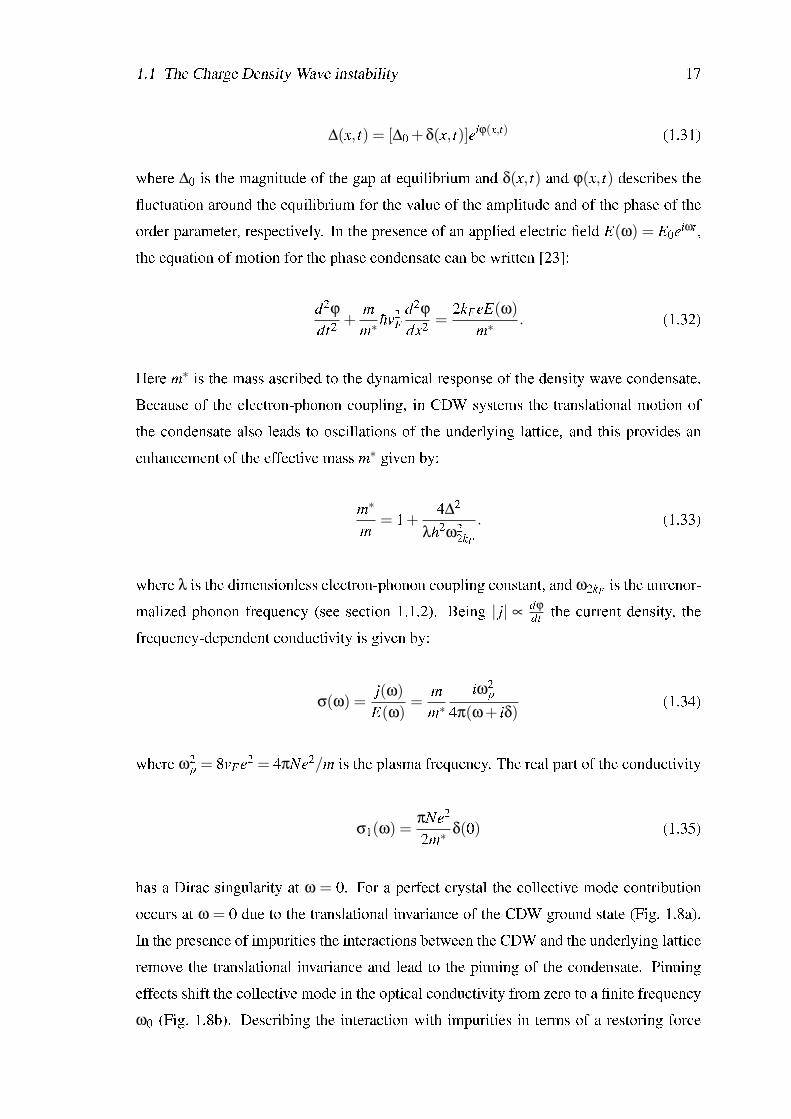
∆(x, t) = [∆0 +δ(x, t)]eiϕ(x,t) (1.31)
where ∆0 is the magnitude of the gap at equilibrium and δ(x, t) and ϕ(x, t) describes theuctuation around the equilibrium for the value of the amplitude and of the phase of theorder parameter, respectively. In the presence of an applied electric eld E(ω) = E0eiωt ,the equation of motion for the phase condensate can be written [23]:
d2ϕdt2 +
mm∗ hv2
Fd2ϕdx2 =
2kFeE(ω)m∗ . (1.32)
Here m∗ is the mass ascribed to the dynamical response of the density wave condensate.Because of the electron-phonon coupling, in CDW systems the translational motion ofthe condensate also leads to oscillations of the underlying lattice, and this provides anenhancement of the effective mass m∗ given by:
m∗
m = 1+4∆2
λh2ω22kF
. (1.33)
where λ is the dimensionless electron-phonon coupling constant, and ω2kF is the unrenor-malized phonon frequency (see section 1.1.2). Being | j| ∝ dϕ
dt the current density, thefrequency-dependent conductivity is given by:
σ(ω) =j(ω)
E(ω)=
mm∗
iω2p
4π(ω+ iδ)(1.34)
where ω2p = 8vFe2 = 4πNe2/m is the plasma frequency. The real part of the conductivity
σ1(ω) =πNe2
2m∗ δ(0) (1.35)
has a Dirac singularity at ω = 0. For a perfect crystal the collective mode contributionoccurs at ω = 0 due to the translational invariance of the CDW ground state (Fig. 1.8a).In the presence of impurities the interactions between the CDW and the underlying latticeremove the translational invariance and lead to the pinning of the condensate. Pinningeffects shift the collective mode in the optical conductivity from zero to a nite frequencyω0 (Fig. 1.8b). Describing the interaction with impurities in terms of a restoring force
18 1. Theory
and including a phenomenological damping term γ = 1/τ, the equation of motion for thephase of the condensate becomes
d2ϕdt2 +
1τ
dϕdt +ω2
0ϕ =2kFeE(ω)
m∗ , (1.36)
and the corresponding frequency-dependent conductivity is given by:
σ(ω) =nce2
iωm∗ω2
ω20−ω2− iω/τ
(1.37)
which represent an optical mode centered around the pinning frequency ω0.
Picture of the Phasons and Amplitudons
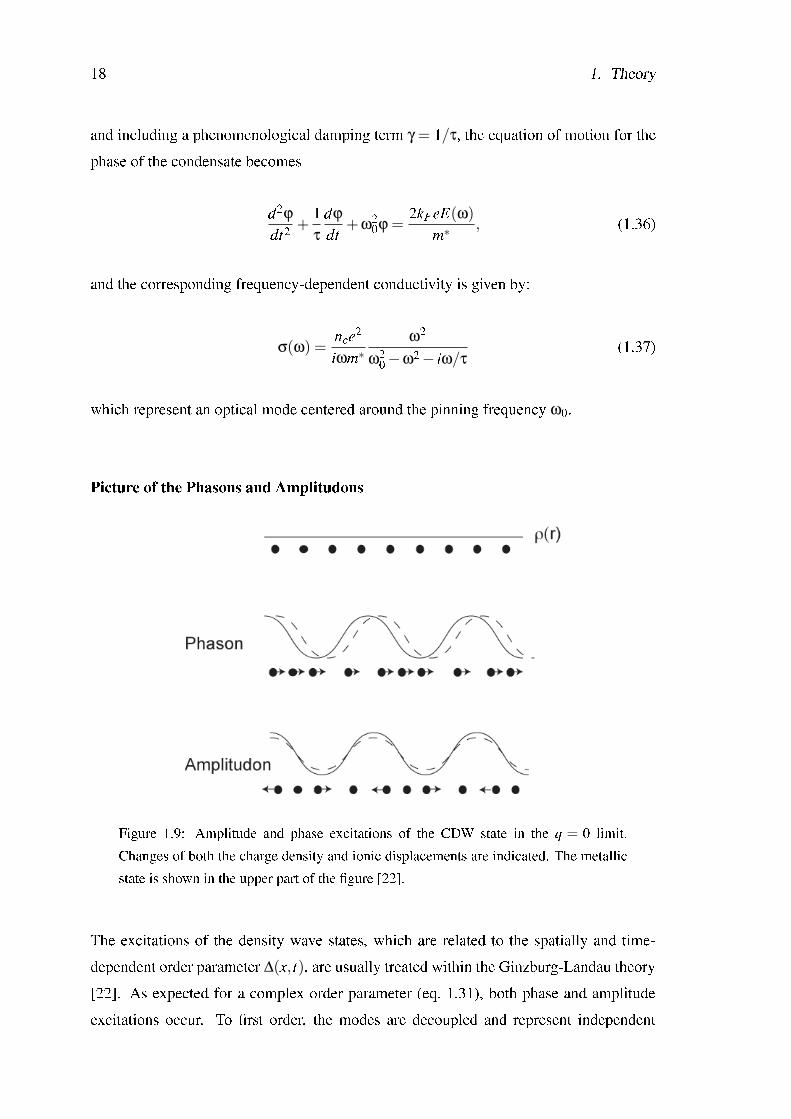
Figure 1.9: Amplitude and phase excitations of the CDW state in the q = 0 limit.Changes of both the charge density and ionic displacements are indicated. The metallicstate is shown in the upper part of the gure [22].
The excitations of the density wave states, which are related to the spatially and time-dependent order parameter ∆(x, t), are usually treated within the Ginzburg-Landau theory[22]. As expected for a complex order parameter (eq. 1.31), both phase and amplitudeexcitations occur. To rst order, the modes are decoupled and represent independent
1.1 The Charge Density Wave instability 19
oscillations of the phase and the amplitude. We do not enter into details here but we justreport in Fig. 1.9 both modes in the q = 0 limit. The oscillations of the phase involve thedisplacement of the electronic charge distributions with respect to the ionic position; andconsequently this mode is infrared active. Such displacements do not occur for amplitudeuctuations. This latter mode corresponds to the breathing of the CDW condensate, andtherefore is expected to be Raman-active.
The SP peak
The complete electrodynamic responce of the CDW state includes, besides the response ofthe collective mode σColl(ω) (see above), the absorption due to the SP excitation acrossthe CDW gap σSP(ω). To evaluate the optical contribution of the SP we consider thespectral weight sum rule [25]:
Z[σColl
1 (ω)+σSP1 (ω)]dω =
πNe2
2m . (1.38)
As we have seen in the previous subsection, the contribution of the collective mode ishowever given by: Z
σColl1 (ω)dω =
πNe2
2m∗ . (1.39)
Substituting equation 1.39 into 1.38, we nd:
ZσSP
1 (ω)dω =Z
[σN1 (ω)−σColl
1 (ω)]dω =πNe2
2m
(1− m
m∗)
. (1.40)
The balance between the spectral weight corresponding to the collective mode and thatdue to SP peak is regulated by the ratio m/m∗. For m∗ = ∞, the spectral weight of thecollective mode is zero, and the expression for the conductivity is identical to what isexpected for a one-dimensional semiconductor:
σSP(ω) =Ne2
iωm [F(ω)−F(0)] (1.41)
20 1. Theory
with the frequency dependent function
F(ω) =−Z 2∆2/(ζ2
k +∆2)(hω)2−4(ζ2
k +∆2)(1.42)
where ζk = εk −EF . In the presence of a nite mass m∗ associated with the collectivemode, the spectral function F(ω) is then modied to [26]:
F ′(ω) =F(ω)
1+(m/m∗−1)F(ω). (1.43)
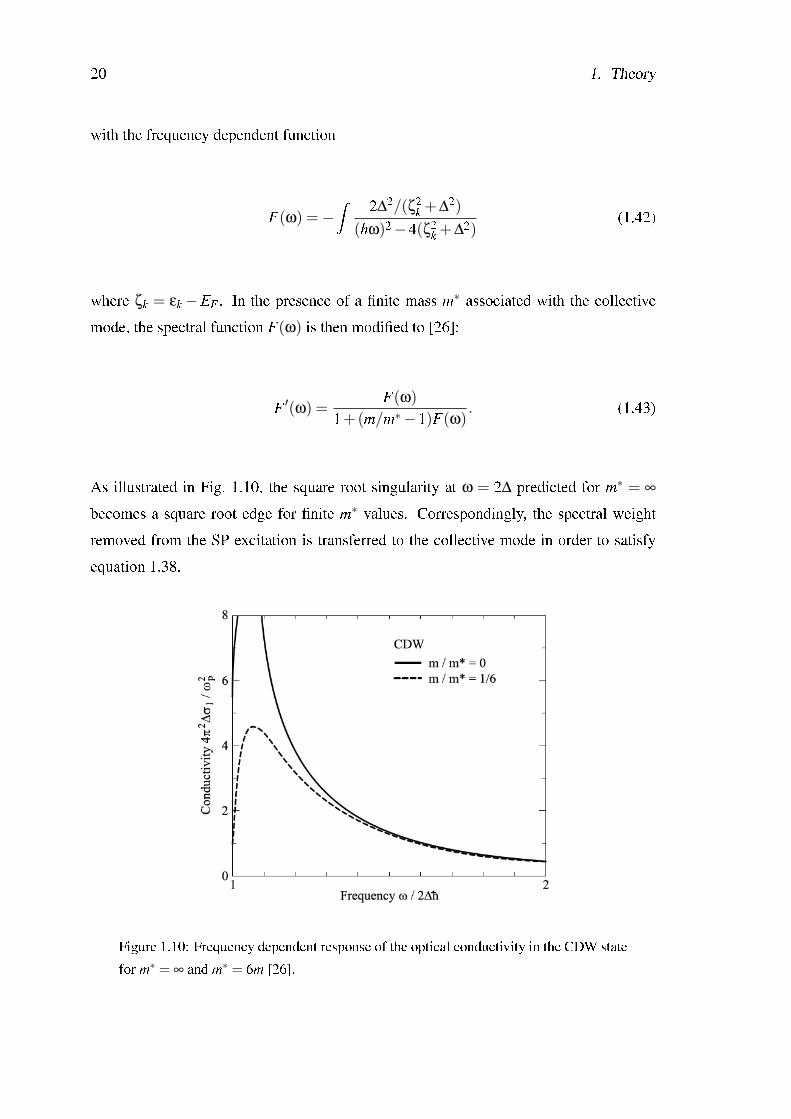
As illustrated in Fig. 1.10, the square root singularity at ω = 2∆ predicted for m∗ = ∞
becomes a square root edge for nite m∗ values. Correspondingly, the spectral weightremoved from the SP excitation is transferred to the collective mode in order to satisfyequation 1.38.
Figure 1.10: Frequency dependent response of the optical conductivity in the CDW statefor m∗ = ∞ and m∗ = 6m [26].
1.2 The physics in low dimension: from Fermi to Tomonaga-Luttinger Liquid 21
1.2 The physics in low dimension: from Fermi to Tomonaga-Luttinger Liquid
The physics of strongly correlated electrons is one of the most difcult and fascinatingsubjects of condensed matter [27, 28]. From the theoretical point of view most of our un-derstanding of this problem is based on Landau's Fermi Liquid theory [29]. However, theeffects of interactions could be greatly enhanced by reduced dimensionality. Thus, un-derstanding the physics of one and two-dimensional electrons has been the focus of muchtheoretical and experimental efforts. In two dimensions, interactions lead to spectaculareffects and perhaps to high temperature superconductivity. However, the theoretical toolsto describe such a 2D situation, still mostly lack. On the other hand, one dimension is bothmore radical and more easy to tackle for the theorists. Here, the effects of interactions areat their maximum and the Fermi Liquid (FL) is destroyed and replaced by a new state ofmatter, the Tomonaga-Luttinger Liquid (TLL) with remarkably different properties.
1.2.1 Fermi Liquids
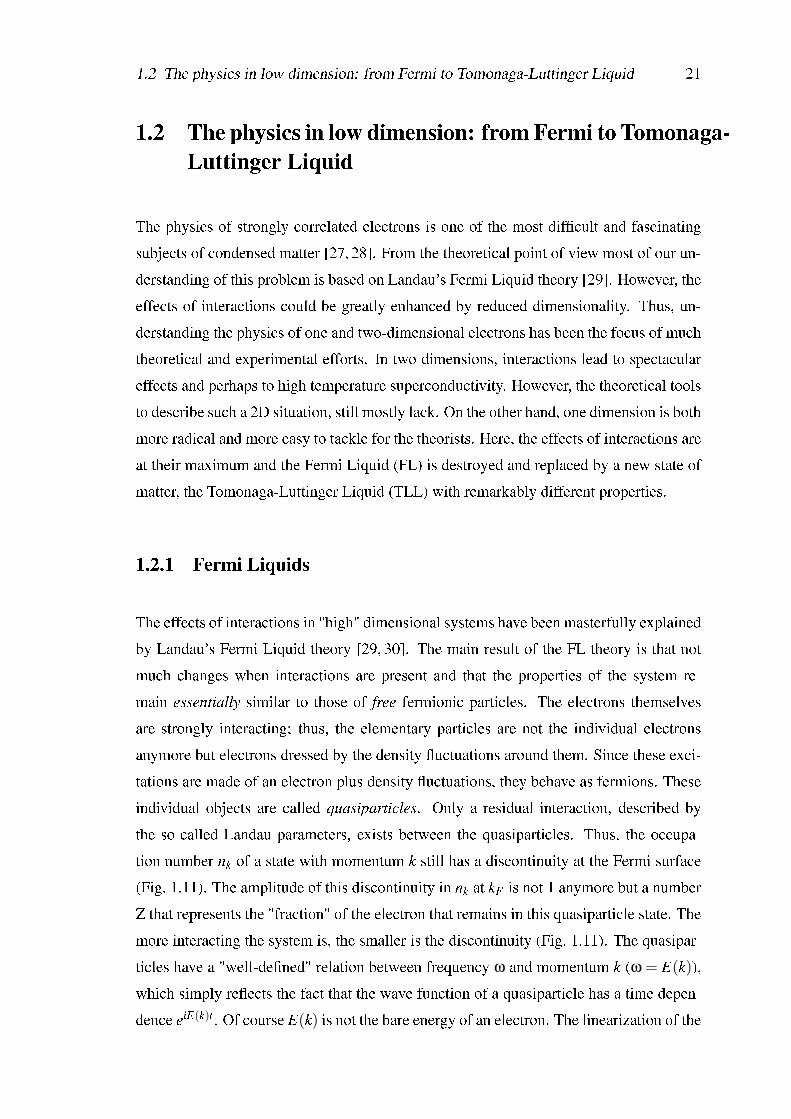
The effects of interactions in "high" dimensional systems have been masterfully explainedby Landau's Fermi Liquid theory [29, 30]. The main result of the FL theory is that notmuch changes when interactions are present and that the properties of the system re-main essentially similar to those of free fermionic particles. The electrons themselvesare strongly interacting; thus, the elementary particles are not the individual electronsanymore but electrons dressed by the density uctuations around them. Since these exci-tations are made of an electron plus density uctuations, they behave as fermions. Theseindividual objects are called quasiparticles. Only a residual interaction, described bythe so-called Landau parameters, exists between the quasiparticles. Thus, the occupa-tion number nk of a state with momentum k still has a discontinuity at the Fermi surface(Fig. 1.11). The amplitude of this discontinuity in nk at kF is not 1 anymore but a numberZ that represents the "fraction" of the electron that remains in this quasiparticle state. Themore interacting the system is, the smaller is the discontinuity (Fig. 1.11). The quasipar-ticles have a "well-dened" relation between frequency ω and momentum k (ω = E(k)),which simply reects the fact that the wave function of a quasiparticle has a time depen-dence eiE(k)t . Of course E(k) is not the bare energy of an electron. The linearization of the
22 1. Theory
Figure 1.11: (a) For free electrons the occupation nk has a discontinuity of amplitude 1 atthe Fermi level. (b) The spectral function A(k,ω) is a delta function peak. (c) In the FL,the occupation nk still has a discontinuity at the Fermi wavevector kF but with a reducedamplitude Z < 1. The excitations are electrons dressed by density uctuations. (d) Theexcitations characterizing the spectral function become sharper when they get closer tothe Fermi level [28].
new dispersion close to the Fermi level E(k) = E(kF)+ kF/m∗(k− kF) denes the effec-tive mass m* of the quasiparticle. Because they are not completely free the quasiparticleexcitations also have a lifetime τ. Thus, the Fourier transform of the time dependence ofthe wave function of the excitation eiE(k)t ·e−t/τ is not just a delta function but a Lorentzianof width 1/τ centered around ω = E(k) (see Fig. 1.11). Since the lifetime is due to thescattering between quasiparticles close to the Fermi energy, those quasiparticles have lessand less phase space to scatter and the lifetime diverges when one goes closer to the Fermilevel. Landau has shown from simple phase space arguments that the lifetime diverges in3D as τ∼ (E(k)−E(kF))2 [29]. Consequently, the Lorentzian peak centered at ω = E(k)becomes sharper and sharper when k goes towards kF and the excitations become betterand better dened when one approaches the Fermi level. The total weight of these peaksis Z.
1.2 The physics in low dimension: from Fermi to Tomonaga-Luttinger Liquid 23
To complete our short survey of the basic features of FL, we mention that in addition tothese individual quasiparticle excitations, fermionic in nature, also collective excitationsexist which describe the response of the system to a disturbance of charge or spin density,bosonic in nature. In a high dimensional system (FL) both individual and collective exci-tation are present. On the other hand, in a 1D system (described by the TLL theory) onlycollective excitations can survive, as we will see in the next section.
1.2.2 Tomonaga-Luttinger Liquids
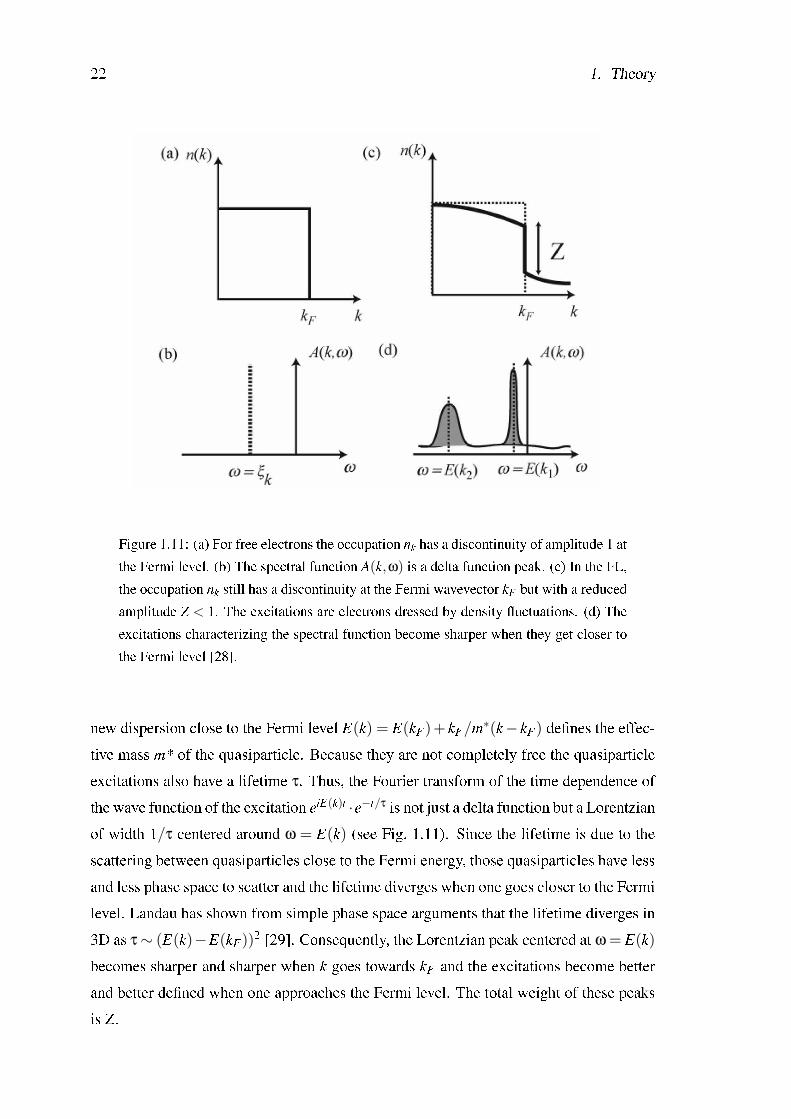
In one dimension, as shown in Fig. 1.12, an electron that tries to propagate has to pushits neighbors because of the electron-electron interactions [28]. Therefore, no individ-ual motion is possible. Any individual excitation has to become a collective one and thequasiparticle excitations do not exist anymore. This concept represents the major dif-ference between the one-dimensional world and higher dimensions and invalidates anypossibility to describe 1D system with the Fermi Liquid theory.
Figure 1.12: (a) In high dimensions, quasiparticle excitations look nearly as individ-ual fermionic objects since a particle can move "between" the others. (b) In a one-dimensional interacting system, an individual electron cannot move without pushing allother electrons conned along the chain. Thus, only collective excitations can exist [28].
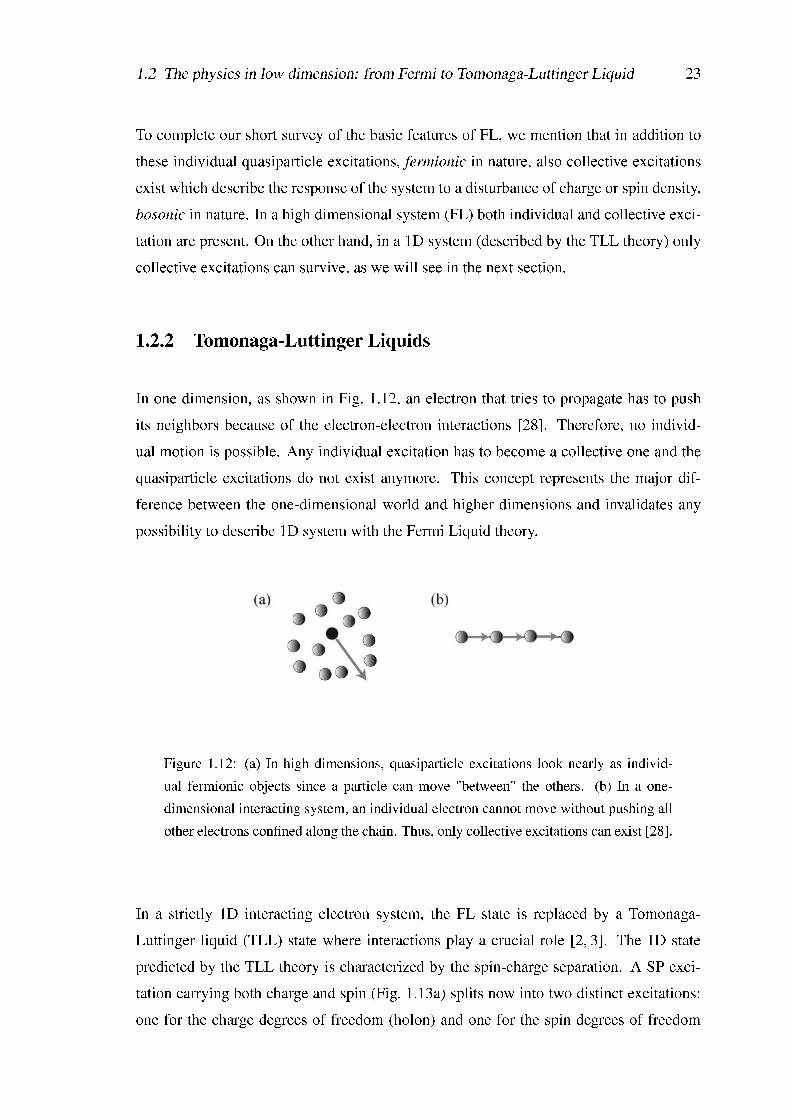
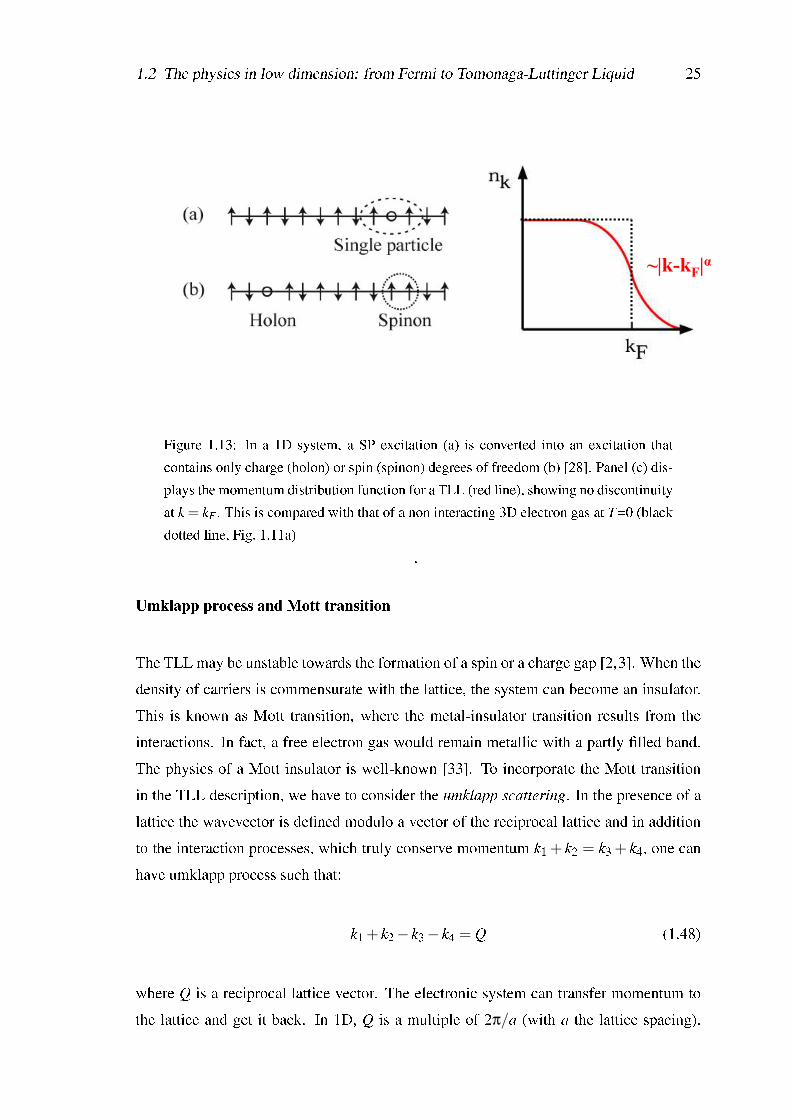
In a strictly 1D interacting electron system, the FL state is replaced by a Tomonaga-Luttinger liquid (TLL) state where interactions play a crucial role [2, 3]. The 1D statepredicted by the TLL theory is characterized by the spin-charge separation. A SP exci-tation carrying both charge and spin (Fig. 1.13a) splits now into two distinct excitations:one for the charge degrees of freedom (holon) and one for the spin degrees of freedom
24 1. Theory
(spinon) (Fig. 1.13b). The energy of such excitations are described by a standard elastic-like Hamiltonian (H0). That Hamiltonian is the sum of a part containing only charge (Hρ)and one containing only spin excitations (Hσ) [31]:
H0 = Hρ +Hσ (1.44)
where Hν(ν = ρ,σ) is of the form
H0 =1
2π
Zdx
[uνKν(πΠν(x))2 +
uνKν
(∇φν(x))2]. (1.45)
∇φ = ρ(x) where ρ(x) is the charge or spin density. φν and Πν are conjugate variables[φν(x),Πν(x)] = ihδ(x−x′). uρ and uσ are the velocities for the propagation of the chargeand spin excitations, respectively (both velocities are equal to vF in the absence of interac-tions). Kρ,σ are dimensionless parameters depending on the interactions. The parametersuρ,σ and Kρ,σ characterize the low energy properties of a 1D system, playing a role similarto the Landau's parameters in the FL theory.
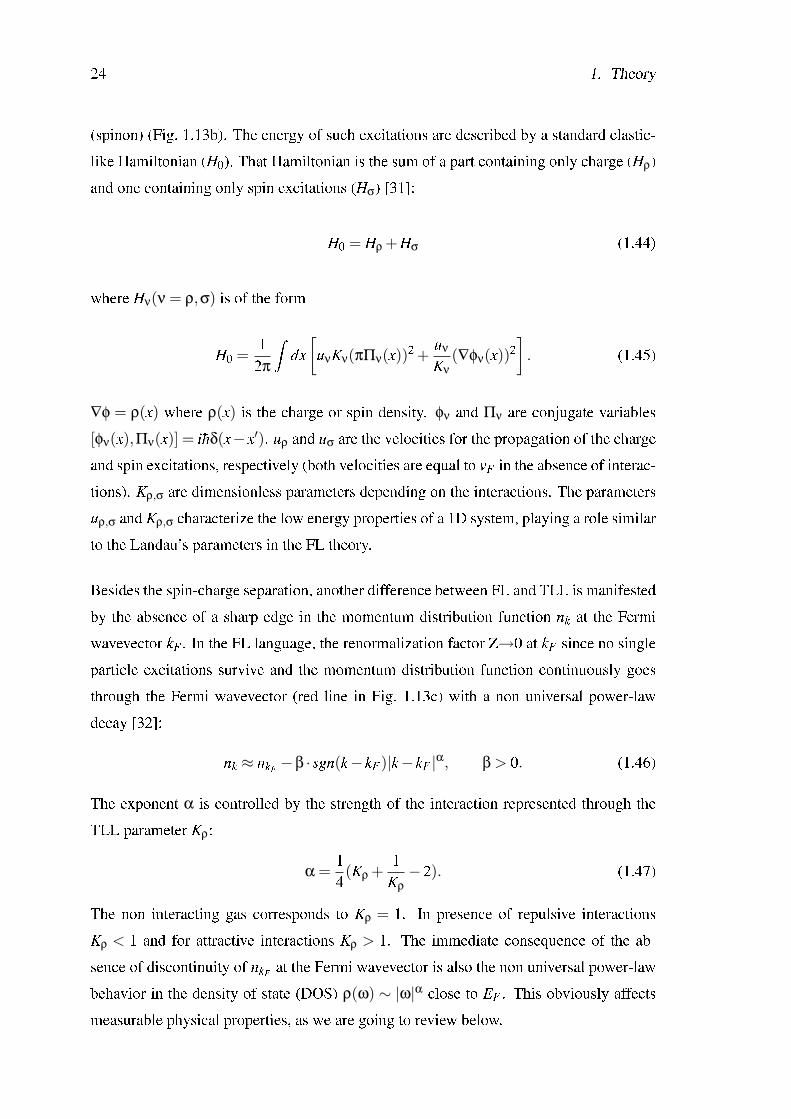
Besides the spin-charge separation, another difference between FL and TLL is manifestedby the absence of a sharp edge in the momentum distribution function nk at the Fermiwavevector kF . In the FL language, the renormalization factor Z→0 at kF since no singleparticle excitations survive and the momentum distribution function continuously goesthrough the Fermi wavevector (red line in Fig. 1.13c) with a non universal power-lawdecay [32]:
nk ≈ nkF −β · sgn(k− kF)|k− kF |α, β > 0. (1.46)
The exponent α is controlled by the strength of the interaction represented through theTLL parameter Kρ:
α =14(Kρ +
1Kρ−2). (1.47)
The non interacting gas corresponds to Kρ = 1. In presence of repulsive interactionsKρ < 1 and for attractive interactions Kρ > 1. The immediate consequence of the ab-sence of discontinuity of nkF at the Fermi wavevector is also the non universal power-lawbehavior in the density of state (DOS) ρ(ω) ∼ |ω|α close to EF . This obviously affectsmeasurable physical properties, as we are going to review below.
1.2 The physics in low dimension: from Fermi to Tomonaga-Luttinger Liquid 25
~|k-kF|
Figure 1.13: In a 1D system, a SP excitation (a) is converted into an excitation thatcontains only charge (holon) or spin (spinon) degrees of freedom (b) [28]. Panel (c) dis-plays the momentum distribution function for a TLL (red line), showing no discontinuityat k = kF . This is compared with that of a non interacting 3D electron gas at T =0 (blackdotted line, Fig. 1.11a)
.
Umklapp process and Mott transition
The TLL may be unstable towards the formation of a spin or a charge gap [2,3]. When thedensity of carriers is commensurate with the lattice, the system can become an insulator.This is known as Mott transition, where the metal-insulator transition results from theinteractions. In fact, a free electron gas would remain metallic with a partly lled band.The physics of a Mott insulator is well-known [33]. To incorporate the Mott transitionin the TLL description, we have to consider the umklapp scattering. In the presence of alattice the wavevector is dened modulo a vector of the reciprocal lattice and in additionto the interaction processes, which truly conserve momentum k1 + k2 = k3 + k4, one canhave umklapp process such that:
k1 + k2− k3− k4 = Q (1.48)
where Q is a reciprocal lattice vector. The electronic system can transfer momentum tothe lattice and get it back. In 1D, Q is a multiple of 2π/a (with a the lattice spacing).
26 1. Theory
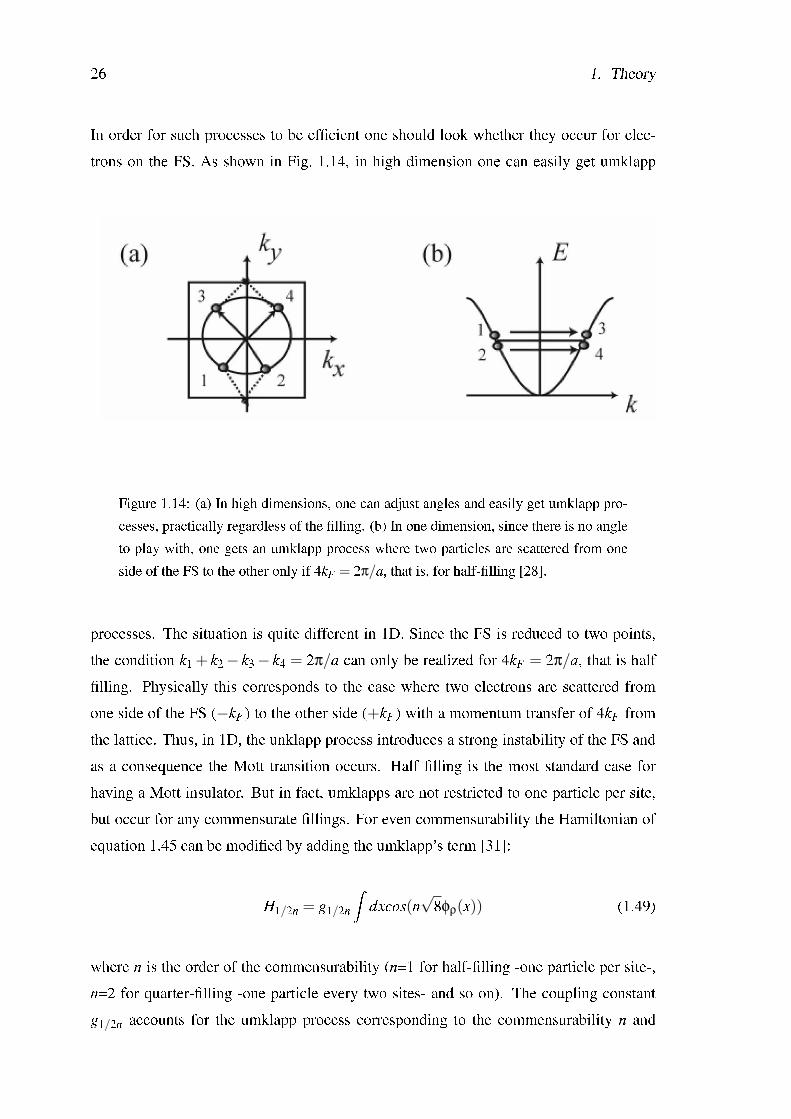
In order for such processes to be efcient one should look whether they occur for elec-trons on the FS. As shown in Fig. 1.14, in high dimension one can easily get umklapp
Figure 1.14: (a) In high dimensions, one can adjust angles and easily get umklapp pro-cesses, practically regardless of the lling. (b) In one dimension, since there is no angleto play with, one gets an umklapp process where two particles are scattered from oneside of the FS to the other only if 4kF = 2π/a, that is, for half-lling [28].
processes. The situation is quite different in 1D. Since the FS is reduced to two points,the condition k1 + k2− k3− k4 = 2π/a can only be realized for 4kF = 2π/a, that is halflling. Physically this corresponds to the case where two electrons are scattered fromone side of the FS (−kF ) to the other side (+kF ) with a momentum transfer of 4kF fromthe lattice. Thus, in 1D, the unklapp process introduces a strong instability of the FS andas a consequence the Mott transition occurs. Half lling is the most standard case forhaving a Mott insulator. But in fact, umklapps are not restricted to one particle per site,but occur for any commensurate llings. For even commensurability the Hamiltonian ofequation 1.45 can be modied by adding the umklapp's term [31]:
H1/2n = g1/2n
Zdxcos(n
√8φρ(x)) (1.49)
where n is the order of the commensurability (n=1 for half-lling -one particle per site-,n=2 for quarter-lling -one particle every two sites- and so on). The coupling constantg1/2n accounts for the umklapp process corresponding to the commensurability n and
1.2 The physics in low dimension: from Fermi to Tomonaga-Luttinger Liquid 27
depends on the precise microscopic interaction (at n=1 for a Hubbard model, g1/2 is ofthe order of the interaction U).
It is now of interest to consider deviation from commensurability. To change thephysical properties of a commensurate system, one has two control parameters. One canvary the strength of the interactions (Kρ) while staying at commensurate lling or varythe chemical potential µ (or lling), by doping, while keeping the interactions constant.In the presence of doping one can write quite generally the umklapp as:
H1/2n = g1/2n
Zdxcos(n
√8φρ(x)−δx) (1.50)
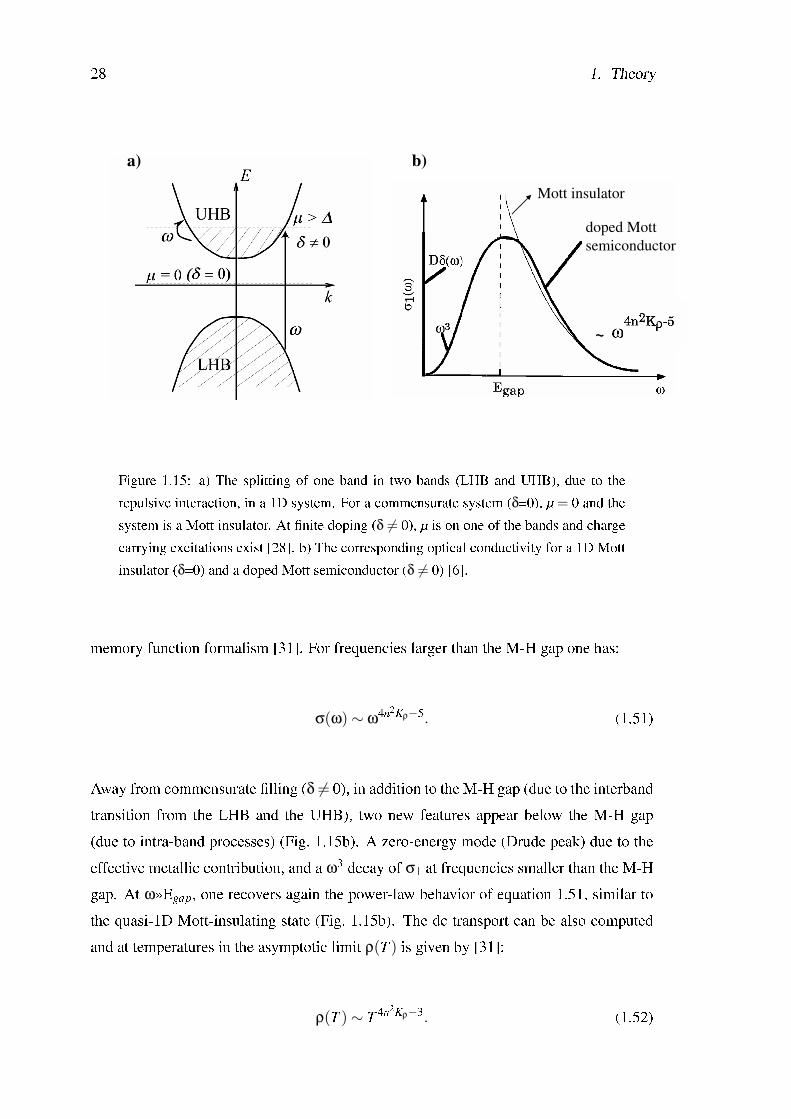
where δ is the deviation (doping) from the commensurate lling. The Hamiltonian 1.50provides a complete description of the Mott transition in one dimension [31]. To studythe Mott transition as a function of doping it is then necessary to map the HamiltonianH0 +H1/2n to a spin-less fermion model [34], describing the charge excitations (solitons)within the sine-Gordon approach. In this way one is led to a simple semiconductor pictureof two bands separated by a gap, as shown in Fig. 1.15a. The repulsion between theelectrons splits the band into a lower Hubbard band (LHB) and an upper Hubbard band(UHB). The excitations in these bands are solitons (kinks) of charge along the chains. Fora commensurate system, the chemical potential is between the two bands (µ = 0) and thesystem is a Mott insulator. At nite doping (δ 6= 0), the chemical potential is on one ofthe bands and charge excitations may exist.
Consequences on the optical and transport properties
The Mott transition and the Luttinger physics have drastic consequences on the opticalproperties and the dc-transport which are expected to be quite different than in FL. Aschematic plot of the optical conductivity (at T = 0) is shown in Fig. 1.15b. For a com-mensurate system in the Mott insulating state (µ=0, δ=0) σ1 is zero until ω is larger thanthe M-H (Mott-Hubbard) gap (Egap), so that transitions between LHB and UHB are pos-sible. σ1 is then characterized by the square root singularity coming from the DOS. Forfrequencies larger than the M-H gap, interactions give a non universal power-law decay.Such a power-law can be described by renormalization group calculations coupled to a
28 1. Theory
Mott insulator
doped Mott
semiconductor
~
a) b)
Figure 1.15: a) The splitting of one band in two bands (LHB and UHB), due to therepulsive interaction, in a 1D system. For a commensurate system (δ=0), µ = 0 and thesystem is a Mott insulator. At nite doping (δ 6= 0), µ is on one of the bands and chargecarrying excitations exist [28]. b) The corresponding optical conductivity for a 1D Mottinsulator (δ=0) and a doped Mott semiconductor (δ 6= 0) [6].
memory function formalism [31]. For frequencies larger than the M-H gap one has:
σ(ω)∼ ω4n2Kρ−5. (1.51)
Away from commensurate lling (δ 6= 0), in addition to the M-H gap (due to the interbandtransition from the LHB and the UHB), two new features appear below the M-H gap(due to intra-band processes) (Fig. 1.15b). A zero-energy mode (Drude peak) due to theeffective metallic contribution, and a ω3 decay of σ1 at frequencies smaller than the M-Hgap. At ω»Egap, one recovers again the power-law behavior of equation 1.51, similar tothe quasi-1D Mott-insulating state (Fig. 1.15b). The dc transport can be also computedand at temperatures in the asymptotic limit ρ(T ) is given by [31]:
ρ(T )∼ T 4n2Kρ−3. (1.52)
1.2 The physics in low dimension: from Fermi to Tomonaga-Luttinger Liquid 29
The resistivity at high temperatures, similarly to the optical conductivity at high energyscales, shows a power-law behavior which is governed by the TLL parameter Kρ and bythe degree of the commensurability n.
Evidence of TLL behavior in real low-dimensional systems
The rst evidence for a TLL state was achieved in the linear chain Bechgaard salts[(TMTTF)2X or (TMTSF)2X, with X=AsF6, PF6, ClO4] [5, 7, 3539]. These materialscan be understood as a 3D array of one-dimensional chain units, formed by the stacking ofthe organic molecule TMTTF or TMTSF. The dimensionality of such system is controlledby the ratio between the in-chain, t‖, and the inter-chain, t⊥, transfer integral, representingthe probability for the electrons to diffuse along or to hopp between the chains, respec-tively. If there is no hopping between the chains (t⊥=0), the system is strictly 1D and theTLL theory can be applied so that a 1D Mott insulator may be expected. This is the casefor the TMTTF family (t‖/t⊥=25). These systems, indeed, show a characteristic feature inthe optical conductivity due to inter-band transitions across the M-H gap (Fig. 1.15b) [5].When the single particle hopping between the chain is instead relevant, small deviationsfrom commensurate lling lead to effects equivalent to a real doping on a single chain(i.e., selfdoping, δ 6= 0) and one expect a two-dimensional doped Mott semiconductor(Fig. 1.15b). This is the case for TMTSF family (t‖/t⊥=10) where the optical conduc-tivity displays the M-H gap feature and the zero-frequency mode, similar to the picturedepicted in Fig. 1.15b. The appearance of a Drude peak (metallic contribution) in the op-tical conductivity is due to the single-electron deconnement. The electrons are no moreconned on individual chain but can jump between two parallel chains leading to a con-ducting state. The increase of the interchain hopping, by lattice compression (chemicalor applied pressure), leads therefore the system to a dimensionality-driven connement-deconnement crossover from a 1D Mott insulator to a high dimensional semiconduc-tor [5, 39]. In Fig. 1.16a the frequency dependence of the optical conductivity above theM-H gap is shown for the TMTSF family. There is evidence for a power-law behavior(σ1 ∼ ω−η), in agreement with the theoretical predictions (eq. 1.51). From the exponent(η=1.3), which differs from that expected for a three dimensional semiconductor (η=3)one can extract the TLL parameter Kρ (eq. 1.51). Kρ agrees with photoemission andtransport data [38]. The power-law is a typical 1D signature and its observation above

30 1. Theory
the M-H gap can be justied by the fact that at energies larger than t⊥ the warping of theFS, due to t⊥ itself (Fig. 1.16b), is no longer distinguishable. Consequently, at such largeenergy scales one effectively experiences a 1D limit, where the commensurate (δ=0) andincommensurate (δ 6=0) case behave in a identical way.
a)
/ peak
1/
peak
b)
T,t
Figure 1.16: a) The normalized conductivity of TMTSF systems shown on log-log scaleto demonstrate the power-law behavior above the nite energy peak (M-H gap) [5]. b)If energy or temperature are larger than the warping of the FS, induced by the interchainhopping (t⊥), the system can be considered to be always in a 1D limit [28].
2 Experimental techniques
2.1 Introduction
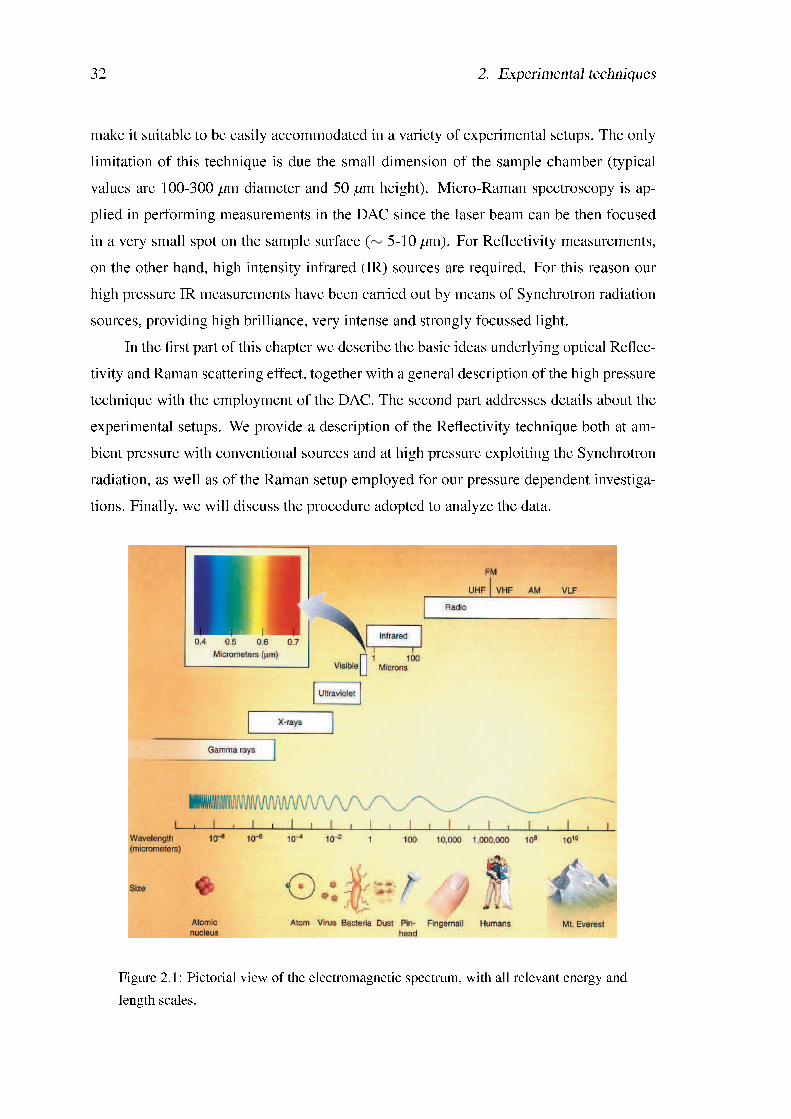
The measurements of the optical Reectivity is a widely used technique in solid stateoptics, since it gives many information on the elementary excitation of the investigatedsystems over a very broad spectral range extending on more than ve orders of magnitude(from the far infrared up to the ultraviolet, see Fig 2.1). Optical spectroscopy is in generalan ideal tool to investigate the CDW systems, since it is able to reveal the opening of theCDW gap in the charge excitation spectrum. Moreover, because of the imperfect nesting,as typical for quasi 2D systems such as the rare-earths (RE) tellurides investigated in thisthesis, the optical techniques are also able to detect the contribution of the free chargecarriers.
Furthermore, Raman spectroscopy represents another powerful and complementarytechnique to investigate the lattice dynamics, especially when the presence of the remain-ing metallic contribution prevents to detect vibrational modes in the infrared range as thecorresponding signals are overwhelmed by the metallic Drude term. Both Reectivityand Raman investigations were carried out at ambient pressure and also at high pressuresin order to follow the evolution of the CDW gap and of the lattice dynamics upon com-pressing the lattice.
High pressures were achieved with a Diamond Anvil Cell (DAC) which is indeedvery appropriate for the investigation of condensed matter under extreme conditions.Moreover, owing to the diamond transparency to the electromagnetic radiation over awide frequency range, it allows to study the material properties as a function of pres-sure with several spectroscopic techniques. The simplicity and compactness of the DAC
31
32 2. Experimental techniques
make it suitable to be easily accommodated in a variety of experimental setups. The onlylimitation of this technique is due the small dimension of the sample chamber (typicalvalues are 100-300 µm diameter and 50 µm height). Micro-Raman spectroscopy is ap-plied in performing measurements in the DAC since the laser beam can be then focusedin a very small spot on the sample surface (∼ 5-10 µm). For Reectivity measurements,on the other hand, high intensity infrared (IR) sources are required. For this reason ourhigh pressure IR measurements have been carried out by means of Synchrotron radiationsources, providing high brilliance, very intense and strongly focussed light.
In the rst part of this chapter we describe the basic ideas underlying optical Reec-tivity and Raman scattering effect, together with a general description of the high pressuretechnique with the employment of the DAC. The second part addresses details about theexperimental setups. We provide a description of the Reectivity technique both at am-bient pressure with conventional sources and at high pressure exploiting the Synchrotronradiation, as well as of the Raman setup employed for our pressure dependent investiga-tions. Finally, we will discuss the procedure adopted to analyze the data.
Figure 2.1: Pictorial view of the electromagnetic spectrum, with all relevant energy andlength scales.
2.2 Optical functions and Reectivity 33
2.2 Optical functions and Reectivity
The interaction of light with an isotropic medium can be described by the macroscopicMaxwell's equations where we consider ρext = 0 since there are no external sources[25, 40]:
∇ ·E = 0 ∇×E =−µc
∂H∂t (2.1)
∇ ·H = 0 ∇×H =εc
∂E∂t +
4πσc E, (2.2)
ε and σ indicate the dielectric function and the optical conductivity which represent theresponse functions of the system when an electric eld is applied and, in the linear regime,the following standard denitions are valid: P= ε E, J=σ E. The equations 2.1 and 2.2can be combined to give the well known wave equation for the plane wave propagating inan energy-absorbing medium:
∇ ·E2 =εc2
∂2E∂t2 +
4πσc2
∂E∂t . (2.3)
The differential equation can be easily solved by a single plane wave function where thewavevector ~q must be complex to account for the energy dissipation:
E = E0ei( q·r−ωt). (2.4)
Substituting the equation 2.4 into 2.3, we nd:
q2 =ω2
c2
(ε+ i4πσ
ω
). (2.5)
Introducing the complex refractive index n = n+ ik denes as q = (ω/c) · n, one gets:
q2 =ω2
c2 (n2− k2 + i2nk), (2.6)
34 2. Experimental techniques
where n and k are the refractive index and the absorbtion coefcient, respectively. Thelast two equations (2.5 and 2.6) can be used to obtain expressions for ε and σ in terms ofn and k:
ε = n2− k2 and σ = 2nkω/4π. (2.7)
Making use of the the complex dielectric function ε = ε1 + iε2 (where ε = n2) and thecomplex conductivity σ = σ1 + iσ2 we can nally write the following four importantexpressions valid for the optical functions [25, 40]:
ε1 = n2− k2 (2.8)
ε2 = 2nk (2.9)
σ1 =ω4π
ε2 (2.10)
σ2 =ω4π
(1− ε1) (2.11)
where ε1 and σ1 are the ε and σ which appear in the Maxwell's equations 2.1 and 2.2.We now introduce a measurable quantity, namely the optical Reectivity R(ω),
which allows us to extract all the above mentioned complex optical functions ( n, ε, σ)through the analitical procedure reported in the subsection 2.6.2. The R(ω) is dened asthe square modulus of the complex reectance r(ω) and is obtained experimentally by theratio between the intensity of the light reected by the sample (Ir) and of the incident one(Ii):
R = |r|2 =∣∣∣∣
ErEi
∣∣∣∣2=
IrIi
, (2.12)
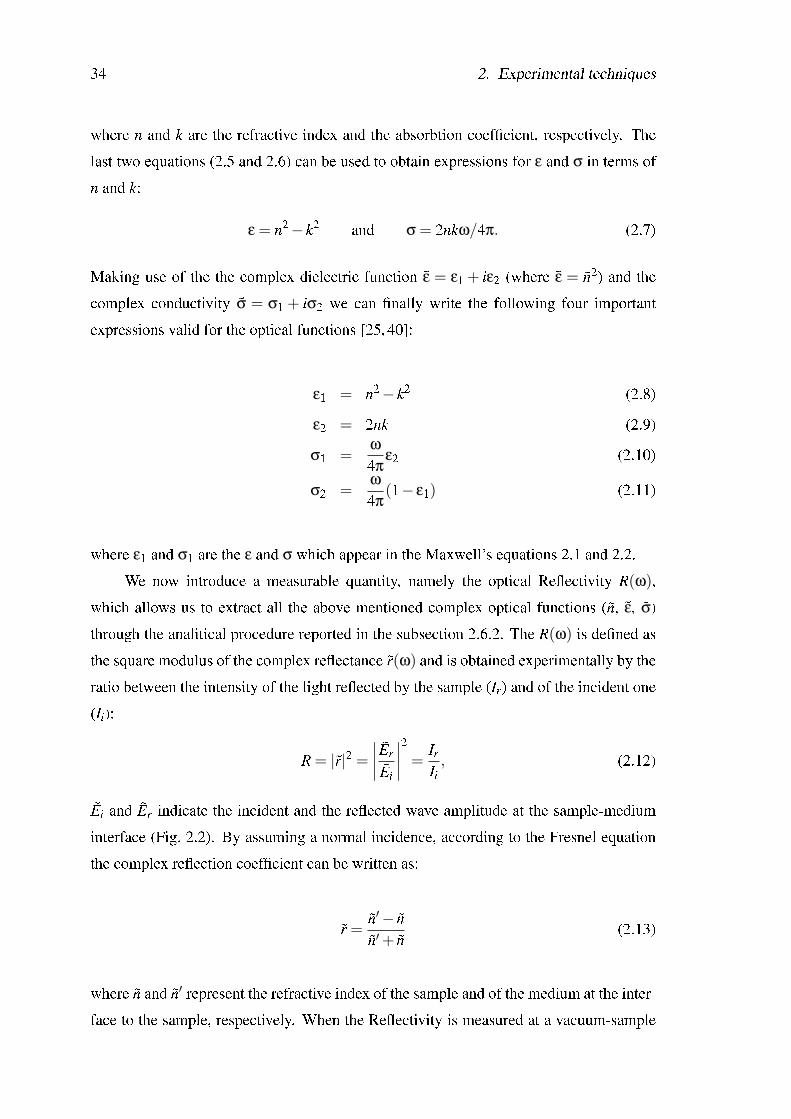
Ei and Er indicate the incident and the reected wave amplitude at the sample-mediuminterface (Fig. 2.2). By assuming a normal incidence, according to the Fresnel equationthe complex reection coefcient can be written as:
r =n′− nn′+ n (2.13)
where n and n′ represent the refractive index of the sample and of the medium at the inter-face to the sample, respectively. When the Reectivity is measured at a vacuum-sample
2.2 Optical functions and Reectivity 35
Figure 2.2: Incident Ei, reected Er, and transmitted Et electric wave traveling normalto the interface between two media.
interface, the refractive index n′=1 and from equation 2.13 one derives the following sim-ple expression for the Reectivity:
R =∣∣∣∣1− n1+ n
∣∣∣∣2=
(1−n)2 + k2
(1+n)2 + k2 . (2.14)
2.2.1 Kramers-Kronig dispersion relations
The physical basis of the Kramers-Kronig (KK) relations is the principle of causality.Causality means that there is not any effect before the cause. The cause in optical phe-nomena is the incident electromagnetic radiation and the effect the motion of electronsand nuclei. Thus, light cannot be reected or absorbed by a system before the arrival ofthe primary light wave. Under the action of an external stimulus (in our case the elec-tromagnetic radiation), a system responds in its own characteristic way and precisely therelationship of the response to a stimulus is given by a response function. For a linearsystem the induced response to an external stimulus can be written as [25, 40]:
X(t) =Z ∞
−∞G(t− t ′) f (t ′)dt ′ (2.15)
36 2. Experimental techniques
The equation 2.15 describes the response X(t) of the system at the time t to an externalstimulus f (t ′) at times t ′. The function G(t− t ′) is called the response function, and maybe the conductivity, the dielectric constant, the susceptibility or any other optical constant,such as the refractive index. G(t− t ′) is a function of the difference of the argument t− t ′
only, since the origin of the time scale does not have any physical signicance. The spatialdependence of the external perturbation can be neglected with the assumption of the localapproximation (what happens at a particular place depends only on the eld existing atthat place), valid for most of the optical problems. The important requirement of thecausality is taken into account by the following condition:
G(t− t ′)≡ 0 for t < t ′ (2.16)
which basically means that there is no response prior to the stimulus. In the Fourier spacethe relation 2.15 assumes the form of a simple product:
X(ω) = G(ω) · f (ω). (2.17)
In general G(ω) is a complex quantity with the real component G1(ω) describing the at-tenuation of signal and the imaginary part G2(ω) reecting the phase difference betweenthe external perturbation and the response. With a few simple mathematical steps is pos-sible to obtain the very fundamental relationships between the real and the imaginary partof the linear response function which are known as KK relations [25, 40]:
G1(ω) =2π
PZ ∞
0
ω′G2(ω′)ω′2−ω2 dω′ (2.18)
G2(ω) = −2ωπ
PZ ∞
0
G1(ω′)ω′2−ω2 dω′ (2.19)
where P is the principle value. We will return later on the KK relationship between themeasured Reectivity R(ω) and the optical properties in condensed matter.
2.3 Raman scattering 37
2.3 Raman scattering
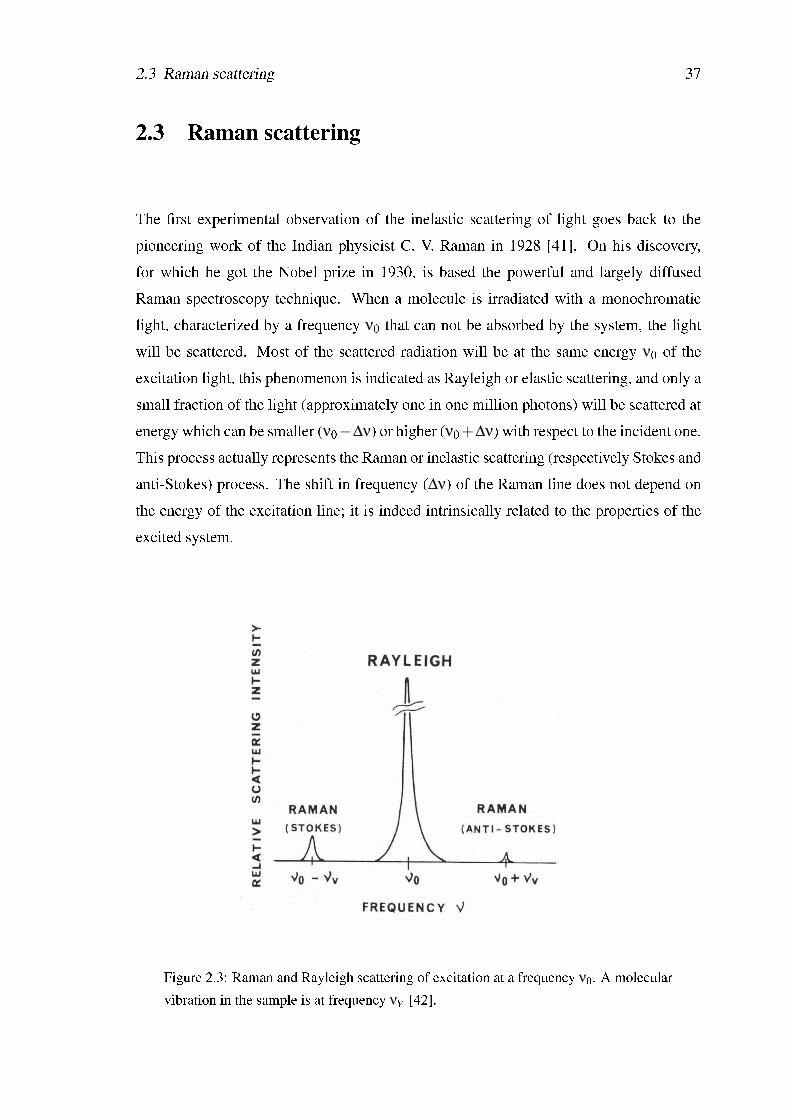
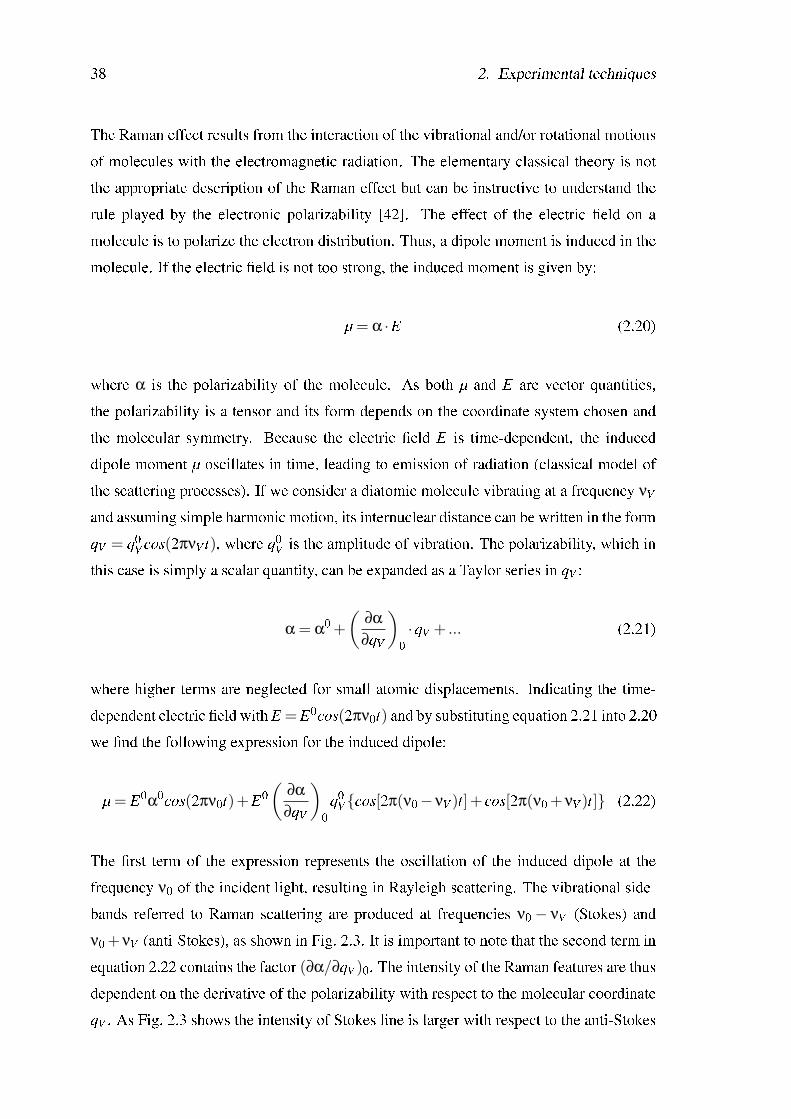
The rst experimental observation of the inelastic scattering of light goes back to thepioneering work of the Indian physicist C. V. Raman in 1928 [41]. On his discovery,for which he got the Nobel prize in 1930, is based the powerful and largely diffusedRaman spectroscopy technique. When a molecule is irradiated with a monochromaticlight, characterized by a frequency ν0 that can not be absorbed by the system, the lightwill be scattered. Most of the scattered radiation will be at the same energy ν0 of theexcitation light, this phenomenon is indicated as Rayleigh or elastic scattering, and only asmall fraction of the light (approximately one in one million photons) will be scattered atenergy which can be smaller (ν0−∆ν) or higher (ν0 +∆ν) with respect to the incident one.This process actually represents the Raman or inelastic scattering (respectively Stokes andanti-Stokes) process. The shift in frequency (∆ν) of the Raman line does not depend onthe energy of the excitation line; it is indeed intrinsically related to the properties of theexcited system.
Figure 2.3: Raman and Rayleigh scattering of excitation at a frequency ν0. A molecularvibration in the sample is at frequency νV [42].
38 2. Experimental techniques
The Raman effect results from the interaction of the vibrational and/or rotational motionsof molecules with the electromagnetic radiation. The elementary classical theory is notthe appropriate description of the Raman effect but can be instructive to understand therule played by the electronic polarizability [42]. The effect of the electric eld on amolecule is to polarize the electron distribution. Thus, a dipole moment is induced in themolecule. If the electric eld is not too strong, the induced moment is given by:
µ = α ·E (2.20)
where α is the polarizability of the molecule. As both µ and E are vector quantities,the polarizability is a tensor and its form depends on the coordinate system chosen andthe molecular symmetry. Because the electric eld E is time-dependent, the induceddipole moment µ oscillates in time, leading to emission of radiation (classical model ofthe scattering processes). If we consider a diatomic molecule vibrating at a frequency νV
and assuming simple harmonic motion, its internuclear distance can be written in the formqV = q0
V cos(2πνV t), where q0V is the amplitude of vibration. The polarizability, which in
this case is simply a scalar quantity, can be expanded as a Taylor series in qV :
α = α0 +(
∂α∂qV
)
0·qV + ... (2.21)
where higher terms are neglected for small atomic displacements. Indicating the time-dependent electric eld with E = E0cos(2πν0t) and by substituting equation 2.21 into 2.20we nd the following expression for the induced dipole:
µ = E0α0cos(2πν0t)+E0(
∂α∂qV
)
0q0
Vcos[2π(ν0−νV )t]+ cos[2π(ν0 +νV )t] (2.22)
The rst term of the expression represents the oscillation of the induced dipole at thefrequency ν0 of the incident light, resulting in Rayleigh scattering. The vibrational side-bands referred to Raman scattering are produced at frequencies ν0 − νV (Stokes) andν0 +νV (anti-Stokes), as shown in Fig. 2.3. It is important to note that the second term inequation 2.22 contains the factor (∂α/∂qV )0. The intensity of the Raman features are thusdependent on the derivative of the polarizability with respect to the molecular coordinateqV . As Fig. 2.3 shows the intensity of Stokes line is larger with respect to the anti-Stokes
2.3 Raman scattering 39
one. To explain this phenomenon the classical model is not enough and quantum theoryhas to be consider. According to quantum theory, a molecular motion can have only cer-tain discrete energy states. A change in state is thus accompanied by the gain or loss ofone or more quanta of energy (∆E). The interaction of a molecule with electromagneticradiation can thus be analyzed in terms of an energy-transfer mechanism. Scattering pro-cesses involve two quanta acting simultaneously in the light-matter system. Simple elasticscattering occurs when a quantum of electromagnetic energy is created at the same timethat an identical one is annihilated. Thus, the molecule is unchanged by the event. In thecase of an inelastic process such as the Raman effect, the two photons are not identicaland there is a net change in the state of the molecule.
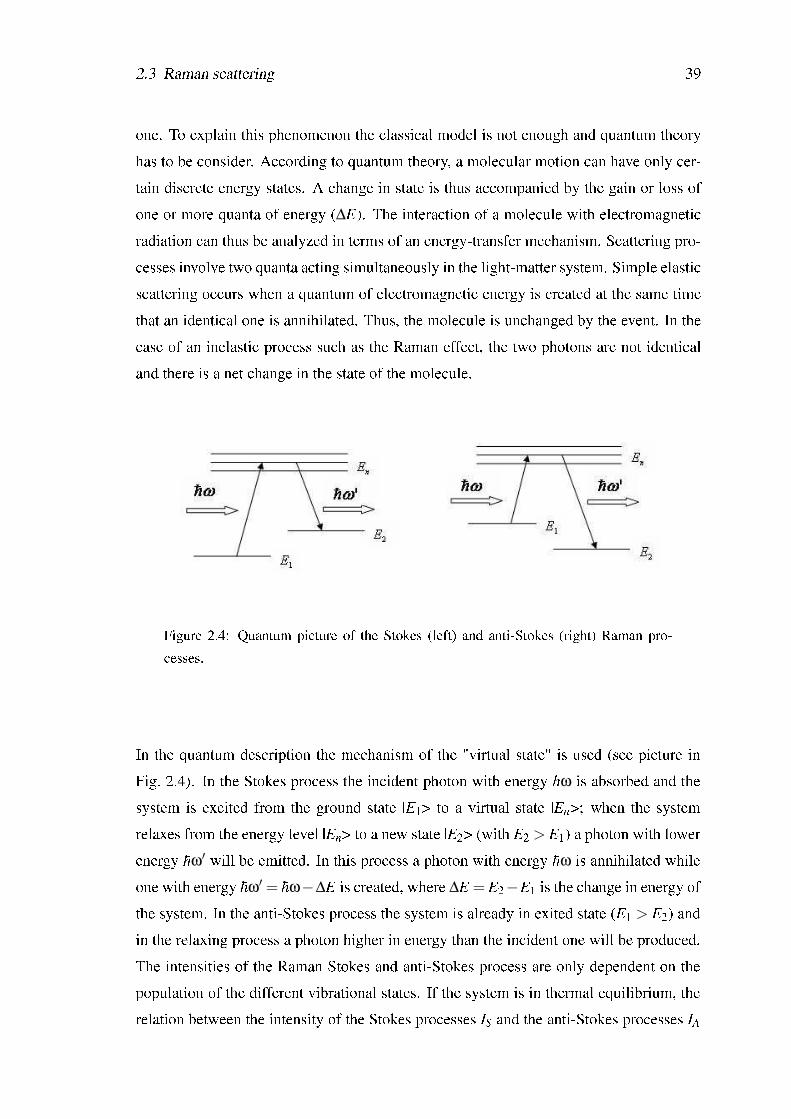
Figure 2.4: Quantum picture of the Stokes (left) and anti-Stokes (right) Raman pro-cesses.
In the quantum description the mechanism of the "virtual state" is used (see picture inFig. 2.4). In the Stokes process the incident photon with energy hω is absorbed and thesystem is excited from the ground state |E1> to a virtual state |En>; when the systemrelaxes from the energy level |En> to a new state |E2> (with E2 > E1) a photon with lowerenergy hω′ will be emitted. In this process a photon with energy hω is annihilated whileone with energy hω′ = hω−∆E is created, where ∆E = E2−E1 is the change in energy ofthe system. In the anti-Stokes process the system is already in exited state (E1 > E2) andin the relaxing process a photon higher in energy than the incident one will be produced.The intensities of the Raman Stokes and anti-Stokes process are only dependent on thepopulation of the different vibrational states. If the system is in thermal equilibrium, therelation between the intensity of the Stokes processes IS and the anti-Stokes processes IA
40 2. Experimental techniques
is given by the Boltzmann factor [42]:
IA/IS = exp(−∆E/kBT ). (2.23)
2.3.1 The Raman tensor
In a idealized case where the scattered light is parallel to the incident beam, the intensityof light scattered from a molecule is given by [42]:
I ∝ ω4s |~ε · α ·~ε′|2. (2.24)
ωs is the frequency of the scattered light, the unit vectors~ε and~ε′ dene the direction ofthe polarization of the exciting and scattered radiation, respectively, and α is the Ramanscattering tensor. The latter is composed of elements of the type
(αxy)i j =< ni|(αxy)0|n j >, (2.25)
where ni represents the ensemble of rotational and vibrational quantum numbers of theinitial state and n j those of the nal state involved in the transition. The quantity (αxy)0 isthe xy component of the electronic polarizability of the molecule in the electronic groundstate and can be written as:
(αxy)0 = Σn(< e0|µi|en >< en|µ j|e0 >
Ei−En + hω+
< e0|µ j|en >< en|µi|e0 >
E j−En + hω′). (2.26)
µ is the dipole moment of the molecule (see previous section 2.3), ω and ω′ are the fre-quencies of the incident and scattered light, Ei and E j are the energy associated with theinitial state and nal state of the molecule respectively. The sum is over all excited virtualstates of the system |en> with energy En. Equation 2.26 describes both Stokes (Ei<E j)and anti-Stokes (Ei>E j) process and the validity is limited by the following condition: theexcitation frequency ω must be higher than any vibrational transition but lower than anyelectronic transition. A vibrational mode is then Raman-active when the expression inequation 2.25 is different from zero.
2.4 High pressure technique 41
2.4 High pressure technique
The employment of diamond anvils in a high pressure cell (rst introduced in the 1950's)led to the development of a versatile and powerful instrument for generating pressure.Compared to classical piston cylinder devices, the Diamond Anvil Cell (DAC) is three orfour order of magnitude less massive and generates pressure one to two order of magni-tude higher than previous devices. Using the diamond anvil cell, extremely high pressurescan be easily reached. Moreover, owing to the diamond transparency to the electromag-netic radiation over a wide frequency range, it allows to study the matter properties as afunction of pressure with several spectroscopic techniques. The simplicity and compact-ness of the diamond anvil cell make it a tool that can easily be accommodated in a widevariety of experimental setups.
2.4.1 The Diamond Anvil Cell
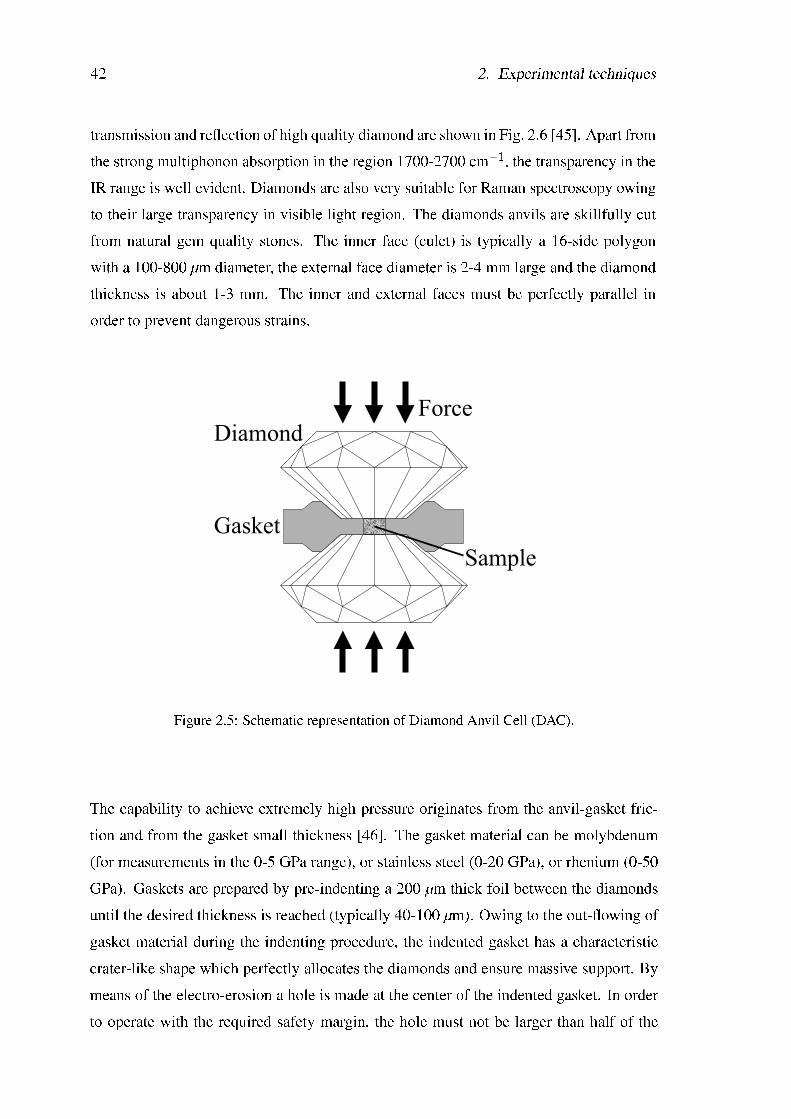
The working principle of a DAC is shown in Fig. 2.5 [43]. A metallic plate with a smallhole in the center is placed between two diamond anvils and a moderate force is exertedon the external faces of the diamonds. The hole is lled by the sample and the hydrostaticpressure transmitting medium. The ratio between the surface of the external and internalanvil faces multiplies the effect of the external force (by a large factor ∼ 103) leading tovery high pressure inside the hole. The metallic plate acts as a gasket and avoids anvilfailure and sample's lost. The friction between diamond and gasket exerts a force whichcompensates the internal pressure. The maximum pressure that can be reached with aDAC depends on several factors such as the dimensions of the diamond and of the hole,the material of the gasket, the diamond-gasket friction and the quality of the diamond.Pressure up to 10-20 GPa can be easily reached and with some technical implementationseven the range of ∼ 103 GPa has been obtained [44].
Diamond is suitable for anvils due to its hardness. Moreover, the transparency to theelectromagnetic radiation over a wide frequency range makes the diamond cell well-suitedfor several spectroscopic techniques such as infrared, Raman and X-ray diffraction. Thequality of diamonds depends on the impurities concentration or vacancies present in thecrystal. Diamonds are classied upon those parameters. Infrared spectroscopy requiresexpensive diamonds characterized by a low impurity level (Type IIa). The typical infrared
42 2. Experimental techniques
transmission and reection of high quality diamond are shown in Fig. 2.6 [45]. Apart fromthe strong multiphonon absorption in the region 1700-2700 cm−1, the transparency in theIR range is well evident. Diamonds are also very suitable for Raman spectroscopy owingto their large transparency in visible light region. The diamonds anvils are skillfully cutfrom natural gem quality stones. The inner face (culet) is typically a 16-side polygonwith a 100-800 µm diameter, the external face diameter is 2-4 mm large and the diamondthickness is about 1-3 mm. The inner and external faces must be perfectly parallel inorder to prevent dangerous strains.
Diamond
Gasket
Force
Sample
Figure 2.5: Schematic representation of Diamond Anvil Cell (DAC).
The capability to achieve extremely high pressure originates from the anvil-gasket fric-tion and from the gasket small thickness [46]. The gasket material can be molybdenum(for measurements in the 0-5 GPa range), or stainless steel (0-20 GPa), or rhenium (0-50GPa). Gaskets are prepared by pre-indenting a 200 µm thick foil between the diamondsuntil the desired thickness is reached (typically 40-100 µm). Owing to the out-owing ofgasket material during the indenting procedure, the indented gasket has a characteristiccrater-like shape which perfectly allocates the diamonds and ensure massive support. Bymeans of the electro-erosion a hole is made at the center of the indented gasket. In orderto operate with the required safety margin, the hole must not be larger than half of the
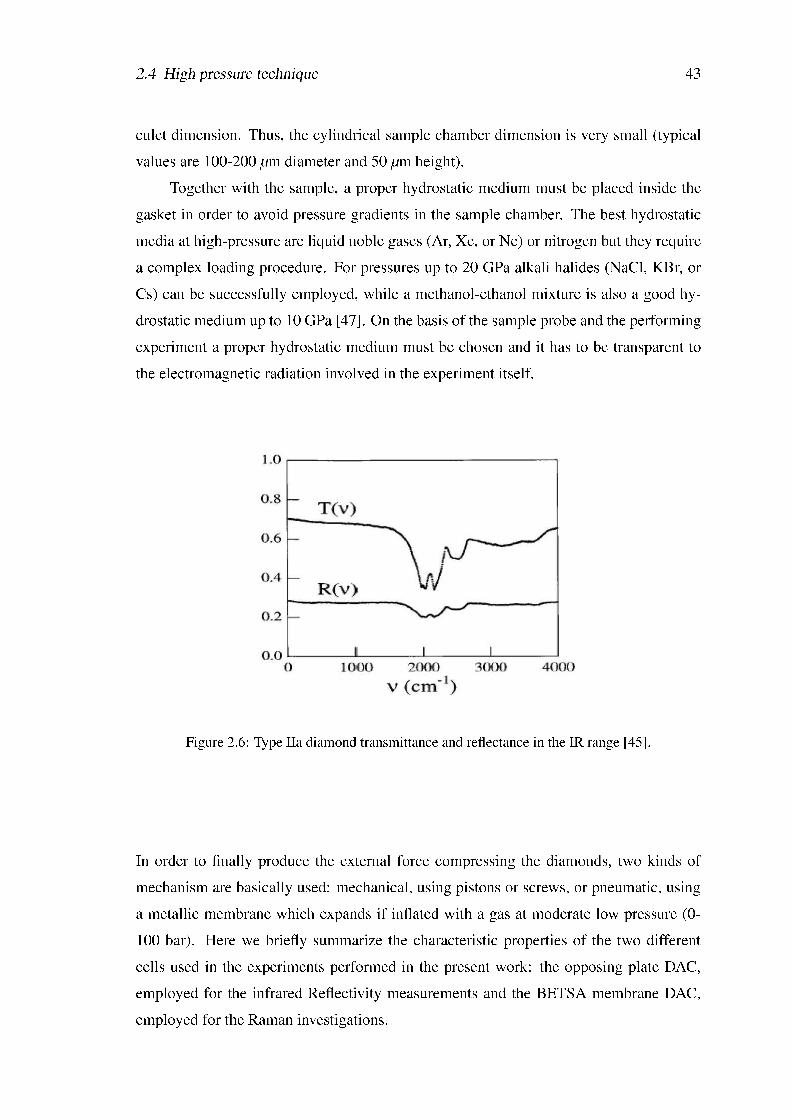
2.4 High pressure technique 43
culet dimension. Thus, the cylindrical sample chamber dimension is very small (typicalvalues are 100-200 µm diameter and 50 µm height).
Together with the sample, a proper hydrostatic medium must be placed inside thegasket in order to avoid pressure gradients in the sample chamber. The best hydrostaticmedia at high-pressure are liquid noble gases (Ar, Xe, or Ne) or nitrogen but they requirea complex loading procedure. For pressures up to 20 GPa alkali halides (NaCl, KBr, orCs) can be successfully employed, while a methanol-ethanol mixture is also a good hy-drostatic medium up to 10 GPa [47]. On the basis of the sample probe and the performingexperiment a proper hydrostatic medium must be chosen and it has to be transparent tothe electromagnetic radiation involved in the experiment itself.
Figure 2.6: Type IIa diamond transmittance and reectance in the IR range [45].
In order to nally produce the external force compressing the diamonds, two kinds ofmechanism are basically used: mechanical, using pistons or screws, or pneumatic, usinga metallic membrane which expands if inated with a gas at moderate low pressure (0-100 bar). Here we briey summarize the characteristic properties of the two differentcells used in the experiments performed in the present work: the opposing plate DAC,employed for the infrared Reectivity measurements and the BETSA membrane DAC,employed for the Raman investigations.
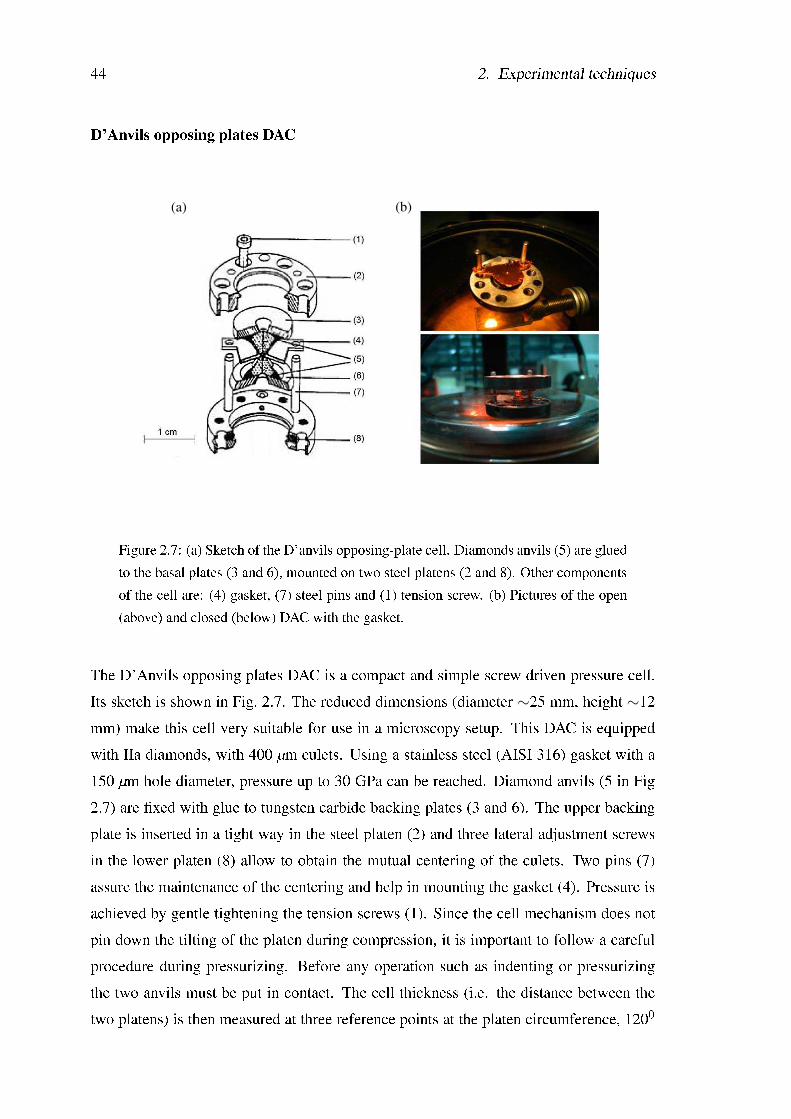
44 2. Experimental techniques
D'Anvils opposing plates DAC
(a) (b)
Figure 2.7: (a) Sketch of the D'anvils opposing-plate cell. Diamonds anvils (5) are gluedto the basal plates (3 and 6), mounted on two steel platens (2 and 8). Other componentsof the cell are: (4) gasket, (7) steel pins and (1) tension screw. (b) Pictures of the open(above) and closed (below) DAC with the gasket.
The D'Anvils opposing plates DAC is a compact and simple screw driven pressure cell.Its sketch is shown in Fig. 2.7. The reduced dimensions (diameter ∼25 mm, height ∼12mm) make this cell very suitable for use in a microscopy setup. This DAC is equippedwith IIa diamonds, with 400 µm culets. Using a stainless steel (AISI 316) gasket with a150 µm hole diameter, pressure up to 30 GPa can be reached. Diamond anvils (5 in Fig2.7) are xed with glue to tungsten carbide backing plates (3 and 6). The upper backingplate is inserted in a tight way in the steel platen (2) and three lateral adjustment screwsin the lower platen (8) allow to obtain the mutual centering of the culets. Two pins (7)assure the maintenance of the centering and help in mounting the gasket (4). Pressure isachieved by gentle tightening the tension screws (1). Since the cell mechanism does notpin down the tilting of the platen during compression, it is important to follow a carefulprocedure during pressurizing. Before any operation such as indenting or pressurizingthe two anvils must be put in contact. The cell thickness (i.e. the distance between thetwo platens) is then measured at three reference points at the platen circumference, 1200
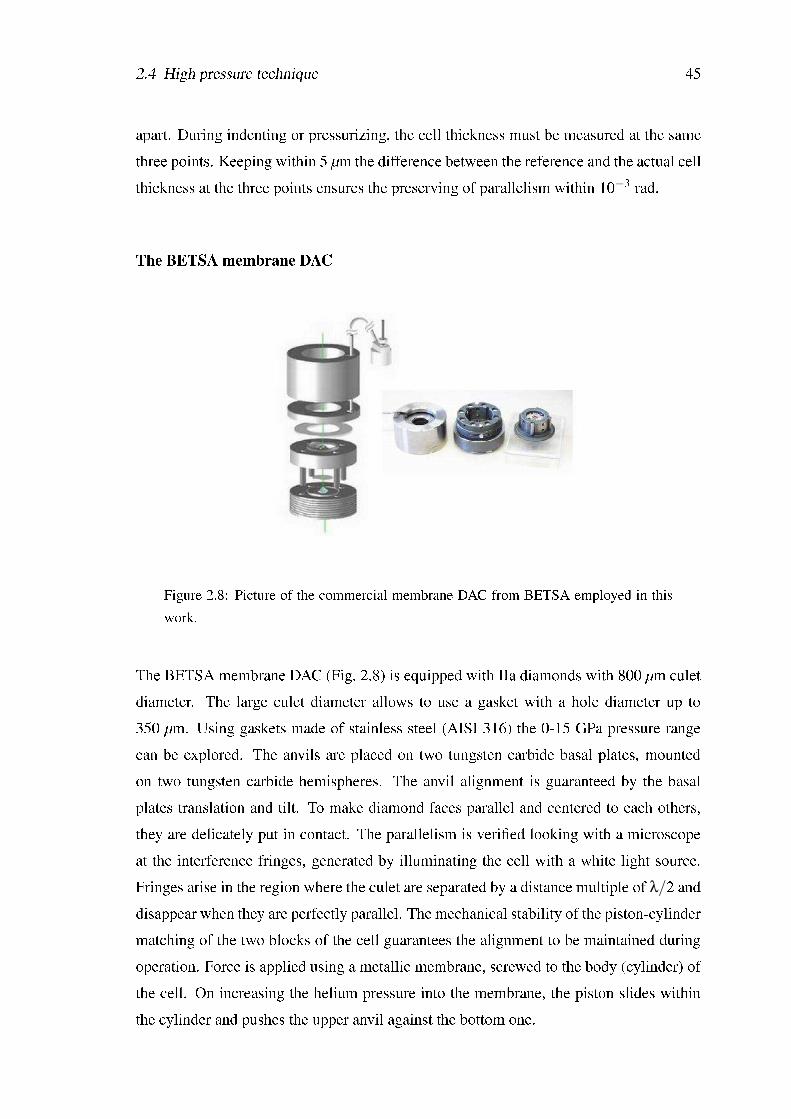
2.4 High pressure technique 45
apart. During indenting or pressurizing, the cell thickness must be measured at the samethree points. Keeping within 5 µm the difference between the reference and the actual cellthickness at the three points ensures the preserving of parallelism within 10−3 rad.
The BETSA membrane DAC
Figure 2.8: Picture of the commercial membrane DAC from BETSA employed in thiswork.
The BETSA membrane DAC (Fig. 2.8) is equipped with IIa diamonds with 800 µm culetdiameter. The large culet diameter allows to use a gasket with a hole diameter up to350 µm. Using gaskets made of stainless steel (AISI 316) the 0-15 GPa pressure rangecan be explored. The anvils are placed on two tungsten carbide basal plates, mountedon two tungsten carbide hemispheres. The anvil alignment is guaranteed by the basalplates translation and tilt. To make diamond faces parallel and centered to each others,they are delicately put in contact. The parallelism is veried looking with a microscopeat the interference fringes, generated by illuminating the cell with a white light source.Fringes arise in the region where the culet are separated by a distance multiple of λ/2 anddisappear when they are perfectly parallel. The mechanical stability of the piston-cylindermatching of the two blocks of the cell guarantees the alignment to be maintained duringoperation. Force is applied using a metallic membrane, screwed to the body (cylinder) ofthe cell. On increasing the helium pressure into the membrane, the piston slides withinthe cylinder and pushes the upper anvil against the bottom one.
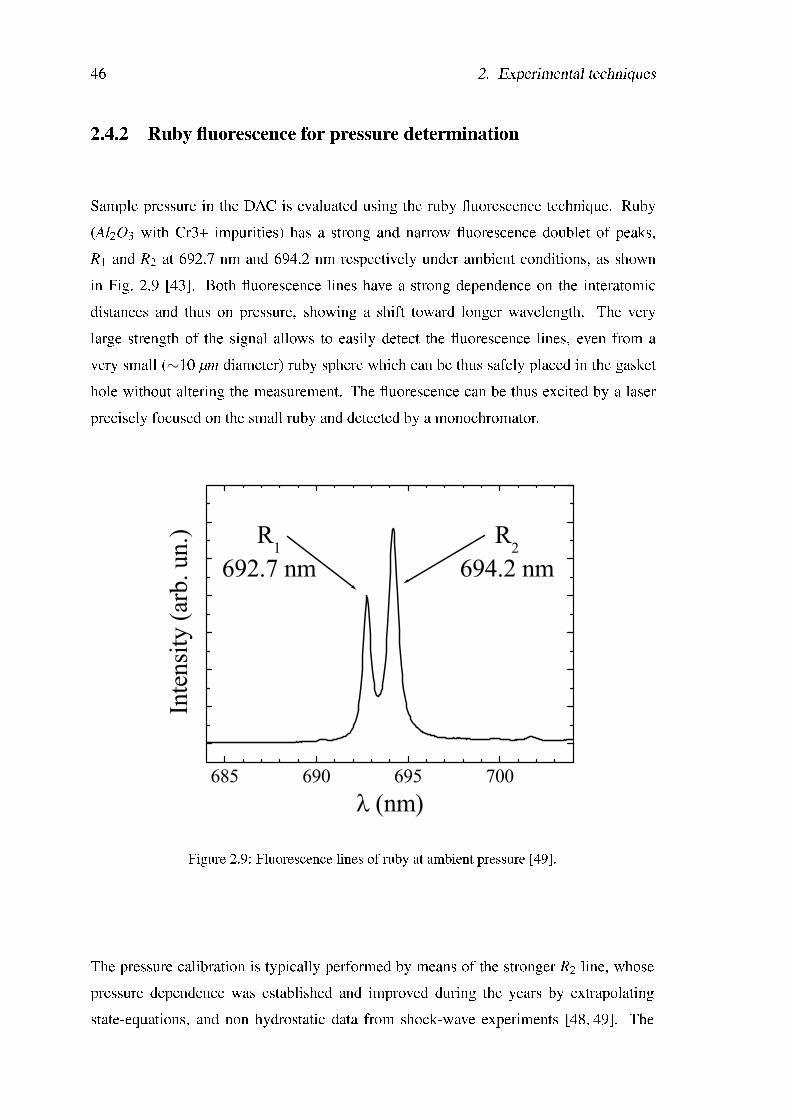
46 2. Experimental techniques
2.4.2 Ruby uorescence for pressure determination
Sample pressure in the DAC is evaluated using the ruby uorescence technique. Ruby(Al2O3 with Cr3+ impurities) has a strong and narrow uorescence doublet of peaks,R1 and R2 at 692.7 nm and 694.2 nm respectively under ambient conditions, as shownin Fig. 2.9 [43]. Both uorescence lines have a strong dependence on the interatomicdistances and thus on pressure, showing a shift toward longer wavelength. The verylarge strength of the signal allows to easily detect the uorescence lines, even from avery small (∼10 µm diameter) ruby sphere which can be thus safely placed in the gaskethole without altering the measurement. The uorescence can be thus excited by a laserprecisely focused on the small ruby and detected by a monochromator.
685 690 695 700
R2
694.2 nm
R1
692.7 nm
Inte
nsi
ty (
arb. un.)
(nm)
Figure 2.9: Fluorescence lines of ruby at ambient pressure [49].
The pressure calibration is typically performed by means of the stronger R2 line, whosepressure dependence was established and improved during the years by extrapolatingstate-equations, and non hydrostatic data from shock-wave experiments [48, 49]. The
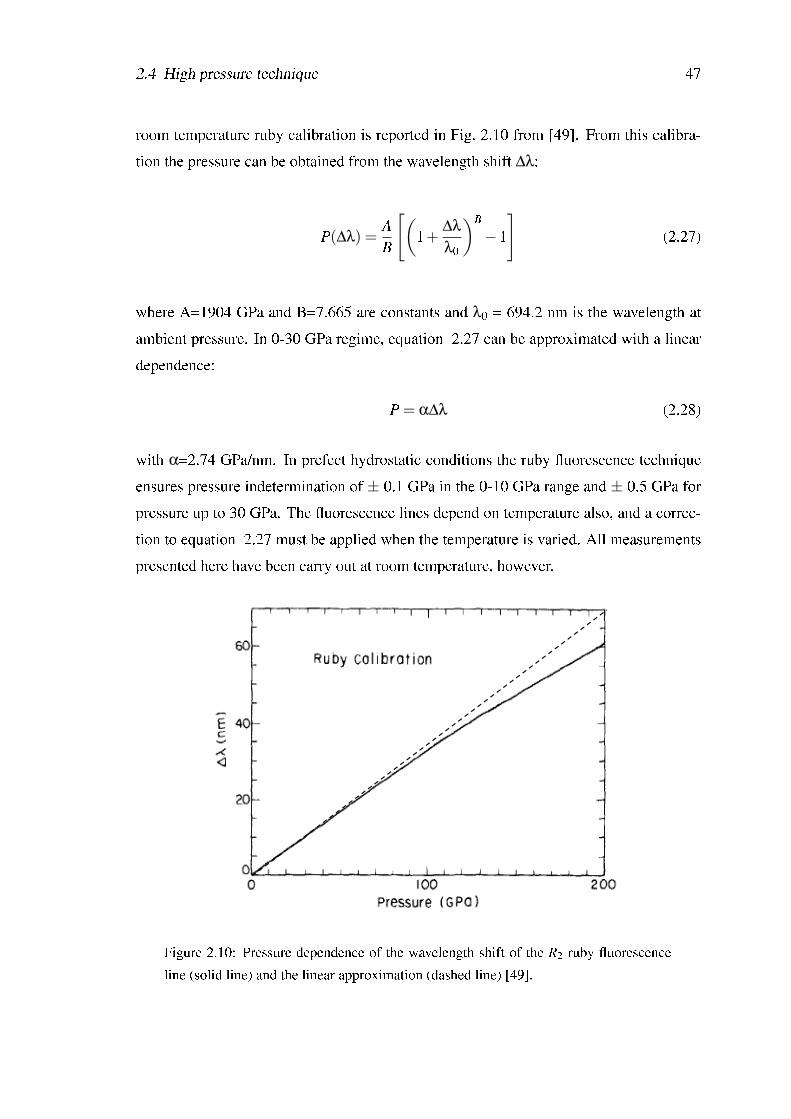
2.4 High pressure technique 47
room temperature ruby calibration is reported in Fig. 2.10 from [49]. From this calibra-tion the pressure can be obtained from the wavelength shift ∆λ:
P(∆λ) =AB
[(1+
∆λλ0
)B−1
](2.27)
where A=1904 GPa and B=7.665 are constants and λ0 = 694.2 nm is the wavelength atambient pressure. In 0-30 GPa regime, equation 2.27 can be approximated with a lineardependence:
P = α∆λ (2.28)
with α=2.74 GPa/nm. In prefect hydrostatic conditions the ruby uorescence techniqueensures pressure indetermination of ± 0.1 GPa in the 0-10 GPa range and ± 0.5 GPa forpressure up to 30 GPa. The uorescence lines depend on temperature also, and a correc-tion to equation 2.27 must be applied when the temperature is varied. All measurementspresented here have been carry out at room temperature, however.
Figure 2.10: Pressure dependence of the wavelength shift of the R2 ruby uorescenceline (solid line) and the linear approximation (dashed line) [49].
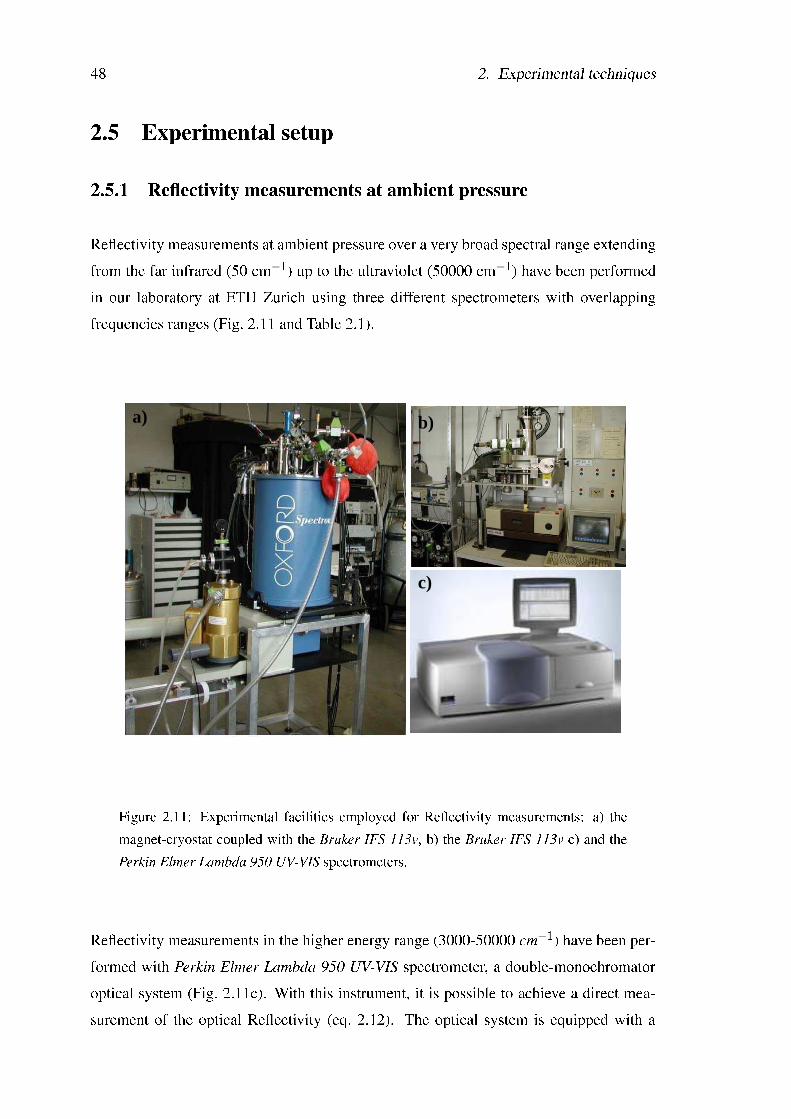
48 2. Experimental techniques
2.5 Experimental setup
2.5.1 Reectivity measurements at ambient pressure
Reectivity measurements at ambient pressure over a very broad spectral range extendingfrom the far infrared (50 cm−1) up to the ultraviolet (50000 cm−1) have been performedin our laboratory at ETH Zurich using three different spectrometers with overlappingfrequencies ranges (Fig. 2.11 and Table 2.1).
b)
c)
a)
Figure 2.11: Experimental facilities employed for Reectivity measurements: a) themagnet-cryostat coupled with the Bruker IFS 113v, b) the Bruker IFS 113v c) and thePerkin Elmer Lambda 950 UV-VIS spectrometers.
Reectivity measurements in the higher energy range (3000-50000 cm−1) have been per-formed with Perkin Elmer Lambda 950 UV-VIS spectrometer, a double-monochromatoroptical system (Fig. 2.11c). With this instrument, it is possible to achieve a direct mea-surement of the optical Reectivity (eq. 2.12). The optical system is equipped with a
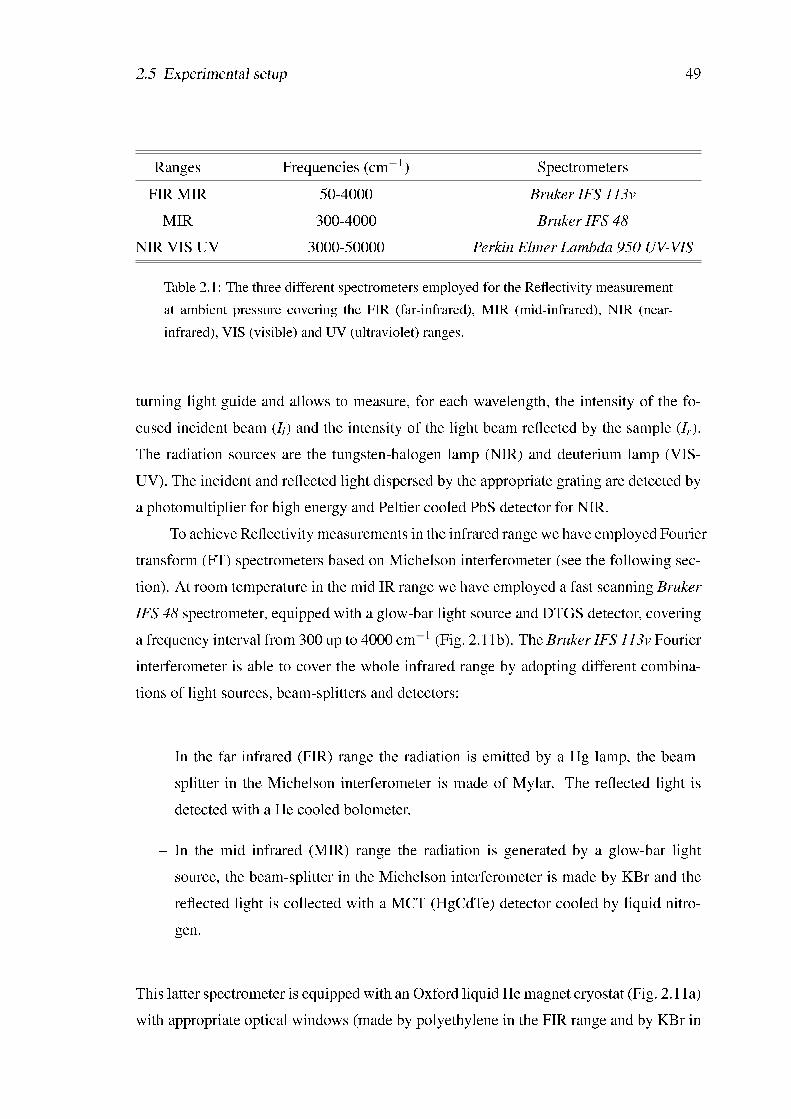
2.5 Experimental setup 49
Ranges Frequencies (cm−1) SpectrometersFIR MIR 50-4000 Bruker IFS 113v
MIR 300-4000 Bruker IFS 48NIR VIS UV 3000-50000 Perkin Elmer Lambda 950 UV-VIS
Table 2.1: The three different spectrometers employed for the Reectivity measurementat ambient pressure covering the FIR (far-infrared), MIR (mid-infrared), NIR (near-infrared), VIS (visible) and UV (ultraviolet) ranges.
turning light guide and allows to measure, for each wavelength, the intensity of the fo-cused incident beam (Ii) and the intensity of the light beam reected by the sample (Ir).The radiation sources are the tungsten-halogen lamp (NIR) and deuterium lamp (VIS-UV). The incident and reected light dispersed by the appropriate grating are detected bya photomultiplier for high energy and Peltier cooled PbS detector for NIR.
To achieve Reectivity measurements in the infrared range we have employed Fouriertransform (FT) spectrometers based on Michelson interferometer (see the following sec-tion). At room temperature in the mid IR range we have employed a fast scanning BrukerIFS 48 spectrometer, equipped with a glow-bar light source and DTGS detector, coveringa frequency interval from 300 up to 4000 cm−1 (Fig. 2.11b). The Bruker IFS 113v Fourierinterferometer is able to cover the whole infrared range by adopting different combina-tions of light sources, beam-splitters and detectors:
In the far infrared (FIR) range the radiation is emitted by a Hg lamp, the beam-splitter in the Michelson interferometer is made of Mylar. The reected light isdetected with a He cooled bolometer.
In the mid infrared (MIR) range the radiation is generated by a glow-bar lightsource, the beam-splitter in the Michelson interferometer is made by KBr and thereected light is collected with a MCT (HgCdTe) detector cooled by liquid nitro-gen.
This latter spectrometer is equipped with an Oxford liquid He magnet cryostat (Fig. 2.11a)with appropriate optical windows (made by polyethylene in the FIR range and by KBr in
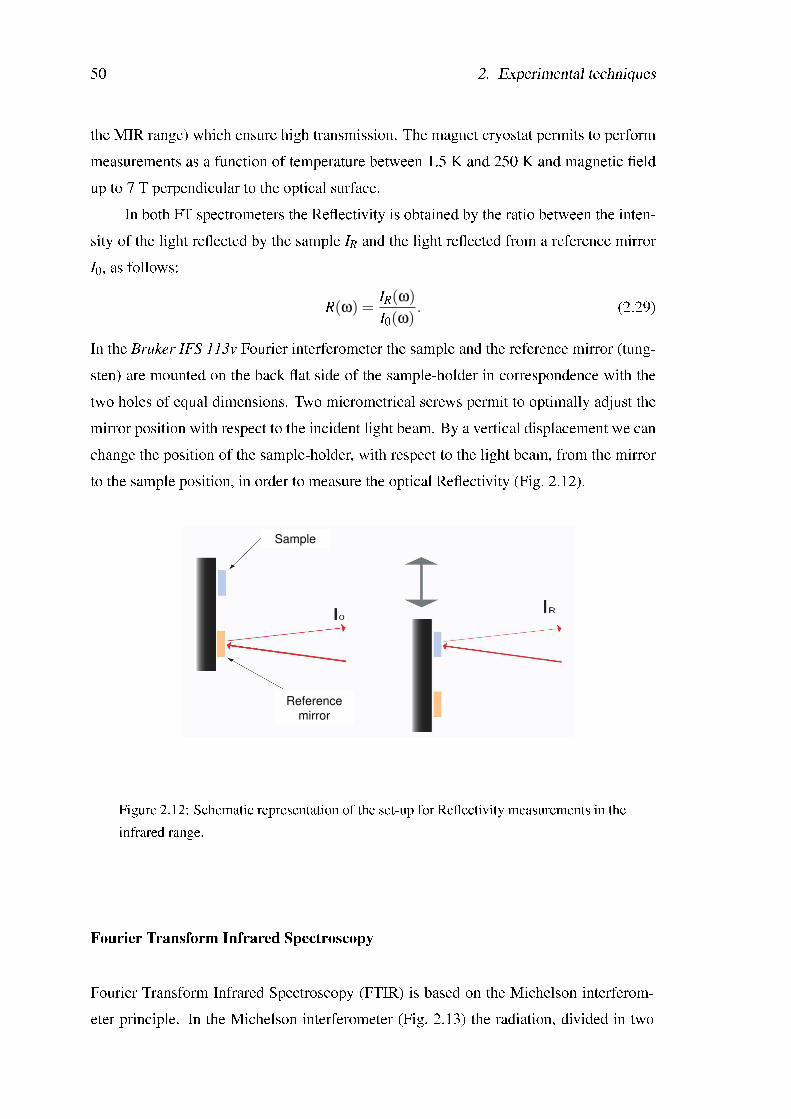
50 2. Experimental techniques
the MIR range) which ensure high transmission. The magnet cryostat permits to performmeasurements as a function of temperature between 1.5 K and 250 K and magnetic eldup to 7 T perpendicular to the optical surface.
In both FT spectrometers the Reectivity is obtained by the ratio between the inten-sity of the light reected by the sample IR and the light reected from a reference mirrorI0, as follows:
R(ω) =IR(ω)I0(ω)
. (2.29)
In the Bruker IFS 113v Fourier interferometer the sample and the reference mirror (tung-sten) are mounted on the back at side of the sample-holder in correspondence with thetwo holes of equal dimensions. Two micrometrical screws permit to optimally adjust themirror position with respect to the incident light beam. By a vertical displacement we canchange the position of the sample-holder, with respect to the light beam, from the mirrorto the sample position, in order to measure the optical Reectivity (Fig. 2.12).
Reference
mirror
Sample
Figure 2.12: Schematic representation of the set-up for Reectivity measurements in theinfrared range.
Fourier Transform Infrared Spectroscopy
Fourier Transform Infrared Spectroscopy (FTIR) is based on the Michelson interferom-eter principle. In the Michelson interferometer (Fig. 2.13) the radiation, divided in two
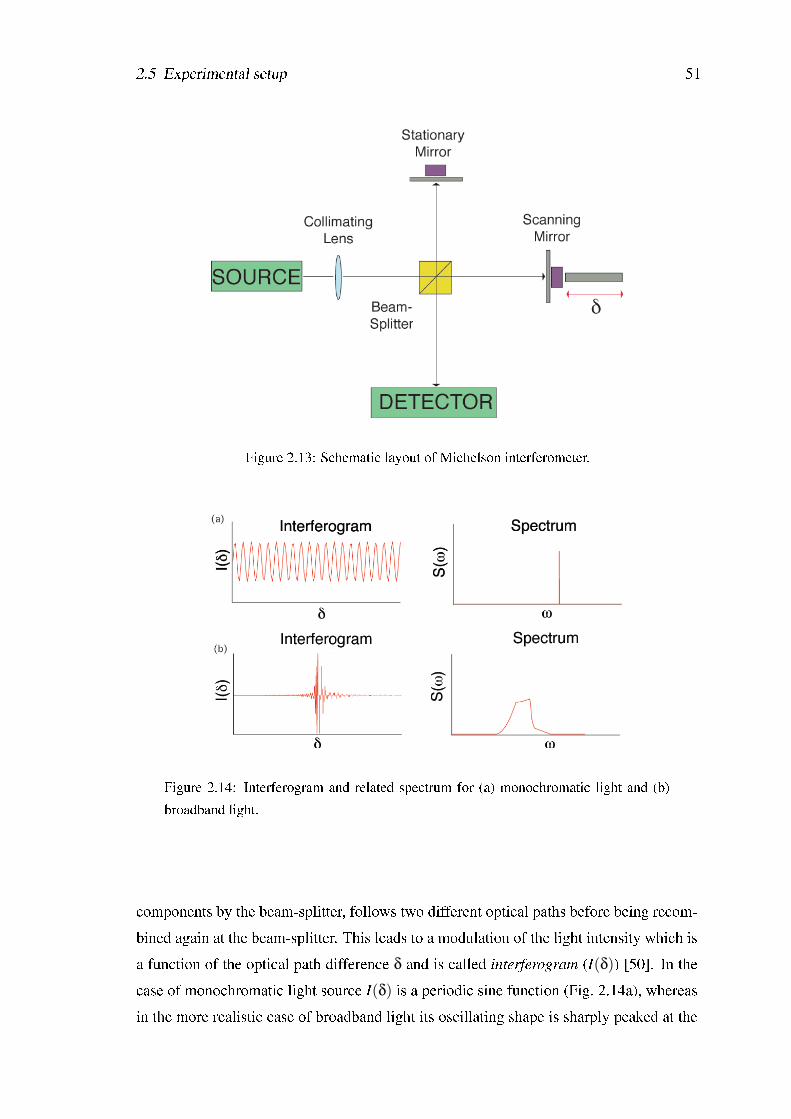
2.5 Experimental setup 51
Figure 2.13: Schematic layout of Michelson interferometer.
Figure 2.14: Interferogram and related spectrum for (a) monochromatic light and (b)broadband light.
components by the beam-splitter, follows two different optical paths before being recom-bined again at the beam-splitter. This leads to a modulation of the light intensity which isa function of the optical path difference δ and is called interferogram (I(δ)) [50]. In thecase of monochromatic light source I(δ) is a periodic sine function (Fig. 2.14a), whereasin the more realistic case of broadband light its oscillating shape is sharply peaked at the
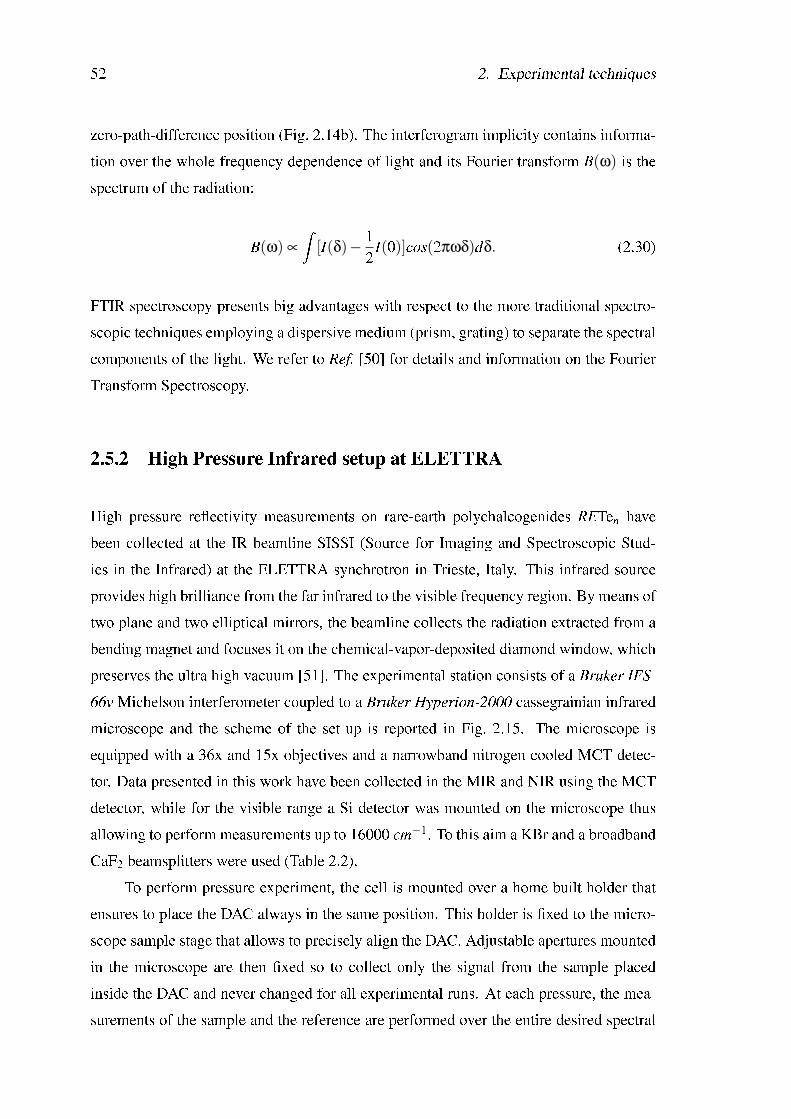
52 2. Experimental techniques
zero-path-difference position (Fig. 2.14b). The interferogram implicity contains informa-tion over the whole frequency dependence of light and its Fourier transform B(ω) is thespectrum of the radiation:
B(ω) ∝Z
[I(δ)− 12 I(0)]cos(2πωδ)dδ. (2.30)
FTIR spectroscopy presents big advantages with respect to the more traditional spectro-scopic techniques employing a dispersive medium (prism, grating) to separate the spectralcomponents of the light. We refer to Ref. [50] for details and information on the FourierTransform Spectroscopy.
2.5.2 High Pressure Infrared setup at ELETTRA
High pressure reectivity measurements on rare-earth polychalcogenides RETen havebeen collected at the IR beamline SISSI (Source for Imaging and Spectroscopic Stud-ies in the Infrared) at the ELETTRA synchrotron in Trieste, Italy. This infrared sourceprovides high brilliance from the far infrared to the visible frequency region. By means oftwo plane and two elliptical mirrors, the beamline collects the radiation extracted from abending magnet and focuses it on the chemical-vapor-deposited diamond window, whichpreserves the ultra high vacuum [51]. The experimental station consists of a Bruker IFS-66v Michelson interferometer coupled to a Bruker Hyperion-2000 cassegrainian infraredmicroscope and the scheme of the set-up is reported in Fig. 2.15. The microscope isequipped with a 36x and 15x objectives and a narrowband nitrogen cooled MCT detec-tor. Data presented in this work have been collected in the MIR and NIR using the MCTdetector, while for the visible range a Si detector was mounted on the microscope thusallowing to perform measurements up to 16000 cm−1. To this aim a KBr and a broadbandCaF2 beamsplitters were used (Table 2.2).
To perform pressure experiment, the cell is mounted over a home built holder thatensures to place the DAC always in the same position. This holder is xed to the micro-scope sample stage that allows to precisely align the DAC. Adjustable apertures mountedin the microscope are then xed so to collect only the signal from the sample placedinside the DAC and never changed for all experimental runs. At each pressure, the mea-surements of the sample and the reference are performed over the entire desired spectral
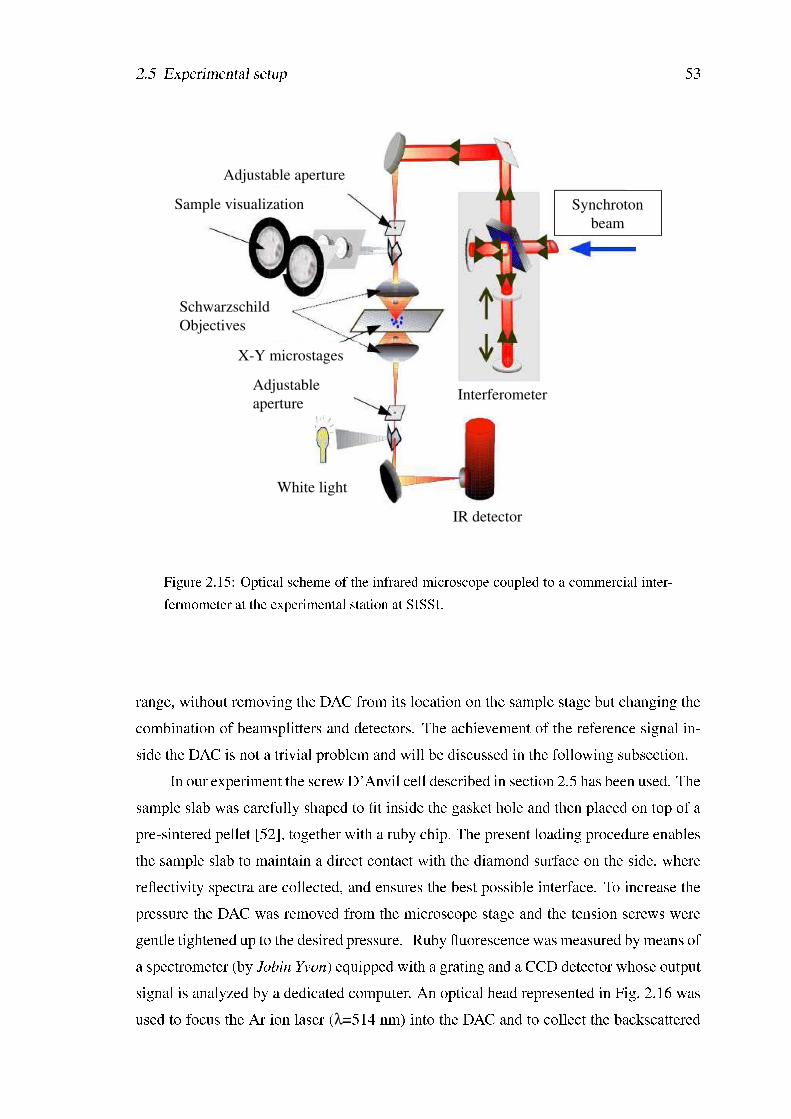
2.5 Experimental setup 53
IR detector
White light
Adjustable
aperture
X-Y microstages
Schwarzschild
Objectives
Interferometer
Sample visualization
Adjustable aperture
Synchroton
beam
Figure 2.15: Optical scheme of the infrared microscope coupled to a commercial inter-fermometer at the experimental station at SISSI.
range, without removing the DAC from its location on the sample stage but changing thecombination of beamsplitters and detectors. The achievement of the reference signal in-side the DAC is not a trivial problem and will be discussed in the following subsection.
In our experiment the screw D'Anvil cell described in section 2.5 has been used. Thesample slab was carefully shaped to t inside the gasket hole and then placed on top of apre-sintered pellet [52], together with a ruby chip. The present loading procedure enablesthe sample slab to maintain a direct contact with the diamond surface on the side, wherereectivity spectra are collected, and ensures the best possible interface. To increase thepressure the DAC was removed from the microscope stage and the tension screws weregentle tightened up to the desired pressure. Ruby uorescence was measured by means ofa spectrometer (by Jobin Yvon) equipped with a grating and a CCD detector whose outputsignal is analyzed by a dedicated computer. An optical head represented in Fig. 2.16 wasused to focus the Ar ion laser (λ=514 nm) into the DAC and to collect the backscattered
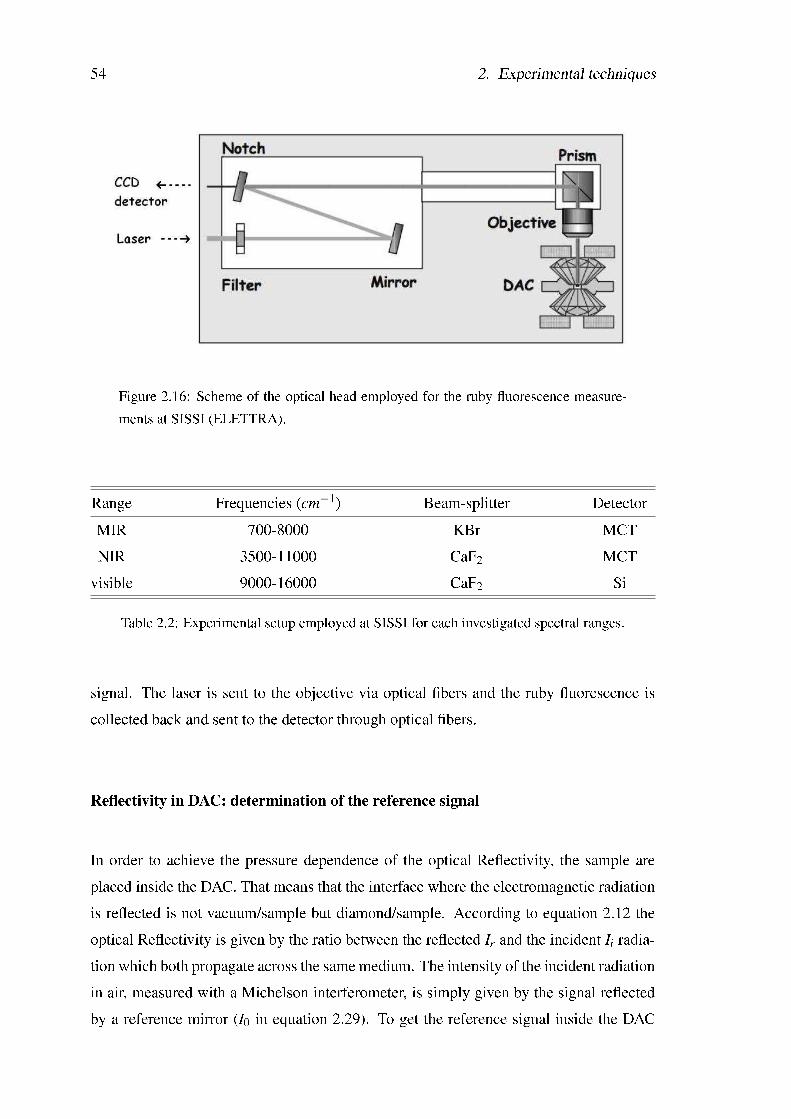
54 2. Experimental techniques
Figure 2.16: Scheme of the optical head employed for the ruby uorescence measure-ments at SISSI (ELETTRA).
Range Frequencies (cm−1) Beam-splitter DetectorMIR 700-8000 KBr MCTNIR 3500-11000 CaF2 MCT
visible 9000-16000 CaF2 Si
Table 2.2: Experimental setup employed at SISSI for each investigated spectral ranges.
signal. The laser is sent to the objective via optical bers and the ruby uorescence iscollected back and sent to the detector through optical bers.
Reectivity in DAC: determination of the reference signal
In order to achieve the pressure dependence of the optical Reectivity, the sample areplaced inside the DAC. That means that the interface where the electromagnetic radiationis reected is not vacuum/sample but diamond/sample. According to equation 2.12 theoptical Reectivity is given by the ratio between the reected Ir and the incident Ii radia-tion which both propagate across the same medium. The intensity of the incident radiationin air, measured with a Michelson interferometer, is simply given by the signal reectedby a reference mirror (I0 in equation 2.29). To get the reference signal inside the DAC
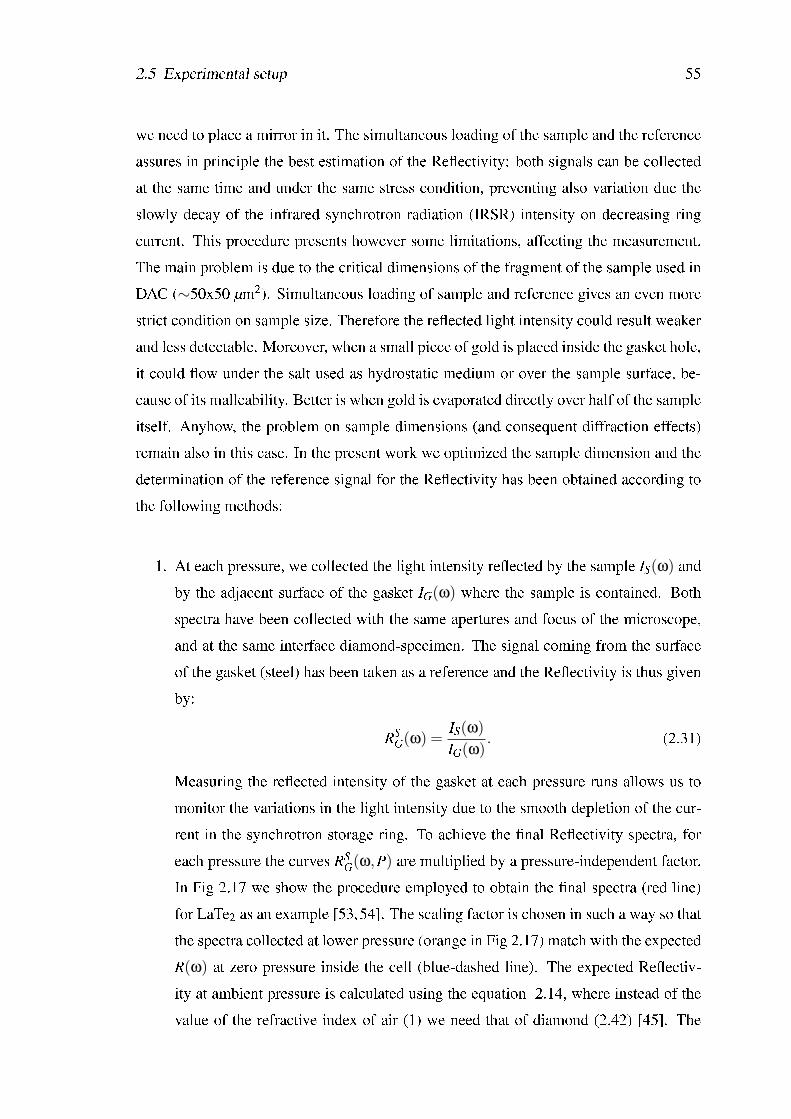
2.5 Experimental setup 55
we need to place a mirror in it. The simultaneous loading of the sample and the referenceassures in principle the best estimation of the Reectivity: both signals can be collectedat the same time and under the same stress condition, preventing also variation due theslowly decay of the infrared synchrotron radiation (IRSR) intensity on decreasing ringcurrent. This procedure presents however some limitations, affecting the measurement.The main problem is due to the critical dimensions of the fragment of the sample used inDAC (∼50x50 µm2). Simultaneous loading of sample and reference gives an even morestrict condition on sample size. Therefore the reected light intensity could result weakerand less detectable. Moreover, when a small piece of gold is placed inside the gasket hole,it could ow under the salt used as hydrostatic medium or over the sample surface, be-cause of its malleability. Better is when gold is evaporated directly over half of the sampleitself. Anyhow, the problem on sample dimensions (and consequent diffraction effects)remain also in this case. In the present work we optimized the sample dimension and thedetermination of the reference signal for the Reectivity has been obtained according tothe following methods:
1. At each pressure, we collected the light intensity reected by the sample IS(ω) andby the adjacent surface of the gasket IG(ω) where the sample is contained. Bothspectra have been collected with the same apertures and focus of the microscope,and at the same interface diamond-specimen. The signal coming from the surfaceof the gasket (steel) has been taken as a reference and the Reectivity is thus givenby:
RSG(ω) =
IS(ω)IG(ω)
. (2.31)
Measuring the reected intensity of the gasket at each pressure runs allows us tomonitor the variations in the light intensity due to the smooth depletion of the cur-rent in the synchrotron storage ring. To achieve the nal Reectivity spectra, foreach pressure the curves RS
G(ω,P) are multiplied by a pressure-independent factor.In Fig 2.17 we show the procedure employed to obtain the nal spectra (red line)for LaTe2 as an example [53,54]. The scaling factor is chosen in such a way so thatthe spectra collected at lower pressure (orange in Fig 2.17) match with the expectedR(ω) at zero pressure inside the cell (blue-dashed line). The expected Reectiv-ity at ambient pressure is calculated using the equation 2.14, where instead of thevalue of the refractive index of air (1) we need that of diamond (2.42) [45]. The
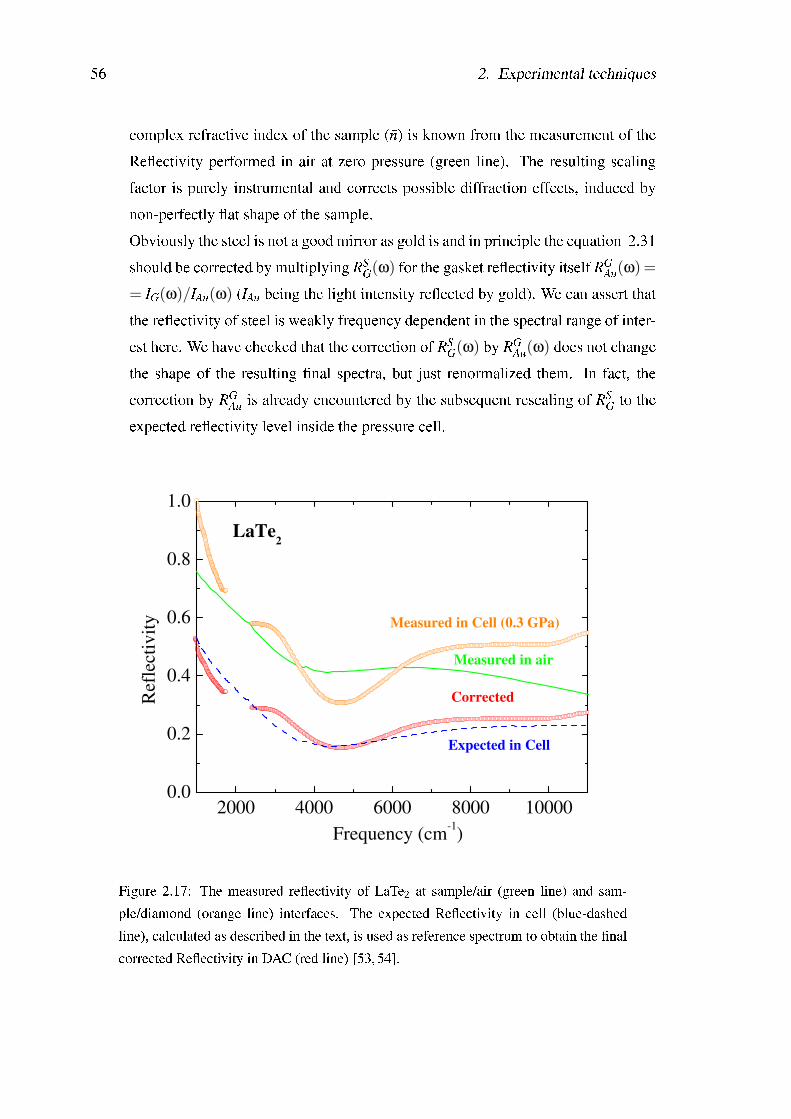
56 2. Experimental techniques
complex refractive index of the sample ( n) is known from the measurement of theReectivity performed in air at zero pressure (green line). The resulting scalingfactor is purely instrumental and corrects possible diffraction effects, induced bynon-perfectly at shape of the sample.Obviously the steel is not a good mirror as gold is and in principle the equation 2.31should be corrected by multiplying RS
G(ω) for the gasket reectivity itself RGAu(ω) =
= IG(ω)/IAu(ω) (IAu being the light intensity reected by gold). We can assert thatthe reectivity of steel is weakly frequency dependent in the spectral range of inter-est here. We have checked that the correction of RS
G(ω) by RGAu(ω) does not change
the shape of the resulting nal spectra, but just renormalized them. In fact, thecorrection by RG
Au is already encountered by the subsequent rescaling of RSG to the
expected reectivity level inside the pressure cell.
2000 4000 6000 8000 100000.0
0.2
0.4
0.6
0.8
1.0
Corrected
LaTe2
Measured in Cell (0.3 GPa)
Measured in air
Expected in Cell
Frequency (cm-1)
Ref
lect
ivit
y
Figure 2.17: The measured reectivity of LaTe2 at sample/air (green line) and sam-ple/diamond (orange line) interfaces. The expected Reectivity in cell (blue-dashedline), calculated as described in the text, is used as reference spectrum to obtain the nalcorrected Reectivity in DAC (red line) [53, 54].
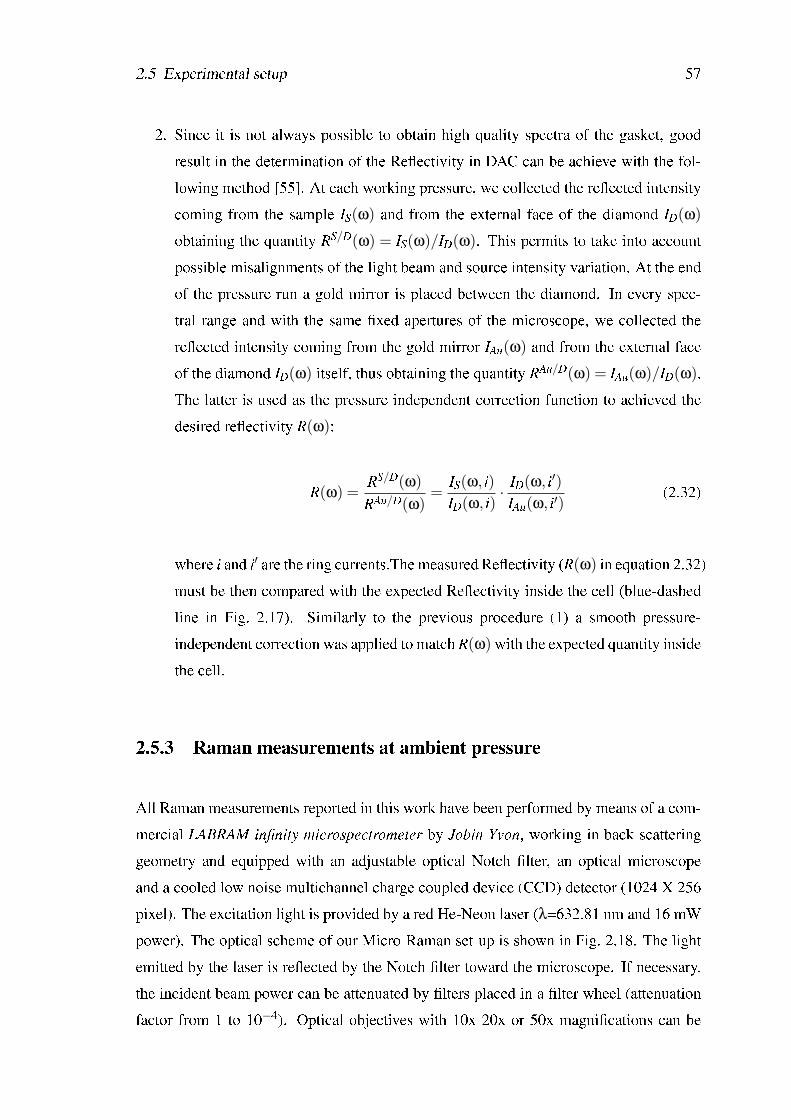
2.5 Experimental setup 57
2. Since it is not always possible to obtain high quality spectra of the gasket, goodresult in the determination of the Reectivity in DAC can be achieve with the fol-lowing method [55]. At each working pressure, we collected the reected intensitycoming from the sample IS(ω) and from the external face of the diamond ID(ω)
obtaining the quantity RS/D(ω) = IS(ω)/ID(ω). This permits to take into accountpossible misalignments of the light beam and source intensity variation. At the endof the pressure run a gold mirror is placed between the diamond. In every spec-tral range and with the same xed apertures of the microscope, we collected thereected intensity coming from the gold mirror IAu(ω) and from the external faceof the diamond ID(ω) itself, thus obtaining the quantity RAu/D(ω) = IAu(ω)/ID(ω).The latter is used as the pressure independent correction function to achieved thedesired reectivity R(ω):
R(ω) =RS/D(ω)RAu/D(ω)
=IS(ω, i)ID(ω, i) ·
ID(ω, i′)IAu(ω, i′) (2.32)
where i and i′ are the ring currents.The measured Reectivity (R(ω) in equation 2.32)must be then compared with the expected Reectivity inside the cell (blue-dashedline in Fig. 2.17). Similarly to the previous procedure (1) a smooth pressure-independent correction was applied to match R(ω) with the expected quantity insidethe cell.
2.5.3 Raman measurements at ambient pressure
All Raman measurements reported in this work have been performed by means of a com-mercial LABRAM-innity microspectrometer by Jobin Yvon, working in back-scatteringgeometry and equipped with an adjustable optical Notch lter, an optical microscopeand a cooled low noise multichannel charge coupled device (CCD) detector (1024 X 256pixel). The excitation light is provided by a red He-Neon laser (λ=632.81 nm and 16 mWpower). The optical scheme of our Micro-Raman set-up is shown in Fig. 2.18. The lightemitted by the laser is reected by the Notch lter toward the microscope. If necessary,the incident beam power can be attenuated by lters placed in a lter wheel (attenuationfactor from 1 to 10−4). Optical objectives with 10x 20x or 50x magnications can be
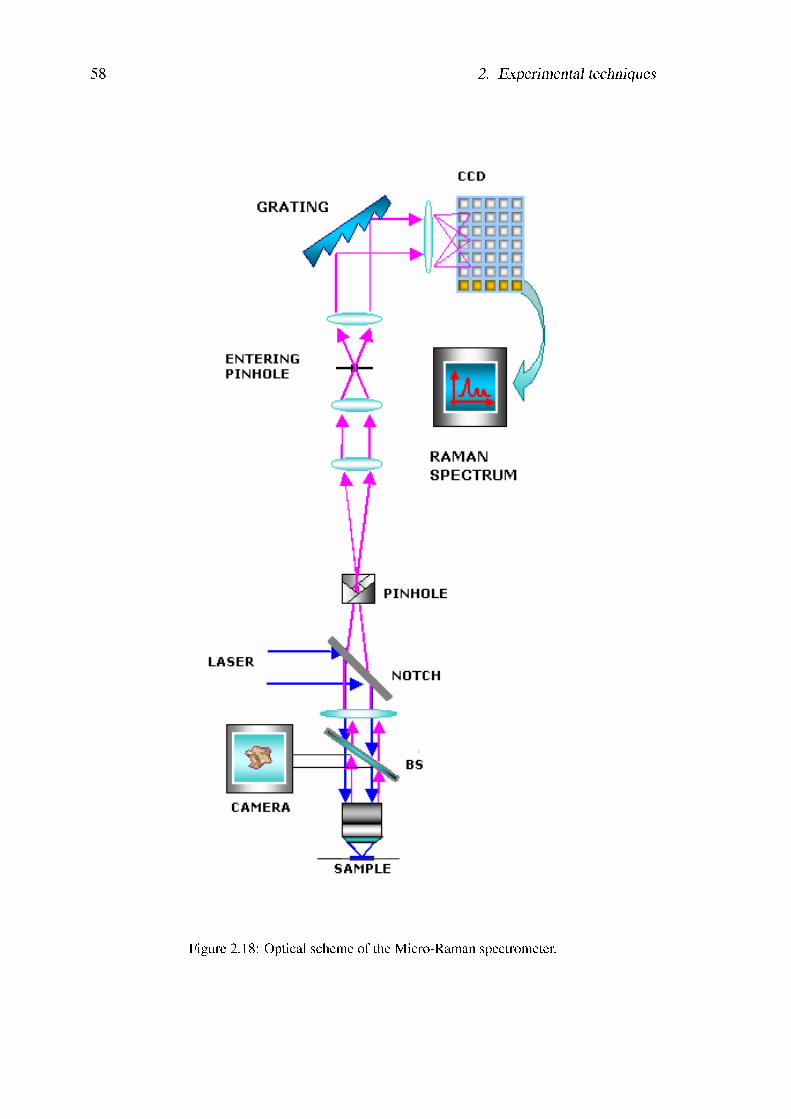
58 2. Experimental techniques
Figure 2.18: Optical scheme of the Micro-Raman spectrometer.
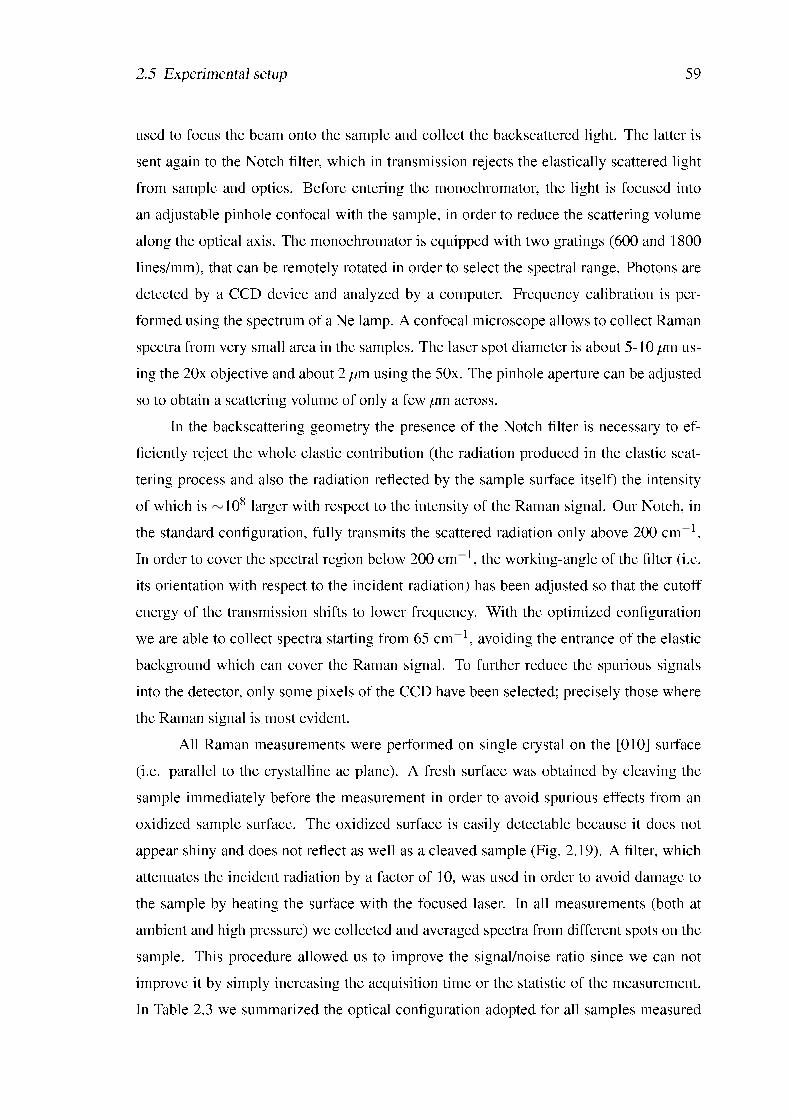
2.5 Experimental setup 59
used to focus the beam onto the sample and collect the backscattered light. The latter issent again to the Notch lter, which in transmission rejects the elastically scattered lightfrom sample and optics. Before entering the monochromator, the light is focused intoan adjustable pinhole confocal with the sample, in order to reduce the scattering volumealong the optical axis. The monochromator is equipped with two gratings (600 and 1800lines/mm), that can be remotely rotated in order to select the spectral range. Photons aredetected by a CCD device and analyzed by a computer. Frequency calibration is per-formed using the spectrum of a Ne lamp. A confocal microscope allows to collect Ramanspectra from very small area in the samples. The laser spot diameter is about 5-10 µm us-ing the 20x objective and about 2 µm using the 50x. The pinhole aperture can be adjustedso to obtain a scattering volume of only a few µm across.
In the backscattering geometry the presence of the Notch lter is necessary to ef-ciently reject the whole elastic contribution (the radiation produced in the elastic scat-tering process and also the radiation reected by the sample surface itself) the intensityof which is ∼108 larger with respect to the intensity of the Raman signal. Our Notch, inthe standard conguration, fully transmits the scattered radiation only above 200 cm−1.In order to cover the spectral region below 200 cm−1, the working-angle of the lter (i.e.its orientation with respect to the incident radiation) has been adjusted so that the cutoffenergy of the transmission shifts to lower frequency. With the optimized congurationwe are able to collect spectra starting from 65 cm−1, avoiding the entrance of the elasticbackground which can cover the Raman signal. To further reduce the spurious signalsinto the detector, only some pixels of the CCD have been selected; precisely those wherethe Raman signal is most evident.
All Raman measurements were performed on single crystal on the [010] surface(i.e. parallel to the crystalline ac plane). A fresh surface was obtained by cleaving thesample immediately before the measurement in order to avoid spurious effects from anoxidized sample surface. The oxidized surface is easily detectable because it does notappear shiny and does not reect as well as a cleaved sample (Fig. 2.19). A lter, whichattenuates the incident radiation by a factor of 10, was used in order to avoid damage tothe sample by heating the surface with the focused laser. In all measurements (both atambient and high pressure) we collected and averaged spectra from different spots on thesample. This procedure allowed us to improve the signal/noise ratio since we can notimprove it by simply increasing the acquisition time or the statistic of the measurement.In Table 2.3 we summarized the optical conguration adopted for all samples measured
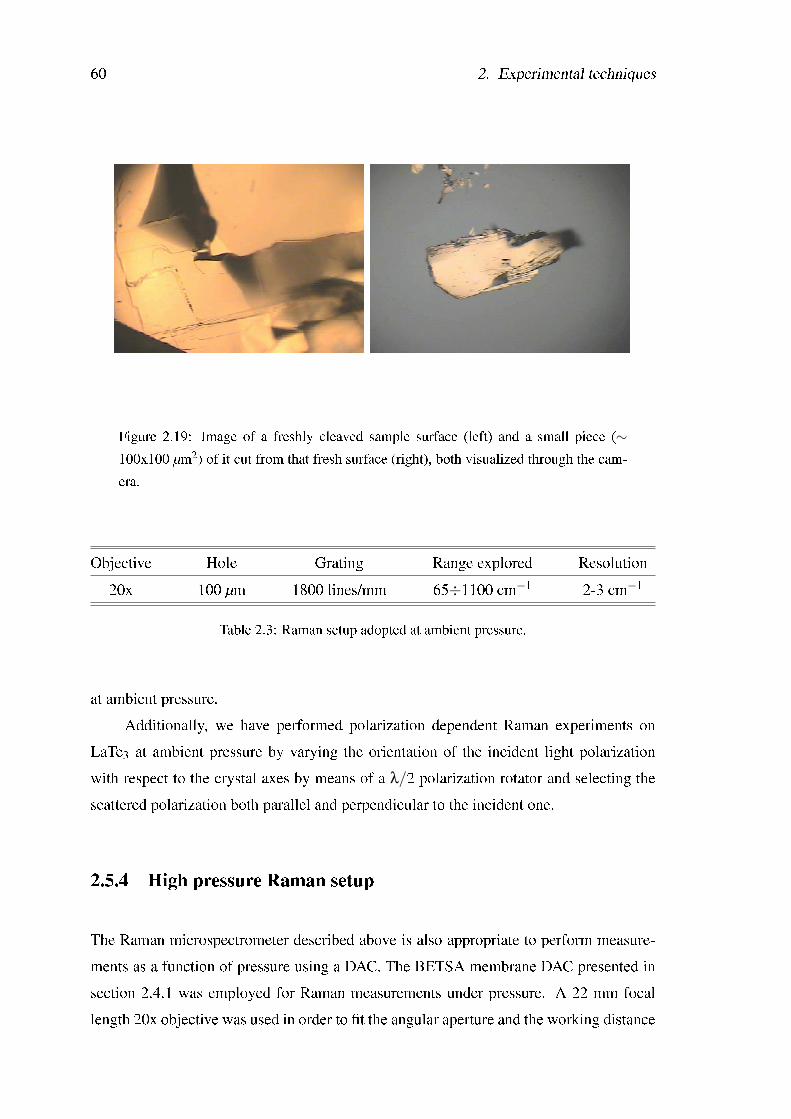
60 2. Experimental techniques
Figure 2.19: Image of a freshly cleaved sample surface (left) and a small piece (∼100x100 µm2) of it cut from that fresh surface (right), both visualized through the cam-era.
Objective Hole Grating Range explored Resolution20x 100 µm 1800 lines/mm 65÷1100 cm−1 2-3 cm−1
Table 2.3: Raman setup adopted at ambient pressure.
at ambient pressure.Additionally, we have performed polarization dependent Raman experiments on
LaTe3 at ambient pressure by varying the orientation of the incident light polarizationwith respect to the crystal axes by means of a λ/2 polarization rotator and selecting thescattered polarization both parallel and perpendicular to the incident one.
2.5.4 High pressure Raman setup
The Raman microspectrometer described above is also appropriate to perform measure-ments as a function of pressure using a DAC. The BETSA membrane DAC presented insection 2.4.1 was employed for Raman measurements under pressure. A 22 mm focallength 20x objective was used in order to t the angular aperture and the working distance
2.5 Experimental setup 61
of the cells. All the characteristics summarized in Table 2.3 have been kept for the highpressure Raman setup. We did not use the lter to attenuate the laser radiation since thehigh thermal conductivity of diamond prevents strong heating of the sample. Stainlesssteel gasket with about 300 µm diameter hole and 50 µm thickness under working con-ditions were used. A small piece (typically ∼100-200 µm diameter) was cut from thefreshly cleaved samples and placed inside the DAC with the [010] surface parallel to thediamond culet. We have tried to load a fragment as big as possible in order to collect andaverage spectra from different spots of the sample inside the pressure cell. As pressuretransmitting medium we employed a 4:1 methanol-ethanol mixture, which is hydrostaticup to 10 GPa [47]. A small ruby chip was also placed inside the gasket hole for pres-sure determination. Ruby uorescence was directly measured by means of the Ramanspectrometer. In Fig. 2.20 a picture of a sample loaded in the gasket hole is shown.
SampleRuby
Figure 2.20: A piece of the sample loaded inside the DAC with a ruby chip into amethanol-ethanol mixture employed as hydrostatic medium.
62 2. Experimental techniques
2.6 Procedure for the analysis of the Reectivity spectra
2.6.1 The Lorenz-Drude model
The Lorentz-Drude model [25, 40] based on the classical dispersion theory, is a verysimple phenomenological approach in order to describe the optical properties of metalsand insulators. The basic assumption of the model is that electrons are bound to thenucleus of the atom by an elastic force, like a small mass tied to a large mass by a spring.The equation of motion for one electron in presence of the electric eld is then:
d2rdt2 + γ
drdt +ω2
0r =− emEloc (2.33)
where ω0 =√
k/m is the resonance frequency, Eloc is the local eld acting on the electronas a driving force and γ represents the damping, providing an energy loss mechanism. Thedipole electric moment is related to the atomic polarizability α(ω) through the relation(valid in the linear response regime):
pe =−er = α(ω)Eloc (2.34)
and therefore
α(ω) =e2/m
(ω20−ω2)− iγω
. (2.35)
By approximating the local eld Eloc with the Maxwell electric eld and considering Nelectrons per unit volume, we can write:
D = εE = E +4πP, (2.36)
P = N pe = N αE. (2.37)
From the above equations we obtain the following expression for the complex dielectricfunction:
ε(ω) = 1+4π α(ω) = 1+4πNe2/m
(ω20−ω2)− iγω
. (2.38)
2.6 Procedure for the analysis of the Reectivity spectra 63
If we now suppose that electrons can oscillate with different frequencies, we can general-ize equation 2.38 as follows:
ε(ω) = 1+∑j
4πN je2/m(ω2
j −ω2)− iγ jω(2.39)
where N j is the density of bound electrons with resonance frequency ω j. In the case of ametal the contribution due to the free electrons must be also taken into account. This iseasily done by adding one oscillator with resonance frequency ω j=0 which represents theso-called Drude term:
ε(ω) = ε∞−ω2
pω2− iωγD
+∑j
S2j
(ω2j −ω2)− iγ jω
(2.40)
where ωp =√
4πNe2/m is the plasma frequency and γD is the free carriers scatteringrate. The quantity S2
j = 4πN je2/m denes the oscillator strength of the jth harmonicoscillator. The term ε∞, which replaces the value 1 in equation 2.39, takes into accountthe contributions due to the electronic interband transitions at frequencies higher thanthe largest frequency, experimentally accessible. In Fig. 2.21 we report, as an example,the frequency dependence of the real ε1 and imaginary ε2 part of the dielectric responsefunction for a single harmonic oscillator. The static dielectric constant ε0 is given by thezero frequency limit of ε1(ω). ε2(ω) is a Lorenzian centered at ω j for an insulator and atzero for a metal.
The knowledge of ε(ω) gives us access to the optical functions n and k as follows:
n =
√12
√ε2
1 + ε22 +
ε12 (2.41)
k =
√12
√ε2
1 + ε22−
ε12 (2.42)
and nally allows us to reproduce the measured R(ω) spectra according to equation 2.14.
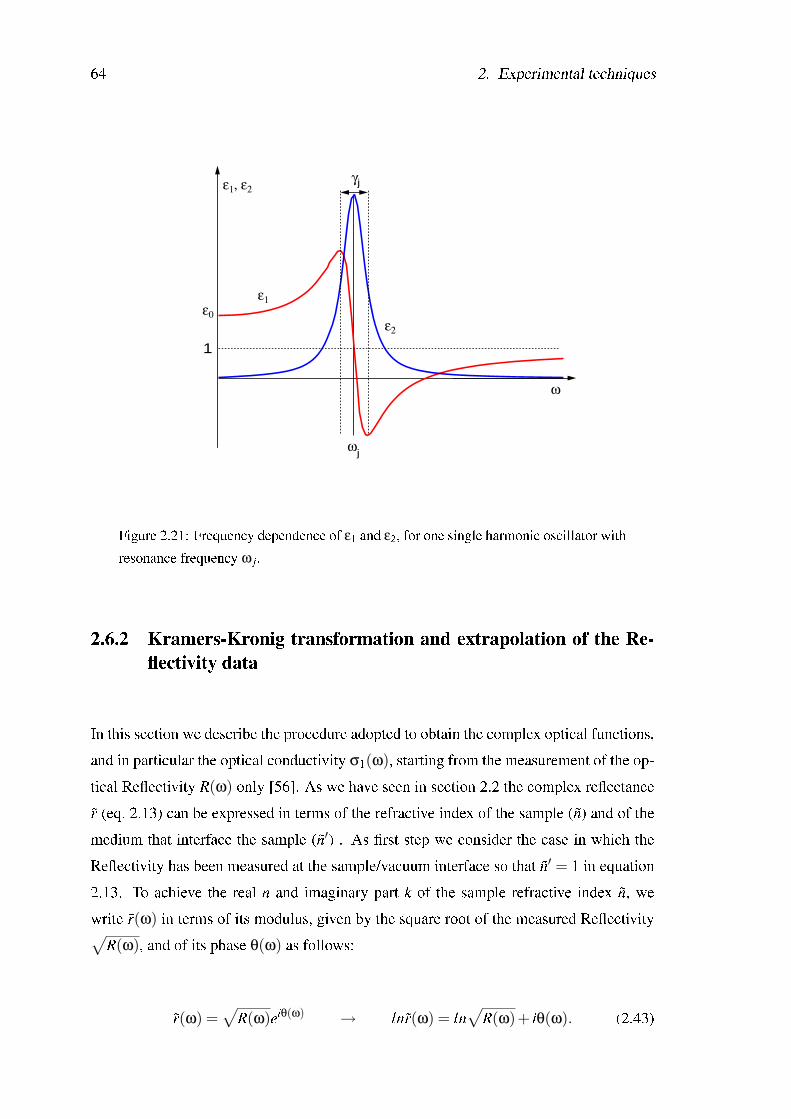
64 2. Experimental techniques
ωj
1
γj
ω
ε1
ε2
ωpj
ε1, ε2
ε0
Figure 2.21: Frequency dependence of ε1 and ε2, for one single harmonic oscillator withresonance frequency ω j.
2.6.2 Kramers-Kronig transformation and extrapolation of the Re-ectivity data
In this section we describe the procedure adopted to obtain the complex optical functions,and in particular the optical conductivity σ1(ω), starting from the measurement of the op-tical Reectivity R(ω) only [56]. As we have seen in section 2.2 the complex reectancer (eq. 2.13) can be expressed in terms of the refractive index of the sample ( n) and of themedium that interface the sample ( n′) . As rst step we consider the case in which theReectivity has been measured at the sample/vacuum interface so that n′ = 1 in equation2.13. To achieve the real n and imaginary part k of the sample refractive index n, wewrite r(ω) in terms of its modulus, given by the square root of the measured Reectivity√
R(ω), and of its phase θ(ω) as follows:
r(ω) =√
R(ω)eiθ(ω) → lnr(ω) = ln√
R(ω)+ iθ(ω). (2.43)
2.6 Procedure for the analysis of the Reectivity spectra 65
If we now identied lnr(ω) with a generic complex response function, its real and imagi-nary part are related by the KK relations (see subsec. 2.2.1) as follows:
θ(ω) =−2ωπ
PZ ∞
0
ln√
R(ω′)ω′2−ω2 dω′. (2.44)
By knowing both R and θ, it is then easy to achieve n and k:
n =1−R
1+R+2√
Rcosθ(2.45)
k =−2√
Rsenθ1+R+2
√Rcosθ
(2.46)
and by using equations 2.8-2.11 we obtain all others optical functions, as well. If we con-sider equation 2.44, the limits of the integration are obviously beyond the experimentalreach and the measured Reectivity has to be extrapolated at very low and high frequen-cies. In air we are able to cover experimentally a broad spectral range (from far IR up toUV) and the standard extrapolation laws can be applied in order to extend R(ω) [25, 40].For the ω→ 0 limit R(ω) is extrapolated with a constant in the case of an insulator, whilein case of a metallic material the Hagens-Rubens (HR) formula is used:
R(ω) = 1−2√
ω/σdc (2.47)
where σdc is the zero frequency value of the optical conductivity. At high frequencythe Reectivity decay is R(ω) v ω−s: with s=2 up to twice the measured spectral rangeand then with s=4 to simulate the electronic continuum. These expressions for the R(ω)
extrapolations can be derived from the Lorentz-Drude model (for more details consultRefs. [25, 40]) considering the low (ω/γ << 1) and high (ω/γ >> 1) energy limits.
We now consider the case for the pressure dependent measurements. The Reec-tivity spectra are collected with the sample inside the DAC ( n′ = 2.42 in eq. 2.13) and theapplication of the KK method is not trivial due to the two following reasons: (i) the mea-sured Reectivity spectra cover a limited frequency range; (ii) the standard KK relationbetween the reectivity and phase needs to be corrected when it is applied to the sam-ple/diamond interface, and the necessary correction term contains an a priori unknownparameter. We therefore performed reliable KK transformations, following the procedure
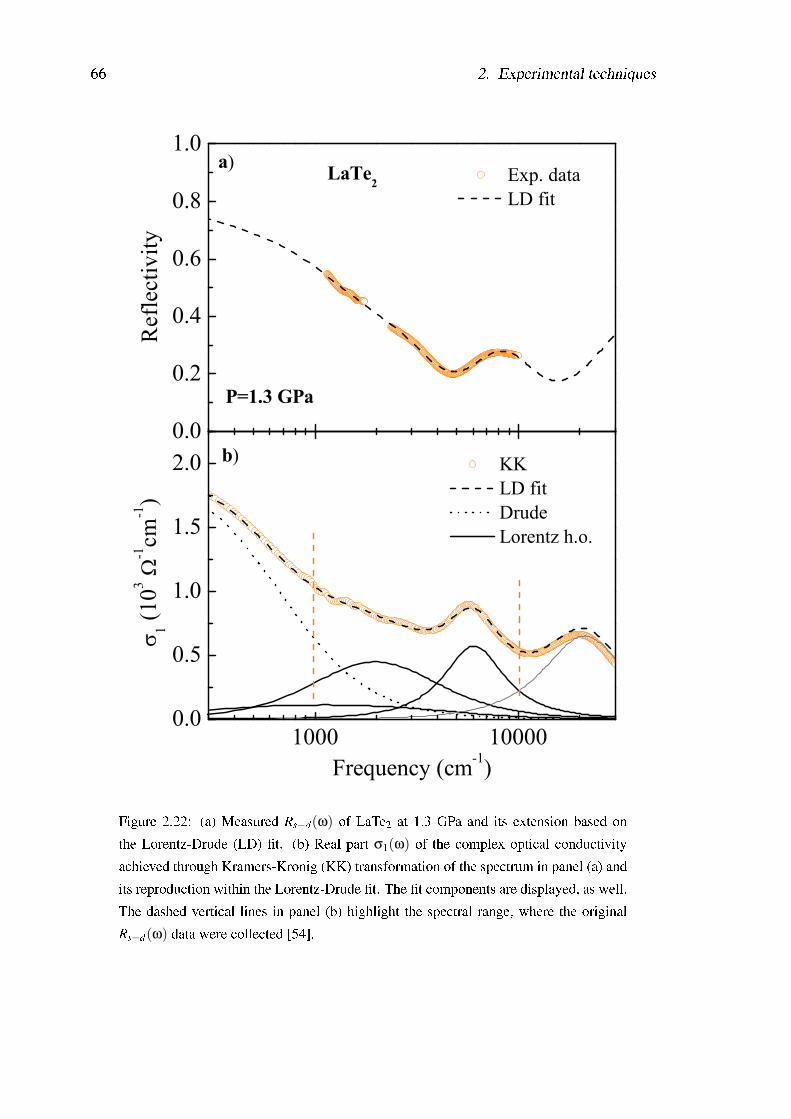
66 2. Experimental techniques
0.0
0.2
0.4
0.6
0.8
1.0LaTe2
a)
P=1.3 GPa
Exp. data LD fit
Ref
lect
ivity
1000 100000.0
0.5
1.0
1.5
2.0 b) KK LD fit Drude Lorentz h.o.
1 (103
-1cm
-1)
Frequency (cm-1)
Figure 2.22: (a) Measured Rs−d(ω) of LaTe2 at 1.3 GPa and its extension based onthe Lorentz-Drude (LD) t. (b) Real part σ1(ω) of the complex optical conductivityachieved through Kramers-Kronig (KK) transformation of the spectrum in panel (a) andits reproduction within the Lorentz-Drude t. The t components are displayed, as well.The dashed vertical lines in panel (b) highlight the spectral range, where the originalRs−d(ω) data were collected [54].
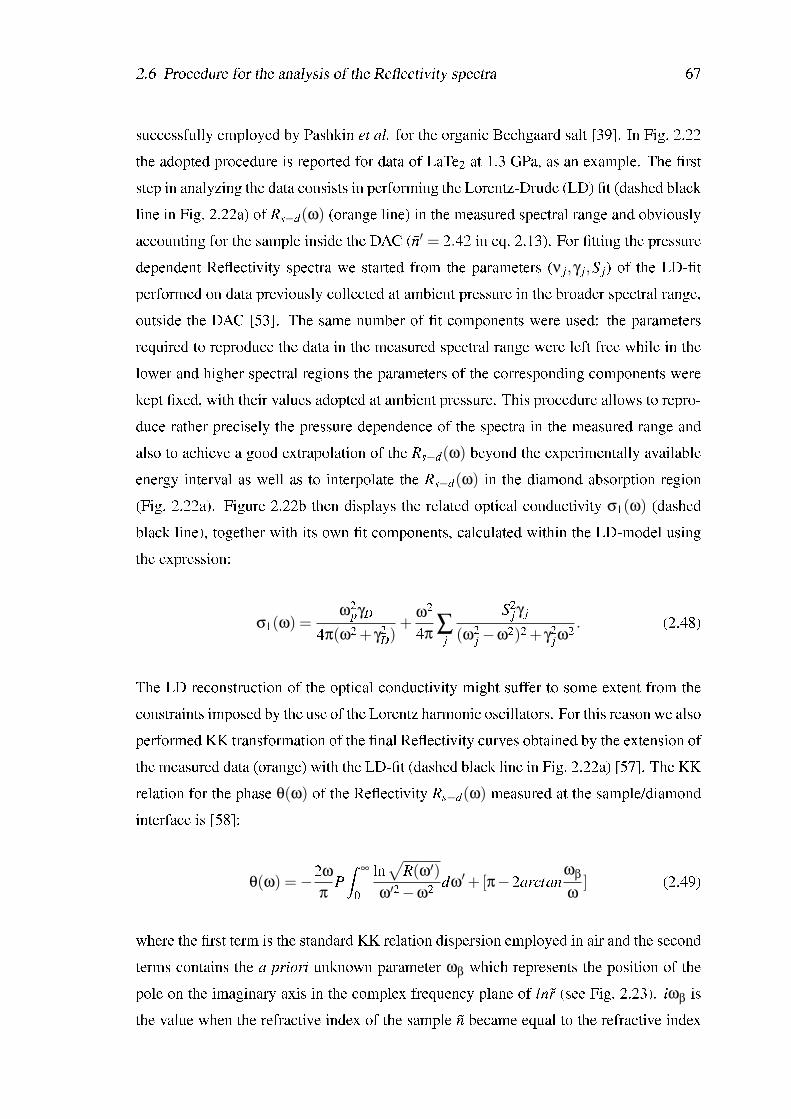
2.6 Procedure for the analysis of the Reectivity spectra 67
successfully employed by Pashkin et al. for the organic Bechgaard salt [39]. In Fig. 2.22the adopted procedure is reported for data of LaTe2 at 1.3 GPa, as an example. The rststep in analyzing the data consists in performing the Lorentz-Drude (LD) t (dashed blackline in Fig. 2.22a) of Rs−d(ω) (orange line) in the measured spectral range and obviouslyaccounting for the sample inside the DAC ( n′ = 2.42 in eq. 2.13). For tting the pressuredependent Reectivity spectra we started from the parameters (ν j,γ j,S j) of the LD-tperformed on data previously collected at ambient pressure in the broader spectral range,outside the DAC [53]. The same number of t components were used: the parametersrequired to reproduce the data in the measured spectral range were left free while in thelower and higher spectral regions the parameters of the corresponding components werekept xed, with their values adopted at ambient pressure. This procedure allows to repro-duce rather precisely the pressure dependence of the spectra in the measured range andalso to achieve a good extrapolation of the Rs−d(ω) beyond the experimentally availableenergy interval as well as to interpolate the Rs−d(ω) in the diamond absorption region(Fig. 2.22a). Figure 2.22b then displays the related optical conductivity σ1(ω) (dashedblack line), together with its own t components, calculated within the LD-model usingthe expression:
σ1(ω) =ω2
pγD
4π(ω2 + γ2D)
+ω2
4π ∑j
S2jγ j
(ω2j −ω2)2 + γ2
jω2 . (2.48)
The LD reconstruction of the optical conductivity might suffer to some extent from theconstraints imposed by the use of the Lorentz harmonic oscillators. For this reason we alsoperformed KK transformation of the nal Reectivity curves obtained by the extension ofthe measured data (orange) with the LD-t (dashed black line in Fig. 2.22a) [57]. The KKrelation for the phase θ(ω) of the Reectivity Rs−d(ω) measured at the sample/diamondinterface is [58]:
θ(ω) =−2ωπ
PZ ∞
0
ln√
R(ω′)ω′2−ω2 dω′+[π−2arctan
ωβ
ω] (2.49)
where the rst term is the standard KK relation dispersion employed in air and the secondterms contains the a priori unknown parameter ωβ which represents the position of thepole on the imaginary axis in the complex frequency plane of lnr (see Fig. 2.23). iωβ isthe value when the refractive index of the sample n became equal to the refractive index
68 2. Experimental techniques
of the diamond window n′, i.e. n(iωβ) = n′. In case of measurements on the sample/airinterface, ωβ tends towards innity and the second term vanishes. For the sample/diamondinterface the second term must, however, be taken into account. The criterium for theproper value of ωβ is the agreement between the optical conductivity obtained by the KKanalysis (orange in Fig. 2.22b) and that from the initial t (dashed black line in Fig. 2.22b).As Fig. 2.22b well illustrates the comparison between the σ1(ω) spectra, obtained rstthrough KK transformation of the extended Reectivity data and second from the directLD-t, is indeed astonishingly good and well emphasizes the reliability of this procedure.
Figure 2.23: Integration path used to perform KK transformation when the Reectivityis measured at sample/window interface [58].
3 Materials
In this chapter we would like to give an overview of the physical background belonging tothe rare-earth (RE) telluride systems investigated in the present work, in order to providethe readership with the aim and motivation of our studies as well as a better understandingof our ndings. We rst report some information about the sample preparation procedure,then the salient characteristics about the crystal and the electronic structure. Finally, wefocus our attention on the main experimental evidences for the CDW state achieved withvarious techniques.
3.1 Sample preparation
Both RETe2 and RETe3 single crystals were grown via a self-ux technique [59,60]. Thisprocedure is favored over the alkali halide ux technique [61] that has been previouslyused; it does not introduce other elements to the melt, and produces large crystals witha high degree of structural order. Both di- and tri-tellurides can be grown from a binarymelt. In order to prepare RETe3, elements in the molar ratio RExTe1−x, (x=0.015-0.030)were put into alumina crucibles and vacuum sealed in quartz tubes. The mixtures wereheated to 800-900 C and slowly cooled over a period of 4 days to end temperatures inthe range of 500-600 C. The remaining melt was decanted in a centrifuge. Resultinggold-colored crystals were malleable, micaceous plates with dimensions of up to 5x0.4x5mm, and oriented with the long b axis perpendicular to the plane of the crystal plates. Thematerial is somewhat air sensitive, and crystals must be stored in an oxygen and moisture-free environment. The growth of RETe2 requires a greater relative concentration of the
69
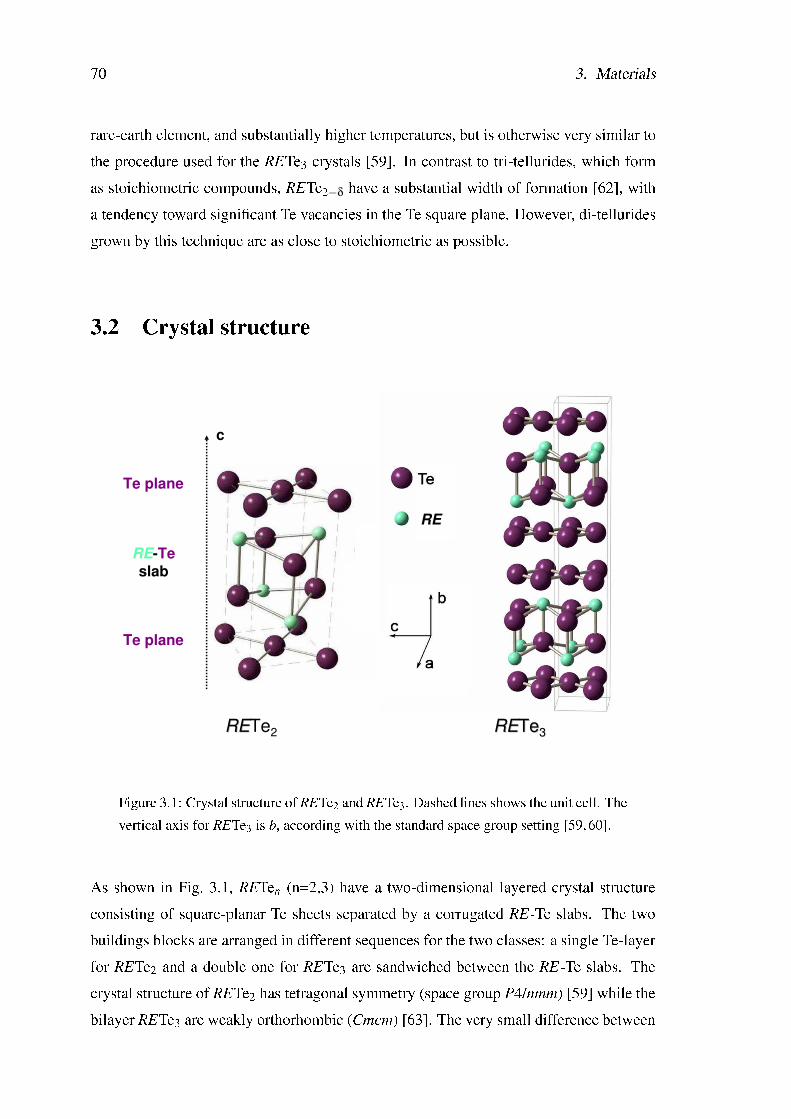
70 3. Materials
rare-earth element, and substantially higher temperatures, but is otherwise very similar tothe procedure used for the RETe3 crystals [59]. In contrast to tri-tellurides, which formas stoichiometric compounds, RETe2−δ have a substantial width of formation [62], witha tendency toward signicant Te vacancies in the Te square plane. However, di-telluridesgrown by this technique are as close to stoichiometric as possible.
3.2 Crystal structure
c
Te plane
RE-Te
slab
Te plane
RE
RERETe2 RERETeTe33
Figure 3.1: Crystal structure of RETe2 and RETe3. Dashed lines shows the unit cell. Thevertical axis for RETe3 is b, according with the standard space group setting [59, 60].
As shown in Fig. 3.1, RETen (n=2,3) have a two-dimensional layered crystal structureconsisting of square-planar Te sheets separated by a corrugated RE-Te slabs. The twobuildings blocks are arranged in different sequences for the two classes: a single Te-layerfor RETe2 and a double one for RETe3 are sandwiched between the RE-Te slabs. Thecrystal structure of RETe2 has tetragonal symmetry (space group P4/nmm) [59] while thebilayer RETe3 are weakly orthorhombic (Cmcm) [63]. The very small difference between
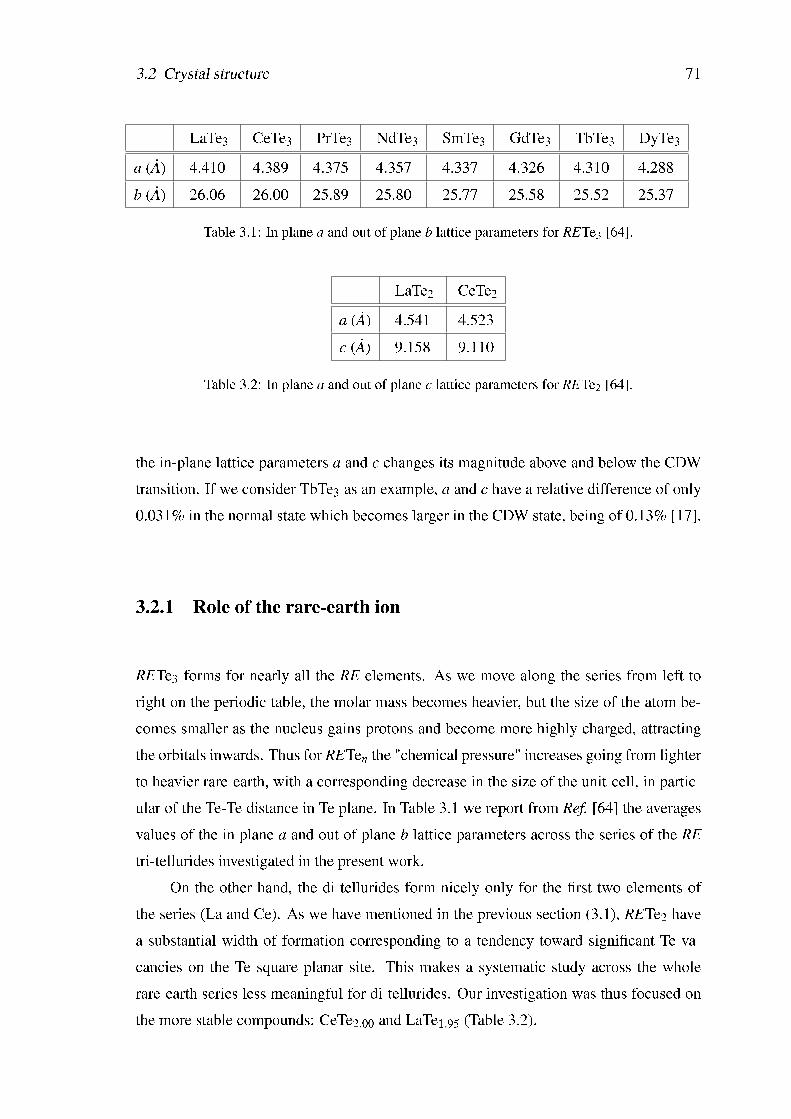
3.2 Crystal structure 71
LaTe3 CeTe3 PrTe3 NdTe3 SmTe3 GdTe3 TbTe3 DyTe3
a ( A) 4.410 4.389 4.375 4.357 4.337 4.326 4.310 4.288b ( A) 26.06 26.00 25.89 25.80 25.77 25.58 25.52 25.37
Table 3.1: In plane a and out of plane b lattice parameters for RETe3 [64].
LaTe2 CeTe2
a ( A) 4.541 4.523c ( A) 9.158 9.110
Table 3.2: In plane a and out of plane c lattice parameters for RETe2 [64].
the in-plane lattice parameters a and c changes its magnitude above and below the CDWtransition. If we consider TbTe3 as an example, a and c have a relative difference of only0.031% in the normal state which becomes larger in the CDW state, being of 0.13% [17].
3.2.1 Role of the rare-earth ion
RETe3 forms for nearly all the RE elements. As we move along the series from left toright on the periodic table, the molar mass becomes heavier, but the size of the atom be-comes smaller as the nucleus gains protons and become more highly charged, attractingthe orbitals inwards. Thus for RETen the "chemical pressure" increases going from lighterto heavier rare-earth, with a corresponding decrease in the size of the unit-cell, in partic-ular of the Te-Te distance in Te plane. In Table 3.1 we report from Ref. [64] the averagesvalues of the in plane a and out of plane b lattice parameters across the series of the REtri-tellurides investigated in the present work.
On the other hand, the di-tellurides form nicely only for the rst two elements ofthe series (La and Ce). As we have mentioned in the previous section (3.1), RETe2 havea substantial width of formation corresponding to a tendency toward signicant Te va-cancies on the Te square planar site. This makes a systematic study across the wholerare-earth series less meaningful for di-tellurides. Our investigation was thus focused onthe more stable compounds: CeTe2.00 and LaTe1.95 (Table 3.2).
72 3. Materials
3.3 Electronic structure
The physical properties of RETen are dominantly determined by the Te planes commonto all compounds. Due to the strong 2D character of the system, a good description ofthe electronic structure can be obtained with a 2D tight-binding calculation based on onesingle Te plane [15]. Such description is then modied when the presence of transversecoupling between the planes and the slabs is introduced. The modication is such thatthe real 3D unit cell (light-blue line in Fig. 3.2a) has a base in the (a,c) plane rotatedby 450 and larger by
√2 compared to the square unit of the Te plane (green square in
Fig. 3.2a) [19, 20]. Hence, two different Brillouin zones (BZ), associated to two differentplanar unit cells, will be most convenient to use in the following description: (i) the 2DBZ built on the Te square from the plane (green line in Fig. 3.2b) and (ii) the 3D BZ builton the lattice unit cell (light-blue line in Fig. 3.2b).
In the next section we describe the 2D tight-binding model for an idealized Te squarelattice and the way this 2D picture is modied by the 3D coupling between layers andslabs. In conclusion we also report the results of the electronic band structure calculationusing the linear mufn-tin orbital (LMTO) method.
3.3.1 Tight-binding model
The tight-binding model considers the p bands of a single square-planar Te sheet (thesquare unit cell is shown in green in Fig. 3.2a), with band lling including electronsdonated from the RE-Te interlayer. As Te ionizes to Te2− and the rare-earth ionizes toRE3+, each RE-Te unit donates one electron to the double Te sheets, which is shared bytwo Te atoms in RETe3 compounds. As the neutral Te atom has the lling 4d105s25p4, theadditional electron brings the lling of the p bands to 5p4.5. As shown in band calculations[18], the pz orbitals lie at lower energy relative to the other p orbitals and are completelylled. The remaining 2.5 electrons are shared between the 5px and 5py orbitals (2.5/4= 5/8 lling). In the case of RETe2, there is only one Te layer where the electron fromRE-Te unit can be donated, so that the lling of the in-plane Te p bands is given by5p5. This provides 3 remaining electrons (instead of 2.5) to be shared between the 5px
and 5py orbitals (3/4=6/8 lling). Following Ref. [16], all interactions with range longerthan the nearest neighbor hopping can be neglected with the consequence that there is no
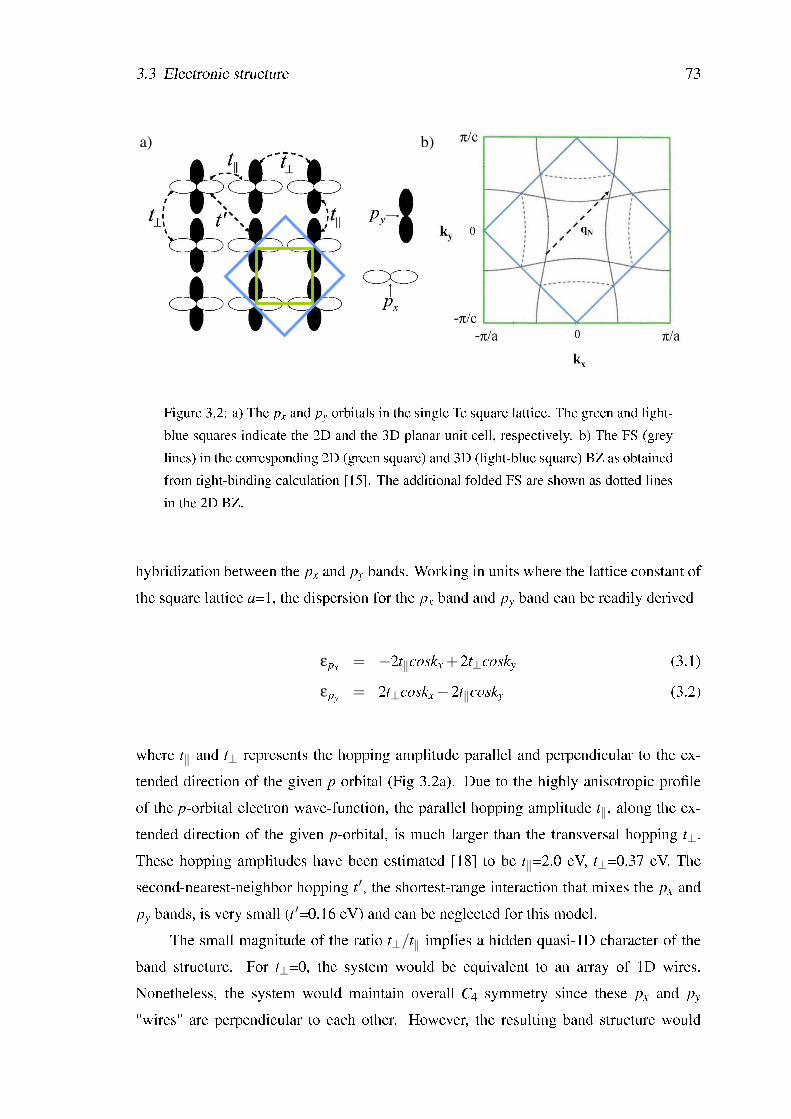
3.3 Electronic structure 73
a) b)
Figure 3.2: a) The px and py orbitals in the single Te square lattice. The green and light-blue squares indicate the 2D and the 3D planar unit cell, respectively. b) The FS (greylines) in the corresponding 2D (green square) and 3D (light-blue square) BZ as obtainedfrom tight-binding calculation [15]. The additional folded FS are shown as dotted linesin the 2D BZ.
hybridization between the px and py bands. Working in units where the lattice constant ofthe square lattice a=1, the dispersion for the px band and py band can be readily derived
εpx = −2t‖coskx +2t⊥cosky (3.1)
εpy = 2t⊥coskx−2t‖cosky (3.2)
where t‖ and t⊥ represents the hopping amplitude parallel and perpendicular to the ex-tended direction of the given p orbital (Fig 3.2a). Due to the highly anisotropic proleof the p-orbital electron wave-function, the parallel hopping amplitude t‖, along the ex-tended direction of the given p-orbital, is much larger than the transversal hopping t⊥.These hopping amplitudes have been estimated [18] to be t‖=2.0 eV, t⊥=0.37 eV. Thesecond-nearest-neighbor hopping t ′, the shortest-range interaction that mixes the px andpy bands, is very small (t ′=0.16 eV) and can be neglected for this model.
The small magnitude of the ratio t⊥/t‖ implies a hidden quasi-1D character of theband structure. For t⊥=0, the system would be equivalent to an array of 1D wires.Nonetheless, the system would maintain overall C4 symmetry since these px and py
"wires" are perpendicular to each other. However, the resulting band structure would
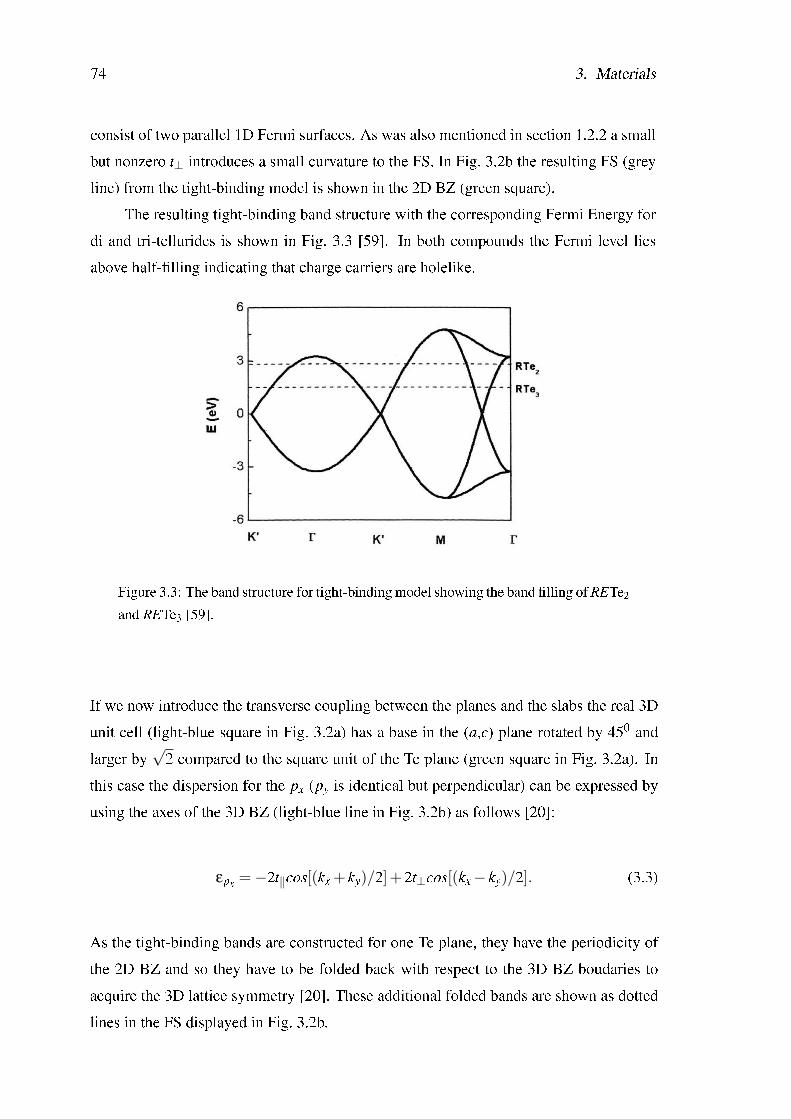
74 3. Materials
consist of two parallel 1D Fermi surfaces. As was also mentioned in section 1.2.2 a smallbut nonzero t⊥ introduces a small curvature to the FS. In Fig. 3.2b the resulting FS (greyline) from the tight-binding model is shown in the 2D BZ (green square).
The resulting tight-binding band structure with the corresponding Fermi Energy fordi and tri-tellurides is shown in Fig. 3.3 [59]. In both compounds the Fermi level liesabove half-lling indicating that charge carriers are holelike.
Figure 3.3: The band structure for tight-binding model showing the band lling of RETe2
and RETe3 [59].
If we now introduce the transverse coupling between the planes and the slabs the real 3Dunit cell (light-blue square in Fig. 3.2a) has a base in the (a,c) plane rotated by 450 andlarger by
√2 compared to the square unit of the Te plane (green square in Fig. 3.2a). In
this case the dispersion for the px (py is identical but perpendicular) can be expressed byusing the axes of the 3D BZ (light-blue line in Fig. 3.2b) as follows [20]:
εpx =−2t‖cos[(kx + ky)/2]+2t⊥cos[(kx− ky)/2]. (3.3)
As the tight-binding bands are constructed for one Te plane, they have the periodicity ofthe 2D BZ and so they have to be folded back with respect to the 3D BZ boudaries toacquire the 3D lattice symmetry [20]. These additional folded bands are shown as dottedlines in the FS displayed in Fig. 3.2b.
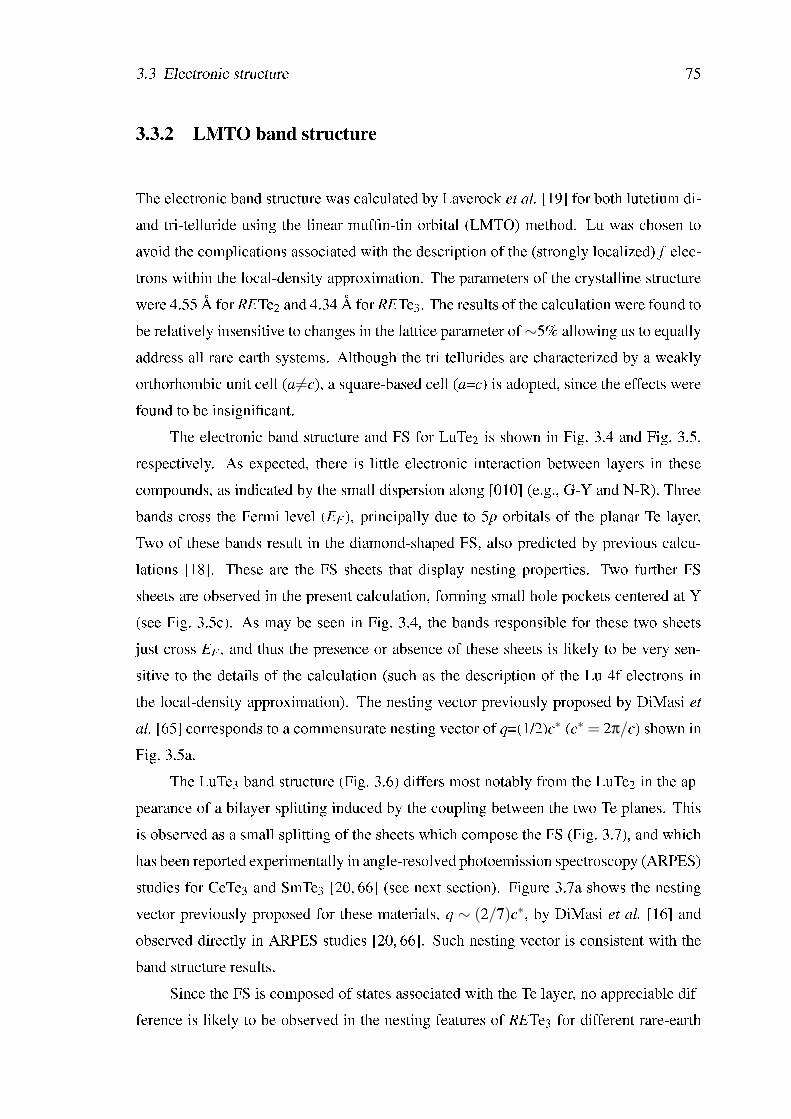
3.3 Electronic structure 75
3.3.2 LMTO band structure
The electronic band structure was calculated by Laverock et al. [19] for both lutetium di-and tri-telluride using the linear mufn-tin orbital (LMTO) method. Lu was chosen toavoid the complications associated with the description of the (strongly localized) f elec-trons within the local-density approximation. The parameters of the crystalline structurewere 4.55 Å for RETe2 and 4.34 Å for RETe3. The results of the calculation were found tobe relatively insensitive to changes in the lattice parameter of∼5% allowing us to equallyaddress all rare-earth systems. Although the tri-tellurides are characterized by a weaklyorthorhombic unit cell (a 6=c), a square-based cell (a=c) is adopted, since the effects werefound to be insignicant.
The electronic band structure and FS for LuTe2 is shown in Fig. 3.4 and Fig. 3.5,respectively. As expected, there is little electronic interaction between layers in thesecompounds, as indicated by the small dispersion along [010] (e.g., G-Y and N-R). Threebands cross the Fermi level (EF ), principally due to 5p orbitals of the planar Te layer.Two of these bands result in the diamond-shaped FS, also predicted by previous calcu-lations [18]. These are the FS sheets that display nesting properties. Two further FSsheets are observed in the present calculation, forming small hole pockets centered at Y(see Fig. 3.5c). As may be seen in Fig. 3.4, the bands responsible for these two sheetsjust cross EF , and thus the presence or absence of these sheets is likely to be very sen-sitive to the details of the calculation (such as the description of the Lu 4f electrons inthe local-density approximation). The nesting vector previously proposed by DiMasi etal. [65] corresponds to a commensurate nesting vector of q=(1/2)c∗ (c∗ = 2π/c) shown inFig. 3.5a.
The LuTe3 band structure (Fig. 3.6) differs most notably from the LuTe2 in the ap-pearance of a bilayer splitting induced by the coupling between the two Te planes. Thisis observed as a small splitting of the sheets which compose the FS (Fig. 3.7), and whichhas been reported experimentally in angle-resolved photoemission spectroscopy (ARPES)studies for CeTe3 and SmTe3 [20, 66] (see next section). Figure 3.7a shows the nestingvector previously proposed for these materials, q ∼ (2/7)c∗, by DiMasi et al. [16] andobserved directly in ARPES studies [20, 66]. Such nesting vector is consistent with theband structure results.
Since the FS is composed of states associated with the Te layer, no appreciable dif-ference is likely to be observed in the nesting features of RETe3 for different rare-earth
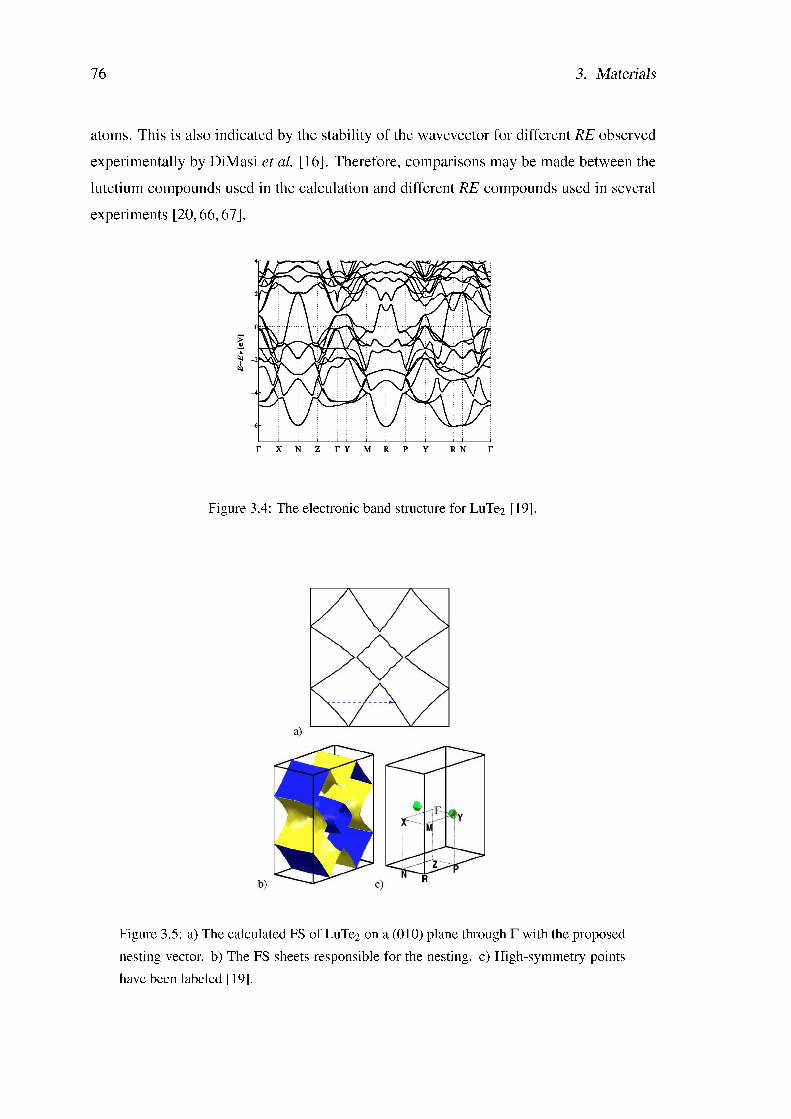
76 3. Materials
atoms. This is also indicated by the stability of the wavevector for different RE observedexperimentally by DiMasi et al. [16]. Therefore, comparisons may be made between thelutetium compounds used in the calculation and different RE compounds used in severalexperiments [20, 66, 67].
Figure 3.4: The electronic band structure for LuTe2 [19].
Figure 3.5: a) The calculated FS of LuTe2 on a (010) plane through Γ with the proposednesting vector. b) The FS sheets responsible for the nesting. c) High-symmetry pointshave been labeled [19].
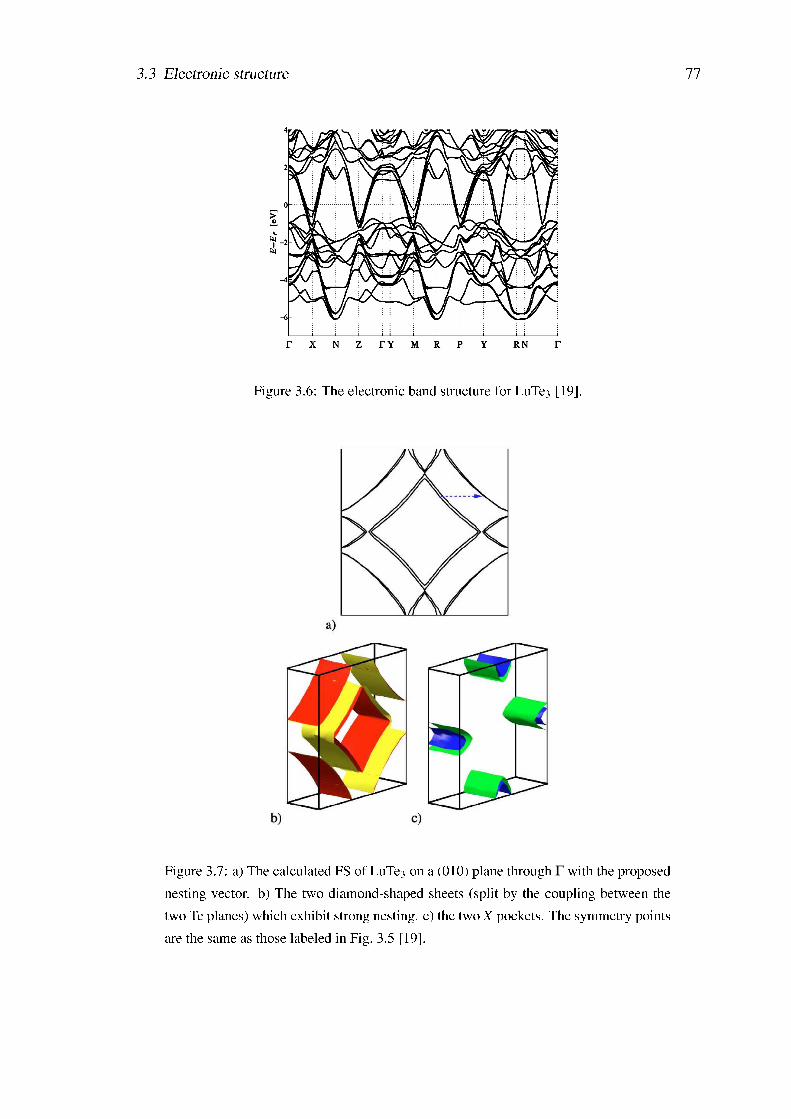
3.3 Electronic structure 77
Figure 3.6: The electronic band structure for LuTe3 [19].
Figure 3.7: a) The calculated FS of LuTe3 on a (010) plane through Γ with the proposednesting vector. b) The two diamond-shaped sheets (split by the coupling between thetwo Te planes) which exhibit strong nesting. c) the two X pockets. The symmetry pointsare the same as those labeled in Fig. 3.5 [19].
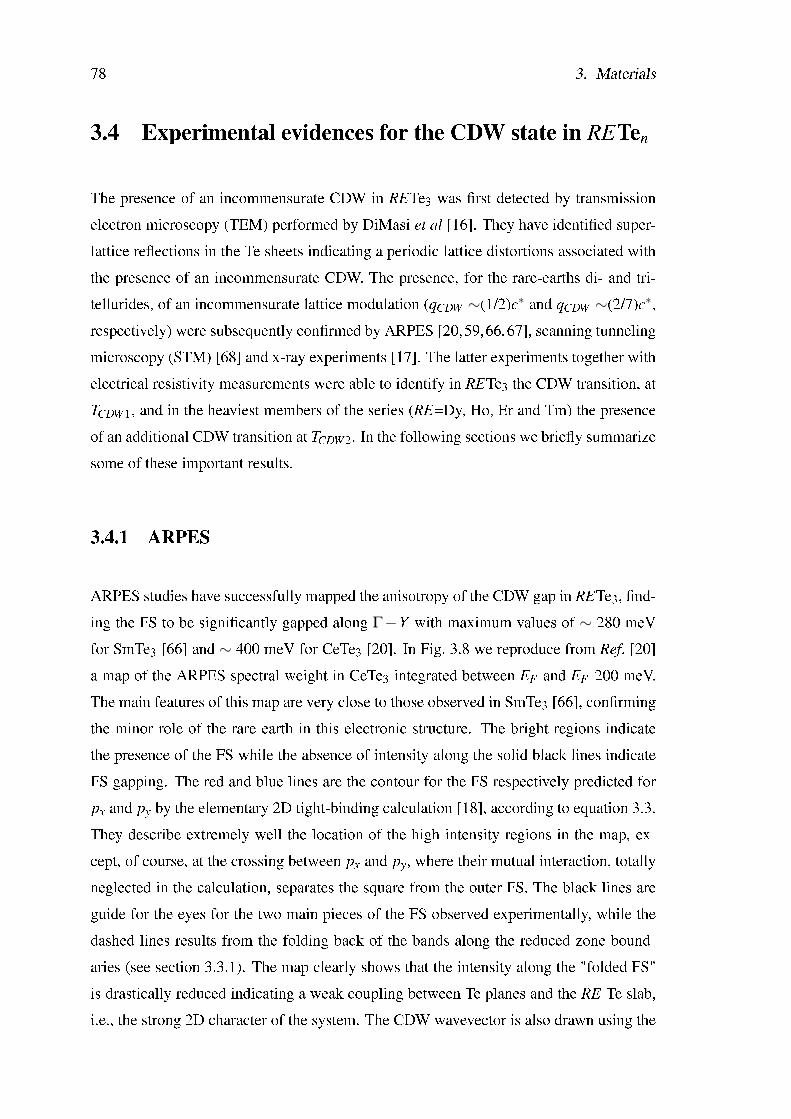
78 3. Materials
3.4 Experimental evidences for the CDW state in RETen
The presence of an incommensurate CDW in RETe3 was rst detected by transmissionelectron microscopy (TEM) performed by DiMasi et al [16]. They have identied super-lattice reections in the Te sheets indicating a periodic lattice distortions associated withthe presence of an incommensurate CDW. The presence, for the rare-earths di- and tri-tellurides, of an incommensurate lattice modulation (qCDW ∼(1/2)c∗ and qCDW ∼(2/7)c∗,respectively) were subsequently conrmed by ARPES [20,59,66,67], scanning tunnelingmicroscopy (STM) [68] and x-ray experiments [17]. The latter experiments together withelectrical resistivity measurements were able to identify in RETe3 the CDW transition, atTCDW1, and in the heaviest members of the series (RE=Dy, Ho, Er and Tm) the presenceof an additional CDW transition at TCDW2. In the following sections we briey summarizesome of these important results.
3.4.1 ARPES
ARPES studies have successfully mapped the anisotropy of the CDW gap in RETe3, nd-ing the FS to be signicantly gapped along Γ−Y with maximum values of ∼ 280 meVfor SmTe3 [66] and ∼ 400 meV for CeTe3 [20]. In Fig. 3.8 we reproduce from Ref. [20]a map of the ARPES spectral weight in CeTe3 integrated between EF and EF -200 meV.The main features of this map are very close to those observed in SmTe3 [66], conrmingthe minor role of the rare-earth in this electronic structure. The bright regions indicatethe presence of the FS while the absence of intensity along the solid black lines indicateFS gapping. The red and blue lines are the contour for the FS respectively predicted forpx and py by the elementary 2D tight-binding calculation [18], according to equation 3.3.They describe extremely well the location of the high intensity regions in the map, ex-cept, of course, at the crossing between px and py, where their mutual interaction, totallyneglected in the calculation, separates the square from the outer FS. The black lines areguide for the eyes for the two main pieces of the FS observed experimentally, while thedashed lines results from the folding back of the bands along the reduced zone bound-aries (see section 3.3.1). The map clearly shows that the intensity along the "folded FS"is drastically reduced indicating a weak coupling between Te planes and the RE-Te slab,i.e., the strong 2D character of the system. The CDW wavevector is also drawn using the
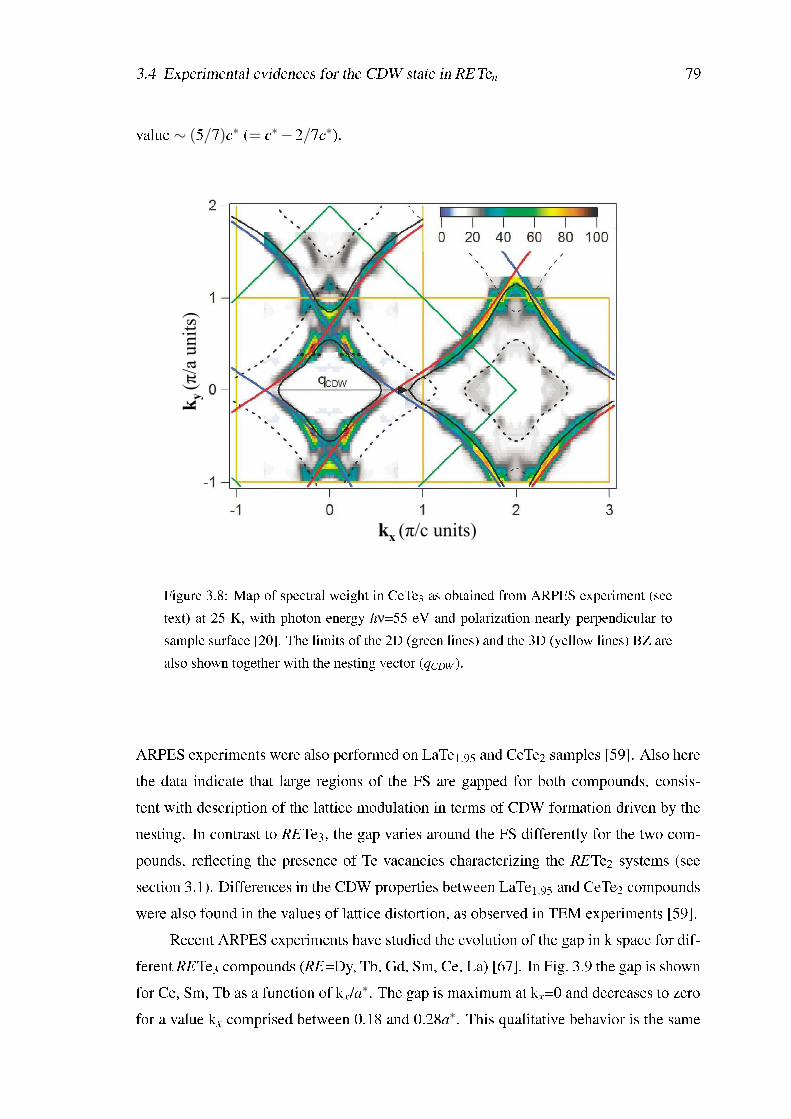
3.4 Experimental evidences for the CDW state in RETen 79
value ∼ (5/7)c∗ (= c∗−2/7c∗).
kx ( /c units)
ky
(/a
unit
s)
Figure 3.8: Map of spectral weight in CeTe3 as obtained from ARPES experiment (seetext) at 25 K, with photon energy hν=55 eV and polarization nearly perpendicular tosample surface [20]. The limits of the 2D (green lines) and the 3D (yellow lines) BZ arealso shown together with the nesting vector (qCDW ).
ARPES experiments were also performed on LaTe1.95 and CeTe2 samples [59]. Also herethe data indicate that large regions of the FS are gapped for both compounds, consis-tent with description of the lattice modulation in terms of CDW formation driven by thenesting. In contrast to RETe3, the gap varies around the FS differently for the two com-pounds, reecting the presence of Te vacancies characterizing the RETe2 systems (seesection 3.1). Differences in the CDW properties between LaTe1.95 and CeTe2 compoundswere also found in the values of lattice distortion, as observed in TEM experiments [59].
Recent ARPES experiments have studied the evolution of the gap in k space for dif-ferent RETe3 compounds (RE=Dy, Tb, Gd, Sm, Ce, La) [67]. In Fig. 3.9 the gap is shownfor Ce, Sm, Tb as a function of kx/a∗. The gap is maximum at kx=0 and decreases to zerofor a value kx comprised between 0.18 and 0.28a∗. This qualitative behavior is the same
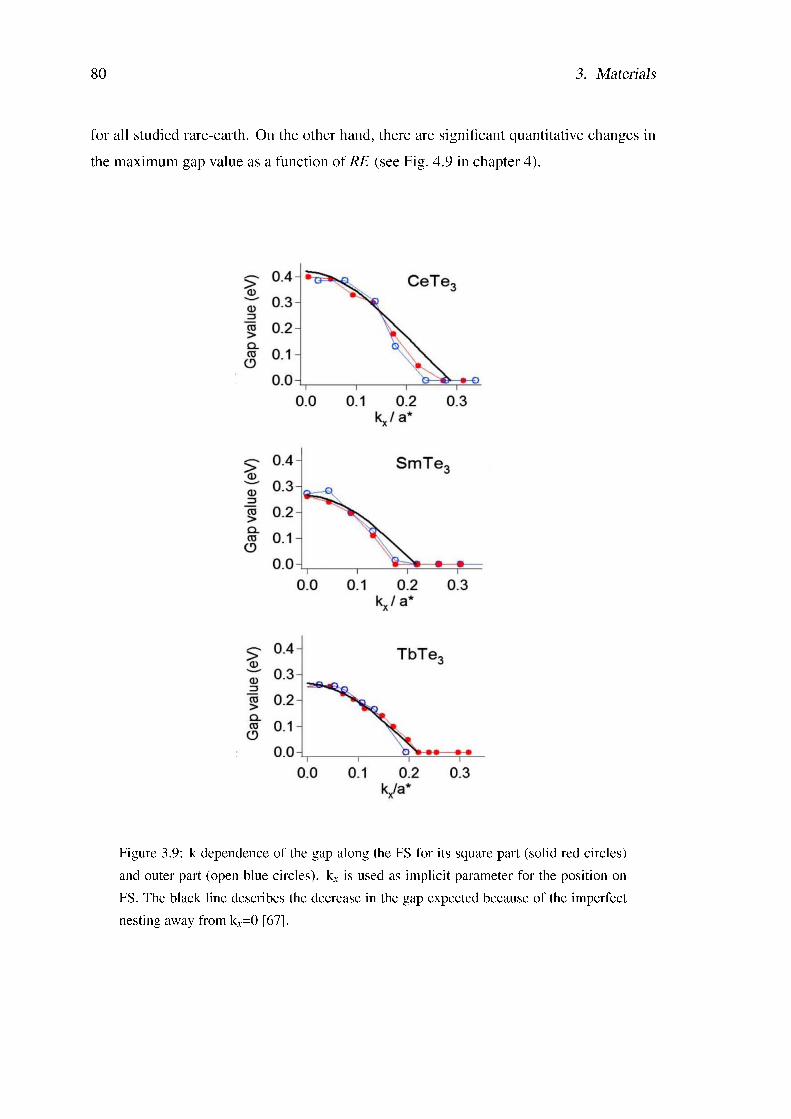
80 3. Materials
for all studied rare-earth. On the other hand, there are signicant quantitative changes inthe maximum gap value as a function of RE (see Fig. 4.9 in chapter 4).
Figure 3.9: k dependence of the gap along the FS for its square part (solid red circles)and outer part (open blue circles). kx is used as implicit parameter for the position onFS. The black line describes the decrease in the gap expected because of the imperfectnesting away from kx=0 [67].
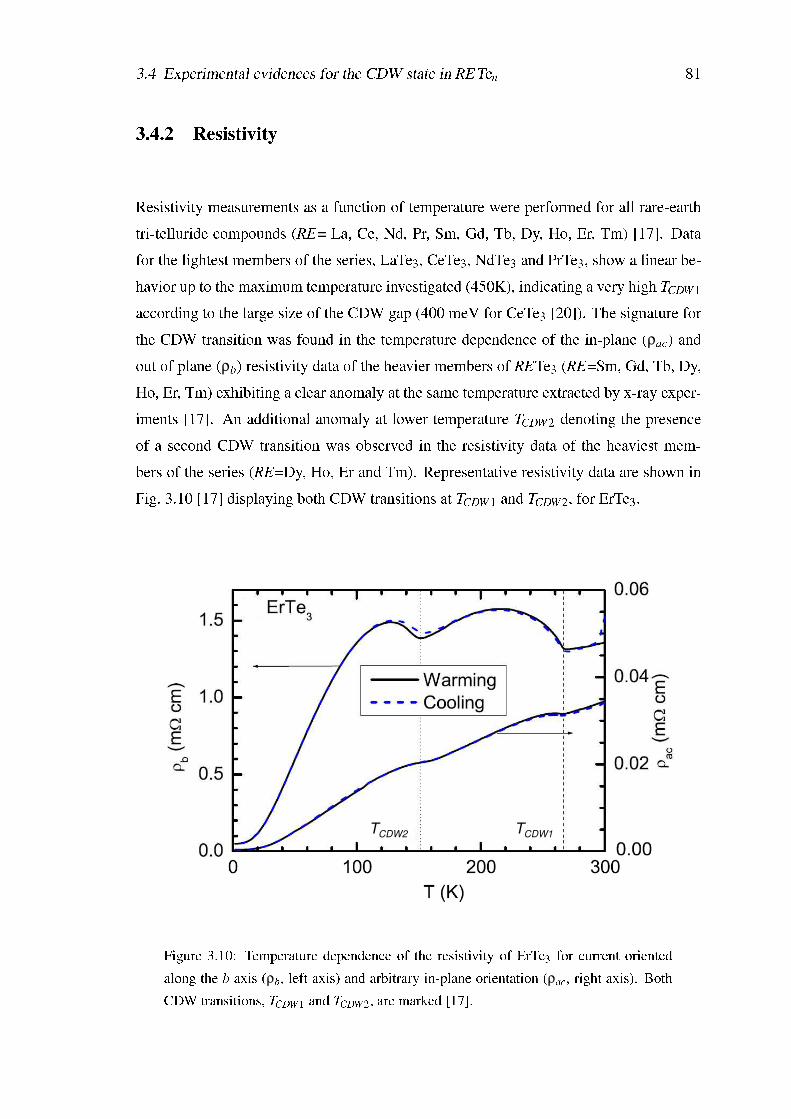
3.4 Experimental evidences for the CDW state in RETen 81
3.4.2 Resistivity
Resistivity measurements as a function of temperature were performed for all rare-earthtri-telluride compounds (RE= La, Ce, Nd, Pr, Sm, Gd, Tb, Dy, Ho, Er, Tm) [17]. Datafor the lightest members of the series, LaTe3, CeTe3, NdTe3 and PrTe3, show a linear be-havior up to the maximum temperature investigated (450K), indicating a very high TCDW1
according to the large size of the CDW gap (400 meV for CeTe3 [20]). The signature forthe CDW transition was found in the temperature dependence of the in-plane (ρac) andout of plane (ρb) resistivity data of the heavier members of RETe3 (RE=Sm, Gd, Tb, Dy,Ho, Er, Tm) exhibiting a clear anomaly at the same temperature extracted by x-ray exper-iments [17]. An additional anomaly at lower temperature TCDW2 denoting the presenceof a second CDW transition was observed in the resistivity data of the heaviest mem-bers of the series (RE=Dy, Ho, Er and Tm). Representative resistivity data are shown inFig. 3.10 [17] displaying both CDW transitions at TCDW1 and TCDW2, for ErTe3.
TCDW2
TCDW1
Figure 3.10: Temperature dependence of the resistivity of ErTe3 for current orientedalong the b axis (ρb, left axis) and arbitrary in-plane orientation (ρac, right axis). BothCDW transitions, TCDW1 and TCDW2, are marked [17].
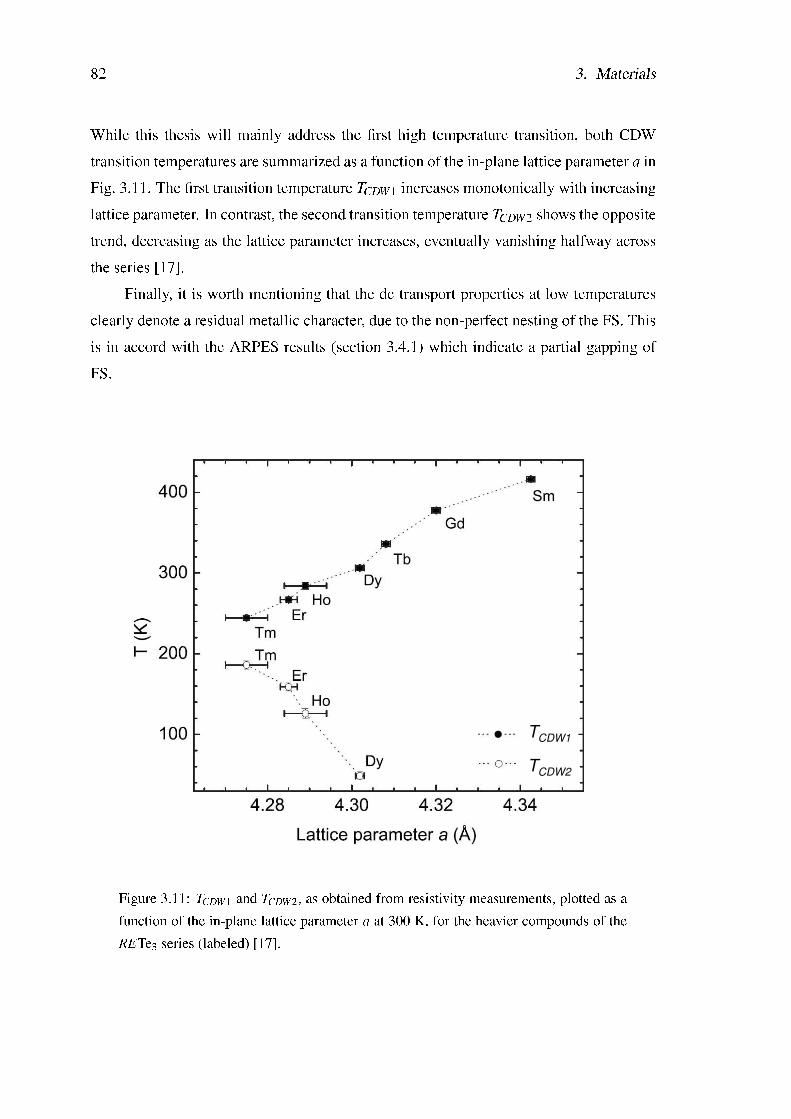
82 3. Materials
While this thesis will mainly address the rst high temperature transition, both CDWtransition temperatures are summarized as a function of the in-plane lattice parameter a inFig. 3.11. The rst transition temperature TCDW1 increases monotonically with increasinglattice parameter. In contrast, the second transition temperature TCDW2 shows the oppositetrend, decreasing as the lattice parameter increases, eventually vanishing halfway acrossthe series [17].
Finally, it is worth mentioning that the dc transport properties at low temperaturesclearly denote a residual metallic character, due to the non-perfect nesting of the FS. Thisis in accord with the ARPES results (section 3.4.1) which indicate a partial gapping ofFS.
TCDW1
TCDW2
Figure 3.11: TCDW1 and TCDW2, as obtained from resistivity measurements, plotted as afunction of the in-plane lattice parameter a at 300 K, for the heavier compounds of theRETe3 series (labeled) [17].
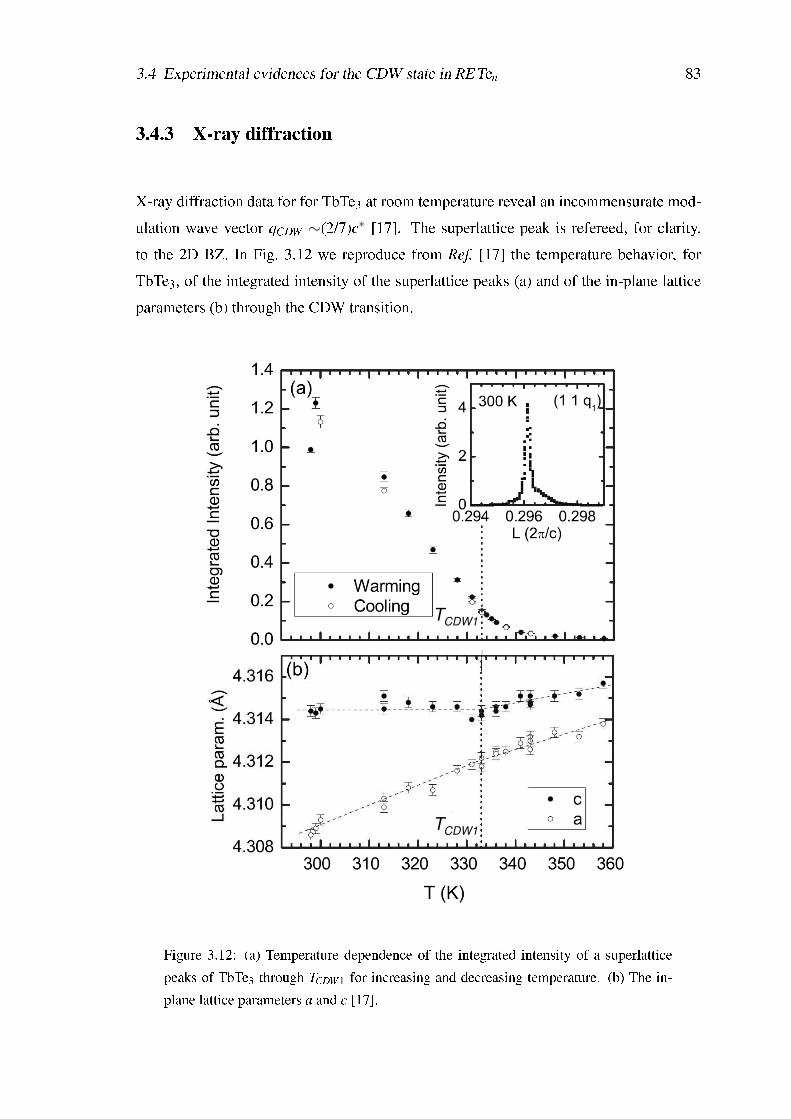
3.4 Experimental evidences for the CDW state in RETen 83
3.4.3 X-ray diffraction
X-ray diffraction data for for TbTe3 at room temperature reveal an incommensurate mod-ulation wave vector qCDW ∼(2/7)c∗ [17]. The superlattice peak is refereed, for clarity,to the 2D BZ. In Fig. 3.12 we reproduce from Ref. [17] the temperature behavior, forTbTe3, of the integrated intensity of the superlattice peaks (a) and of the in-plane latticeparameters (b) through the CDW transition.
TCDW1
TCDW1
Figure 3.12: (a) Temperature dependence of the integrated intensity of a superlatticepeaks of TbTe3 through TCDW1 for increasing and decreasing temperature. (b) The in-plane lattice parameters a and c [17].
84 3. Materials
The intensity of the CDW peaks (a typical one is reported in the inset of Fig. 3.12a) rapidlydecreases on heating from room temperature with no observable hysteresis, indicative of asecond-order CDW transition as predicted theoretically [15]. The CDW transition is alsoreected in the temperature dependence of a and c lattice parameters (Fig. 3.12b). Theydisplay, above the transition temperature TCDW1, similar dependence increasing linearlywith a very small relative difference (only 0.031% at 370K). The formation of the CDWappears to "stretch" the lattice from its expected value along the direction of the mod-ulation wave vector (c axis), while slightly compressing the lattice in the perpendiculardirection, such that the relative difference between a and c is larger than above the CDWtransition (0.13% at 300K). The exact value for TCDW1 (∼ 332.8 K) was extracted fromthe behavior in temperature of the full width at half maximum (FWHM) of the satellitespeaks which shows a sharp increase at the CDW transition (not shown here).
Furthermore, x-ray diffraction experiments on ErTe3 have shown that the secondCDW transition at TCDW2 occurs at an almost equivalent wavevector, oriented perpendic-ular to the rst one, along the a∗ axis. As already mentioned, this second phase transitionand its implications are outside the scope of this work and therefore it will not be dis-cussed further.
4 Results and Discussion
In this chapter we present and discuss our results achieved with both IR and Raman spec-troscopy on the low-dimensional RETen (n=2,3) systems. We focus our attention on thelight rare-earth members of this interesting family of compounds, which indeed exhibitan incommensurate CDW state already at room temperature. Details about the crystal andthe electronic structure as well as the physical properties related to the CDW state can befound in chapter 3. We briey remind here some relevant characteristic features of theelectronic structure. The electronic bands at the Fermi level derive from the Te px and py
in-plane orbitals, leading to a very simple quasi-1D FS [16, 18]. The parallel hopping t‖,along the extended direction of the p-orbital, is much larger than the transverse hoppingt⊥ (t‖=2.0 eV, t⊥=0.37 eV for RETe3). The small magnitude of the ratio t⊥/t‖ implies ahidden quasi-1D character of the band structure. Large part of the open quasi-1D FS isnested by a single wave vector (q∼ 2/7c∗) in the base plane of the reciprocal lattice [19].The nesting vector is very close to the CDW modulation vector (lattice distortion) and thusnesting appears to be the driving mechanism for the CDW instability [20, 67]. Owing tothe 2D character of these compounds, the gap is not isotropic and shows a wave-vectordependence. In particular, since the vector~q does not nest the whole FS, there are parts ofit which are not gapped. Therefore, the CDW state coexists with the metallic phase dueto the free charge carriers in the ungapped regions of the FS.
The lattice constant decreases on going from La to Dy [64], i.e., by decreasing theionic radius of the rare-earth atom. Therefore, the study of these compounds allows toinvestigate the CDW state as a function of the in-plane lattice constant a, which is di-rectly related to the Te-Te distance in the Te layers. An alternative powerful tool to studythe effect of the lattice compression on the CDW state is the application of external pres-sure on a single member of the RE series (di or tri-tellurides). This allows to monitor
85
86 4. Results and Discussion
the response of the system while the CDW state is continuously tuned by increasing theinterchain hopping (t⊥) and altering the nesting conditions. Both Reectivity and Ramaninvestigations were thus carried out on rare-earth di- and tri-tellurides as a function of thelattice compression, achieved by chemical substitution or by the application of externalpressure.
This chapter is divided in two main sections which address selected results fromour optical and Raman investigations. Details about the experimental techniques, the em-ployed setups and data analysis can be found in chapter 2.
4.1 Optical spectroscopy on RETen (n=2,3)
Optical spectroscopy is an ideal tool to study CDW systems, since it is able to revealthe opening of the CDW gap in the charge excitation spectrum. As described in section1.1.4, the optical signature of the CDW phase is in fact a nite-frequency peak, ascribedto the transition from the CDW condensate to a single particle (SP) state [26]. Moreover,the optical technique also reveals, in terms of the Drude peak, the remaining metalliccontribution due to the free charge carriers in the ungapped regions of the FS [20].
To put our results in a broader context, we rst report the optical study on RETe3
[69], which represents the starting point for our recent investigations. We then present ournewest optical investigation at high pressure on CeTe3 [70] in a very broad spectral rangeas well as our ndings on the single layer RETe2 at ambient [53] and at high pressure [54],respectively.
4.1.1 RETe3 at ambient pressure
The double layer RETe3 single crystals were grown by slow cooling a binary melt, asdescribed in section 3.1. The crystals could be readily cleaved between Te layers to revealclean surfaces for the Reectivity measurements. Exploiting the spectrometers describedin section 2.5, the optical Reectivity R(ω) was measured for all samples from the far-infrared (6 meV) up to the ultraviolet (12 eV) spectral range, with light polarized parallelto the Te planes.
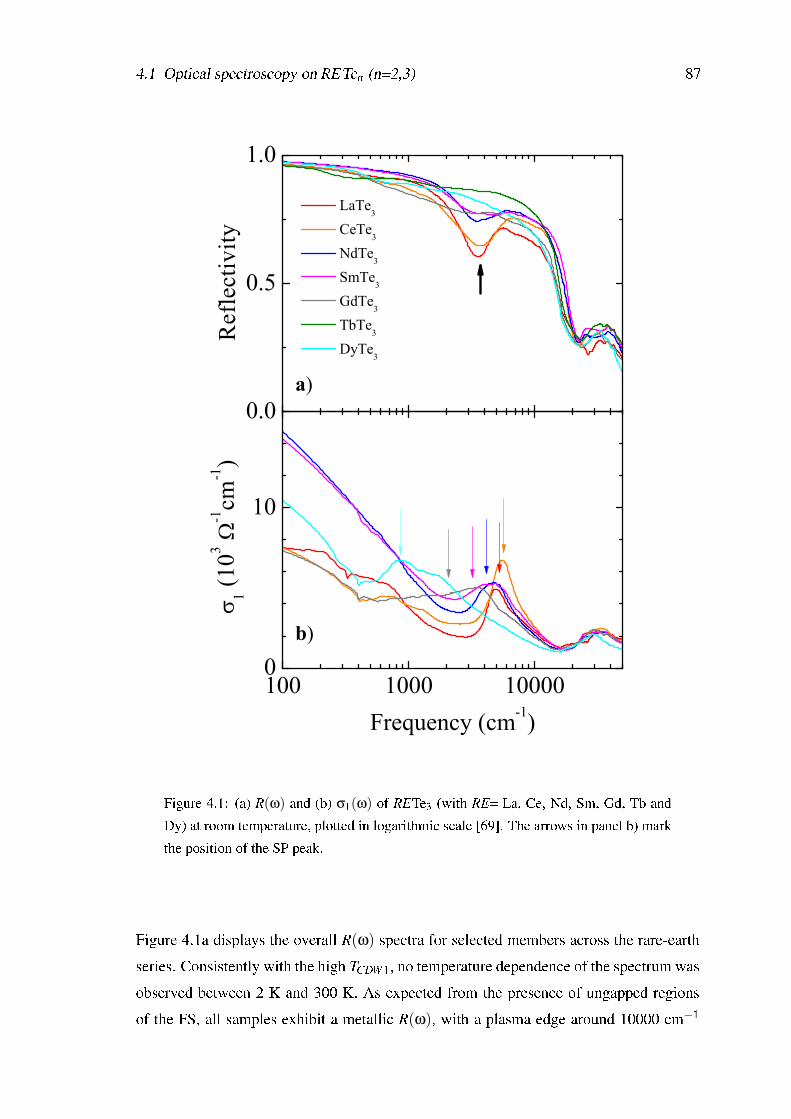
4.1 Optical spectroscopy on RETen (n=2,3) 87
100 1000 100000
10
b)
1 (103
-1cm
-1)
Frequency (cm-1)
0.0
0.5
1.0
a)
LaTe3
CeTe3
NdTe3
SmTe3
GdTe3
TbTe3
DyTe3
Ref
lect
ivity
Figure 4.1: (a) R(ω) and (b) σ1(ω) of RETe3 (with RE= La, Ce, Nd, Sm, Gd, Tb andDy) at room temperature, plotted in logarithmic scale [69]. The arrows in panel b) markthe position of the SP peak.
Figure 4.1a displays the overall R(ω) spectra for selected members across the rare-earthseries. Consistently with the high TCDW1, no temperature dependence of the spectrum wasobserved between 2 K and 300 K. As expected from the presence of ungapped regionsof the FS, all samples exhibit a metallic R(ω), with a plasma edge around 10000 cm−1
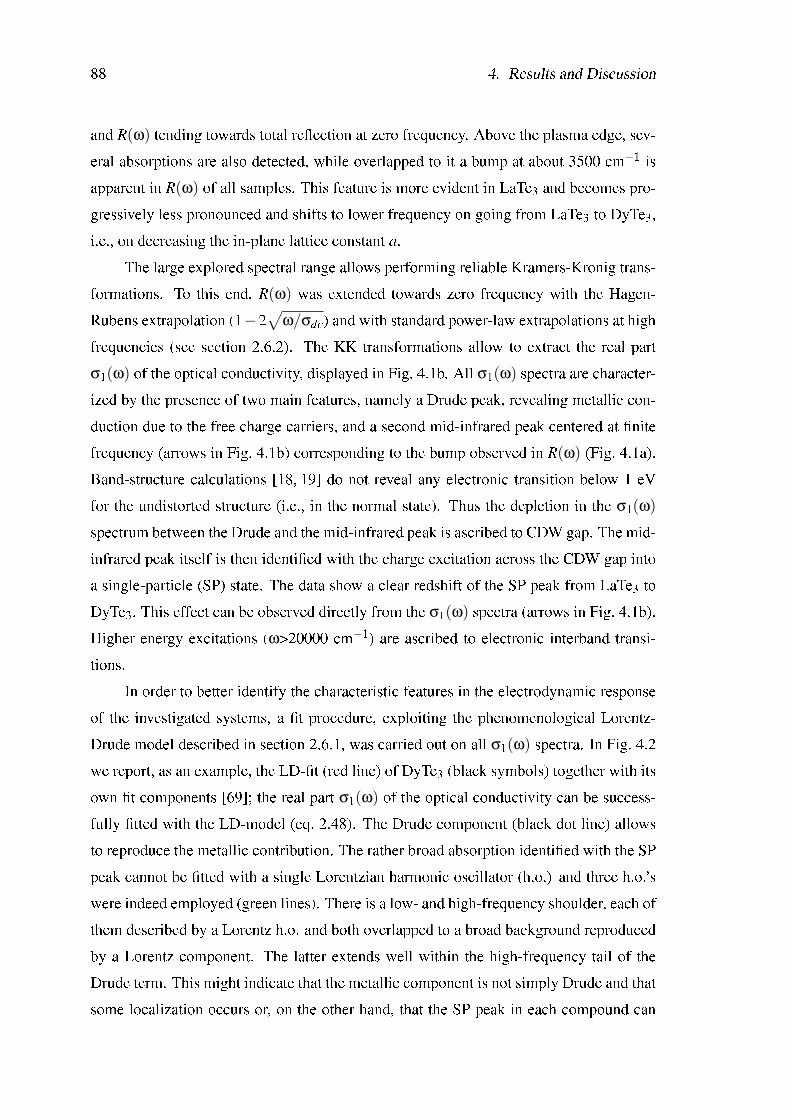
88 4. Results and Discussion
and R(ω) tending towards total reection at zero frequency. Above the plasma edge, sev-eral absorptions are also detected, while overlapped to it a bump at about 3500 cm−1 isapparent in R(ω) of all samples. This feature is more evident in LaTe3 and becomes pro-gressively less pronounced and shifts to lower frequency on going from LaTe3 to DyTe3,i.e., on decreasing the in-plane lattice constant a.
The large explored spectral range allows performing reliable Kramers-Kronig trans-formations. To this end, R(ω) was extended towards zero frequency with the Hagen-Rubens extrapolation (1−2
√ω/σdc) and with standard power-law extrapolations at high
frequencies (see section 2.6.2). The KK transformations allow to extract the real partσ1(ω) of the optical conductivity, displayed in Fig. 4.1b. All σ1(ω) spectra are character-ized by the presence of two main features, namely a Drude peak, revealing metallic con-duction due to the free charge carriers, and a second mid-infrared peak centered at nitefrequency (arrows in Fig. 4.1b) corresponding to the bump observed in R(ω) (Fig. 4.1a).Band-structure calculations [18, 19] do not reveal any electronic transition below 1 eVfor the undistorted structure (i.e., in the normal state). Thus the depletion in the σ1(ω)
spectrum between the Drude and the mid-infrared peak is ascribed to CDW gap. The mid-infrared peak itself is then identied with the charge excitation across the CDW gap intoa single-particle (SP) state. The data show a clear redshift of the SP peak from LaTe3 toDyTe3. This effect can be observed directly from the σ1(ω) spectra (arrows in Fig. 4.1b).Higher energy excitations (ω>20000 cm−1) are ascribed to electronic interband transi-tions.
In order to better identify the characteristic features in the electrodynamic responseof the investigated systems, a t procedure, exploiting the phenomenological Lorentz-Drude model described in section 2.6.1, was carried out on all σ1(ω) spectra. In Fig. 4.2we report, as an example, the LD-t (red line) of DyTe3 (black symbols) together with itsown t components [69]; the real part σ1(ω) of the optical conductivity can be success-fully tted with the LD-model (eq. 2.48). The Drude component (black dot line) allowsto reproduce the metallic contribution. The rather broad absorption identied with the SPpeak cannot be tted with a single Lorentzian harmonic oscillator (h.o.) and three h.o.'swere indeed employed (green lines). There is a low- and high-frequency shoulder, each ofthem described by a Lorentz h.o. and both overlapped to a broad background reproducedby a Lorentz component. The latter extends well within the high-frequency tail of theDrude term. This might indicate that the metallic component is not simply Drude and thatsome localization occurs or, on the other hand, that the SP peak in each compound can
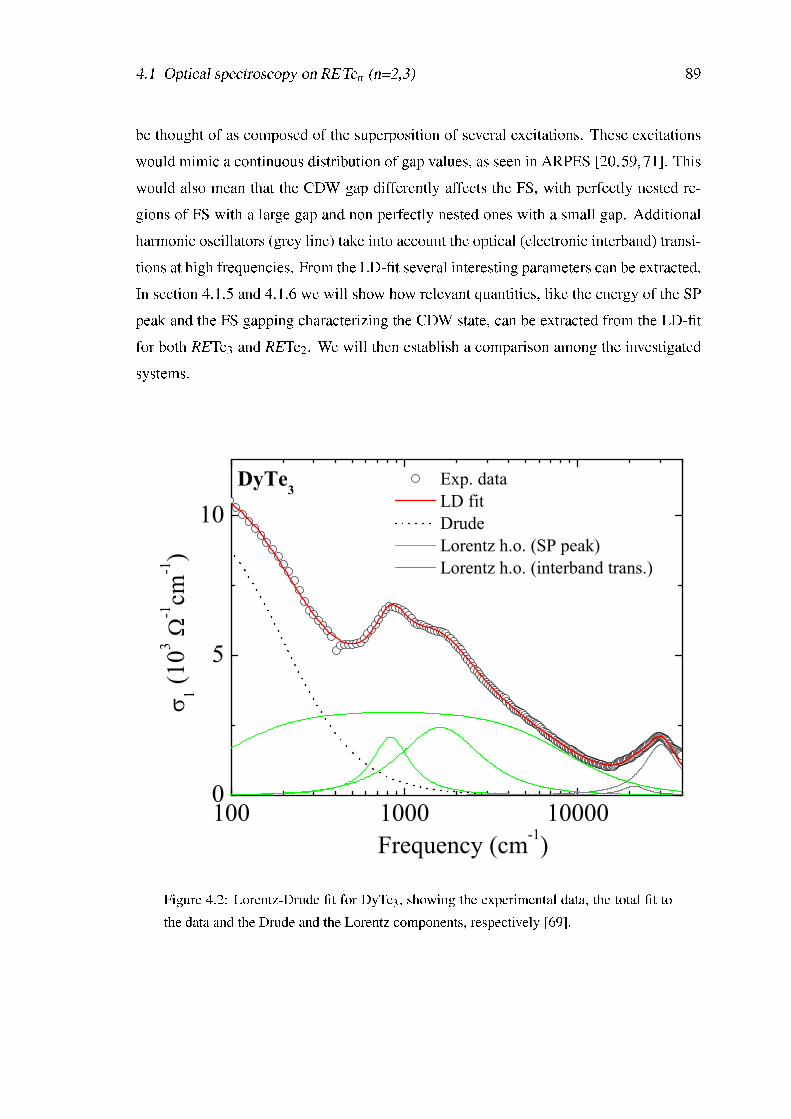
4.1 Optical spectroscopy on RETen (n=2,3) 89
be thought of as composed of the superposition of several excitations. These excitationswould mimic a continuous distribution of gap values, as seen in ARPES [20,59,71]. Thiswould also mean that the CDW gap differently affects the FS, with perfectly nested re-gions of FS with a large gap and non perfectly nested ones with a small gap. Additionalharmonic oscillators (grey line) take into account the optical (electronic interband) transi-tions at high frequencies. From the LD-t several interesting parameters can be extracted.In section 4.1.5 and 4.1.6 we will show how relevant quantities, like the energy of the SPpeak and the FS gapping characterizing the CDW state, can be extracted from the LD-tfor both RETe3 and RETe2. We will then establish a comparison among the investigatedsystems.
100 1000 100000
5
10DyTe3
1 (103
-1cm
-1)
Exp. data LD fit Drude Lorentz h.o. (SP peak) Lorentz h.o. (interband trans.)
Frequency (cm-1)
Figure 4.2: Lorentz-Drude t for DyTe3, showing the experimental data, the total t tothe data and the Drude and the Lorentz components, respectively [69].
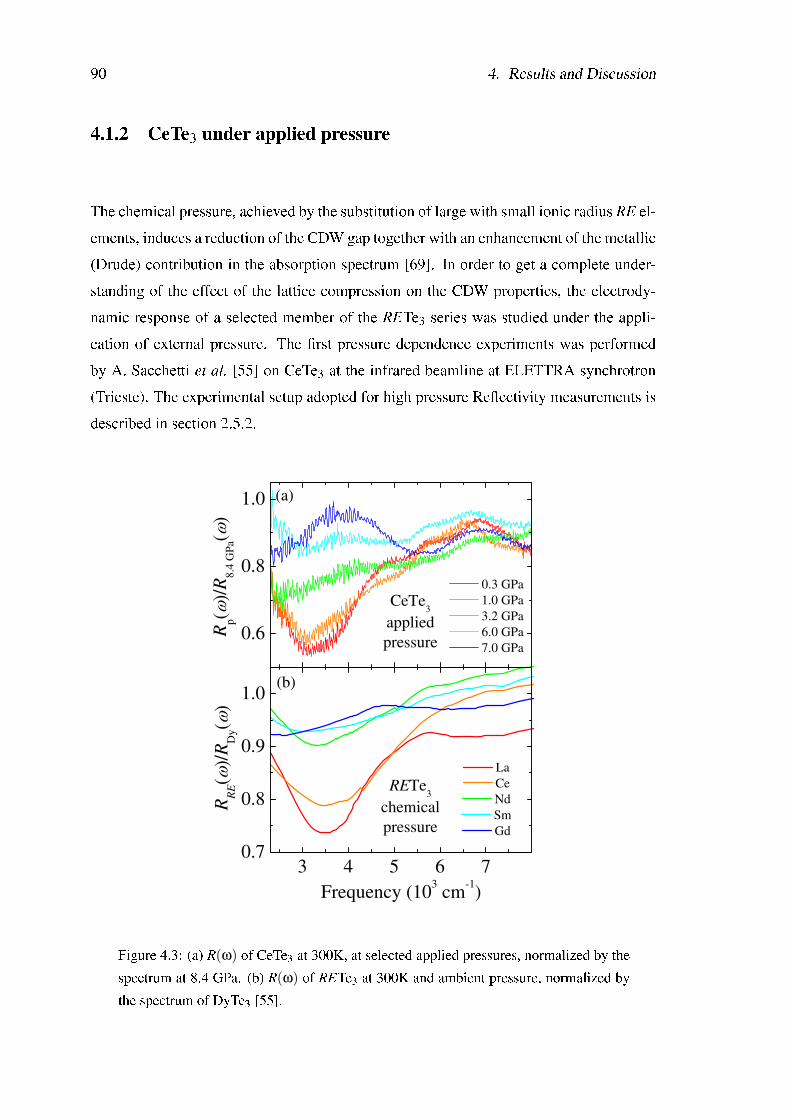
90 4. Results and Discussion
4.1.2 CeTe3 under applied pressure
The chemical pressure, achieved by the substitution of large with small ionic radius RE el-ements, induces a reduction of the CDW gap together with an enhancement of the metallic(Drude) contribution in the absorption spectrum [69]. In order to get a complete under-standing of the effect of the lattice compression on the CDW properties, the electrody-namic response of a selected member of the RETe3 series was studied under the appli-cation of external pressure. The rst pressure dependence experiments was performedby A. Sacchetti et al. [55] on CeTe3 at the infrared beamline at ELETTRA synchrotron(Trieste). The experimental setup adopted for high pressure Reectivity measurements isdescribed in section 2.5.2.
3 4 5 6 70.7
0.8
0.9
1.0(b)
La
Ce
Nd
Sm
Gd
Frequency (103 cm
-1)
RR
E(
)/R
Dy(
)
RETe3
chemical
pressure
0.6
0.8
1.0
CeTe3
applied
pressure
(a)
0.3 GPa
1.0 GPa
3.2 GPa
6.0 GPa
7.0 GPa
Rp(
)/R
8.4
GP
a()
Figure 4.3: (a) R(ω) of CeTe3 at 300K, at selected applied pressures, normalized by thespectrum at 8.4 GPa. (b) R(ω) of RETe3 at 300K and ambient pressure, normalized bythe spectrum of DyTe3 [55].
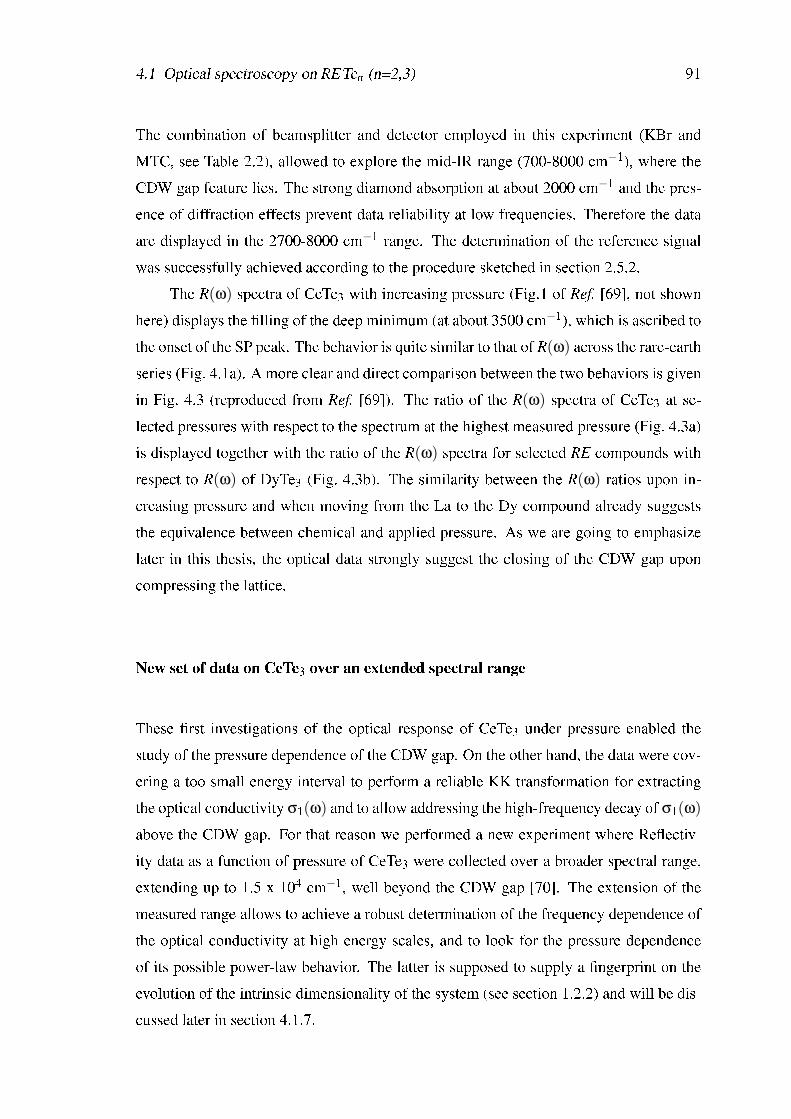
4.1 Optical spectroscopy on RETen (n=2,3) 91
The combination of beamsplitter and detector employed in this experiment (KBr andMTC, see Table 2.2), allowed to explore the mid-IR range (700-8000 cm−1), where theCDW gap feature lies. The strong diamond absorption at about 2000 cm−1 and the pres-ence of diffraction effects prevent data reliability at low frequencies. Therefore the dataare displayed in the 2700-8000 cm−1 range. The determination of the reference signalwas successfully achieved according to the procedure sketched in section 2.5.2.
The R(ω) spectra of CeTe3 with increasing pressure (Fig.1 of Ref. [69], not shownhere) displays the lling of the deep minimum (at about 3500 cm−1), which is ascribed tothe onset of the SP peak. The behavior is quite similar to that of R(ω) across the rare-earthseries (Fig. 4.1a). A more clear and direct comparison between the two behaviors is givenin Fig. 4.3 (reproduced from Ref. [69]). The ratio of the R(ω) spectra of CeTe3 at se-lected pressures with respect to the spectrum at the highest measured pressure (Fig. 4.3a)is displayed together with the ratio of the R(ω) spectra for selected RE compounds withrespect to R(ω) of DyTe3 (Fig. 4.3b). The similarity between the R(ω) ratios upon in-creasing pressure and when moving from the La to the Dy compound already suggeststhe equivalence between chemical and applied pressure. As we are going to emphasizelater in this thesis, the optical data strongly suggest the closing of the CDW gap uponcompressing the lattice.
New set of data on CeTe3 over an extended spectral range
These rst investigations of the optical response of CeTe3 under pressure enabled thestudy of the pressure dependence of the CDW gap. On the other hand, the data were cov-ering a too small energy interval to perform a reliable KK transformation for extractingthe optical conductivity σ1(ω) and to allow addressing the high-frequency decay of σ1(ω)
above the CDW gap. For that reason we performed a new experiment where Reectiv-ity data as a function of pressure of CeTe3 were collected over a broader spectral range,extending up to 1.5 x 104 cm−1, well beyond the CDW gap [70]. The extension of themeasured range allows to achieve a robust determination of the frequency dependence ofthe optical conductivity at high energy scales, and to look for the pressure dependenceof its possible power-law behavior. The latter is supposed to supply a ngerprint on theevolution of the intrinsic dimensionality of the system (see section 1.2.2) and will be dis-cussed later in section 4.1.7.
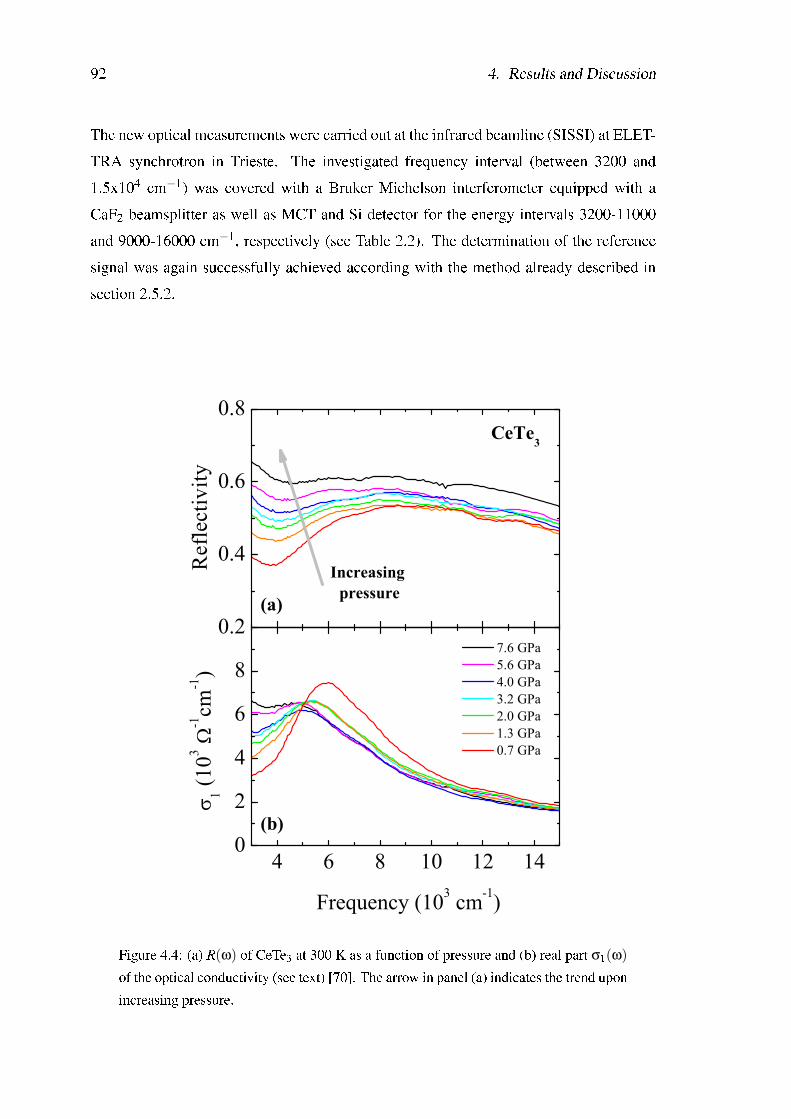
92 4. Results and Discussion
The new optical measurements were carried out at the infrared beamline (SISSI) at ELET-TRA synchrotron in Trieste. The investigated frequency interval (between 3200 and1.5x104 cm−1) was covered with a Bruker Michelson interferometer equipped with aCaF2 beamsplitter as well as MCT and Si detector for the energy intervals 3200-11000and 9000-16000 cm−1, respectively (see Table 2.2). The determination of the referencesignal was again successfully achieved according with the method already described insection 2.5.2.
0.2
0.4
0.6
0.8
Increasing pressure(a)
CeTe3
7.6 GPa 5.6 GPa 4.0 GPa 3.2 GPa 2.0 GPa 1.3 GPa 0.7 GPa
Ref
lect
ivity
4 6 8 10 12 140
2
4
6
8
(b)
Frequency (103 cm-1)
1 (103
-1cm
-1)
Figure 4.4: (a) R(ω) of CeTe3 at 300 K as a function of pressure and (b) real part σ1(ω)
of the optical conductivity (see text) [70]. The arrow in panel (a) indicates the trend uponincreasing pressure.
4.1 Optical spectroscopy on RETen (n=2,3) 93
Figure 4.4a shows the collected R(ω) data on CeTe3 while Fig. 4.4b displays the resultingσ1(ω) (obtained by KK, see section 2.6.2) as a function of pressure at 300 K in the spec-tral range covered within the DAC [70]. Besides extending to much higher frequenciesthan in the rst investigation [55], the quality of the data in Fig. 4.4 is also very muchimproved and the annoying interference pattern due to diffused light in the previous spec-tra (Fig. 4.3a) are no longer present. The overall trend agrees, however, with the earlyndings and establishes once more an analogy between the optical responses upon com-pressing the lattice either by externally applied pressure or by chemical substitution. R(ω)
at low pressures is characterized by the depletion at about 4000 cm−1, at the onset of thebroad bump which extends into the UV spectral range. The minimum of R(ω) at about4000 cm−1 progressively lls in under pressure. The broad bump is ascribed also here tothe excitation across the CDW gap into a single particle (SP) state. Its disappearance withpressure signals the closing of the CDW gap and is accompanied by an overall increaseof the R(ω) signal, indicating an enhancement of the metallicity of the system.
Before applying the Kramers-Kronig transformations in order to get the optical con-ductivity one rst needs to extend R(ω) beyond the measured energy interval. We madeuse of the analysis described in details in section 2.6.2, based on the well establishedprocedure presented in Ref. [39]. The procedure is based on the phenomenological LDapproach which allows to reconstruct the Reectivity inside the DAC starting from the tof the Reectivity of CeTe3 (Fig. 4.1a) measured in air and at zero pressure in the verybroad spectral range. The t components as well as the overall LD-t procedure at zeropressure in CeTe3 are identical to the situation represented in Fig. 4.2 for DyTe3. The tparameters employed to reproduce the Reectivity of CeTe3 under applied pressure arethen reported in Table C.1 (appendix). Figure 4.4b presents σ1(ω), obtained through theKK procedure applied to the extended Reectivity, in the corresponding spectral rangewhere the R(ω) spectra (Fig. 4.4a) were collected. We immediately recognized two fea-tures: the single particle peak excitation due to the CDW gap and the nite σ1(ω) at lowfrequencies which denes the onset of the effective metallic contribution. Upon applyingpressure it is evident that spectral weight is removed from the CDW gap excitation andmoves into the Drude term at low frequencies. This is coincident with the lling-in ofthe R(ω) depletion at about 4000 cm−1 (Fig. 4.4a). Furthermore, one can qualitativelyappreciate the shift of the CDW gap excitation towards low frequencies, indicating itsprogressive closing upon compressing the lattice. Such a behavior of σ1(ω) is totally
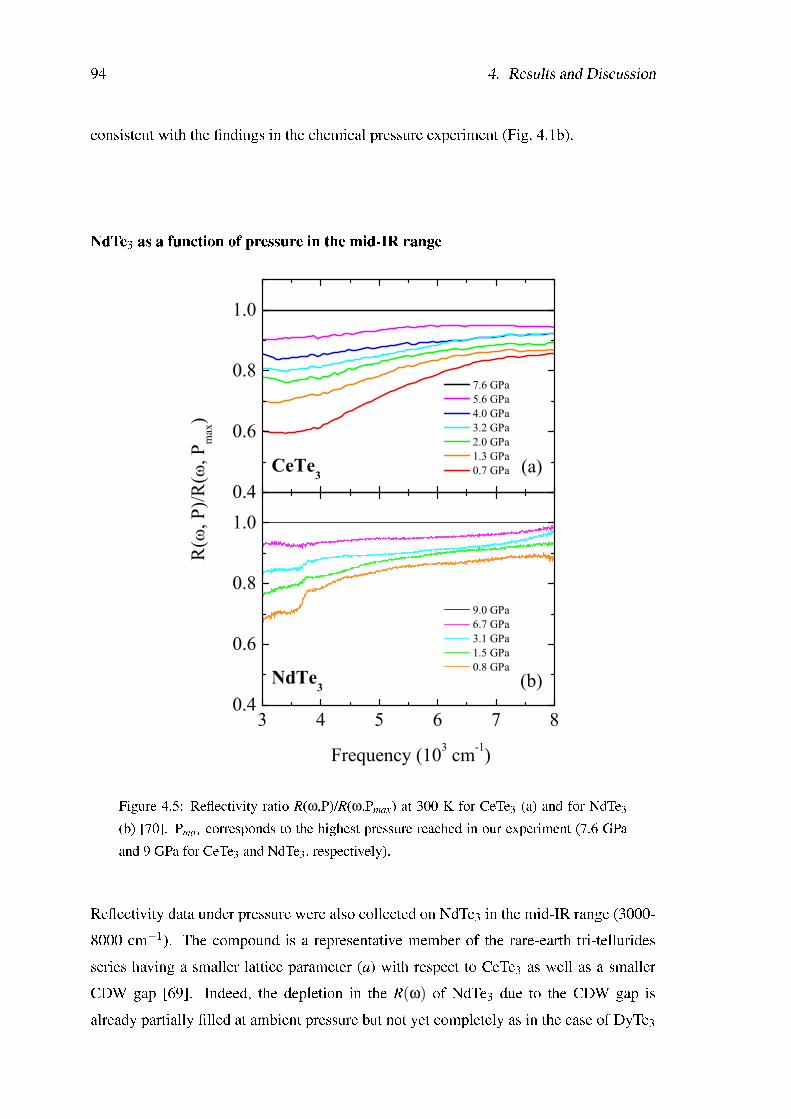
94 4. Results and Discussion
consistent with the ndings in the chemical pressure experiment (Fig. 4.1b).
NdTe3 as a function of pressure in the mid-IR range
0.4
0.6
0.8
1.0
(a)CeTe3
7.6 GPa 5.6 GPa 4.0 GPa 3.2 GPa 2.0 GPa 1.3 GPa 0.7 GPa
3 4 5 6 7 80.4
0.6
0.8
1.0
Frequency (103 cm-1)
(b)NdTe3
9.0 GPa 6.7 GPa 3.1 GPa 1.5 GPa 0.8 GPa
R(
, P)/R
(, P
max
)
Figure 4.5: Reectivity ratio R(ω,P)/R(ω,Pmax) at 300 K for CeTe3 (a) and for NdTe3
(b) [70]. Pmax corresponds to the highest pressure reached in our experiment (7.6 GPaand 9 GPa for CeTe3 and NdTe3, respectively).
Reectivity data under pressure were also collected on NdTe3 in the mid-IR range (3000-8000 cm−1). The compound is a representative member of the rare-earth tri-telluridesseries having a smaller lattice parameter (a) with respect to CeTe3 as well as a smallerCDW gap [69]. Indeed, the depletion in the R(ω) of NdTe3 due to the CDW gap isalready partially lled at ambient pressure but not yet completely as in the case of DyTe3
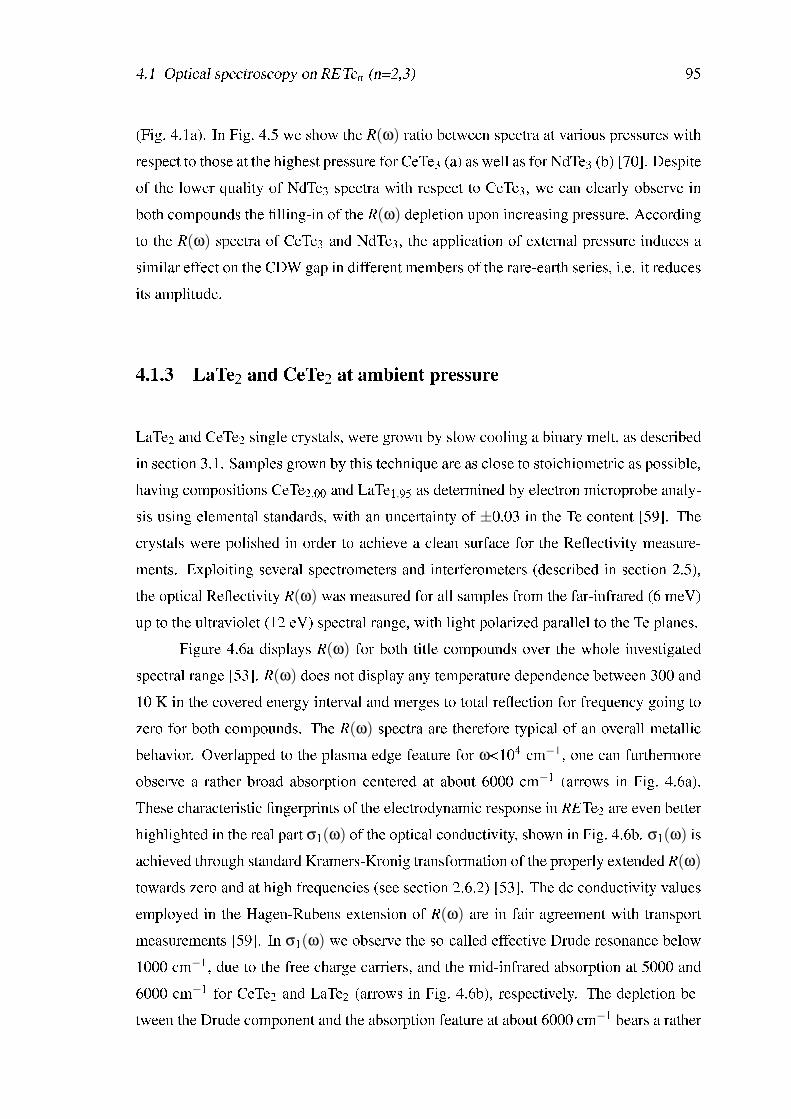
4.1 Optical spectroscopy on RETen (n=2,3) 95
(Fig. 4.1a). In Fig. 4.5 we show the R(ω) ratio between spectra at various pressures withrespect to those at the highest pressure for CeTe3 (a) as well as for NdTe3 (b) [70]. Despiteof the lower quality of NdTe3 spectra with respect to CeTe3, we can clearly observe inboth compounds the lling-in of the R(ω) depletion upon increasing pressure. Accordingto the R(ω) spectra of CeTe3 and NdTe3, the application of external pressure induces asimilar effect on the CDW gap in different members of the rare-earth series, i.e. it reducesits amplitude.
4.1.3 LaTe2 and CeTe2 at ambient pressure
LaTe2 and CeTe2 single crystals, were grown by slow cooling a binary melt, as describedin section 3.1. Samples grown by this technique are as close to stoichiometric as possible,having compositions CeTe2.00 and LaTe1.95 as determined by electron microprobe analy-sis using elemental standards, with an uncertainty of ±0.03 in the Te content [59]. Thecrystals were polished in order to achieve a clean surface for the Reectivity measure-ments. Exploiting several spectrometers and interferometers (described in section 2.5),the optical Reectivity R(ω) was measured for all samples from the far-infrared (6 meV)up to the ultraviolet (12 eV) spectral range, with light polarized parallel to the Te planes.
Figure 4.6a displays R(ω) for both title compounds over the whole investigatedspectral range [53]. R(ω) does not display any temperature dependence between 300 and10 K in the covered energy interval and merges to total reection for frequency going tozero for both compounds. The R(ω) spectra are therefore typical of an overall metallicbehavior. Overlapped to the plasma edge feature for ω<104 cm−1, one can furthermoreobserve a rather broad absorption centered at about 6000 cm−1 (arrows in Fig. 4.6a).These characteristic ngerprints of the electrodynamic response in RETe2 are even betterhighlighted in the real part σ1(ω) of the optical conductivity, shown in Fig. 4.6b. σ1(ω) isachieved through standard Kramers-Kronig transformation of the properly extended R(ω)
towards zero and at high frequencies (see section 2.6.2) [53]. The dc conductivity valuesemployed in the Hagen-Rubens extension of R(ω) are in fair agreement with transportmeasurements [59]. In σ1(ω) we observe the so-called effective Drude resonance below1000 cm−1, due to the free charge carriers, and the mid-infrared absorption at 5000 and6000 cm−1 for CeTe2 and LaTe2 (arrows in Fig. 4.6b), respectively. The depletion be-tween the Drude component and the absorption feature at about 6000 cm−1 bears a rather
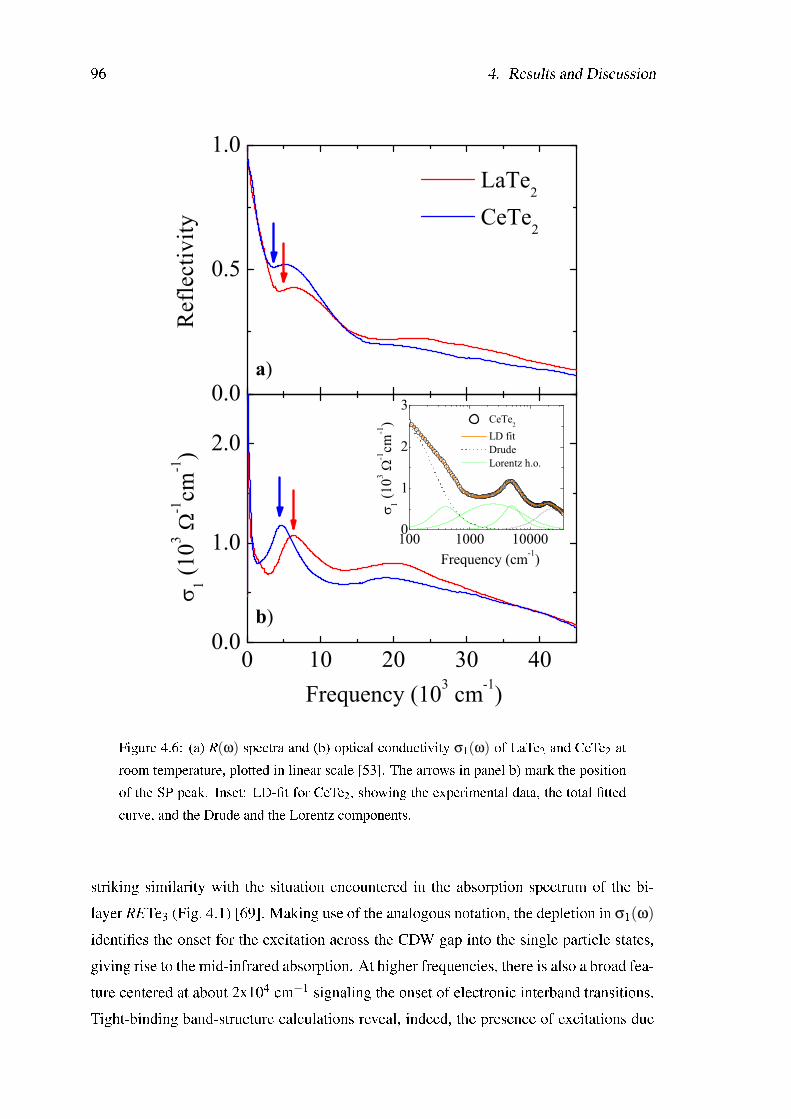
96 4. Results and Discussion
0 10 20 30 400.0
1.0
2.0
0.0
0.5
1.0
100 1000 100000
1
2
3
b)
1 (103
-1cm
-1)
Frequency (103 cm-1)
a)
LaTe2
CeTe2
Ref
lect
ivity
CeTe2
LD fit Drude Lorentz h.o.
Frequency (cm-1)
1 (103
-1cm
-1)
Figure 4.6: (a) R(ω) spectra and (b) optical conductivity σ1(ω) of LaTe2 and CeTe2 atroom temperature, plotted in linear scale [53]. The arrows in panel b) mark the positionof the SP peak. Inset: LD-t for CeTe2, showing the experimental data, the total ttedcurve, and the Drude and the Lorentz components.
striking similarity with the situation encountered in the absorption spectrum of the bi-layer RETe3 (Fig. 4.1) [69]. Making use of the analogous notation, the depletion in σ1(ω)
identies the onset for the excitation across the CDW gap into the single particle states,giving rise to the mid-infrared absorption. At higher frequencies, there is also a broad fea-ture centered at about 2x104 cm−1 signaling the onset of electronic interband transitions.Tight-binding band-structure calculations reveal, indeed, the presence of excitations due
4.1 Optical spectroscopy on RETen (n=2,3) 97
to the electronic interband transitions well above 1 eV.The absorption spectrum σ1(ω) of CeTe2 and LaTe2 is well reproduced within the
LD approach (inset of Fig. 4.6b) with the same t-philosophy and procedure already em-ployed for RETe3 (Fig. 4.2 in section 4.1.1). The t parameters are reported in Table C.2and will be discussed in section 4.1.5.
4.1.4 IR spectra of LaTe2 under applied pressure
Variation in the Te concentration for different members of the RE ditellurides makes asystematic study across the whole rare-earth series in RETe2 less meaningful than hasbeen the case for RETe3 [69]. In contrast, externally applied pressure has the distinctadvantage of varying the lattice parameters for a single sample. This would enable a directmeasurements of the effect of lattice compression on RETe2 and would allow comparingthe impact of such an effect among the two classes of RE telluride compounds. We carriedout Reectivity measurements of RETe2 under applied pressure exploiting again the highbrilliance of the infrared beamline at Elettra synchrotron in Trieste. The incident andreected light were focused and collected by the optical microscope equipped with aMCT detector and coupled to a Bruker Michelson interferometer with KBr and CaF2
beam splitter, which allows us to explore the 800-11000 cm−1 spectral range (see Table2.2 in section 2.5.2). In this experiment it was possible to obtain high-quality spectra ofthe gasket so that we determine the reference signal following the procedure describedin section 2.5.2. Figure 4.7 displays the pressure dependence of R(ω) between 103 and1.1 x 104 cm−1, where the strong diamond absorption around 2000 cm−1 has been cutout from the spectra [54]. In contrast to the rst pressure-dependent optical investigationon CeTe3 [55] the R(ω) spectra of LaTe2 are remarkably smooth and do not display anyevidence for interference pattern between the diamond windows because of diffused light.The low pressure R(ω) reproduces the depletion around 5000 cm−1, already observed atambient pressure (arrow in Fig. 4.6a) and ascribed to the onset of the CDW gap excitation.The striking feature in Fig. 4.7 is the progressive increase of R(ω) signal with increasingpressure, accompanied by the lling-in of the deep minimum in R(ω) at about 5000 cm−1.
The optical conductivity was extracted performing the KK transformation of theextended R(ω) within the LD approach and accounting for the sample inside the DAC.The employed KK procedure to achieve σ1(ω) in this pressure dependent experiment was
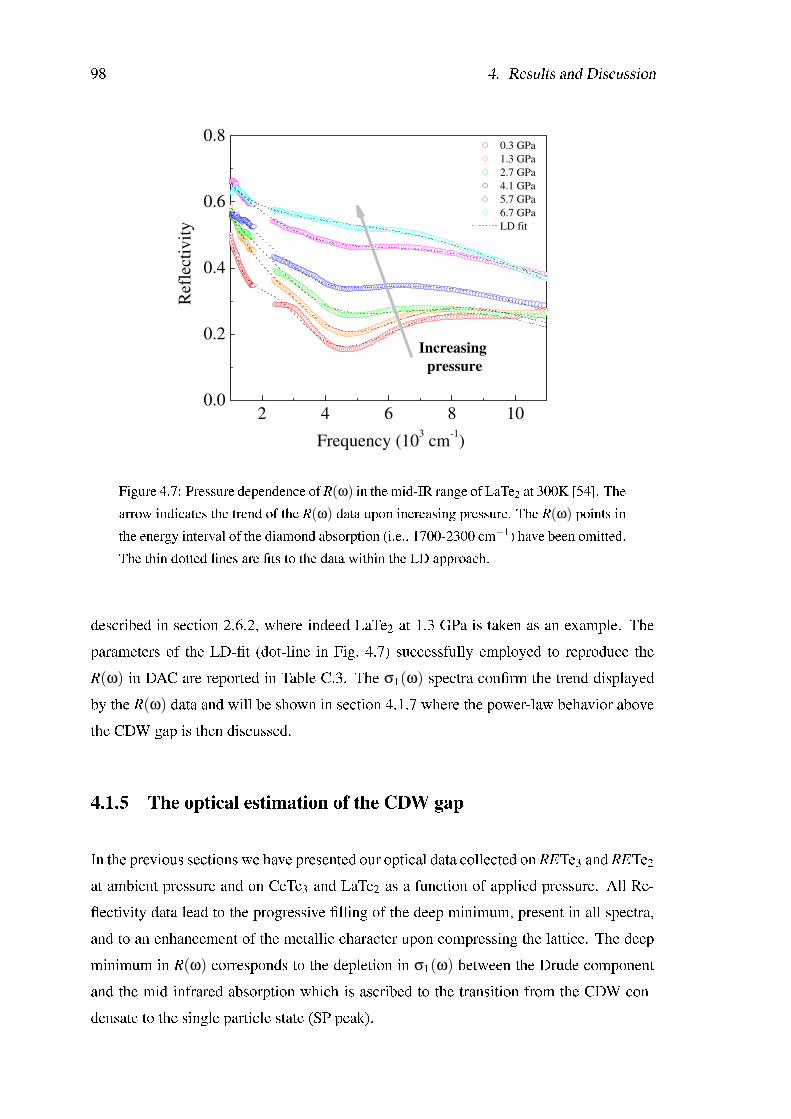
98 4. Results and Discussion
2 4 6 8 100.0
0.2
0.4
0.6
0.8 0.3 GPa
1.3 GPa
2.7 GPa
4.1 GPa
5.7 GPa
6.7 GPa
LD fit
Increasing
pressure
Ref
lect
ivit
y
Frequency (103 cm
-1)
Figure 4.7: Pressure dependence of R(ω) in the mid-IR range of LaTe2 at 300K [54]. Thearrow indicates the trend of the R(ω) data upon increasing pressure. The R(ω) points inthe energy interval of the diamond absorption (i.e., 1700-2300 cm−1) have been omitted.The thin dotted lines are ts to the data within the LD approach.
described in section 2.6.2, where indeed LaTe2 at 1.3 GPa is taken as an example. Theparameters of the LD-t (dot-line in Fig. 4.7) successfully employed to reproduce theR(ω) in DAC are reported in Table C.3. The σ1(ω) spectra conrm the trend displayedby the R(ω) data and will be shown in section 4.1.7 where the power-law behavior abovethe CDW gap is then discussed.
4.1.5 The optical estimation of the CDW gap
In the previous sections we have presented our optical data collected on RETe3 and RETe2
at ambient pressure and on CeTe3 and LaTe2 as a function of applied pressure. All Re-ectivity data lead to the progressive lling of the deep minimum, present in all spectra,and to an enhancement of the metallic character upon compressing the lattice. The deepminimum in R(ω) corresponds to the depletion in σ1(ω) between the Drude componentand the mid-infrared absorption which is ascribed to the transition from the CDW con-densate to the single particle state (SP peak).
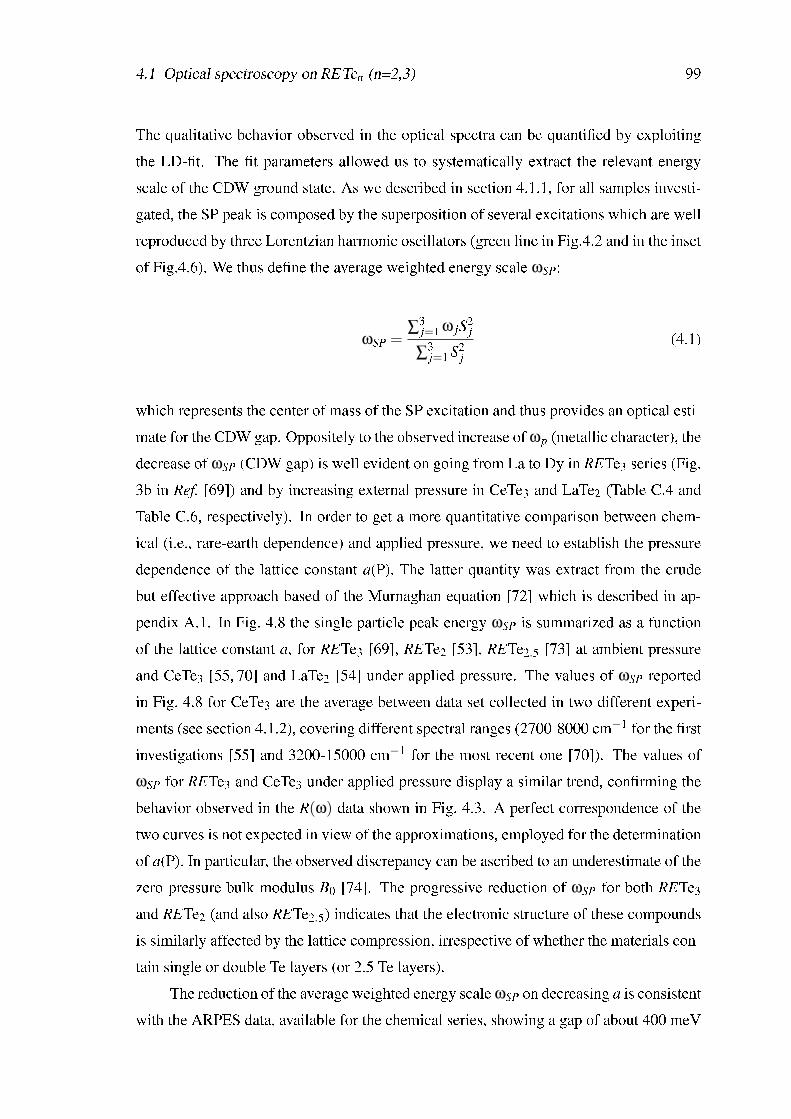
4.1 Optical spectroscopy on RETen (n=2,3) 99
The qualitative behavior observed in the optical spectra can be quantied by exploitingthe LD-t. The t parameters allowed us to systematically extract the relevant energyscale of the CDW ground state. As we described in section 4.1.1, for all samples investi-gated, the SP peak is composed by the superposition of several excitations which are wellreproduced by three Lorentzian harmonic oscillators (green line in Fig.4.2 and in the insetof Fig.4.6). We thus dene the average weighted energy scale ωSP:
ωSP =∑3
j=1 ω jS2j
∑3j=1 S2
j(4.1)
which represents the center of mass of the SP excitation and thus provides an optical esti-mate for the CDW gap. Oppositely to the observed increase of ωp (metallic character), thedecrease of ωSP (CDW gap) is well evident on going from La to Dy in RETe3 series (Fig.3b in Ref. [69]) and by increasing external pressure in CeTe3 and LaTe2 (Table C.4 andTable C.6, respectively). In order to get a more quantitative comparison between chem-ical (i.e., rare-earth dependence) and applied pressure, we need to establish the pressuredependence of the lattice constant a(P). The latter quantity was extract from the crudebut effective approach based of the Murnaghan equation [72] which is described in ap-pendix A.1. In Fig. 4.8 the single particle peak energy ωSP is summarized as a functionof the lattice constant a, for RETe3 [69], RETe2 [53], RETe2.5 [73] at ambient pressureand CeTe3 [55, 70] and LaTe2 [54] under applied pressure. The values of ωSP reportedin Fig. 4.8 for CeTe3 are the average between data set collected in two different experi-ments (see section 4.1.2), covering different spectral ranges (2700-8000 cm−1 for the rstinvestigations [55] and 3200-15000 cm−1 for the most recent one [70]). The values ofωSP for RETe3 and CeTe3 under applied pressure display a similar trend, conrming thebehavior observed in the R(ω) data shown in Fig. 4.3. A perfect correspondence of thetwo curves is not expected in view of the approximations, employed for the determinationof a(P). In particular, the observed discrepancy can be ascribed to an underestimate of thezero-pressure bulk modulus B0 [74]. The progressive reduction of ωSP for both RETe3
and RETe2 (and also RETe2.5) indicates that the electronic structure of these compoundsis similarly affected by the lattice compression, irrespective of whether the materials con-tain single or double Te layers (or 2.5 Te layers).
The reduction of the average weighted energy scale ωSP on decreasing a is consistentwith the ARPES data, available for the chemical series, showing a gap of about 400 meV
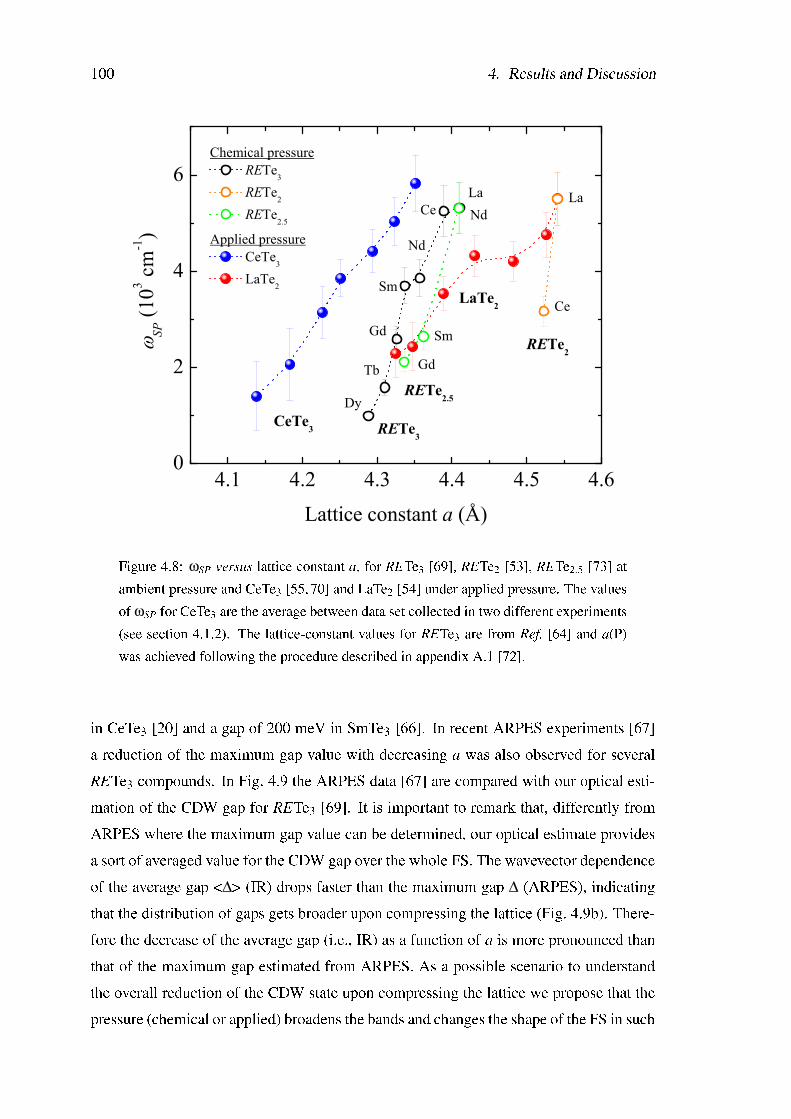
100 4. Results and Discussion
4.1 4.2 4.3 4.4 4.5 4.60
2
4
6
RETe2.5
Ce
La
Chemical pressure RETe
3
RETe2
RETe2.5
Applied pressure CeTe
3
LaTe2
Gd
Sm
Nd
Tb
Dy
Gd
Sm
Nd
LaCe
RETe3
Lattice constant a (Å)
SP
(103 c
m-1
)
CeTe3
LaTe2
RETe2
Figure 4.8: ωSP versus lattice constant a, for RETe3 [69], RETe2 [53], RETe2.5 [73] atambient pressure and CeTe3 [55, 70] and LaTe2 [54] under applied pressure. The valuesof ωSP for CeTe3 are the average between data set collected in two different experiments(see section 4.1.2). The lattice-constant values for RETe3 are from Ref. [64] and a(P)was achieved following the procedure described in appendix A.1 [72].
in CeTe3 [20] and a gap of 200 meV in SmTe3 [66]. In recent ARPES experiments [67]a reduction of the maximum gap value with decreasing a was also observed for severalRETe3 compounds. In Fig. 4.9 the ARPES data [67] are compared with our optical esti-mation of the CDW gap for RETe3 [69]. It is important to remark that, differently fromARPES where the maximum gap value can be determined, our optical estimate providesa sort of averaged value for the CDW gap over the whole FS. The wavevector dependenceof the average gap <∆> (IR) drops faster than the maximum gap ∆ (ARPES), indicatingthat the distribution of gaps gets broader upon compressing the lattice (Fig. 4.9b). There-fore the decrease of the average gap (i.e., IR) as a function of a is more pronounced thanthat of the maximum gap estimated from ARPES. As a possible scenario to understandthe overall reduction of the CDW state upon compressing the lattice we propose that thepressure (chemical or applied) broadens the bands and changes the shape of the FS in such
4.1 Optical spectroscopy on RETen (n=2,3) 101
a way to alter the favorable nesting conditions. These latter are the prerequisite for theformation of the CDW condensate (chapter 1). The decrease of ωSP upon compressing thelattice is then consistent with the reduction of the perfectly nested FS regions (with largeCDW gap) in favor of the non perfectly nested ones (with small CDW gap). This inducesmoreover an increase of spectral weight at low frequencies into the Drude component,thus having consequences on the effective gapping of the FS (see below).
4.30 4.35 4.400
2
4
6
Sm
RETe3
SP (IR)
max (ARPES)
LaCe
Gd
TbDy
Sm
Nd
Ce La
Gd
Tb
Dy
(1
03 c
m-1
)
Lattice parameter (Å)
a) b)
Figure 4.9: a) The optical estimation of the CDW gap (ωSP=<∆>) [69] and the maximumgap value from ARPES data [67] are plotted versus lattice constant a [64], for RETe3.b) The comparison between average gap <∆> (IR) and maximum gap ∆ (ARPES) as afunction of the wavevector is sketched for a situation with good and bad nesting of theFS, respectively.
4.1.6 The optical estimation of the fraction of the ungapped FS
Further support to the above considerations comes from the behavior of the plasma fre-quency and from sum rule arguments. The plasma frequency ωp, the square of whichrepresents the total spectral weight of the Drude peak, is indicative of the metallic degreeof the system. The values of ωp extracted from our investigations on CeTe3 and LaTe2
(Table C.1 and Table C.3, respectively) show an enhancement of the Drude weight under
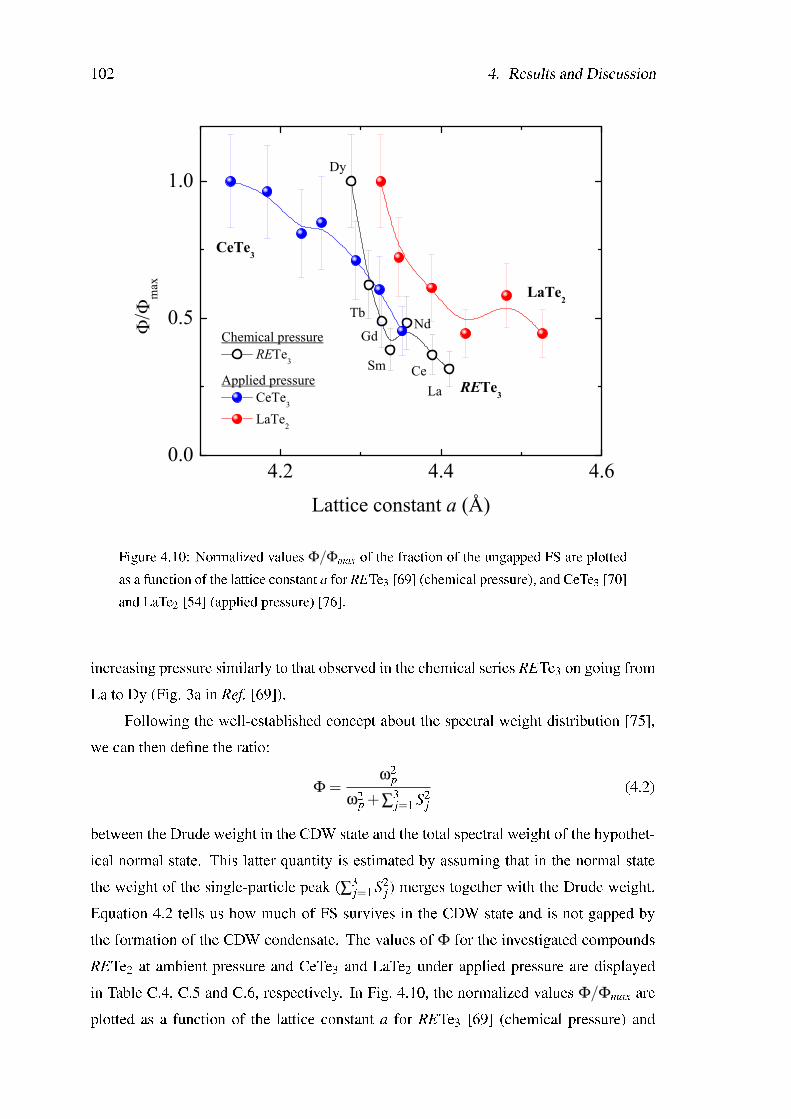
102 4. Results and Discussion
4.2 4.4 4.60.0
0.5
1.0
Chemical pressure RETe
3
Applied pressure CeTe
3
LaTe2
Tb
Dy
Gd
Sm
Nd
LaCe
RETe3
Lattice constant a (Å)
/max
CeTe3
LaTe2
Figure 4.10: Normalized values Φ/Φmax of the fraction of the ungapped FS are plottedas a function of the lattice constant a for RETe3 [69] (chemical pressure), and CeTe3 [70]and LaTe2 [54] (applied pressure) [76].
increasing pressure similarly to that observed in the chemical series RETe3 on going fromLa to Dy (Fig. 3a in Ref. [69]).
Following the well-established concept about the spectral weight distribution [75],we can then dene the ratio:
Φ =ω2
pω2
p +∑3j=1 S2
j(4.2)
between the Drude weight in the CDW state and the total spectral weight of the hypothet-ical normal state. This latter quantity is estimated by assuming that in the normal statethe weight of the single-particle peak (∑3
j=1 S2j ) merges together with the Drude weight.
Equation 4.2 tells us how much of FS survives in the CDW state and is not gapped bythe formation of the CDW condensate. The values of Φ for the investigated compoundsRETe2 at ambient pressure and CeTe3 and LaTe2 under applied pressure are displayedin Table C.4, C.5 and C.6, respectively. In Fig. 4.10, the normalized values Φ/Φmax areplotted as a function of the lattice constant a for RETe3 [69] (chemical pressure) and

4.1 Optical spectroscopy on RETen (n=2,3) 103
1 2 3 4 5 6 70.01
0.02
0.03
0.04
0.05
0.06
Nd
Ce
Tb
La
Gd
Sm
SP (103 cm-1)
CeTe
3 (applied pressure)
RETe3 (chemical pressure)
Figure 4.11: The ratio Φ (eq. 4.2) versus the single particle peak ωSP (eq. 4.1) for theexperiment on CeTe3 under externally applied pressure [70] and for the data collectedon the RETe3 series (i.e., chemical pressure) [69].
CeTe3 [70] and LaTe2 [54] (applied pressure) [76]. The portion of the ungapped FS in-creases on decreasing a, thus emphasizing the lesser impact of the CDW on the FS uponreducing the lattice constant.
The estimation of Φ for the RETe3 series (i.e., chemical pressure) [69] relies onthe very robust Lorentz-Drude analysis of the electrodynamic response over a very broadspectral range, covered with optical experiments at ambient pressure. It was establishedthat as little as 2% to 7% of the original FS remains in the CDW state, going across thechemical series from LaTe3 to DyTe3. These values are smaller but of the same order ofmagnitude as those obtained through a de Haas-van Alphen investigation of LaTe3 [77].Although the agreement among the two techniques is not perfect, these latter data givesome condence in our procedure based on spectral weight arguments of σ1(ω) in estab-lishing the ungapped fraction of the FS. For the optical experiment under applied pressure,caution should be placed on the estimation of Φ, which is obviously affected by the limi-tations in estimating the Drude weight because of the reduced extension of the measured
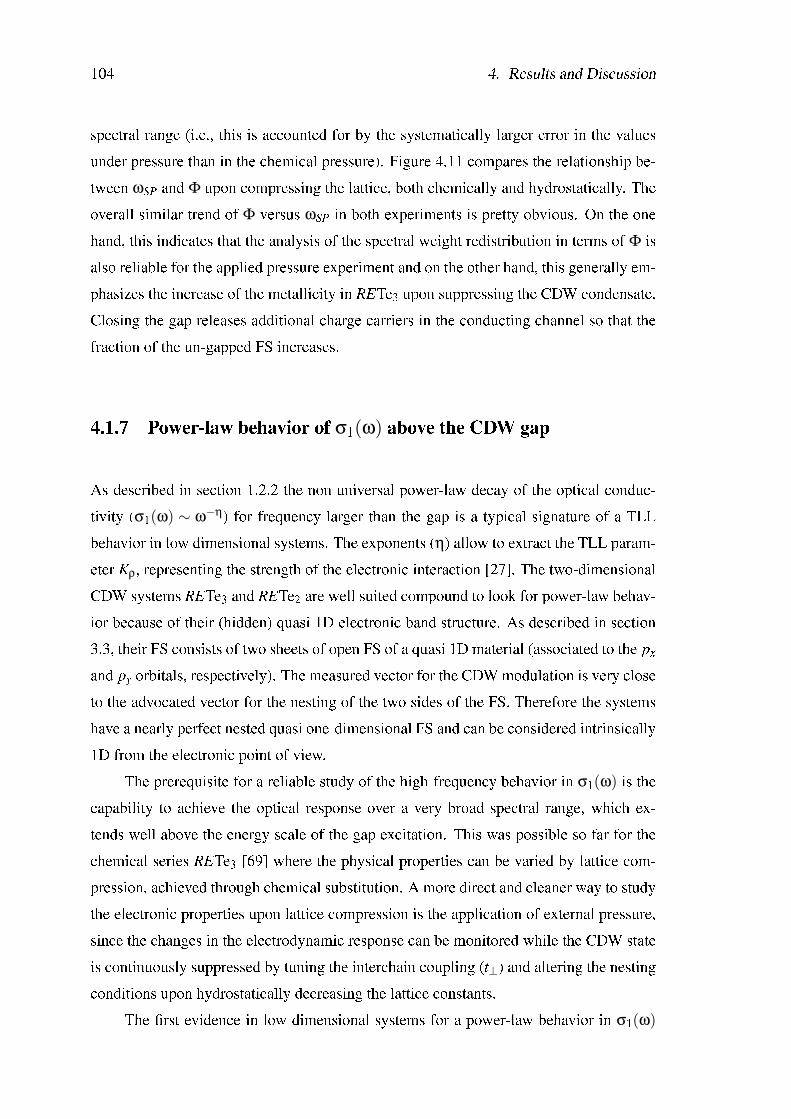
104 4. Results and Discussion
spectral range (i.e., this is accounted for by the systematically larger error in the valuesunder pressure than in the chemical pressure). Figure 4.11 compares the relationship be-tween ωSP and Φ upon compressing the lattice, both chemically and hydrostatically. Theoverall similar trend of Φ versus ωSP in both experiments is pretty obvious. On the onehand, this indicates that the analysis of the spectral weight redistribution in terms of Φ isalso reliable for the applied pressure experiment and on the other hand, this generally em-phasizes the increase of the metallicity in RETe3 upon suppressing the CDW condensate.Closing the gap releases additional charge carriers in the conducting channel so that thefraction of the un-gapped FS increases.
4.1.7 Power-law behavior of σ1(ω) above the CDW gap
As described in section 1.2.2 the non universal power-law decay of the optical conduc-tivity (σ1(ω) ∼ ω−η) for frequency larger than the gap is a typical signature of a TLLbehavior in low dimensional systems. The exponents (η) allow to extract the TLL param-eter Kρ, representing the strength of the electronic interaction [27]. The two-dimensionalCDW systems RETe3 and RETe2 are well suited compound to look for power-law behav-ior because of their (hidden) quasi 1D electronic band structure. As described in section3.3, their FS consists of two sheets of open FS of a quasi 1D material (associated to the px
and py orbitals, respectively). The measured vector for the CDW modulation is very closeto the advocated vector for the nesting of the two sides of the FS. Therefore the systemshave a nearly perfect nested quasi one-dimensional FS and can be considered intrinsically1D from the electronic point of view.
The prerequisite for a reliable study of the high-frequency behavior in σ1(ω) is thecapability to achieve the optical response over a very broad spectral range, which ex-tends well above the energy scale of the gap excitation. This was possible so far for thechemical series RETe3 [69] where the physical properties can be varied by lattice com-pression, achieved through chemical substitution. A more direct and cleaner way to studythe electronic properties upon lattice compression is the application of external pressure,since the changes in the electrodynamic response can be monitored while the CDW stateis continuously suppressed by tuning the interchain coupling (t⊥) and altering the nestingconditions upon hydrostatically decreasing the lattice constants.
The rst evidence in low dimensional systems for a power-law behavior in σ1(ω)
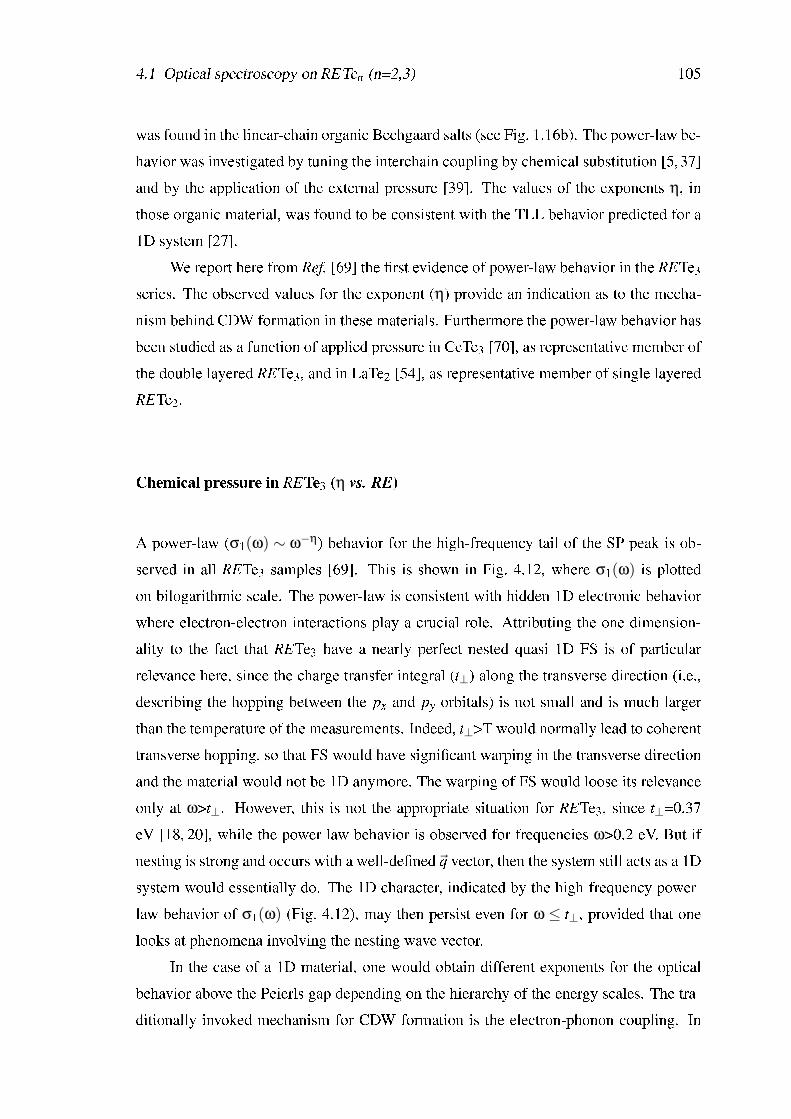
4.1 Optical spectroscopy on RETen (n=2,3) 105
was found in the linear-chain organic Bechgaard salts (see Fig. 1.16b). The power-law be-havior was investigated by tuning the interchain coupling by chemical substitution [5,37]and by the application of the external pressure [39]. The values of the exponents η, inthose organic material, was found to be consistent with the TLL behavior predicted for a1D system [27].
We report here from Ref. [69] the rst evidence of power-law behavior in the RETe3
series. The observed values for the exponent (η) provide an indication as to the mecha-nism behind CDW formation in these materials. Furthermore the power-law behavior hasbeen studied as a function of applied pressure in CeTe3 [70], as representative member ofthe double layered RETe3, and in LaTe2 [54], as representative member of single layeredRETe2.
Chemical pressure in RETe3 (η vs. RE)
A power-law (σ1(ω) ∼ ω−η) behavior for the high-frequency tail of the SP peak is ob-served in all RETe3 samples [69]. This is shown in Fig. 4.12, where σ1(ω) is plottedon bilogarithmic scale. The power-law is consistent with hidden 1D electronic behaviorwhere electron-electron interactions play a crucial role. Attributing the one dimension-ality to the fact that RETe3 have a nearly perfect nested quasi 1D FS is of particularrelevance here, since the charge transfer integral (t⊥) along the transverse direction (i.e.,describing the hopping between the px and py orbitals) is not small and is much largerthan the temperature of the measurements. Indeed, t⊥>T would normally lead to coherenttransverse hopping, so that FS would have signicant warping in the transverse directionand the material would not be 1D anymore. The warping of FS would loose its relevanceonly at ω>t⊥. However, this is not the appropriate situation for RETe3, since t⊥=0.37eV [18, 20], while the power-law behavior is observed for frequencies ω>0.2 eV. But ifnesting is strong and occurs with a well-dened~q vector, then the system still acts as a 1Dsystem would essentially do. The 1D character, indicated by the high-frequency power-law behavior of σ1(ω) (Fig. 4.12), may then persist even for ω ≤ t⊥, provided that onelooks at phenomena involving the nesting wave vector.
In the case of a 1D material, one would obtain different exponents for the opticalbehavior above the Peierls gap depending on the hierarchy of the energy scales. The tra-ditionally invoked mechanism for CDW formation is the electron-phonon coupling. In
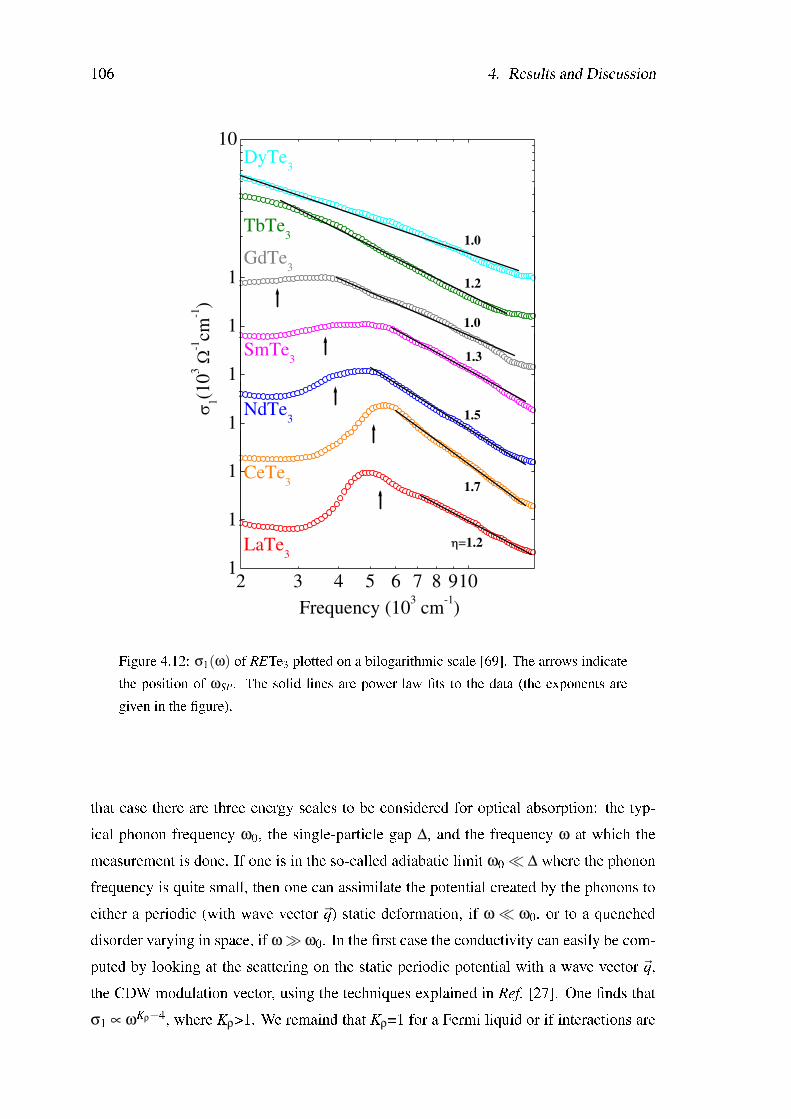
106 4. Results and Discussion
1
10
2 3 4 5 6 7 8 9101
=1.2LaTe3
Frequency (103 cm
-1)
1
1.3
1.5
1.7CeTe
31
NdTe31
1.0
SmTe3
1(1
03
-1cm
-1)
1
GdTe3
1
1.0
1.2
TbTe3
DyTe3
Figure 4.12: σ1(ω) of RETe3 plotted on a bilogarithmic scale [69]. The arrows indicatethe position of ωSP. The solid lines are power-law ts to the data (the exponents aregiven in the gure).
that case there are three energy scales to be considered for optical absorption: the typ-ical phonon frequency ω0, the single-particle gap ∆, and the frequency ω at which themeasurement is done. If one is in the so-called adiabatic limit ω0 ¿ ∆ where the phononfrequency is quite small, then one can assimilate the potential created by the phonons toeither a periodic (with wave vector ~q) static deformation, if ω ¿ ω0, or to a quencheddisorder varying in space, if ωÀ ω0. In the rst case the conductivity can easily be com-puted by looking at the scattering on the static periodic potential with a wave vector ~q,the CDW modulation vector, using the techniques explained in Ref. [27]. One nds thatσ1 ∝ ωKρ−4, where Kρ>1. We remaind that Kρ=1 for a Fermi liquid or if interactions are
4.1 Optical spectroscopy on RETen (n=2,3) 107
weak and decreases with increasingly repulsive interactions. It is clear that such a re-sult would not be compatible with the data, making it hard to have the standard adiabaticmechanism for the CDW formation. The other case, when the phonon potential is viewedby the electron as a quenched disorder, is also not quite compatible with the data. Indeedin that case one nds σ1 ∝ ωKρ−3. A weakly interacting system would thus give expo-nents of order -2 (η=2) or slightly below, in somewhat closer but yet very unsatisfactoryagreement with the data. It thus seems unlikely that the data are explained by the standardscattering over a distortion due to adiabatic phonons. The data would on the contrary bein reasonable agreement with the so-called antiadiabatic limit (∆,ω)¿ ω0, in which onecan integrate over the phonon eld. The phonon uctuations introduce then an effectiveinteraction between the particles which corresponds to an umklapp scattering and whichleads to an expression for σ1(ω) as that of equation 1.51 for the half-lling case (n=1).This would lead to exponents close or slightly smaller than -1, in much better agreementwith the data. It is however extremely unlikely to be able to nd phonons of such highfrequency, since one would need ω0>1eV. Consequently, phonons alone could not explainthe observed optical data and power-laws.
A much more probable source for such an umklapp scattering leading to equa-tion 1.51 is the direct interaction between electrons, allowing the transfer of two particlesfrom one sheet of the FS to the other and thus transferring 4~q to the lattice. Note thatthe proposed wave vector for the CDW modulation is indeed giving a value for 4~q closeto a reciprocal lattice vector, and thus allowing such umklapp processes to be effective.As explained in section 1.2.2, the umklapp process leading to a power-law behavior inσ1(ω) and in other response functions was theoretically predicted for strict 1D systemswithin the TLL scenario [31] and observed experimentally in the 1D Bechgaard salts withη=1.3 [5].
Even though the exponents for the high-frequency power-law observed in the data donot show a dened trend across the rare-earth series, their absolute values range between1.7 and 1.0. This experimental behavior is in reasonable agreement with the scenariosketched above. This strongly suggests that interactions rather than a standard electron-phonon mechanism could play in RETe3 a rather crucial role in the CDW formation athigh energy scales. The electron-phonon coupling is nevertheless important at differentenergy scale, lower than the gap. This is also conrmed by our Raman investigations,which will be presented in the following section (4.2).
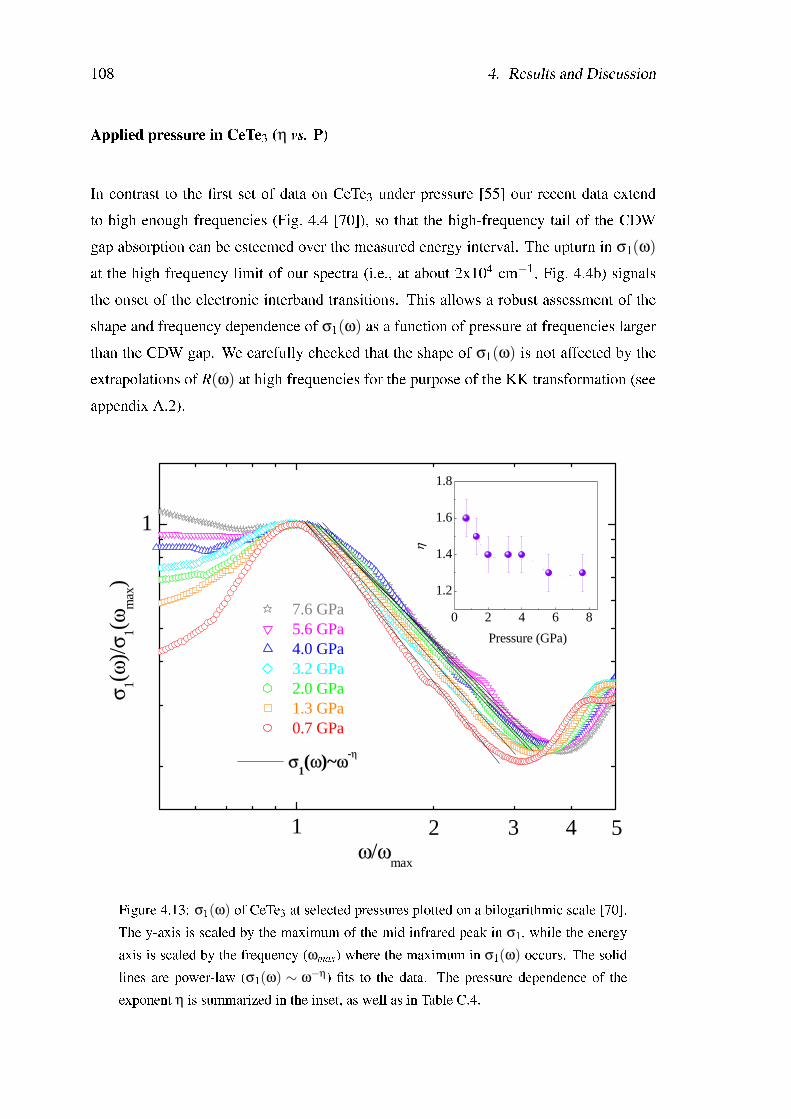
108 4. Results and Discussion
Applied pressure in CeTe3 (η vs. P)
In contrast to the rst set of data on CeTe3 under pressure [55] our recent data extendto high enough frequencies (Fig. 4.4 [70]), so that the high-frequency tail of the CDWgap absorption can be esteemed over the measured energy interval. The upturn in σ1(ω)
at the high frequency limit of our spectra (i.e., at about 2x104 cm−1, Fig. 4.4b) signalsthe onset of the electronic interband transitions. This allows a robust assessment of theshape and frequency dependence of σ1(ω) as a function of pressure at frequencies largerthan the CDW gap. We carefully checked that the shape of σ1(ω) is not affected by theextrapolations of R(ω) at high frequencies for the purpose of the KK transformation (seeappendix A.2).
1
1
0 2 4 6 8
1.2
1.4
1.6
1.8
σ1(ω)~ω
-η
3 4 52
σ1(ω
)/σ
1(ωm
ax)
ω/ωmax
7.6 GPa5.6 GPa4.0 GPa3.2 GPa2.0 GPa1.3 GPa0.7 GPa
η
Pressure (GPa)
Figure 4.13: σ1(ω) of CeTe3 at selected pressures plotted on a bilogarithmic scale [70].The y-axis is scaled by the maximum of the mid infrared peak in σ1, while the energyaxis is scaled by the frequency (ωmax) where the maximum in σ1(ω) occurs. The solidlines are power-law (σ1(ω) ∼ ω−η) ts to the data. The pressure dependence of theexponent η is summarized in the inset, as well as in Table C.4.
4.1 Optical spectroscopy on RETen (n=2,3) 109
Figure 4.13 highlights σ1(ω) for the spectral range above the CDW gap, using a biloga-rithmic scale representation [70]. Furthermore, σ1(ω) has been rescaled by its maximumvalue and the frequency axis by the frequency ωmax where the maximum of σ1(ω) oc-curs. The high energy tail of the CDW gap is well reproduced by a power-law behaviorσ1(ω) ∼ ω−η with exponent η between 1.6 and 1.3 (Table C.4) [78, 79]. The overallbehavior of σ1(ω) agrees with ndings in the rare-earth series RETe3. Similar consid-erations as in the case of the chemical pressure experiment indeed apply here, so that athigh energy scales the crucial role is played by the electron-electron interaction insteadof the electron-phonon coupling. Finally, it is worth noting that the exponent η progres-sively decreases upon compressing the lattice (inset in Fig. 4.13) being quite suggestiveof a crossover from a weakly interacting towards a non-interacting electron gas systemupon reducing the lattice constant. Such a trend in η is not uncommon and has been mostclearly observed in the linear-chain Bechgaard salts. Furthermore, apart from the excep-tion of LaTe3, η behaves similarly in the chemical pressure experiment across the RETe3
series (Fig. 4.12).
Applied pressure in LaTe2 (η vs. P)
Figure 4.14 reports the best power-law σ1(ω)∼ω−η of LaTe2 under pressure in the spec-tral range above the CDW gap absorption [54]. The exponents η are summarized inTable C.6, with an estimation error of about ±0.1. The values of η are very close to 1,which compare fairly well with the pressure results on CeTe3 as well as on LaTe2 andCeTe2, not shown here (Table C.5, [53]). Even though we seek the largest energy inter-val, for which such a power-law in σ1(ω) applies, in most cases though, it is appropriatefor an energy range extending over less than a decade. This means that caution shouldbe placed on the power-law behavior given the rather small frequency interval over whichit is extracted. Nonetheless, the power-law in σ1(ω) is found within the spectral rangeoriginally covered by the R(ω) measurements (extending up to 1.1x104 cm−1) and, asalready stated for CeTe3 case, it is independent of any extrapolation effects in R(ω). Thisis clearly shown in Fig. B.1b of the appendix, where the power-law behaviors in σ1(ω)
for the three different extrapolations of R(ω) are, in fact, almost identical, giving the ex-ponent η∼1.0±0.1.
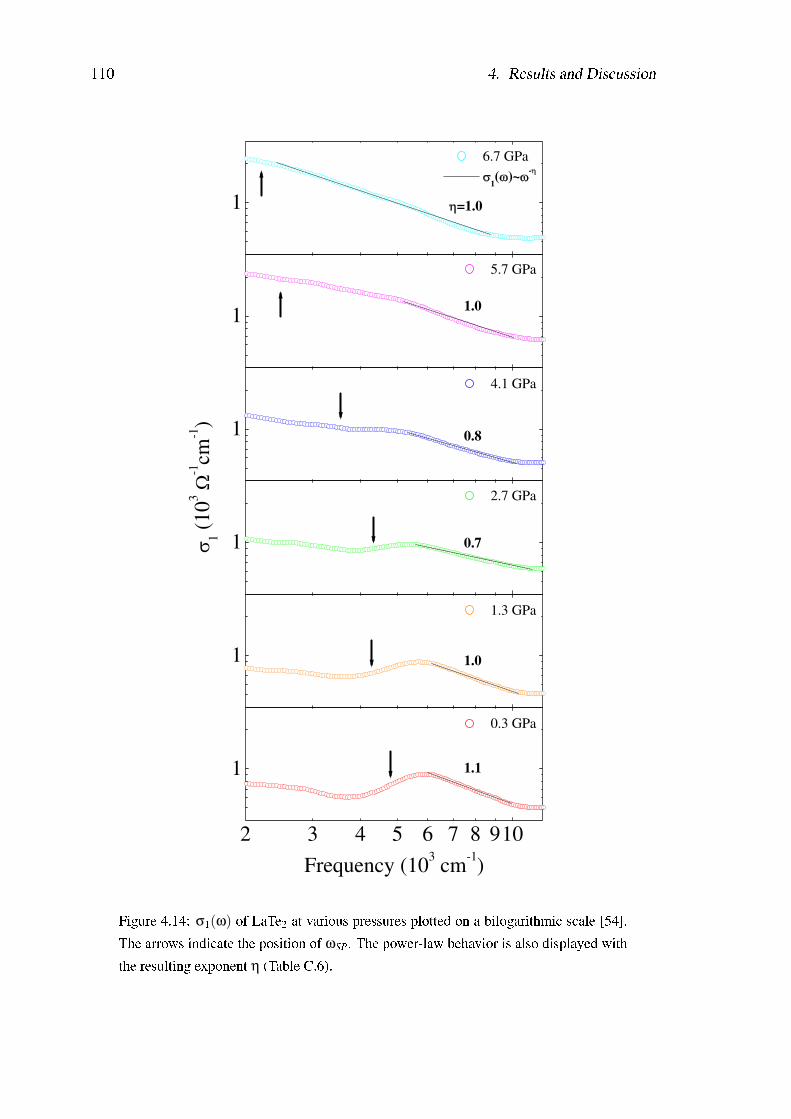
110 4. Results and Discussion
1
1
1
1
2 3 4 5 6 7 8 910
1
1
1.0
5.7 GPa
0.8
4.1 GPa
0.7
2.7 GPa
1.0
1.3 GPa
1.1
1 (
10
3-1cm
-1)
0.3 GPa
Frequency (103 cm
-1)
=1.0
6.7 GPa
1( )~
-
Figure 4.14: σ1(ω) of LaTe2 at various pressures plotted on a bilogarithmic scale [54].The arrows indicate the position of ωSP. The power-law behavior is also displayed withthe resulting exponent η (Table C.6).
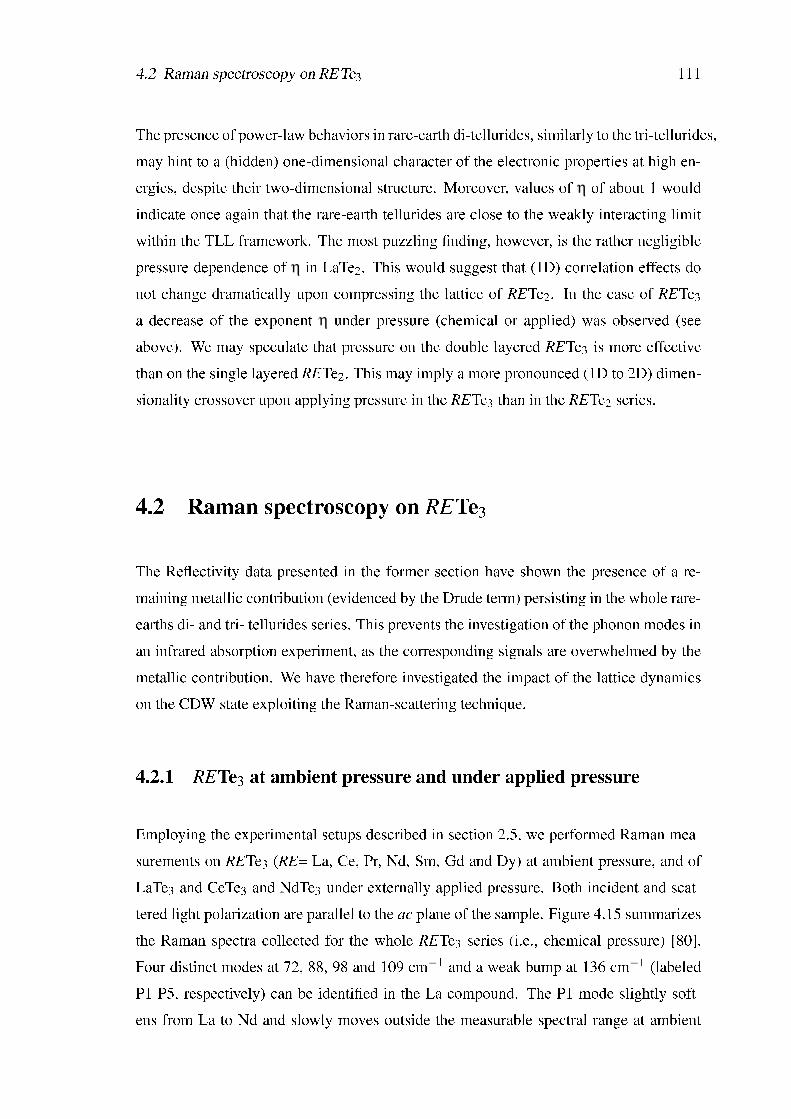
4.2 Raman spectroscopy on RETe3 111
The presence of power-law behaviors in rare-earth di-tellurides, similarly to the tri-tellurides,may hint to a (hidden) one-dimensional character of the electronic properties at high en-ergies, despite their two-dimensional structure. Moreover, values of η of about 1 wouldindicate once again that the rare-earth tellurides are close to the weakly interacting limitwithin the TLL framework. The most puzzling nding, however, is the rather negligiblepressure dependence of η in LaTe2. This would suggest that (1D) correlation effects donot change dramatically upon compressing the lattice of RETe2. In the case of RETe3
a decrease of the exponent η under pressure (chemical or applied) was observed (seeabove). We may speculate that pressure on the double layered RETe3 is more effectivethan on the single layered RETe2. This may imply a more pronounced (1D to 2D) dimen-sionality crossover upon applying pressure in the RETe3 than in the RETe2 series.
4.2 Raman spectroscopy on RETe3
The Reectivity data presented in the former section have shown the presence of a re-maining metallic contribution (evidenced by the Drude term) persisting in the whole rare-earths di- and tri- tellurides series. This prevents the investigation of the phonon modes inan infrared absorption experiment, as the corresponding signals are overwhelmed by themetallic contribution. We have therefore investigated the impact of the lattice dynamicson the CDW state exploiting the Raman-scattering technique.
4.2.1 RETe3 at ambient pressure and under applied pressure
Employing the experimental setups described in section 2.5, we performed Raman mea-surements on RETe3 (RE= La, Ce, Pr, Nd, Sm, Gd and Dy) at ambient pressure, and ofLaTe3 and CeTe3 and NdTe3 under externally applied pressure. Both incident and scat-tered light polarization are parallel to the ac plane of the sample. Figure 4.15 summarizesthe Raman spectra collected for the whole RETe3 series (i.e., chemical pressure) [80].Four distinct modes at 72, 88, 98 and 109 cm−1 and a weak bump at 136 cm−1 (labeledP1-P5, respectively) can be identied in the La compound. The P1 mode slightly soft-ens from La to Nd and slowly moves outside the measurable spectral range at ambient
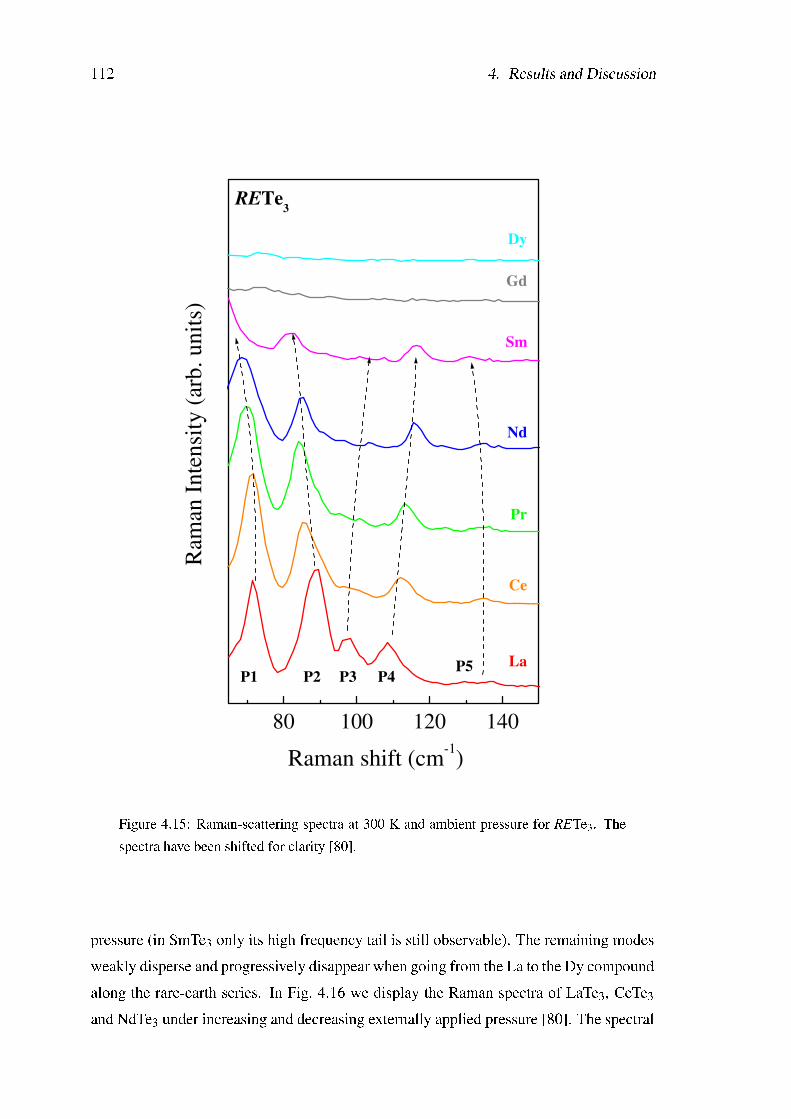
112 4. Results and Discussion
80 100 120 140
Raman shift (cm-1)
P5P4P3P2P1
Dy
Gd
Sm
Nd
Pr
Ce
La
RETe3
Ram
an I
nte
nsi
ty (
arb
. u
nit
s)
Figure 4.15: Raman-scattering spectra at 300 K and ambient pressure for RETe3. Thespectra have been shifted for clarity [80].
pressure (in SmTe3 only its high frequency tail is still observable). The remaining modesweakly disperse and progressively disappear when going from the La to the Dy compoundalong the rare-earth series. In Fig. 4.16 we display the Raman spectra of LaTe3, CeTe3
and NdTe3 under increasing and decreasing externally applied pressure [80]. The spectral
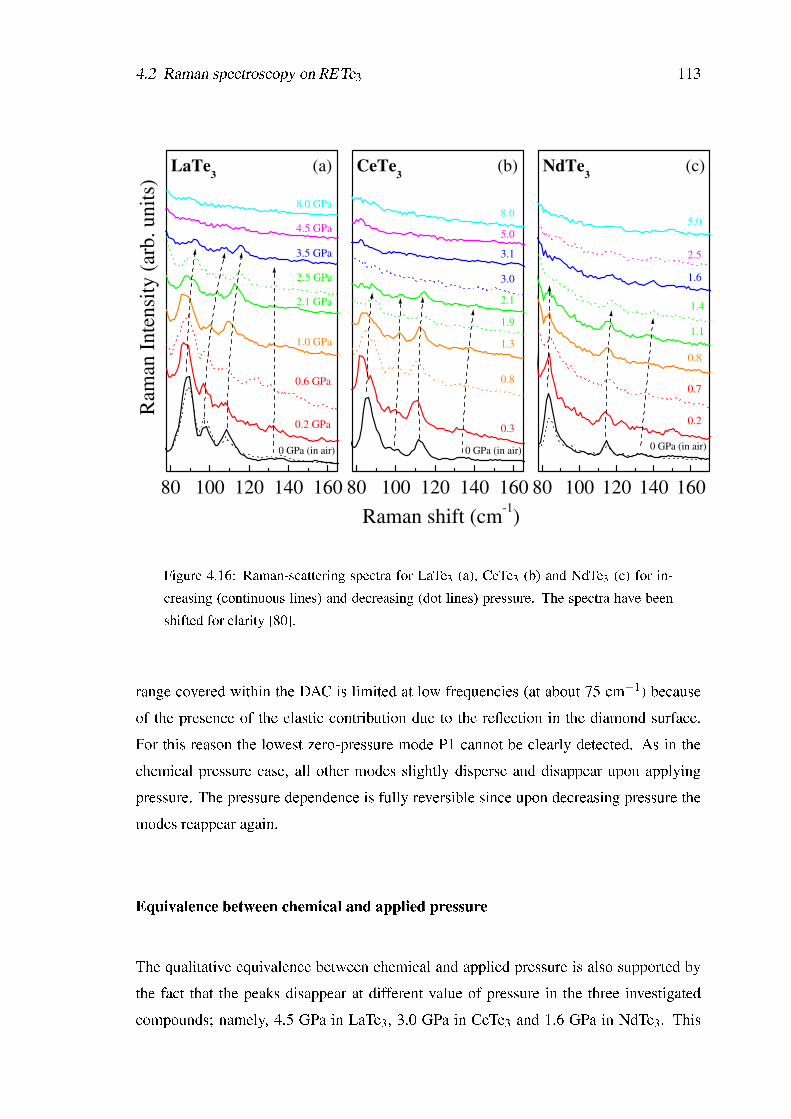
4.2 Raman spectroscopy on RETe3 113
80 100 120 140 160 80 100 120 140 16080 100 120 140 160
0 GPa (in air)
(c)
8.0
3.1
2.1
1.3
5.0
3.0
1.9
0.8
0.3
CeTe3
1.4
0.7
2.5
5.0
1.6
1.1
0.8
0.2
0 GPa (in air)
(a) (b) NdTe3
Ram
an I
nte
nsi
ty (
arb
. u
nit
s)
0.6 GPa
2.5 GPa
0 GPa (in air)
8.0 GPa
4.5 GPa
3.5 GPa
2.1 GPa
1.0 GPa
0.2 GPa
Raman shift (cm-1)
LaTe3
Figure 4.16: Raman-scattering spectra for LaTe3 (a), CeTe3 (b) and NdTe3 (c) for in-creasing (continuous lines) and decreasing (dot lines) pressure. The spectra have beenshifted for clarity [80].
range covered within the DAC is limited at low frequencies (at about 75 cm−1) becauseof the presence of the elastic contribution due to the reection in the diamond surface.For this reason the lowest zero-pressure mode P1 cannot be clearly detected. As in thechemical pressure case, all other modes slightly disperse and disappear upon applyingpressure. The pressure dependence is fully reversible since upon decreasing pressure themodes reappear again.
Equivalence between chemical and applied pressure
The qualitative equivalence between chemical and applied pressure is also supported bythe fact that the peaks disappear at different value of pressure in the three investigatedcompounds; namely, 4.5 GPa in LaTe3, 3.0 GPa in CeTe3 and 1.6 GPa in NdTe3. This
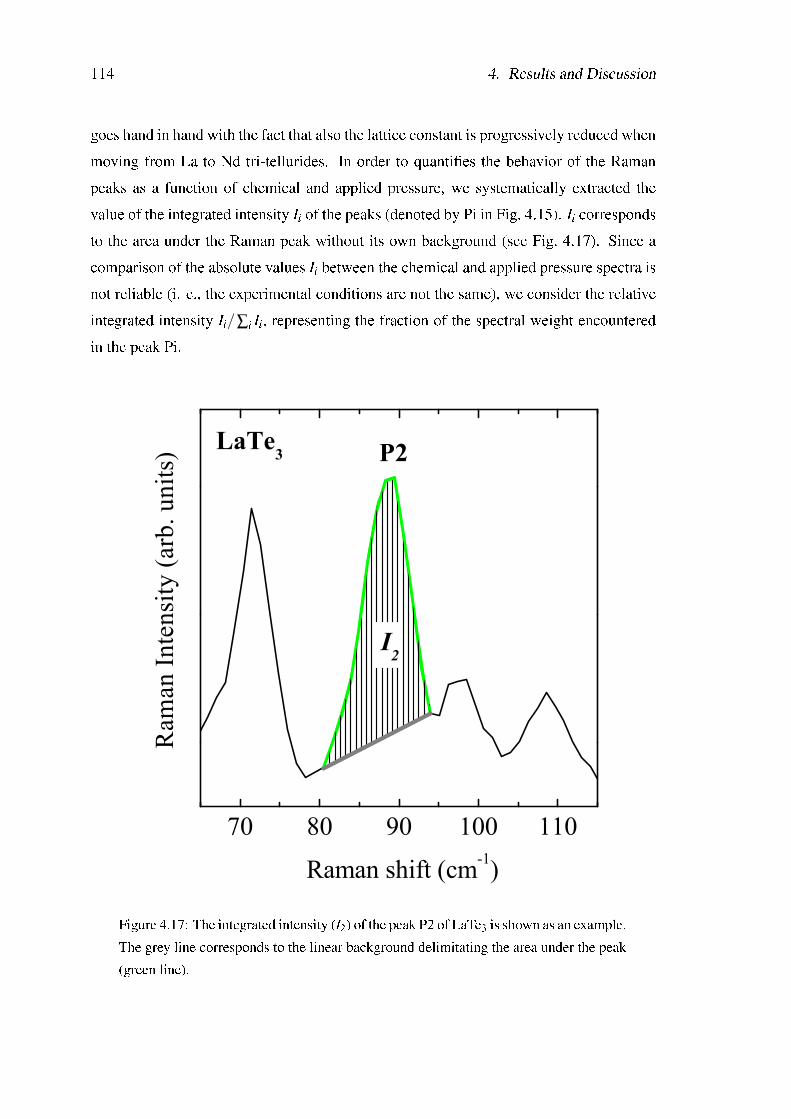
114 4. Results and Discussion
goes hand in hand with the fact that also the lattice constant is progressively reduced whenmoving from La to Nd tri-tellurides. In order to quanties the behavior of the Ramanpeaks as a function of chemical and applied pressure, we systematically extracted thevalue of the integrated intensity Ii of the peaks (denoted by Pi in Fig. 4.15). Ii correspondsto the area under the Raman peak without its own background (see Fig. 4.17). Since acomparison of the absolute values Ii between the chemical and applied pressure spectra isnot reliable (i. e., the experimental conditions are not the same), we consider the relativeintegrated intensity Ii/∑i Ii, representing the fraction of the spectral weight encounteredin the peak Pi.
70 80 90 100 110
Raman shift (cm-1)
I2
LaTe3
Ram
an In
tens
ity (a
rb. u
nits
) P2
Figure 4.17: The integrated intensity (I2) of the peak P2 of LaTe3 is shown as an example.The grey line corresponds to the linear background delimitating the area under the peak(green line).
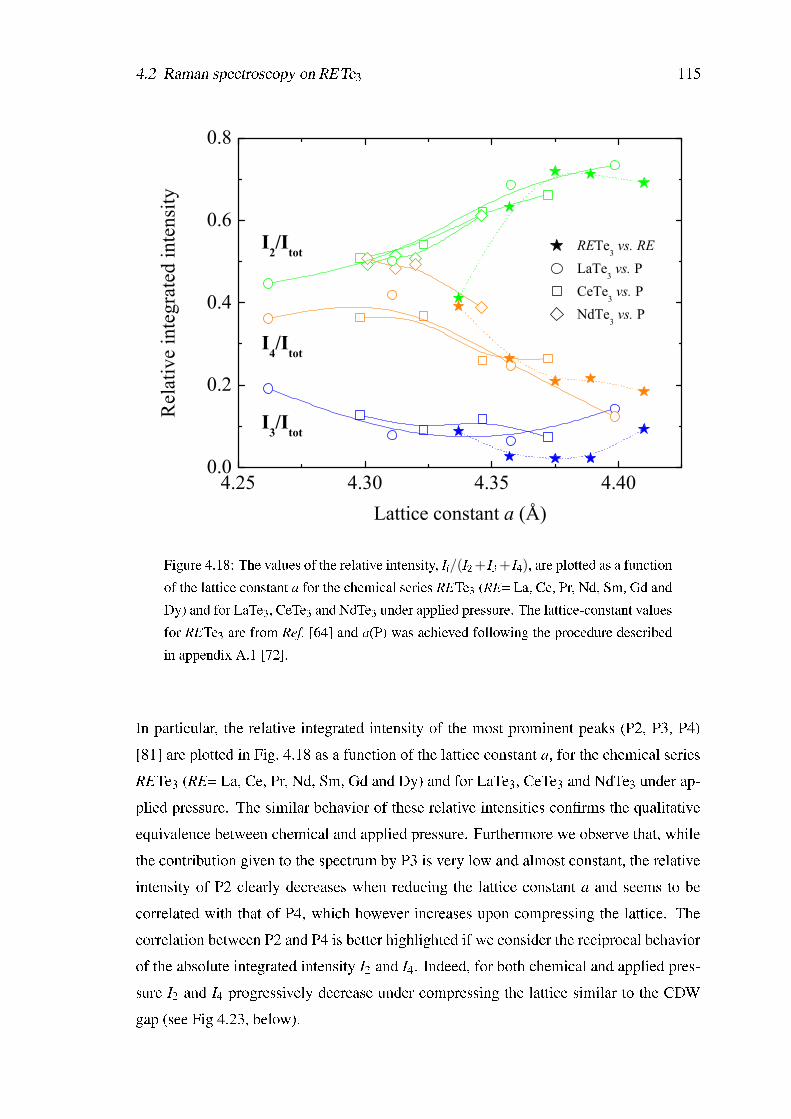
4.2 Raman spectroscopy on RETe3 115
4.25 4.30 4.35 4.400.0
0.2
0.4
0.6
0.8
I3/Itot
I4/Itot
RETe3 vs. RE
LaTe3 vs. P
CeTe3 vs. P
NdTe3 vs. P
Rel
ativ
e in
tegr
ated
inte
nsity
Lattice constant a (Å)
I2/Itot
Figure 4.18: The values of the relative intensity, Ii/(I2 + I3 + I4), are plotted as a functionof the lattice constant a for the chemical series RETe3 (RE= La, Ce, Pr, Nd, Sm, Gd andDy) and for LaTe3, CeTe3 and NdTe3 under applied pressure. The lattice-constant valuesfor RETe3 are from Ref. [64] and a(P) was achieved following the procedure describedin appendix A.1 [72].
In particular, the relative integrated intensity of the most prominent peaks (P2, P3, P4)[81] are plotted in Fig. 4.18 as a function of the lattice constant a, for the chemical seriesRETe3 (RE= La, Ce, Pr, Nd, Sm, Gd and Dy) and for LaTe3, CeTe3 and NdTe3 under ap-plied pressure. The similar behavior of these relative intensities conrms the qualitativeequivalence between chemical and applied pressure. Furthermore we observe that, whilethe contribution given to the spectrum by P3 is very low and almost constant, the relativeintensity of P2 clearly decreases when reducing the lattice constant a and seems to becorrelated with that of P4, which however increases upon compressing the lattice. Thecorrelation between P2 and P4 is better highlighted if we consider the reciprocal behaviorof the absolute integrated intensity I2 and I4. Indeed, for both chemical and applied pres-sure I2 and I4 progressively decrease under compressing the lattice similar to the CDWgap (see Fig 4.23, below).
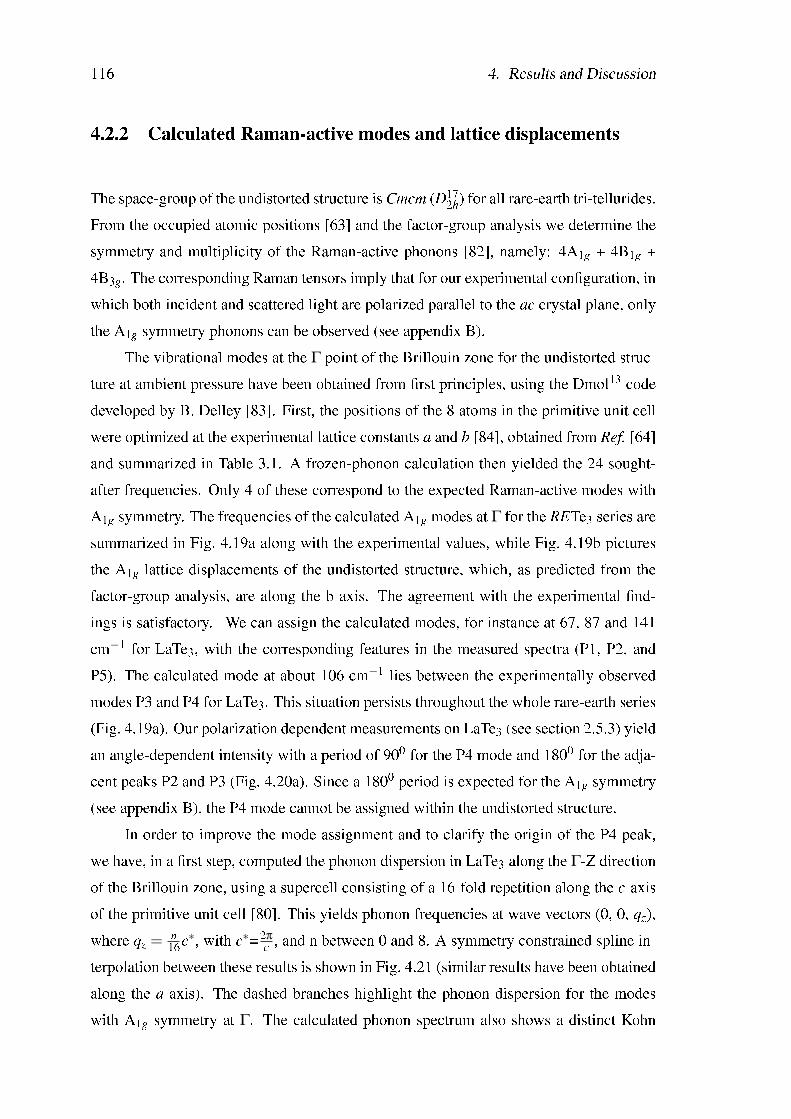
116 4. Results and Discussion
4.2.2 Calculated Raman-active modes and lattice displacements
The space-group of the undistorted structure is Cmcm (D172h) for all rare-earth tri-tellurides.
From the occupied atomic positions [63] and the factor-group analysis we determine thesymmetry and multiplicity of the Raman-active phonons [82], namely: 4A1g + 4B1g +4B3g. The corresponding Raman tensors imply that for our experimental conguration, inwhich both incident and scattered light are polarized parallel to the ac crystal plane, onlythe A1g symmetry phonons can be observed (see appendix B).
The vibrational modes at the Γ point of the Brillouin zone for the undistorted struc-ture at ambient pressure have been obtained from rst principles, using the Dmol13 codedeveloped by B. Delley [83]. First, the positions of the 8 atoms in the primitive unit cellwere optimized at the experimental lattice constants a and b [84], obtained from Ref. [64]and summarized in Table 3.1. A frozen-phonon calculation then yielded the 24 sought-after frequencies. Only 4 of these correspond to the expected Raman-active modes withA1g symmetry. The frequencies of the calculated A1g modes at Γ for the RETe3 series aresummarized in Fig. 4.19a along with the experimental values, while Fig. 4.19b picturesthe A1g lattice displacements of the undistorted structure, which, as predicted from thefactor-group analysis, are along the b axis. The agreement with the experimental nd-ings is satisfactory. We can assign the calculated modes, for instance at 67, 87 and 141cm−1 for LaTe3, with the corresponding features in the measured spectra (P1, P2, andP5). The calculated mode at about 106 cm−1 lies between the experimentally observedmodes P3 and P4 for LaTe3. This situation persists throughout the whole rare-earth series(Fig. 4.19a). Our polarization dependent measurements on LaTe3 (see section 2.5.3) yieldan angle-dependent intensity with a period of 900 for the P4 mode and 1800 for the adja-cent peaks P2 and P3 (Fig. 4.20a). Since a 1800 period is expected for the A1g symmetry(see appendix B), the P4 mode cannot be assigned within the undistorted structure.
In order to improve the mode assignment and to clarify the origin of the P4 peak,we have, in a rst step, computed the phonon dispersion in LaTe3 along the Γ-Z directionof the Brillouin zone, using a supercell consisting of a 16-fold repetition along the c-axisof the primitive unit cell [80]. This yields phonon frequencies at wave vectors (0, 0, qz),where qz = n
16c∗, with c∗=2πc , and n between 0 and 8. A symmetry constrained spline in-
terpolation between these results is shown in Fig. 4.21 (similar results have been obtainedalong the a axis). The dashed branches highlight the phonon dispersion for the modeswith A1g symmetry at Γ. The calculated phonon spectrum also shows a distinct Kohn
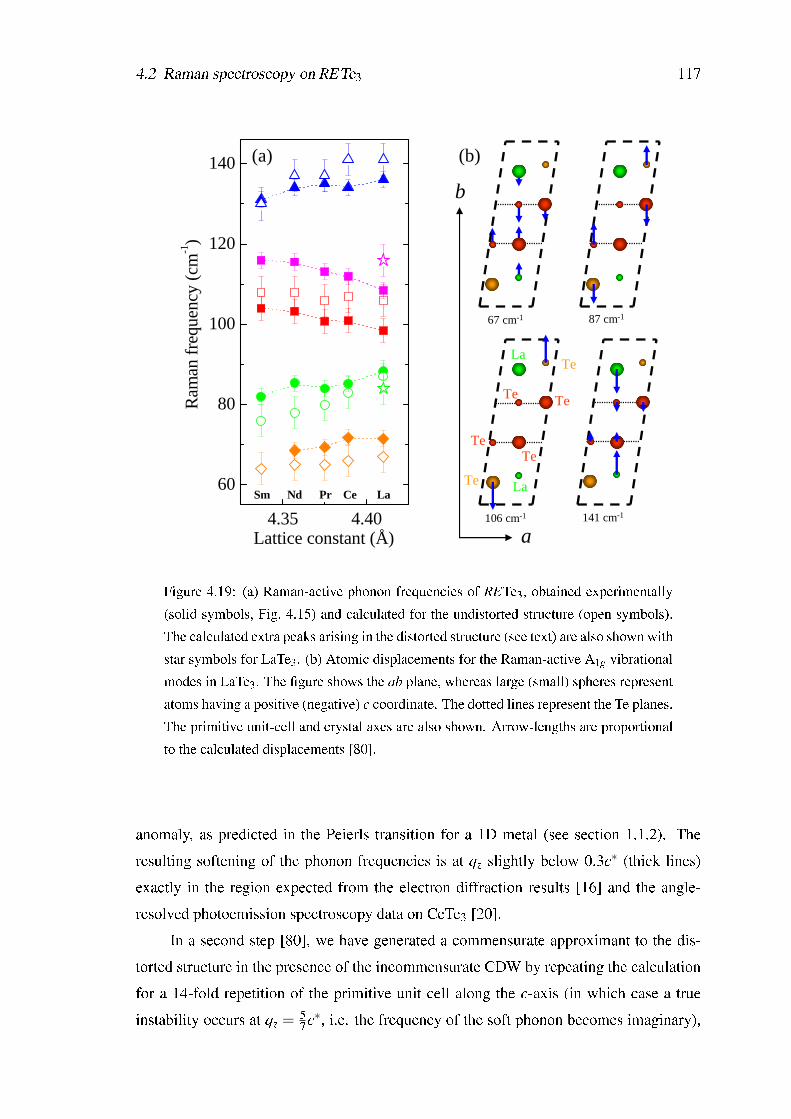
4.2 Raman spectroscopy on RETe3 117
67 cm-1 87 cm-1
106 cm-1 141 cm-1
a
b
La
La
Te
Te
Te
Te
Te
Te
4.35 4.40
60
80
100
120
140
Sm Nd Pr Ce La
Ram
an fr
eque
ncy
(cm-1)
Lattice constant (Å)
(a) (b)
Figure 4.19: (a) Raman-active phonon frequencies of RETe3, obtained experimentally(solid symbols, Fig. 4.15) and calculated for the undistorted structure (open symbols).The calculated extra peaks arising in the distorted structure (see text) are also shown withstar symbols for LaTe3. (b) Atomic displacements for the Raman-active A1g vibrationalmodes in LaTe3. The gure shows the ab plane, whereas large (small) spheres representatoms having a positive (negative) c coordinate. The dotted lines represent the Te planes.The primitive unit-cell and crystal axes are also shown. Arrow-lengths are proportionalto the calculated displacements [80].
anomaly, as predicted in the Peierls transition for a 1D metal (see section 1.1.2). Theresulting softening of the phonon frequencies is at qz slightly below 0.3c∗ (thick lines)exactly in the region expected from the electron diffraction results [16] and the angle-resolved photoemission spectroscopy data on CeTe3 [20].
In a second step [80], we have generated a commensurate approximant to the dis-torted structure in the presence of the incommensurate CDW by repeating the calculationfor a 14-fold repetition of the primitive unit cell along the c-axis (in which case a trueinstability occurs at qz = 5
7c∗, i.e. the frequency of the soft phonon becomes imaginary),
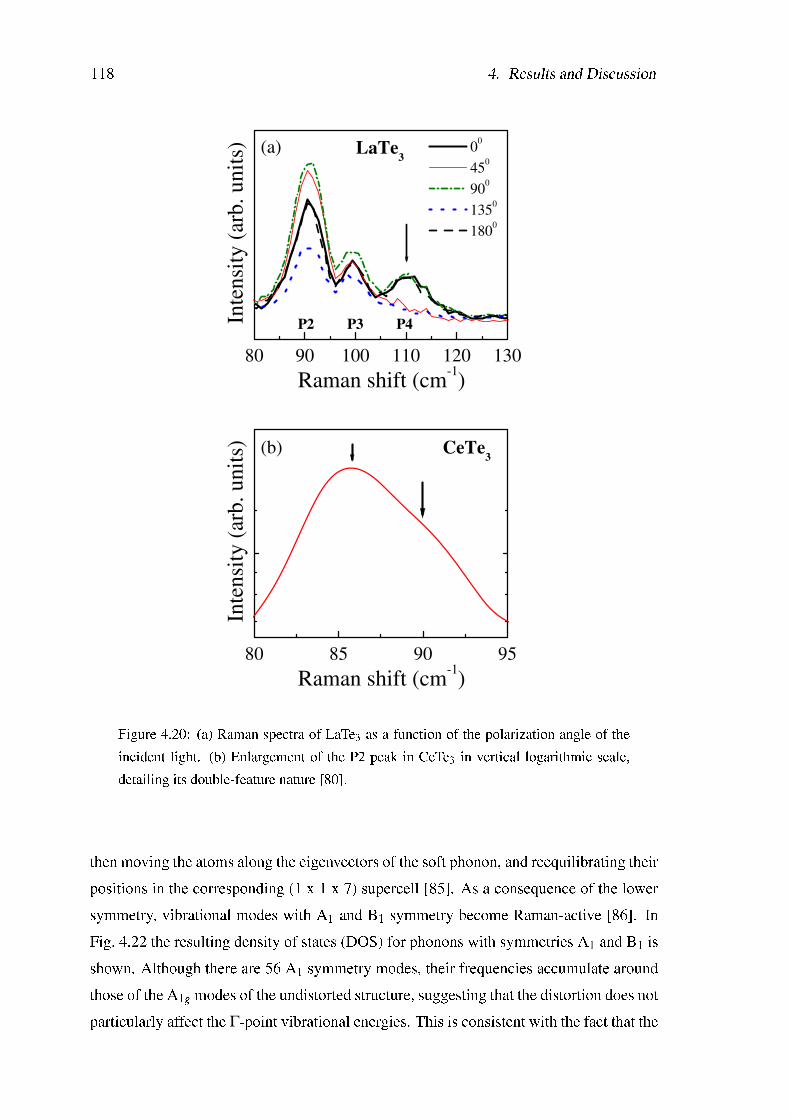
118 4. Results and Discussion
80 90 100 110 120 130
80 85 90 95
P2 P3 P4
(a) LaTe3
Raman shift (cm-1)
Inte
nsi
ty (
arb
. u
nit
s) 00
450
900
1350
1800
(b) CeTe3
Raman shift (cm-1)
Inte
nsi
ty (
arb
. u
nit
s)
Figure 4.20: (a) Raman spectra of LaTe3 as a function of the polarization angle of theincident light. (b) Enlargement of the P2 peak in CeTe3 in vertical logarithmic scale,detailing its double-feature nature [80].
then moving the atoms along the eigenvectors of the soft phonon, and reequilibrating theirpositions in the corresponding (1 x 1 x 7) supercell [85]. As a consequence of the lowersymmetry, vibrational modes with A1 and B1 symmetry become Raman-active [86]. InFig. 4.22 the resulting density of states (DOS) for phonons with symmetries A1 and B1 isshown. Although there are 56 A1 symmetry modes, their frequencies accumulate aroundthose of the A1g modes of the undistorted structure, suggesting that the distortion does notparticularly affect the Γ-point vibrational energies. This is consistent with the fact that the
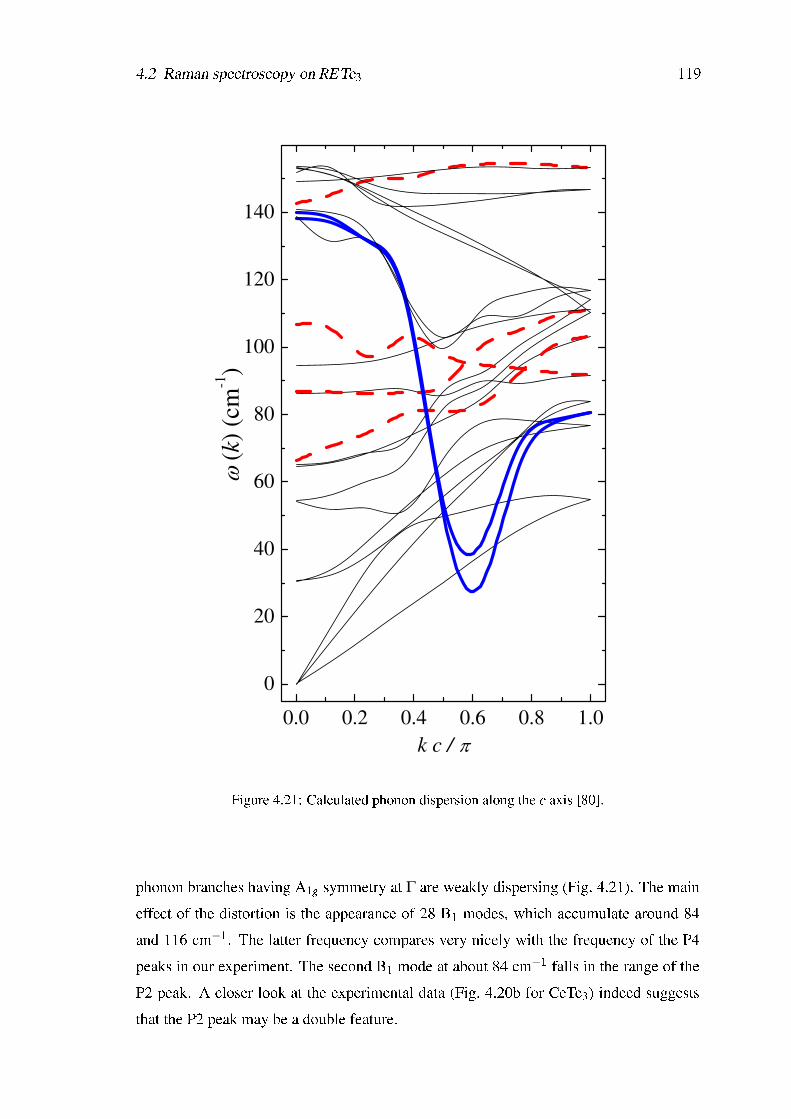
4.2 Raman spectroscopy on RETe3 119
0.0 0.2 0.4 0.6 0.8 1.0
0
20
40
60
80
100
120
140 (
k)
(cm
-1)
k c /
Figure 4.21: Calculated phonon dispersion along the c axis [80].
phonon branches having A1g symmetry at Γ are weakly dispersing (Fig. 4.21). The maineffect of the distortion is the appearance of 28 B1 modes, which accumulate around 84and 116 cm−1. The latter frequency compares very nicely with the frequency of the P4peaks in our experiment. The second B1 mode at about 84 cm−1 falls in the range of theP2 peak. A closer look at the experimental data (Fig. 4.20b for CeTe3) indeed suggeststhat the P2 peak may be a double feature.
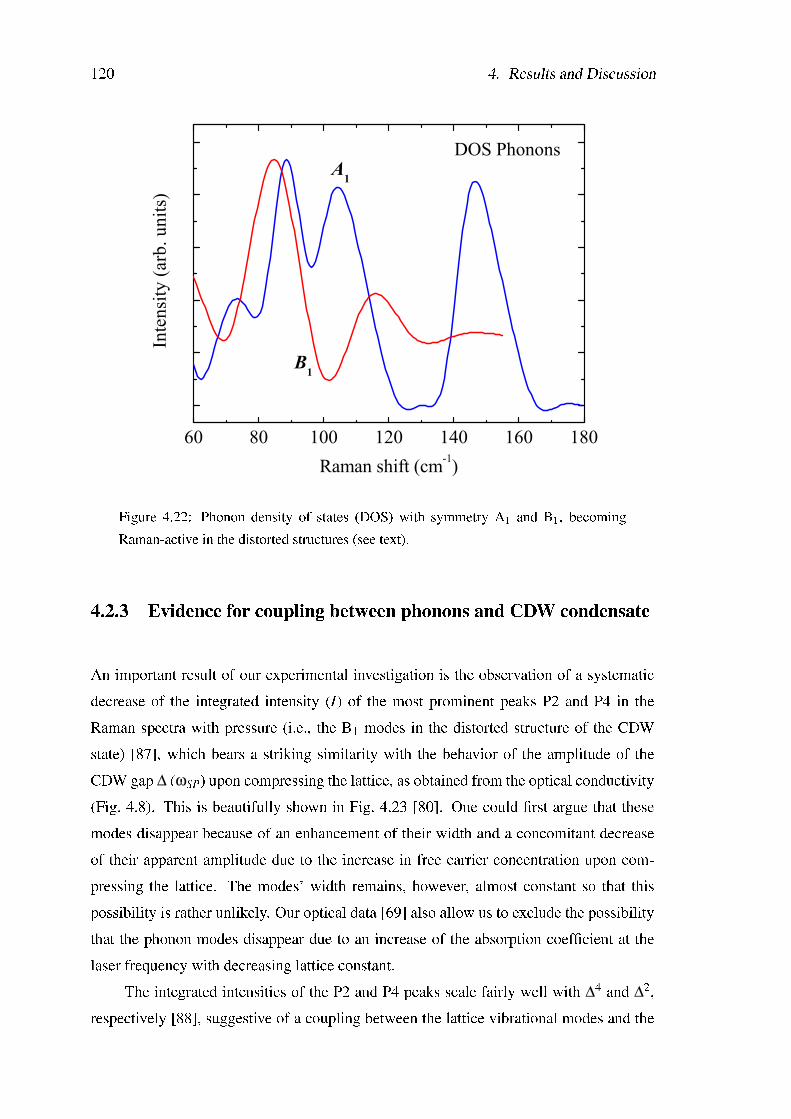
120 4. Results and Discussion
60 80 100 120 140 160 180Raman shift (cm-1)
B1
Inte
nsity
(arb
. uni
ts)
DOS Phonons A1
Figure 4.22: Phonon density of states (DOS) with symmetry A1 and B1, becomingRaman-active in the distorted structures (see text).
4.2.3 Evidence for coupling between phonons and CDW condensate
An important result of our experimental investigation is the observation of a systematicdecrease of the integrated intensity (I) of the most prominent peaks P2 and P4 in theRaman spectra with pressure (i.e., the B1 modes in the distorted structure of the CDWstate) [87], which bears a striking similarity with the behavior of the amplitude of theCDW gap ∆ (ωSP) upon compressing the lattice, as obtained from the optical conductivity(Fig. 4.8). This is beautifully shown in Fig. 4.23 [80]. One could rst argue that thesemodes disappear because of an enhancement of their width and a concomitant decreaseof their apparent amplitude due to the increase in free carrier concentration upon com-pressing the lattice. The modes' width remains, however, almost constant so that thispossibility is rather unlikely. Our optical data [69] also allow us to exclude the possibilitythat the phonon modes disappear due to an increase of the absorption coefcient at thelaser frequency with decreasing lattice constant.
The integrated intensities of the P2 and P4 peaks scale fairly well with ∆4 and ∆2,respectively [88], suggestive of a coupling between the lattice vibrational modes and the
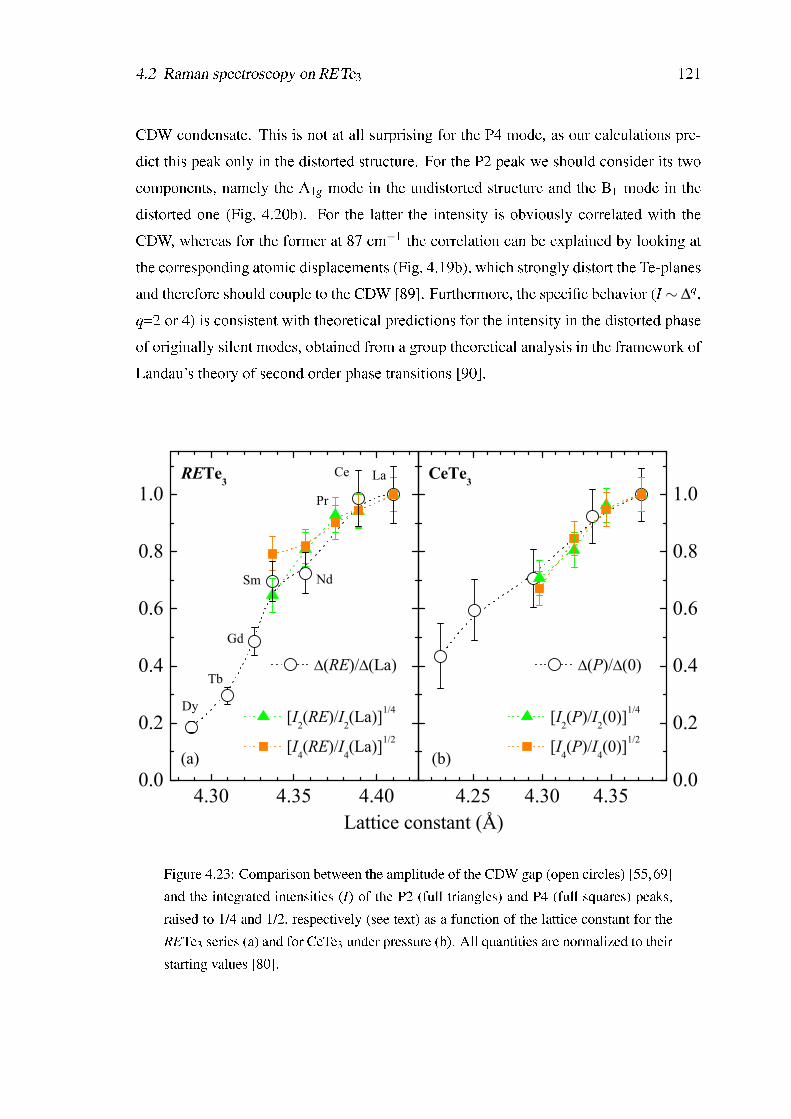
4.2 Raman spectroscopy on RETe3 121
CDW condensate. This is not at all surprising for the P4 mode, as our calculations pre-dict this peak only in the distorted structure. For the P2 peak we should consider its twocomponents, namely the A1g mode in the undistorted structure and the B1 mode in thedistorted one (Fig. 4.20b). For the latter the intensity is obviously correlated with theCDW, whereas for the former at 87 cm−1 the correlation can be explained by looking atthe corresponding atomic displacements (Fig. 4.19b), which strongly distort the Te-planesand therefore should couple to the CDW [89]. Furthermore, the specic behavior (I ∼ ∆q,q=2 or 4) is consistent with theoretical predictions for the intensity in the distorted phaseof originally silent modes, obtained from a group theoretical analysis in the framework ofLandau's theory of second order phase transitions [90].
4.30 4.35 4.400.0
0.2
0.4
0.6
0.8
1.0
4.25 4.30 4.350.0
0.2
0.4
0.6
0.8
1.0
(RE)/ (La)
[I2(RE)/I
2(La)]1/4
[I4(RE)/I
4(La)]1/2
RETe3 Pr
Dy
Tb
Gd
LaCe
Sm Nd
(a)
(P)/ (0)
(b)
[I2(P)/I
2(0)]1/4
[I4(P)/I
4(0)]1/2
CeTe3
Lattice constant (Å)
Figure 4.23: Comparison between the amplitude of the CDW gap (open circles) [55,69]and the integrated intensities (I) of the P2 (full triangles) and P4 (full squares) peaks,raised to 1/4 and 1/2, respectively (see text) as a function of the lattice constant for theRETe3 series (a) and for CeTe3 under pressure (b). All quantities are normalized to theirstarting values [80].

Conclusions and outlook
We have investigated both the Raman scattering and the electrodynamic response of thelow-dimensional rare-earth di- and tri-telluride CDW systems. Particular emphasis hasbeen devoted to the electronic excitations and the lattice dynamics, studied as a functionof the lattice compression.
Our optical data were collected on RETe2 (with RE=La, Ce) at ambient pressureas well as on LaTe2, CeTe3 and NdTe3 under externally applied pressure. These results,combined with the previous investigations on the RETe3 (with RE=La, Ce, Nd, Sm, Gd,Tb and Dy) series at ambient pressure, provide a complete view on the electrodynamicresponse of these CDW materials. We presented a detailed analysis of both the Drudecontribution, resulting from the ungapped regions of FS, and the SP peak, due to the car-riers' excitation across the CDW gap, upon compressing the lattice. A slight enhancementof the metallic contribution, as well as the fraction of the ungapped FS, and a simultane-ous reduction of the CDW gap are observed in both di- and tri-tellurides on decreasing thelattice constant, by chemical or applied pressure. Our results conrm that chemical andapplied pressure similarly affects the electronic properties of RETen (n=2,3) and equiva-lently reduces the impact of the CDW state in these materials. We proposed that this effectmight be due to a quenching of the favorable nesting conditions driven by a modicationof the FS because of the increasing dimensionality upon lattice compression.
The extended spectral range covered by our optical investigation also allows to ana-lyze the decay of the optical conductivity for energies larger than the CDW gap. A power-law behaviors in σ1(ω), consistent with the predictions for a Tomonaga-Luttinger-liquid,was observed for both rare-earth di- and tri-tellurides. This emphasizes a non-negligiblecontribution of 1D correlation effects in the physics of these 2D compounds. The val-ues of about 1 for the power-law exponent η would indicate that the rare-earth tellurides
123
124 Conclusions and outlook
are close to the weakly interacting limit within the TLL framework. A decreasing η isobserved in RETe3 under pressure (chemical or applied). This latter observation is sug-gestive of a crossover from a weakly interacting towards a non-interacting electron gassystem upon reducing the lattice constant, which is not uncommon and has been mostclearly observed in the linear-chain Bechgaard salts [5,39]. On the contrary, a rather neg-ligible pressure dependence of η is observed in LaTe2. We may speculate that pressure onthe double layered RETe3 is more effective than on the single layered RETe2. This mayimply a more pronounced (1D to 2D) dimensionality crossover upon applying pressure inthe RETe3 than in the RETe2 series.
Furthermore, we addressed the issue of the coupling between vibrational modes andCDW condensate in these prototype 2D systems. To this end we performed Raman-scattering experiments on the rare-earth series RETe3 (with RE= La, Ce, Pr, Nd, Sm, Gdand Dy) at room temperature and at ambient pressure as well as on LaTe3, CeTe3 andNdTe3 under externally applied pressure. Our data combined with rst-principles calcu-lations allow us to identify the expected Raman-active modes for the normal state as wellas for the CDW state. We also predicted the Kohn anomaly in the phonon dispersion, i.e.,the "freezing in" of a lattice distortion associated with the formation of the CDW phase.The most important result of our experimental investigation is the observation of a sys-tematic decrease in the integrated intensity of the prominent peaks in the Raman spectrawhich show a striking similarity with the behavior of the amplitude of the CDW gap (i.e.the order parameter), upon compressing the lattice, as obtained from the optical conduc-tivity. We have thus provided clear evidence for the tight coupling between the CDWcondensate and the lattice degrees of freedom in RETe3. Finally, our ndings, achievedwith Raman spectroscopy, further support the notion of the equivalence between chemicaland applied pressure in shaping the signatures of the CDW state.
All our investigations conrm that the easily tunable rare-earth telluride series representsa rather unique playground for a systematic study of the mechanism leading to the for-mation of the CDW state. Our results may also motivate new investigations in order tofurther broaden our understanding and perspective on the CDW state. We would like tomention two main future projects on RETe3, specically involving x-ray diffraction andRaman-scattering experiments.
The reduction of the CDW gap with chemical pressure in RETe3 series establishedon the basis of optical-spectroscopy experiments already pairs with the results of x-ray
Conclusions and outlook 125
diffraction studies [17] which show a progressive reduction of intensity of the satellitepeaks associated to the CDW distorted phase when moving from La to Dy. Althoughour IR experiments at high-pressures on CeTe3 reveal that the application of externalpressure induces a reduction of the CDW gap similar to that observed for the chemi-cal pressure, a high-pressure x-ray diffraction study in RETe3 monitoring the pressuredependence of the CDW distortion is still missing. Future work should for instance beaimed to the collection of x-ray data as a function of the applied pressure on LaTe3 andCeTe3. These compounds have the largest CDW gaps, and highest transition tempera-tures at zero pressure in this series. Therefore, they display the largest possible range oftransition temperatures which can be achieved by varying the external pressure (i.e., bycompressing the lattice). The basic goal would be to rst measure the pressure depen-dence of the lattice parameters of CeTe3 at room temperature. These data enable then afull analysis of our pressure-dependent optical conductivity data, without relying on thecrude estimation of the lattice constant under pressure, as reported in Ref. [55]. Beyondthat, one could follow the pressure dependence of the satellite peaks through the CDWtransition, achieved either by lattice compression or by lowering the temperature. Thenal goal is then to reach the mapping of the pressure-temperature phase diagram. Thesechallenging and very demanding experiments will open new perspectives by the com-parison of both the CDW transition temperature (TCDW ) and the CDW order parameterunder different applied pressures, which could provide a more detailed understanding ofthe equivalence between chemical and applied pressure, and might perhaps reveal somesubtle differences between these effects. Furthermore, an x-ray study at high-pressuresand low-temperatures on the lightest rare-earth telluride members would allow observingthe (additional) satellite peaks due to the second phase transition, already evidenced inthe diffraction pattern of the heaviest rare-earth tellurides at ambient pressure [17].
Our rst Raman investigations on RETe3, performed at room temperature, haveshown the modication of the lattice dynamics when the CDW phase is progressivelysuppressed by increasing pressure (chemical or applied). As a future work, the study ofthe Raman spectrum, when the CDW phase transition is approached by changing the tem-perature, would be highly interesting. To this purpose, Raman spectra should be collected,for the heavier members of the RETe3 (Dy and Ho), as a function of temperature and atambient pressure. These latter compounds have a low TCDW (TCDW1 '300K for Dy and290K for Ho) and thus the impact of the temperature-induced CDW phase in the Ramanspectrum can be easily observed by cooling down the system below room temperature.
126 Conclusions and outlook
This study would provide an interesting comparison between pressure and temperatureeffects on the lattice dynamics across the CDW transition. Even more challenging butextremely interesting would be the study of the evolution of the Raman spectrum in tem-perature at high pressures for one of the lightest rare-earth member (LaTe3 is a goodcandidate). In these experiments, the evolution of Raman spectrum will be monitoredwhile the CDW state, suppressed by the application of the external pressure, is restoredby cooling down the system. This would allow to further address the equivalence betweenchemical and applied pressure with respect to the lattice dynamics and its interplay withthe CDW condensate.
Our Raman investigations reported so far, were quite elusive as far as the amplitudemode is concerned. Together with the phase mode, the excitation of the CDW ampli-tude (i.e., the breathing mode of the CDW condensate) is one of the ngerprints of thecollective state. It is hopeless to detect the phase mode by IR spectroscopy because ofthe residual metallic character in the CDW ground state. Nevertheless, the truly Ramanactive amplitude mode can be identied by extending the frequency interval, covered sofar by this technique. There are generally not too many reports in the literature of the am-plitude mode; in most cases just an indirect evidence. Recent time resolved ARPES [91]and femtosecond pump-probe spectroscopy [92] gave already some hints of the amplitudemode excitation. The Raman scattering experiment as a function of both temperature andexternal pressure is the ideal spectroscopic tool to clarify the evolution of the collectiveexcitation across the CDW phase transition, induced or released by lowering the temper-ature or by compressing the lattice, respectively. The analysis of the amplitude mode'sintegrated intensity will shed light on the coupling mechanism driving the CDW phasetransition.
Appendix AMurnaghan equation
The pressure dependence of the lattice constant a(P) can be calculated from the zero-pressure bulk modulus B0. First of all, we consider the value β from the phononic part ofthe specic heat [93]:
cV = γT +βT 3, β =2π2kB
5
(kBhvs
)3. (A.1)
With the β values extracted from Ref. [59] (17.4 and 14.1 J/m3 K4 for LaTe3 and LaTe2,respectively) one achieves the sound velocity vs, which corresponds to vs=1923 m/s (2056m/s) for LaTe3 (LaTe2). The bulk modulus B0 can be estimated from:
B0 = ρv2s (A.2)
where ρ=M f .u./V f .u.=6837 Kg/m3 (6930 Kg/m3) is the density of LaTe3 (LaTe2). Theabove values for ρ and vs nally give B0=25 GPa (29.3 GPa) for LaTe3 (LaTe2). We canthen assume a linear pressure dependence of the bulk modulus:
B(P) = B0 +B′P (A.3)
127
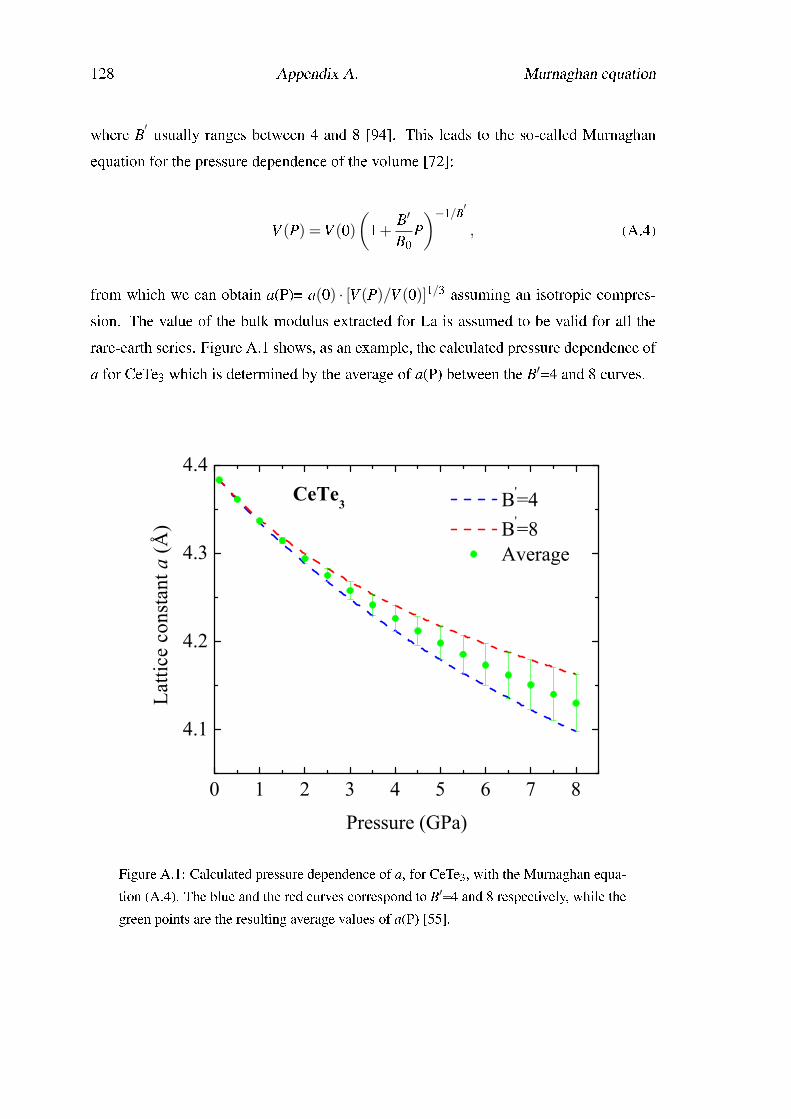
128 Appendix A. Murnaghan equation
where B′ usually ranges between 4 and 8 [94]. This leads to the so-called Murnaghanequation for the pressure dependence of the volume [72]:
V (P) = V (0)(
1+B′B0
P)−1/B′
, (A.4)
from which we can obtain a(P)= a(0) · [V (P)/V (0)]1/3 assuming an isotropic compres-sion. The value of the bulk modulus extracted for La is assumed to be valid for all therare-earth series. Figure A.1 shows, as an example, the calculated pressure dependence ofa for CeTe3 which is determined by the average of a(P) between the B′=4 and 8 curves.
0 1 2 3 4 5 6 7 8
4.1
4.2
4.3
4.4CeTe3
Latti
ce c
onst
ant a
(Å)
Pressure (GPa)
B'=4 B'=8 Average
Figure A.1: Calculated pressure dependence of a, for CeTe3, with the Murnaghan equa-tion (A.4). The blue and the red curves correspond to B′=4 and 8 respectively, while thegreen points are the resulting average values of a(P) [55].
Appendix BEffect of the high frequencyextrapolation of R(ω)
We took good care to check the effect of the high frequency extrapolations of the mea-sured R(ω), a rather sensitive issue when applying the KK analysis. Figure B.1a showsR(ω) at 1.3 GPa of LaTe2 (considered here as an example) with three different extrap-olations, which have been ad hoc manipulated by changing the width of the last h.o.at ω4 ∼1.2x104 cm−1 which describes the electronic interband transition (grey line inFig. 2.22). The rst extrapolation considers γ4=2.5x104 cm−1 for the fourth h.o., whichalso corresponds to the best t of the measured R(ω) (black dashed line). The other twoextrapolations were obtained with γ4=2.0x104 cm−1 (blue line) and γ4=3.0x104 cm−1
(green line), respectively. The change of γ4 implies a minor adjustment of the parame-ters of S2
3 and γ3 (strength and damping) of the third Lorentz h.o., leaving, however, theother ones unchanged (see Fig. 2.22). Apart from the obvious changes of R(ω) abovethe upper limit of our measurement, the t quality of R(ω) remains outstanding in themeasured spectral range. The resulting altered R(ω) at high frequencies smoothly joinsthe rest of the (measured) R(ω) signal at about 104 cm−1. Fig. B.1b compares the realpart σ1(ω) of the complex optical conductivity obtained by the KK transformations of theR(ω) spectra with the three different extrapolations. Due to the rather local character ofthe KK transformations, the nal result is less affected by the extrapolations of R(ω) atfrequencies above 104 cm−1 and their impact on the frequency dependence of σ1(ω) be-low 104 cm−1 is very moderate. The spectra are almost identical and start to deviate fromeach other at the very upper end of the measured spectral range. This also means that wecan trust our data and the corresponding KK analysis all the way up to the high frequency
129
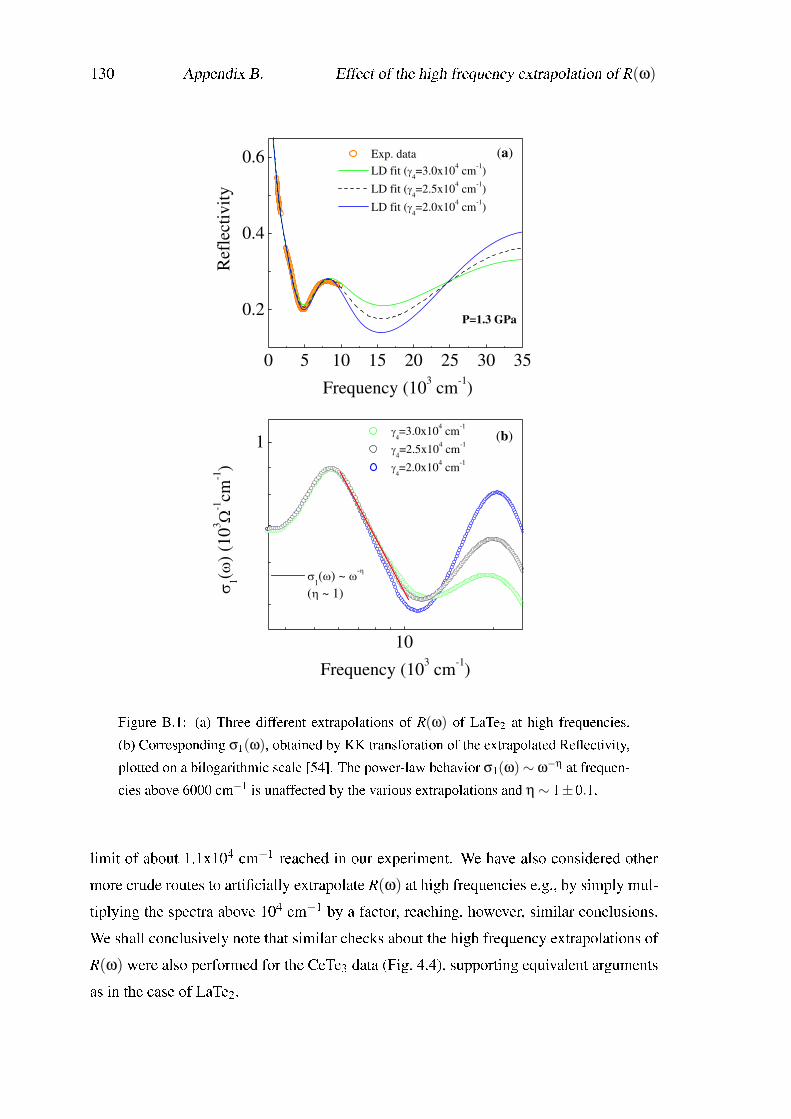
130 Appendix B. Effect of the high frequency extrapolation of R(ω)
0 5 10 15 20 25 30 35
0.2
0.4
0.6
10
1
(a)
P=1.3 GPa
Frequency (103 cm
-1)
Ref
lect
ivit
y
Exp. data
LD fit (4=3.0x10
4 cm
-1)
LD fit (4=2.5x10
4 cm
-1)
LD fit (4=2.0x10
4 cm
-1)
(b)
1( ) ~
-
( ~ 1)
1(
) (1
03
-1cm
-1)
Frequency (103 cm
-1)
=3.0x104 cm
-1
4=2.5x10
4 cm
-1
=2.0x104 cm
-1
Figure B.1: (a) Three different extrapolations of R(ω) of LaTe2 at high frequencies.(b) Corresponding σ1(ω), obtained by KK transforation of the extrapolated Reectivity,plotted on a bilogarithmic scale [54]. The power-law behavior σ1(ω)∼ ω−η at frequen-cies above 6000 cm−1 is unaffected by the various extrapolations and η∼ 1±0.1.
limit of about 1.1x104 cm−1 reached in our experiment. We have also considered othermore crude routes to articially extrapolate R(ω) at high frequencies e.g., by simply mul-tiplying the spectra above 104 cm−1 by a factor, reaching, however, similar conclusions.We shall conclusively note that similar checks about the high frequency extrapolations ofR(ω) were also performed for the CeTe3 data (Fig. 4.4), supporting equivalent argumentsas in the case of LaTe2.
Appendix CSummary of the Lorentz-Drude analysis
In the following three tables (C.1, C.3 and C.2) we report the LD-t parameters for CeTe3
and LaTe2 under pressure and RETe2 at ambient pressure, respectively. ωp is the plasmafrequency and γD is the width of the Drude peak, representing the free charge carriers'scattering, whereas ω j, γ j, and S2
j are the center-peak frequency, the width, and the modestrength for the jth Lorentz harmonic oscillator (h.o.), respectively. The pressure valuesare reported in GPa while the t parameters are given in cm−1, except σdc (Ω−1 cm−1).
In Table C.4, C.5 and C.6 we summarize the pressure dependence of the reectivityenergy pole ωβ, the single-particle peak ωSP, the fraction of the ungapped Fermi surfaceΦ, and the power-law exponent η for CeTe3 and LaTe2. At ambient pressure ωβ tendstowards innity (see equation 2.49).
131
132 Appendix C. Summary of the Lorentz-Drude analysis
Pω
pγD
σdc
ω1
γ1S1
ω2
γ2S2
ω3
γ3S3
ω4
γ4S4
08000
1427544
5102601
249005485
267127120
77639192
3300025400
896223050
0.78000
1427544
6502800
245005981
417237080
845213450
3511025400
896223050
1.39000
1608443
7202750
259705511
440331670
660711700
3675025400
896223050
2.010000
1709811
7003269
306205489
526033570
703211830
3313025400
896223050
3.210000
1709811
7003269
306205267
500031710
719021830
2625025400
896223050
4.010500
17010816
7003500
330005250
570933000
545015000
2950025400
896223050
5.612000
17014127
7504433
359405317
509727340
342313490
3587025400
896223050
7.612500
19013716
7303200
350005536
520728210
141910940
3803025400
896223050
TableC.1:LD
-tparametersofCeTe3
underpressure.Forthe
lasth.o.the
valuesofω5 =34290
cm−
1,γ5 =17030cm
−1,S5 =45330
cm−
1
wereem
ployedatallpressures.
Appendix C. Summary of the Lorentz-Drude analysis 133
RETe
2ω
pγ D
σ dc
ω1
γ 1S 1
ω2
γ 2S 2
ω3
γ 3S 3
ω4
γ 4S 4
LaTe
268
4035
022
3178
491
447
3617
4325
1085
6664
3076
2420
282
2121
024
960
3118
0Ce
Te2
6658
256
2890
402
548
4298
2427
8629
1802
549
5146
6312
760
2221
630
540
3053
9
Tabl
eC.2
:LD
-tp
aram
eter
sofL
aTe 2
and
CeTe
2at
ambi
entp
ress
ure.
P(G
Pa)
ωp
γ Dσ d
cω
1γ 1
S 1ω
2γ 2
S 2ω
3γ 3
S 3ω
4γ 4
S 40.
376
5655
017
7721
1325
0169
3517
3030
0068
0160
6150
0714
290
2121
024
960
3118
01.
389
5368
219
6010
9946
8956
0119
8338
4910
170
6063
5138
1328
021
210
2496
031
180
2.7
9053
700
1953
1361
2821
1134
029
3975
6166
2259
4175
8016
460
2121
024
960
3118
04.
110
510
900
2047
1479
4052
1089
015
0022
8269
6850
8765
4714
800
2121
024
960
3118
05.
714
000
1000
3269
1934
5612
2150
042
2176
8878
6350
4846
4766
4321
210
2496
031
180
6.7
1500
011
5432
5218
0024
5040
6520
6247
3718
700
4906
9882
5723
2121
024
960
3118
0
Tabl
eC.3
:LD
-tp
aram
eter
sofL
aTe 2
unde
rpre
ssur
e.
134 Appendix C. Summary of the Lorentz-Drude analysis
P(GPa) ωβ (cm−1) ωSP (cm−1) Φ η
0.7 31500 5933 0.020 1.61.3 31000 4933 0.026 1.52.0 32000 4605 0.031 1.43.2 32000 4144 0.037 1.44.0 32000 3682 0.035 1.45.6 33000 2811 0.042 1.37.6 34000 2121 0.043 1.3
Table C.4: CeTe3 under pressure at 300K.
RETe2 ωSP (cm−1) Φ η
LaTe2 5502 0.0845 0.7CeTe2 3165 0.0805 1.0
Table C.5: RETe2 at ambient pressure and at 300K.
P(GPa) ωβ (cm−1) ωSP (cm−1) Φ η
0.3 8000 4754 0.16 1.11.3 8500 4206 0.21 1.02.7 9600 4316 0.16 0.74.1 9800 3528 0.22 0.85.7 12350 2425 0.26 1.06.7 11500 2285 0.36 1.0
Table C.6: LaTe2 under pressure at 300K.
Appendix DRaman active phonon modes in RETe3
The Raman active phonon modes for the undistorted structure are 12 in total: 4 A1g + 4B1g + 4 B3g. The related Raman tensors have the following form [82]:
A1g =
a 0 00 b 00 0 c
B1g =
0 d 0d 0 00 0 0
B3g =
0 0 00 0 e0 e 0
where the y coordinate correspond to the perpendicular direction (b, out of plane).The Raman intensity is given by [42]:
I ∝ |~ε · α ·~ε′|2 (D.1)
where the unitary vectors ~ε and ~ε′ indicate the direction of the incident and scatteredpolarization of the light and α is the Raman tensor (see section 2.3.1). Since the incidentlaser light is polarized in the ac plane, the following expression for~ε is valid:
~ε = (cosθ,0,sinθ). (D.2)
In a Raman experiment two conguration can be realized: xx and xy. In the xx cong-uration the analyzed scattered light has the same polarization of the incident one and the
135
136 Appendix D. Raman active phonon modes in RETe3
expression for the intensity Ixx can be easily calculated by using equation D.1 with~ε′ =~ε:
Ixx(A1g) = [Acos2θ+Csin2θ]2, (D.3)
Ixx(B1g) = 0, (D.4)
Ixx(B3g) = 0. (D.5)
In the xy conguration the polarization of the analyzed scattered light is orthogonal tothe incident one. The expression for the intensity Ixy can be obtained again by usingequation D.1, but with~ε′⊥~ε (i.e., with~ε′ = (sinθ,0,−cosθ)) it follows:
Ixy(A1g) = [(A−C)sinθcosθ]2, (D.6)
Ixy(B1g) = 0, (D.7)
Ixy(B3g) = 0. (D.8)
In both experimental congurations (xx and xy) only the four A1g modes have a non-zeroRaman intensity, showing the periodicity of 1800 for Ixx and 900 for Ixy.
Bibliography
[1] J.G. Bednorz and K.A. Müller, Z. Phys. B - Condensed Matter 64, 189 (1986).
[2] J. Luttinger, J. Math. Phys. 4, 1154 (1963).
[3] S. Tomonaga, Prog. Theor. Phys. 5, 554 (1950).
[4] J. Voit, Eur. Phys. J. B 5, 505 (1998).
[5] V. Vescoli, L. Degiorgi, W. Henderson, G. Grüner, K.P. Starkey and L.K.Montgomery, Science 281, 1181 (1998) and references therein.
[6] V. Vescoli, F. Zwick, W. Henderson, L. Degiorgi, M. Grioni, G. Grüner and L.K.Montgomery, Eur. Phys. J. B 13, 503-511 (2000).
[7] L. Degiorgi and D. Jérome, J. Phys. Soc. Jpn. 75, 051004 (2006).
[8] For a review see: D.N. Basov and T. Timusk, Rev. Mod. Phys. 77, (2005), andreferences therein.
[9] R.E. Peierls, Quantum Theory of Solids, Oxford University Press, New York (1955).
[10] A.W. Overhauser, Phys. Rev. Lett. 4, 462 (1960).
[11] E. Fawcett, Rev. Mod. Phys. 60, 209 (1988).
[12] J.A. Wilson, F.J. DiSalvo and S. Mahajan, Adv. Phys. 24, 117 (1975).
[13] T. Vuletic, B. Korin-Hamzic, T. Ivek, S. Tomic, B. Gorshunov, M. Dressel and J.Akimitsu, Phys. Rep. 428, 169 (2006).
[14] See Sec. V of S.A. Kivelson, I.P. Bindloss, E. Fradkin, V. Oganesyan, J.M.Tranquada, A. Kapitulnik and C. Howald, Rev. Mod. Phys. 75, 1201 (2003).
[15] H. Yao, J.A. Robertson, E.A. Kim and S.A. Kivelson, Phys. Rev. B 74, 245126(2006).
137
[16] E. DiMasi, M.C. Aronson, J.F. Manseld, B. Foran and S. Lee, Phys. Rev. B 52,14516 (1995).
[17] N. Ru, C.L. Condron, G.Y. Margulis, K.Y. Shin, J. Laverock, S.B. Dugdale, M.F.Toney and I.R. Fisher, Phys. Rev. B 77, 035114 (2008).
[18] A. Kikuchi, J. Phy. Soc. Japan 67, 1308 (1998).
[19] J. Laverock, S.B. Dugdale, Z. Major, M.A. Alam, N. Ru, I.R. Fisher, G. Santi andE. Bruno, Phys. Rev. B 71, 085114 (2005).
[20] V. Brouet, W.L. Yang, X.J. Zhou, Z. Hussain, N. Ru, K.Y. Shin, I.R. Fisher and Z.X.Shen, Phys. Rev. Lett. 93, 126405 (2004).
[21] E.J. Woll and W. Kohn, Phys. Rev. 126, 1693 (1962).
[22] G. Grüner, Density waves in solids, Addison Wesley, Reading, MA (1994).
[23] G. Grüner, Rev. Mod. Phys. 60, 1129 (1988).
[24] M. Tinkham, Introduction to Superconductivity, second edition, McGraw-Hill, NewYork (1996).
[25] M. Dressel and G. Grüner, Electrodynamics of Solids, Cambrige University Press(2002).
[26] P.A. Lee, T.M. Rice and P.W. Anderson, Solid State Commun. 14, 703 (1974).
[27] T. Giamarchi, Quantum Physics in One Dimension, Oxford University Press, Oxford(2004).
[28] T. Giamarchi, Chem. Rev. 104, 5037 (2004).
[29] L.D. Landau, Sov. Phys. JETP 3, 920; 5, 101; 8, 70 (1957).
[30] P. Nozieres, Theory of Interacting Fermi Systems, Benjamin, New York, (1961).
[31] T. Giamarchi, Physica B 230, 975-980 (1997).
[32] H.J. Schulz, G. Cuniberti and P. Pieri, cond-mat/9807366 (1998).
[33] N.F. Mott, Metal-Insulator Transitions, Taylor and Francis, London (1990).
[34] V.J. Emery, Highly conducting one-dimensional solids, Eds. J.T. Devreese, R.P.Evrard, V.E. van Doren, Plenum Press, New York (1979).
[35] D. Jérome and H.J. Schulz, Adv. Phys. 31, 229 (1982).
[36] D. Jérome, Strongly Interacting Fermions and High Tc Superconductivity, Eds. BDoucot and J. Zinn-Justin, Elsevier, Amsterdam, p. 249 (1995).
[37] A. Schwartz, M. Dressel, G. Grüner, V. Vescoli, L. Degiorgi and T. Giamarchi, Phys.Rev. B 58, 1261 (1998)
[38] J. Moser, M. Gabay, P. Auban-Senzier, D. Jérome, K. Bechgaard and J.M. Fabre,Eur. Phys. J. B 1, 39 (1998).
[39] A. Pashkin, M. Dressel and C.A. Kuntscher, Phys. Rev. B 74, 165118 (2006).
[40] F. Wooten, Optical Properties of Solids, Academic Press, New York (1972).
[41] C.V. Raman and K.S. Krishnan, Nature 121, 501 (1928).
[42] G. Turrel, Raman Microscopy, Developments and Applications, Eds. G. Turrel andJ. Corset, Academic Press, London, p. 1-25 (1996).
[43] A. Jayaraman, Rev. Sci. Instrum. 57, 1013 (1986).
[44] C. Narayana, H. Luo, J. Orloff and A.L. Ruoff, Nature 393, 46 (1998).
[45] P. Dore, A. Nucara, D. Cannavo`, G. De Marzi, P. Calvani, A. Marcelli, R.S.Sussmann, A.J. Whitehead, C.N. Dodge, A.J. Krehan and H.J. Peters, Appl. Opt.37, 5731 (1998).
[46] D.J. Dunstan, Rev. Sci. Instrum. 60, 3789 (1989).
[47] G.J. Piermarini, S. Block and J.D. Barnett, J. Appl. Phys. 44, 5377 (1973).
[48] G.J. Piermarini and S. Block, Rev. Sci. Instrum. 46, 973 (1975).
[49] H.K. Mao, J. Xu and P.M. Bell, J. Geophys. Res. 91, 4673 (1986).
[50] R.J. Bell, Introductory Fourier transform spectroscopy, Academic Press, New York(1972).
[51] S. Lupi, A. Nucara, A. Perucchi, P. Calvani, M. Ortolani, L. Quaroni and M.Kiskinova, J. Opt. Soc. Am. B 24, 959 (2007).
[52] We employed KBr (NaCl) as a pre-sintered pellet for high-pressure IR experimentson LaTe2 (CeTe3).
[53] M. Lavagnini, A. Sacchetti, L. Degiorgi, K.Y. Shin and I.R. Fisher, Phys. Rev. B 75,205133 (2007).
[54] M. Lavagnini, A. Sacchetti, L. Degiorgi, E. Arcangeletti, L. Baldassarre, P.Postorino, S. Lupi, A. Perucchi, K.Y. Shin and I.R. Fisher, Phys. Rev. B 77, 165132(2008).
[55] A. Sacchetti, E. Arcangeletti, A. Perucchi, L. Baldassarre, P. Postorino, S. Lupi, N.Ru, I.R. Fisher and L. Degiorgi, Phys. Rev. Lett. 98, 026401 (2007).
[56] When both Reectivity and Transmission data are available, the optical functionscan be obtained directly, i.e. without KK transformation procedure.
[57] We remark that the LD extension of the measured data was only used in the energyintervals without directly measured points. The original data points were indeedconsidered within the energy spectral range covered by the experiment (verticaldashed lines in Fig. 2.22b).
[58] J.S. Plaskett and P.N. Schatz, J. Chem. Phys. 38, 612 (1963).
[59] K.Y. Shin, V. Brouet, N. Ru, Z.X. Shen and I.R. Fisher, Phys. Rev. B 72, 085132(2005).
[60] N. Ru and I.R. Fisher, Phys. Rev. B 73, 033101 (2006).
[61] E. DiMasi, B. Foran, M.C. Aronson and S. Lee, Chem. Mater. 6, 1867 (1994).
[62] T.B. Massalski, Binary Alloy Phase Diagrams, ASM International, Materials Park,OH (1996).
[63] B.K. Norling and H. Steinnk, Inorg. Chem. 5, 1488 (1966).
[64] P. Villars and L.D. Calvert, Pearson's Handbook of Crystallographic Data forIntermetallic Phases, American Society for Metals, Metals Park, OH (1991).
[65] E. DiMasi, B. Foran, M.C. Aronson and S. Lee, Phys. Rev. B 54, 13587 (1996).
[66] G.-H. Gweon, J.D. Denlinger, J.A. Clack, J.W. Allen, C.G. Olson, E.D. DiMasi,M.C. Aronson, B. Foran and S. Lee, Phys. Rev. Lett. 81, 886 (1998).
[67] V. Brouet, W.L. Yang, X.J. Zhou, Z. Hussain, R.G. Moore, R. He, D.H. Lu, Z. X.Shen, J. Laverock, S.B. Dugdale, N. Ru and I.R. Fisher, Phys. Rev. B 77, 235104(2008).
[68] A. Fang, N. Ru, I.R. Fisher and A. Kapitulnik, Phys. Rev. Lett. 99, 046401 (2007).
[69] A. Sacchetti, L. Degiorgi, T. Giamarchi, N. Ru and I. R. Fisher, Phys. Rev. B 74,125115 (2006).
[70] M. Lavagnini, A. Sacchetti, C. Marini, M. Valentini, R. Sopracase, A. Perucchi, P.Postorino, S. Lupi, J.-H. Chu, I.R. Fisher and L. Degiorgi, Phys. Rev. B 79, 075117(2009).
[71] The gap values determined from the ARPES experiments are always referred withrespect to the Fermi energy. Assuming the Fermi energy in the middle of the gap,means that the optically determined gap is about twice as large as the ARPES one.
[72] F.D. Murnaghan, Proc. Natl. Acad. Sci. U.S.A. 30, 244 (1944).
[73] F. Pfuner, L. Degiorgi, K.Y. Shin and I.R. Fisher, Eur. Phys. J. B 63, 11 (2008).
[74] A. Sacchetti, C.L. Condron, S.N. Gvasaliya, F. Pfuner, M. Lavagnini, M. Baldini,M.F. Toney, M. Merlini, M. Hanand, J. Mesot, J.-H. Chu, I. R. Fisher, P. Postorinoand L. Degiorgi, Phys. Rev. B 79, (R) (2009) in press, cond-mat/0811.0338 (2008).
[75] A. Perucchi, L. Degiorgi and R.E. Thorne, Phys. Rev. B 69, 195114 (2004).
[76] We do not report the values of Φ for RETe2 (as well as RETe2.5) because they areavailable only for 2 (3) compounds and are not reppresentative of a general trend.
[77] N. Ru, R.A. Borzi, A. Rost, A.P. Mackenzie, J. Laverock, S.B. Dugdale and I.R.Fisher, Phys. Rev. B 78, 045123 (2008).
[78] While this behavior is reproducible over several data set, we emphasize neverthelessthat σ1(ω) ∼ ω−η is established over a limited energy interval (i.e., less than adecade).
[79] We note that the exponent η for a one-dimensional band insulator would be totallydifferent, ranging between 2, when coupling to phonons is included, and 3, whenthe lattice is assumed to be rigid and only umklapp scattering off the single-periodlattice potential is possible [V. Vescoli, F. Zwick, J. Voit, H. Berger, M. Zacchigna, L.Degiorgi, M. Grioni and G. Gruner, Phys. Rev. Lett. 84, 1272 (2000)]. Our exponentsη are moreover different from the expectation in the case of the decay of σ1(ω) dueto the high frequency tail of a single Lorentzian, for which η is equal to 2.
[80] M. Lavagnini M. Baldini, A. Sacchetti, D. Di Castro, B. Delley, R. Monnier, J.-H.Chu, N. Ru, I. R. Fisher, P. Postorino and L. Degiorgi, Phys. Rev. B 78, 201101(R)(2008).
[81] The lowest energy peak P1 is not visible in the high pressure measurements, becauseof the reduced spectral range with the sample inside the DAC.
[82] W.G. Fately, F.R. Dollish, N.T. McDevitt and F.F Bentley, Infrared and Ramanselection rules for molecular and lattice vibrations: the correlation method, JohnWiley & Sons, New York (1972).
[83] The calculations were done with hardness-conserving semilocal pseudopotentialsfor all states below the 4d shell for Te and the 5s shell for the rare-earth atoms [B.Delley, Phys. Rev. B 66, 155125 (2002)], and used the DNP basis set [B. Delley,J. Chem. Phys. 92, 508 (1990); J. Chem. Phys. 113, 7756 (2000)]. The k-spaceintegrations have been performed with an unshifted 6 x 2 x 6 (2 x 2 x 6) mesh,which amounts to 40 (16) symmetry unique k-points in the calculations for theprimitive (super-) cell. A thermal broadening of 1 mHartree has been used. The
total energy has been modied with the entropy term proposed by M. Weinert andJ.W. Davenport [Phys. Rev. B 45, 13709 (1992)] to make the energy functionalvariational.
[84] An orthorhombic pseudotetragonal (a=c) structure was considered, as the smalldeviations between a and c were found to be insignicant in an earlier high precisioncalculation of the Fermi surface [19].
[85] C. Malliakas, S.J.L. Billinge, H.J. Kim and M.G. Kanatzidis, J. Am. Chem. Soc.127, 6510 (2005).
[86] The unit cell in the distorted structure is not centrosymmetric anymore, so that theA1g symmetry turns into A1. The period of the angle-dependent intensity is 1800
(900) for the A1 (B1) symmetry.
[87] The sudden disappearance of the modes in the Raman spectra of Gd and Dy tri-tellurides (Fig. 4.15) could also originate from the fact that the data were collectedat 300 K, i.e. just slightly below their own TCDW [17].
[88] The behaviour of the weak P3 and P5 peaks is less well dened, while the intensityof the P1 peak, is only partially seen in the chemical-pressure series.
[89] M.J. Rice, Phys. Rev. Lett. 37, 36 (1976) and Solid State Commun. 25, 1083 (1978).
[90] J. Petzelt and V. Dvorák, J. Phys. C 9, 1571 (1976).
[91] F. Schmitt, P.S. Kirchmann, U. Bovensiepen, R.G. Moore, L. Rettig, M. Krenz, J.-H.Chu, N. Ru, L. Perfetti, D.H. Lu, M. Wolf, I.R. Fisher and Z.-X. Shen, Science 321,1649 (2008).
[92] R.V. Yusupov, T. Mertelj, J.-H. Chu, I.R. Fisher and D. Mihailovic, Phys. Rev. Lett.101, 246402 (2008).
[93] N.W. Ashcroft and N.D. Mermin, Solid State Physics, Brooks Cole (1976).
[94] S. Jiuxun, W. Qiang, C. Lingcang and J. Fuqian, J. Phys. Chem. Solids 66, 773(2005).
Acknowledgement
First of all, I would like to thank my supervisor Prof. Leonardo Degiorgi. He gave me thechance to work in an important research institute such as the ETH Zürich and to be in-volved in several interesting scientic projects. The results presented in the current thesisand in particular all my work was supported by his constant presence and dedication. Byworking with Leonardo, I had the inestimable opportunity to acquire the proper methodand mentality for high-level physics investigations. His determination and his enthusiasmin achieving results was a precious example that I will never forget.
I try now to thank all the people (they are many) who have collaborated with us in therealization of my Ph.D. project.
Prof. P. Postorino and all his group at the University of Rome "La Sapienza" for theRaman measurements. We had a great collaboration with them. I am particularygrateful to Prof. Postorino because he introduced me in the world of the researchand his training and advices are still very useful for me.
Dr. Andrea Perucchi and all the IRS group for the experiments at the Infraredbeam-line at ELETTRA synchrotron in Trieste. During my beam-times there, Iwas supported by a group of competent and relaxed people.
Prof. René Monnier for his theoretical support in our Raman studies and above allfor his smile and his kindness.
Prof. Ian Fisher and his group at Stanford University for providing us the samplesinvestigated in this work and for several fruitful scientic discussion, by email.
143
Prof. B. Batlogg and Prof. T. Giamarchi for being co-examiners of my thesis. Iwish to acknowledge Prof. Batlogg also for being always very friendly and full ofenthusiasm. He is an important presence for all of us at the F oor and we alwaysenjoyed a lot the Christmas dinner which he organizes every year.
After the Professors, I would like to thank all my young colleagues who shared with me,during long sessions of measurements, the beauty and the hardness of this job: DanieleDi Castro, Maria Baldini, Emanuele Arcangeletti, Leonetta Baldassarre in Rome, and ofcourse my colleague at ETH Zürich Florian Pfuner. He shared with me the F3 lab in thelast three years and day by day we helped each other as a good team. Florian, thank youfor everything! We had a great time together!
Last, but denitively not least I thank Dr. Andrea Sacchetti. There are no words toexpress how important was his contribution in the realization of this work and above allin my scientic and human growth. Grazie Sacco!
Finally, I will spend few words in Italian for people who were not involved in my sci-entic work but are very important to me.
Solo brevemente, volevo dedicare un ringraziamento speciale a tutte le persone che hoconosciuto in questi anni, che con la loro straordinaria energia e con il loro affetto mihanno fatto trascorrere dei momenti incredibili, sempre divertentissimi e sempre intensi.Non dimeticheró mai il mio primo anno a zh e non mi dimenticheró mai di voi. Fate tuttiparte di questa tesi... Grazie!! :-)L'ultimo pensiero vá alla mia famiglia, che tre anni fa mi ha visto partire per questolavoro e andare "lontano"... ma che penso e spero non mi abbia mai sentita veramentelontana, dal cuore.

Curriculum vitae
Name Michela LavagniniBorn December 8th, 1978 (Roma)Nationality Italian
Education
July 1997 Scientic maturity, Liceo Statale "B. Touschek" (Roma).February 2005 Diploma (Laurea) in Physics at the University of Roma
"La Sapienza" (score: 110/110). Experimental thesis in theRaman-scattering group of Prof. P. Postorino.
October 2005 Ph.D position and teaching assistant at ETH Zürich in theOptical Spectroscopy group of Prof. L. Degiorgi.
March 2009 Degree of Doctor of Science at ETH Zürich.
Scientic experiences
November 2006 Reectivity measurements at high-pressure at the Infraredbeamline (SISSI) at ELETTRA synchrotron, Trieste (Italy).
February 2008 X-ray diffraction experiments at high-pressure at ESRFsynchrotron, Grenoble (France).
August 2008 Raman experiments at high-pressure in the group of Dr. R.Hackl at the Walther-Meissner-Institut, Garching (Munich,Germany).
145

List of Publications
1. Pressure-induced quenching of the charge-density-wave state observed by x-ray diffraction.A. Sacchetti, C.L. Condron, S.N. Gvasaliya, F. Pfuner, M. Lavagnini, M. Baldini,M.F. Toney, M. Merlini, M. Hanand, J. Mesot, J.-H. Chu, I. R. Fisher, P. Postorinoand L. Degiorgi, Phys. Rev. B 79, (R) (2009) in press.
2. Pressure dependence of the single particle excitation in the charge-density-wave CeTe3 system.M. Lavagnini, A. Sacchetti, C. Marini, M. Valentini, R. Sopracase, A. Perucchi, P.Postorino, S. Lupi, J.-H. Chu, I.R. Fisher and L. Degiorgi, Phys. Rev. B 79, 075117(2009).
3. Evidence for coupling between charge density waves and phonons in two-dimensionalrare-earth tritellurides.M. Lavagnini, M. Baldini, A. Sacchetti, D. Di Castro, B. Delley, R. Monnier, J.-H.Chu, N. Ru, I. R. Fisher, P. Postorino and L. Degiorgi, Phys. Rev. B 78, 201101(R)(2008).
4. Pressure dependence of the optical properties of the charge-density-wave com-pound LaTe2.M. Lavagnini, A. Sacchetti, L. Degiorgi, E. Arcangeletti, L. Baldassarre, P. Pos-torino, S. Lupi, A. Perucchi, K.Y. Shin and I.R. Fisher, Phys. Rev. B 77, 165132
147
(2008).
5. Role of charge doping and lattice distortions in codoped Mg1−xAlLixB2 com-pounds.M. Monni, M. Affronte, C. Bernini, D. Di Castro, C. Ferdeghini, M. Lavagnini, P.Manfrinetti, A. Orecchini, A. Palenzona, C. Petrillo, P. Postorino, A. Sacchetti, F.Sacchetti and M. Putti, Physica C 460, 598 (2007).
6. Photoemission and optical studies of ZrSe3, HfSe3, and ZrS3.D. Pacile, M. Papagno, M. Lavagnini, H. Berger, L. Degiorgi and M. Grioni, Phys.Rev. B 76, 155406 (2007).
7. Optical properties of the Ce and La ditelluride charge density wave compounds.M. Lavagnini, A. Sacchetti, L. Degiorgi, K.Y. Shin and I.R. Fisher, Phys. Rev. B75, 205133 (2007).
8. Raman spectra of neutron-irradiated and Al-doped MgB2.D. Di Castro, E. Cappelluti, M. Lavagnini, A. Sacchetti, A. Palenzona, M. Putti andP. Postorino, Phys. Rev. B 74, 100505(R) (2006).
9. Role of charge doping and lattice distortions in codoped Mg1−xAlLixB2 com-pounds.M. Monni, C. Ferdeghini, M. Putti, P. Manfrinetti, A. Palenzona, M. Affronte, P.Postorino, M. Lavagnini, A. Sacchetti, D. Di Castro, F. Sacchetti, C. Petrillo and A.Orecchini, Phys. Rev. B 73, 214508 (2006).
Presentations
PSI Summer School on "Correlated Electron Materials", August 18-25, 2007. LyceumAlpinum in Zuoz / Engadin, Switzerland."Optical study of the Ce and La di-telluride charge density wave compounds underpressure" (Poster presentation).
Swiss Workshop on Materials with Novel Electronic Properties, September 28-30, 2007.Les Diablerets, Switzerland."Optical study of the Ce and La di-telluride charge density wave compounds underpressure" (Poster presentation).
SPS Meeting, March 26-27, 2008. University of Geneva, Switzerland."Infrared and Raman study of the charge-density-wave rare-earth polychalcogenidesRETen" (Poster presentation).


![Index [assets.cambridge.org]assets.cambridge.org/97805217/41859/index/9780521741859_index… · facial expressions see gestures and facial expressions facilitating interaction avoiding](https://img.pdfslide.us/doc/110x75/5f6e7b711e5f8276a466c5ca/index-facial-expressions-see-gestures-and-facial-expressions-facilitating-interaction.jpg)