Embed Size (px)
Citation preview
In collaboration with REA, SPI, Funded Programs and Leadership Development 1
Mining for Data - Part 2
In collaboration with REA, SPI, Funded Programs and Leadership Development 2
Goals of the Day
• Examine MCA data
• Apply a problem solving process to monitoring teaching, learning and leadership
• Utilize the new knowledge to refine the School Continuous Improvement Plans (SCIPs)
In collaboration with REA, SPI, Funded Programs and Leadership Development 3
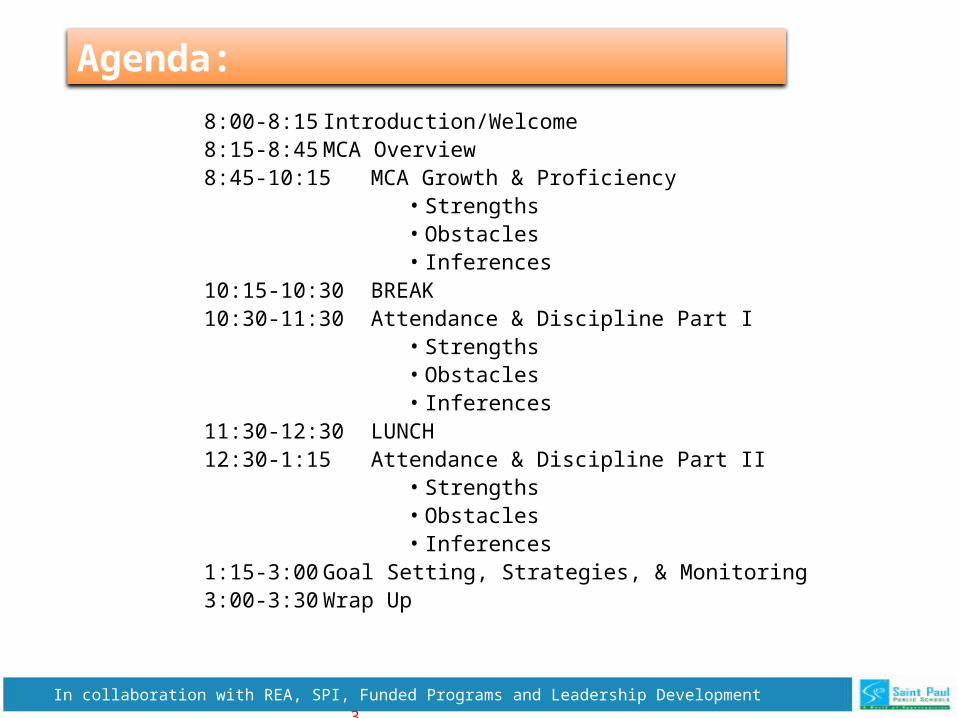
8:00-8:15 Introduction/Welcome8:15-8:45 MCA Overview8:45-10:15 MCA Growth & Proficiency
• Strengths• Obstacles• Inferences
10:15-10:30 BREAK10:30-11:30 Attendance & Discipline Part I
• Strengths• Obstacles• Inferences
11:30-12:30 LUNCH12:30-1:15 Attendance & Discipline Part II
• Strengths• Obstacles• Inferences
1:15-3:00 Goal Setting, Strategies, & Monitoring3:00-3:30 Wrap Up
Agenda:
In collaboration with REA, SPI, Funded Programs and Leadership Development 4
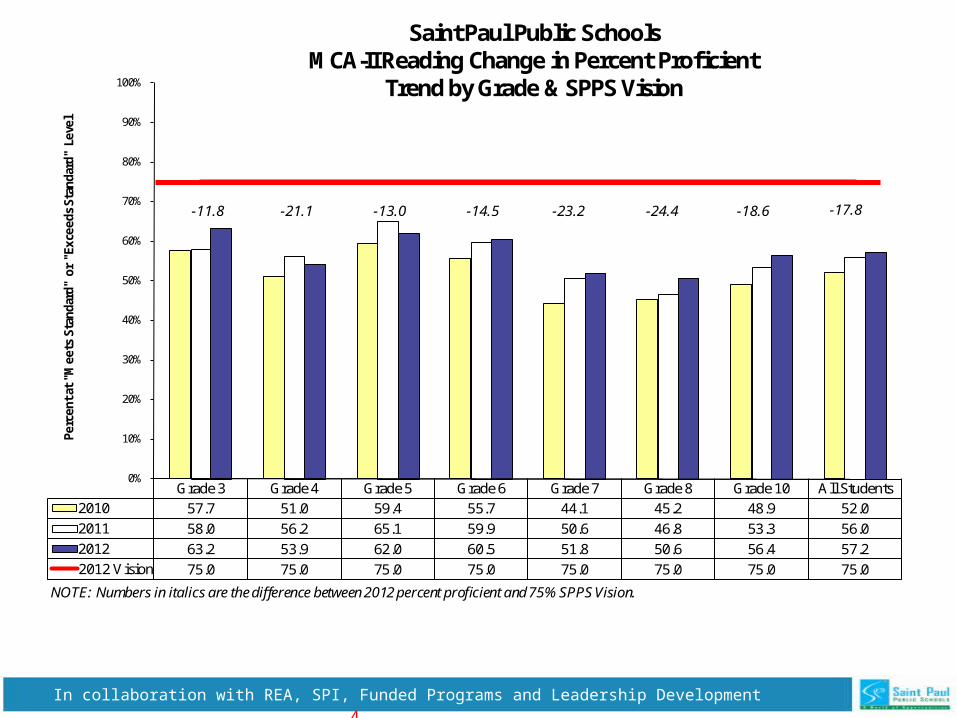
Grade 3 Grade 4 Grade 5 Grade 6 Grade 7 Grade 8 Grade 10 All Students
2010 57.7 51.0 59.4 55.7 44.1 45.2 48.9 52.0
2011 58.0 56.2 65.1 59.9 50.6 46.8 53.3 56.0
2012 63.2 53.9 62.0 60.5 51.8 50.6 56.4 57.2
2012 Vision 75.0 75.0 75.0 75.0 75.0 75.0 75.0 75.0
0%
10%
20%
30%
40%
50%
60%
70%
80%
90%
100%Pe
rcen
t at "M
eets
Sta
ndar
d" o
r "E
xcee
ds S
tand
ard"
Lev
el
Saint Paul Public SchoolsMCA-II Reading Change in Percent Proficient
Trend by Grade & SPPS Vision
NOTE: Numbers in italics are the difference between 2012 percent proficient and 75% SPPS Vision.
-11.8 -21.1 -13.0 -14.5 -23.2 -24.4 -18.6 -17.8

In collaboration with REA, SPI, Funded Programs and Leadership Development 5
American Indian
Asian American
HispanicAfrican
AmericanCaucasian
Special Education
ELLow
IncomeAll
Students
2010 48.3 46.6 52.9 44.9 82.9 25.3 39.3 45.9 56.0
2011 48.3 46.6 52.9 44.9 82.9 25.3 39.3 45.9 56.0
2012 51.2 47.9 53.7 45.8 84.7 26.5 39.1 46.8 57.2
2012 Vision 75.0 75.0 75.0 75.0 75.0 75.0 75.0 75.0 75.0
0%
10%
20%
30%
40%
50%
60%
70%
80%
90%
100%
Perc
ent a
t "M
eets
Sta
ndar
d" o
r "E
xcee
ds S
tand
ard"
Lev
el
Saint Paul Public SchoolsMCA-II Reading Change in Percent Proficient
Trend by Student Group & SPPS Vision
-23.8 -27.1 -21.3 -29.2
+9.7
-48.5 -35.9 -28.2 -17.8
NOTE: Numbers in italics are the difference between 2012 percent proficient and 75% SPPS Vision.
In collaboration with REA, SPI, Funded Programs and Leadership Development 6
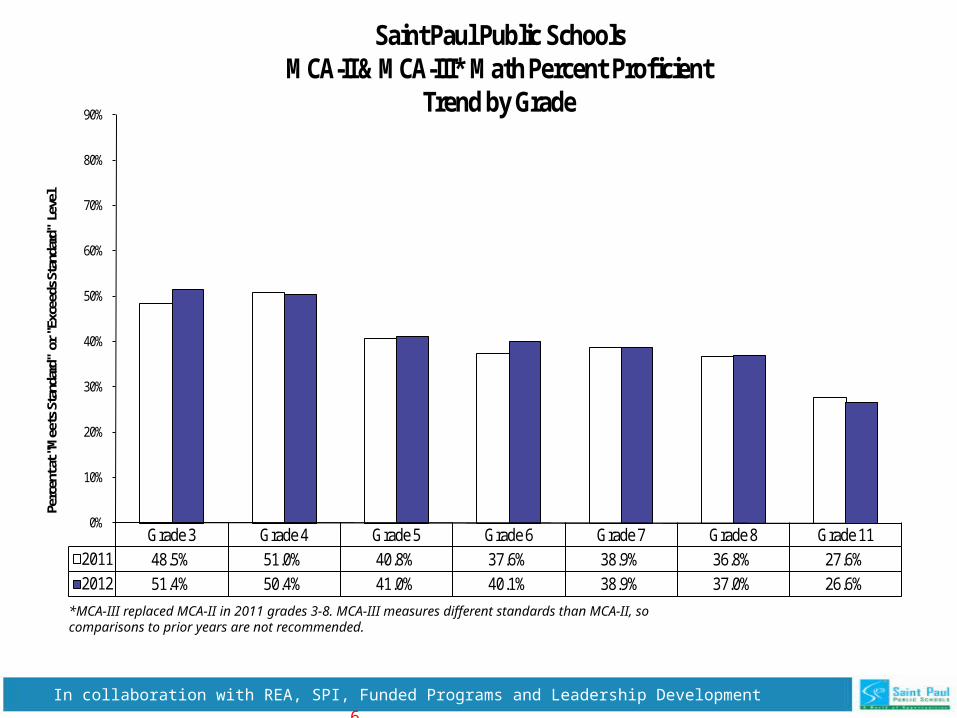
*MCA-III replaced MCA-II in 2011 grades 3-8. MCA-III measures different standards than MCA-II, so comparisons to prior years are not recommended.
Grade 3 Grade 4 Grade 5 Grade 6 Grade 7 Grade 8 Grade 11
2011 48.5% 51.0% 40.8% 37.6% 38.9% 36.8% 27.6%
2012 51.4% 50.4% 41.0% 40.1% 38.9% 37.0% 26.6%
0%
10%
20%
30%
40%
50%
60%
70%
80%
90%
Perc
ent a
t "M
eets
Sta
ndar
d" o
r "E
xcee
ds S
tand
ard"
Lev
elSaint Paul Public Schools
MCA-II & MCA-III* Math Percent ProficientTrend by Grade
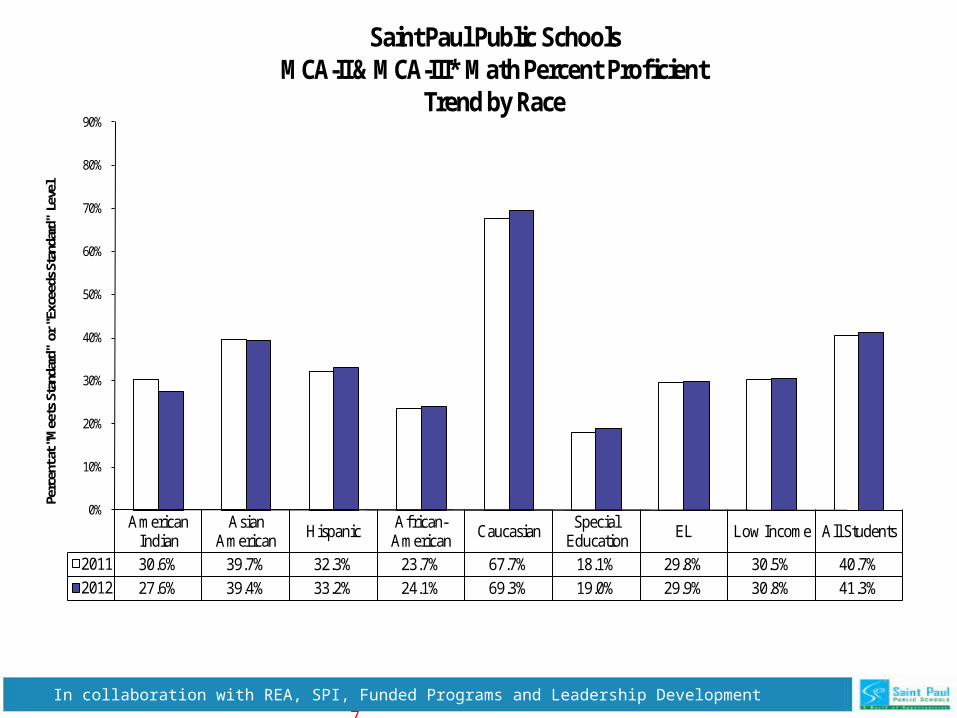
*MCA-III replaced MCA-II in 2011 in grades 3-8. MCA-III measures dif ferent standards than MCA-II, so comparisons to prior years are not recommended.
In collaboration with REA, SPI, Funded Programs and Leadership Development 7
American Indian
Asian American
HispanicAfrican-
AmericanCaucasian
Special Education
EL Low Income All Students
2011 30.6% 39.7% 32.3% 23.7% 67.7% 18.1% 29.8% 30.5% 40.7%
2012 27.6% 39.4% 33.2% 24.1% 69.3% 19.0% 29.9% 30.8% 41.3%
0%
10%
20%
30%
40%
50%
60%
70%
80%
90%
Perc
ent a
t "M
eets
Sta
ndar
d" o
r "E
xcee
ds S
tand
ard"
Lev
elSaint Paul Public Schools
MCA-II & MCA-III* Math Percent Proficient Trend by Race
*MCA-III replaced MCA-II in 2011 in grades 3-8. MCA-III measures dif ferent standards than MCA-II, so comparisons to prior years are not recommended.

In collaboration with REA, SPI, Funded Programs and Leadership Development 8
During the next protocol you will compare your school’s data for last year with the data for this year.
Think about your strategies. What do you need to “reconsider” based on the MCA results? Center your thinking on the link between your strategies and your school’s results on the MCA.
What can be your Courageous Conversation with building staff next year?
Reflections
In collaboration with REA, SPI, Funded Programs and Leadership Development 9
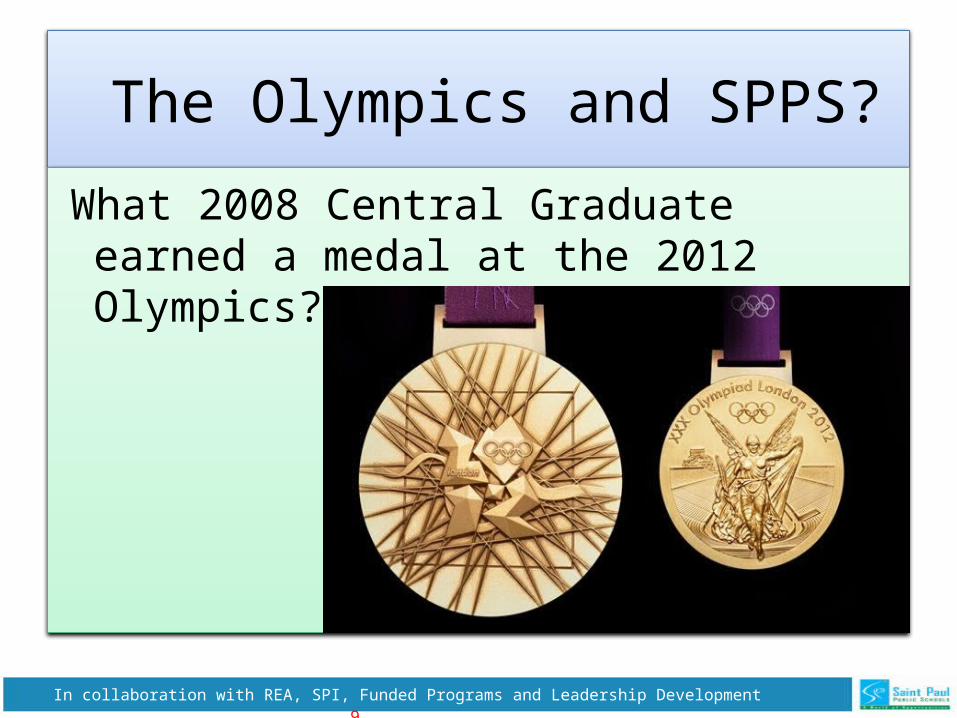
The Olympics and SPPS?
What 2008 Central Graduate earned a medal at the 2012 Olympics?

In collaboration with REA, SPI, Funded Programs and Leadership Development 10
Susannah Scanlan
Fencing Princeton
In collaboration with REA, SPI, Funded Programs and Leadership Development 11
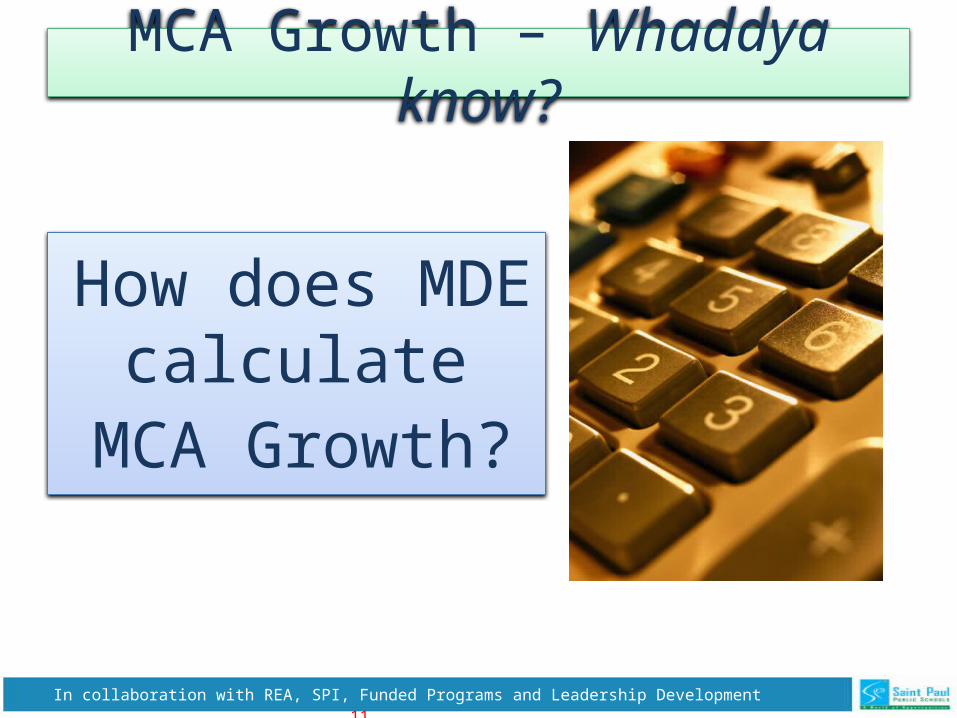
MCA Growth – Whaddya know?
How does MDE calculate
MCA Growth?
In collaboration with REA, SPI, Funded Programs and Leadership Development 12
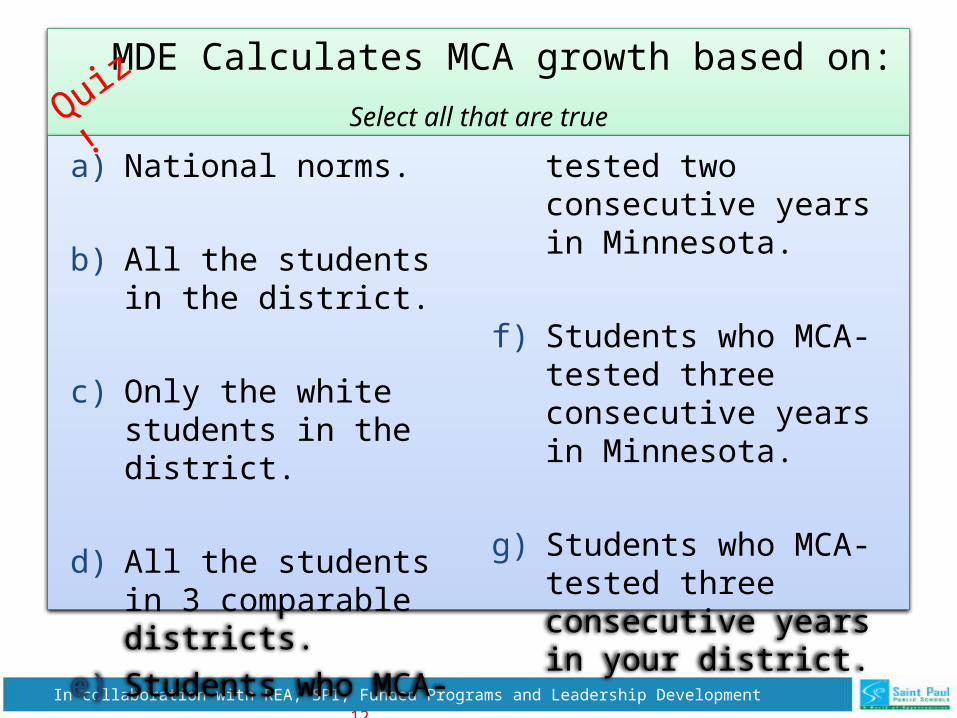
MDE Calculates MCA growth based on:
Select all that are true
a) National norms.
b) All the students in the district.
c) Only the white students in the district.
d) All the students in 3 comparable districts.
e) Students who MCA-
tested two consecutive years in Minnesota.
f) Students who MCA- tested three consecutive years in Minnesota.
g) Students who MCA- tested three consecutive years in your district.
Quiz!

In collaboration with REA, SPI, Funded Programs and Leadership Development 13
MCA Growth and Proficiency
Objectives:
1. Using MCA data, determine the extent to which student groups are meeting the necessary growth targets to become on track for success.
2. Identify the largest gaps in student proficiency over the past two years.
3. Use the Cause Inference Matrix to reflect on which adult actions were in part responsible for 2012 results and revise SCIP accordingly.
In collaboration with REA, SPI, Funded Programs and Leadership Development 14
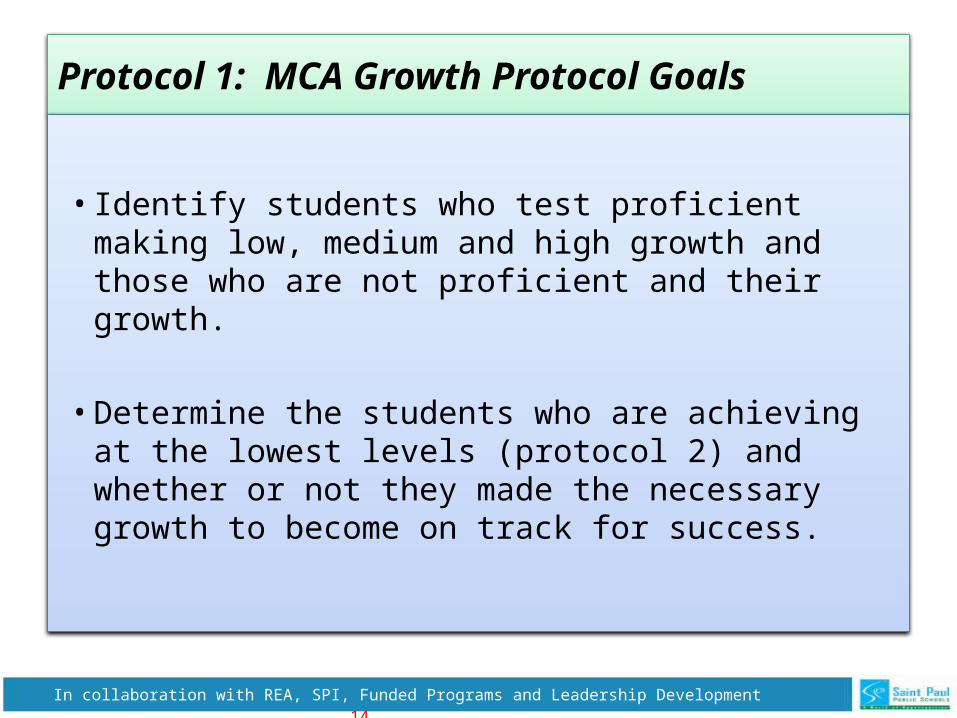
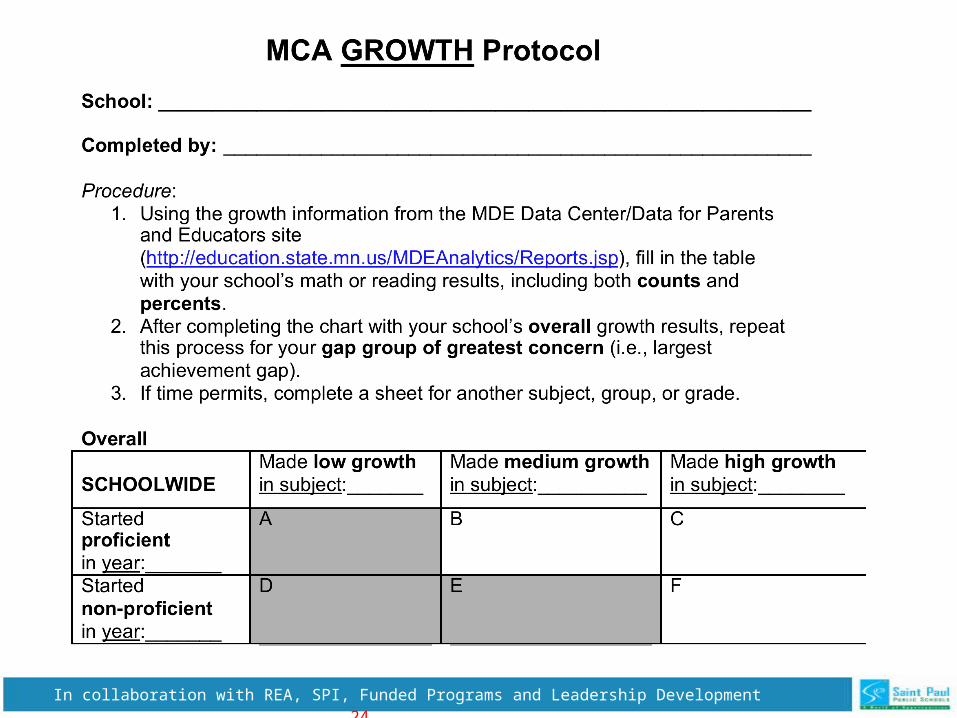
Protocol 1: MCA Growth Protocol Goals
• Identify students who test proficient making low, medium and high growth and those who are not proficient and their growth.
• Determine the students who are achieving at the lowest levels (protocol 2) and whether or not they made the necessary growth to become on track for success.
In collaboration with REA, SPI, Funded Programs and Leadership Development 15
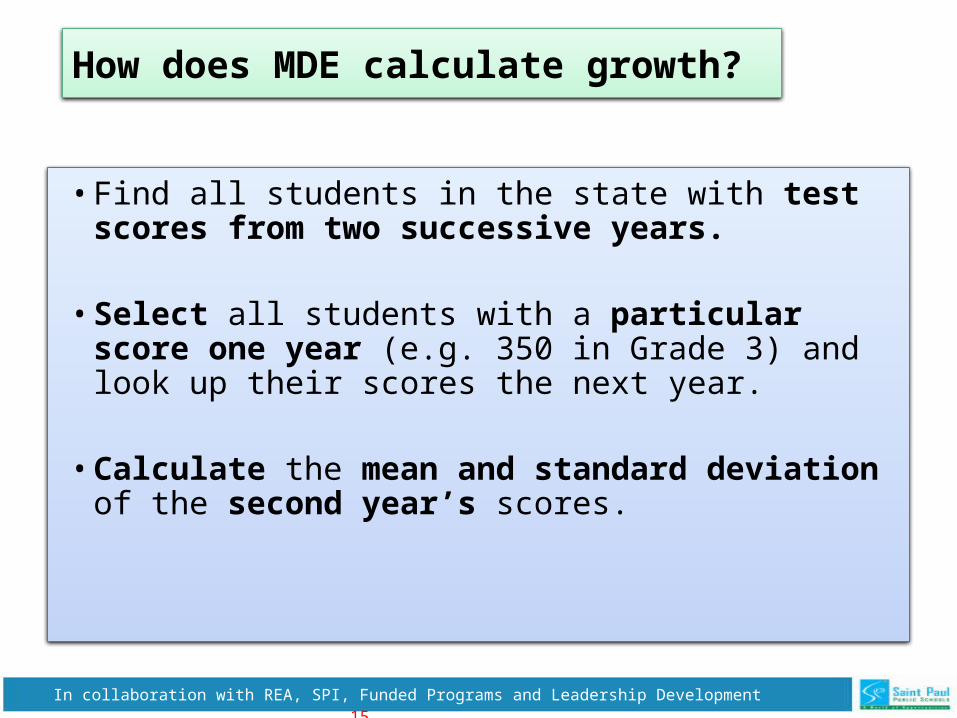
• Find all students in the state with test scores from two successive years.
• Select all students with a particular score one year (e.g. 350 in Grade 3) and look up their scores the next year.
• Calculate the mean and standard deviation of the second year’s scores.
How does MDE calculate growth?
In collaboration with REA, SPI, Funded Programs and Leadership Development 16
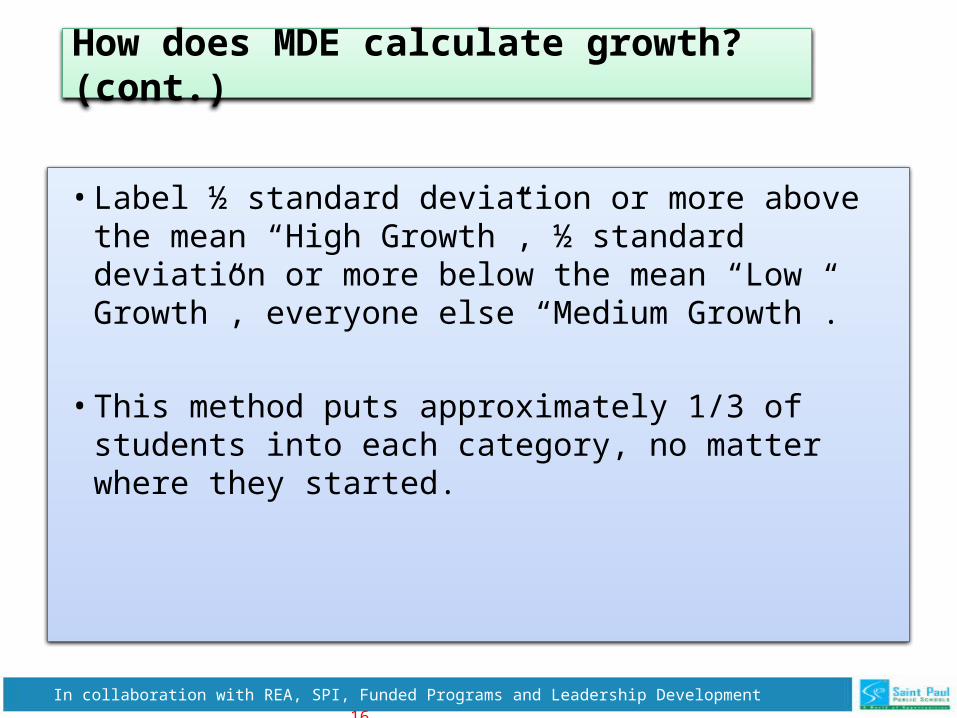
How does MDE calculate growth? (cont.)
• Label ½ standard deviation or more above the mean “High Growth”, ½ standard deviation or more below the mean “Low Growth”, everyone else “Medium Growth”.
• This method puts approximately 1/3 of students into each category, no matter where they started.
In collaboration with REA, SPI, Funded Programs and Leadership Development 17
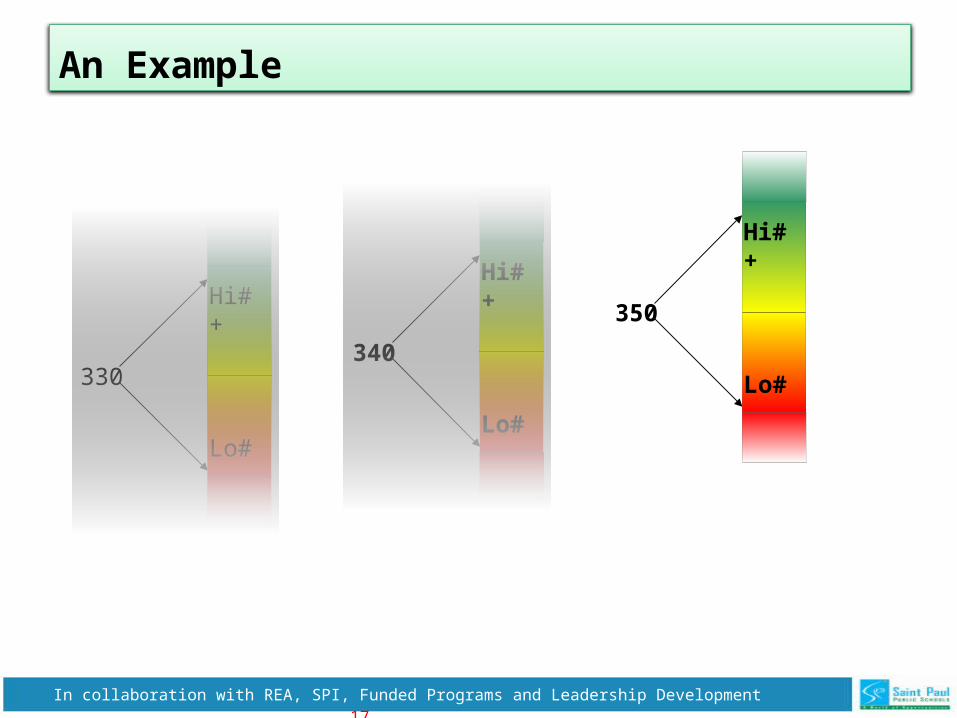
330
Hi# +
Lo# -
340
Hi# +
Lo# -
350
Hi# +
Lo# -
An Example
In collaboration with REA, SPI, Funded Programs and Leadership Development 18
Which students are included in MCA Growth data?
• Took MCA (not MTAS) current year and prior year
• Have valid scores from both years
• Did not skip or get held back a grade level
• For grade 10 & 11 students, their “prior year” score is
actually from grade 8
In collaboration with REA, SPI, Funded Programs and Leadership Development 19
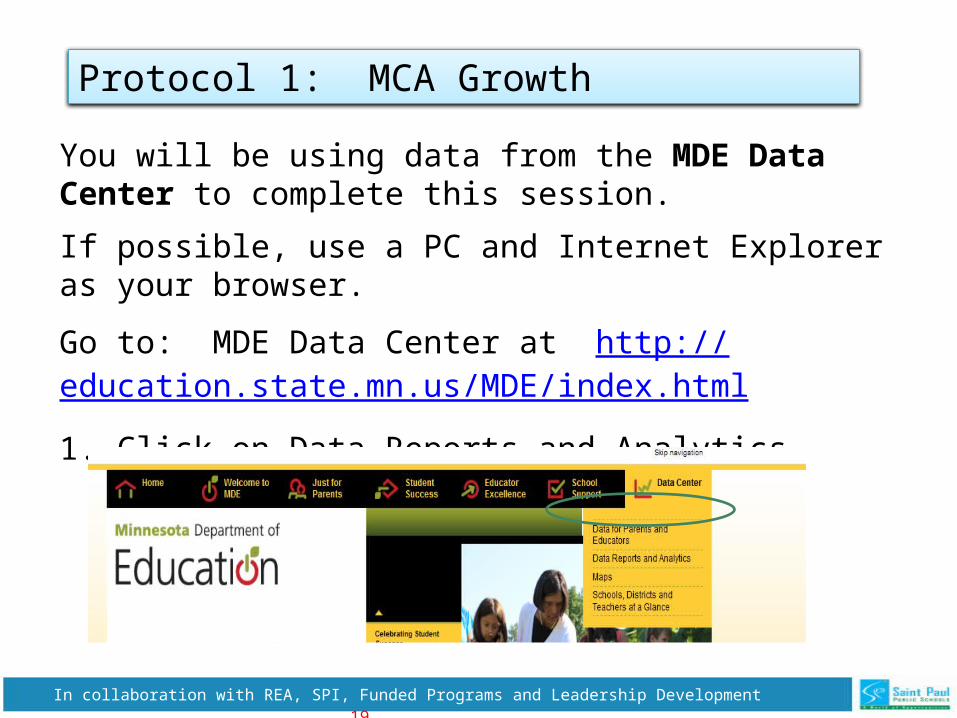
If possible, use a PC and Internet Explorer as your browser.
Go to: MDE Data Center at http://education.state.mn.us/MDE/index.html
1. Click on Data Reports and Analytics.
You will be using data from the MDE Data Center to complete this session.
Protocol 1: MCA Growth
In collaboration with REA, SPI, Funded Programs and Leadership Development 20
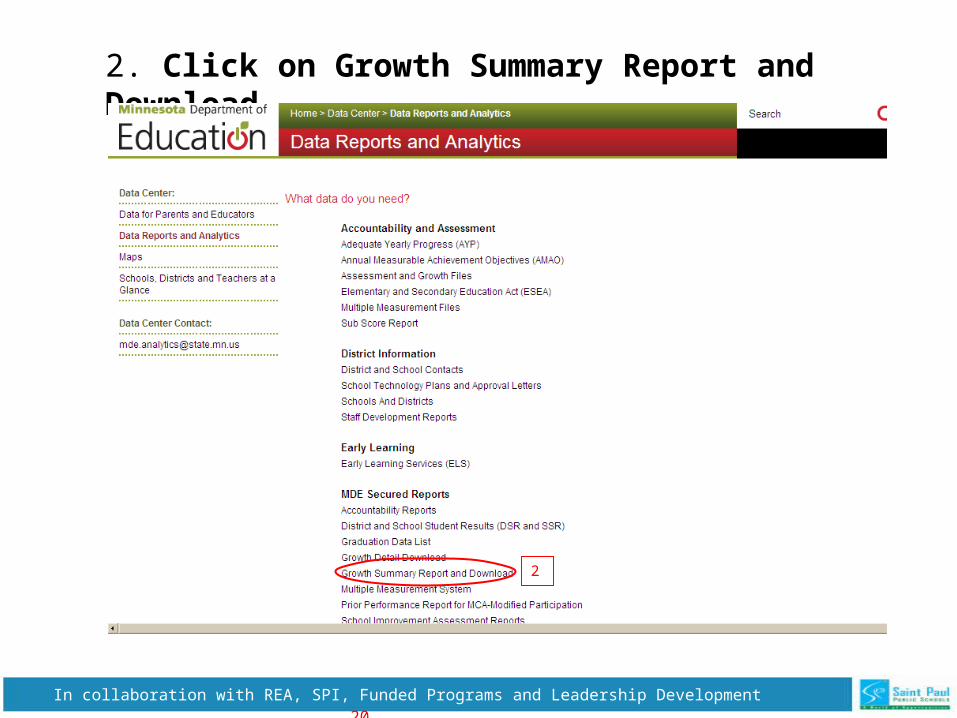
2. Click on Growth Summary Report and Download.
2
In collaboration with REA, SPI, Funded Programs and Leadership Development 21
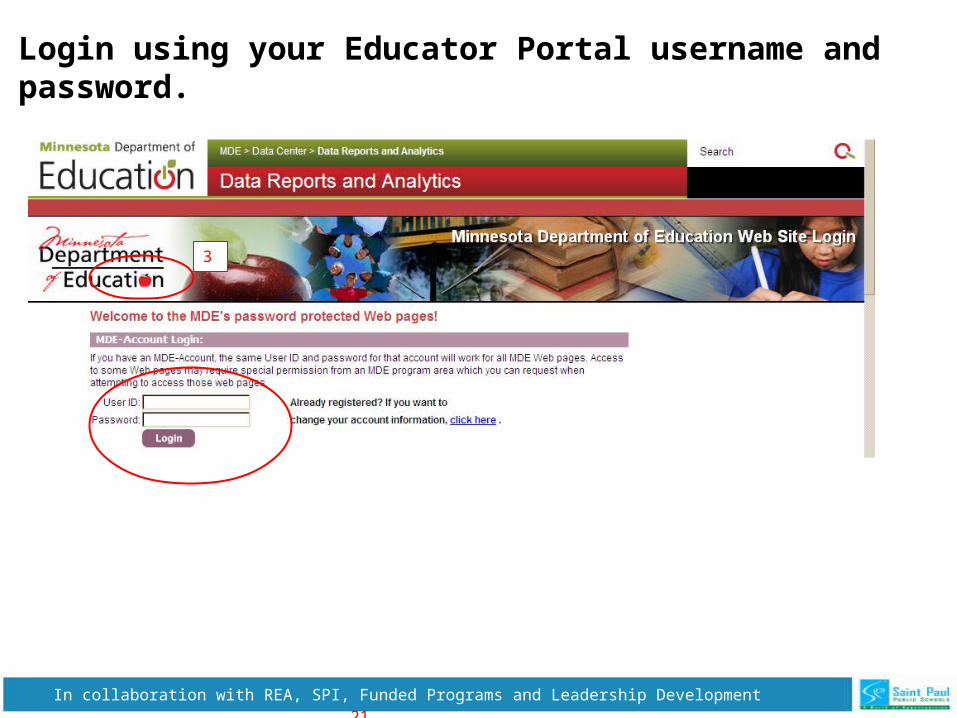
3
Login using your Educator Portal username and password.
In collaboration with REA, SPI, Funded Programs and Leadership Development 22
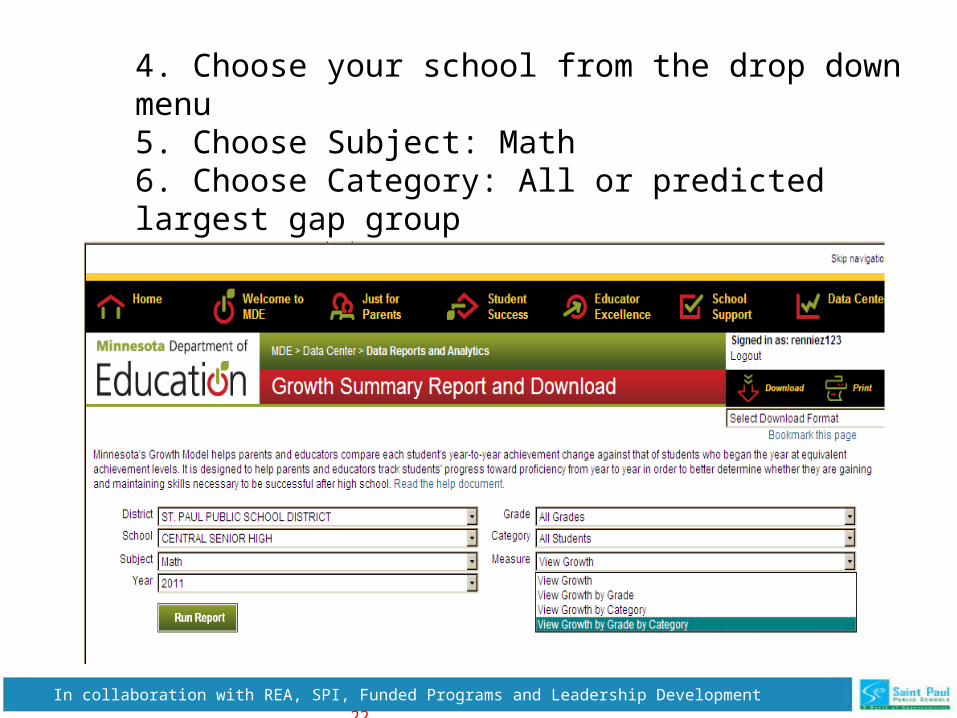
4. Choose your school from the drop down menu 5. Choose Subject: Math6. Choose Category: All or predicted largest gap group7. Choose Measure: View growth by grade and category8. Click on Run Report
In collaboration with REA, SPI, Funded Programs and Leadership Development 23
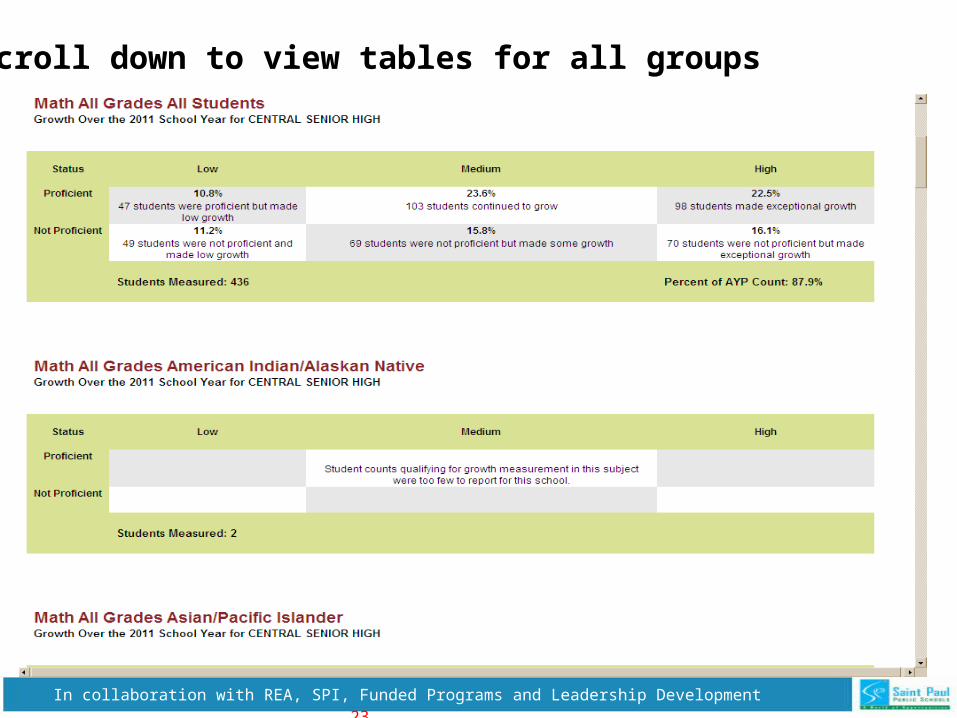
Scroll down to view tables for all groups
In collaboration with REA, SPI, Funded Programs and Leadership Development 24
In collaboration with REA, SPI, Funded Programs and Leadership Development 25
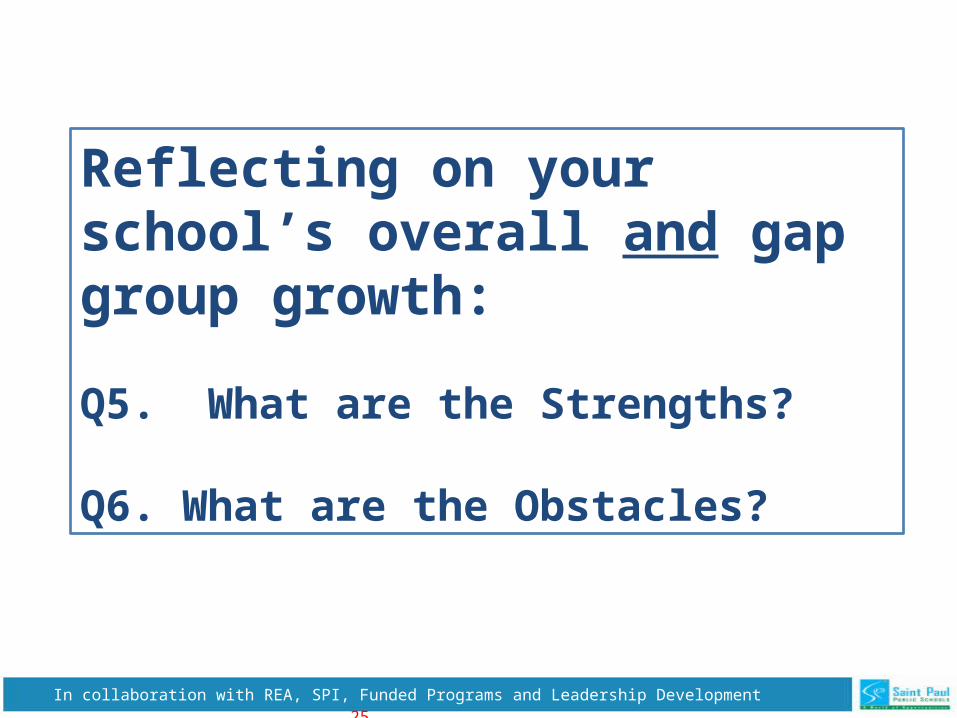
Reflecting on your school’s overall and gap group growth:
Q5. What are the Strengths?
Q6. What are the Obstacles?
In collaboration with REA, SPI, Funded Programs and Leadership Development 26
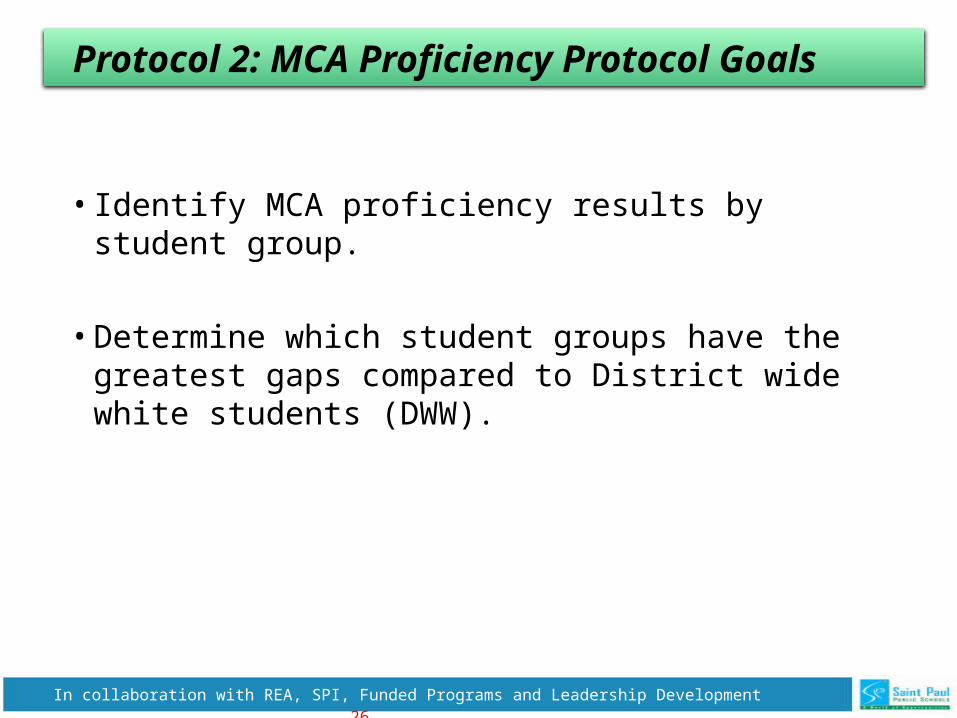
Protocol 2: MCA Proficiency Protocol Goals
• Identify MCA proficiency results by student group.
• Determine which student groups have the greatest gaps compared to District wide white students (DWW).

In collaboration with REA, SPI, Funded Programs and Leadership Development 27
Protocol 2: MCA Proficiency Protocol
• You will be using data from the NCLB Categories report on Viewpoint to complete this worksheet.
• Go to: Viewpoint at https://viewpoint.spps.org/login.aspx
In collaboration with REA, SPI, Funded Programs and Leadership Development 28
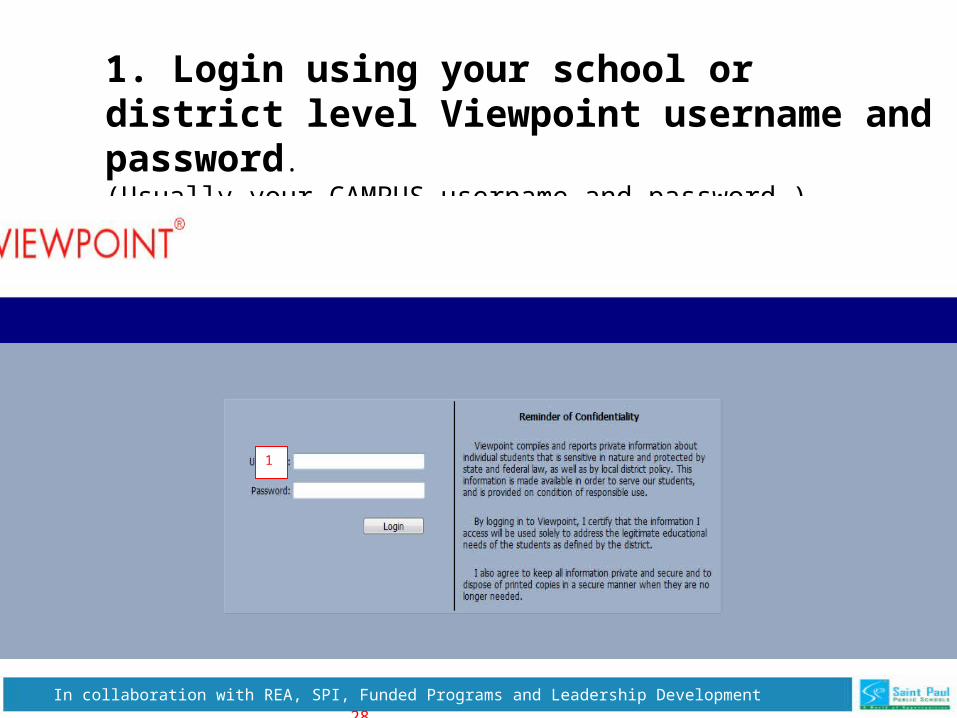
1. Login using your school or district level Viewpoint username and password.(Usually your CAMPUS username and password.)
1
In collaboration with REA, SPI, Funded Programs and Leadership Development 29
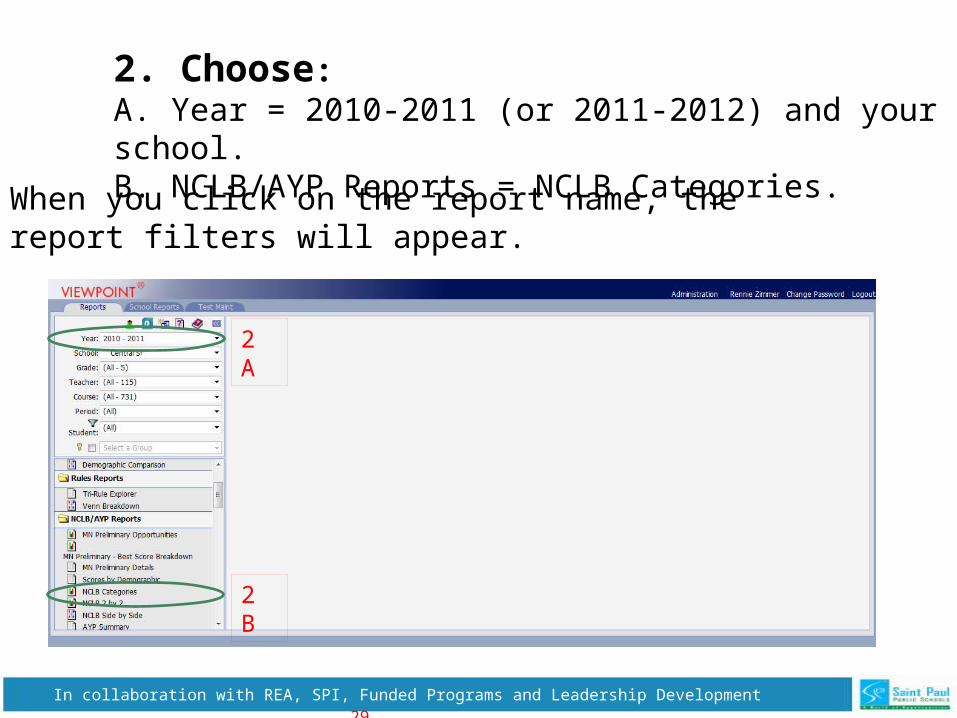
2. Choose: A. Year = 2010-2011 (or 2011-2012) and your school.B. NCLB/AYP Reports = NCLB Categories.
When you click on the report name, the report filters will appear.
2 A
2 B
In collaboration with REA, SPI, Funded Programs and Leadership Development 30
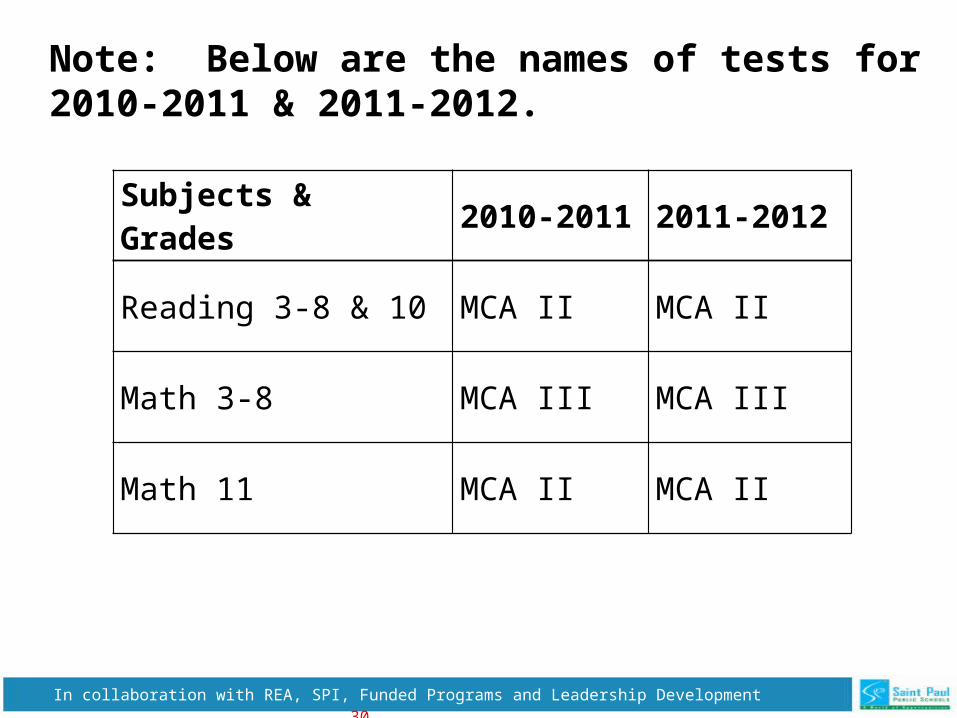
Note: Below are the names of tests for 2010-2011 & 2011-2012.
Subjects & Grades 2010-2011 2011-2012
Reading 3-8 & 10 MCA II MCA II
Math 3-8 MCA III MCA III
Math 11 MCA II MCA II

In collaboration with REA, SPI, Funded Programs and Leadership Development 31
3. Choose specific test filters.• Test: grades 3-8 & 10 reading=MN AYP-MCA II; grades 3-8 math=MN
AYP MATH III; grade 11 math=MN AYP-MCAII• Season: 2010-2011 or 2011-2012 (same as Year in step 2A)• Category: Math or Reading• Scale: Proficiency• Status: AYP Demographics• Demographic: AYP/Ethnicity, AYP/ELL, or AYP/Special Ed
In collaboration with REA, SPI, Funded Programs and Leadership Development 32
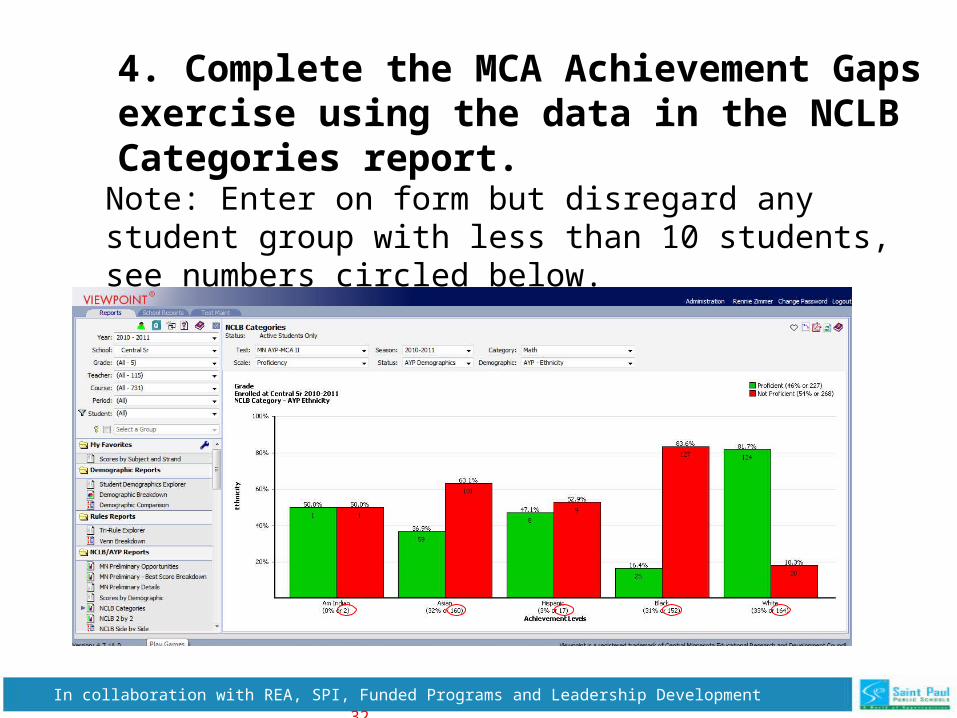
4. Complete the MCA Achievement Gaps exercise using the data in the NCLB Categories report.
Note: Enter on form but disregard any student group with less than 10 students, see numbers circled below.
In collaboration with REA, SPI, Funded Programs and Leadership Development 33
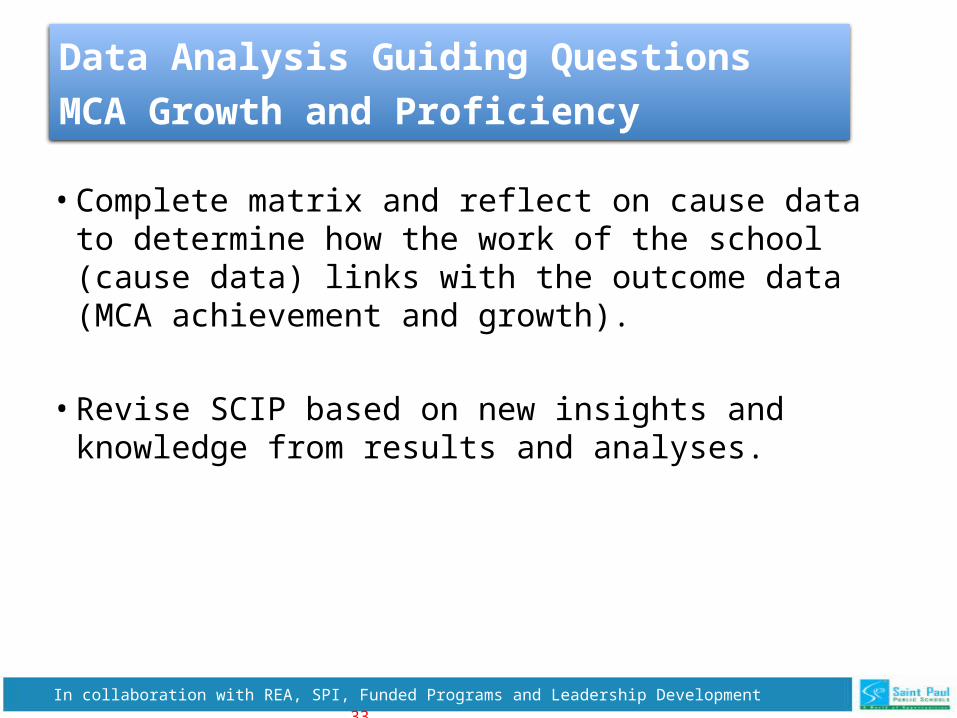
Data Analysis Guiding Questions
MCA Growth and Proficiency
• Complete matrix and reflect on cause data to determine how the work of the school (cause data) links with the outcome data (MCA achievement and growth).
• Revise SCIP based on new insights and knowledge from results and analyses.
In collaboration with REA, SPI, Funded Programs and Leadership Development 34
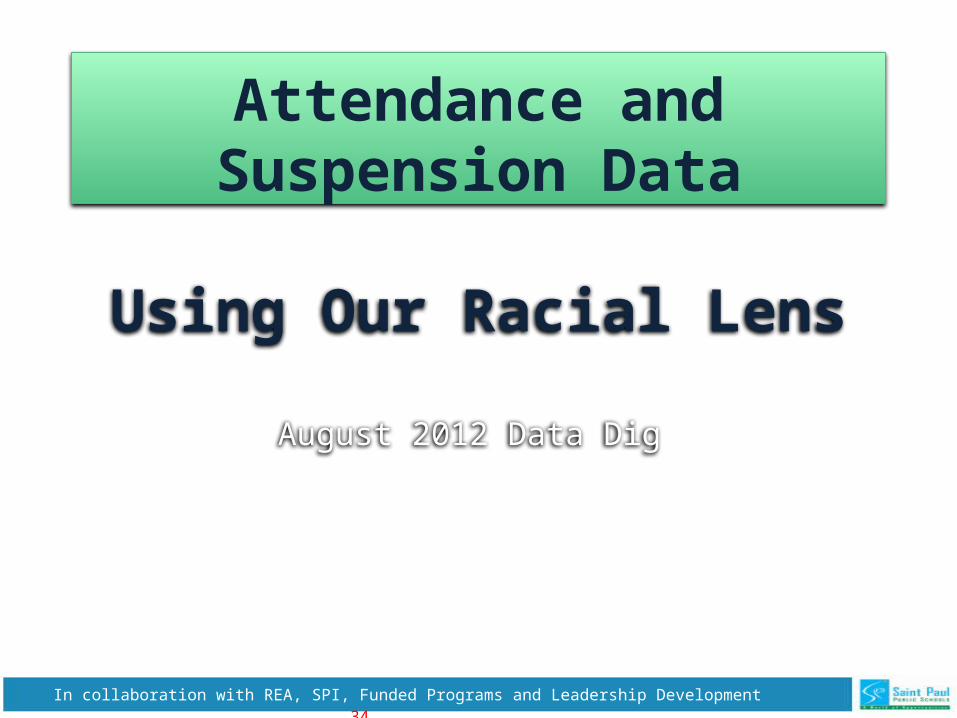
Attendance and Suspension Data
Using Our Racial Lens
August 2012 Data Dig
In collaboration with REA, SPI, Funded Programs and Leadership Development 35
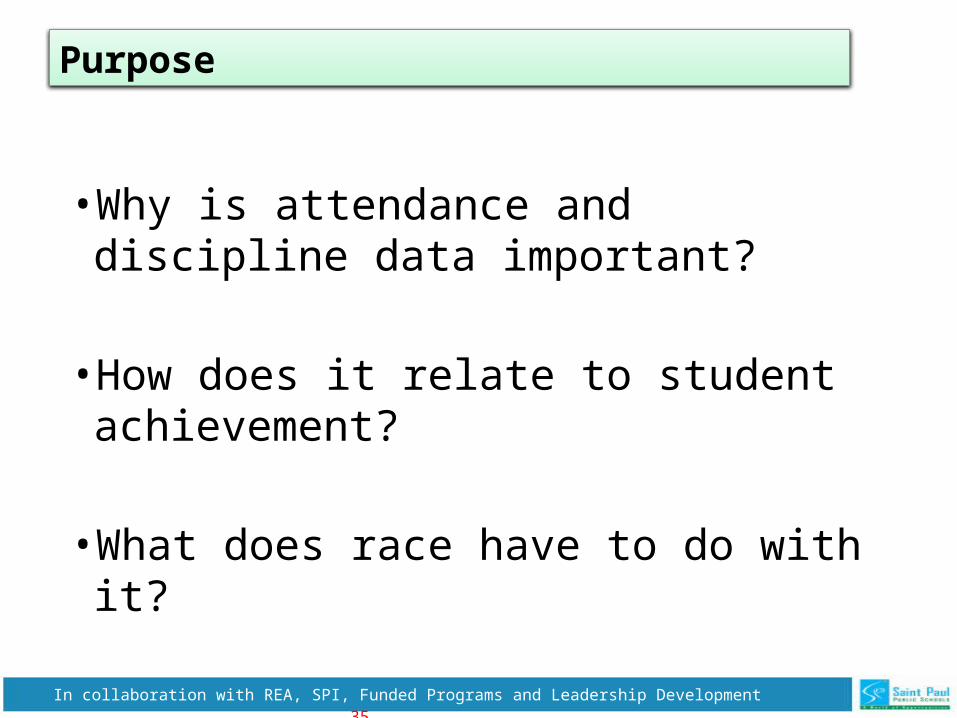
• Why is attendance and discipline data important?
• How does it relate to student achievement?
• What does race have to do with it?
Purpose
In collaboration with REA, SPI, Funded Programs and Leadership Development 36
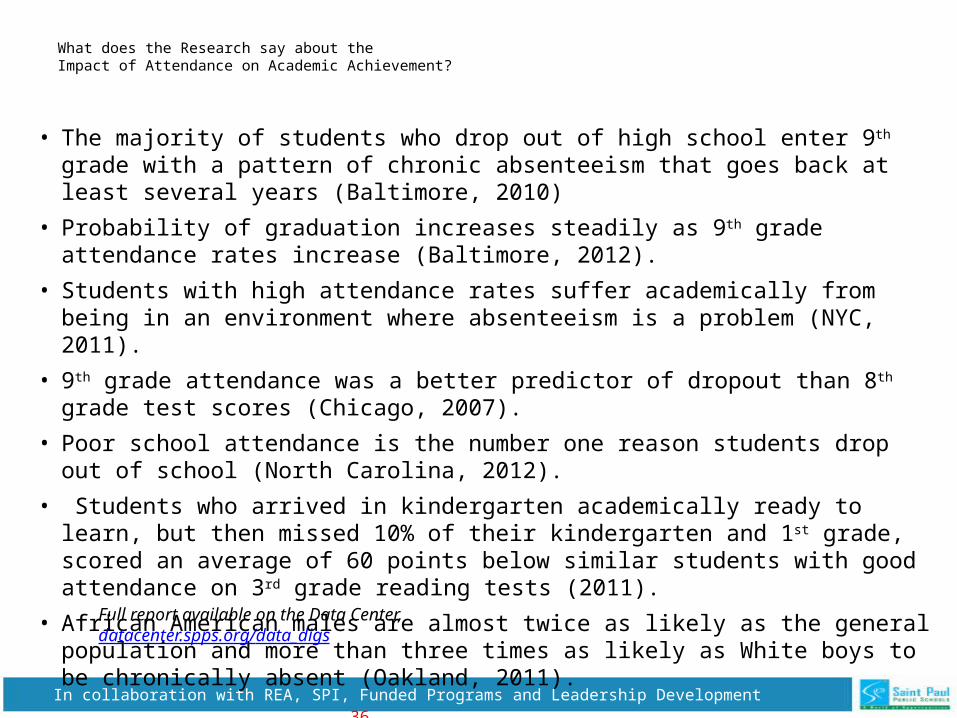
What does the Research say about the Impact of Attendance on Academic Achievement?
• The majority of students who drop out of high school enter 9th grade with a pattern of chronic absenteeism that goes back at least several years (Baltimore, 2010)
• Probability of graduation increases steadily as 9th grade attendance rates increase (Baltimore, 2012).
• Students with high attendance rates suffer academically from being in an environment where absenteeism is a problem (NYC, 2011).
• 9th grade attendance was a better predictor of dropout than 8th grade test scores (Chicago, 2007).
• Poor school attendance is the number one reason students drop out of school (North Carolina, 2012).
• Students who arrived in kindergarten academically ready to learn, but then missed 10% of their kindergarten and 1st grade, scored an average of 60 points below similar students with good attendance on 3rd grade reading tests (2011).
• African American males are almost twice as likely as the general population and more than three times as likely as White boys to be chronically absent (Oakland, 2011).
Full report available on the Data Center, datacenter.spps.org/data_digs
In collaboration with REA, SPI, Funded Programs and Leadership Development 37
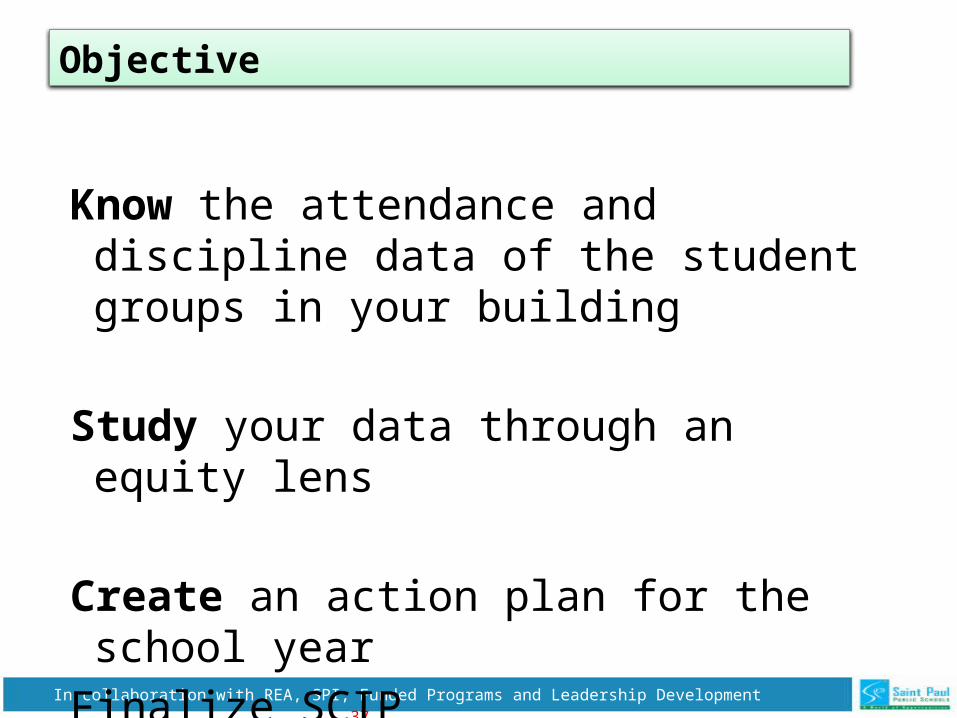
Know the attendance and discipline data of the student groups in your building
Study your data through an equity lens
Create an action plan for the school year
Finalize SCIP
Objective

In collaboration with REA, SPI, Funded Programs and Leadership Development 38
Agenda:1. Analysis of attendance data (11 or more days absent) for gap and growth
2. Analysis of discipline/suspension data for gap and growth
3. Review SCIP and update- SMART goal(s)- Strategies- Monitoring plan
Attendance and Suspension Data
Using Our Racial Lens
In collaboration with REA, SPI, Funded Programs and Leadership Development 39
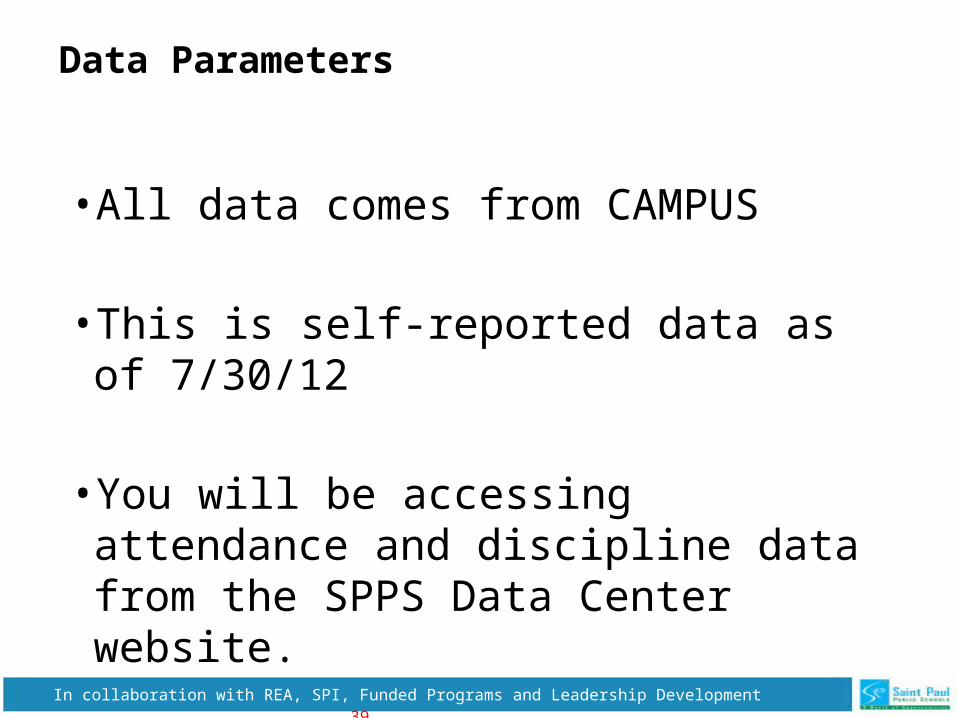
• All data comes from CAMPUS
• This is self-reported data as of 7/30/12
• You will be accessing attendance and discipline data from the SPPS Data Center website.
Data Parameters

In collaboration with REA, SPI, Funded Programs and Leadership Development 40
Attendance Data: Absent 11 or more days
In collaboration with REA, SPI, Funded Programs and Leadership Development 41
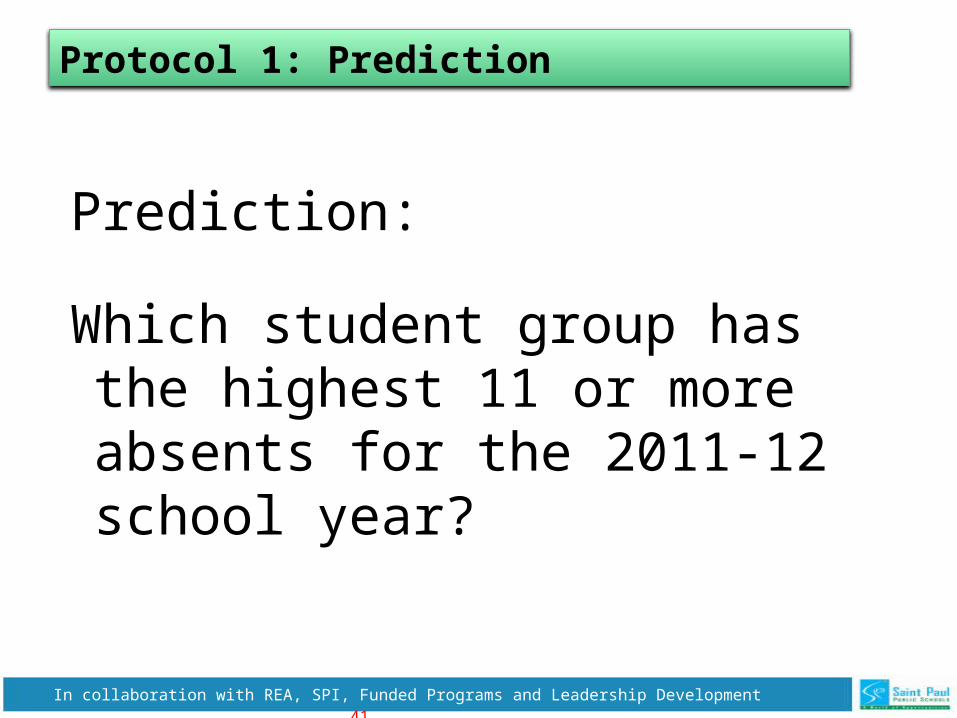
Prediction:
Which student group has the highest 11 or more absents for the 2011-12 school year?
Protocol 1: Prediction

In collaboration with REA, SPI, Funded Programs and Leadership Development 42
Identify by percent of students absent 11 or more days
http://datacenter.spps.org/• Click on “School”• Select your school• Select topic “Attendance”• Select report “Absent 11 days by Ethnicity”
Protocol 2: Data Analysis
In collaboration with REA, SPI, Funded Programs and Leadership Development 43
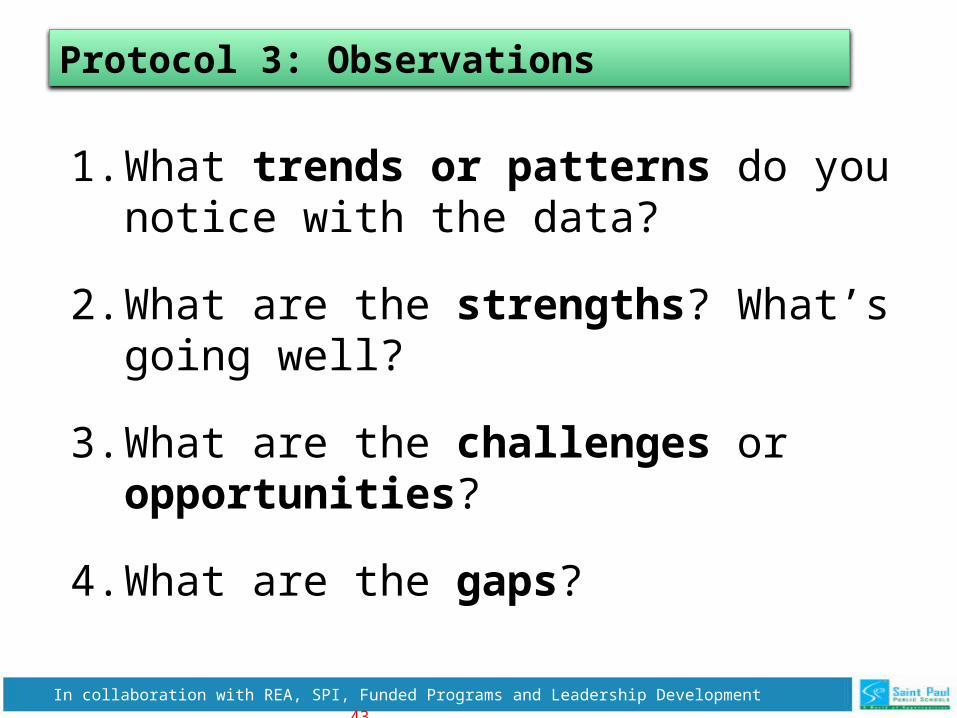
1. What trends or patterns do you notice with the data?
2. What are the strengths? What’s going well?
3. What are the challenges or opportunities?
4. What are the gaps?
Protocol 3: Observations
In collaboration with REA, SPI, Funded Programs and Leadership Development 44
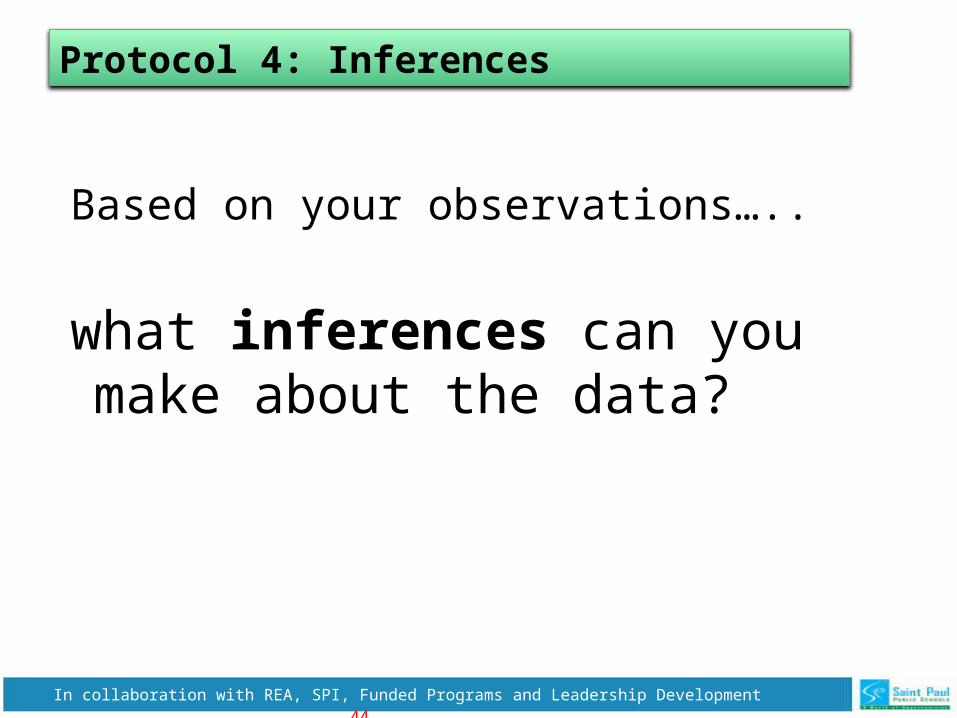
Based on your observations…..
what inferences can you make about the data?
Protocol 4: Inferences
In collaboration with REA, SPI, Funded Programs and Leadership Development 45
Discipline Data:Suspension
In collaboration with REA, SPI, Funded Programs and Leadership Development 46
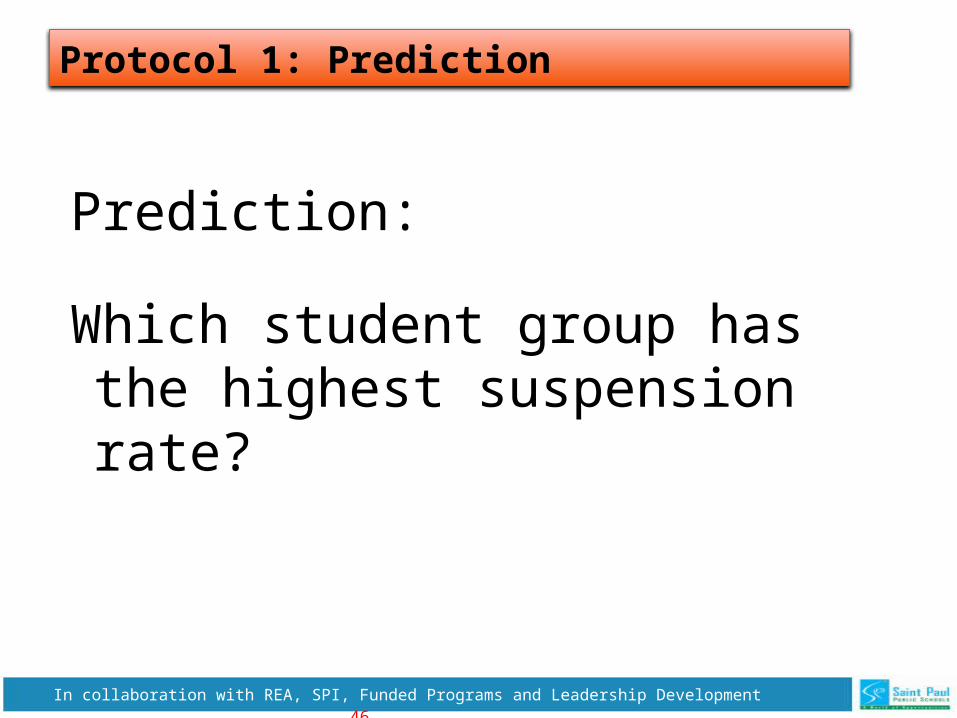
Prediction:
Which student group has the highest suspension rate?
Protocol 1: Prediction

In collaboration with REA, SPI, Funded Programs and Leadership Development 47
Identify suspension rate by student group.
http://datacenter.spps.org/• Click on “School”• Select your school• Select topic “Discipline”• Select report “Suspension by Ethnicity”
Protocol 2: Data Analysis
In collaboration with REA, SPI, Funded Programs and Leadership Development 48
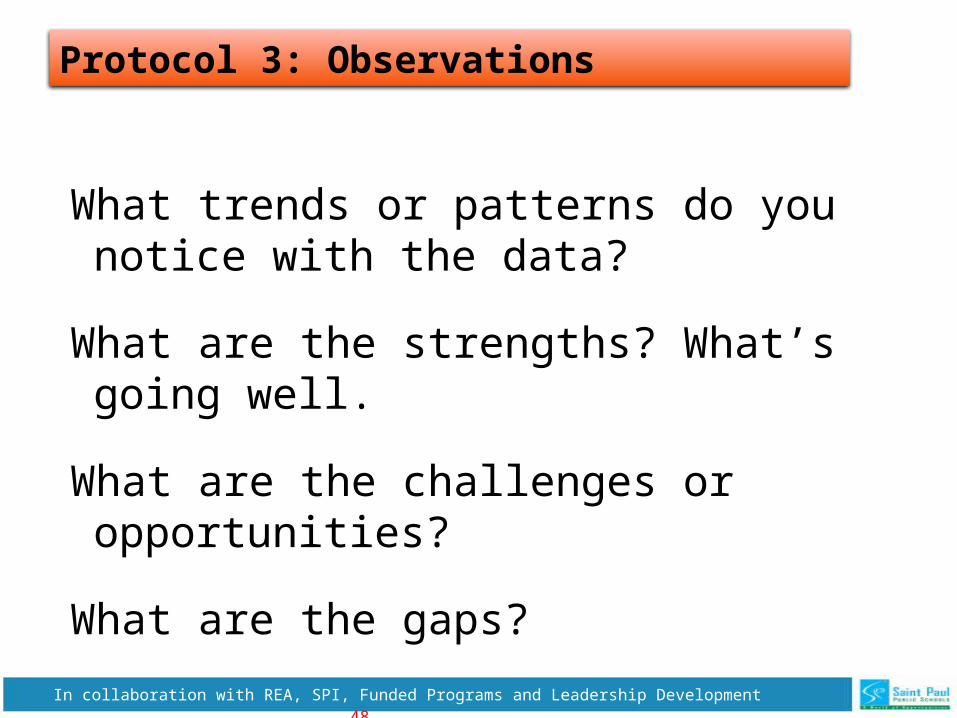
What trends or patterns do you notice with the data?
What are the strengths? What’s going well.
What are the challenges or opportunities?
What are the gaps?
Protocol 3: Observations
In collaboration with REA, SPI, Funded Programs and Leadership Development 49
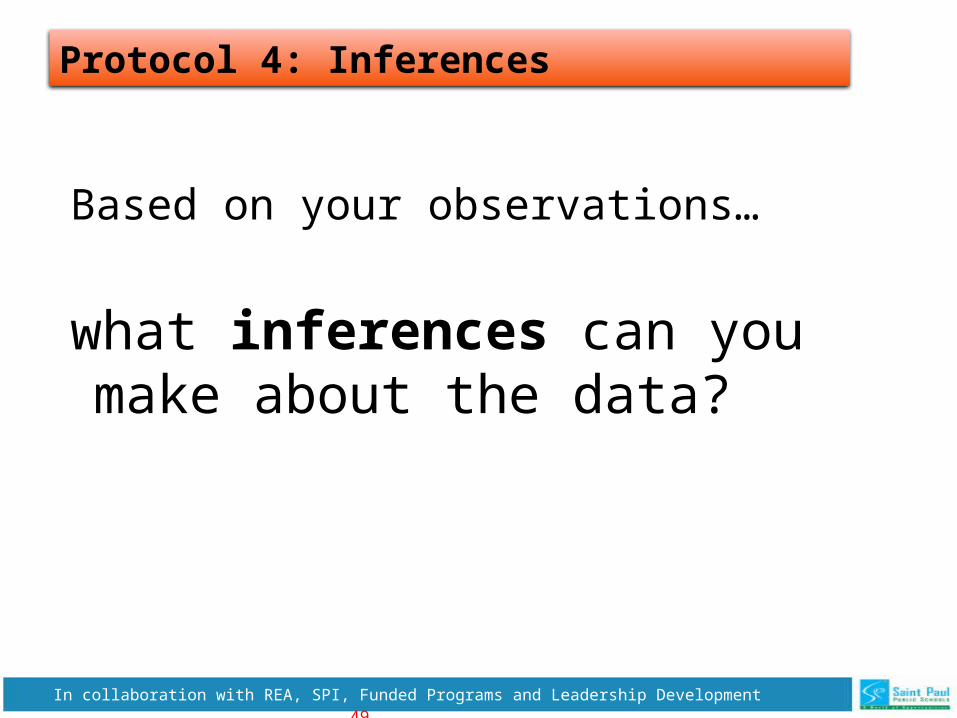
Based on your observations…
what inferences can you make about the data?
Protocol 4: Inferences
In collaboration with REA, SPI, Funded Programs and Leadership Development 50
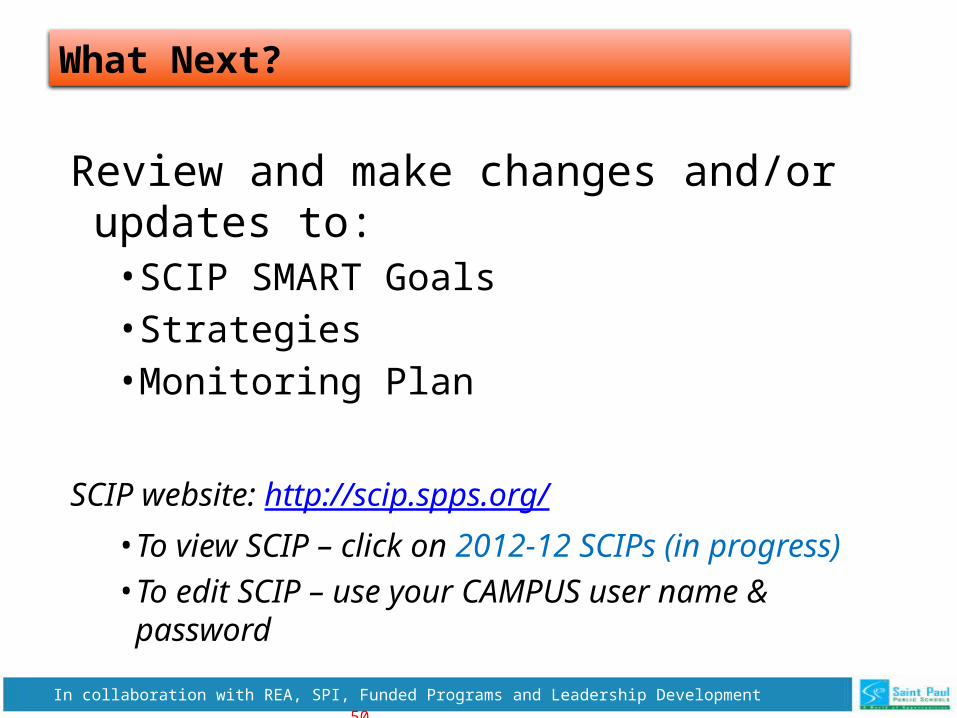
Review and make changes and/or updates to:
• SCIP SMART Goals• Strategies• Monitoring Plan
SCIP website: http://scip.spps.org/• To view SCIP – click on 2012-12 SCIPs (in progress)• To edit SCIP – use your CAMPUS user name &
password
What Next?
In collaboration with REA, SPI, Funded Programs and Leadership Development 51
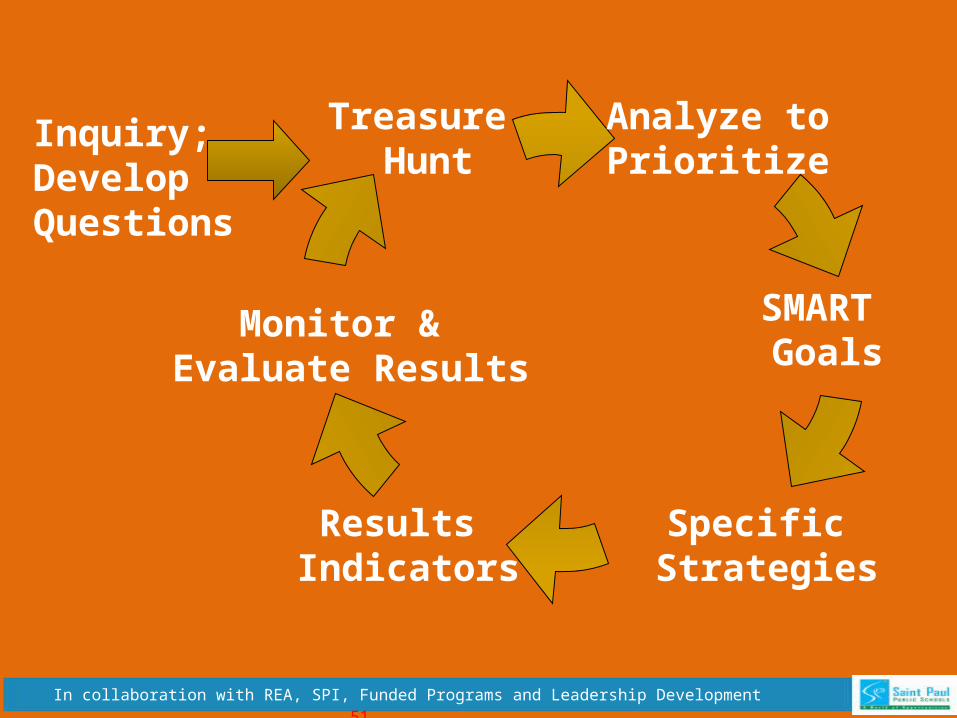
Analyze toPrioritize
Monitor & Evaluate Results
Treasure Hunt
SMART Goals
Specific Strategies
Results Indicators
Inquiry;Develop Questions
In collaboration with REA, SPI, Funded Programs and Leadership Development 52
Strategies,
Results Indicators &
Setting up for Success
In collaboration with REA, SPI, Funded Programs and Leadership Development 53
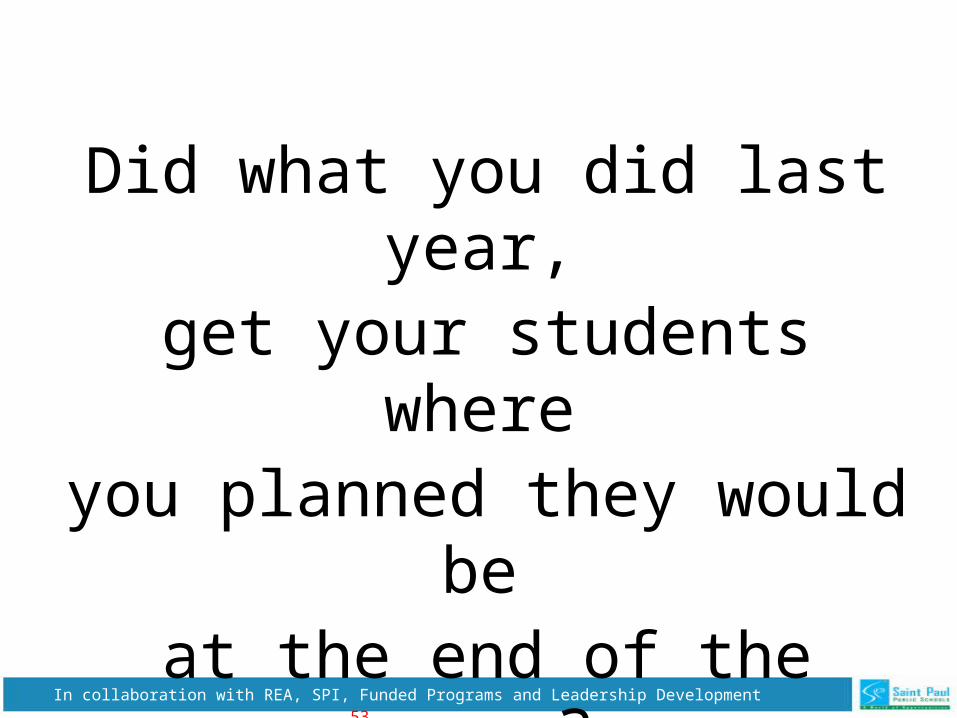
Did what you did last year, get your students where
you planned they would be at the end of the year?
In collaboration with REA, SPI, Funded Programs and Leadership Development 54
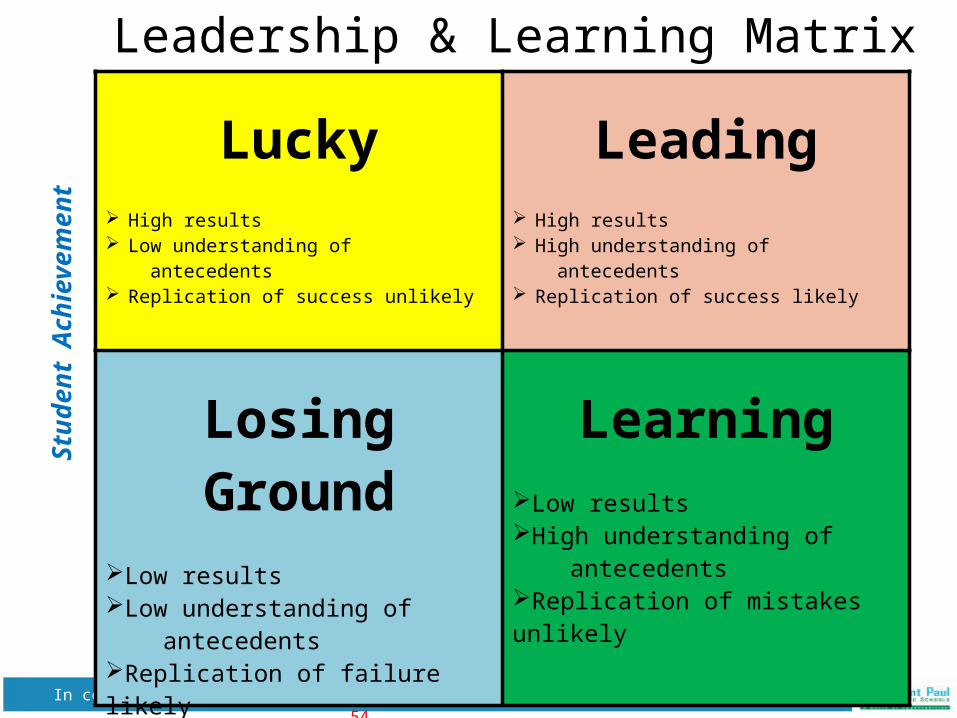
Leadership & Learning Matrix
Leadership/Teacher Practices
Stu
den
t A
ch
iev
em
en
t
Lucky High results Low understanding of antecedents Replication of success unlikely
Leading High results High understanding of antecedents Replication of success likely
Losing Ground
Low resultsLow understanding of antecedentsReplication of failure likely
LearningLow resultsHigh understanding of antecedentsReplication of mistakes unlikely
In collaboration with REA, SPI, Funded Programs and Leadership Development 55
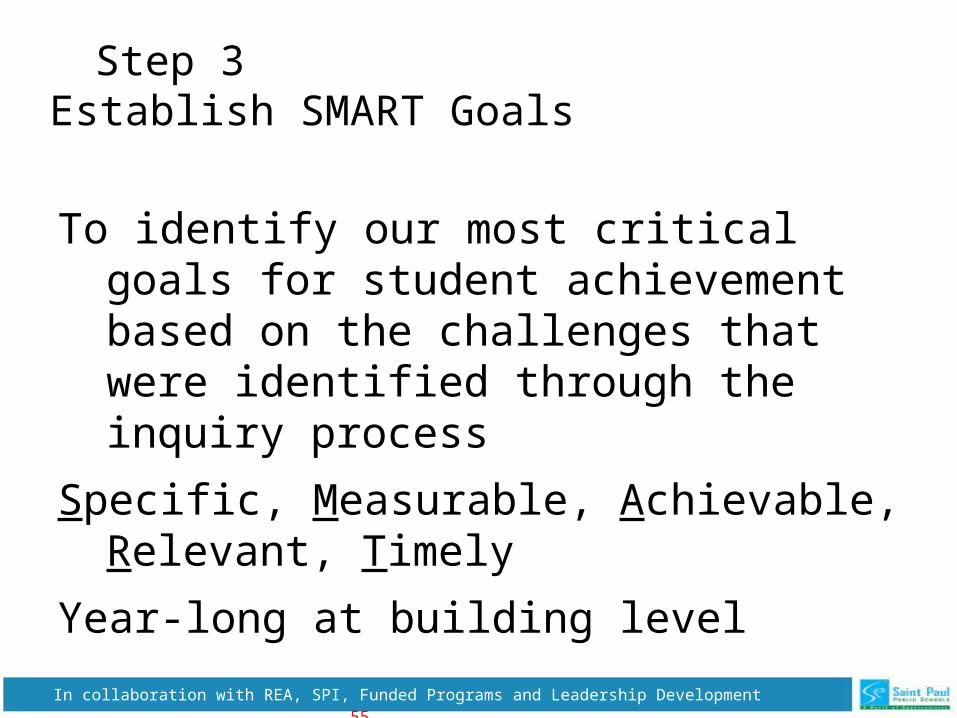
Step 3Establish SMART Goals
To identify our most critical goals for student achievement based on the challenges that were identified through the inquiry process
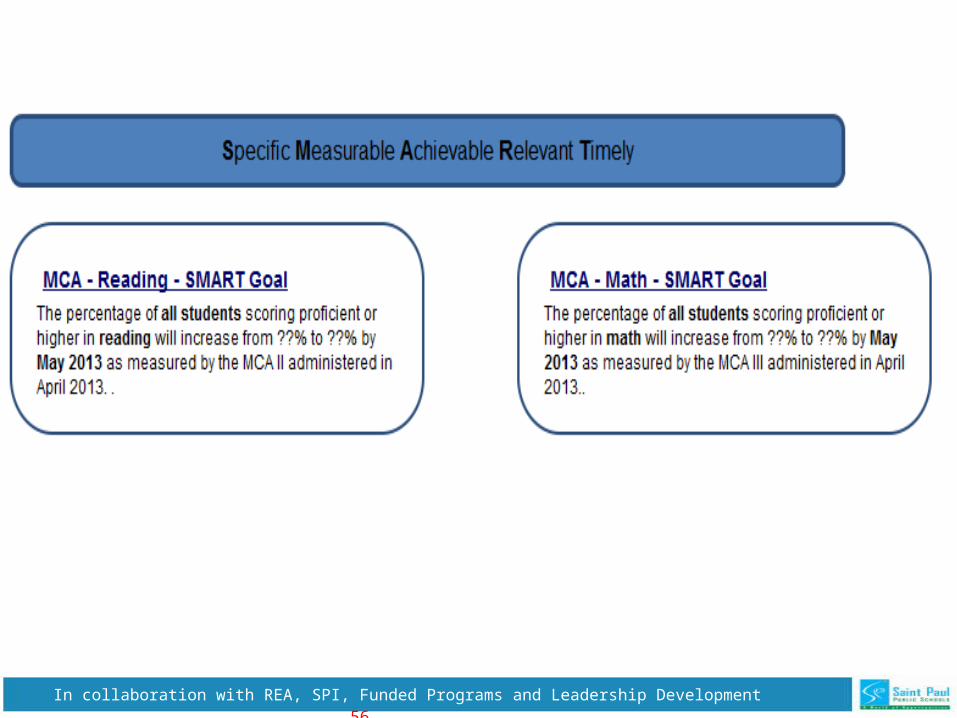
Specific, Measurable, Achievable, Relevant, Timely
Year-long at building level
In collaboration with REA, SPI, Funded Programs and Leadership Development 56
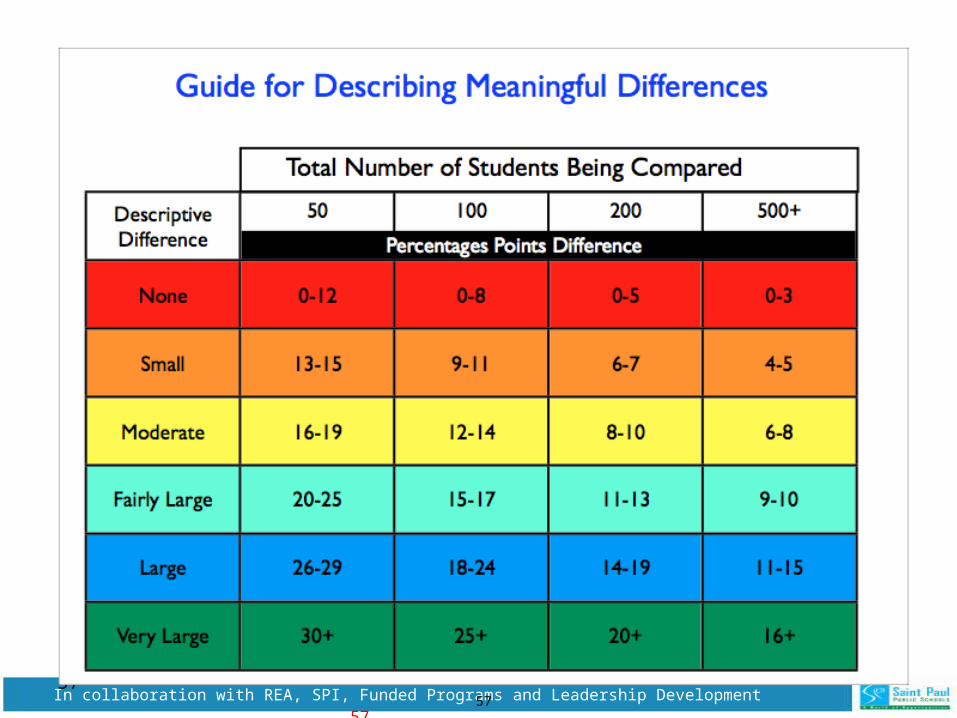
In collaboration with REA, SPI, Funded Programs and Leadership Development 57
5757
In collaboration with REA, SPI, Funded Programs and Leadership Development 58
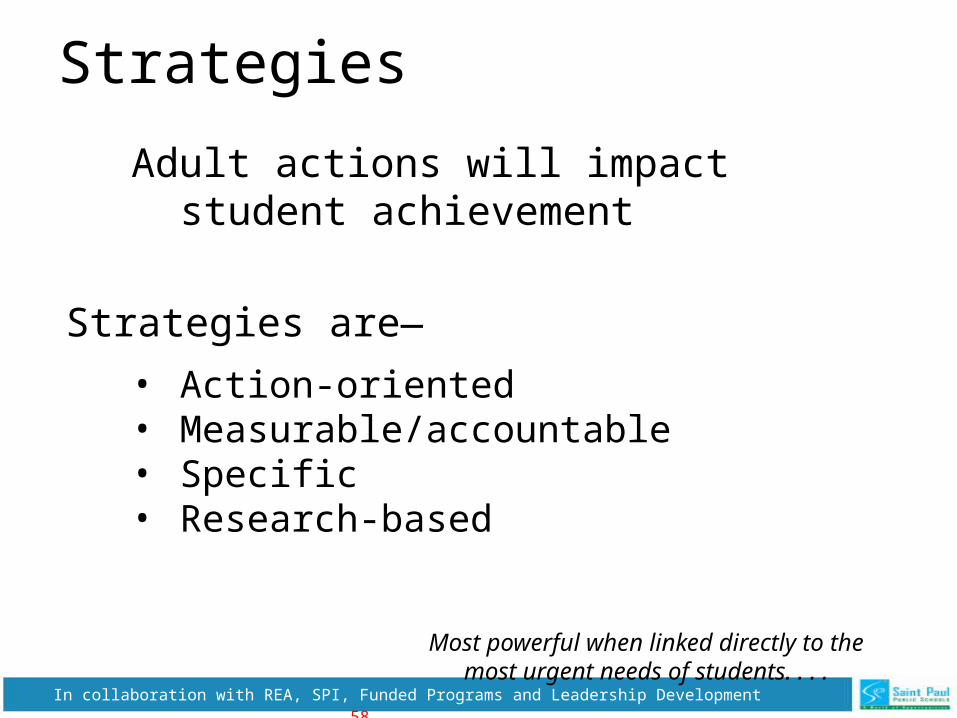
Strategies
Adult actions will impact student achievement
Strategies are—
• Action-oriented• Measurable/accountable• Specific• Research-based
Most powerful when linked directly to the most urgent needs of students. . . .
In collaboration with REA, SPI, Funded Programs and Leadership Development 59
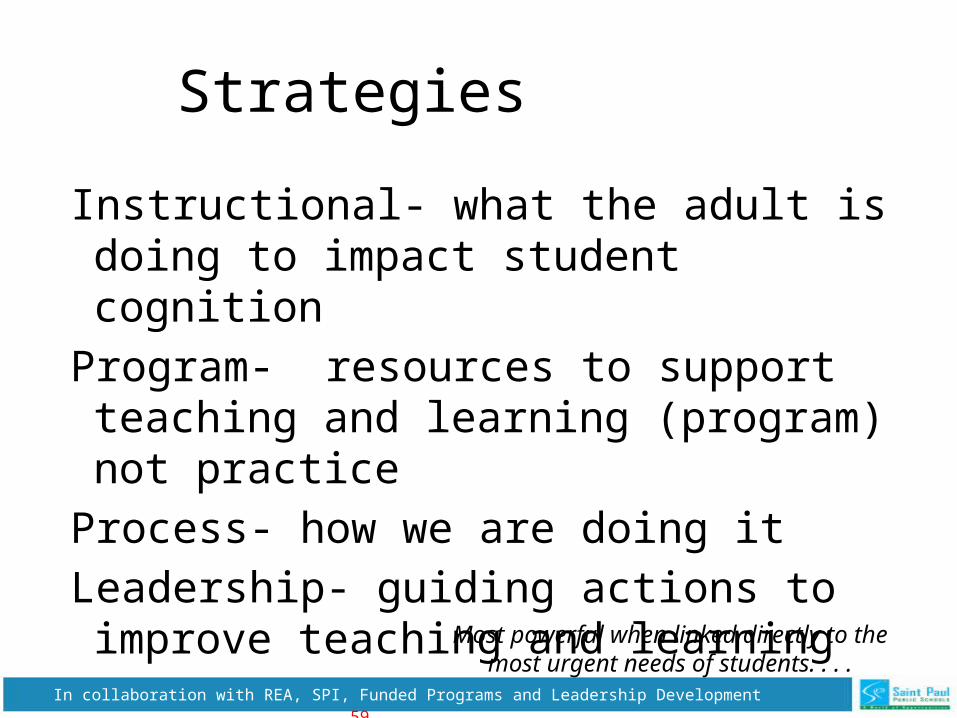
Strategies
Instructional- what the adult is doing to impact student cognition
Program- resources to support teaching and learning (program) not practice
Process- how we are doing it
Leadership- guiding actions to improve teaching and learning
Most powerful when linked directly to the most urgent needs of students. . . .
In collaboration with REA, SPI, Funded Programs and Leadership Development 60
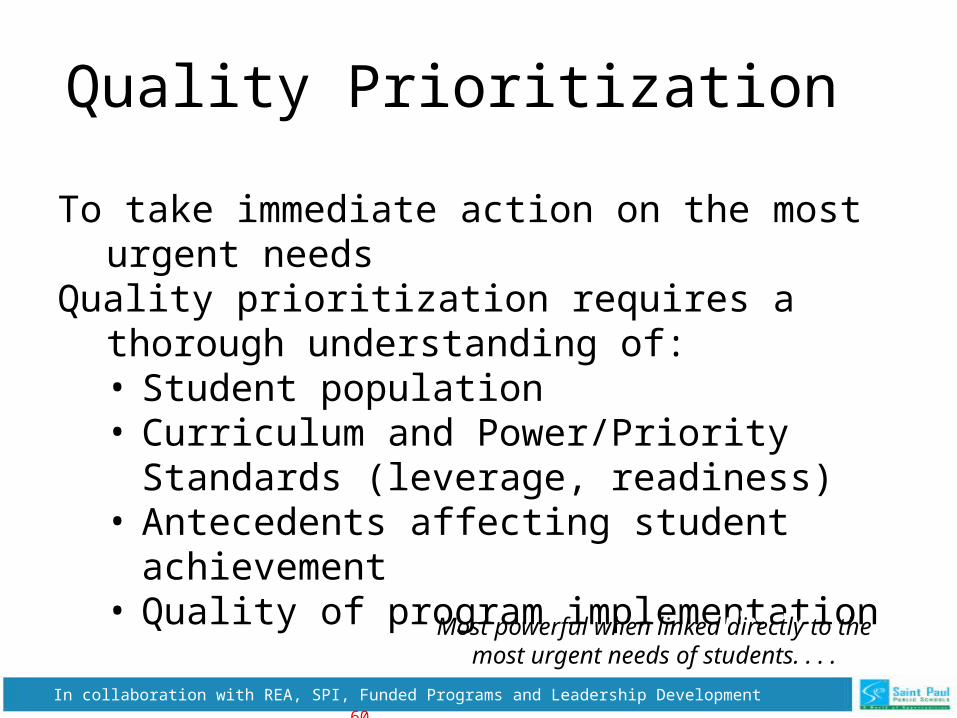
Quality Prioritization
To take immediate action on the most urgent needsQuality prioritization requires a thorough
understanding of:• Student population• Curriculum and Power/Priority Standards
(leverage, readiness)• Antecedents affecting student achievement• Quality of program implementation
White, 2005Most powerful when linked directly to the most urgent needs of students. . . .
In collaboration with REA, SPI, Funded Programs and Leadership Development 61
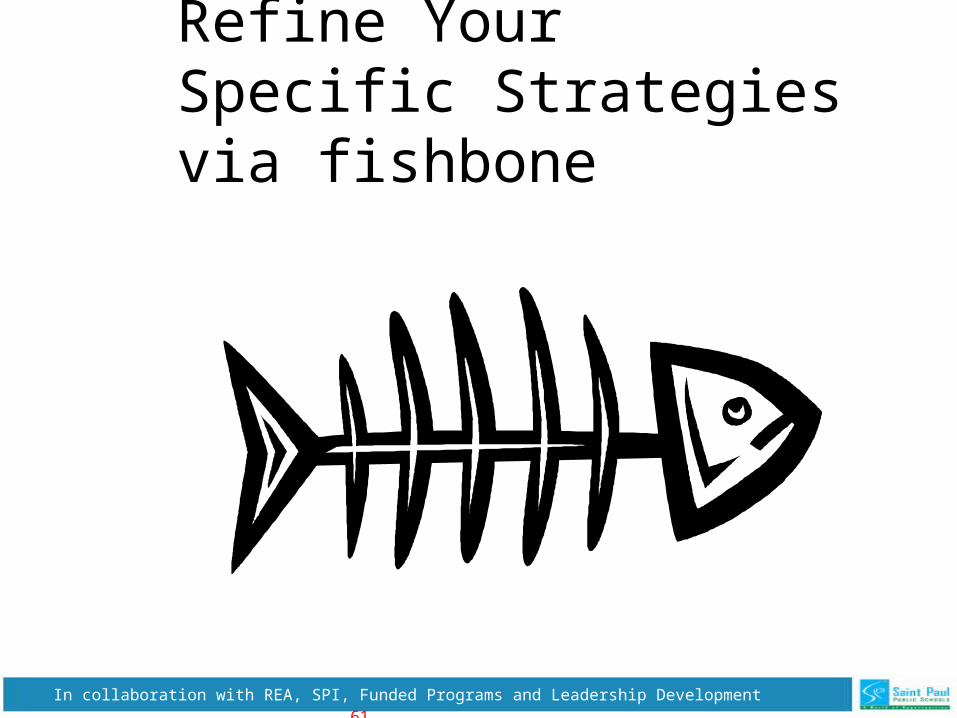
Refine Your Specific Strategies via fishbone
In collaboration with REA, SPI, Funded Programs and Leadership Development 62
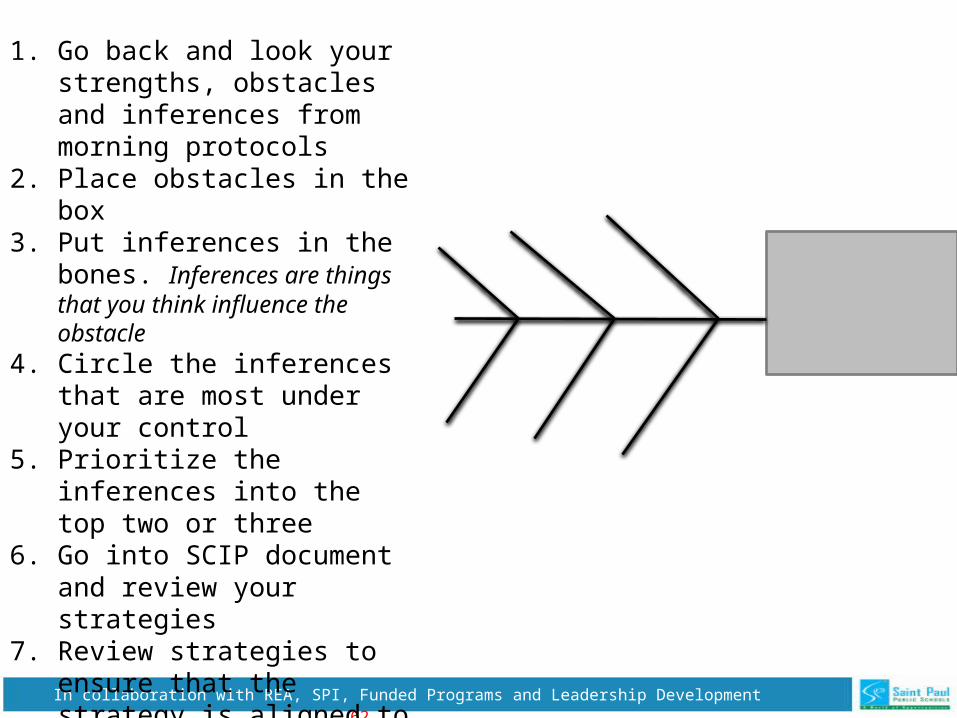
1. Go back and look your strengths, obstacles and inferences from morning protocols
2. Place obstacles in the box3. Put inferences in the bones.
Inferences are things that you think influence the obstacle
4. Circle the inferences that are most under your control
5. Prioritize the inferences into the top two or three
6. Go into SCIP document and review your strategies
7. Review strategies to ensure that the strategy is aligned to the prioritized inferences (causes)
8. Refine if needed
In collaboration with REA, SPI, Funded Programs and Leadership Development 63
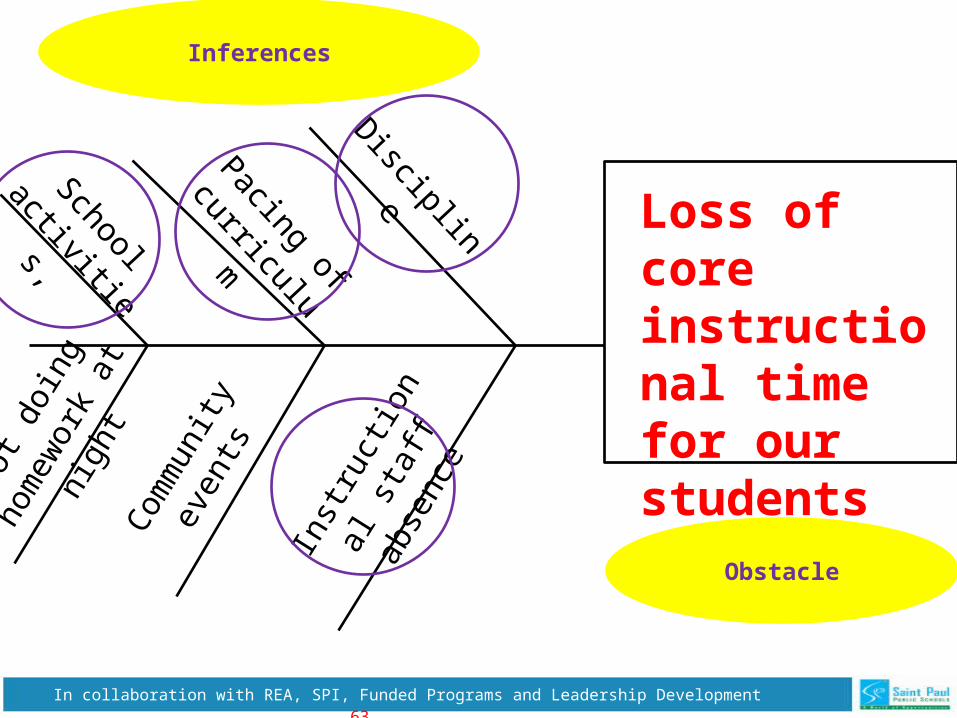
Loss of core instructional time for our students of colorObstacle
Discipline
Pacing of
curriculum
School
activities,
Com
mun
ity
even
ts
Inst
ruct
iona
l
staf
f abs
ence
Not
doi
ng
hom
ewor
k at
ni
ght
Inferences
In collaboration with REA, SPI, Funded Programs and Leadership Development 64
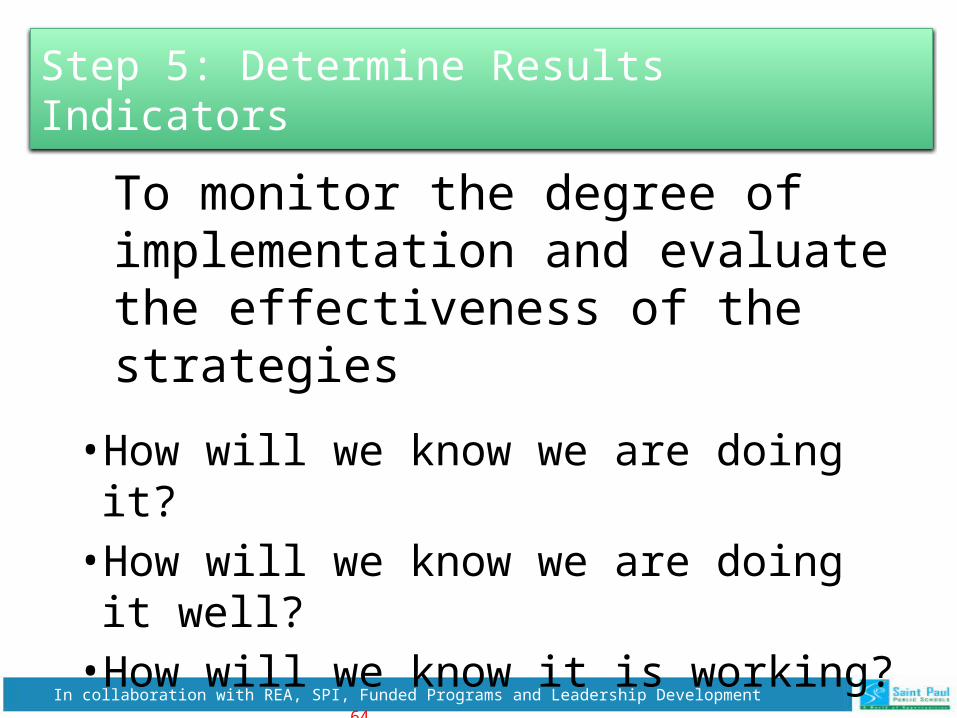
Step 5: Determine Results Indicators
• How will we know we are doing it?• How will we know we are doing it well?• How will we know it is working?
To monitor the degree of implementation and evaluate the effectiveness of the strategies
In collaboration with REA, SPI, Funded Programs and Leadership Development 65
Results Indicators
Considerations
• Serve as an interim measurement
• Used to determine effective implementation of a strategy
• Used to determine if strategy is having the desired impact
• Help to determine midcourse corrections
In collaboration with REA, SPI, Funded Programs and Leadership Development 66
In collaboration with REA, SPI, Funded Programs and Leadership Development 67
Step 6Monitor and Evaluate Results
To engage in a continuous improvement cycle that—
– Identifies midcourse corrections where needed
– Adjusts strategies to assure fidelity of implementation
In collaboration with REA, SPI, Funded Programs and Leadership Development 68
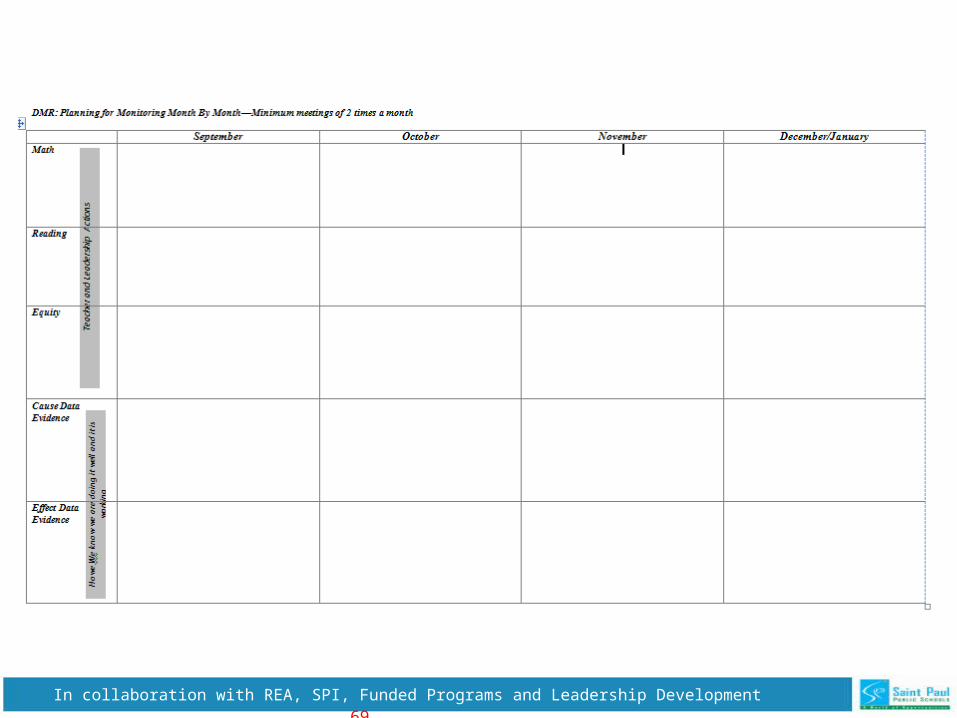
Develop Your Monitoring Plan• This is what needs to happen via the BLT monthly meetings
• Review your work from developing questions to determining results indicators then determine how you will monitor the strategies. When you create your monitoring plan consider:
– Teacher or administrator teams– Monitoring cycles– Goals– Strategies– Impact on student and adult behavior– Ability to make midcourse corrections
In collaboration with REA, SPI, Funded Programs and Leadership Development 69