Embed Size (px)
Citation preview
p 1
Profiling and Identification of Hop-Derived Bitter Compounds
in Beer Using LC-MS/MS
André Schreiber SCIEX, Canada
Beer is one of the world's most widely consumed beverage (after
tea and water) and probably the oldest alcoholic beverage.1 Beer
has attracted consumers over centuries due to its refreshing
character, attractive aroma, and typical bitter taste.
The production of beer is called brewing, which involves the
fermentation of starches, mainly derived from cereal grains (most
commonly malted barley, although wheat, corn, and rice are
widely used). Most beer is flavored with hops, which add
bitterness and act as a natural preservative, though other
flavorings such as herbs or fruit may occasionally be included.2
Aroma-active volatiles as well as nonvolatile bitter compounds of
beers have been thoroughly investigated in recent decades.
The typical hop-derived beer bitterness is caused by adding
cones, pellets, or extracts of hop during wort boiling. A few
isomerization processes have been identified to be of major
importance for bitter taste development in the final beer product.
The so-called isoxanthohumol (Figure 1), identified as a bitter
compound in beer, was found to be generated from the hop-
derived xanthohumol, during wort boiling. Moreover, trans- and
cis-iso-α-acids have been identified as the major bitter
contributors in beer and were demonstrated to be generated
upon a rearrangement reaction of their hop-derived precursors,
the α-acids. Following the α-acids, the second major constituents
of hop are the β-acids (Figure 1), but there are almost no data
available on the direct contribution of these compounds to beer
bitterness or on their role in the generation of bitter-tasting
conversion products during wort boiling.3, 4
General Method for Beer Profiling
Here an LC-MS/MS based method is presented to identify hop-
derived bitter compounds in beer.
• High resolution-accurate mass MS and MS/MS data were
collected using the SCIEX X500R QTOF system.
• MS and MS/MS information were collected in a single
injection using information dependent acquisition (IDA) for
confident compound identification.
• Targeted and non-targeted data processing are demonstrated
in workflows within the SCIEX OS and MarkerView™
software.
• Principle component analysis in MarkerViewTM software
allows for classification of sample groups and profiling based
on target or unknown sample constituents.
• Compound Identification tools within the SCIEX OS software
include FormulaFinder algorithm and ChemSpider database.
These can be used to tentatively identify candidate structures
for non-targeted features.
Figure 1. Hop-Derived Bitter Compounds and Their Isomerization Processes During the Wort Boiling.
Xanthohumol Isoxanthohumol
-acids (such as cohumulone and humulone) trans- and cis-iso--acids
(such as isocohumulone and isohumulone)
-acids (such as colupulone)
CH3CH3
OH
O
CH3
O
OH
OH
CH3CH3
OH
O
CH3
O
O
OH
OO
CH3
CH3
OH OH
O
CH3 CH3
H
CH3
CH3
OO
CH3
CH3
OH OH
O
CH3 CH3
H
CH3
CH3
OO
CH3
CH3
OH OH
O
CH3 CH3
H
CH3
CH3
OO
CH3
CH3
OH OH
O
CH3 CH3
H
CH3
CH3
OH
CH3
OH
OH
O
CH3
CH3
O
CH3
CH3
CH3
OH
OH
OH
O
CH3
CH3
O
CH3
CH3
CH3
CH3
OH OCH3
CH3
OH O
CH3
CH3
CH3
CH3
CH3
CH3
wort-boiling
p 2
Methods
Sample Preparation: Beer samples were purchased from the
Liquor Control Board of Ontario (LCBO). Samples were
degasses and then diluted 2x with water. 5 µL of sample was
injected.
Chromatography: Separation was performed using an
ExionLC™ AD system, with a Phenomenex Luna Omega 1.6 µm
Polar C18 (50 x 2.1 mm). A simple gradient was used as
described in Table 1, at a flow of 0.5 mL/mim.
Mass Spectrometry: The SCIEX X500R QTOF system with
Turbo V™ source and Electrospray Ionization (ESI) was used in
positive polarity. Ion source temperature was set to 450ºC and IS
voltage was set to 5500 V. Mass calibration was achieved using
the integrated calibrant delivery system (CDS) with the
TwinSprayer probe (dual ESI needle).
High resolution data were acquired using an information
dependent acquisition (IDA) method consisting of a TOF-MS
survey (100-1000 Da for 200 msec) and up to 10 dependent
MS/MS scans (50-1000 Da for 50 msec). Declustering Potential
(DP) was set to 80 V and MS/MS fragmentation was achieved
using a Collision Energy (CE) of 35 V with a Collision Energy
Spread (CES) of ±15 V.
Dynamic background subtraction (DBS) was activated to achieve
the most complete MS/MS coverage. No inclusion list was used
which allowed non-target identification without the need for a
second injection to acquire MS/MS data. All data were acquired
and processed using SCIEX OS software version 1.0
Data Processing: MarkerView™ Software 1.3 was used for
statistical processing using Principal Components Analysis
(PCA).
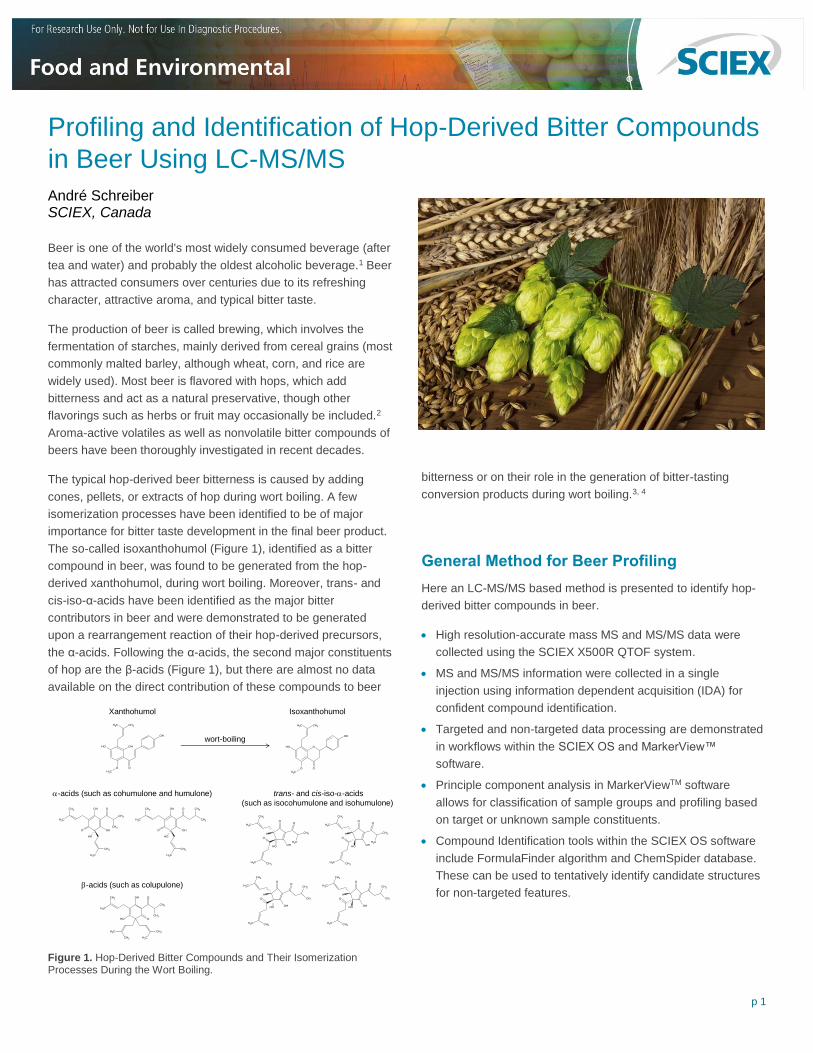
Figure 2. Example Resolution Data for Isoxanthohumol. Resolution of 30000 or greater in both MS and MS/MS modes is achieved due to the N-optics design of the X500R QTOF system.
X500R Performance Characteristics and Data Acquisition Workflows
The X500R QTOF system utilizes N-optics design to maximize
resolution while maintaining benchtop design and a minimized
footprint. The resolving power increases with mass range
providing ~30000 to 40000 resolution for the typical molecular
weight range of ingredients and potential contaminants in beer
(Figure 2).
The X500R QTOF system achieves stable mass accuracy of
less than 2 ppm by using a heated TOF configuration, with 6
heater drones throughout the TOF path and by using the
dynamic background calibration software algorithm. In addition,
both dynamic transmission control and dynamic background
calibration are used for further provide long term mass accuracy
stability.
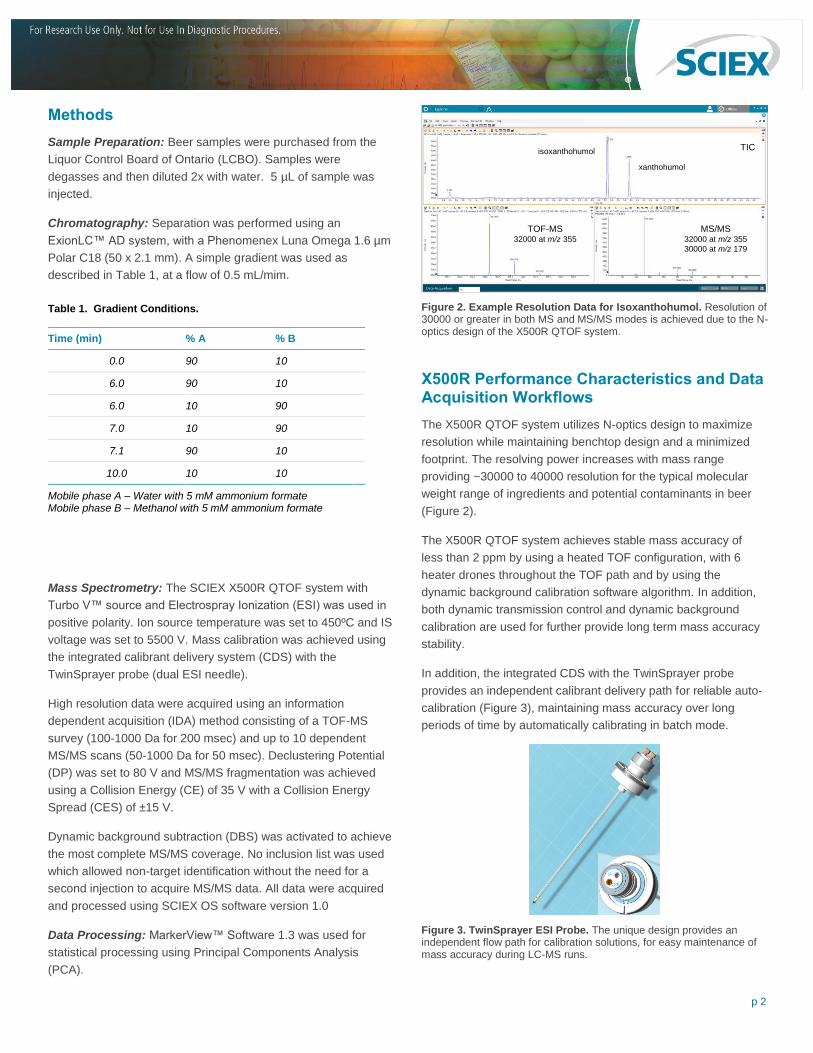
In addition, the integrated CDS with the TwinSprayer probe
provides an independent calibrant delivery path for reliable auto-
calibration (Figure 3), maintaining mass accuracy over long
periods of time by automatically calibrating in batch mode.
Figure 3. TwinSprayer ESI Probe. The unique design provides an independent flow path for calibration solutions, for easy maintenance of mass accuracy during LC-MS runs.
TOF-MS32000 at m/z 355
MS/MS32000 at m/z 355
30000 at m/z 179
isoxanthohumol
xanthohumol
TIC
Table 1. Gradient Conditions.
Time (min) % A % B
0.0 90 10
6.0 90 10
6.0 10 90
7.0 10 90
7.1 90 10
10.0 10 10
Mobile phase A – Water with 5 mM ammonium formate Mobile phase B – Methanol with 5 mM ammonium formate
p 3
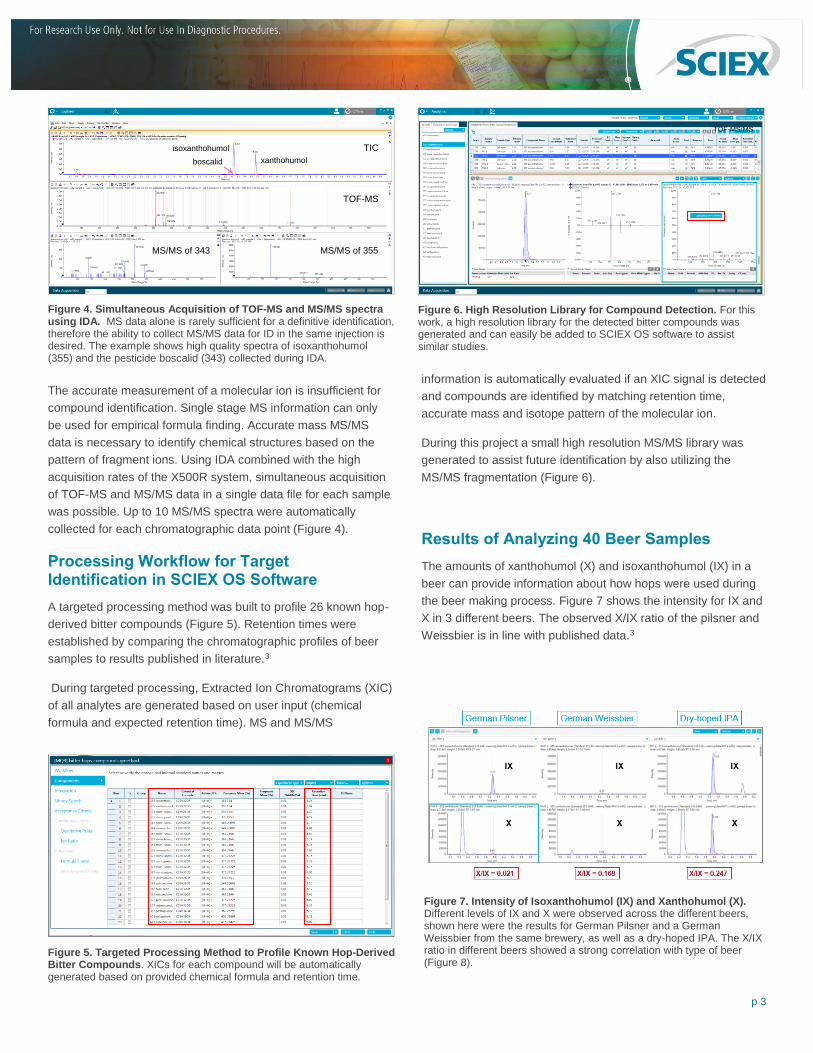
The accurate measurement of a molecular ion is insufficient for
compound identification. Single stage MS information can only
be used for empirical formula finding. Accurate mass MS/MS
data is necessary to identify chemical structures based on the
pattern of fragment ions. Using IDA combined with the high
acquisition rates of the X500R system, simultaneous acquisition
of TOF-MS and MS/MS data in a single data file for each sample
was possible. Up to 10 MS/MS spectra were automatically
collected for each chromatographic data point (Figure 4).
Processing Workflow for Target Identification in SCIEX OS Software
A targeted processing method was built to profile 26 known hop-
derived bitter compounds (Figure 5). Retention times were
established by comparing the chromatographic profiles of beer
samples to results published in literature.3
During targeted processing, Extracted Ion Chromatograms (XIC)
of all analytes are generated based on user input (chemical
formula and expected retention time). MS and MS/MS
information is automatically evaluated if an XIC signal is detected
and compounds are identified by matching retention time,
accurate mass and isotope pattern of the molecular ion.
During this project a small high resolution MS/MS library was
generated to assist future identification by also utilizing the
MS/MS fragmentation (Figure 6).
Results of Analyzing 40 Beer Samples
The amounts of xanthohumol (X) and isoxanthohumol (IX) in a
beer can provide information about how hops were used during
the beer making process. Figure 7 shows the intensity for IX and
X in 3 different beers. The observed X/IX ratio of the pilsner and
Weissbier is in line with published data.3
Figure 4. Simultaneous Acquisition of TOF-MS and MS/MS spectra using IDA. MS data alone is rarely sufficient for a definitive identification, therefore the ability to collect MS/MS data for ID in the same injection is desired. The example shows high quality spectra of isoxanthohumol (355) and the pesticide boscalid (343) collected during IDA.
Figure 7. Intensity of Isoxanthohumol (IX) and Xanthohumol (X). Different levels of IX and X were observed across the different beers, shown here were the results for German Pilsner and a German Weissbier from the same brewery, as well as a dry-hoped IPA. The X/IX ratio in different beers showed a strong correlation with type of beer (Figure 8).
Figure 5. Targeted Processing Method to Profile Known Hop-Derived Bitter Compounds. XICs for each compound will be automatically generated based on provided chemical formula and retention time.
Figure 6. High Resolution Library for Compound Detection. For this work, a high resolution library for the detected bitter compounds was generated and can easily be added to SCIEX OS software to assist similar studies.
TOF-MS
MS/MS of 355
isoxanthohumol
xanthohumol
TIC
boscalid
MS/MS of 343
TOF-MS/MS
p 4
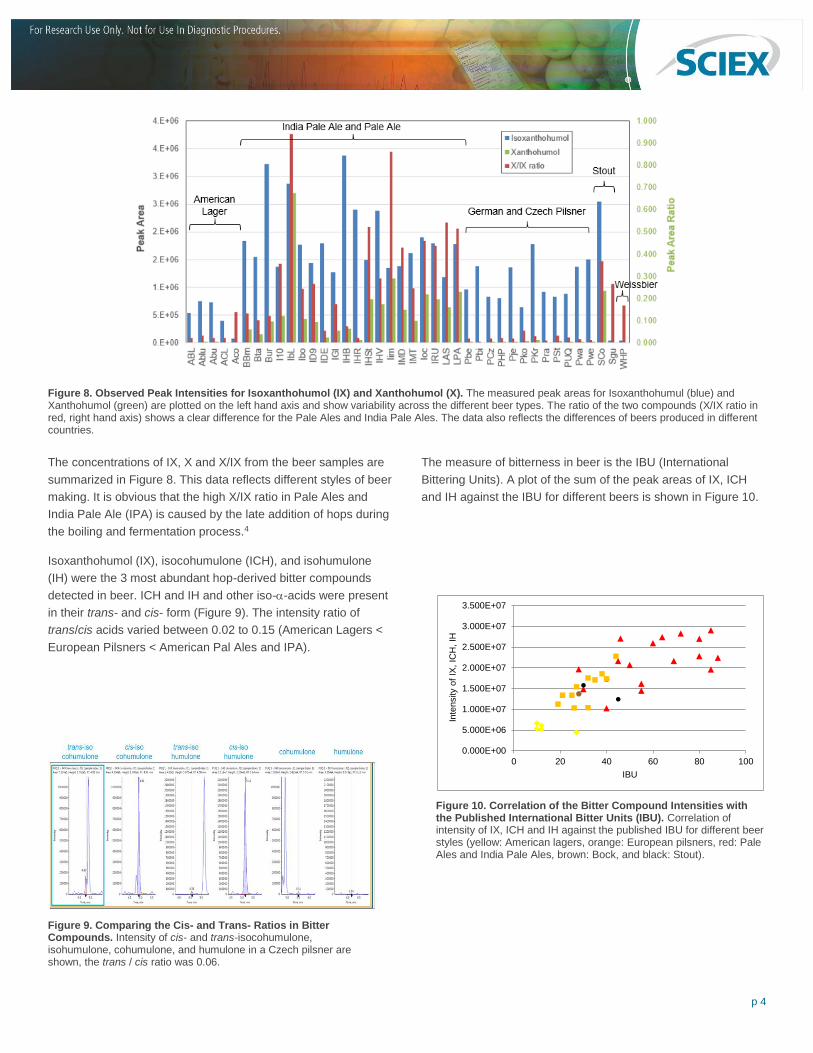
The concentrations of IX, X and X/IX from the beer samples are
summarized in Figure 8. This data reflects different styles of beer
making. It is obvious that the high X/IX ratio in Pale Ales and
India Pale Ale (IPA) is caused by the late addition of hops during
the boiling and fermentation process.4
Isoxanthohumol (IX), isocohumulone (ICH), and isohumulone
(IH) were the 3 most abundant hop-derived bitter compounds
detected in beer. ICH and IH and other iso--acids were present
in their trans- and cis- form (Figure 9). The intensity ratio of
trans/cis acids varied between 0.02 to 0.15 (American Lagers <
European Pilsners < American Pal Ales and IPA).
The measure of bitterness in beer is the IBU (International
Bittering Units). A plot of the sum of the peak areas of IX, ICH
and IH against the IBU for different beers is shown in Figure 10.
Figure 9. Comparing the Cis- and Trans- Ratios in Bitter Compounds. Intensity of cis- and trans-isocohumulone, isohumulone, cohumulone, and humulone in a Czech pilsner are shown, the trans / cis ratio was 0.06.
Figure 8. Observed Peak Intensities for Isoxanthohumol (IX) and Xanthohumol (X). The measured peak areas for Isoxanthohumul (blue) and Xanthohumol (green) are plotted on the left hand axis and show variability across the different beer types. The ratio of the two compounds (X/IX ratio in red, right hand axis) shows a clear difference for the Pale Ales and India Pale Ales. The data also reflects the differences of beers produced in different countries.
Figure 10. Correlation of the Bitter Compound Intensities with the Published International Bitter Units (IBU). Correlation of intensity of IX, ICH and IH against the published IBU for different beer styles (yellow: American lagers, orange: European pilsners, red: Pale Ales and India Pale Ales, brown: Bock, and black: Stout).
0.000E+00
5.000E+06
1.000E+07
1.500E+07
2.000E+07
2.500E+07
3.000E+07
3.500E+07
0 20 40 60 80 100
Inte
nsity
of
IX, IC
H,
IH
IBU

p 5
Beer Profiling using Statistical Data Analysis
Statistical data analysis, such as Principal Components Analysis
(PCA), can be used to profile and compare different beverage
samples. Figure 11 shows the PCA scores plot for 40 different
beers. Beers of similar style group together. The location of a
sample in the plot indicates a specific flavor or color (i.e. lighter
beer vs. a more hoppy/bitter beer). The PCA loadings plot
assists in finding characteristic markers (m/z-RT). Once these
markers are found, the corresponding chemical can be identified
using formula finding based on accurate mass MS and MS/MS
followed by ChemSpider searching and MS/MS elucidation.
The -acids lupulone and adlupulone were found in higher
concentrations in darker beers, such as stout and black IPA, as
the profile plot (bottom trace) in Figure 11 shows. Both
compounds were identified using the described automated
software tools in SCIEX OS software (Figure 12).
Summary
The SCIEX X500R QTOF system was used to analyze 40
different beer samples in positive polarity ESI using information
dependent acquisition of MS and MS/MS spectra. Samples were
processed using a targeted approach to profile 26 known hop-
derived bitter compounds in SCIEX OS software. Samples were
also processed using PCA in MarkerView™ software. This study
shows that LC-MS/MS is a valuable tool to study flavor and
aroma profile in food and beverage samples.
Figure 11. Profiling Differences Between Beer Samples. Principle Components Analysis (PCA) using MarkerView™ Software was performed to profile and map different beer styles. This Scores plot (Top) shows how the beer styles cluster together. The loading plot (not shown here) assisted to
find characteristic m/z-RT, selection of this feature can then be plotted across the different samples (bottom). The -acids lupulone and adlupulone are plotted here and were found to be in higher concentrations in the darker beers.
Figure 12. Feature Identification with SCIEX OS. Identification of lupulone and adlupulone in an Irish stout based on formula finding followed by ChemSpider searching and MS/MS elucidation
Darker beers Black IPA
Imperial IPA
Stout
Pilsner
Am. Light
Weissbier
Bock
Home made
IPA
Pale Ale
415.284 @ 6.1 min
lupulone & adlupulone

p 6
References
1. J. P. Arnold: ‘Origin and History of Beer and Brewing: From
Prehistoric Times to the Beginning of Brewing Science and
Technology’ Alumni Association of the Wahl-Henius Institute
(1911) Reprint Edition (2005) www.BeerBooks.com
2. R. Barth: ‘The Chemistry of Beer: The Science in the Suds’
Wiley (2013)
3. D. Intelmann, G. Haseleu, and Th. Hofmann: ‘LC-MS/MS
Quantitation of Hop-Derived Bitter Compounds in Beer
Using the ECHO Technique’ J. Agric. Food Chem. 57 (2009)
1172-1182
4. J. F. Stevens, A. W. Alan, M. L. Deinzer: ‘Quantitative
analysis of Xanthohumol and related prenylflavonoids in
hops and beer by liquid chromatography tandem mass
spectrometry’ J. Chrom. A 832 (1999) 97-107
AB Sciex is doing business as SCIEX.
© 2018 AB Sciex. For Research Use Only. Not for use in diagnostic procedures. The trademarks mentioned herein are the property of AB Sciex Pte. Ltd. or their respective owners. AB SCIEX™ is being used under license.
Document number: RUO-MKT-02-4481-B