Embed Size (px)
Citation preview

Institute of Cosmology andGravitation, University of Portsmouth
Inflation: a quantum laboratory oncosmological scales
Christopher Pattison
Supervisors:
Prof. David Wands
Dr. Vincent Vennin
Dr. Hooshyar Assadullahi
This thesis is submitted in partial fulfilment of
the requirements for the award of the degree of
Doctor of Philosophy of the University of Portsmouth.
March 2020

Abstract
This thesis is dedicated to studying cosmological inflation, which is a period of accel-
erated expansion in the very early Universe that is required to explain the observed
anisotropies in the cosmic microwave background. Inflation, when combined with
quantum mechanics, also provides the over-densities that grow into the structure of
the modern Universe. Understanding perturbations during this period of inflation is
important, and we study these perturbations in detail in this work.
We will assume that inflation is driven by a single scalar field, called the inflaton.
When the shape of the potential energy is flat, the inflaton can enter a phase of “ultra-
slow-roll inflation”. We study the stability of such a period of inflation, and find that
it can be stable and long-lived, although it has a dependence on the initial velocity of
the inflaton field. This is different to the slow-roll regime of inflation, which is always
stable, but has no dependence on the initial velocity.
In the second part of this thesis, we use the stochastic formalism for inflation
in order to take account of the non-perturbative backreaction of quantum fluctuations
during inflation. This formalism is an effective field theory for long wavelength parts
of quantum fields during inflation, and hence is only valid on large scales. We use this
formalism to study curvature fluctuations during inflation, and we derive full proba-
bility distributions of these fluctuations. This allows us to study the statistics of large
fluctuations that can lead to the formation of rare objects, such as primordial black
holes. In general, we find that when the quantum effects modelled by the stochastic
formalism are correctly accounted for, many more primordial black holes can be formed
than one would expect if these quantum effects were not taken into account.
We finish by summarising our results and discussing future research directions
that have opened up as a result of the work we have done. In particular, we mention
future applications of the formalisms we develop using the stochastic techniques for
inflation, and note that their applications can be broader than primordial black holes
and they can be used to, for example, study other rare objects.
i

Table of Contents
Abstract i
Declaration viii
Acknowledgements ix
Dedication x
Dissemination xi
1 Introduction 1
1.1 Standard model of cosmology 2
1.1.1 The FLRW Universe 2
1.1.2 Einstein equations 4
1.1.3 Composition of the Universe 11
1.1.4 Timeline of the Universe 14
1.2 Classical problems in the Hot Big Bang Model 19
1.2.1 Horizon problem 20
1.2.2 Flatness and monopole problems 22
1.3 Inflation 24
1.3.1 Solution to the Horizon Problem 25
1.3.2 Classical inflationary dynamics 27
1.3.3 Slow-roll inflation 30
1.3.4 Inflationary perturbations 34
1.4 Modern problems in cosmology 42
1.4.1 Inflationary constraints and model selection 43
ii

1.4.2 Dark energy 45
1.4.3 Dark matter 48
1.4.4 Origin of supermassive black holes 56
1.5 Primordial black holes 58
2 Attractive behaviour of ultra-slow-roll inflation 66
2.1 Introduction 67
2.2 Inflaton dynamics and definitions 69
2.2.1 Slow-roll inflation 70
2.2.2 Ultra-slow roll inflation 71
2.3 Stability analysis 73
2.3.1 Dynamical equation for the relative field acceleration 73
2.3.2 Slow-roll limit 74
2.3.3 Ultra-slow-roll limit 75
2.4 Examples 80
2.4.1 Starobinsky inflation 81
2.4.2 Cubic inflection point potential 82
2.5 Summary 92
3 Stochastic inflation 94
3.1 Deriving the Langevin equations 95
3.2 Requirements for the stochastic approach 100
3.3 Stochastic inflation beyond slow roll 103
3.3.1 Separate universes 104
3.3.2 Gauge corrections to the noise 109
3.3.3 Case study 1: slow roll 114
3.3.4 Case study 2: ultra-slow roll 116
3.3.5 Case study 3: Starobinsky model 118
3.4 The δN formalism 124
3.4.1 The classical-δN formalism 124
3.4.2 The stochastic-δN formalism 127
3.5 First passage time analysis 129
3.5.1 DBI inflation 130
3.5.2 Mean Number of e-folds 131
3.5.3 Number of e-folds variance 134
3.5.4 Power Spectrum 135
iii

4 Quantum diffusion during inflation and primordial black holes 138
4.1 Motivations 139
4.2 Probability distribution of curvature perturbations 141
4.2.1 Statistical moments of first passage times 141
4.2.2 The characteristic function approach 142
4.2.3 The heat equation approach 145
4.3 Expansion about the classical limit 146
4.3.1 The characteristic function approach 147
4.3.2 The heat equation approach 152
4.4 The stochastic limit 153
4.4.1 The characteristic function approach 154
4.4.2 The heat equation approach 157
4.5 Primordial black holes 160
4.5.1 Classical limit 161
4.5.2 Stochastic limit 162
4.5.3 Recipe for analysing a generic potential 165
4.5.4 Example 1: V ∝ 1 + φp 166
4.5.5 Example 2: running-mass inflation 170
4.6 Conclusions 173
5 Ultra-slow-roll inflation with quantum diffusion 175
5.1 Stochastic ultra-slow-roll inflation 176
5.2 Characteristic function formalism 180
5.2.1 First passage time analysis 180
5.2.2 Characteristic function 181
5.3 Classical limit 183
5.3.1 Leading order 183
5.3.2 Next-to-leading order 184
5.4 Late-time limit 186
5.5 Stochastic USR limit 188
5.5.1 Stochastic limit expansion 188
5.5.2 Implications for primordial black holes 190
5.6 Discussion 195
6 Conclusions 197
6.1 Summary 197
iv

6.2 Future work 200
Appendices 202
A FLRW Christoffel symbols and Einstein tensor 203
B Sasaki–Mukhanov equation 206
C First slow-roll correction in ultra-slow roll 211
D Elliptic theta functions 214
E Detailed analysis of the model V ∝ 1 + φp 217
E.1 Case p = 2 219
E.2 Case p > 2 220
E.2.1 Case p > 2 and φ0 > MPl 220
E.2.2 Case p > 2 and φ0 < MPl 220
E.3 Case 1 < p < 2 222
E.3.1 Case 1 < p < 2 and φ0/MPl < vp−22p
0 222
E.3.2 Case 1 < p < 2 and φ0/MPl > vp−22p
0 222
E.4 Case 0 < p < 1 223
E.4.1 Case 0 < p < 1 and φ0 < MPl 223
E.4.2 Case 0 < p < 1 and φ0 > MPl 223
E.5 Case p = 1 224
F Deriving the Fokker–Planck equation 226
F.1 Ultra-slow roll 226
F.2 Slow roll 228
F.3 Leading order classical characteristic function 229
F.3.1 Classical NLO solution 231
Bibliography 232
v

List of Figures
1.1 H0 tension over time 4
1.2 Different epochs in the history of the Universe 9
1.3 Composition of the Universe 11
1.4 History of the Universe 14
1.5 Planck 2018 CMB temperature map 17
1.6 Space-time conformal diagram with and without inflation 26
1.7 Planck 2018 inflationary constraints 44
1.8 Evidence for dark energy 46
1.9 Evidence for zero curvature and a cosmological constant 47
1.10 Galaxy rotation curve for NGC 6503 50
1.11 Mass distribution for the Bullet Cluster 51
1.12 Planck power spectrum 53
1.13 Constraints on properties of the axion 56
1.14 Event Horizon Telescope image of M87 black hole 57
1.15 Known black holes in the Universe 59
1.16 Mass fraction of the Universe contained in primordial black holes 62
2.1 Field acceleration parameter for the Starobinsky model of inflation 80
2.2 Field acceleration parameter for the cubic inflection point potential with
φ0 = 10MPl 84
2.3 Field acceleration and first slow-roll parameter for the cubic inflection
point model with φ0 = 0.1MPl 87
2.4 Field acceleration for the cubic inflection point model for the parameter
range −φ0 < φ < φ30/M
2Pl 89
2.5 Existence of and basins of attraction for slow roll and ultra-slow roll-
regimes in the cubic inflection point model for φ0 = 0.1MPl 90
vi

2.6 Existence of and basins of attraction for slow roll and ultra-slow-roll
regimes in the cubic inflection point model for φ0 = 10MPl 91
3.1 Gauge correction to the field perturbation in the uniform-N gauge in
the Starobinsky model of inflation 119
3.2 Sketch of stochastic dynamics in an arbitrary potential 127
4.1 Probability distributions of the number of e-folds N realised in a
quadratic potential 144
4.2 Probability distribution of N in a quadratic potential with approxima-
tions at NLO and NNLO 151
4.3 Sketch of the “quantum well” for an exactly flat potential 153
4.4 Probability distribution of the number of e-folds N in a flat potential 155
4.5 Probability distribution for N in a flat potential, compared to different
approximation schemes 157
4.6 Mass fraction of PBHs in a flat potential 162
4.7 Power spectrum of curvature perturbations in a quadratic potential 168
4.8 The potential for running-mass inflation 169
5.1 Sketch of the ultra-slow-roll scenario 179
5.2 Probability distribution of N in the late time, ultra-slow roll limit 187
5.3 The mean number of e-folds in the ultra-slow-roll limit 191
5.4 Probability distribution of N in ultra-slow roll 193
5.5 Mass fraction of PBHs formed in an ultra-slow-roll regime 194
vii

Declaration
Whilst registered as a candidate for the above degree, I have not been registered for
any other research award. The results and conclusions embodied in this thesis are the
work of the named candidate and have not been submitted for any other academic
award.
Chapter 1 is an introductory chapter, written by myself and drawn from
many references, as cited where appropriate. Chapter 2 is primarily based on JCAP
1808(2018)048, while Chapter 3 provides a combination of further introductory ma-
terial and sections based on JCAP 1907(2019)031. Chapter 3 also contains some
new analytical results which are not yet published. Chapter 4 is based on JCAP
1710(2017)046, and Chapter 5 was based on work in progress which has since been
expanded and submitted for publication.
I am the first author of each publication that this thesis is based on, and in each
of these I performed all of the analytic and numerical calculations, either originally or
as checks for my co-authors.
Word count: 50,001 words.
Ethical review code: 5D3F-6FD6-E158-5231-4FF5-FD1B-A724-6CF3
viii

Acknowledgements
First of all, I would like to thank my incredible PhD supervisors: Prof David Wands,
Dr Vincent Vennin and Dr Hooshyar Assadullahi, for your remarkable wealth of knowl-
edge, advice, and humour that you have shared with me throughout this time. I thank
you for showing me the beauty of early universe physics, and for teaching me with
kindness and patience, in a relaxed environment. You have inspired me to be a better
researcher, and I could not have hoped for a better team of teachers and collaborators.
I would like to thank my examiners Ed Copeland and Roy Maartens for the care-
ful consideration they gave to this thesis, and for the enjoyable and fruitful discussions
we had about this work.
It is also a pleasure to thank all of my PhD colleagues for keeping me sane and
helping me to achieve the work in this thesis. In particular, I would like to thank
Natalie, Bill, and Mark, for your continued support and encouragement throughout
my PhD. I would also like to thank everyone that I shared an office and department
with throughout my time in Portsmouth, including my close friends Michael, Mike,
Laura, Tays, Manu, The Sams, Jacob, and Gui - thank you for making every day fun,
and inspiring me throughout my PhD. I truly hope you all achieve your dreams.
Finally, and most importantly, I would like to thank Hannah, my parents Jan
and Andy, and my sister Eve. Without your love and support I would not have been
able to make it through the last three years, and I hope you know how much I love
and appreciate you all. I also hope you are proud of the work you have helped me to
produce here (even if this is the only page you read of this thesis!). I would be lost
without you.
ix

Dedication
Completing a PhD is always difficult, but I was lucky to pass through mine with a
whole host of privileges that allowed me to focus entirely my work. I did not have
to deal with racism. I did not have to deal with sexism. I did not have to deal with
discrimination of any kind.
Many PhD students are forced to deal with these issues, both inside and outside
of academia, throughout their PhD. This makes their PhD journey more complicated
and difficult than I can imagine. It is our collective responsibility to ensure that the
members of our society who feel these discriminations directly are not the only ones
who are working to rectify them. If some of our community suffer, then we all feel the
negative effects.
Take care of your colleagues. Call out behaviour that should be consigned to
the history books. We must make sure that the future of academia, and society, is fair
and offers equal opportunities and support to everyone. Black Lives Matter.
This PhD thesis was completed and defended during the COVID-19 pandemic. It is
dedicated to everyone who has suffered as a result of this disease.
x

Dissemination
Publications
C. Pattison, V. Vennin, H. Assadullahi and D. Wands, Quantum diffusion during
inflation and primordial black holes, JCAP 1710(2017)046, [1707.00537]
C. Pattison, V. Vennin, H. Assadullahi and D. Wands, The attractive behaviour of
ultra-slow-roll inflation, JCAP 1808(2018)048, [1806.09553]
C. Pattison, V. Vennin, H. Assadullahi and D. Wands, Stochastic inflation beyond
slow roll, JCAP 1907(2019)031, [1905.06300]
xi

Chapter 1
Introduction
In this chapter, we will review the standard model of cosmology and cosmological infla-
tion, as well as perturbations during inflation and the effects they can have on observ-
able quantities. We will review the so-called Friedmann-Lemaıtre-Robertson-Walker
(FLRW) Universe, which describes an expanding spacetime that is homogeneous and
isotropic, and discuss the Hot Big Bang model of the Universe, which describes the
Universe since the initial singularity (some 13.7 billion years ago), along with the prob-
lems of this model. Cosmological inflation will then be introduced, which was designed
in the 1980s to solve the known problems of the Hot Big Bang model and also, when
combined with quantum mechanics, inflation provides a mechanism to seed the large-
scale structure we see in the Universe. Finally, in this chapter, we will explain some
modern problems that persist in cosmology, and then discuss the formation of pri-
mordial black holes. These objects form in the early universe, but after inflation has
ended. A later part of this thesis is concerned with studying the effects of quantum
diffusion during inflation; we find that this can have a large impact on the formation
of primordial black holes. In this section, we only present an overview of the standard
cosmological model, and more details can be found in a range of textbooks, see, for
example, [1–8].
1

1.1 Standard model of cosmology
1.1.1 The FLRW Universe
Let us begin by discussing the Hot Big Bang Model of the Universe. By implementing
the cosmological principle of isotropy and homogeneity, the metric for spacetime can be
simply written as the Friedmann-Lemaıtre-Robertson-Walker (FLRW) metric, which
is completely determined up to a single free function of cosmic time. This free function
is the scale factor of the Universe, a(t), which is often taken to be dimensionless (so
that a = 1 today, by convention), and given this function the FLRW metric is then
ds2 = gµνdxµdxν = −dt2 + a2(t)
[dr2
1−Kr2+ r2dθ2 + r2 sin2 θdφ2
], (1.1.1)
where µ, ν run from 0 to 3, and the parameter K describes the spatial curvature of
the Universe and can take on the discrete values K = 1 (closed universe), K = 0
(flat Universe), or K = −1 (open Universe). Note that we are using natural units
c = ~ = kb = 1 here and throughout this thesis. In the metric (1.1.1), t is cosmic
time, r is the comoving radial coordinate, and θ and φ are the comoving angular
coordinates. Note the simplicity of this metric, which is due to the symmetries of
isotropy and homogeneity, and note that if the scale factor were to vary with space as
well as time, then this metric would violate homogeneity.
From the FLRW metric we can gain some physical understanding as to what
the scale a(t) represents. If we consider a constant t hypersurface, and define the
comoving distance Lcom between two points at fixed spatial coordinates (r, θ, φ) to
remain constant in the FLRW frame, then the physical distance Lphys between these
two points is Lphys = a(t)Lcom. This means the scale factor a(t) sets the physical
expansion of spatial hypersurfaces in the FLRW metric (1.1.1)
2

In the FLRW metric we also have a simple, linear relationship betewen distance
and velocity, known as the Hubble law. This can easily be seen by considering
vphys =d
dtLphys =
a
aLphys ≡ HLphys , (1.1.2)
where a dot denotes a time derivative, and we have defined the Hubble parameter
H(t) = a/a which sets the rate of expansion. We denote the current value of H(t) to
be H0, which we call the Hubble constant, and note that current measurements of its
value are failing to converge on an agreed exact value for H0 (see Ref. [9] for a review),
see Fig. 1.1. While the original measurement of this constant by Edwin Hubble in
1929 was 500 kms−1Mpc−1, modern measurements range between approximately 67-
74 kms−1Mpc−1. This tension is seen as important because the value of H0 contains
significant information about the content and history of the Universe, and hence re-
solving this tension is the subject of a great deal of research today. The information
encoded in the value of H0 includes a characteristic time scale H−10 ≈ 4.551 × 10¹⁷s
called the “Hubble time”, which ultimately sets the scale for the age of the Universe,
and a characteristic length scale H−10 ≈ 1.364 × 1026m called the “Hubble radius”,
which ultimately sets the scale for the size of the observable Universe.
It is sometimes convenient to factor out the scale factor from the time coordinate
of the FLRW metric, i.e. remove the expansion from the time coordinate. This is done
by defining the conformal time coordinate by dt = a(η)dη, and hence (1.1.1) becomes
ds2 = a2(η)
[−dη2 +
dr2
1−Kr2+ r2dθ2 + r2 sin2 θdφ2
]. (1.1.3)
3

2000 2005 2010 2015 2020Publication year
60
65
70
75
80
H0 [
km s
1 Mpc
1 ]
KP
SH 0ES
SH 0ES CHP
SH 0ESSH 0ES
WMAP1
WMAP3
WMAP5 WMAP7
WMAP9
Planck1
3Pla
nck15
Planck1
8
GW170817
Local probe CMB LIGO
Figure 1.1. H0 measurements over time, demonstrating the emergence of a tension betweenlocal measurements and those inferred from CMB measurements using the ΛCDM model.“KP” denotes the Hubble Space Telescope key project [10], “CHP” is the Carnegie HubbleProgram [11]. WMAP [12] and Planck [13] are constraints from the cosmic microwave back-ground (CMB), and SH0ES are local supernovae constraints (eg, [14]). The LIGO data pointuses a single gravitational wave event to constrain H0 [15]. Image credit: Natalie Hogg[16].
1.1.2 Einstein equations
The dynamics of generic (i.e. not necessarily FLRW) space-time metrics are described
by the Einstein–Hilbert action
S =M2
Pl
2
∫d4x√−g R , (1.1.4)
where MPl = 1/√
8πG ≈ 2.435 × 10¹⁸GeV in natural units of c = 1 is the reduced
Planck mass, d4x√−g = d4x
√−det (gµν) is the 4-dimensional volume element, and R
is the Ricci scalar which is defined as the contraction of the Ricci tensor R = Rµµ. One
can vary this action with respect to the metric components gµν to obtain the vacuum
solution
Rµν = 0 , (1.1.5)
4

but it is perhaps more enlightening to first add gravitating matter and a cosmological
constant Λ to the action (1.1.4) in an attempt to describe a Universe that is more like
our own. Doing so yields the action
S =M2
Pl
2
∫d4x√−g (R− 2Λ) +
∫d4x√−g Lmatter , (1.1.6)
where Lmatter is the Langrangian density of the gravitating matter of the universe.
If one varies the matter sector of this equation with respect to gµν then it allows
one to define the energy-momentum tensor T µν of the matter part as
−1
2
√−g Tµν ≡∂√−g Lmatter
∂gµν=
1
2
√−g gµνLmatter −√−g ∂Lmatter
∂gµν
= −1
2
√−g(
2∂Lmatter
∂gµν− gµνLmatter
).
(1.1.7)
Similarly, varying the first term of (1.1.6) with respect to gµν lets us define the Einstein
tensor as
Gµν + Λgµν ≡ Rµν +1
2Rgµν + Λgµν =
2√−g M2Pl
∂ [√−g (R− 2Λ)]
∂gµν. (1.1.8)
Thus, varying the entire action (1.1.6) and forcing this variation to vanish yields the
well-known Einstein field equations
Gµν + Λgµν =1
M2Pl
Tµν , (1.1.9)
where one can see that the Planck mass MPl acts as a coupling constant between the
matter in the theory and the gravitaional sector gµν , which follows because the matter
sector does not feature MPl in its action (if it did the factors of MPl would cancel at
the level of the equations of motion and it would not feature as a coupling constant).
As an example, we can now explicitly calculate the tensors Tµν and Gµν when
we consider an FLRW universe. One can plug the FLRW metric (1.1.1) components
5

into the definition of Gµν (1.1.8) to find
G00 = 3H2 +3K
a2,
Gij = −gij(H2 +
a
a+K
a2
),
G0i = Gi0 = 0 ,
(1.1.10)
where the indicies i, j correspond to the spatial indices and run from 1 to 3, and the
index 0 corresponds to the time component of the metric. These components are given
explicitly in Appendix A, along with the Christoffel symbols of the FLRW metric.
In order to find the form of the energy momentum tensor, let us consider an
observer that is moving with the matter fluid, i.e. moving with respect to the rest
frame and stationary with respect to the fluid frame, where we assume the matter is a
perfect fluid with density ρ, pressure P , and (normalised) 4-velocity uµ. For a perfect
fluid, the energy-momentum tensor is given by
Tµν = (ρ+ P )uµuν + Pgµν , (1.1.11)
where we note that for an observer at rest with respect to the fluid we have u0 = −1
and ui = 0, and hence Tµν = diag (ρ, P, P, P ) for our perfect matter fluid. We note
that, assuming that ρ and P do not vary spatially, this form of Tµν is consistent with
our global assumption of homogeneity and isotropy.
If we now substitute the components of the metric (1.1.1) and the Gµν , Tµν ten-
sors into the Einstein equations (1.1.9), we find two important equations in cosmology
H2 =ρ
3M2Pl
− K
a2+
Λ
3, (1.1.12)
a
a= −ρ+ 3P
6M2Pl
+Λ
3, (1.1.13)
6

which are called the Friedmann equation and Raychaudhuri equation, respectively 1.
It is interesting to note that, in the absence of curvature and the cosmological
constant (K = Λ = 0), the Friedmann equation gives a direct relationship between the
Hubble rate and its energy density, meaning that simply the presence of energy in the
Universe will cause it to contract or expand. Similarly, if Λ = 0, the Raychaudhuri
equation tells us that the presence of energy (with or without pressure) stops the scale
factor from being constant. In the context of what will follow in this thesis, it is
important to note that the scale factor will accelerate (a > 0) if ρ + 3P < 0, which is
possible for fluids with negative pressure (assuming ρ is positive), and we will see that
this is the case during inflation.
From the energy-momentum tensor, if we implement the time component of the
conservation equation ∇µTνµ = 0 (i.e. take ν = 0), we also find that
0 = ∇µT0µ = −ρ− 3
a
aρ− 3
a
aP , (1.1.14)
which can be simply rewritten as the continuity equation
ρ+ 3H(ρ+ P ) = 0 . (1.1.15)
The continuity equation (1.1.15) has a simple solution when the equation of state
parameter, defined as w = Pρ
, is constant, and these solutions are given by
ρ(a) = ρin
(a
ain
)−3(1+w)
, (1.1.16)
where ρin is the initial value of ρ when a = ain. Many cases of interest yield the
simple solutions given by (1.1.16). For example, cold matter simply has wmatter = 0
and so we see that ρmatter ∝ a−3, which is to say that matter scales inversely with
1Note that one can also derive the Friedmann equation by varying the action (1.1.6) with respectto the lapse function A (see Eq. (1.3.36) for the definition of the lapse function), and one can derivethe Raychaudhuri equation by varying the action (1.1.6) with respect to the scale factor a.
7

the volume of the spacetime that it is in. For radiation, we have wradiation = 1/3, and
so ρradition ∝ a−4, so in an expanding spacetime, radiation dilutes with the volume
increase of the spacetime (∝ a−3) as well as with an additional redshift dependence
(∝ a−1) of each particles energy. In order to see how we can identify the effect of the
curvature K and the cosmological constant Λ with a fluid, let us rewrite (1.1.12) as
H2 =1
3M2Pl
[ρmatter + ρrad + ρK + ρΛ] ≡ 1
3M2Pl
ρtot , (1.1.17)
where we define ρmatter to be the energy density of any matter and any other non-
relativistic constituent present in the Universe, ρrad is the energy density of radiation,
ρK = −3M2PlK/a
2 to be the energy density of curvature, ρΛ = M2PlΛ to be the energy
density of the cosmological constant, and ρtot to be the total energy density of the
Universe. We see that ρK ∝ a−2, and so from (1.1.16) we can conclude that wK = −1/3,
and similarly ρΛ ∝ a0, and so we associate the cosmological constant to a fluid with
equation of state wΛ = −1. The constant values of w and the forms of the energy
density’s dependence on the scale factor discussed above are summarised in Table
(1.1).
fluidequation of stateparameter w
ρ(a) a(t)
cold matter 0 ∝ a−3 ∝ t2/3
radiation 1/3 ∝ a−4 ∝ t1/2
spatial curvature −1/3 ∝ a−2 ∝ tcosmological constant −1 ∝ a0 ∝ eHt
scalar field −1 + 2ε1/3 ∝ a−2ε1 ∝ t1/ε1
Table 1.1. Equations of state for various fluids, along with the corresponding profiles fortheir density and scale factor.
Rewriting the Friedmann equation as (1.1.17) has another useful consequence,
as it allows us to see that (assuming a evolves monotonically) the right-hand side
quickly becomes dominated by one of the fluids. This is the fluid with the smallest
8

ln a
lnρ
Radiation ρ ∝ a−4
Matter ρ ∝ a−3 Constant Λ
Figure 1.2. A simple illustration of the decay of energy density of the constituents of theUnvierse.
value of w if space is expanding, and the fluid with the largest value of w if space is
contracting.
Once H is dominated by a single fluid, (1.1.17) is integrable and we find
a(t) =
ain
[1± 3
2(1 + w)Hin (t− tin)
] 23(1+w) if w 6= −1
ain exp [Hin (t− tin)] if w = −1
, (1.1.18)
Here, the ± depends on whether space is expanding (take the + sign) or contracting
(take the − sign). For the rest of this thesis, only the case of expanding space will be
considered. For the values of w discussed above, the corresponding profiles of a(t) are
displayed in Table (1.1).
There a few interesting things that we can note when considering multiple flu-
ids together. First of all, if one considers multiple fluids in the Freidmann equation
(1.1.12), that is we replace ρ → ∑i ρi, then we can consider all of the separate con-
9

stituents of gravitating matter in the Universe which all dilute at different rates with
the expansion of the Universe. In this way, we can estimate which constituent domi-
nated the energy budget of the Universe throughout its history, as shown in Fig. 1.2.
We see that the history of the Universe can be separated into three main epochs in
which the total energy density ρtot of the Universe is dominated by a different con-
stituent of the Universe. From the end of inflation until matter-radiation equality at
zeq ' 3402, the energy density of the Universe is dominated by radiation, and hence
ρtot ∝ a−4. Then for redshifts zeq < z < zacc, where zacc ' 0.6, matter (specifically
dark matter) dominated the energy budget of the Universe and ρtot ∝ a−3. Finally,
the current epoch of the Universe zacc < z < 0 is dominated by dark energy (assumed
to be a cosmological constant), and hence ρtot ∝ a0. The evolution of each of these
epochs is well understood, although during the transitions between epochs there are
two equally important constituents of the Universe and hence the behaviour of ρtot is
more complicated.
Next, we can see that if we consider the Universe to be made up of multiple
fields with independent equations of state wi = Pi/ρi, then the continuity equation
(1.1.15) simply generalises to
∑
i
[ρi + 3H(ρi + Pi)] = 0 . (1.1.19)
Finally, we note that if (1.1.19) is solved because each term vanishes individually, then
this corresponds to the case of multiple fluids that are not interacting (so no energy
transfers between the fields), and in this case (as we did before) we can solve for the
total energy density ρT as
ρT(a) =∑
i
ρini
(aiaini
)−3(1+wi)
. (1.1.20)
10

Figure 1.3. Current composition of the Universe, according to the ΛCDM model, wherewe take Ωk ' 0. This is consistent with the latest measurements from the Planck satellite[17].
1.1.3 Composition of the Universe
It is possible to use (1.1.20) to estimate the energy density of each constituent of the
Universe at any time if we know the current values for their energy density (or if we
know their values at any one time, but it is easiest to measure them at the current
time). This can be done as long as we assume each component has a constant equation
of state and assuming there is no energy transferred between each component.
Let us begin by defining the critical density of the universe to be
ρcrit = 3M2PlH
2 , (1.1.21)
and also defining the dimensionless quantities Ωi = ρi/ρcrit for each fluid, where Ωi
describes the fraction of the Universe that is contained in each constituent. We note
11
at this point that ΩK can be either positive or negative, while every other Ωi is strictly
positive (or zero). With these definitions in place, we can rewrite the Friedmann
equation (1.1.17) as
1− ΩK = Ωmatter + Ωrad + ΩΛ , (1.1.22)
where ΩK has been singled out on the left-hand side due to it being the only one that
can be positive or negative. Finally, we can implement the scaling of the scale factor
(1.1.20) for each constituent to show how each term evolves backwards (or forwards)
in time from their current values,
1− Ω0K
a2=
Ω0matter
a3+
Ω0rad
a4+ Ω0
Λ , (1.1.23)
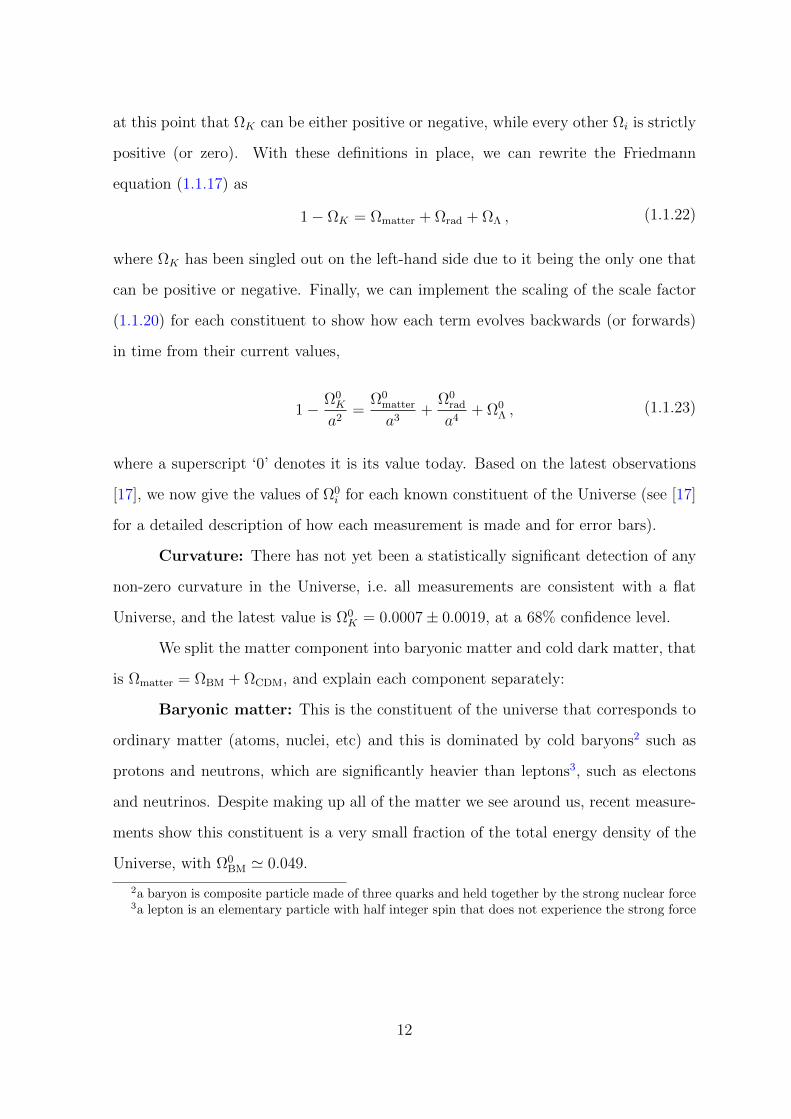
where a superscript ‘0’ denotes it is its value today. Based on the latest observations
[17], we now give the values of Ω0i for each known constituent of the Universe (see [17]
for a detailed description of how each measurement is made and for error bars).
Curvature: There has not yet been a statistically significant detection of any
non-zero curvature in the Universe, i.e. all measurements are consistent with a flat
Universe, and the latest value is Ω0K = 0.0007± 0.0019, at a 68% confidence level.
We split the matter component into baryonic matter and cold dark matter, that
is Ωmatter = ΩBM + ΩCDM, and explain each component separately:
Baryonic matter: This is the constituent of the universe that corresponds to
ordinary matter (atoms, nuclei, etc) and this is dominated by cold baryons2 such as
protons and neutrons, which are significantly heavier than leptons3, such as electons
and neutrinos. Despite making up all of the matter we see around us, recent measure-
ments show this constituent is a very small fraction of the total energy density of the
Universe, with Ω0BM ' 0.049.
2a baryon is composite particle made of three quarks and held together by the strong nuclear force3a lepton is an elementary particle with half integer spin that does not experience the strong force
12

Dark matter: This component of the matter in the Universe is necessary in
order to explain many observations of our Universe (see Sec. 1.4.3 for details), including
galactic rotation curves and the CMB fluctuations seen by the Planck satellite. Dark
matter has w = 0, is pressureless, and does not interact electromagnetically (or if it
does interact with the EM force, it must do so extremely weakly), hence the name
“dark matter”. While the nature of dark matter is currently unknown, there are
many candidates for dark matter, some of which are explored later in this thesis (see
Sec. 1.4.3), including primordial black holes, which we will discuss in detail. Despite
the unknown nature of dark matter, it is much more abundant in the Universe than
baryonic matter, with Ω0CDM ' 0.262, so approximately 5 times the energy density of
ordinary matter is contained in dark matter.
Radiation: Since radiation dilutes much faster than matter as the Universe
expands, see (1.1.16) with w = 1/3, the present energy density contained in radiation
is much smaller than that contained in matter, with Ω0rad ' 9.23 × 10⁻⁵, and most of
this is contained in photons from the CMB (neutrinos have a small mass and are hence
non-relativistic in the current epoch).
Cosmological constant: A cosmological constant with w = −1 is also neces-
sary to explain several pieces of evidence that the current expansion of the Universe is
accelerating, including supernovae observations, baryon acoustic oscillations and voids,
and fitting the CMB observations. In fact, this dark energy fluid must be the dominant
constituent of the Universe today, with Ω0Λ ' 0.6889 ± 0.0056, despite the fact that
we do not know the exact nature of this dark energy fluid. However, it is likely to be
a cosmological constant or similar, as the latest measurements [17] for the equation
of state are w = −1.03 ± 0.03, at 68% confidence level, which is consistent with a
cosmological constant.
The fractions of the energy density of the Universe contained in each component
discussed here are summarised in Fig. 1.3. Let us note that the majority of the energy
density of the Universe is contained in fluids that we do not currently understand,
13

Figure 1.4. An illustrated timeline of some of the key events in the evolution of the Universe,including the approximate times that they occured. Image credit: NASA.
and the nature of dark matter and dark energy are two of the most important open
questions in modern cosmology.
1.1.4 Timeline of the Universe
In this section we provide a brief description of some key events in the history of the
Universe. These events are summarised in Fig. 1.4, along with approximate time after
the Big Bang that they took place. The initial singularity of the Big Bang picture is
postulated because all photons travelling in an expanding Universe are such that their
wavelength evolves as a−1. Since we also know that an initial black-body distribution
remains a black-body at all time and its temperature decreases as T ∝ a−1, if we
evolve this backwards in time we reach an initial singularity of infinite temperature at
a finite time in the past (at t = 0). In the Hot Big Bang model of the Universe, this
initial singularity is followed by a hot radiation dominated era which gradually cools.
As the radiation cools and dilutes, it eventually becomes subdominant to the matter
density of the Universe, and hence the radiation dominated era is followed by a matter
dominated era. It is during this matter era that the familiar structures of the modern
Universe form, including galaxies, stars and planets. Finally, as the matter dilutes
14
with the expansion of the volume of spacetime, the cosmological constant (which has
constant density and does not dilute) eventually dominates the energy density of the
Universe and we enter the current era of accelerated expansion due to dark energy.
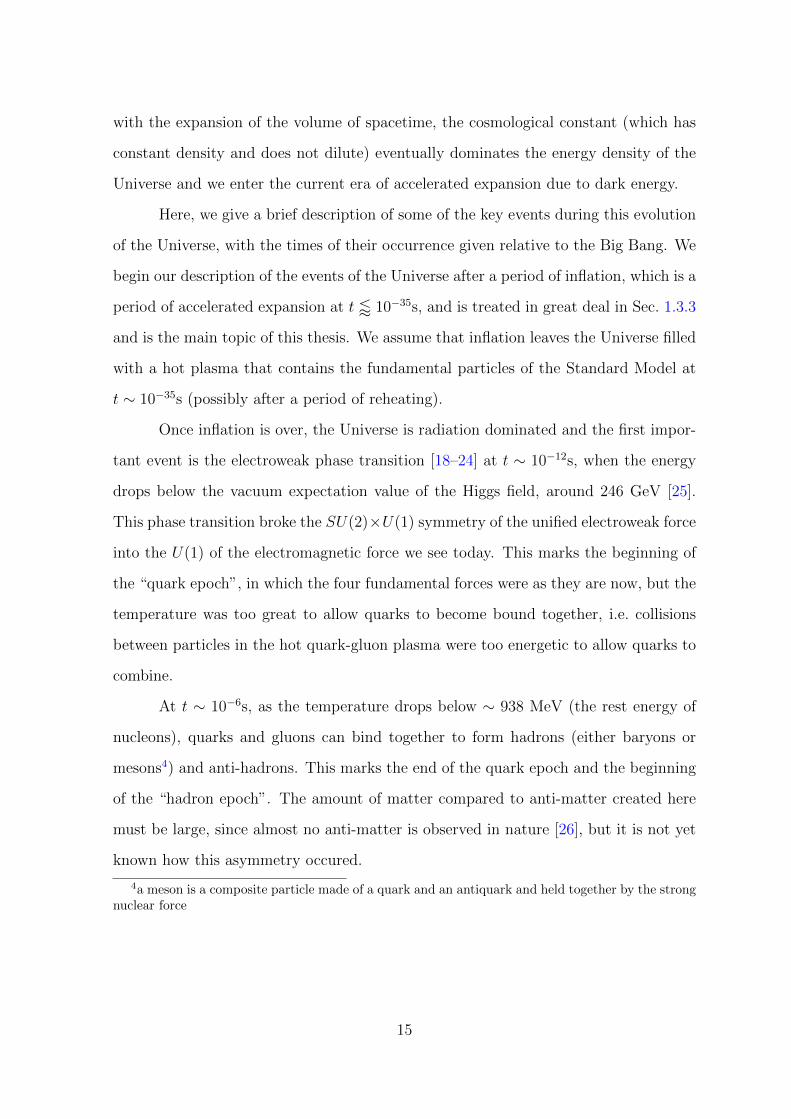
Here, we give a brief description of some of the key events during this evolution
of the Universe, with the times of their occurrence given relative to the Big Bang. We
begin our description of the events of the Universe after a period of inflation, which is a
period of accelerated expansion at t / 10−35s, and is treated in great deal in Sec. 1.3.3
and is the main topic of this thesis. We assume that inflation leaves the Universe filled
with a hot plasma that contains the fundamental particles of the Standard Model at
t ∼ 10−35s (possibly after a period of reheating).
Once inflation is over, the Universe is radiation dominated and the first impor-
tant event is the electroweak phase transition [18–24] at t ∼ 10−12s, when the energy
drops below the vacuum expectation value of the Higgs field, around 246 GeV [25].
This phase transition broke the SU(2)×U(1) symmetry of the unified electroweak force
into the U(1) of the electromagnetic force we see today. This marks the beginning of
the “quark epoch”, in which the four fundamental forces were as they are now, but the
temperature was too great to allow quarks to become bound together, i.e. collisions
between particles in the hot quark-gluon plasma were too energetic to allow quarks to
combine.
At t ∼ 10−6s, as the temperature drops below ∼ 938 MeV (the rest energy of
nucleons), quarks and gluons can bind together to form hadrons (either baryons or
mesons4) and anti-hadrons. This marks the end of the quark epoch and the beginning
of the “hadron epoch”. The amount of matter compared to anti-matter created here
must be large, since almost no anti-matter is observed in nature [26], but it is not yet
known how this asymmetry occured.
4a meson is a composite particle made of a quark and an antiquark and held together by the strongnuclear force
15
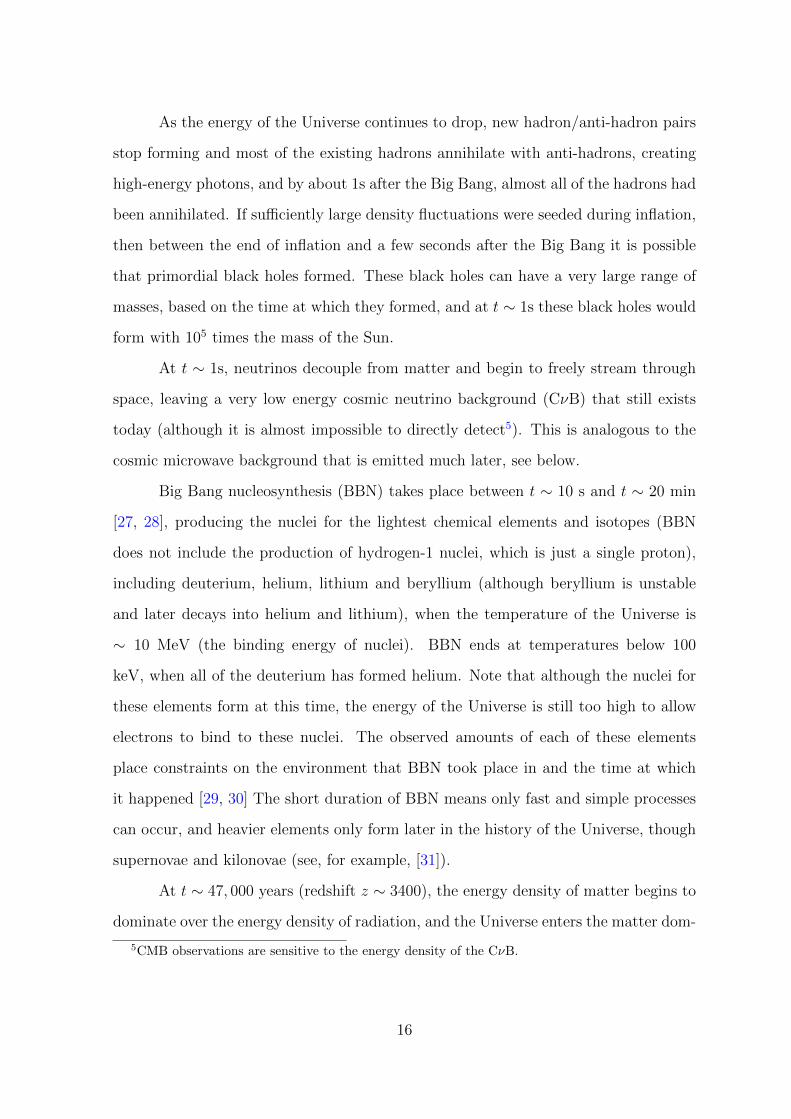
As the energy of the Universe continues to drop, new hadron/anti-hadron pairs
stop forming and most of the existing hadrons annihilate with anti-hadrons, creating
high-energy photons, and by about 1s after the Big Bang, almost all of the hadrons had
been annihilated. If sufficiently large density fluctuations were seeded during inflation,
then between the end of inflation and a few seconds after the Big Bang it is possible
that primordial black holes formed. These black holes can have a very large range of
masses, based on the time at which they formed, and at t ∼ 1s these black holes would
form with 105 times the mass of the Sun.
At t ∼ 1s, neutrinos decouple from matter and begin to freely stream through
space, leaving a very low energy cosmic neutrino background (CνB) that still exists
today (although it is almost impossible to directly detect5). This is analogous to the
cosmic microwave background that is emitted much later, see below.
Big Bang nucleosynthesis (BBN) takes place between t ∼ 10 s and t ∼ 20 min
[27, 28], producing the nuclei for the lightest chemical elements and isotopes (BBN
does not include the production of hydrogen-1 nuclei, which is just a single proton),
including deuterium, helium, lithium and beryllium (although beryllium is unstable
and later decays into helium and lithium), when the temperature of the Universe is
∼ 10 MeV (the binding energy of nuclei). BBN ends at temperatures below 100
keV, when all of the deuterium has formed helium. Note that although the nuclei for
these elements form at this time, the energy of the Universe is still too high to allow
electrons to bind to these nuclei. The observed amounts of each of these elements
place constraints on the environment that BBN took place in and the time at which
it happened [29, 30] The short duration of BBN means only fast and simple processes
can occur, and heavier elements only form later in the history of the Universe, though
supernovae and kilonovae (see, for example, [31]).
At t ∼ 47, 000 years (redshift z ∼ 3400), the energy density of matter begins to
dominate over the energy density of radiation, and the Universe enters the matter dom-
5CMB observations are sensitive to the energy density of the CνB.
16

Figure 1.5. Planck 2018 CMB temperature map. The temperature of the CMB is 2.725 K,with fluctions of just 0.01%, i.e. 1 part in 10, 000. Image credit: ESA/Planck collaboration.
inated era. From this point on, perturbations are no longer erased by free-streaming
radiation and hence structures can begin to form in the matter dominated era. The
matter content of the Universe at this point is dominated by dark matter, although
since the nature of dark matter is still unknown, the Hot Big Bang model does not
give a unique explanation for its origin. At t ∼ 100, 000 years, the temperature of the
Universe is low enough for the first molecules (helium hydride) to form.
At t ∼ 370, 000 years (redshift z ∼ 1080), the Universe has cooled enough (to
about 1 eV) that charged electrons can bind with protons to form the first neutral
hydrogen atoms, in a phase called “recombination” (even though it is the first time
these particles have combined). At this point the Universe becomes transparent for
the first time [32] and photons scatter off charged particles for the last time at the
“last scattering surface”, and can then freely stream through the Universe unimpeded
and are still travelling today. Almost all protons and electrons in the Universe become
bound in neutral atoms, and hence the mean free path for photons becomes very
large, that is to say the photon-atom cross-section is much smaller than the photon-
electron cross-section, and hence photons “decouple” from matter. This results in the
17

cosmic microwave background (CMB), which is often called the “oldest light in the
Universe”. The CMB reaches us with the same temperature distribution that it was
emitted with (i.e. a perfect black-body), but with its temperature redshifted by the
expansion of spacetime between its emission and now, and the average temperature of
the CMB today is TCMB = 2.725K. The latest Planck image [13] of the temperature
fluctuations of the CMB is shown in Fig. 1.5, where the colours show that the CMB is
homogeneous and isotropic up one part in 105, and the deviations from homogeneity
are key predictions of inflation. We note that when electrons and photons combine, it
is more efficient for them to do so with the electron still in an excited state and then
for the electron to transition to a lower energy state by releasing photons once the
hydrogen forms, providing more photons for the CMB.
After recombination, the Universe is no longer opaque to photons, but there are
no light emitting structures, and hence this epoch is called the “Dark Ages”. As such, it
is very difficult to make observations of anything from this epoch. There were only two
sources of photons from this epoch, the CMB photons, and the rare 21cm spin line of
neutral hydrogen, which is the spontaneous release of a 21cm photon from an electron
dropping down an energy state. Although this 21cm emission is rare, the Universe was
filled with neutral hydrogen, and so a detectable amount of this wavelength of light
could have been emitted during the dark ages and there are currently many telescopes
trying to detect this light, including the recent EDGES experiment [33].
As perturbations grow during the matter era, the first stars (known as Popula-
tion III stars) begin to form at t ∼ 100, 000 years, providing the first visible light after
recombination and ending the Dark Ages. These early stars were made almost entirely
of hydrogen (and some helium), and gradually began to fill the Universe with heavier
elements as they evolved and went supernova.
Galaxies then begin to form and in these early galaxies form objects that are
energetic enough to ionise neutral hydrogen. That is, objects that produce photons
with enough energy to break apart the electron-proton bond of the hydrogen and
18
leave separate charged particles, in a process that is called “reionisation” [34–37]. The
objects thought to be able to produce these high energy photons include quasars, as
well as the Population III stars and the formation of the early galaxies themselves.
Reionisation took place between t ∼ 150 millions years and t ∼ 1 billion years, or at
redshift 6 < z < 20. However, due to the large amount of expansion that the Universe
had experienced since recombination, the Universe did not revert back to being opaque
to photons after reionisation, i.e. the mean free path of photons remains large, even
today, due to scattering interactions remaining rare due to the dilution of matter.
Entering the current epoch at t ∼ 9 billion years, dark energy begins to dominate
the Universe and the expansion of the Universe accelerates [38, 39]. During this epoch,
the large scale structure of the Universe continues to develop to become the cosmic
web we see today, full of clusters of galaxies, galaxies, stars and planetary systems.
The nature of dark energy is still unknown, and is a very active area of research in
modern cosmology.
1.2 Classical problems in the Hot Big Bang Model
Above we have outlined the main events and features of the Hot Big Bang model
of cosmology. Although this model is very compelling, it leaves several unanswered
questions about the Universe when we compare this theory to observations, and this
ultimately leads us to introduce an early phase of cosmological inflation into our view
of the Universe. The three famous problems are known as the horizon, flatness, and
monopole problems, although this is not an exhaustive list of known problems with
this model and other questions raised by this model include the origin and nature
of dark matter and dark energy, the nature of physics at the Big Bang singularity,
etc. Below, we will discuss the details of the horizon problem, as it is arguably the
most fundamental problem, while simply noting the other two for historical reasons.
Most modern cosmologists indeed treat these problems as the original motivation for
19

inflation, but nowadays the main motivation for studying inflation is to seed the large
scale structure of the Universe.
In this section, we will introduce the horizon problem, and in the next section
we will show explicitly how this can be rectified by a period of accelerated expansion
in the very early Universe.
1.2.1 Horizon problem
We begin by discussing the horizon problem [40, 41] of the Hot Big Bang model, which
is a consequence of the finite travel time of light, and the existence of a causal horizon
in the Hot Big Bang model. This causal horizon acts as a barrier between observable
events and non-observable events, and no physical process can act on scales larger
than the causal horizon. This means that we would, a priori, expect the Universe to
be inhomogeneous on scales larger than the causal horizon, as separate causal regions
cannot “talk” to each other in order to equilibriate. The causal horizon is defined as
the furthest physical (proper) distance away that a photon received at a time trec could
have originated.
In this section, we will calculate the size of the causal horizon at the time of
recombination and show that it is much smaller than the diameter of the last scattering
surface, i.e. the last scattering surface is made of many causally disconnected regions.
Hence the extreme homogeneity of the CMB observations (see Fig. 1.5) requires either
fine-tuning, an early period of inflation, or some other explanation.
If a photon is emitted at time tem and radius rem and travels directly (dφ =
dθ = 0) to an observer at r = 0, then from (1.1.1) we see that its trajectory, given by
ds2 = 0, isdt
a(t)=
dr√1−Kr2
. (1.2.1)
If K = 0 (as will be justified below), we can then solve for r to get
r(t) = rem −∫ t
tem
dt
a(t), (1.2.2)
20

and hence the physical distance between the photon and its point of emission is
dphys(t) = a(t)r(t). In order to find the size of the horizon, we must maximise (1.2.2),
which will occur if the photon was emitted at the earliest possible time, so tem = tBB
is the time of the Big Bang, and received at the latest possible time, so r(trec) = 0.
Thus, (1.2.2) gives
rem =
∫ trec
tBB
dt
a(t), (1.2.3)
and hence the size of the horizon at a time trec is given by
dhor (trec) = a(trec)rem = a(trec)
∫ trec
tBB
dt
a(t). (1.2.4)
The size of the causal horizon at the last scattering surface is then found by taking
trec = tlss in Eq. (1.2.4).
However, it is more useful to know the angular size of the causal horizon at
recombination as seen by an observer on Earth at time t0 > tlss, denoted by ∆Ωdhor(t0),
as this is an observable quantity. If we let dΩ2 = dθ2 + sin θdφ2, and assume that the
last scattering surface is an instantaneous sphere of constant radius, i.e. dt = dr = 0,
then the FLRW metric (1.1.1) reads ds = a(tlss)rlssdΩ. Here, rlss =∫ t0tlss
dta(t)
is the
distance from Earth to the last scattering surface, and is found from (1.2.2) with
t = t0, tem = tlss and r(t0) = 0. Combining all of these results, we find that the angular
size of the causal horizon of the last scattering surface as seen from Earth is
∆Ωdhor(t0) =dhor (tlss)
a(tlss)rlss
=
∫ tlsstBB
dta(t)∫ t0
tlss
dta(t)
. (1.2.5)
This ratio of integrals can be solved by noting the relationship
∫ t2
t1
dt
a(t)=
1
a0H0
∫ z1
z2
dz√∑i Ω
0i (1 + z)3(1+wi)
, (1.2.6)
21

where ωi refers to the energy density of each fluid present in the Universe, with equation
of state wi, as in (1.1.23). With this, the angular size of the causal horizon at last
scattering can be found numerically to be
∆Ωdhor(t0) =
∫∞zlss
dz√∑i Ω0
i (1+z)3(1+wi)∫ zlss0
dz√∑i Ω0
i (1+z)3(1+wi)
' 0.0054 rad ' 0.3 deg , (1.2.7)
which corresponds to approximately 1/450, 000 of the sky. This means we should
expect the last scattering surface to be comprised of around 450, 000 separate patches
whose physical properties have, a priori, no reason to be similar and can be completely
different. However, observations tell us that the CMB is homogeneous and isotropic
up to tiny fluctuations of order δT/T ' 10−5 across the whole sky [13], and hence we
have a contradiction in the standard picture, and this problem is know as the “horizon
problem”.
Note that this is essentially an initial condition problem, because if one assumes
that the conditions in each patch were identical before last scattering6, then this prob-
lem vanishes. Another way to solve the horizon problem without fine-tuning the initial
conditions is to introduce an early phase of cosmological inflation, as will be discussed
in the next section.
1.2.2 Flatness and monopole problems
The flatness problem [42] refers to the fact that observations of the Universe today
are consistent with flatness at 95% [13], while also noting that ΩK = 0 is unstable in
a radiation or matter dominated universe, and any initial curvature in the Universe
should grow. This means that the flatness problem is another fine-tuning issue, since
6Since the Universe at the time we need to set initial conditions is likely to be governed byquantum gravity, the nature of which we do not know, it may be argued that the horizon problemis a manifestation of our ignorance of quantum gravity and should not be considered a “classical”problem. However, in this case we cannot perform any calculations or make any predictions.
22

to explain the current observations we need to set the initial curvature of the Universe
to be close to zero at an extremely precise level.
This is, again, not a problem if one is happy to set such a fine-tuned initial
configuration, but an early period of inflation also solves this problem. To see why, we
simply need to note that curvature decays slower than the other fluids in the Universe
(i.e. slower than radiation and matter, see Eq. (1.1.23)), and hence if it is small today
then it must have been even smaller in the past. If we introduce a phase in which
the energy density decays slower than curvature, however, we can effectively dilute
any curvature away in the early Universe. We know that wK = −1/3, and so any
phase dominated by a new fluid with w < −1/3 will see curvature decay faster than
this new fluid. We will see shortly that this is precisely the case for an accelerating
expansion phase. We also assume this new fluid decays directly into radiation and
hence curvature is automatically subdominant to the radiation, provided the period of
inflation lasted long enough (which turns out to be approximately 60 e-folds or more
[43]).
For the rest of the thesis, we take ΩK = 0, since from (1.1.17) we see that
the contribution from curvature grows slower than all other components as we go
backwards in time (a → 0), and hence we know that curvature has never dominated
the energy content of the Universe.
The monopole problem is the apparent paradox between the predicted abun-
dance of magnetic monopoles [44, 45] resulting from spontaneous symmetry breaking in
Grand Unified Theories [46–48] (GUT) as the universe cools below MGUT ' 1016GeV,
and the observed number of magnetic monopoles in the Universe today. These GUT
theories predict vast numbers of these monopoles being produced at high temperatures
[49, 50] and they should still exist in the modern Universe in such numbers that they
would be the dominant constituent of the Universe [51, 52]. However, searches for these
objects have failed to find any magnetic monopoles [53], leading to the paradox of the
monopole problem. Inflation offers a solution to this problem by effectively diluting
23

the density of such monopoles to less than one per causal patch of the Universe. This
does not exclude the possibility of these theories forming magnetic monopoles, but a
long enough period of inflation explains the lack of observations of these objects (we
require N & 60 e-folds, assuming w = −1).
1.3 Inflation
Cosmological inflation [54–59] is the leading paradigm for the very early Universe, in
which space-time undergoes a period of accelerating expansion at very high energies
(between 103 and 1015 GeV). While inflation provides a neat solution to the classical
problems of the Hot Big Bang model, possibly a more important feature of cosmic
inflation is its ability to seed the large-scale structure of the modern Universe when
vacuum quantum fluctuations (of the gravitational and matter fields) are amplified
and grow into the cosmic web [60–65]. This provides an explanation for the observed
homogeneity and isotropy of the Universe, and allows inflation to be a predictive the-
ory, and measurements of these inhomogeneities provide knowledge about conditions
during inflation. For example, inflation predicts that the spectrum of the cosmologi-
cal fluctuations should be almost exactly scale invariant, that is to say their power is
approximately equal on all spatial scales, and this is completely consistent with the
latest observations [13].
In fact, inflation is possibly the only case in physics where an effect based on
General Relativity and Quantum Mechanics leads to predictions that, given our present
day technological capabilities, can be tested experimentally. We note that many other
possible explanations for the early universe have been suggested (see, for example,
[66–71]), but inflation has outlasted them all and become an accepted part of modern
cosmology. High precision data that can test the inflationary paradigm is now more
readily available than ever, and will keep coming with missions planned for the next
few decades that will continue to test inflation. Recent observations from the Planck
24

satellite [13, 72] (which build upon previous previous data from the WMAP satellite [12,
73]) allow us to constrain inflation, while data about the smaller scales of the CMB is
complemented by ground-based microwave telescopes such as the Atacama Cosmology
Telescope [74, 75] and the South Pole Telescope [76, 77], and dedicated ultra-sensitive
polarization experiments are planned for the future [78–82]. Other observations that
can test inflationary physics include polarisation measurements of the CMB, and 21
cm telescopes (for example [33]) that probe the dark ages of the Universe. Direct
detection of primordial gravitational waves, through future experiments like the space-
based Laser Interferometer Space Antenna (LISA) [83], can also test the very early
Universe [84], including inflation and the formation of primordial black holes. Probing
the very early Universe is exciting because it provides an ultra-high energy quantum
laboratory on cosmological scales, allowing us to test physics well beyond the scales
accessible to Earth-based experiments such as the Large Hadron Collider (LHC).
In this section, as well as demonstrating some of the motivation behind inflation,
we will discuss the theory and tools that are typically used to study inflation, which
will provide the foundations for the results presented later in this thesis.
1.3.1 Solution to the Horizon Problem
In order to understand how a period of inflation can solve the horizon problem, let
us consider conformal space-time diagrams. By neglecting angular coordinates, the
FLRW metric (1.1.3), written in conformal time, is simply given by
ds2 = a2(η)(−dη2 + dr2
), (1.3.1)
where we recall that conformal time is given by dt = adη. Thus, in this parameterisa-
tion, photons, which follow null geodesics defined by ds2 = 0 and define the past light
cones, follow the simple trajectories dη = dr. The size of the causal horizon in terms
25

Figure 1.6. Conformal diagrams in the (η, r) plane, where light propagates in straight lines.In the left panel we depict the standard Big Bang cosmology with no inflation, where theCMB consists of approximately 450, 000 causally disconnected patches. This means that thepast light cones of these regions do not intersect before the initial singularity at η = 0. Inthe right hand plot we show the conformal diagram when inflation is included and we extendconformal time to negative values, and any two patches on the CMB are causally connectedas there past light cones intersect (denoted by the shaded region here).
of conformal time is then given by
dhor (η) = a(η) (η − ηBB) , (1.3.2)
where ηBB is the value of conformal time at the Big Bang. Now, from Eq. (1.1.18),
if the Universe is dominated by a single fluid with equation of state w, and we have
tBB = 0, then the scale factor is given by
a(t) = a0
(t
t0
) 23(1+w)
, (1.3.3)
where a0 is a constant defined by Eq. (1.1.18), and which is positive for an expanding
Universe and w > −1. Hence conformal time, found by integrating dt = adη, is given
by
η = η0
(t
t0
) 3w+13(1+w)
, (1.3.4)
where we have defined
η0 =3
a0t0
1 + w
3w + 1. (1.3.5)
26

Now, if w > −13, then when t→ 0 we have η → 0 from Eq. (1.3.4). This tells us that
ηBB = 0, and hence the size of the horizon is dhor (η) = aη, which is finite and can lead
to a horizon problem. This is the case represented by the left hand side of Fig. 1.6.
However, if w < −13, which we will see below is the case for an inflating universe,
then when t→ 0, we have η → −∞ from Eq. (1.3.4). This means that ηBB = −∞, and
hence the size of the causal horizon becomes infinite, see Eq. (1.3.2). Since w < −13,
the definition of η0 means that η is allowed to become negative, and the singularity
at a = 0 is only realised in the infinite past7. This means that the horizon problem is
eliminated in this case [56, 57], which is represented in the right hand side of Fig. 1.6.
1.3.2 Classical inflationary dynamics
By definition, inflation is a period of accelerated expansion, hence the scale factor a
is growing at an increasing rate, so a > 0. The Raychauduri equation (1.1.13) in the
absence of a cosmological constant then tells us that
ρ+ 3P < 0 , (1.3.6)
which means that inflation will be realised by a fluid with negative pressure (since we
require ρ > 0 always). More specifically, this tells us that, for inflation, the equation
of state is w < −1/3. Since inflation takes place at very high energies, the necessary
formalism to describe the physics of this time is field theory, and hence a simple
realisation of inflation is to consider the expansion to be driven by a real scalar field
φ, which we call the “inflaton” field, i.e. we consider the energy density of the early
Universe to be dominated by the inflaton. This is an assumption that is completely
compatible with the flatness, isotropy and homogeneity of the early Universe that
we observe. However, the physics of inflation cannot be tested terrestrially (i.e. in a
7In the infinite future, for w < −1/3, we have a → ∞ in the infinite future t → 0 (or η → 0).This is only the case if we assume the inflation phase (w < −1/3) lasts indefinitely, but in practiceinflation will end at some finite time −1 ηend < 0, and hence the surface η → 0− represents theend of inflation. This is shown in Fig. 1.6.
27

particle accelerator) because of the extremely high energies that it took place at, which
are currently well beyond the limits of experimental probing on Earth. This means
that the shape of the potential V (φ) is relatively unknown, other than the flatness
requirement to ensure inflation is realised, allowing for many models of inflation to be
suggested (and tested against observations).
The action for a single scalar field φ, the inflaton, minimally coupled to gravity
is given by
Sinfl =
∫d4x√−g
[M2
Pl
2R− 1
2gµν∂µφ∂νφ− V (φ)
], (1.3.7)
where the potential of the inflaton V (φ) is left unspecified for now, and the shape of
the potential is still an area of extensive research and discussion today [85, 86]. From
this action, we can use the definition (1.1.7) to find the energy-momentum tensor of φ
to be
Tµν = ∂µφ∂νφ− gµν[
1
2gρλ∂ρφ∂λφ+ V (φ)
], (1.3.8)
and the equation of motion for φ is
∂
∂φ
(√−g[−1
2gµν∂µφ∂νφ− V (φ)
])= − gµν√−g ∂µ
(√−g ∂νφ)− ∂V
∂φ= 0 . (1.3.9)
As explained previously, we assume a flat Universe (K = 0, since curvature can never
have dominated the Universe) and in an FLRW Universe (see (1.1.1)) this equation of
motion becomes
φ+ 3Hφ+ V,φ = 0 , (1.3.10)
which is called the Klein–Gordon equation, and we have assumed that φ is homoge-
neous and we recall that a dot is a derivative with respect to cosmic time t and a
subscript “, φ” denotes a derivative with respect to the field φ. Since φ is a scalar
field, and hence has only one degree of freedom, it has no anisotropic stress and can
be identified as a perfect fluid, and therefore by comparing (1.3.8) for flat space with
28

Tµν = diag (ρ, P, P, P ) for a perfect fluid, φ has energy density and pressure given by
ρ =φ2
2+ V (φ) (1.3.11)
P =φ2
2− V (φ) , (1.3.12)
and we can therefore write the equation of state of φ as
w =P
ρ=
12φ2 − V (φ)
12φ2 + V (φ)
. (1.3.13)
From (1.3.12), we see that in order to have negative pressure, as is required to ensure
inflation is realised, we need to have
V (φ) >φ2
2, (1.3.14)
which mean that the potential energy must dominate over the kinetic energy if we have
an inflating universe. Also note that with the forms of energy density and pressure given
by Eqs. (1.3.11) and (1.3.12), we can find the equation of motion (1.3.10) by plugging
these into the continuity equation (1.1.15), and we find the Friedmann equation (1.1.12)
for the inflaton φ is
H2 =12φ2 + V (φ)
3M2Pl
. (1.3.15)
For given initial conditions on φ and φ and any potential V (φ), the Klein–Gordon equa-
tion (1.3.10), together with the Friedmann equation (1.3.15), can be solved, although
numerical methods must often be used, to give the dynamics of the inflaton. For a
given potential, inflation will persist as long as P < −ρ/3, and when this condition
fails, inflation will end and a phase of reheating is assumed to take place which fills
the universe with the particles of the standard model.
29

1.3.3 Slow-roll inflation
While numerical solutions to (1.3.10) can be useful, it is helpful to consider cases when
analytical solutions exist and this is the case when the inequality in Eq. (1.3.10) is
extreme, i.e. V (φ) φ2. From Eqs. (1.3.11) and (1.3.12), this means that P ' −ρand hence the continuity equation (1.1.15) gives ρ ' 0, i.e. the energy density of the
inflaton field is approximately constant. In turn, the Friedmann equation (1.1.12) then
tells us that H = a/a can be taken to be constant and hence the scale factor is given
by
a(t) ' ain exp [H (t− tin)] . (1.3.16)
This means space-time is very close to de Sitter space (in which the ' here is an exact
equality), and we see that inflation does in fact give us exponential expansion. This
motivates the study of solutions of (1.3.10) in this V (φ) φ2 limit, which we call
the “slow-roll” approximation because the kinetic energy is much smaller than the
potential energy and hence the inflaton “slowly rolls” down its potential.
In order to explicitly parameterise the deviations from de Sitter space, we in-
troduce a set of hierarchical quantities called the “slow-roll parameters”
εi+1 =d ln |εi|
dN=
1
εi
d |εi|dN
, (1.3.17)
where ε0 = Hin/H, Hin is the value of the Hubble parameter at the initial time tin,
dN = d ln a = Hdt, and N is the number of “e-folds” of inflation, which we will often
use as our time coordinate. Typically, each εi is of the same order of magnitude and
slow-roll inflation is defined by the condition εi 1 ∀i > 0. For example, the first
slow-roll parameter is
ε1 = − H
H2= 3
12φ2
V (φ) + 12φ2, (1.3.18)
where the second equality follows by using H = −φ2/(2M2Pl), which is found by insert-
ing the Klein–Gordon equation in the time derivative of the Friedmann equation. In
30

terms of the scale factor, ε1 can be written as
ε1 = 1− aa
a2, (1.3.19)
and hence the condition for inflation a > 0 is equivalent to ε1 < 1. The slow-roll
condition V (φ) φ2 also ensures that ε1 1, and hence ensures inflation is easily
realised. We also have, from (1.3.13), that the equation of state for the inflaton is
w = −1 +2ε13' −1 , (1.3.20)
as previously stated in table (1.1), and we see that the slow-roll parameter ε1 param-
eterises the deviation from the de Sitter value w = −1.
There are several nice consequences of the slow-roll assumption. For example,
implementing V (φ) φ2 in (1.3.15) tells us that in slow roll we have the simplified
Friedmann equation
H2 ' V (φ)
3M2Pl
, (1.3.21)
which is valid at leading (zeroth) order in the slow-roll parameter ε1. If we then consider
the second slow-roll parameter ε2 (which tells us the relative change in ε1 in one e-fold)
we find
ε2 =H
HH− 2
H
H2= 6
(ε13− V,φ
3Hφ− 1
), (1.3.22)
which comes from (1.3.17) and by noting that
H =3Hφ2
M2Pl
+φV,φM2
Pl
, (1.3.23)
which is found by using the Klein–Gordon equation and the time derivative of our
previously found expression H = −φ2/(2M2Pl). By considering the condition ε2 1,
we see that, at leading order in slow roll, φSR ' −V ′/(3H), which is equivalent to
neglecting the second derivative term in the Klein–Gordon equation (1.3.10). This is
31

a powerful result because it takes the equation of motion from second order to first
order, and thus removes a dependence on the initial velocity of the field, and the
kinetic energy is now entirely specified by the gradient of the potential. The form of
the potential entirely specifies the dynamics of the inflaton and there is just a single
trajectory through phase space (we call this trajectory the “slow-roll attractor”).
We can calculate the length of time that slow-roll inflation lasts for by rewriting
the slow-roll equation of motion with the number of e-folds N as the time variable, so
dφSR
dN' − V,φ
3H2, (1.3.24)
where we recall that dN = Hdt and that this is at leading order in slow roll (i.e. we
neglect terms that are ∝ ε1). By first inserting the slow-roll Friedmann equation
(1.3.21), this can be integrated to give
∆NSR ≡ Nend −Nin =
∫ Nend
Nin
dN ' − 1
M2Pl
∫ φend
φin
V
V,φdφ , (1.3.25)
where φin is the value of the inflaton at an inital time Nin and φend is the field value at
some end time Nend. For a given potential V (φ), this expression can then be inverted
to give φ(N). Recall that this is only valid at leading order in slow roll, and one
can perturbatively include corrections to this slow-roll trajectory, and the limit of this
expansion gives the slow-roll attractor in phase-space [87], which confirms that the
slow-roll approximation is not only simple but is also physically motivated.
In the slow-roll approximation, the hierarchy of slow-roll parameters (1.3.17)
can be rewritten in terms of the potential and its derivatives. This can be done by
noting that (1.3.24), together with the Friedmann equation (1.3.21), gives
d
dN' −M2
Pl
V,φV
d
dφ, (1.3.26)
32

and hence the slow-roll parameters at leading order (LO) are given by
εLO0 ' Hin
√3M2
Pl
V(1.3.27)
εLO1 ' M2
Pl
2
(V,φV
)2
(1.3.28)
εLO2 ' 2M2
Pl
[(V,φV
)2
− V,φφV
](1.3.29)
εLO3 ' 2M4
Pl
εSR2
[2
(V,φV
)4
− 3V,φφV
2,φ
V 3+V,φφφV,φV 2
], (1.3.30)
and higher order parameters can continue to be calculated in the same way. We
reiterate that these expressions are only valid in slow roll. In this form, the first slow-
roll parameter εSR1 tells us that the potential of the inflaton needs to be sufficiently flat
in order to support inflation, that is ε1 1 if
dV
dφ V
MPl
, (1.3.31)
which hence provides a necessary (but not sufficient) condition for slow-roll inflation.
Beyond this required flatness, there is little known about the shape of the inflatons
potential, and a priori it can take a large range of different shapes. If one wants to
derive the next-to-leading order expressions for the quantities given above, this can be
done by noting the Friedmann equation can be written (exactly) as
H2 =V (φ)
3M2Pl
(1− ε1
3
) . (1.3.32)
Combining this with Eq. (1.3.15), gives us
φ2 = 2V (φ)ε1
3− ε1, (1.3.33)
33

and then we can write
dN = ± 1
MPl
dφ√2ε1
. (1.3.34)
Using these relations, the next-to-leading-order in slow roll expressions can be obtained
to be
εNLO0 = εLO
0
(1− εLO
1
6
)
εNLO1 = εLO
1
(1− εLO
2
3
)
εNLO2 = εLO
2
(1− εLO
2
6− εLO
3
3
)
εNLO3 = εLO
3
(1− εLO
2
3− εLO
4
3
),
(1.3.35)
and we note that we can continue to calculate more slow-roll parameters in the same
way, and similarly we can calculate these parameters at higher and higher order.
1.3.4 Inflationary perturbations
One of the huge successes of inflation is that, in addition to providing a solution for
the classical Hot Big Bang problems, when combined with quantum mechanics it pro-
vides a natural explanation for the CMB anisotropies and the large-scale structure of
the Universe. These deviations from homogeneity and isotropy arise from the vacuum
quantum fluctuations of the coupled inflaton and gravitational fields, and are pre-
dicted to have an almost scale-invariant power spectrum, which matches observations
[13]. Since the slow-roll attractor of inflation is so strong, many models of inflation
make the same prediction of an almost scale invariant power spectrum, and the devia-
tions from scale invariance (i.e. deviations from a massless field in de Sitter, where H
is approximately constant) probe the shape of the inflaton potential and characterise
the deviations from flatness of the potential. As such, measurements of the CMB
anisotropies allow us to constrain the inflationary potential V (φ). In this section, we
will discuss inflationary perturbations and demonstrate some key features of the pre-
dictions of (slow-roll) inflation. We will review the standard approach to inflationary
34

perturbations here, while in Chapter 3 we introduce the stochastic formalism for in-
flationary perturbations, which seeks to also include the non-perurbative backreaction
effects of field fluctuations of the background equations.
Beyond homogeneity and isotropy, we can expand the metric about the flat
FLRW line element (1.1.3)
ds2 = a2(η)−(1 + 2A)dη2 + 2∂iBdxidη + [(1− 2ψ)δij + 2∂i∂jE] dxidxj
,
(1.3.36)
where a is the scale factor, and A, B, ψ and E are scalar fluctuations. Here, A is
called the lapse function perturbation and represents a fluctuation in the proper time
interval with respect to the coordinate time interval.
By perturbing the Klein–Gordon equation and the Einstein equations according
to Eq. (1.3.36), and rewriting the resultant equation in Fourier space (∇2 → −k2), one
finds the equation of motion for scalar perturbations in an FLRW metric. At linear
order, and for a given comoving wavenumber k, this is given by [88, 89]
¨δφk + 3H ˙δφk +
(k2
a2+ V,φφ
)δφk = −2V,φAk + φ
[Ak + 3ψk +
k2
a2
(a2Ek − aBk
)].
(1.3.37)
The metric perturbations that feature in the right-hand side of Eq. (1.3.37)
satisfy the Einstein field equations (1.1.9), and in particular the energy and momentum
constraints
3H(ψk +HAk
)+k2
a2
[ψk +H
(a2Ek − aBk
)]= − 1
2M2Pl
[φ(
˙δφk − φAk)
+ V,φδφk
],
(1.3.38)
ψk +HAk =φ
2M2Pl
δφk , (1.3.39)
35

which come from the 00 (energy) and 0i (momentum) components respectively. Intro-
ducing the Sasaki–Mukhanov variable [90, 91]
Qk = δφk +φ
Hψk , (1.3.40)
and using Eqs. (1.3.38) and (1.3.39) to eliminate the metric perturbations, Eq. (1.3.37)
can be rewritten as
Qk + 3HQk +
[k2
a2+ V,φφ −
1
a3M2Pl
d
dt
(a3
Hφ2
)]Qk = 0 . (1.3.41)
Note that (1.3.41) takes a simple and familiar form in the spatially flat gauge,
which corresponds to the choice ψ = 0, and in which case we define vk = aQk, which
has equation of motion
v′′k +
(k2 − z′′
z
)vk = 0 , (1.3.42)
where a prime denotes a derivative with respect to conformal time η, and we have
defined
z = a√
2ε1 MPl . (1.3.43)
Eq. (1.3.42) is known as the Sasaki–Mukhanov equation, and it is particularly useful
because vk is related to the gauge-invariant curvature perturbation ζk (see Eq. (1.5.2))
through
vk = zζk , (1.3.44)
with z defined as above. This can easily be seen to take the form of a harmonic
oscillator by defining
ω2(η, k) = k2 − z′′
z, (1.3.45)
and hence Eq. (1.3.42) is v′′k +ω2(η, k)vk = 0, i.e. a harmonic oscillator with frequency
ω. Let us note that in the case of constant ε1, we simply have ω2(η, k) = k2 − a′′/a.
Since, during inflation, a ∝ exp(Ht), this further simplifies to ω2(η, k) = k2 − 2/η2.
36

This allows us to describe the different behaviours of this variable at different times.
At early times, |η| |k|, and hence ω2 ' k2, which means that the Sasaki–Mukhanov
variable oscillates with constant frequency and vk ∝ cos(kη). On the other hand, at
late times (|η| |k|) we have ω2 ' −2/η2, and hence vk ∝ −1/η + η2 ' −1/η, as
discussed in more detail below.
One can show that, in full generality z′′/z = H2(2− ε1 + 3ε2/2− ε1ε2/2 + ε22/4 +
ε2ε3/2), where H = a′/a is the conformal Hubble parameter. For future use however,
instead of working with the second and third slow-roll parameters, it will be more
convenient to work with the field acceleration parameter
f = − φ
3Hφ= 1 +
1
3HφV,φ (1.3.46)
and the dimensionless mass parameter
µ =V,φφ3H2
, (1.3.47)
in terms of which
z′′
z= H2
(2 + 5ε1 − 3µ− 12fε1 + 2ε21
), (1.3.48)
see Appendix B.
Solution in the slow-roll limit
At leading order in slow roll, the slow-roll parameters can simply be evaluated at the
Hubble-crossing time η∗ ' −1/k∗, since their time dependence is slow-roll suppressed,
i.e. ε1 = ε1∗ +O(ε2), etc. At that order, we begin by writing
z′′
z≡ ν2 − 1
4
η2, (1.3.49)
where ν2 = 9/4 + 3ε1∗ + 3ε2∗/2 can be taken as constant at leading order in slow roll,
and we have used the fact that H ' − 1η
(1 + ε1∗). At that order, the Sasaki–Mukhanov
37

equation has the generic solution
vk (η) =√−η [AJν (−kη) +BYν (−kη)]
=√−η
[αH(1)
ν (−kη) + βH(2)ν (−kη)
],
(1.3.50)
where we recall that conformal time η runs from −∞ to 0 during inflation. In
Eq. (1.3.50), Jν is the Bessel function of the first kind, Yν is the Bessel function of
the second kind, A, B, α and β are constants, and the second line follows from
H(1)ν = Jν + iYν , (1.3.51)
H(2)ν = Jν − iYν , (1.3.52)
where H(1)ν is the Hankel function of the first kind, and H
(2)ν is the Hankel function of
the second kind.
In order to fix the constants α and β, we need to set our initial conditions.
However, this is not a simple task, since the mode functions in (1.3.42) have a time-
dependent frequency and hence defining a vacuum state is difficult. However, we avoid
this problem by noticing that in the sub-Hubble (early time) limit we have |kη| 1
and we can neglect this time dependence and asymptotically define a ground state,
known as the Bunch–Davies vacuum, which serves as our inital condition and is given
by [92]
limη→−∞
vk(η) =e−ikη√
2k. (1.3.53)
We implement this initial condition by making use of the following asymptotic be-
haviour for the Hankel functions
limkη→−∞
H(1)ν (−kη) =
√2
π
1√−kη eikηei
π2 (ν+ 1
2)
limkη→−∞
H(2)ν (−kη) =
√2
π
1√−kη e−ikηe−i
π2 (ν+ 1
2) .
(1.3.54)
38

Thus
limkη→−∞
vk (η) =
√2
πk
[αei
π2 (ν+ 1
2)eikη + βe−iπ2 (ν+ 1
2)e−ikη]
=e−ikη√
2k. (1.3.55)
By comparing the two expressions in this equation, we conclude that α = 0 and
β =√π2
(where the irrelevant phase factor e−iπ2 (ν+ 1
2) is dropped). Thus the Bunch–
Davies modes at first order in slow roll are
vk (η) =
√−πη2
H(2)ν (−kη) . (1.3.56)
We now have the slow-roll result for vk, and can use it to find some interesting
physical quantities. For example, we can use the fact that vk = zζk to calculate the
curvature perturbation ζk. For this, we need to find the behaviour of z in the slow-roll
regime. This is done by solving (1.3.49), which has general solution
z = C1(−η)12−ν + C2(−η)
12
+ν . (1.3.57)
Now note that 12− ν ≈ −1 and 1
2+ ν ≈ 2, so since η is increasing from −∞ to 0,
we have that η−1 is the growing mode, and η2 is the decaying mode, and hence in the
late-time expansion and at leading order in slow roll we take
z ∝ (−η)12−ν . (1.3.58)
More specifically, we have
z = a∗√
2ε1∗MPl
(η
η∗
) 12−ν
, (1.3.59)
39

where η∗ is some reference time such that z = a∗√
2ε1∗MPl when η = η∗. At late times,
the second Hankel function behaves as
lim−kη→0
H(2)ν (−kη) =
i
πΓ(ν)
(−kη
2
)−ν, (1.3.60)
where Γ(ν) in the Gamma function, and hence in this limit
vk (η) =iΓ(ν)
2
√−ηπ
(−kη2
)−ν. (1.3.61)
Then, in the super-horizon limit, we have
ζk =vkz
=i
2MPl
(k∗k
) 32 (−η∗)
12
a∗√ε1∗
= constant , (1.3.62)
where we have also use η∗ = −1/k∗. This demonstrates that at late time in slow roll,
the curvature perturbation ζ is constant on super-horizon scales.
We can also calculate the power spectrum of curvature fluctuations, Pζ , using
Pζ = z−2Pv , (1.3.63)
where we note that Pv ≡ |vk|2. Using this, and Eq. (1.3.59), we find
Pζ =π
4
(−η∗)1−2ν
a2∗ε1∗
(−η)2ν
2M2Pl
∣∣H(2)ν (−kη)
∣∣2 (1.3.64)
Then, in the super-horizon limit, kη → 0, we use (1.3.60) to find
Pζ =Γ2(ν)
2M2Pla
2∗ε1∗
(2
k
)2ν(−η∗)1−2ν
4π, (1.3.65)
and hence
Pζ ≡k3
2π2Pζ =
Γ2(ν)
16π3M2Pl
k3−2ν (−η∗)1−2ν22ν
a2∗ε1∗
, (1.3.66)
40

which is noticeably independent of conformal time η, and hence on the large scales
that this expression is valid on, curvature perturbations are constant, confirming what
is claimed above. At leading order in slow roll (i.e. ν = 3/2), this simplifies nicely to
Pζ =
(H∗2π
)2(dN
dφ
)2
, (1.3.67)
where each function is evaluated at horizon crossing (k∗ = a∗H∗), and we have used
the identity
2M2Plε1 =
dφ
dN. (1.3.68)
We usually evaluate the power spectrum around some pivot scale, where the pivot scale
k∗ is usually taken to be the scale best constrained by observations (see [17]). We can
also calculate the spectral index ns, which is defined as
ns − 1 =d lnPζd ln k
= 3− 2ν , (1.3.69)
from which we can see that if we take ν = 32
(ε1 = ε2 = 0), we have exact scale
invariance, and hence the slow-roll parameters also parameterise the amount of scale
dependence one has in the power spectrum. Note also that, by definition, ε1 ≥ 0, and
inflation occurs for ε1 < 1, so if we take inflation to end at ε1 = 1 then it is natural
to assume that ε1 increases during inflation and thus ε2 > 0 in slow roll. Together,
these conclusions predict, that, in slow roll ns < 1 is slightly “red”, rather than exactly
scale invariant or “blue” (ns > 1), which is consistent with current observations which
exclude exact scale invariance at more than a 5σ confidence level, see Sec. 1.4.1.
Note that once the slow-roll approximation breaks down, the Sasaki–Mukhanov
equation is hard to solve because one cannot take the slow-roll parameters to be ap-
proximately constant. This is one of the reasons that the slow-roll limit is so well-
studied. Further methods need to be developed in order to solve beyond slow-roll, see
Appendix C for a discussion on this.
41

As well as scalar perturbations, we can also consider vector and tensor pertur-
bations to the spacetime metric during inflation. While vector perturbations decay
during inflation (due to the conservation of angular momentum), tensor perturbations
can be studied in the same way as scalar perturbations. There is one subtlety that
arises here, which is the fact that there are two separate helicities for tensor perturba-
tions, denoted h+ and h−. The two helicities come from the fact that we impose two
requirements, namely that tensor perturbations are transverse ∂ihij = 0 and trace-free
hii = 0.
Following the same reasoning as for scalar perturbations, we arrive at an anal-
ogous equation to Eq. (1.3.42) for tensor perturbations, namely
h′′± + 2Hh′± + k2h± = 0 . (1.3.70)
where H = a′/a. By proceeding in the same way as we did for scalars, and allowing
for the two helicities, we can compute the power spectrum of tensor perturbations to
be
Ph(k) ' 8
M2Pl
(H
2π
)2
' 2V
3π2M4Pl
, (1.3.71)
where functions here should be evaluated at the scale k, usually taken to be at horizon
crossing k∗ = a∗H∗. Finally, we can define a parameter called the tensor-to-scalar ratio
as
r =Ph(k)
Pζ(k)' 16ε1 , (1.3.72)
which can be constrained by cosmological data such as the CMB, and where the second
equality is valid in slow roll.
1.4 Modern problems in cosmology
While we have outlined a well understood timeline for the evolution of the Universe
above, there are many aspects of these events that are not well understood. As such,
42

it is fair to conclude that our understanding of fundamental physics is incomplete. In
this section, we will discuss several of these open problems of modern cosmology and
explore their origin and possible explanations. The list of problems that we discuss is
not an exhaustive list of all the questions that still exist, and examples of open problems
that we do not discuss in detail here include the cosmological constant problem (why
is the measured vacuum energy so different to the predicted value from theory?) [93],
and the origin of matter-antimatter asymmetry [26].
1.4.1 Inflationary constraints and model selection
We have seen that inflation offers natural solutions to the classical problems of the
Hot Big Bang model and also provides the seeds for the large-scale structure of the
Universe, but in theory many possible models of inflation exist and using observations
to select the physically relevant ones is an important open question in cosmology.
As before, we assume inflation is driven by a single scalar field and discuss
the current constraints on such inflationary models and which models are currently
favoured by data. This discussion is mainly based on Fig. 1.7, which is taken from [72]
and uses the final data release of the Planck satellite in 2018.
Planck observed the CMB in nine wavelength bands, ranging from 1cm to 13mm
[13], which corresponds to wavelengths from microwaves to the very-far-infrared. The
wavelength range, along with with high sensitivity and small angular resolution allowed
Planck to map the CMB in more detail than ever before. At the range of scales that
the CMB is sensitive to, the Planck mission found no evidence of slow-roll violation
for inflation [72], and hence the models discussed here are assumed to be in slow roll.
The Planck observations for the spectral index ns and the tensor-to-scalar ratio
r at k = 0.002Mpc−1 can be compared to theoretical prediction from potential models
of inflation to see which models fit the data well. Assuming a ΛCDM cosmology,
combining Planck data with BAO data, the constraint on the spectral index is ns =
0.966± 0.0038 at 68% confidence level. By also using B-mode polarisation data from
43

0.94 0.96 0.98 1.00
Primordial tilt (ns)
0.0
00.
05
0.1
00.1
50.2
0
Ten
sor-
to-s
cala
rra
tio
(r0.0
02)
Convex
Concave
TT,TE,EE+lowE+lensing
TT,TE,EE+lowE+lensing+BK15
TT,TE,EE+lowE+lensing+BK15+BAO
Natural inflation
Hilltop quartic model
α attractors
Power-law inflation
R2 inflation
V ∝ φ2
V ∝ φ4/3
V ∝ φV ∝ φ2/3
Low scale SB SUSYN∗=50
N∗=60
Figure 1.7. Planck 2018 marginalised joint 68% and 95% CL regions (assuming dns/d ln k =0) for the spectral index ns and the tensor-to-scalar ratio r at k = 0.002Mpc−1 from Planckalone and in combination with BK15 or BK15+BAO data, compared to the theoretical predic-tions of selected (slow-roll) inflationary models. Image credit: Planck collaboration[72].
BICEP2/Keck field (BK 15) [94], the tensor-to-scalar ratio is constrained to be r0.002 <
0.056 at 95% confidence level.
To compare with this data, a selection of models are chosen, including several
monomial potentials, R2 inflation [54], α attractors [95, 96], and natural inflation
[97, 98], and ns and r are calculated in these models. These calculations are each done
at first order in slow roll, are performed at a scale k = 0.002Mpc−1, and include an
uncertainty in the number of e-folds of 50 < N∗ < 60. The comparison between theory
and data is shown in Fig. 1.7, and we make some comments about the conclusions
here.
First of all, we see that monomial potentials of the form V (φ) ∝ φp are strongly
ruled out for p > 2, and once B-mode data is included even potentials with 1 < p <
2 are disfavoured compared to, say, the R2 model of inflation. Out of the models
considered here, R2 inflation is the best fit to the data, while α attractors can also fit
44

the data well, but can do so because of an additional degree of freedom in the model,
compared to R2 inflation. While natural inflation is now disfavoured by the Planck
2018 data, the Hilltop quartic model [99] provides a very good fit for a large swathe of
its parameter space.
However, while this data reduces the number of models that are physically
viable, there are still many models that are consistent with the data. Indeed, models
such as α attractors can tune their parameters so that they can satisfy almost all
current and future observations. This means that improved data will not rule out
models like this, but can be used to constrain the values of their parameters. While
more complicated Bayesian analysis for model selection in light of the Planck data is
possible (see for example [100]), it is unlikely that any future data will be able to select
a unique, viable model for inflation, although improved data will indeed continue to
rule out models [101] and shrink the parameter space of viable models.
1.4.2 Dark energy
With a plethora of evidence for a dark energy component (see, for example, [102]) of
the Universe that dominates at late (current) times, it is now widely accepted that this
component exists, although the nature of dark energy remains elusive. The leading
paradigm for dark energy is that of a cosmological constant Λ (see [103] for a review
on the cosmological constant), i.e. a perfect fluid with an equation of state w = −1.
The evidence for dark energy is summarised in Fig. 1.8, which shows a combination
of evidence from CMB, supernovae (SNe) and baryon acoustic oscillations (BAO),
and their agreement in the ΩΛ − Ωm plane. As stated previously, we see evidence
for ΩΛ ' 0.69 [17], and conclude that dark energy is the dominant component of the
Universe today.
Beyond the cosmological constant, a popular alternative is to assume a dark
energy fluid with an equation of state that varies with time. For example, one possible
45

Figure 1.8. Evidence for dark energy. Shown are a combination of observations of thecosmic microwave background (CMB), supernovae (SNe) and baryon acoustic oscillations(BAO). Image credit: Supernova Cosmology Project [104].
parameterisation is to allow w to vary as a function of the scale factor a as
w(a) = w0 + wa(1− a) , (1.4.1)
where w0 and wa are constants. Note that a cosmological constant would correspond
to w0 = −1 and wa = 0. In Fig. 1.9, we show results from the Baryon Oscillation
Spectroscopic Survey (BOSS), part of the Sloan Digital Sky Survey III, which in the
left panel constrains the curvature and a non-varying dark energy equation of state to
be consistent with 0 and −1 respectively, and in the right panel constrains the extended
model (1.4.1) for a varying equation of state and finds consistency with a cosmological
constant.
46

0.06 0.04 0.02 0.00
ΩK
1.65
1.50
1.35
1.20
1.05
0.90
w
PLANCK+SN
PLANCK+BAO
PLANCK+BAO+FS
PLANCK+BAO+FS+SN
1.8 1.5 1.2 0.9 0.6 0.3 0.0
w0
1.5
1.0
0.5
0.0
0.5
1.0
1.5
wa
PLANCK+SN
PLANCK+BAO
PLANCK+BAO+FS
PLANCK+BAO+FS+SN
Figure 1.9. Evidence for zero curvature and a cosmological constant. Parameter constraintsfor the owCDM (left) and w0waCDM (right) cosmological models, comparing the results fromBAO and BAO+FS to those with JLA SNe. Image credit: BOSS [105].
To demonstrate the similarities between dark energy and inflation, let us note
that late-time accelerated expansion can be achieved with a scalar field, which we
call the “quintessence field” Q, which behaves just like the inflaton except that it
dominates at late times rather than early times. In this case, the equation of state for
the quintessence field is given by
wQ =12Q2 − V (Q)
12Q2 + V (Q)
, (1.4.2)
and so has an equation of state that varies in the same way as the inflaton, see
Eq. (1.3.13). This explanation for dark energy differs from the cosmological constant
because the scalar field is dynamical over time, while a constant Λ, by definition, does
not.
These different models of dark energy may be constrained through improved
measurements of the equation of state w and its evolution (or lack thereof) and how
this affects observations such as the CMB and the matter power spectrum, or through
observations the dark energy speed of sound, although this is currently much less
47

constrained [106]. Let us also note that the late time acceleration of the Universe may
be due to a large-scale modification to gravity that we do not yet understand [107–110].
Currently, there is not sufficient data to rule out or isolate a best candidate for dark
energy, meaning that we currently lack a fundamental understanding of the dominant
constituent of our Universe. As such, there is much research activity on dark energy
at this time and its nature remains an open question [111].
1.4.3 Dark matter
There is a significant amount of evidence [112] that approximately 80% of the matter
in the Universe is contained in non-baryonic matter that does not interact via elec-
tromagnetism, but does interact with gravity, making it very hard to detect. We use
the term “dark matter” to refer to this hypothetical matter, and additionally, classify
dark matter as “cold” or “hot” depending on its typical velocity, with cold dark matter
(which moves with non-relativistic velocity) currently favoured by observations, as the
dark matter must cluster to form the large scale structure of the universe.
The need for dark matter was first noticed in the 1930’s with the work of Lund-
mark and Zwicky [113], who noted that galaxies in the Coma cluster were moving
too quickly to be explained by the visible matter in the cluster, leading to the hy-
pothesis that something massive and dark must be providing additional gravitational
pull. Later, in the 1970’s, Rubin et al [114] found more evidence for dark matter
when studying galactic rotation curves, leading to the dark matter paradigm becom-
ing widely accepted. For a more detailed review of the history of dark matter, see Ref.
[115].
In this section, we outline some of the evidence for dark matter, and then discuss
some of the leading candidates for this elusive constituent of the Universe.
48

Evidence for dark matter:
We will first discuss some of the evidence for dark matter. We include, arguably, some
of the most convincing evidence for dark matter, but note that more evidence exists
for dark matter, for example Lyman-α forest observations [116].
Galaxy rotation curves: This piece of evidence refers to measuring the ro-
tation velocities of visible stars and gas within disk galaxies (elliptical galaxies have
random motion within them) as a function of distance from the centre of the galaxy.
For a spiral galaxy, the density of visible matter decreases with radius from the centre
of the galaxy, and hence the usual dynamics of Kepler’s Second Law (i.e. Newtonian
dynamics) predict the velocity of stars further from the centre to orbit the galaxy
slower than those in the centre where gravity should be stronger due to the higher
density of mass. This is what we observe in systems such as our solar system. How-
ever, rather than decreasing in this way, rotation curves of galaxies are observed to be
flat, out to large radii from the galaxy centre [117]. These flat rotation curves have
been seen in all galaxies that have been studied, including the Milky Way [118], and
the visible stars and gas observed in these galaxies cannot provide the force to speed up
these orbits sufficiently. If one postulates that these galaxies contain large amounts of
additional, unseen (dark) matter, then these rotation curves can be explained. This fit
is demonstrated in Fig. 1.10, where the galactic rotation curve for NGC 6503 is shown.
The matter of the stars and gas contained in the disk alone cannot fit the observed
velocity, but the existence as a large “dark matter halo”, making up over 95% of the
mass of the galaxy provides the gravity to explain these rotation curves.
Note that rotation curves can only be observed as far out as there is visible
matter or neutral hydrogen, which does not allow us to trace the full extent of the
dark matter halo. This limitation is not shared with gravitational lensing probes of
dark matter discussed next.
49

Figure 1.10. Galactic rotation curve for NGC 6503, showing the disk and gas contribution,as well as an additional dark matter halo contribution that is needed to match the data.Image credit: Katherine Freese [119]
Gravitational lensing: As a consequence of GR, massive objects such as
galaxy clusters can warp spacetime and act as a lens for distant objects, i.e. a lens
between an observer and, say, a distant quasar will warp the image of the quasar seen by
the observer. The more massive the lens, the more extreme the warping is, so observing
more extreme lensing events means the lens is more massive. This phenomenon can
be used to probe the existence and distribution of mass in the Universe, even if that
mass is “dark”, and many lensing observations confirm the existence of dark matter,
both in galaxies and clusters of galaxies.
For example, strong lensing observations of the Abell 1689 cluster [120] provide
mass measurements for the cluster, which are again much higher than the mass in
visible matter in the cluster. Weak lensing can also be used map underlying dark
matter halos in the Universe, and for instance SDSS used weak lensing to identify the
fact that galaxies (including the Milky Way) are much more massive than the visible
light suggests, leading to the requirement of a large dark matter halo for each galaxy
[121].
50

Figure 1.11. Left panel: optical images from the Magellan telescope with contours of spatialdistribution of mass, from gravitational lensing. Right panel: the same contours plotted overChandra x-ray data that traces hot plasma in the galaxy. We see that most of the matter innot found in the visible plasma, which felt the friction of the collision and slowed down, butis in a dark matter halo further out which feels gravity but not electromagnetic friction andhence traveled further in the merger. Image credit:[122]
Bullet Cluster: The Bullet Cluster [122] is a cluster of galaxies formed from the
collision of two smaller galaxy clusters. Gravitational lensing of background galaxies
of the Bullet Cluster allow us to map the mass of the Bullet Cluster, which can then
be compared to electromagnetic observations of the visible matter in the cluster. In
Fig. 1.11, we can see that the majority of the mass in the cluster is not located where the
bulk of the baryons are observed, providing evidence of two distinct types of matter -
baryons and dark matter - that behave differently in the collision. The baryons interact
both electromagnetically and gravitationally, and feel a “friction” in the collision that
slows them down and causes them to cluster more easily in the centre. However, the
dark matter feels no friction and moves through the collision more easily, only being
bound by gravity, and forms a much larger halo.
CMB: There is also evidence for dark matter in the anisotropies of the CMB.
Since dark matter and baryons behave differently (even though they are both matter),
the CMB is sensitive to both of these types of matter in different ways. In the early
Universe, baryons are ionised and interact strongly with radiation (through Thompson
scattering), while dark matter is neutral, and so only interacts gravitationally (and via
its effect on the density and velocity of baryons) with the CMB. Hence, the perturba-
51

tions of dark matter and perturbations of baryons evolve differently and leave different
imprints on the CMB.
The photons of the CMB underwent oscillations that “froze in” at the time
of decoupling, and the angular scale and heights of the peaks and troughs of these
oscillations provide a powerful probe of cosmological parameters, including the total
energy density, the baryonic fraction, and the dark matter component, as shown in
Fig. 1.12. We can use the sound horizon to probe the geometry of the Universe. If the
Universe is spatially flat, then the angular scale of the first Doppler peak is predicted
to be found at 1 deg [119], which is precisely what we see in the power spectrum in
Fig. 1.12, suggesting that the Universe is indeed flat. The height of the second peak of
the power spectrum corresponds to ordinary baryonic matter making up ∼ 5% of the
energy density of the Universe, while the third peak tells us that ∼ 26% of the energy
density is in dark matter. It is difficult to reproduce this evidence for dark matter
with competing explanations, such as modified Newtonian dynamics (MOND) [123].
Additionally, a few small galaxies have been observed that contain no dark matter
[124], which would not be possible if dark matter came from modifications to gravity
Finally, let us note that without dark matter, the large scale structure of the
Universe could not have formed by the present time (and we would fail to exist). Before
recombination, the baryons were coupled to photons (the Universe is ionised) and so
both photons and baryons stream away and stop structure forming. However, the dark
matter is not coupled to radiation and can hence collapse and begin to form structure.
This provides potential wells that baryons can later fall into after recombination and
form the structure we see today. This also provides evidence that the dark matter is
cold, rather than hot. Relativistic dark matter would stream in the same way that
photons did, and hence non-relativistic cold dark matter has become the accepted
paradigm.
52

Figure 1.12. Planck’s power spectrum of temperature fluctuations in the cosmic microwavebackground. The fluctuations are shown at different angular scales on the sky. Red dots witherror bars are the Planck data. The green curve represents the standard model of cosmology,ΛCDM. The peak at 1 degree is consistent with a flat geometry of the universe, the heightof the second peak with 5%, and the second and third peaks with 26% dark matter. Imagecredit: ESA and the Planck Collaboration[125]
Candidates for dark matter:
While there is much evidence for a cold dark matter component to the Universe, we
know about the nature of dark matter. While a breakdown of our theories of gravity
on galactic scales is a possible explanation for the observations of dark matter, here
we will mention a few of the leading candidates for “particle” dark matter, although
we note that this is not an exhaustive list.
WIMPS: Weakly interacting massive particles (WIMPs) are a popular candi-
date for cold dark matter. A WIMP is a hypothetical elementary particle that only
interacts via gravity and the weak nuclear force (and possibly any other unknown force
beyond the standard model that is as weak, or weaker, than the weak force). WIMPs
in the mass range of ∼ 100 GeV can offer the correct dark matter abundance that
53

is observed today [126, 127], and the “WIMP miracle” refers to the fact that the su-
persymmetry (SUSY) extension of the standard model of particle physics predicts a
particle in this mass range that only interacts via the weak force (and gravity). Thus,
a stable SUSY particle is a long-proposed WIMP candidate for dark matter.
While the WIMP is a popular candidate for dark matter, both indirect and
direct searches for WIMPs have failed to have any positive detections, and the Large
Hadron Collider (LHC) has also failed to find evidence for SUSY. Indirect searches for
WIMPs, such as the Fermi-LAT gamma ray telescope [128], look for excess gamma
rays that can be produced when WIMPs interact with themselves. Direct detectors
attempt to observe the effects of a WIMP collision with a heavy nucleus in a sensitive
system set up on Earth. For example, noble gas scintillators produce a pulse of light
when the nucleus of an atom interacts with a WIMP. The XENON1T detector [129]
uses 3.5 tons of liquid xenon (even larger experiments are planned for the future),
although no detections of dark matter WIMPs have yet occured.
Axions: The axion is a hypothetical elementary field (and hence, particle)
which was proposed by Peccei and Quinn in 1977 [130, 131] as a solution to the “strong
CP problem” of quantum chromodynamics (QCD). An axion with a sufficiently low
mass offers a suitable candidate for cold dark matter, as they may have been produced
in large numbers in the early Universe. A comprehensive review of axions can be found
in Ref. [132]. The strong CP problem [133–135] refers to the apparent discrepancy
between theory and observation of QCD phenomena. The theory of QCD allows for
charge-parity (CP) violation, i.e. the equations governing the strong nuclear force are
not necessarily invariant under change and parity inversion8. However, observations
have not yet found any evidence for this CP violation existing within QCD. For ex-
ample, if CP violation occurs in QCD, then the neutron should exhibit an electric
dipole field, but no such electric field has yet been observed (see, for example, [136]),
suggesting that the neutron does not have this field (or that is is at least 109 times
8Note that CP violation is predicted and observed in the weak nuclear force.
54

weaker than a CP violating QCD theory predicts) and hence QCD does not appear to
violate CP symmetry.
The axion arises from a proposed solution of the strong CP problem. The
Lagrangian for QCD can be written as
LQCD = Linv − θLvio , (1.4.3)
where Linv is a Langrangian contribution that is invariant under CP symmetry, and
Lvio is a contribution that violates CP symmetry9, and θ is a new physical parameter.
Thus, one solution to the strong CP problem would be if θ ' 0, which would be the
case if any of the standard model quarks were massless (which is contradicted by many
measurements of the quark masses [137]), or if θ is fine-tuned to 0. A more “natural”
solution, suggested by Peccei and Quinn, is to promote θ to a new dynamical field,
which over time reduces in value in order to minimise the energy of the vacuum. The
new θ field can then be quantised to give a particle, named the axion, which turns out
to have no spin, no electric charge and have a mass of ∼ 10−11Me, where Me is the
mass of the electron.
Axions also only interact very weakly through the strong and weak forces, and
through gravity, making detection difficult. Many experiments, such as the CERN
Axion Solar Telescope (CAST) [138], are currently searching for axions by searching
for X-rays that may be produced when axions pass through strong magnetic fields.
While no detections have yet been made, this may mean that axions are simply lighter
or more weakly interacting than expected (see Fig. 1.13 for recent constraints on axion
properties), and axions remain a popular dark matter candidate, as well as being the
leading solution to the strong CP problem.
MaCHOs, including primordial black holes: Finally, we will discuss mas-
sive compact halo objects (MaCHOs) as a candidate for dark matter. MaCHOS include
9This term appears in the Lagrangian because QCD does not have a unique vacuum, but insteadhas infinitely many lowest energy states.
55

ALPS II
IAXO
Axion Mass ma (eV)
Axion
-‐Pho
ton Co
upling |gaγγ| (G
eV–1)
Figure 1.13. Existing limits on the photon coupling of axions and axion-like particles andthe projected coverage of ongoing upgrades for these experiments.Image credit: [139]
objects such as brown dwarfs, neutron stars and primordial black holes (PBHs), the
last of which we will focus on here. As a dark matter candidate, MaCHOs are ap-
pealing because they do not require any extension to the standard model of particle
physics, as they are typically made of the known constituents of the Universe (baryons,
or collapsed particles in the case of PBHs) just in a form that is very difficult to detect.
Section 1.5 focuses on PBHs, and therefore a full discussion of these objects will be
performed there.
1.4.4 Origin of supermassive black holes
A supermassive black hole (SMBH) is an especially large black hole, with masses typi-
cally ranging from 106M to 1010M. The centre of every massive galaxy is expected to
56

Figure 1.14. The first direct image of a black hole, taken by the Event Horizon Telescopein 2019. The image shows light bending around the supermassive black hole at the centreof the galaxy M87, which is 6.5 billion times the mass of the Sun. Image credit: EventHorizon Telescope Collaboration [142]
contain a supermassive black hole, and the existence of such black holes has been con-
firmed through the direct imaging of the supermassive black holes in the M87 galaxy,
see Fig. 1.14, and through observations of the stellar orbits around the Milky Way’s
own supermassive black hole, Sagittarius A* [140]. The most massive known SMBH
is named TON 618 and has an approximate mass of 6.6× 10¹⁰M [141]. Accretion of
gas onto supermassive black holes powers quasars, objects so massive and bright that
they can outshine entire galaxies.
While the existence of SMBHs is known, the origin of such massive objects
is still an open question [143, 144]. The earliest black holes to form through stellar
collapse can form from the death of populations III stars, which may be up to a few
hundred solar masses, and can form by approximately redshift 15 [145]. It is thought
that these first stellar black holes can then accrete matter and merge with one another
throughout the rest of the age of the Universe, eventually becoming the SMBHs we see
today. However, there are issues with this formation route for SMBHs. In particular,
57

quasars have been observed at high redshifts10 z > 7, and stellar black holes would
not have had time to grow to these masses at such high redshifts in this way. This is
because there is a limit to how fast a body can accrete matter, known as the Eddington
limit. This is because the in-falling matter heats up and produces an outward flow
of radiation, and if this radiation becomes too powerful it can carry the material
surrounding the black hole away, shutting down accretion.
Note that there are other possible formation mechanisms for SMBHs, such as
the collapse of “quasi-stars” [147] in pregalactic halos, or the collapse of “dark stars”
[148, 149] at reshifts z > 10. Both of these methods can produce black holes at an
earlier time than the collapse of population III stars, which can then accrete matter
to become SMBHs.
An alternative route to forming SMBH is through PBHs formed in the very
early Universe. This idea has two advantages over forming SMBH through stellar
collapse and growth through subsequent accretion and mergers. Firstly, PBHs can
form at larger masses than black holes formed from the death of stars, and for example
PBHs formed around 1s after the Big Bang may have a mass of up to ∼ 105M [150].
Secondly, PBHs have a longer time to grow to supermassive sizes, even at high redshifts,
making the Eddington limit less impactful on their status as potential seed for SMBHs.
This is a second open problem in cosmology that PBHs may offer a solution to, and
we study these objects in more detail in the following section.
1.5 Primordial black holes
In this section, we will discuss primordial black holes (PBHs), and motivate why these
objects are currently the subject of much research. There is compelling evidence that
black holes exist, following the LIGO/Virgo detections of gravitational waves from
10Currently, the most distant known quasar is named ULAS J1342+0928 [146], and has a mass of∼ 800 × 106M. It is at redshift z = 7.54, when the Universe was approximately 690 million yearsold.
58

Figure 1.15. Known black holes in the Universe from the first and second observing runsof LIGO, plus black holes discovered through X-ray observations, and known neutron starsin the Universe. Image credit : LIGO/Frank Elavsky/Northwestern
merging black holes (see Fig. 1.15), and the direct imaging of the event horizon of the
supermassive black hole in the centre of the M87 galaxy (see Fig. 1.14) . While black
holes in the modern Universe form through the supernovae and subsequent collapse of
massive stars, the early Universe was much denser than the Universe now and so called
PBHs could form from causal patches of radiation exceeding a critical curvature, or
density, relative to the rest of the Universe. This forms a black hole with roughly the
mass of the causal horizon that collapsed [150], and the resultant PBH is expected to
form in isolation with no accretion disk or associated system. In the standard picture,
which we adopt here, this collapse happens in the first few seconds after inflation
and during the radiation dominated period of the Universe’s history11. The curvature
fluctuations that seed these PBHs collapse come from vacuum quantum fluctuations
during inflation.
PBHs offer possible solutions to some of the modern problems in cosmology
discussed above, namely they offer a plausible candidate to make up some or all of
11It is possible that an early matter dominated period in the Universe’s history may affect theformation of PBHs (see, eg, [151]), but here we only consider PBHs forming in the radiation era.
59

the dark matter12 (see, for example, [153–155]), and also offer candidates to seed the
SMBHs observed at high redshifts. In addition to this, PBHs may provide some the
black holes that LIGO has observed [156, 157] and the formation and merger of PBHs
could also provide some of the stochastic gravitational waves background that LISA
will observe.
During the inflationary epoch, vacuum quantum fluctuations were amplified
to become large-scale cosmological perturbations that seeded the cosmic microwave
background (CMB) anisotropies and the large-scale structure of our Universe [60–65].
In the range of scales accessible to CMB experiments [158, 159], these perturbations
are constrained to be small, at the level ζ ' 10−5 until they re-enter the Hubble radius
during the radiation era, where ζ is the scalar curvature perturbation. At smaller scales
however, they may be sufficiently large so that when they re-enter the Hubble radius,
they overcome the pressure forces and collapse to form PBHs [160–162]. In practice,
PBHs form when the mean curvature perturbation in a given Hubble patch exceeds a
threshold denoted ζc ' 1 [163, 164] (see Ref. [165] for an alternative criterion based
on the density contrast rather than the curvature perturbation).
The abundance of PBHs is usually stated in terms of the mass fraction of the
Universe contained within PBHs at the time of formation, β. If the coarse-grained
curvature perturbation ζcg follows the probability distribution function (PDF) P (ζcg),
β is given by [166]
β (M) = 2
∫ ∞
ζc
P (ζcg) dζcg . (1.5.1)
Here, ζcg is obtained from keeping the wavelengths smaller than the Hubble radius at
the time of formation,
ζcg(x) = (2π)−3/2
∫
k>aHform
dkζkeik·x , (1.5.2)
12Note, however, that recent work suggests that the existence of PBHs may be inconsistent withthe existence of WIMPs [152].
60

where a is the scale factor, H ≡ a/a is the Hubble scale, and a dot denotes differentia-
tion with respect to cosmic time. In Eq. (1.5.1), M is the mass contained in a Hubble
patch at the time of formation [167–169], M = 3M2Pl/Hform, where MPl is the reduced
Planck mass.
Observational constraints on β depend on the masses PBHs have when they
form. For masses between 109g and 1016g, the constraints mostly come from the
effects of PBH evaporation on big bang nucleosynthesis and the extragalactic photon
background13, and typically range from β < 10−24 to β < 10−17. Heavier PBHs, with
mass between 1016g and 1050g, have not evaporated yet and can only be constrained
by their gravitational and astrophysical effects (such as the mircolensing of quasars),
at the level β < 10−11 to β < 10−5 (see Refs. [171–173] for summaries of constraints,
see in particular Fig. 10 of [173] for recent constraints on PBHs as dark matter).
Compared to the CMB anisotropies that allow one to measure ζ accurately in
the largest ∼ 7 e-folds of scales in the observable Universe, PBHs only provide upper
bounds on β(M), and hence on ζ. However, these constraints span a much larger range
of scales and therefore yield valuable additional information. This is why PBHs can be
used to constrain the shape of the inflationary potential beyond the ∼ 7 e-folds that
are accessible through the CMB.
In practice, one usually assumes P (ζcg) to be a Gaussian PDF, see Fig. 1.16, with
standard deviation given by the integrated power spectrum⟨ζ2
cg
⟩=∫ kendkPζ(k)d ln k,
where k is related to the time of formation through k = aHform, and where kend
corresponds to the wavenumber that exits the Hubble radius at the end of inflation.
13Interestingly, there is another suggested method of PBH detection. If a PBH with mass around5× 10−19M (∼ 2× 10¹⁴g, and a radius similar to that of a proton), were to pass through the Earth,it would have almost no impact on the Earth, but would deposit ∼ 109 joules of Hawking radiationinto the Earth. This would leave detectable traces in crystalline material in Earth’s crust, and henceoffer an alternative detection method for PBHs [170].
61

Figure 1.16. Sketch of how the mass fraction of the Universe contained in PBHs, denoted β,is obtained. One integrates the tail of the PDF of curvature fluctuation above some criticalvalue ζc, above which PBHs are expected to form.
Combined with Eq. (1.5.1), this gives rise to
β (M) = erfc
ζc√
2∫ kendkPζ(k)d ln k
, (1.5.3)
where erfc is the complementary error function, M is the mass contained in the Hubble
volume, and 2π/k is the comoving Hubble length when the black holes form. In the
limit β 1, this leads to∫ kendkPζ(k)d ln k ' ζ2
c /(−2 ln β). Assuming the power
spectrum to be scale invariant, one has∫ kendkPζ(k)d ln k ' Pζ ln(kend/k) ' Pζ∆N ,
where ∆N = ∆ ln a is the number of e-folds elapsed between the Hubble radius exit
times of k and kend during inflation. This leads to
Pζ∆N ' −ζ2
c
2 ln β. (1.5.4)
62

For instance, with ζc = 1, the bound β < 10−22 leads to the requirement that
Pζ∆N < 10−2. This can be translated into constraints on the inflationary poten-
tial V = 24π2M4Plv and its derivative V,φ with respect to the inflaton field φ using the
slow-roll formulae [91, 174]
Pζ =2v3
M2Plv,φ
2, ∆N =
∫ φ
φend
v
M2Plv,φ
dφ . (1.5.5)
However, as we shall later see, producing curvature fluctuations of order ζ ∼ ζc ∼ 1
or higher precisely corresponds to the regime where quantum diffusion dominates over
the classical field dynamics over a typical time scale of one e-fold.
Let us note in particular that the assumptions here rely on two things. Firstly,
the above considerations rely on the use of a Gaussian PDF for P (ζcg), which is only
valid in the regime where quantum diffusion provides a subdominant correction to the
classical field dynamics during inflation. This is discussed in great detail in Chapter
4, and there we explore what happens when this condition is violated, but we remain
in a slow-roll regime. Secondly, we are applying the classical slow-roll formulae for the
curvature power spectrum Pζ and number of e-folds ∆N , and hence we rely on the
slow-roll assumptions holding throughout PBH formation. Producing large curvature
perturbations is more likely precisely when the power spectrum Pζ becomes large. From
(1.5.5) it is easy to see that this can be achieved when v,φ → 0, but this may cause
problems for the slow-roll conditions, and much current research focuses on producing
PBHs outside of slow roll [175–179].
There are straightforward ways that we can see that slow-roll violation can
easily produce the conditions needed for PBH production. If V ′ → 0, then the slow-
roll equation of motion 3HφSR + V,φ = 0 becomes simply φSR = 0, and there are no
dynamics. Also, in the case that V,φ = 0, ε2 is no longer necessarily small, and hence
there is no reason to neglect the second derivative term in the Klein–Gordon equation
(1.3.10) in the first place. We treat this as a break down of the slow-roll equations.
63

In order to explicitly see that this can lead to large curvature perturbations
during inflation, let us rewrite the Sasaki–Mukhanov equation (1.3.42) in terms of the
curvature perturbation ζk = vk/z, which gives the equation of motion
d2ζkdN
+ (3− ε1 + ε2)dζkdN
+
(k
aH
)2
ζk = 0 , (1.5.6)
where we have used the fact that dN = aHdη and dz/dN = (1+ε2/2)z. This equation
can be solved on super-horizon scales (k aH), and the asymptotic equation can be
integrated once to give
dζkdN
∣∣∣∣kaH
= C3e−
∫(3−ε1+ε2)dN = C2e
−3N+lnH−ln ε1 , (1.5.7)
and again to give the solution
ζk∣∣kaH = C1 + C2
∫e−3N+lnH−ln ε1dN , (1.5.8)
and hence we see the existence of two “modes” that govern the behaviour of ζk in
the super-horizon limit. The first of these modes is constant and corresponds to the
“adiabatic” mode, while the second mode evolves and either grows or decays, depending
on the sign of 3 − ε1 + ε2. This second mode corresponds to “non-adiabatic” (or
“entropy”) perturbations which can cause the curvature perturbation ζ to evolve, even
after horizon crossing. If the curvature perturbation were to grow, then its power
spectrum
Pζ =k3
2π2|ζk|2
∣∣∣∣kaH
, (1.5.9)
can become large and we expect many more PBHs to form.
In the standard slow-roll picture, the non-constant, non-adiabatic mode is ex-
ponentially suppressed because ε1, ε2 1, meaning that the curvature perturbation
very quickly becomes constant after horizon crossing, meaning we can simply evaluate
64

the power spectrum at horizon crossing (k = aH). However, beyond slow roll, the
evolving mode of the curvature perturbation can grow on super-horizon scales if the
second slow-roll parameter changes sign and we have ε2 < −3 + ε1. This growth will
also cause the power spectrum to grow, and hence we have the possibility of producing
many black holes once we leave the slow-roll regime.
Combining these two considerations, we see that we expect many PBHs to be
formed when we have a very flat potential V,φ → 0 and we violate slow roll and have
ε2 < −3 + ε1. This is precisely the case for “ultra-slow-roll inflation”, in which we have
a potential that is either exactly flat or very close to flat, and typically the second
slow-roll parameter is large, with ε2 ' −6.
This motivates us to study ultra-slow-roll (USR) inflation. In the next chapter
(i.e. in Chapter 2), we perform a classical analysis of the stability of USR inflation,
in which we perform a full phase space analysis of USR. The stability of USR is an
important feature to understand if one wants to study PBH production, as a long-lived
(i.e. stable) period of USR inflation may lead to many more PBH being produced than
a short-lived regime may produce. Later in this thesis, after introducing the formalism
of “stochastic inflation” in Chapter 3, we will study the quantum effects modelled by
this formalism in a USR regime in Chapter 5.
65

Chapter 2
Attractive behaviour of
ultra-slow-roll inflation
As we have seen in the previous chapter, the production of primordial black holes may
require the violation of slow-roll inflation. As such, in this chapter, we discuss the
regime of ultra-slow-roll inflation, where the dynamics of the inflaton field are friction
dominated, and we study in detail the dynamics of this regime. It is often claimed that
the ultra-slow-roll regime of inflation is a non-attractor and/or transient, and here we
study this claim in a classical context, i.e. without considering quantum diffusion. We
carry out a phase-space analysis of ultra-slow roll in an arbitrary potential, V (φ), and
show that while standard slow roll is always a dynamical attractor (whenever it is a
self-consistent approximation), ultra-slow roll is stable for an inflaton field rolling down
a convex potential with MPlV,φφ > |V,φ| (or for a field rolling up a concave potential
with MPlV,φφ < −|V,φ|). In particular, when approaching a flat inflection point, ultra-
slow roll is always stable and a large number of e-folds may be realised in this regime.
However, in ultra-slow roll, φ is not a unique function of φ as it is in slow roll and
dependence on initial conditions is retained. We illustrate our analytical results with
numerical examples.
66

This chapter is based on the publication [180], and is arranged as follows. In
Sec. 2.2 we briefly review the necessary machinery of inflation and the slow roll and
ultra-slow roll (USR) regimes of the inflaton dynamics. In Sec. 2.3 we perform a phase-
space analysis of ultra-slow-roll inflation and derive a necessary and sufficient condition
for stability in USR. We then demonstrate how this condition can be applied to some
simple examples in Sec. 2.4, and provide some brief conclusions in Sec. 2.5.
2.1 Introduction
We have seen that the simplest, and therefore perhaps the most natural, realisation
of inflation is that of a single scalar field called the inflaton, which we denote φ. The
classical equation of motion of φ in an FLRW cosmology is given by the Klein-Gordon
equation
φ+ 3Hφ+ V,φ(φ) = 0 , (2.1.1)
where a dot denotes a derivative with respect to cosmic time t, V,φ is the derivative
of the potential with respect to the inflaton field value, and H = a/a is the Hubble
expansion rate which satisfies (1.3.15)
H2 =1
3M2Pl
(V +
φ2
2
). (2.1.2)
Generally, it is not possible to solve this system of equations analytically, and so
approximations are often made to simplify the dynamics.
The most common approximation is that of slow-roll (SR) inflation, which we
have reviewed in detail in Sec. 1.3.3. In this regime, one takes φ2 V (φ), so the energy
budget of the inflaton is potential dominated and Eq. (2.1.2) reads H2 ' V/(3M2Pl).
Under this approximation, one also neglect the acceleration term φ in the Klein-Gordon
67

equation (2.1.1), and hence the equation of motion becomes first order,
φSR' − V,φ
3H. (2.1.3)
However, there are regimes in which this approximation is not a valid one. For
instance, one can imagine cases where the potential of the inflaton becomes very flat,
so V,φ(φ) → 0, and SR begins to break down. A simple example of this is a potential
with a flat inflection point at which V,φ = V,φφ = 0. Under the SR approximation,
Eq. (2.1.3) would give us φ = 0 at the inflection point, and so the inflaton rolling down
this potential would come to a complete stop at the flat point of the potential. In
practice, we may expect the residual (although small) kinetic energy to carry the field
through the inflection point, contrary to the SR prediction. When SR is violated in this
way, a phase of so-called “ultra-slow-roll” (USR) [181, 182], or “friction dominated”,
inflation takes place.
Let us take a moment at this point to clear up the nomenclature surrounding
“ultra-slow-roll” inflation and similar scenarios, as this can sometimes be unclear in
the literature. “Ultra-slow roll” is the name we use to describe the situation when the
potential of the inflaton is very flat, so that V,φ ' 0, and hence from the Klein-Gordon
equation (2.1.1)
φUSR' −3Hφ
USR. (2.1.4)
“Constant-roll” inflation [183–187] is intended to be a generalisation of ultra-slow-roll
inflation, and is simply defined as a regime where −φ/(3Hφ) = constant, and this
constant is not necessarily equal to 1. However, often when constant-roll inflation is
considered, ultra-slow roll is actually a singular point of the equations studied, and so
the analysis does not include ultra-slow roll. One must thus be careful when calling
constant-roll inflation a generalisation of ultra-slow roll. Another situation where SR
is violated is “fast-roll” inflation [188], where the effective mass of the inflaton is of
68

the same order as H and all three terms in the Klein-Gordon equation (2.1.1) are of
comparable magnitude (in the “ultra-fast roll” limit, the friction term is subdominant).
In this chapter, we are interested in the stability properties of USR inflation.
While SR inflation is known to be a dynamical attractor [189–192], it is often claimed
in the literature that USR is always non-attractive [175, 187, 193–195]. However, this
conclusion is obtained from investigating constant-roll inflation, which is supported
only by a very specific class of potentials and which, as already pointed out, only
reduces to USR in a (singular) limit. This is why we carry out a generic analysis of
USR that does not assume a specific potential. We will derive a simple criterion on
the potential for when it is stable.
2.2 Inflaton dynamics and definitions
We begin by discussing the formalism and language we will use to construct and define
USR, and explain how it differs from SR. As introduced before, we shall make use of
the Hubble flow parameters (1.3.17), where we recall that inflation requires ε1 < 1,
along with the field acceleration parameter,
f = − φ
3Hφ= 1 +
1
3HφV,φ , (2.2.1)
which quantifies the relative importance of the acceleration term compared with the
friction term in the Klein-Gordon equation (2.1.1). The field acceleration parameter
can be expressed in terms of the first two Hubble-flow parameters, as can be seen from
combining Eqs. (1.3.18) and (1.3.22) with Eq. (2.2.1),
f =2ε1 − ε2
6. (2.2.2)
Since f , like the slow-roll parameters, is a function of φ and φ, phase space
(which is usually parametrised by φ and φ) can also be parametrised by φ and f . This
69

will prove useful in the following. To this end, let us express φ in terms of φ and f ,
which can be done by combining Eqs. (2.1.2) and (2.2.2),
φ2 = V
[√1 +
2M2Pl
3 (f − 1)2
(V,φV
)2
− 1
]. (2.2.3)
Thus by combining Eqs. (1.3.18) and (2.2.3), one can write the first Hubble flow pa-
rameter as
ε1 = 3
√1 +
2M2Pl
3(1−f)2
(V,φV
)2
− 1√
1 +2M2
Pl
3(1−f)2
(V,φV
)2
+ 1
. (2.2.4)
The condition for inflation to take place, ε1 < 1, then reads
MPl
|1− f |
∣∣∣∣V,φV
∣∣∣∣ <3√2. (2.2.5)
We will often work in the quasi-de Sitter (quasi-constant-Hubble) approximation which
corresponds to ε1 1, and hence [MPl/|1− f |]|V,φ/V | 1.
2.2.1 Slow-roll inflation
Slow-roll inflation corresponds to the regime where all Hubble flow parameters are
much smaller than one, i.e. |εn| 1 for n ≥ 1 and we have seen that this means that
the dynamical system boils down to
H2SR' V
3M2Pl
and 3HφSR' −V,φ , (2.2.6)
and hence |f | 1 in slow roll. In this limit, φ is determined completely by the
gradient of the potential and a single trajectory is selected out in phase space since
φSR
has no dependence on initial conditions. One notices that while SR is usually
defined as |εn| 1 for all n ≥ 1, the above system only relies on ε1 1 and |ε2| 1.
70
Since φ is an explicit function of φ through Eq. (2.2.6), any phase space function
can be written as a function of φ only. For the first Hubble-flow parameter and the
field acceleration parameter, substituting Eq. (2.2.6) into Eqs. (1.3.18) and (2.2.1), one
obtains
ε1SR 'M2
Pl
2
(V,φV
)2
, (2.2.7)
fSR' M2
Pl
3
[V,φφV− 1
2
(V,φV
)2]. (2.2.8)
For a given inflationary potential V (φ), the existence of a regime of SR inflation can
thus be checked by verifying that the potential slow-roll parameters εV and ηV , defined
as
εV ≡M2
Pl
2
(V,φV
)2
and ηV ≡M2Pl
V,φφV
, (2.2.9)
remain small,
εV 1 and |ηV | 1 . (2.2.10)
2.2.2 Ultra-slow roll inflation
In the ultra-slow roll regime it is the driving term, corresponding to the gradient
of the potential, that is neglected in the Klein-Gordon equation (2.1.1), rather than
the field acceleration. This corresponds to the relative field acceleration f ≈ 1 in
Eq. (2.2.1), leading to Eq. (2.1.4). Note that if φ follows the gradient of its potential,
then φV,φ = V < 0, and conversely φV,φ > 0 if the field evolves in the opposite
direction. From Eq. (2.2.1), one can then see that f < 1 corresponds to situations
where the inflaton rolls down its potential and f > 1 to cases where the field climbs
up its potential.
Integrating Eq. (2.1.4) leads to the USR solution
φUSR∝ e−3N . (2.2.11)
71
This is the USR limit in which one takes V,φ = 0, but we shall see later that other
solutions exist approaching USR when V,φ does not exactly vanish. Instead of being
driven by V,φ as in the SR case (2.1.3), here the time derivative φUSR is exponentially
decreasing with the number of e-folds. If we also assume quasi-de Sitter (ε1 1), the
above can be integrated as
φUSR− φ
USR,∗ '1
3
φUSR,∗H∗
[1− e−3(N−N∗)] , (2.2.12)
where the star denotes some reference time. Thus the USR solution may be thought of
as the free or transient response of the scalar field in an expanding FRLW cosmology.
It is independent of the shape of the potential, but depends instead on the initial value
of the field and its time derivative, φ∗ and φ∗.
Despite the different background evolution, linear fluctuations of a massless
field about ultra-slow-roll inflation have the same scale-invariant form as during slow-
roll inflation [182, 196, 197]. This is a striking example of the invariance of field
perturbations under “duality” transformations [175, 198].
The condition under which USR takes place reads |f − 1| 1, which implies
that 3H|φ| |V,φ|. Clearly this is possible for any finite potential gradient so long as
we have a sufficiently large field kinetic energy. However, in order to have inflation we
also need to have ε1 < 1, which from Eq. (2.2.5) corresponds to
εV <9
4(1− f)2 , (2.2.13)
where εV is the first potential slow-roll parameter given in Eq. (2.2.9). The quasi-de
Sitter approximation ε1 1 simply corresponds to εV (1 − f)2. Comparing this
relation with Eq. (2.2.10), one can see that USR inflation requires a potential that is
even flatter than what SR imposes at the level of εV (hence the name “ultra”-slow roll,
which is otherwise not so apt since SR and USR are disjoint regimes), but that no
72

constraint is required on ηV , i.e. on the second derivative of the potential and hence
there is no constraints on ε21.
In the following, we thus distinguish two regimes: USR, which corresponds to
|f − 1| 1, and USR inflation, which corresponds to√εV |f − 1| 1.
2.3 Stability analysis
USR is often referred to as a transient or non-attractor solution during inflation [175,
187, 193–195]. This is because of results in constant-roll models [183–187], where the
field acceleration parameter f defined in Eq. (2.2.1) is taken to be a constant. In the
Hamilton-Jacobi formalism, this corresponds to taking H(φ) ∝ exp(±√
3f/2 φ/MPl),
and the potentials that support such a phase of constant roll can be obtained from V =
3M2PlH
2 − 2M4PlH
′2. In these potentials, the constant-roll solution is only one possible
trajectory in phase space and one can study its stability. One finds that the constant-
roll solution is an attractor if f < 1/2 [184]. This excludes the USR limit f ' 1, which
could lead to the incorrect conclusion that USR is always unstable. However this result
only applies to the family of potentials mentioned above. Moreover, it is singular in the
limit f → 1 since combining the equations above, one finds V ≡ constant in that case,
for which f = 1 is the only solution so nothing can be concluded about its attractive
or non-attractive behaviour.
This motivates us to go beyond these considerations and to study the phase-
space stability of USR in a generic potential.
2.3.1 Dynamical equation for the relative field acceleration
Since the field acceleration parameter, f , quantifies the importance of the acceleration
term in the Klein-Gordon equation (2.1.1), it essentially parameterises whether we are
in SR (|f | 1) or USR (|f − 1| 1). As such, knowing the evolution of f tells us
which regime we are in and when we transition from one to the other, and will allow
1For USR we typically have ε2 ' −6.
73

us to study the stability of the two regimes. As such, we seek a dynamical equation
for f .
We begin by recasting Eq. (2.1.1) with φ as the “time” variable, which reduces
the equation to a first-order differential equation, namely
dφ
dφ+ 3H +
V,φ
φ= 0 , (2.3.1)
where we assume that φ evolves monotonically with time, and hence acts as a “clock”
for inflation. Eq. (2.3.1) can be rewritten as
d
dφ
(φ2)
= −2V,φf
f − 1, (2.3.2)
and, combined with Eq. (2.2.3), this leads to an equation for the evolution of f ,
df
dφ=
3
2M2Pl
V
V,φ(f − 1)2 (f + 1)
[√1 +
2M2Pl
3 (f − 1)2
(V,φV
)2
− 1− f1 + f
]− (1− f)
V,φφV,φ
.
(2.3.3)
This can be written in terms of the potential slow-roll parameters (2.2.9) as
df
dφ=
3
2MPl
(f − 1)2 (f + 1)√2εV
[√1 +
4εV
3 (f − 1)2 −1− f1 + f
]− (1− f) ηV
2MPl
√2εV
. (2.3.4)
Note that this equation is exact and does not make any assumption about the smallness
or otherwise of the slow-roll parameters.
2.3.2 Slow-roll limit
We shall begin our stability analysis by considering the slow-roll case. If we expand the
right-hand side of Eq. (2.3.4) to first order in the potential slow-roll parameters (2.2.9)
and take f to be of first order in the slow-roll parameters as suggested by Eq. (2.2.8),
one obtains
V,φV
df
dφ' 1
2
(V,φV
)2
− V,φφV
+3
M2Pl
f . (2.3.5)
74

We see that the right-hand side of Eq. (2.3.5) vanishes for the slow-roll solution (2.2.8),
which is consistent with the fact that f is first order in the slow-roll parameters and
V,φ/V df/dφ ' df/dN is second order in slow roll.
The stability of the slow-roll solution can then be studied by considering a
deviation from Eq. (2.2.8) parametrised by
f ' fSR + ∆ . (2.3.6)
In this expression, fSR is given by Eq. (2.2.8) plus corrections that are second order in
slow roll and ∆ describes deviations from slow roll that are nonetheless first order in
slow-roll parameters or higher. For instance, we imagine that initially, one displaces
f from the standard slow-roll expression given in Eq. (2.2.8) (e.g. by adding another
linear combination of some slow-roll parameters) and study how this displacement
evolves in time. By substituting Eq. (2.3.6) into Eq. (2.3.5), one obtains
V,φV
d∆
dφ' 3
M2Pl
∆ , (2.3.7)
which at leading order in slow roll, using Eq. (2.2.6), can easily be solved to give
∆ ' ∆in exp [−3 (N −Nin)] , (2.3.8)
which is always decreasing as inflation continues. This shows that SR is a stable
attractor solution whenever the consistency conditions (2.2.10) are satisfied. This is of
course a well-known result [189, 190] but it is interesting to see how it can be formally
proven in the formalism employed in this work.
2.3.3 Ultra-slow-roll limit
In the ultra-slow-roll limit we have f = 1, which we can readily see is a fixed point of
Eq. (2.3.3) for any potential. We can therefore carry out a generic stability analysis of
75
this fixed point that is valid for any potential. The results will be illustrated with two
specific models in Sec. 2.4.
The strategy is to linearise Eq. (2.3.3) around f = 1 by parameterising
f = 1− δ , (2.3.9)
where we assume |δ| 1 in order to study small deviations from USR, and from
Eq. (2.2.1) we see that δ = −V,φ/(3Hφ). The only ambiguity is in the argument of
the square root in Eq. (2.3.3), that reads 1 + εV /(6δ2), since both εV and δ are small
numbers. However, from Eq. (2.2.13) and the discussion below it, one recalls that
inflation requires εV < 9δ2/4, and εV δ2 ensures quasi de-Sitter inflation ε1 1.
This is why Eq. (2.3.3) should be expanded in the USR inflation limit√εV |δ| 1,2
which gives rise todδ
dφ' − 3
M2Pl
V
V,φδ2 +
V,φφV,φ
δ . (2.3.13)
The right-hand side of this expression is proportional to δ − ηV /3, so which term
dominates depends on the magnitude |δ| with respect to |ηV |. Since δ must be larger
than√εV , two possibilities have to be distinguished.
2An expansion in the USR non-inflating limit, |δ| √εV and |δ| 1, can also be performedalong similar lines. At linear order in δ, Eq. (2.3.3) gives rise to
dδ
dφ'[−√
6
MPl
sign (V,φδ) +V,φφV,φ
]δ . (2.3.10)
If the field follows the gradient of its potential, one obtains the stability condition
V,φφ|V,φ|
>
√6
MPl
, (2.3.11)
and conversely, if the field climbs up the potential, one gets V,φφ/|V,φ| < −√
6 /MPl. The solution toEq. (2.3.10) reads
δ ' δinV,φ(φ)
V,φ (φin)exp
(√6|φ− φin|MPl
). (2.3.12)
To determine how ε1 varies, one can plug Eq. (2.3.12) into Eq. (2.2.4). One finds that if the fieldfollows the gradient of its potential, then ε1 decreases if εV < 3 and increases otherwise, and it alwaysdecreases if the field climbs up its potential. When ε1 decreases, it may become smaller than one atsome point, and a phase of USR inflation starts, whose stability properties are discussed in the maintext.
76

Case η2V < εV
In this case the condition for USR inflation,√εV |δ|, guarantees that |δ| ηV and
the first term on the right-hand side of Eq. (2.3.13) dominates,
dδ
dφ' − 3
M2Pl
V
V,φδ2 . (2.3.14)
As explained at the beginning of Sec. 2.2.2, if the field follows the gradient of its
potential then we have f < 1 and δ > 0. If V,φ > 0 and φ decreases with time, then
from Eq. (2.3.14) δ increases with time and USR is unstable. If V,φ < 0 and φ increases
with time, then again δ increases with time and USR is still unstable. Conversely, if
we have f > 1 and δ < 0, so that the field climbs up the potential, if V,φ > 0 then φ
increases with time and so does δ, so USR is unstable, and if V,φ < 0 then φ decreases
with time and USR is still unstable. Note that if one substitutes V,φ = −3Hφδ into
Eq. (2.3.14), then these same conclusions can also be reached by again considering the
signs of δ and φ for any case of interest.
We conclude that USR inflation is always unstable in that case. The example
discussed in Sec. 2.4.1 corresponds to this situation.
Case εV < η2V
In this case, which term dominates in Eq. (2.3.13) depends on the magnitude of δ.
However, strictly speaking, a stability analysis of the fixed point δ ∼ 0 should only
deal with its immediate neighbourhood, i.e. with the smallest possible values of |δ|which in this case are smaller than |ηV | (notice that if |ηV | & 1 then εV < η2
V becomes
true for all√εV |δ| 1). The second term in Eq. (2.3.13) then dominates and one
hasdδ
dφ' V,φφ
V,φδ . (2.3.15)
A similar discussion as in the previous case can be carried out, by first considering the
situation where the field follows the gradient of its potential, so f < 1 and δ > 0. If
77

V,φ > 0 and φ decreases with time then |δ| decreases if V,φφ > 0. If V,φ < 0 and φ
increases with time then |δ| decreases under the same condition
V,φφ > 0 . (2.3.16)
Thus we conclude that USR is stable for a scalar field rolling down a convex potential.
Conversely, we find that USR is stable for a scalar field rolling up a concave potential,
V,φφ < 0.
The fact that |δ| decreases with time is a necessary condition for USR inflation
stability but not a sufficient one, since one also has to check that |δ| remains much
larger than√εV , i.e. that the system remains inflating. To this end, let us notice that
Eq. (2.3.15) can be integrated and gives
δ ' δinV,φ(φ)
V,φ (φin). (2.3.17)
This confirms that |δ| decreases with time when |V,φ| decreases. Note that, given
δ = −V,φ/3Hφ, this solution corresponds to Hφ =constant, which differs from the
ultra-slow-roll limit Eq. (2.2.11). Substituting Eq. (2.3.17) into Eq. (2.2.4) (expanded
in the√εV |δ| 1 limit), one obtains
ε1 ' ε1,in
(Vin
V
)2
, (2.3.18)
where a subscript “in” denotes a quantities value at the initial field value φin. Therefore,
ε1 increases if the field follows the gradient of its potential and decreases otherwise.
Whether or not this increase can stop inflation in the former case depends on the
potential. If the relative variations of the potential are bounded this may never happen
if ε1 has a sufficiently small value initially.
One can also use Eq. (2.3.17) to compute the number of e-folds spent in the USR
regime. Since dN/dφ = H/φ = −3H2δ/V,φ where we have used the definition (2.2.1),
78
in the quasi de-Sitter limit where H2 ' V/(3M2Pl), one obtains dN/dφ = −V δ/(V ′M2
Pl).
Making use of Eq. (2.3.17), this gives rise to dN/dφ = −V δin/[V,φ(φin)M2Pl], and hence
∆NUSR
= − δin
M2PlV,φ(φin)
∫ φ
φin
V (φ)dφ . (2.3.19)
This should be compared with the slow-roll formula ∆NSR
=
−1/M2Pl
∫ φφinV (φ)/V,φ(φ)dφ, which shows that in general fewer e-folds are re-
alised between two given field values in the USR regime than in standard slow roll.
From this slow-roll formula it is even clear that ∆NSR
can become infinite if there is
a flat point in the potential such that V/V,φ is not integrable as V,φ → 0. However,
the USR formula (2.3.19) is always integrable and finite, even when one crosses a flat
inflection point of the potential.
Note that when we find USR to be a local attractor (|δ| decreases), it is so for
sufficiently small values of |δ| < |ηV | only. If |δ| > |ηV | initially, then the first term
on the right-hand side of Eq. (2.3.13) dominates even if εV < η2V and the analysis of
section Sec. 2.3.3 shows that USR becomes unstable. In this case trajectories diverge
from USR (f ∼ 1) to approach the standard slow roll (f 1) for εV 1 and |ηV | 1.
This shows that, if εV < η2V 1, the boundary between the SR and the USR basins
of attraction is located around the line |δ| ∼ |ηV |. This will be checked explicitly in
the example presented in Sec. 2.4.2. This is similar to bifurcation behaviour that has
previously been observed for inflection point quintessence [199].
In summary, we find that if the inflaton rolls down its potential, USR inflation
is stable if V,φφ > 0 and η2V > εV , which can be combined into the condition
ηV >√εV , (2.3.20)
and continues to inflate provided V/Vin remains larger than√ε1,in .
79
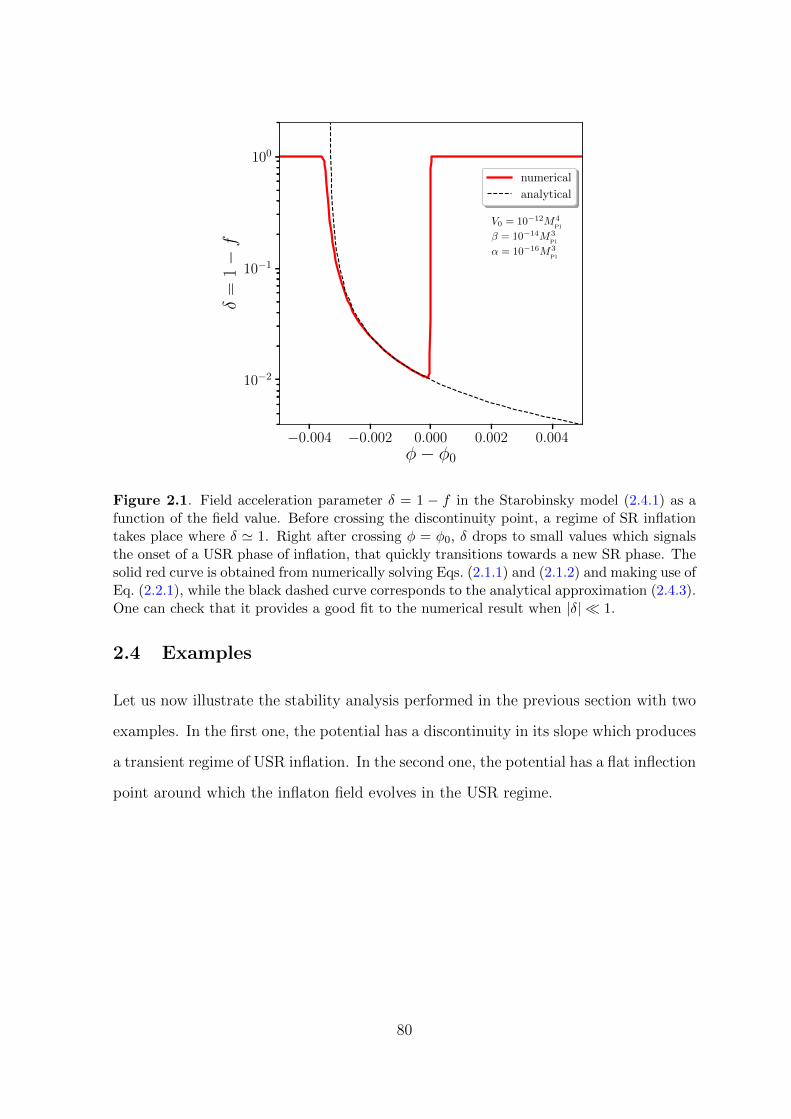
−0.004 −0.002 0.000 0.002 0.004φ− φ0
10−2
10−1
100
δ=
1−f
V0 = 10−12M4Pl
β = 10−14M3Pl
α = 10−16M3Pl
numerical
analytical
Figure 2.1. Field acceleration parameter δ = 1 − f in the Starobinsky model (2.4.1) as afunction of the field value. Before crossing the discontinuity point, a regime of SR inflationtakes place where δ ' 1. Right after crossing φ = φ0, δ drops to small values which signalsthe onset of a USR phase of inflation, that quickly transitions towards a new SR phase. Thesolid red curve is obtained from numerically solving Eqs. (2.1.1) and (2.1.2) and making use ofEq. (2.2.1), while the black dashed curve corresponds to the analytical approximation (2.4.3).One can check that it provides a good fit to the numerical result when |δ| 1.
2.4 Examples
Let us now illustrate the stability analysis performed in the previous section with two
examples. In the first one, the potential has a discontinuity in its slope which produces
a transient regime of USR inflation. In the second one, the potential has a flat inflection
point around which the inflaton field evolves in the USR regime.
80

2.4.1 Starobinsky inflation
Let us first analyse the Starobinsky piece-wise linear model [200], where the potential
is made up of two linear segments with different gradients,
V (φ) =
V0 + α (φ− φ0) for φ < φ0
V0 + β (φ− φ0) for φ > φ0
, (2.4.1)
where β > α > 0.
Starting with φ > φ0, the inflaton quickly relaxes to the slow-roll attractor for
V0 βMPl (corresponding to εV 1), where, according to Eq. (2.2.6), 3Hφ ' −β.
Right after crossing φ = φ0 where the gradient of the potential is discontinuous, φ is
still given by the same value (since the equation of motion (2.1.1) for φ is second order,
φ is continuous through the discontinuity point) but the value of V,φ is now different,
such that f given by Eq. (2.2.1) reads
f− = 1 +V −,φ
3(Hφ)−= 1 +
V −,φ
3(Hφ)+' 1−
V −,φV +,φ
= 1− α
β. (2.4.2)
In this expression, a superscript “−” (or “+”) means that the quantity is evaluated at
φ → φ0 with φ < φ0 (or φ > φ0, respectively). If α β, f− ' 1 and a phase of USR
is triggered.
The analysis of Sec. 2.3.3 revealed that the stability of USR inflation depends
on whether εV is smaller or larger than η2V . In the present model, since ηV exactly
vanishes, one necessarily falls in the later case, i.e. the case discussed in Sec. 2.3.3
where it was shown that USR inflation is always unstable. Let us also notice that in
the Starobinsky model, Eq. (2.3.14) can be integrated analytically, and making use of
Eq. (2.4.2) for the initial condition, one finds
δ ' α
β + 3V0M2
Pl(φ− φ0)
. (2.4.3)
81

Since φ decreases as a function of time, δ increases, and this confirms that USR is
unstable in the Starobinsky model.
These considerations are numerically checked in Fig. 2.1. One can see that when
the inflaton field crosses the discontinuity point at φ = φ0, a phase of USR inflation
with small values of δ starts, which Eq. (2.4.3) accurately describes. This regime is
however unstable and when the inflaton field crosses the value
φUSR→SR
= φ0 −M2
Pl (β − α)
3V0
, (2.4.4)
δ ' 1 and the system relaxes back to SR. Making use of Eq. (2.2.12), one can also
estimate the number of e-folds spent in the USR regime between the field values φ0
and φUSR→SR
, and one finds
NUSR' 1
3ln
(β
α
). (2.4.5)
The number of USR e-folds is therefore of order a few or less in this model.
2.4.2 Cubic inflection point potential
Let us now consider the case where the potential contains a flat inflection point at
φ = 0, around which it can be expanded as
V (φ) = V0
[1 +
(φ
φ0
)3]. (2.4.6)
One could parametrise the potential with a higher odd power of the field, say V ∝1+(φ/φ0)5, but this would not change the qualitative conclusions that we draw below.
The potential (2.4.6) has a flat inflection point at φ = 0, where V,φ = V,φφ = 0. In
the slow-roll regime, it takes the inflaton an infinitely long time to reach the inflection
point, which it never crosses. However in the USR regime the inflaton can traverse the
inflection point in a finite time, which we estimate below.
82

As explained in Eq. (2.2.10), SR inflation requires εV 1 and |ηV | 1, where
the potential slow-roll parameters (2.2.9) are here given by
εV =9
2
M2Pl
φ20
(φ/φ0)4
[1 + (φ/φ0)3]2,
ηV = 6M2
Pl
φ20
φ/φ0
1 + (φ/φ0)3.
(2.4.7)
Let us first focus on the part of the potential located before the inflection point,
i.e. at φ > 0. The parameter εV vanishes at φ = 0 and at φ → ∞, and in between
it reaches a maximum at φ = 21/3φ0 where its value is εV,max = 21/3M2Pl/φ
20. The
parameter ηV has a similar behaviour, with a maximum at φ = 2−1/3φ0 where its value
is ηV,max = 25/3M2Pl/φ
20.
Two regimes need therefore to be distinguished: (i) if φ0 MPl, SR inflation
can be realised for all φ > 0, while (ii) if φ0 MPl, SR inflation only takes place
at sufficiently large (φ MPl) or sufficiently small (φ φ30/M
2Pl) field values. After
crossing the inflection point at φ = 0, the potential decreases towards zero and the
potential slow-roll parameter, εV , diverges, signalling the end of inflation, so we restrict
our analysis to the field values φ > −φ0.
USR inflation can be studied making use of the results of Sec. 2.3.3, where it
was shown that USR inflation is stable if ηV >√εV , see Eq. (2.3.20). Together with
Eq. (2.4.7), this gives rise to the USR stability condition
0 < φ < 2√
2MPl . (2.4.8)
We shall now study the two regimes φ0 MPl and φ0 MPl separately.
Case φ0 MPl
In this case, as already mentioned, SR inflation is an attractor over the entire range
φ > 0 (until inflation stops when φ approaches −φ0). This implies that if one starts
83

10−5 10−4 10−3 10−2 10−1 100 101 102
φ/MPl
−0.002
0.000
0.002
0.004
0.006
0.008f
0.00 0.02 0.04 0.06 0.08 0.10
φ/MPl
10−8
10−6
10−4
10−2
100
δ=
1−f
Figure 2.2. Field acceleration parameter in the cubic inflection point model (2.4.6) as afunction of the field value, for φ0 = 10MPl and V0 = 4.2× 10⁻¹¹. The red lines correspond tonumerical solutions of Eq. (2.3.3) and the dashed blue line stands for the slow-roll limit (2.2.8).The left panel zooms in on the region f ' 0 where one can see that SR is an attractor. Theright panel uses a logarithmic scale on 1− f = δ, such that it zooms in on the USR regimef ' 1. If δ is initially smaller than |ηV |/3, represented with the dashed green line, thetrajectories evolve towards δ = 0, otherwise they evolve to reach the SR attractor. The blackdotted lines correspond to the analytical USR approximation (2.3.17).
from an initial field value that is larger than the USR stability upper bound given
in Eq. (2.4.8), φ = 2√
2MPl, the system relaxes towards the SR attractor (SR is the
only stable attractor at φ > 2√
2MPl) and stays in SR until the end of inflation. In
this scenario, even though USR inflation is also a local attractor at φ < 2√
2MPl, the
inflaton field never drives a phase of USR inflation.
The only way to get a period of USR inflation is therefore to start with φ <
2√
2MPl. There, as explained in Sec. 2.3.3, USR inflation is stable and its basin of
attraction is bounded by the condition√εV < |δ| < ηV .
These considerations are numerically verified in Fig. 2.2. In the left panel, the
SR region |f | 1 is displayed, where one can check that the numerical solutions of
Eq. (2.3.3) (red curves) all converge towards the SR attractor (2.2.8) (dashed blue
curve). In the right panel, a logarithmic scale is used on 1 − f , which allows one to
zoom in on the USR region f ' 1. Since the initial values for φ satisfy Eq. (2.4.8), one
can check that the trajectories with δ < ηV converge towards USR, while the ones for
84

which δ > ηV approach the SR attractor. This confirms that the boundary between
the two basins of attraction is located around the line |δ| = |ηV |. The analytical
approximation (2.3.17) is displayed with the black dotted lines and one can check that
it provides a good fit to the numerical result in the USR regime.
Let us finally estimate the number of e-folds that is typically realised in the
USR inflating regime. In the stability range (2.4.8) of USR inflation, the potential
is dominated by its constant piece since φ0 MPl. The first Hubble-flow parameter
is therefore roughly constant during the USR epoch, see Eq. (2.3.18). Starting USR
inflation at φin ∼ MPl with δ = δin, Eq. (2.3.17) implies that δ goes back to its initial
value δin at around φ ∼ −MPl. Plugging these values into Eq. (2.3.19), one obtains
∆NUSR' 2δin
3
(φ0
MPl
)3
. (2.4.9)
This shows that, in the regime φ0 MPl, a large number of USR e-folds can be
realised. However, we should note that this number remains finite, contrary to what
happens in the slow-roll regime where it takes an infinite time to cross the inflection
point, as already mentioned.
Stochastic diffusion
This large number of USR inflationary e-folds is however derived under the assump-
tion that the field behaves classically all the way down to the inflection point, while
stochastic diffusion is expected to play a role when the potential becomes very flat. Let
us estimate how this changes the above result. Stochastic diffusion and its impacts on
the dynamics will be studied in detail in both slow roll and ultra-slow roll, in chapters
4 and 5 respectively, and here we simply provide a brief discussion relevant to the
example under consideration.
Starting from φin = MPl and δ = δin as explained above, Eq. (2.3.17) leads to
δ(φ) ' δin(φ/MPl)2 (where we assume φ < MPl). Then, making use of Eq. (2.3.19), if
85

the field behaved in a purely classical manner, the number of e-folds realised between
φ and −φ would be given by ∆NUSR
(φ) ' 2δin/3(φ0/MPl)3(φ/MPl).
On the other hand, if the field was only driven by stochastic noise, its equation
of motion would be given by [201] dφ/dN = H/(2π)ξ, where ξ is a white Gaussian
noise with vanishing mean and unit variance, such that 〈ξ(N)ξ(N ′)〉 = δ(N − N ′).
Assuming that H is roughly constant, this leads to 〈φ2〉 = H2/(2π)2N , hence the
typical number of e-folds required for the inflaton field value to go from φ to −φ is
given by ∆Nsto = 48π2φ2M2Pl/V0. Notice that this can also be obtained using the
“first-passage-time techniques” developed in Ref. [202], and which we will discuss in
Sec. 3.5. Setting a reflective boundary condition at φ and an absorbing one at −φ, one
finds that the mean number of e-folds required to reach −φ starting from φ exactly
coincides with the expression given here for ∆Nsto.
Since ∆NUSR
scales as φ and ∆Nsto as φ2, two regimes need to be distinguished.
When φ > φsto, where
φsto
φ0
=δin
72π2
(φ0
MPl
)2V0
M4Pl
(2.4.10)
is the solution of ∆NUSR
(φsto) = ∆Nsto(φsto), one has ∆NUSR
< ∆Nsto, which means
that classical USR is more efficient at driving the field than stochastic diffusion, hence
the dynamics of the field are essentially classical. When φ < φsto on the other hand,
stochastic diffusion takes over, which means that the part of the potential where
−φsto < φ < φsto is dominated by quantum diffusion.
This is why, for classical USR to take place, one needs to impose φsto < MPl,
which means that the potential energy cannot be too large,
V0
M4Pl
72π2
(MPl
φ0
)3
(2.4.11)
(recall that φ0 MPl so this is not necessarily guaranteed). When this is the case, the
number of classical USR infationary e-folds is given by ∆NUSR,class
= ∆NUSR
(MPl) −
86

10−5 10−4 10−3 10−2 10−1 100 101
φ/MPl
10−2
10−1
100
101
102
f
10−5 10−4 10−3 10−2 10−1 100 101
φ/MPl
10−14
10−12
10−10
10−8
10−6
10−4
10−2
100
102
ε 1
Figure 2.3. Left panel: Field acceleration parameter in the cubic inflection pointmodel (2.4.6) as a function of the field value, for φ0 = 0.1MPl and V0 = 4.2× 10⁻¹¹, with thesame conventions as in Fig. 2.2. The solid part of the red curves correspond to when f < 1and φ decreases with time, while the dotted parts are for f > 1 and φ increases (as indicatedby the arrows). Right panel: first Hubble-flow parameter ε1 as a function of the field valuefor the same solid trajectories and the dotted trajectory with an arrow in the left panel. Thedashed green line stands for ε1 = 1 below which inflation proceeds. The trajectories thathave both ε1 1 and f → 1 drive a phase of USR inflation.
∆NUSR
(φsto), where ∆NUSR
(MPl) was given in Eq. (2.4.9), and one obtains
∆NUSR,class
=2δin
3
(φ0
MPl
)3[
1− δin
72π2
(φ0
MPl
)3V0
M4Pl
]. (2.4.12)
If the parameter φ0 is chosen such that 1 φ0/MPl (72π2V0/M4Pl)−1/3, this number
can still be very large and a sustained phase of classical USR inflation takes place.
Case φ0 MPl
In this case, SR inflation can only occur at φ MPl or φ φ30/M
2Pl. One therefore
has three regions: if φMPl, SR is the only attractor, if φ30/M
2Pl φMPl, USR is
the only attractor, and if φ φ30/M
2Pl, both SR and USR are local attractors. These
three regimes can be clearly seen in the left panel of Fig. 2.3, where the same colour
code as in Fig. 2.2 is employed. In the right panel of Fig. 2.3, the first Hubble-flow
parameter is displayed for the same trajectories. The solid curves have f < 1 for which
87

φ decreases with time and the dotted curves have f > 1 for which φ increases with
time. We shall now discuss each of these three regimes in more detail.
Firstly, if one starts with an initial value of φ that is super Planckian, one
quickly reaches the SR attractor. Then when φ becomes of order MPl, fSRbecomes
of order one which signals the breakdown of SR and one leaves the SR line to settle
down to f ' 1, i.e. in the USR regime. However, as can be seen on the right panel of
Fig. 2.3, the first Hubble-flow parameter converges towards ε1 ' 3, so inflation stops
around φ ' MPl and does not resume afterwards. In this case, for φ < MPl, we have
USR but not USR inflation, and this non-inflating USR regime is stable due to the
considerations of footnote 2.
Secondly, if one starts with an initial field value between φ30/M
2Pl and MPl and
with φ < 0 (rolling down the potential), the field converges towards USR, since it is
the only stable solution. This is the case for the trajectory with f < 1 on which an
arrow has been added in Fig. 2.3. Let us recall that the dotted part of the trajectory
corresponds to f > 1 and the inflaton climbs up its potential (φ > 0), until its velocity
changes vanishes at which point f diverges and φ changes sign. The inflaton then rolls
down its potential starting from very negative values for f (solid part of the curve)
and quickly reaches USR. On the right panel of Fig. 2.3 one can see that ε1 is roughly
constant in the rolling down phase, which is consistent with Eq. (2.3.18) since the
potential is dominated by its constant piece V ' V0 when φ φ0.
Lastly, if one starts with φ φ30/M
2Pl, one either reaches the SR attractor if
|δ| > |ηV | or the USR attractor if |δ| < |ηV |. This can be more clearly seen in Fig. 2.4,
where the whole region −φ0 < φ < φ30/M
2Pl is displayed. One can check that the
inflating USR approximation (2.3.17) provides a good approximation to the numerical
solutions of Eq. (2.3.3) in the inflating part of phase space for those trajectories that
reach the USR attractor, while the non-inflating USR approximation (2.3.12) correctly
describes the non-inflating trajectories (in the grey shaded region of the plot). Here,
because the field excursion is sub-Planckian (since φ0 MPl), these two behaviours
88

−10−1 −10−2 −10−3 −10−4 −10−5 −10−6 0 10−6 10−5 10−4 10−3
φ/MPl
0
10−7
10−6
10−5
10−4
10−3
10−2
10−1
100
101
δ=
1−f
Figure 2.4. Same as in the left panel of Fig. 2.3 for the region −φ0 < φ < φ30/M
2Pl. Yellow
shading denotes regions when the axis scale is linear rather than logarithmic, and the greyshaded region is where inflation in not happening ε1 > 1, as given by (2.2.5). The blackdashed lines stand for the analytical USR inflation approximation (2.3.17) in the inflatingpart, and to the USR non-inflation approximation (2.3.12) in the non-inflating part (the fieldexcursion being sub Planckian, the two behaviours are very much similar). The dashed greenline stands for δ = |ηV |/3, which in the φ > 0 region corresponds to the boundary betweenthe SR and the USR basins of attraction. For φ < 0, only SR is an attractor which explainswhy those trajectories that reach the USR attractor in the φ > 0 region have δ increasingwith time in the φ < 0 region where USR is unstable.
are almost identical. As in the right panel of Fig. 2.2, one can also check that the
line |δ| ∼ |ηV | correctly delimitates the boundary between the two basins of attraction
when φ > 0. If φ < 0, USR becomes unstable and only SR remains as an attractor,
which explains why δ increases with time for those trajectories that reached the USR
attractor before crossing the flat inflection point. However, one should note that those
trajectories do not have time to reach the SR attractor before the potential becomes
too steep and SR is violated. Similarly, for φ > φ30/M
2Pl the potential is too steep and
SR is not a valid approximation.
89

SR (|f | < 0.1)
USR (|f − 1| < 0.1)
no inflation (ε1 > 1)
no SR inflation (εV or |ηV | > 1)
−10
−8
−6
−4
−2
0
log
10
( φ/M
2 Pl
)
0 2 4 6 8− log10 (−φ/φ0)
0
2
4
6
8
10
−lo
g10
( −φ/M
2 Pl
)
−8 −5 −2 1 4log10 (φ/φ0)
SR basin (|f | →< 0.1)
USR basin (f → 1)
non inflating (ε1 > 1)
no SR inflation (εV or |ηV | > 1)
−10
−8
−6
−4
−2
0
log
10
( φ/M
2 Pl
)0 2 4 6 8
− log10 (−φ/φ0)
0
2
4
6
8
10
−lo
g10
( −φ/M
2 Pl
)−8 −5 −2 1 4
log10 (φ/φ0)
Figure 2.5. Regions in phase space for the cubic inflection point model (2.4.6) with V0 =4.2×10⁻¹¹ and φ0 = 0.1MPl where SR and USR solutions exist (left panel), and (right panel)basins of attraction for SR (f < 1 and |f | decreasing) and USR (|1− f | decreasing).
Let us also estimate the number of e-folds that is typically realised in the USR
inflating regime. USR is stable in the range (2.4.8). However, for φ > φ0, the potential
is not dominated by its constant piece so ε1 can substantially increase because of
Eq. (2.3.18). Whether or not USR inflation is maintained depends on the initial value
of ε1 (see the right panel of Fig. 2.3) and to avoid this initial condition dependence,
let us consider the case where we start USR inflation around φ ∼ φ0. Starting with
δ = δin, Eq. (2.3.17) implies that δ goes back to its initial value δin at around φ ∼ −φ0.
Making use of Eq. (2.3.19), this gives rise to
∆NUSR' 2δin
3
(φ0
MPl
)2
. (2.4.13)
This shows that, in the regime φ0 MPl, the number of e-folds realised in the USR
regime is necessarily small, contrary to the case φ0 MPl, see Eq. (2.4.9).
Finally we plot in Figs. 2.5 and 2.6 the phase space (φ, φ) for the cubic inflection
point model (2.4.6), for φ0 = 0.1MPl and φ0 = 10MPl respectively. In the left panels,
90

SR (|f | < 0.1)
USR (|f − 1| < 0.1)
no inflation (ε1 > 1)
no SR inflation (εV or |ηV | > 1)
−10
−8
−6
−4
−2
0
log
10
( φ/M
2 Pl
)
0 2 4 6 8− log10 (−φ/φ0)
0
2
4
6
8
10
−lo
g10
( −φ/M
2 Pl
)
−8 −5 −2 1 4log10 (φ/φ0)
SR basin (|f | →< 0.1)
USR basin (f → 1)
non inflating (ε1 > 1)
no SR inflation (εV or |ηV | > 1)
−10
−8
−6
−4
−2
0
log
10
( φ/M
2 Pl
)0 2 4 6 8
− log10 (−φ/φ0)
0
2
4
6
8
10
−lo
g10
( −φ/M
2 Pl
)−8 −5 −2 1 4
log10 (φ/φ0)
Figure 2.6. Regions in phase space for the cubic inflection point model (2.4.6) with V0 =4.2 × 10⁻¹¹ and φ0 = 10MPl where SR and USR solutions exist (left panel), and regions ofstability for SR and USR (right panel).
the blue region corresponds to SR solutions (defined as |f | < 0.1) and the red region
to USR (defined as |1− f | < 0.1). In the right panels we show the basins of attraction
of SR and USR, defined by the behaviour of f .
One can see that SR corresponds to a thin line in phase space while USR spans
a larger region. This is due to the fact that in USR inflation, there is no unique USR
trajectory in phase space and solutions retain a dependence on initial conditions as
can be seen e.g. in Eq. (2.3.17). This is not the case for SR that singles out a unique
phase-space trajectory, see Eq. (2.2.8). Note also that SR solutions only exist in the
quadrants where the field velocity is aligned with the potential gradient while USR
exists in every quadrant.
The right-hand plots show the basins of attraction of SR (i.e. where f < 1 and
|f | decreases) and USR (where |1− f | decreases). When φ > 0, if the field goes up the
potential (φ > 0) then USR is unstable, and there is no SR regime and hence no SR
basin of attraction either. If the field rolls down the potential (φ < 0), when φMPl
91

or φ < 0 we see that only SR is an attractor as discussed above, and when 0 < φMPl
both SR and USR can be attractors. When φ < 0 and the field goes up the potential,
USR is an attractor in some region of the phase space. This corresponds to initial
conditions where the field arrives at the inflection point with an almost vanishing
velocity and inflates in the USR regime.
2.5 Summary
In this chapter we have shown that, contrary to what is sometimes suggested in the
literature, ultra-slow-roll inflation can be a classical stable attractor in phase space.
We have seen that ultra-slow-roll inflation (|δ| 1) is stable for a scalar field rolling
down a convex potential (V < 0 and V,φφ > 0) if the condition (2.3.20) is fulfilled,
which in terms of the potential function V (φ) reads
MPlV,φφ > |V,φ| . (2.5.1)
Conversely, standard slow roll (|f | 1) is always an attractor whenever the slow-roll
consistency conditions Eq. (2.2.10) are satisfied.
In practice, however, in models with a long-lived USR epoch, the classical de-
scription may eventually break down when quantum fluctuations become more efficient
at driving the field than its (decreasing) residual velocity. We have estimated when
this happens, and shown that classical USR can still be long lived. When the quan-
tum and classical evolutions become comparable then the resulting primordial density
perturbations after inflation become large, which, as discussed previously, can lead
to the formation of primordial black holes [160, 162, 203] (see [176, 204] for explicit
models similar to the inflection point potential discussed in this chapter). In such cases
we need a non-perturbative formalism to describe the cosmological evolution on large
scales, such as stochastic inflation. In the next chapter, we will review and develop the
92

formalism of stochastic inflation, before going on to apply this formalism to both slow
roll and ultra-slow roll, in chapters 4 and 5, respectively.
93

Chapter 3
Stochastic inflation
We have seen in Sec. 1.3.4 how deviations from homogeneity and isotropy can be stud-
ied in the standard, perturbative description of inflation. In this chapter we describe,
and develop new results for, the stochastic formalism for inflation [201, 205–212], which
goes beyond the standard treatment by also including the non-linear backreaction of
perturbations on the background dynamics. The stochastic formalism is an effective
field theory for the large-scale modes of the inflaton field, which is coarse-grained at
scales larger than the Hubble radius, while sub-Hubble degrees of freedom are inte-
grated out and treated as a classical, stochastic noise.
One can intuitively understand the derivation of this theory as simply adding a
stochastic noise term to the classical equations of motion. For example, in slow roll,
the classical equation dφ/dN = −V,φ/(3H2) becomes a Langevin equation of the form
dφ
dN= − V,φ
3H2+H
2πξ (N) . (3.0.1)
The right-hand side of this equation has two terms, the first of which involves V,φ
and is a classical drift term, and the second term involves ξ which is a Gaussian
white noise such that 〈ξ (N)〉 = 0 and 〈ξ (N) ξ (N ′)〉 = δ (N −N ′), and which makes
the dynamics stochastic. Indeed, when light fields are coarse grained at a fixed, non-
94

expanding, physical scale that is larger than the Hubble radius during the whole period
of inflation, one can show that their dynamics indeed become classical and stochastic.
Parts of this chapter are based on Ref. [213], and this chapter is organised as fol-
lows: In Sec. 3.1, we derive the general Langevin equations of a field and its momentum
in stochastic inflation, before describing the requirements of this stochastic formalism
to be valid in Sec. 3.2. Next, in Sec. 3.3, we explicitly show that these requirements are
valid in physical cases, and demonstrate this in three examples: slow roll, ultra-slow
roll, and Starobinsky’s piece-wise linear model for inflation. In Sec. 3.4, we explain
the δN formalism, which can be used to calculate perturbations during inflation while
taking into account the non-perturbative backreaction effects of quantum fluctuations.
Finally, in Sec. 3.5, we use the techniques of “first passage time analysis” to calculate
the first few moments of the probability distribution of curvature fluctuations when
stochastic effects are included. In this final section, the calculations are done in the
framework of DBI inflation, which is motivated from string theory and includes non-
canonical kinetic terms, and this is a new calculation in the literature (although the
canonical calculation is easily recovered).
3.1 Deriving the Langevin equations
Recall that, in this thesis, we consider a single inflaton field φ with potential V (φ)
for simplicity, but our results can easily be extended to multiple-field setups. We also
restrict our analysis to scalar fluctuations only, which are found from expanding about
the flat FLRW line element, as shown in Eq. (1.3.36).
For now we consider a general system under no assumptions (in particular we
do not assume slow roll at this point), and hence the homogeneous background field φ
and its conjugate momentum π are two independent dynamical variables and stochastic
inflation needs to be formulated in the full phase space (see also Ref. [192]). This can
95

be done by deriving the Hamiltonian equations1 from the action (1.3.7),
∂φ
∂N= π , (3.1.1)
∂π
∂N+ (3− ε1) π +
V,φ(φ)
H2= 0 , (3.1.2)
where we recall that N = ln a is the number of e-folds, ε1 is the first slow-roll parameter,
H ≡ a/a is the Hubble parameter, a dot denotes derivatives with respect to cosmic
time t and a subscript ,φ means derivative with respect to the field φ. At this stage,
φ and π are quantum operators, as stressed by the hats. The Hubble parameter is
related to the field phase-space variables through the Friedmann equation (1.3.15).
When linear fluctuations are added to the homogenous field and its conjugate
momentum, they can be split according to
φ = ˆφ+ φs , (3.1.3)
π = ˆπ + πs , (3.1.4)
where φs and πs are the short-wavelength parts of the fields that can be written as a
Fourier decomposition
φs =
∫
R3
dk
(2π)32
W
(k
σaH
)[e−ik·xφk(N)ak + eik·xφ∗k(N)a†k
], (3.1.5)
πs =
∫
R3
dk
(2π)32
W
(k
σaH
)[e−ik·xπk(N)ak + eik·xπ∗k(N)a†k
]. (3.1.6)
In these expressions, a†k and ak are creation and annihilation operators, φk and πk
are field fluctuations with wavenumber k, and W is a window function that selects
out modes such that k/(σaH) > 1, where σ 1 is the coarse-graining parameter.
Specifically, W is such that W ' 0 for k/(σaH) 1 and W ' 1 for k/(σaH) 1.
1This can also be obtained from the Klein–Gordon equation written with N as the time variable
96

For example, the simplest choice of window function, and the one we shall take later
on, is a Heaviside function W (x) = θ(x− 1), where x = k/(σaH).
The coarse-grained fields φ and π thus contain all wavelengths that are much
larger than the Hubble radius, k < σaH. They stand for the local background values
of the fields, which are continuously perturbed by the small wavelength modes as they
emerge from φs and πs and cross the coarse-graining radius. The perturbation of the
coarse-grained field by the small-scale modes leaving the Hubble radius comes from the
time dependence of the argument of the window function W , and we do not consider
any couplings between super-Hubble and sub-Hubble modes (couplings such as this
would, however, need to be taken into account beyond linear order in perturbation
theory). Our aim is to find Langevin equations (which are effective equations of motions
with the small-wavelength parts of the fields φs and πs integrated out) for these long-
wavelength parts of the quantum fields.
Inserting the decompositions (3.1.3) and (3.1.4) into the classical equations of
motion (3.1.1) and (3.1.2), to linear order in the short-wavelength parts of the fields,
the equations for the long-wavelength parts become
∂ ˆφ
∂N= ˆπ + ξφ(N) , (3.1.7)
∂ ˆπ
∂N= − (3− ε1) ˆπ − V,φ( ˆφ)
H2+ ξπ(N) , (3.1.8)
where the source functions ξφ and ξπ are given by
ξφ = −∫
R3
dk
(2π)32
dW
dN
(k
σaH
)[e−ik·xφk(N)ak + eik·xφ∗k(N)a†k
], (3.1.9)
ξπ = −∫
R3
dk
(2π)32
dW
dN
(k
σaH
)[e−ik·xπk(N)ak + eik·xπ∗k(N)a†k
]. (3.1.10)
Note that in the stochastic formalism, background quantities such as H and ε1 are only
evaluated as function of the coarse-grained fields (eg through the Friedmann equation)
97

and not the short wavelength perturbations, which means that these short wavelength
modes are taken to be “test perturbations”.
Now, if the window function is taken to be a Heaviside function, then the two-
point correlation functions of the sources are given by [192]
〈0|ξφ(N1)ξφ(N2)|0〉= 1
6π2
dk3σ(N)
dN
∣∣∣∣N1
|φkσ(N1)|2 δ (N1 −N2),
〈0|ξπ(N1)ξπ(N2)|0〉= 1
6π2
dk3σ(N)
dN
∣∣∣∣N1
|πkσ(N1)|2 δ (N1 −N2),
〈0|ξφ(N1)ξπ(N2)|0〉= 〈0|ξπ(N1)ξφ(N2)|0〉∗=1
6π2
dk3σ(N)
dN
∣∣∣∣N1
φkσ(N1)π∗kσ(N1)δ (N1−N2),
(3.1.11)
where kσ ≡ σaH is the comoving coarse-graining scale. In order to evaluate these
correlation functions more explicitly, one needs to calculate the amplitudes of the field
fluctuations. This leads us to note that the specific gauge in which one solves for the
field fluctuations is now important, as the amplitude of the fluctuations is a gauge-
dependent quantity. This point is discussed in detail in Sec. 3.3.2.
The important step is now to view the source functions as random Gaussian
noises rather than quantum operators2, correlated according to Eqs. (3.1.11), and to
interpret Eqs. (3.1.7) and (3.1.8) as stochastic Langevin equations for the random field
variables φ and π,
∂φ
∂N= π + ξφ(N) , (3.1.13)
∂π
∂N= − (3− ε1) π − V,φ(φ)
H2(φ, π)+ ξπ(N) , (3.1.14)
2The mapping between ξφ and ξπ (which are, strictly speaking, quantum operators) and theirclassical noise counterparts is found by identifying their quantum expectation values with stochasticmoments, that is by imposing the relationship
⟨ξpi (N1)ξqj (N2)
⟩=⟨0|T
[ξpi (N1)ξqj (N2)
]|0⟩, (3.1.12)
where i and j stand for φ or π, p and q are natural numbers, and where the T -product is the timeordering product. Note that in the left hand side of the above, the angle brackets stand for stochasticaverage while in the right hand side, they denote the bra and the ket of the vacuum state |0〉.
98

where we have removed the hats to stress that we now work with stochastic quan-
tities rather than quantum operators. These are the general Langevin equations for
stochastic inflation.
Before we discuss the general criteria that one must satisfy in order to use the
stochastic formalism, let us make a few notes about the formalism described here.
Firstly, due to the presence of the term δ(N1−N2) in each correlator in (3.1.11),
we see that the noise terms ξφ and ξπ are “white noises”, meaning that their value at
time N1 is uncorrelated with their value at any other time N2. This means that
they describe a Markovian process, and the noises have no “memory” of their history.
However, this property is a direct consequence of our choice of the Heaviside window
function. If we were to choose a smooth window function, we would find “coloured
noises”, which are non-Markovian and their values at different times are correlated
[214–216]. While this may have physical implications, because a coloured noise can
provide an additional source of non-Gaussianity [217] and affect the shape of the power
spectrum [216], we continue with a Heaviside window function for simplicity.
Secondly, in order to obtain the noise correlators (3.1.11), we have evaluated
them at the same point x in space, so there is no x-dependence in these expression.
This is done both for simplicity of the expressions given, and because this is the case
of physical interest for perturbations in stochastic inflation.
Finally, let us demonstrate how to calculate the noise correlators in some specific
cases. Here, we will focus on 〈ξφξφ〉 in (3.1.11), and simply note that the calculation
of the other moments follows in the same way. Let us first consider the case of a de
Sitter background. To calculate the auto-correlation of ξφ, we need to calculate the
field fluctuation φk, which in the notation of Eq. (1.3.40) is δφk, by solving the Sasaki–
Mukhanov equation (1.3.42). By implementing the Bunch–Davies initial condition, as
in Sec. 1.3.4, we find that in the super-Hubble limit k aH that we are interested in,
99

the field fluctuation is given by
(σaH)3|φk|2k=σaH 'H
4π2Γ(ν)22νσ3−2ν , (3.1.15)
for σ 1, where ν = 32
√1− 4
9H2d2Vdφ2
, and Γ is the Euler Gamma function. Hence, we
find
〈ξφ(N1)ξφ(N2)〉 =
(H
2π
)2 (σ2
)3−2ν 4Γ2(ν)
πδ(N1 −N2) . (3.1.16)
If we additionally impose that we are considering a light field, so d2Vdφ2 H2, then
ν ' 3/2 and
〈ξφ(N1)ξφ(N2)〉 =
(H
2π
)2
δ(N1 −N2) , (3.1.17)
along with ξπ = 0. We can thus combine the Langevin equations (3.1.7) and (3.1.8)
and write them as
∂2φ
∂N2= −3
∂φ
∂N− V,φH2
+ 3H
2πξ(N) , (3.1.18)
where we have redefined the noise term as ξφ = H/(2π)ξ, where ξ is a Gaussian white
noise. Furthermore, in slow roll, we can neglect the second derivative term to obtain
the Langevin equation
∂φ
∂N= − V,φ
3H2+H
2πξ(N) . (3.1.19)
In the following section, we shall consider the conditions required for this
stochastic formalism to be a consistent approach.
3.2 Requirements for the stochastic approach
In order for the stochastic approach outlined above to be valid, we require three main
conditions to be met:
100

• quantum-to-classical transition
This requirement is what allows us to describe the coarse-grained field as a clas-
sical stochastic quantity, since we replace quantum operators by stochastic fields,
but we note that this is a non-trivial procedure. For instance, stochastic variables
always commute while quantum operators do not. From the last of Eqs. (3.1.11),
one can see that this notably implies the imaginary part of φkπ∗k to be negligi-
ble compared to its real part. During inflation, cosmological perturbations are
placed in a two-mode highly squeezed state on large scales and indeed experience
such a quantum-to-classical transition [218–220]. The only requirement for this
to happen is the dominance of a growing mode over a decaying mode, which
is guaranteed as long as perturbations get amplified outside the Hubble radius.
Note that this requirement is always satisfied and does not rely on slow roll or
any other approximation to be valid.
Furthermore, the importance of this first requirement should be taken with a
grain of salt. Hermitian two-point functions involving the field and its conju-
gate momentum, or any higher-order correlator involving only one phase-space
variable, can be well reproduced by a stochastic description regardless of the
amount of quantum squeezing [192, 221]. There are also a class of observables
called “improper” [222], the expectation values of which can never be reproduced
by a stochastic theory, even in the large-squeezing limit (giving rise e.g. to Bell
inequality violations [223, 224]).
The quantum-to-classical transition is therefore a delicate concept, which however
does not rely on the slow-roll approximation, and hence when we later study the
stochastic formalism beyond slow roll, this condition will not hinder the use of a
stochastic formalism outside the slow-roll regime.
• separate universe approach
Since the spatial gradients in the Langevin equations (3.1.13) and (3.1.14) are
neglected, one assumes that, on super-Hubble scales, each Hubble patch evolves
101
forward in time independently of the other patches, and under a locally FLRW
metric. This is the so-called separate universe picture [189, 225–229], or quasi-
isotropic [230–233] picture. The validity of this approximation beyond slow roll
has recently been questioned in Ref. [234], and in Sec. 3.3.1, we will show why
it is in fact still valid.
• use of the uniform-N gauge
In order to derive the Langevin equations (3.1.13) and (3.1.14), only the field
variables have been perturbed according to Eqs. (3.1.3) and (3.1.4), and not the
entries of the metric. In particular, the lapse function, i.e. A in the notation of
Eq. (1.3.36), has been neglected. This implies that the Langevin equations are
written in a specific gauge, namely the one where the time coordinate is fixed.
Since we work with the number of e-folds as the time variable, this corresponds
to the uniform-N gauge. In Eqs. (3.1.11), the field perturbations φk and πk must
therefore be calculated in that same gauge. However, it is common to compute
the field perturbations in the spatially-flat gauge, since in that gauge, they are
directly related to the gauge-invariant curvature perturbation, which is quantised
in the Bunch-Davies vacuum. One must therefore compute the correction to the
noise amplitude that comes from translating the field fluctuations in the spatially-
flat gauge to the uniform-N gauge, and this is what is done in detail in Sec. 3.3.2.
Let us note that one could work with a different time coordinate, hence in a
different gauge (for instance, working with cosmic time t would imply working in
the synchronous gauge). This is not a problem as long as one computes gauge-
invariant quantities in the end, such as the curvature perturbation ζ. However,
since ζ is related to the fluctuation in the number of e-folds in the so-called
“stochastic-δN formalism” [202, 235], we find it convenient to work with the
number of e-folds as a time variable. Another reason is that, as will be shown
in Sec. 3.3.2, in the slow-roll regime, the spatially-flat gauge coincides with the
uniform-N gauge (but not, say, with the synchronous gauge), which makes the
102

gauge correction identically vanish, and which explains why it is usually recom-
mended [202] (but not compulsory) to work with N as a time variable.
3.3 Stochastic inflation beyond slow roll
Having identified three main requirements for the stochastic formalism for inflation to
be valid, we note it is well known that these conditions are all satisfied in the slow-roll
limit of inflation, but they have not been studied in detail beyond this approxima-
tion. We therefore perform a systematic analysis of these conditions, and confirm that
stochastic inflation is valid well beyond the slow-roll regime.
As noted above, the quantum-to-classical transition of super-Hubble fluctuations
has no relation to slow roll of any other regime, and is therefore not studied any further
here. However, we demonstrate the validity of the separate universe approach to
evolving long-wavelength scalar field perturbations beyond slow roll, and also calculate
the gauge correction to the amplitude of the stochastic noise that is discussed above.
We show that this gauge correction vanishes in the slow-roll limit, but we also explain
how to calculate them in general, and explicitly compute the correction in different
cases, including ultra-slow roll and the Starobinsky model that interpolates between
slow roll and ultra-slow roll, and find the corrections to be negligible in practice. This
confirms the validity of the stochastic formalism for studying quantum backreaction
effects in the very early universe beyond slow roll.
This study is motivated by recent works where situations in which non-slow-roll
stochastic effects are at play have been highlighted [175–177, 236, 237]. For instance, if
the inflationary potential features a very flat section close to the end of inflation, large
curvature perturbations could be produced that later collapse into primordial black
holes. If such a flat portion exists, it may be associated with both large stochastic
diffusion [238] and deviations from slow-roll, e.g. the ultra-slow-roll regime [181, 182],
which we have already seen can be stable in some cases [180]. This explains the need
103

for implementing the stochastic inflation programme beyond slow roll, which is the
aim of this section.
3.3.1 Separate universes
We first consider the separate universe approach, which is valid when each causally-
disconnected patch of the universe evolves independently, obeying the same field
equations locally as in a homogeneous and isotropic (FLRW) cosmology. Combin-
ing Eqs. (3.1.1) and (3.1.2), it is straightforward to recover the Klein–Gordon equation
for a homogeneous field in an FLRW cosmology, φ(t), which is given by (1.3.10). In this
section, we derive the equation of motion for linear fluctuations about a homogeneous
scalar field from perturbations of the background FLRW equations of motion, i.e., the
separate universe approach. We show that the resultant equation of motion matches
the known result from cosmological perturbation theory, which is given by Eq. (1.3.41),
at leading order in a spatial gradient expansion, with or without slow roll.
Perturbed background equations
In order to easily relate the field fluctuation δφ to the Sasaki–Mukhanov variable, one
usually chooses to work in the spatially-flat gauge where ψ = 0, and hence Q = δφ
according to Eq. (1.3.40). Here, we will show how to perturb the background equations
in that gauge (see Sec. 3.3.1), but also in the uniform-N gauge that is used in stochastic
inflation (see Sec. 3.3.1).
Let us perturb the quantities appearing in Eq. (1.3.10), according to
φ→ φ+ δφ , dt→ (1 + A)dt , (3.3.1)
where A is the lapse function introduced in Eq. (1.3.36). Let us stress that the lapse
function needs to be perturbed, otherwise one is implicitly working in a synchronous
gauge (where A = 0), which in general differs from the spatially-flat and uniform-N
gauges, and this leads to inconsistencies [234]. Inserting Eq. (3.3.1) into Eq. (1.3.10)
104

gives rise to
δφ+
(3H +
φ2
2M2PlH
)˙δφ+
(φ
2M2PlH
V,φ + V,φφ
)δφ
−φA−(
2φ+ 3Hφ+φ3
2M2PlH
)A = 0 ,
(3.3.2)
where we have also used
δH =V,φδφ+ φ ˙δφ− φ2A
6M2PlH
(3.3.3)
that comes from perturbing the Friedmann equation (2.1.2) under Eq. (3.3.1).
Spatially-flat gauge
In the spatially-flat gauge, the lapse function can readily be rewritten in terms of the
field perturbation by imposing the momentum constraint (1.3.39), which simplifies to
A =φ
2M2PlH
δφ . (3.3.4)
Substituting this relation into Eq. (3.3.2) gives rise to
δφ+ 3H ˙δφ+
[V,φφ −
1
M2Pla
3
d
dt
(a3
Hφ2
)]δφ = 0 . (3.3.5)
Comparing Eq. (3.3.5), obtained from the perturbed background equations, with
Eq. (1.3.41), obtained in linear perturbation theory in the spatially-flat gauge where
Q = δφ, we see that the two are consistent in the super-Hubble limit where k aH.
It is important to note that the local proper time in each patch is perturbed with
respect to the cosmic time, t, in the background in the presence of a non-zero lapse
perturbation, A. As can be seen from Eq. (3.3.4) the perturbation A vanishes in the
spatially-flat gauge in the slow-roll limit, φ→ 0, and the local proper time in this limit
coincides with the background cosmic time. Beyond slow roll one must consistently
account for local variations in the proper time interval in different patches if one wants
105

to relate the separate universe equations to the perturbation equations written in terms
of a global (background) cosmic time. This will be the aim of Sec. 3.3.2.
Uniform-N gauge
Let us introduce the expansion rate of t = constant hypersurfaces
θ = nµ;µ , (3.3.6)
where nµ is the unit time-like vector, orthogonal to the constant-time hypersurfaces.
It is related to the metric perturbations in Eq. (1.3.36) according to [89]
θ =3
a
(H−HA− ψ′ + 1
3∇2σ
), (3.3.7)
whereH = a′/a is the conformal Hubble parameter, a prime is a derivative with respect
to conformal time η defined through dt = adη, and σ = E ′ −B is the shear potential.
From the perturbed expansion rate θ, one can define a perturbed integrated expansion
up to first order in the metric perturbations
N =1
3
∫θ(1 + A)dt = N − ψ +
1
3∇2
∫σdη . (3.3.8)
The last term in the right-hand side can be re-written in terms of EB ≡∫σdη, which
corresponds to E in the hypersurface-orthogonal threading where B = 0. From now
on, we work in such a spatial threading. This gives rise to
δN = −ψ +1
3∇2EB , (3.3.9)
i.e., the perturbation of the trace of the spatial metric on constant-time hypersurfaces.
Note, in particular, that in the spatially-flat gauge where ψ = B = 0, we have δN |ψ=0 =
13∇2EB|ψ=0.
106

The uniform-N gauge used in the Langevin equations (3.1.13) and (3.1.14) is
defined by keeping the integrated expansion unperturbed across all patches of the
universe, i.e. δN = 0. From Eq. (3.3.9), this imposes a direct relationship between ψ
and E, namely ψ = 13∇2EB. In the uniform-N gauge, we note that the perturbation
equation (1.3.37) can be written as
¨δφk + 3H ˙δφk +
(k2
a2+ V,φφ
)δφk = φAk − 2V,φAk
= φAk +(
2φ+ 6Hφ)Ak .
(3.3.10)
This can be recast in a form similar to the perturbed background equation (3.3.2),
namely
¨δφk +
(3H +
φ2
2M2PlH
)˙δφk +
(φ
2M2PlH
V,φ + V,φφ
)δφk
− φAk −(
2φ+ 3Hφ+φ3
2M2PlH
)Ak = ∆k
(3.3.11)
where the difference between Eqs. (3.3.2) and (3.3.10) is quantified as
∆k =φ
H
1
2M2Pl
[φ(
˙δφk − φAk)
+ V,φδφk
]+ 3H2Ak
− k2
a2δφk . (3.3.12)
If we now impose the energy constraint (1.3.38) in the uniform-N gauge, and recalling
that since we choose B = 0, ψ = 13∇2E, one can show that
∆k = −k2
a2
(δφk +
φ
Hψk
)= −k
2
a2Qk , (3.3.13)
see Eq. (1.3.40). Hence, since we neglect k2/a2 terms in the large-scale limit, the per-
turbation equations and the perturbed background equations become identical on large
scales. We conclude that the separate universe approach, describing the evolution of
long-wavelength perturbations about an FLRW background in terms of locally FLRW
107

patches, is valid in both the spatially-flat and uniform-N gauges. This result does not
rely on slow roll; we only require that we can neglect gradient terms on super-Hubble
scales.
Arbitrary gauge
Let us finally see how the above arguments can be formulated without fixing a gauge.
It is instructive to collect together metric perturbation terms in the Klein-Gordon
equation from the full linear perturbation theory, Eq. (1.3.37), which describe the
perturbation of the local expansion rate (3.3.7)
δθk = −3ψk −k2
a2
(a2Ek − aBk
)− 3HAk . (3.3.14)
Re-writing the perturbed Klein-Gordon equation (1.3.37) in terms of δθk we obtain
¨δφk + 3H ˙δφk +
(k2
a2+ V,φφ
)δφk =
(2φ+ 3Hφ
)Ak + φAk − φδθk . (3.3.15)
Finally, combining Eq. (3.3.15) with the background equation (1.3.10) and rewriting
the time derivatives in terms of the local proper time rather than the coordinate time,
∂/∂τ ≡ (1− A)∂/∂t, one obtains
∂2
∂τ 2(φ+ δφ) + θ
∂
∂τ(φ+ δφ) + V,φ(φ+ δφ) =
∇2
a2(δφ) . (3.3.16)
Thus we see that the perturbed Klein-Gordon equation (1.3.37) from cosmological
perturbation theory in an arbitrary gauge has exactly the same form, up to first order
in the inhomogeneous field and metric perturbations and up to spatial gradient terms of
order ∇2δφ, as the Klein-Gordon equation for a homogeneous scalar field in an FLRW
cosmology, Eq. (1.3.10), where we identify the local proper time, τ , with the coordinate
time, t, in an FLRW cosmology and the local expansion rate, θ/3, with the Hubble
rate, H, in an FLRW cosmology. However to relate these local quantities to a global
108

background coordinate system we need to fix a gauge. This cannot be determined by
the local FLRW equations but requires to use additional constraint equations from the
cosmological perturbation theory, as demonstrated in the preceding sub-sections for
the spatially-flat and uniform-N gauges.
3.3.2 Gauge corrections to the noise
In the previous section, it was explained that the field fluctuations, which determine the
noise correlators through Eq. (3.1.11), are usually calculated in the spatially-flat gauge,
where the field perturbations coincide with the Sasaki–Mukhanov variable. However,
we have seen that the local time in the spatially-flat gauge is in general perturbed with
respect to the global time. As stressed in Sec. 3.1, the Langevin equations (3.1.13)
and (3.1.14) are written in terms of the number of e-folds, i.e., the integrated expansion,
N , is used as a time variable. If we are to use the number of e-folds as a local time
coordinate and also as a global coordinate, relating the stochastic distribution of field
values in many different patches at a given time, then we need to work in the uniform-
N gauge. Thus one needs to gauge transform the field fluctuations calculated in the
spatially-flat gauge to the uniform-N gauge before evaluating Eq. (3.1.11), and in this
section, we explain how this can be done.
Gauge transformations
Let us denote quantities in the uniform-N gauge with a tilde, i.e. δN = 0. The
transformations from the spatially-flat to the uniform-N gauge can be written by means
of a gauge transformation parameter α (that will be determined below), according
to [89]
δφ→ δφ = δφ+ φ′α , (3.3.17)
ψ → ψ = ψ −Hα , (3.3.18)
EB → EB = EB +
∫αdη . (3.3.19)
109

Combining these transformation rules with Eq. (3.3.9), the perturbed integrated ex-
pansion transforms as
δN → δN = δN +Hα +1
3∇2
∫αdη . (3.3.20)
By definition, δN = 0, so one is lead to
δN∣∣∣ψ=0
+Hα +1
3∇2
∫αdη = 0 . (3.3.21)
Taking the derivative of this expression with respect to conformal time, one obtains a
differential equation for the gauge transformation parameter α, namely
3Hα′ +(3H′ +∇2
)α = S , (3.3.22)
where the source term reads
S = −3δN ′∣∣∣ψ=0
= −∇2σ∣∣∣ψ=0
. (3.3.23)
Two remarks are then in order. First, the source standing on the right-hand
side of Eq. (3.3.22) remains to be calculated. In Sec. 3.3.2, we will show that for
a scalar field it is related to the non-adiabatic pressure perturbation, and we will
explain how it can be calculated. In Sec. 3.3.2, we will provide the general solution
to Eq. (3.3.22). Second, once α is determined, the field fluctuations in the uniform-N
gauge can be obtained from those in the spatially-flat gauge via Eq. (3.3.17). The noise
correlators (3.1.11) also involve the fluctuation in the conjugate momentum, so this
needs to be transformed into the uniform-N gauge as well. However, precisely since N
is unperturbed in the uniform-N gauge, one simply has
δπ =dδφ
dN, (3.3.24)
110

and δπ can be inferred from δφ by a straightforward time derivative.
Non-adiabatic pressure perturbation
Let us now show that the source function, S(η) of Eq. (3.3.22), coincides with the
non-adiabatic pressure perturbation for a scalar field. This will prove that if inflation
proceeds along a phase-space attractor (such as slow roll), where non-adiabatic pressure
perturbations vanish, the source function vanishes as well; in this case Eq. (3.3.22) is
solved by α = 0, and there are no gauge corrections.
Let us start by recalling the expressions for the energy constraint in an arbitrary
gauge [89]
3H (ψ′ +HA)−∇2 (ψ +Hσ) = − a2
2M2Pl
δρ . (3.3.25)
Combining this with the momentum constraint (1.3.39) gives
∇2(ψ +Hσ) =a2
2M2Pl
δρcom , (3.3.26)
where the comoving density perturbation for a scalar field is given by
δρcom = δρ− ρ′
φ′δφ . (3.3.27)
This in turn can be related to the non-adiabatic pressure perturbation [89]
δPnad = − 2a2
3Hφ′V,φδρcom . (3.3.28)
In particular, in the spatially-flat gauge where ψ = 0, Eq. (3.3.26) becomes
H∇2σ|ψ=0 = − 3Hφ′4M2
PlV,φδPnad . (3.3.29)
111

Thus the source term S on the right-hand side of Eq. (3.3.22) reads
S =3φ′
4M2PlV,φ
δPnad , (3.3.30)
and it vanishes if the non-adiabatic pressure perturbation is zero, which is the case
whenever inflation proceeds along a phase-space attractor, φ′ = φ′(φ), such as during
slow roll.
In order to find a general expression for S(η), one can use the (arbitrary gauge)
expression for δρ for a scalar field [89],
δρ =φ′δφ′ − φ′2A
a2+ V,φδφ , (3.3.31)
and combine it with Eq. (3.3.26) to obtain
∇2(ψ +Hσ) =a2
2M2Pl
[(3Hφ+ V,φ
)δφ+ φδφ− φ2A
]. (3.3.32)
Hence, in terms of the field fluctuations in the spatially-flat gauge and using Eq. (3.3.4)
for the perturbed lapse function, one finds
S = − 1
2M2PlH
[(3Hφ′ + a2V,φ −
φ′3
2M2PlH
)Q+ φ′Q′
]. (3.3.33)
Introducing the second slow-roll parameter ε2 ≡ d ln ε1/dN , the source function can
be rewritten in the simpler form
S =Q√
2ε12MPl
sign(φ)
(Hε2
2− Q′
Q
). (3.3.34)
112

General solution
When written in Fourier space, the differential equation (3.3.22) for αk has the general
solution
αk =1
3H
∫ η
η0
Sk(η′) exp
[k2
3
∫ η
η′
dη′′
H(η′′)
]dη′ . (3.3.35)
In this expression, η0 is an integration constant that defines the slicing relative to
which the expansion is measured. In what follows, we will consider situations in which
an attractor is reached at late times. Since, in such a regime, the gauge correction
vanishes (given that the non-adiabatic pressure perturbation does), we will take η0 in
the asymptotic future, i.e. η0 = 0−.
Finally, in Eq. (3.3.34) the Sasaki–Mukhanov variable, Q, needs to be deter-
mined, which can be done by solving the Sasaki–Mukhanov equation
v′′k +
(k2 − z′′
z
)vk = 0 , (3.3.36)
where vk = aQk and z ≡ a√
2ε1 MPl. One can show that, in full generality z′′/z =
H2(2−ε1 +3ε2/2−ε1ε2/2+ε22/4+ε2ε3/2), where we have introduced the third slow-roll
parameter ε3 ≡ d ln ε2/d lnN . Recall that, in terms of the field acceleration parameter
f = −φ/(3Hφ) and the dimensionless mass parameter µ = V,φφ/(3H2), we can write
z′′/z as
z′′
z= H2
(2 + 5ε1 − 3µ− 12fε1 + 2ε21
), (3.3.37)
as given in Eq. (1.3.48).
The following three sections will be devoted to three case studies, for which
Eq. (3.3.36) will be solved and Eq. (3.3.35) will be evaluated in order to derive the gauge
corrections to the stochastic noise correlators in the uniform-N gauge with respect to
those in the spatially-flat gauge. In all cases, we will find that at the order of the
coarse-graining parameter at which the stochastic formalism is derived, these gauge
corrections can be neglected.
113

3.3.3 Case study 1: slow roll
Let us first apply the programme sketched above to the case of slow-roll inflation.
As argued before, the presence of a dynamical attractor in that case makes the non-
adiabatic pressure perturbation vanish, hence we should not find any gauge correction
to the field fluctuations in the uniform-N gauge and thus to the correlators for the
noise. This is therefore a consistency check of our formalism.
At leading order in slow roll, the slow-roll parameters can simply be evaluated
at the Hubble-crossing time η∗ ' −1/k, since their time dependence is slow-roll sup-
pressed, i.e. ε1 = ε1∗ + O(ε2), etc. At that order, Eq. (3.3.36) is solved according
to
vk =
√−πη2
H(2)ν (−kη) = aQk , (3.3.38)
where H(2)ν is the Hankel function of the second kind and ν ≡ 3/2 + ε1∗ + ε2∗/2, see
Sec. 1.3.4. Since the coarse-graining parameter is such that σ 1, the mode functions
in Eq. (3.1.11) need to be evaluated in the super-Hubble regime, i.e. when −kη 1.
One can therefore make use of the asymptotic behaviour
H(2)ν (−kη) ' iΓ(ν)
π
(2
−kη
)ν [1 +
1
4(ν − 1)(−kη)2 +O
(k4η4
)]. (3.3.39)
On the other hand, at first order in slow roll, the scale factor can also be expanded,
and one finds [191]
a = − 1
H∗η
[1 + ε1∗ − ε1∗ ln
(η
η∗
)+O(ε2)
], (3.3.40)
where we have used the expressionH ' − 1η
(1 + ε1∗) derived in Appendix B. Combining
the two previous equations then leads to
Q′kQk
'32
+ ε1∗ − νη
+72− ν
4(ν − 1)k2η , (3.3.41)
114

which is valid at next-to-leading order both in the slow-roll parameters and in kη.
With the expression given above for ν, one can see that Q′k/Qk ' −ε2/(2η) at leading
order in kη. Since, at leading order, H ' −1/η, the two terms in the right-hand side
of Eq. (3.3.34) exactly cancel, and the source function Sk vanishes. This confirms that
the gauge corrections are indeed suppressed in that case.
In fact, the first contribution to the gauge correction comes from the decaying
mode, and for completeness we now derive its value. Plugging the previous expressions
into Eq. (3.3.34) leads to
Sk =i
2
H∗MPl
√kε1∗ η (−kη)−ε1∗−
ε2∗2 sign
(φ). (3.3.42)
One can then insert Eq. (3.3.42), along with H = −(1 + ε1∗)/η, into Eq. (3.3.35),
and derive the gauge transformation parameter from the spatially-flat gauge to the
uniform-N gauge in the large-scale and slow-roll limit,
αk =iH∗√ε1∗
12MPl
k−52 (−kη)3−ε1∗− ε2∗2 sign
(φ). (3.3.43)
In the uniform-N gauge, according to Eq. (3.3.17), the field fluctuation thus reads
δφk = Qk
[1− ε1∗
6(−kη)2
], (3.3.44)
and its deviation from Q is therefore both slow-roll suppressed and controlled by the
amplitude of the decaying mode. Since it needs to be evaluated at the coarse-graining
scale kσ = σaH in Eq. (3.1.11), the relative gauge correction to the correlations of the
noises scales as ε1σ2, which can be neglected since the stochastic formalism assumes
σ → 0.
115

3.3.4 Case study 2: ultra-slow roll
Let us now consider the case of ultra-slow-roll (USR) inflation [180–182], where the
dynamics of φ is friction dominated and the gradient of the potential can be neglected
in the Klein–Gordon equation (1.3.10), which becomes
φ+ 3Hφ ' 0 . (3.3.45)
This gives rise to φUSR ∝ e−3N , hence φ = φin+3H(φin−φ). The phase-space trajectory
thus carries a dependence on initial conditions that is not present in slow roll, which
explains why ultra-slow roll is not a dynamical attractor while slow roll is. We therefore
expect the non-adiabatic pressure perturbation not to vanish in ultra-slow roll, which
may lead to some non-trivial gauge corrections. In ultra-slow roll, the field acceleration
parameter f introduced in Eq. (2.2.1) is close to one (while it is close to zero in slow
roll), so δ ≡ 1− f quantifies how deep in the ultra-slow-roll regime one is. In the limit
where δ = 0, φUSR ∝ e−3N gives rise to εUSR1 ∝ e−6N/H2, hence
εUSRn =
−6 + 2ε1 if n is even
2ε1 if n > 1 is odd .
(3.3.46)
The even slow-roll parameters are therefore large in ultra-slow roll. When δ does not
strictly vanish, these expressions can be corrected, and for the second and the third
slow-roll parameters, one finds
ε2 = −6 + 2ε1 + 6δ , (3.3.47)
ε3 = 2ε1 −dδ
dN
6
6− 2ε1 − 6δ, (3.3.48)
116

which are exact formulas. One can then calculate
dδ
dN= −µ+ 3δ − 3δ2 + δε1 , (3.3.49)
where µ is the dimensionless mass parameter defined in Eq. (1.3.47). For small δ and
ε1, one then has
εUSR3 ' 2ε1 + µ− 3δ + µ
(2ε1 + 6δ
6
). (3.3.50)
There is no reason, a priori, that µ needs to be small, and hence these corrections can
be large for models with V,φφ 6= 0. Note also that Eq. (3.3.49) provides a criterion for
the stability of ultra-slow roll, which is stable when the right-hand side of this equation
is negative, in agreement with the results of Ref. [180].
Let us now derive the gauge corrections in ultra-slow roll. We perform a calcu-
lation at leading order in ε1, δ and µ, but in Appendix C the calculation is extended to
next-to-leading order in ε1, and it is shown that the result derived below is indeed valid.
At leading order, one simply has z′′/z ' 2H2, hence Eq. (3.3.36) is solved according to
vk =1√2k
e−ikη(
1− i
kη
). (3.3.51)
Since a = −1/(H∗η) at leading order, this gives rise to
Q′kQk
=−ik2η
kη − i , (3.3.52)
and the source function (3.3.34) reads
Sk =H∗
2MPl
√ε1ke−ikη
(3− 3i
kη+ ikη
)sign
(φ). (3.3.53)
117

Since ε1 ' ε1∗(a/a∗)−6, the gauge transformation parameter α can be obtained from
Eq. (3.3.35) and is given by
αk =iH∗√ε1∗
6MPl
k−52 (kη)4sign
(φ) [
1 +O(kη)2]. (3.3.54)
Comparing this expression with Eq. (3.3.43), one can see that the gauge correction
decays even faster than in the slow-roll regime, hence is even more suppressed. This
is because, although slow roll is a dynamical attractor while ultra-slow roll is not, the
field velocity (hence the conjugate momentum) decays very quickly in ultra-slow roll,
and this also damps away one of the two dynamical degrees of freedom. Finally, the
gauge transformation (3.3.17) gives rise to
δφk = Qk
[1 +
ε1∗3
(−kη)6]. (3.3.55)
The relative corrections to the noises correlators scale as ε1∗σ6 and can therefore be
neglected, even more accurately than in slow roll.
3.3.5 Case study 3: Starobinsky model
In the two previous sections, we have shown that the gauge corrections to the noise
correlators are negligible both in slow-roll and in ultra-slow-roll inflation. In this
section, we consider a model that interpolates between these two limits, namely the
Starobinsky piece-wise linear model [200]. This allows us to study a regime that is
neither slow roll nor ultra-slow roll, but for which the early-time (ultra-slow roll) and
the late-time (slow roll) limits are under control.
The Starobinsky model is based on a potential made up of two linear parts with
different gradients defined by the dimensionless parameters a+ a− > 0:
V (φ) =
V0
(1 + a+
φMPl
)forφ > 0
V0
(1 + a−
φMPl
)forφ < 0
. (3.3.56)
118

−0.004 −0.002 0.000 0.002φ/M
Pl
10−2
10−1
100
δ=
1−f
V0 = 10−12M4Pl
a+ = 10−2
a− = 10−4
numerical
analytical
approximation
−0.006 −0.005 −0.004 −0.003 −0.002 −0.001 0.000φ/M
Pl
10−38
10−33
10−28
10−23
10−18
10−13
10−8
10−3
∣ ∣ ∣1−δφ
k/Q
k
∣ ∣ ∣
V0 = 10−12M4Pl
a+ = 10−2
a− = 10−4
Starobinsky model
slow roll
ultra− slow roll
Figure 3.1. Left panel: field acceleration parameter, f defined in (2.2.1), in the Starobinskymodel. The red curve corresponds to a numerical integration of the Klein–Gordon equa-tion (1.3.10), the dashed black curve corresponds to the analytical solution (3.3.61), whilethe dotted green line stands for the approximation (3.3.62). Right panel: fractional gaugecorrection to the field perturbation in the uniform-N gauge in the Starobinsky model, for amode such that k/aH = 10−2 at the transition time t = 0. The black line corresponds to thefull result (3.3.70), the blue line stands for the slow-roll result (3.3.44), and the green line is
the ultra-slow-roll result (3.3.55). Solid lines are such that 1− δφk/Qk > 0 and dashed lines
are such that 1− δφk/Qk < 0.
In order to ensure both parts of the potential are able to support slow-roll inflation,
we require a± 1.
The dynamics of the inflaton, as it evolves across the discontinuity in the po-
tential gradient at φ = 0, can be split into three phases. The first phase, which we
label SR+, is a slow-roll phase for φ > 0 and φ < 0. When the inflaton crosses φ = 0,
it then starts down the φ < 0 part of the potential with an initial velocity inherited
from the first slow-roll phase SR+ that is much larger than the slow-roll velocity for
φ < 0. The second phase thus starts in an ultra-slow-roll regime and is denoted USR.
It corresponds to the field range φUSR→SR < φ < 0. Finally, the inflaton relaxes back
to slow roll for φ < φUSR→SR, and we call this third phase SR−.
During the USR phase the Hubble parameter can be taken as approximately
constant, H ' H0 =√V0/(3M2
Pl) ; the consistency of that assumption will be checked
119

below. The Klein–Gordon equation (1.3.10) then becomes φ+ 3H0φ+ V0a−/MPl = 0,
and can be solved to give
φ(t)
MPl
=a+ − a−
3
(e−3H0t − 1
)− a−H0t , (3.3.57)
where we choose t = 0 to denote the time when φ = 0, and the initial velocity is set
such that its value at the transition point is given by its slow-roll counterpart in the
φ > 0 branch of the potential, i.e. φ(φ = 0−) = φ(φ = 0+) = −H0a+. The acceleration
parameter defined in Eq. (2.2.1) is then given by
f(t) = 1− a−a− + (a+ − a−)e−3H0t
. (3.3.58)
At the transition time, it reads f(t = 0) = 1− a−a+
, so if a−/a+ 1, f ' 1 and ultra-
slow roll takes place. At late time, however, f is damped so that the system relaxes
back to a phase of slow-roll inflation. Note that the solution (3.3.57) can be inverted,
H0t(φ) =1
3
(1− a+
a−
)− φ
MPla−+
1
3W0
[a+ − a−a−
exp
(a+
a−− 1 + 3
φ
MPla−
)],
(3.3.59)
where W0(x) is the 0-branch of the Lambert function, which leads to the phase-space
trajectory
φ(φ) = −MPl
HH2
0a−
1 +W0
[a+ − a−a−
exp
(a+
a−− 1 + 3
φ
MPla−
)]. (3.3.60)
In the denominator of the first term in the right-hand side, H is left to vary [239], in
such a way that at late time, i.e. when φ goes to −∞, one recovers the slow-roll result
φ = −MPlH20a−/H. Plugging Eq. (3.3.59) into Eq. (3.3.58) also leads to
f(φ) = 1− 1
1 +W0
[a+−a−a−
exp(a+a−− 1 + 3 φ
MPla−
)] , (3.3.61)
120
which is shown in Fig. 3.1 with the dashed black line and compared to a numerical
solution of the Klein–Gordon equation displayed with the solid red line. One can check
that f starts from a value close to one at early time and approaches zero at late time.
If one expands Eq. (3.3.61) around φ = 0, one obtains
f ' 1− a−
a+ + 3 φMPl
, (3.3.62)
which matches Eq. (4.3) of Ref. [180]. This approximation is also shown in Fig. 3.1,
with the dotted green line.
From Eq. (3.3.61), the transition time between USR and SR−, defined as the
time when f = 1/2, is found to be
tUSR→SR =1
3H0
ln
(a+ − a−a−
), (3.3.63)
which is consistent with Eq. (4.5) of Ref. [180]. Making use of Eq. (3.3.57), the field
value at which this happens is given by
φUSR→SR = −MPl
3
[a+ − 2a− + a− ln
(a+ − a−a−
)]' −a+
3MPl , (3.3.64)
where the last expression is derived in the limit a−/a+ 1 and agrees with Eq. (4.4)
of Ref. [180]. This allows us to test the assumption made above that the potential,
hence the Hubble parameter, does not vary much during the USR phase. The relative
shift in the potential value between φ = 0 and φUSR→SR is indeed given by
∆V
V=a−(a+ − a−)
3 1 , (3.3.65)
which justifies the above assumption.
Let us now calculate the gauge transformation from the spatially-flat to uniform-
N gauge in this model. As explained above, combining Eq. (3.3.60) and (3.3.57) leads
121

to
φ(t) =H2
0MPl
H
[(a− − a+)e−3H0t − a−
], (3.3.66)
that allows us to both describe the USR and the SR− phases, as well as the transition
between the two. Making use of the relation ε1 = φ2/(2M2PlH
2), one obtains
ε1(t) =1
2
(H0
H
)4 [a− − (a− − a+)e−3H0t
]2
ε2(t) = − 6(a− − a+)e−3H0t
(a− − a+)e−3H0t − a−+ 4ε1(t) .
(3.3.67)
One can check that, at late times, one recovers ε2 = 4ε1, which is indeed satisfied in
slow roll for linear potentials, see Eqs. (B.0.14) and (B.0.15).
Since µ = 0 in this model, the fact that ε1 remains small implies that Eq. (1.3.48)
is close to its de-Sitter limit. Moreover, one can check that, at early times, the term
Q′k/Qk in Eq. (3.3.34) provides a subdominant contribution, hence it is sufficient to
evaluate Q′k/Qk at late time and use the result of Eq. (3.3.41), Q′k/Qk ' −ε2∗/(2η) +
k2η = a2−/η + k2η. One then obtains
S =iH0
MPl
sign(φ)
(2k)32η
3(a− − a+)e−3H0t
(1 +
a2−3
)− a3
−
+[a− + (a+ − a−)e−3H0t
]3 − k2η2[(a− − a+) e−3H0t − a−
].
(3.3.68)
From Eq. (3.3.35), we then find the gauge transformation parameter to be
α ' −iηH0
3(2k)32MPl
sign(φ)[(kη)2
2a− + (a− − a+) e−3H0t
(1 +
a3−2
)
+ a2− (a+ − a−) e−3H0t +
a− (a+ − a−)2
2e−6H0t +
(a+ − a−)3
9e−9H0t
],
(3.3.69)
where only the (kη)2-suppressed term that becomes dominant at late times has been
kept, i.e. there are other (kη)2 terms that have been dropped for consistency since
122

they always provide sub-dominant contributions. One can check that at early time,
i.e. when t→ 0, the ultra-slow-roll expression (3.3.54) is recovered if a−/a+ 1, while
at late time, i.e. when t→∞, the slow-roll expression (3.3.43) is recovered. This gives
rise to the gauge correction
δφk/Qk = 1+1
6
(H0
H
)3 [(a− − a+) e−3H0t − a−
][
(kη)2
2a− + (a− − a+) e−3H0t
(1 +
a2−3
)
+ a2− (a+ − a−) e−3H0t +
a− (a+ − a−)2
2e−6H0t +
(a+ − a−)3
9e−9H0t
],
(3.3.70)
which is displayed in the right panel of Fig. 3.1 for a mode such that k/aH = 10−2
at the transition time t = 0. Right after the transition point, one can check that the
ultra-slow-roll result (3.3.55) is recovered (the slight discrepancy is due to the finite
value of a−/a+, i.e. the finite initial value of δ, we work with in Fig. 3.1), and at late
time, the slow-roll result (3.3.44) is obtained. In between, the gauge correction to the
noise correlators remains tiny and can therefore be safely neglected.
Thus, from the analysis in this section, we can conclude that the stochastic
formalism for inflation in valid well beyond the usual slow-roll approximation. We
have confirmed the the separate universe approach, which is one of the main pillars
that stochastic inflation rests on, is valid and does not require slow roll. Furthermore,
we have considered the subtle gauge dependence that arises from our choice to use
stochastic inflation in the uniform-N gauge, and have found that in practical situa-
tions (slow roll, ultra-slow roll, and models that interpolate between them) the gauge
transformation is trivial on super-Hubble scales, and stochastic inflation can be ap-
plied as usually formulated and without further refinements. Note that this does not
preclude the existence of situations where these gauge effects might be significant, but
in such cases, Eqs. (3.3.17), (3.3.24), (3.3.34) and (3.3.35) provide the key formulas to
compute them.
123

The validity of stochastic inflation beyond slow roll is an important result when
one wants to consider the production of primordial black holes, the formation of which
is likely to require regimes of inflation that both undergo large stochastic diffusion and
violate slow roll. These implications for primordial black hole formation will be studied
in detail in chapters 4 and 5, respectively.
3.4 The δN formalism
In order to calculate the mass fraction of primordial black holes, we need to find the
probability distribution of the coarse-grained curvature perturbations, see Eq. (1.5.1).
In this section, we will explain how this can be done using the stochastic-δN formalism.
3.4.1 The classical-δN formalism
The starting point of the stochastic-δN formalism is the standard, classical δN formal-
ism [62, 225, 229, 240–242], which provides a succinct way of relating the fluctuations
in the number of e-folds of expansion during inflation for a family of homogeneous
universes with the statistical properties of curvature perturbations. Starting from the
unperturbed flat Friedmann-Lemaıtre-Robertson-Walker metric
ds2 = −dt2 + a2(t)δijdxidxj , (3.4.1)
deviations from isotropy and homogeneity can be added at the perturbative level and
contain scalar, vector and tensor degrees of freedom. Gauge redundancies associated
with diffeomorphism invariance allow one to choose a specific gauge in which fixed time
slices have uniform energy density and fixed spatial worldlines are comoving (in the
super-Hubble regime this gauge coincides with the synchronous gauge supplemented
by some additional conditions that fix it uniquely). Including spatial perturbations
124

only, one obtains [62, 189, 243]
ds2 = −dt2 + a2(t)e2ζ(t,x)δijdxidxj , (3.4.2)
where ζ is the adiabatic curvature perturbation mentioned in Sec. 1.5. One can then
introduce a local scale factor
a(t,x) = a(t)eζ(t,x) , (3.4.3)
which allows us to express the amount of expansion from an initial flat space-time slice
at time tin to a final space-time slice of uniform energy density as
N(t,x) = ln
[a(t,x)
a(tin)
]. (3.4.4)
This is related to the curvature perturbation ζ via Eq. (3.4.3), which gives rise to
ζ(t,x) = N(t,x)− N(t) ≡ δN , (3.4.5)
where N(t) ≡ ln [a(t)/a(tin)] is the unperturbed expansion. This expression forms the
basis of the δN formalism, which follows by making the further simplifying assumption
that on super-Hubble scales, each spatial point of the universe evolves independently
and this evolution is well approximated by the evolution of an unperturbed universe.
This is the separate Universe approximation discussed previously, and it allows us to
neglect spatial gradients on super-Hubble scales. As a consequence, N(t,x) is the
amount of expansion in unperturbed, homogeneous universes, and ζ can be calculated
from the knowledge of the evolution of a family of such universes.
We can also write the δN formalism in terms of the inflaton field φ by perturbing
φ(x) = φ + δφ(x). Here, φ is a homogeneous, unperturbed field value and δφ is
a perturbation that we view as originating from vacuum fluctuations. We can then
125

rewrite (3.4.5) as
ζ(t,x) = N(ρ(t), φ(x))− N(ρ(t), φ) , (3.4.6)
in which we now evaluate N in unperturbed universes from an initial field value φ to
a final hypersurface where the energy density has a given value ρ. We can also expand
the curvature perturbation as
ζ(t,x) = δN ' ∂N
∂φδφ , (3.4.7)
since we know that observed curvature perturbations are approximately Gaussian, and
where we can simply evaluate N using the classical formula
N(φ) =1
MPl
∫dφ√2ε1
. (3.4.8)
We can now evaluate the power spectrum of curvature perturbations using the standard
δN formalism. Working with the reduced power spectrum Pζ = k3/(2π2)Pζ , which can
be expressed in term of the power spectrum of δφ through Eq. (3.4.7). Indeed, from
Eq. (3.1.15) with ν ' 3/2, we can calculate the de Sitter power spectrum for a light
field to be
Pδφ(k) =k3
2π2|φk|2 =
(H
2π
)2
, (3.4.9)
where H is to evaluated at horizon crossing (k = aH). Finally, we can combine this
with Eq. (3.4.8) to find
Pζ(k) =1
2M2Plε1
(H
2π
)2
, (3.4.10)
which matches Eq. (1.3.67) exactly. The approach explained here is the standard δN
formalism, and in the next section we combine this with the stochastic approach to
inflation, to obtain the stochastic-δN formalism.
126

v
end UV
Figure 3.2. Sketch of the single-field stochastic dynamics solved in this work. Starting fromφ∗ at initial time, the inflaton field φ evolved along the potential v(φ) under the Langevinequation (3.4.11), until φ reaches φend where inflation ends. A reflective wall is added at φuv
to prevent the field from exploring arbitrarily large values. The number of e-folds realisedalong a family of realisations of the Langevin equation is calculated, and gives rise to theprobability distribution of curvature perturbations using the δN formalism.
3.4.2 The stochastic-δN formalism
The δN formalism relies on the calculation of the amount of expansion realised amongst
a family of homogeneous universes. When stochastic inflation is employed to describe
such a family of universes and to calculate the amount of expansion realised in them,
this gives rise to the stochastic-δN formalism [202, 235, 244–248].
This approach is sketched in Fig. 3.2 for the case of the stochastic formalism in
slow roll, where the Langevin equation (3.1.14) for φ (where we have dropped the bar
notation but note this equation is only valid on super-Hubble scales) is simply
dφ
dN= − V ′
3H2+H
2πξ (N) , (3.4.11)
where for ease of notation we now take a prime to mean differentiation with respect to
the inflation field φ, i.e. ′ = ddφ
. Starting from φ = φ∗ at an initial time, the inflaton
127
field evolves along the potential v(φ) under the Langevin equation (3.4.11), where
hereafter we use the rescaled dimensionless potential
v ≡ V
24π2M4Pl
, (3.4.12)
until it reaches φend where inflation ends. A reflective wall is added at φuv to prevent
the field from exploring arbitrarily large values, which can be necessary to renormalise
infinities appearing in the theory [248] (whose results are still independent of φuv and of
the exact nature of the wall, reflective or absorbing, provided φuv lies in some range).
For example, in Ref. [247] it was shown that for a single field monomial potential
v(φ) = φp, one can safely take the reflective wall to infinity, φuv → ∞. In this case,
the probability of the inflaton interacting with the reflective wall becomes zero (for
any p ≥ 0), and the physical nature of the wall becomes irrelevant. This remains true
even for p < 1, despite the fact that in this case the mean number of e-folds diverges
as φuv → ∞. However, in the case of a flat potential at the end of inflation, such the
case considered in Sec. 4.5.2, if the value of φuv is finite then it becomes an important
physical parameter that denotes the end of the flat portion of the potential, which we
will see also denotes the end of the stochastic dominated region of the potential.
The amount of expansion realised along a given trajectory is called N , which is
a stochastic variable. Thanks to the δN formalism, the fluctuation in this number of
e-folds, N −〈N〉, is nothing but the coarse-grained curvature perturbation ζcg defined
in Eq. (1.5.2),
δNcg (x) = N (x)− 〈N〉 = ζcg (x) =1
(2π)3/2
∫ kend
k∗
dkζkeik·x , (3.4.13)
where k∗ and kend are the wavenumbers that cross the Hubble radius at initial and
final times when φ = φ∗ and φ = φend respectively. Since, as explained in Sec. 4.1, the
128

calculation of the PBH mass function relies on the PDF of coarse-grained curvature
perturbations, the next step is to calculate the PDF of δNcg.
Before doing so, let us note that quantities related to ζ, and not ζcg, can also
be calculated in the stochastic-δN formalism. For the power spectrum Pζ for instance,
since the coarse-grained δNcg receives an integrated contribution of all modes exiting
the Hubble radius during inflation, 〈δN2cg〉 =
∫ kendk∗Pζdk/k, one has [202, 235]
Pζ =d⟨δN2
cg
⟩
d 〈N〉 , (3.4.14)
where we have used the relation 〈N〉 = ln(aend/a∗) = ln(kend/k), where the last equality
is valid at leading order in slow roll only. In the same manner, the local bispectrum
can be written as Bζ ∝ d2〈δN3cg〉/d〈N〉2, from which the effective f local
NL parameter,
measuring the ratio between the bispectrum and the power spectrum squared, is given
by
f localNL =
5
72
⟨δN3
cg
⟩
d 〈N〉2
(d⟨δN2
cg
⟩
d 〈N〉
)−2
. (3.4.15)
3.5 First passage time analysis
In this section, we describe a technique called “first passage time analysis”, which
allows us to calculate the mean number of e-folds that the inflaton realises between
two points, as well as higher order moments of a probability distribution of N , and was
first applied to stochastic inflation inflation in Refs. [201, 202]. As well as reviewing
this technique, we use this section to extend these methods to include DBI inflation
[249, 250] (named for Dirac–Born–Infeld), which is a new result. This model of inflation
includes non-canonical kinetic terms, and is motivated by some models of string theory
(see, for example, [251–253]), and the inflaton is thought of as the distance between
two branes.
129

3.5.1 DBI inflation
As before, we consider single scalar field inflation, but in DBI inflation we have a
non-canonical kinetic term. Since this model is motivated from string theory, it is
orignally described by a 10 dimensional theory. Once compactified to four dimensions,
the classical effective 4D action is given by [254]
S = −∫
d4x√−g
[M2
PlR + V (φ)−(γ (φ, ∂µφ)− 1
γ (φ, ∂µφ)
)T (φ)
], (3.5.1)
where R is the 4D Ricci scalar, T (φ) is called the “warp factor”, and
γ (φ, ∂µφ) =
(1 +
gµν∂µφ∂νφ
T (φ)
)− 12
(3.5.2)
is defined as the Lorentz factor. For an FLRW background, the Friedmann and Klein–
Gordon equations then read
3M2PlH
2 = (γ − 1)T (φ) + V (φ) , (3.5.3)
φ+3H
γ2φ = −3γ − γ3 − 2
2γ3T ′(φ)− V ′(φ)
γ3. (3.5.4)
This shows us that γ → 1 returns canonical kinetic terms. Also, γ describes how the
speed of sound cs of this model behaves through γ = 1cs
. For DBI inflation in an FLRW
background, we have the explicit form [254, 255]
γ =1√
1− φ2
T (φ)
=
√1 +
4M4Pl
T (φ)
(dH
dφ
)2
, (3.5.5)
where the second equality follows from the Friedmann and Klein–Gordon equations in
FLRW DBI inflation.
In the regime γ → 1, φ behaves as usual and obeys the standard Klein–Gordon
equation (1.3.10), and hence if the potential is sufficiently flat then the inflaton can
130

slow roll. However, from Eq. (3.5.5), we see that the velocity of the inflaton can never
exceed√T (φ) , even if the potential becomes steep3.
When we include the non-canonical kinetic term of DBI inflation, the slow-roll
Langevin equation (3.4.11) is modified to become [254]
dφ
dN= − V ′
3γH2+H
2πξ(N) , (3.5.6)
This is the stochastic equation of motion for slow-roll DBI inflaton and is the
starting point for our following analysis.
3.5.2 Mean Number of e-folds
Here we will calculate the mean number of e-folds the inflaton experiences between an
initial and a final field value.
Calculating the Mean
For a given wavenumber k, let φ∗(k) be the value of the course-grained field φ = φcl+δφ
when k crosses the Hubble radius. If inflation ends at φend, let N (k) be the number
of e-folds realised between φ∗(k) and φend. Here N is a stochastic quantity, and its
variance is given by
δN 2(k) =⟨N 2(k)
⟩− 〈N (k)〉2 . (3.5.7)
Before outlining our computational programme, we shall first derive the so-
called Ito lemma, which is a relation obeyed by any smooth function f of φ, for the
case of DBI inflation. From the Langevin equation (3.5.6), we have
dφ = −M2PlV′
γVdN +
H
2πξdN . (3.5.8)
3The limit φ →√T (φ) (i.e. γ → ∞) can therefore be thought of as an extra, “ultra-relativistic”
regime of inflation.
131
and hence if f(φ) is a smooth function and φ obeys (3.5.6), then by Taylor expansion
we have
df [φ(N)] = f(φ+ dφ)− f(φ)
= f ′dφ+1
2f ′′dφ2 + . . .
' f ′[φ(N)]√
2v[φ(N)]MPlξ(N)dN −M2Pl
f ′[φ(N)]
γ[φ(N)]
v′[φ(N)]
v[φ(N)]dN
+ f ′′[φ(N)]v[φ(N)]M2PldN ,
(3.5.9)
where we have defined the dimensionless potential v to be
v =V
24π2M4Pl
' H2
8π2M2Pl
, (3.5.10)
with the second approximation valid in slow-roll. Note that, in Eq. (3.5.9) even though
we only keep terms of order dN , we must work at order dφ2 initially, as some of these
terms reduce to linear order when we work in Ito calculus [256]. We assume the inflation
starts at φ = φ∗ and evolves until inflation ends, at φ1 < φ∗. We then have N = Nat φ = φ1. Integrating (3.5.9) between N = 0 (at φ = φ∗) and N = N then gives a
generalised Ito lemma, namely
f(φ1)− f(φ∗) =
∫ N
0
f ′[φ(N)]√
2v[φ(N)]MPlξ(N)dN
+
∫ N
0
M2Pl
[f ′′[φ(N)]v[φ(N)]− f ′[φ(N)]
γ[φ(N)]
v′[φ(N)]
v[φ(N)]
]dN .
(3.5.11)
In order to calculate the mean number of e-folds 〈N〉, we look to use the Ito
lemma (3.5.11) and define a function f(φ) such that
M2Pl
[f ′′[φ(N)]v[φ(N)]− f ′[φ(N)]
γ[φ(N)]
v′[φ(N)]
v[φ(N)]
]= −1 , (3.5.12)
132

with boundary condition f(φ1) = 0, so that the last integrand in the Ito lemma becomes
−1. We can thus evaluate (3.5.11) for our choice of f and find
N = f(φ∗) + f ′[φ(N)]√
2v[φ(N)]MPlξ(N) . (3.5.13)
Taking the stochastic average of this expression over multiple realisations then gives
〈N〉 = f(φ∗) , (3.5.14)
since 〈ξ〉 = 0 because ξ is a Gaussian noise. Therefore, if we solve (3.5.12) and evaluate
the result at φ∗ we will find the mean value of N . Doing this yields
f(φ) =
∫ φ
φend
dy
M2Pl
∫ φ
y
dx
v(x)exp
[∫ y
x
v′(z)
γ(z)v2(z)dz
], (3.5.15)
where φ = φ(φ1) is an integration constant allowing us to satisfy our boundary condi-
tions. Thus, we can evaluate f(φ∗) and find the mean number of e-folds to be
〈N〉 =
∫ φ∗
φend
dy
M2Pl
∫ φ
y
dx
v(x)exp
[∫ y
x
v′(z)
γ(z)v2(z)dz
]. (3.5.16)
Note that in the case γ = 1 this reduces to the standard result for canonical stochastic
inflation [202]. This technique is called “first passage time analysis”, and we now
discuss the “classical limit” of this expression, before explaining how to extend this
technique to calculate higher order moments of the distribution of the number of e-
folds.
Classical Limit
While (3.5.16) is an exact expression, it can be hard to deduce exact general behaviour
from this form, and so we seek a “classical limit” in which we can check the consistency
of our result (i.e. if we can recover known canonical results) and to gain some intuition
133

for the leading order behaviour. As such, we perform a saddle-point approximation
around a point y, where the exponent is maximal. Taylor expanding the exponent
around y gives
∫ y
x
v′(z)
γ(z)v2(z)dz ' − v′(y)
γ(y)v2(y)(x− y)
+
(v′(y)γ′(y)
γ2(y)v2(y)+ 2
v′2(y)
γ(y)v2(y)− v′′(y)
γ(y)v2(y)
)(x− y)2
2.
(3.5.17)
By also Taylor expanding 1v(x)
around y to first order, and imposing that (γ[y]v[y])2 is
sufficiently small, gives
〈N〉 |cl =1
M2Pl
∫ φ∗
φend
γ(y)v(y)
v′(y)dy . (3.5.18)
This classical limit is valid as long as the Taylor expansion (3.5.17) converges,
and we quantify this be imposing that the second term must be small, which leads us
to define a classicality criterion by
ηcl ≡∣∣∣∣γv2
v′
(2v′
v− v′′
v′+γ′
γ
)∣∣∣∣ 1 . (3.5.19)
3.5.3 Number of e-folds variance
Following a similar calculation, we will now find the variance, or dispersion, in the
number of e-folds realised in this setup. By squaring (3.5.13) and averaging the result,
we obtain an expression of the number of e-folds variance as
⟨N 2⟩
= f 2(φ∗) + 2M2Pl
⟨∫ N
0
f ′2[φ(N)]v[φ(N)]dN
⟩. (3.5.20)
In order to use the Ito lemma, we define a function g[φ(N)] by
g′′(φ)v(φ)− g′(φ)v′(φ)
γ(φ)v(φ)= −2f ′2(φ)v(φ) , (3.5.21)
134

where f is defined by (3.5.15). Now, by using Eq. (3.5.11), imposing the boundary
condition g(φ1) = 0, and then taking the stochastic average of the result, we see that
g(φ∗) = 2M2Pl
⟨∫ N
0
f ′2[φ(N)]v[φ(N)]dN
⟩
=⟨N 2⟩− 〈N〉2
≡ δN 2 .
(3.5.22)
Thus, in order to find the variance of the number of e-folds, we need to solve (3.5.21)
with g(φ1) = 0 and evaluate the resulting function at φ∗. The formal solution is given
by
δN 2 = g(φ∗) = 2
∫ φ∗
φend
dy
∫ φ2
y
dxf ′2(x) exp
[∫ y
x
v′(z)
γ(z)v2(z)dz
], (3.5.23)
where once again φ2 is an integration constant chosen to realise g(φ1) = 0.
Classical Limit
As before, we can derive the classical limit for the variance. When ηcl 1, our saddle
point approximation (3.5.17) is valid, and we can also expand f ′2(x) around the point
y using
f ′2(x) ' f ′2(y) + 2f ′(y)f ′′(y)(x− y) +[f ′′(y)2 + f ′(y)f ′′′(y)
](x− y)2 . (3.5.24)
Using these expansions, we find that the classical limit of (3.5.23) is
δN 2∣∣cl
=2
M4Pl
∫ φ∗
φend
γ3(y)v4(y)
v′(y)3dy . (3.5.25)
3.5.4 Power Spectrum
Using the expressions found so far in this section, we can now calculate the power
spectrum of curvature fluctuations Pζ(k) = PδN(k) = dd〈N〉δN 2
∣∣∣〈N〉=ln(kend/k)
. It is
135

straightforward to calculate
Pζ(φ∗) =g′(φ∗)
f ′(φ∗)
= 2
[∫ φ
φ∗
dx
MPlv(x)exp
[∫ φ∗
x
v′(z)
γ(z)v2(z)dz
]]−1
×
∫ φ2
φ∗
dx
MPl
(∫ φ∞
x
dy
MPlv(y)exp
[∫ φ∗
y
v′(z)
γ(z)v2(z)dz
])2
exp
[∫ φ∗
x
v′(z)
γ(z)v2(z)dz
],
where Pζ(φ∗) stands for the power spectrum calculated at a scale k such that when
it crosses the Hubble radius. We can also calculate the tilt of the power spectrum by
noting that, in slow roll, we have
∂
∂ ln k' − ∂φ
∂ 〈N〉∂
∂φ, (3.5.26)
and hence we have
ns = 1− g′′(φ)
f ′(φ)g′(φ)+f ′′(φ)
f ′2(φ). (3.5.27)
The full expression is not written out here for brevity, but can be found from
Eqs. (3.5.15) and (3.5.23).
Classical Limit
Making use of our previous classical expressions for f and g, we find the classical limits
for the power spectrum and scalar index to be
Pζ∣∣cl
(φ∗) =2
M2Pl
v3(φ∗)γ2(φ∗)
v′(φ∗)2. (3.5.28)
and
ns∣∣cl
(φ∗) = 1−M2Pl
[3
γ(φ∗)
(v′(φ∗)
v(φ∗)
)2
− 2v′′(φ∗)
γ(φ∗)v(φ∗)+ 2
γ′(φ∗)v′(φ∗)
v(φ∗)γ2(φ∗)
], (3.5.29)
respectively.
136
We can continue to derive higher order moments of the number of e-folds realised
in this setup, such as the skewness and so on, in similar ways (following the approach
of Vennin and Starobinsky [202]). We can also keep higher order terms in our Taylor
expansions in the classical limits to find the next-to-leading order corrections (or as
many orders as one requires). At this point we note again that including the DBI term
γ in these expressions is a new result that we present in this thesis.
In the next chapter, we build on this first passage time analysis and construct a
formalism to calculate full probability distributions in the stochastic framework, rather
than the individual moments presented here.
137

Chapter 4
Quantum diffusion during inflation
and primordial black holes
Having now introduced the stochastic formalism for inflation and studied its validity in
a general setting, we now apply this formalism to the specific case of slow-roll inflation.
Using stochastic inflation, we are able to calculate the full probability density function
(PDF) of inflationary curvature perturbations, even in the presence of large quantum
backreaction, while making no assumptions of Gaussianity (as is usually done in the
literature). This is of direct interest for the study of the formation of primordial
black holes, which we have seen provide possible solutions to several open problems in
modern cosmology.
In this chapter, making use of the stochastic-δN formalism, two complementary
methods are developed, one based on solving an ordinary differential equation for the
characteristic function of the PDF, and the other based on solving a heat equation for
the PDF directly. In the classical limit where quantum diffusion is small, we develop
an expansion scheme that not only recovers the standard Gaussian PDF at leading
order, but also allows us to calculate the first non-Gaussian corrections to the usual
result. In the opposite limit where quantum diffusion is large, we find that the PDF
is given by an elliptic theta function, which is fully characterised by the ratio between
138

the squared width and height (in Planck mass units) of the region where stochastic
effects dominate. By applying these results to the calculation of the mass fraction of
primordial black holes, we show that no more than ∼ 1 e-fold can be spent in regions of
the potential dominated by quantum diffusion. We then explain how this requirement
constrains inflationary potentials with two examples.
This chapter is based on the publication [238] and is organised as follows: In
Sec. 4.2, we explain how the full PDF of curvature perturbations can be calculated in
stochastic inflation. Using the stochastic-δN formalism (see Sec. 3.4), we first derive
a set of ordinary differential equations for the moments of this PDF (see Sec. 4.2.1),
from which two methods of construction of the distribution are proposed, one based
on its characteristic function (see Sec. 4.2.2) and one based on a heat equation (see
Sec. 4.2.3). In Sec. 4.3, we derive the classical limit of our formulation, where quantum
diffusion is a subdominant correction to the classical field dynamics. At leading order,
the standard result is recovered, and higher-order corrections allow us to calculate the
first non-Gaussian modifications to the PDF of curvature perturbations and to the
mass fraction β. In Sec. 4.4, we expand our calculation in the opposite limit, where
the potential is exactly flat and stochastic effects dominate. In this case, the PDF of
curvature perturbations is found to be highly non-Gaussian and is given by an elliptic
theta function. In Sec. 4.5, we explain how these two limits enable one to treat more
generic inflationary potentials and give a simple calculational programme that updates
Eq. (1.5.4) and allows one to translate PBH observational constraints into constraints
on the potential. We then illustrate this programme with two examples. We finally
summarise the main results and present the conclusions of this chapter in Sec. 4.6.
4.1 Motivations
As noted in Sec. 1.5, the usual calculations for the mass fraction of the Universe
contained in primordial black holes (PBHs) relies on two assumptions, namely the
139

use of a Gaussian PDF and the use of the slow-roll approximations. In this chapter,
we do not make the Gaussian assumption for the PDF of curvature perturbations
during inflation, while maintaining the assumption that inflation takes place in a slow-
roll regime, and instead calculate these PDFs directly, making use of the stochastic
formalism for inflation introduced in chapter 3.
As we shall see, producing curvature fluctuations of order ζ ∼ ζc ∼ 1 or higher
precisely corresponds to the regime where quantum diffusion dominates the field dy-
namics over a typical time scale of one e-fold. The validity of the standard approach
that is summarised in Sec. 1.5 is therefore questionable and this is why here, we present
a generic calculation of the PBH abundance from inflation that fully incorporates
quantum backreaction effects, and we update Eq. (1.5.4) to take into account the full
quantum dynamics of the inflaton field.
In the slow-roll approximation of the stochastic formalism, recall that the infla-
ton field φ follows a Langevin equation of the form
dφ
dN= − V ′
3H2+H
2πξ (N) , (4.1.1)
where, as in Sec. 3.5, a prime denotes a derivative with respect to the inflaton field.
The right-hand side of this equation has two terms, the first of which involves V ′ and
is a classical drift term, and the second term involves ξ which is a Gaussian white noise
such that 〈ξ (N)〉 = 0 and 〈ξ (N) ξ (N ′)〉 = δ (N −N ′), and which makes the dynamics
stochastic.
Over the time scale of one e-fold, the ratio between the mean quantum kick
H/(2π), and the classical drift V ′/(3H2), is of order√Pζ , provided Pζ follows the
classical formula (1.5.5) and where one has made use of the Friedmann slow-roll equa-
tion (1.3.21). Therefore, if PBHs form when this ratio is of order one or higher, this
is precisely when one expects quantum modifications to the standard result to become
important.
140

4.2 Probability distribution of curvature perturbations
The calculation of the PBH mass fraction relies on the PDF of the coarse-grained
curvature perturbations through Eq. (1.5.1). Let us explain how this distribution can
be calculated in the stochastic-δN formalism introduced in Sec. 3.4.
4.2.1 Statistical moments of first passage times
In order to calculate the PDF of the realised number of e-folds N , and hence of δNcg
(i.e. of ζcg), a first step consists in calculating its statistical moments
fn(φ) = 〈N n(φ)〉 , (4.2.1)
where the dependence on the field value φ (denoted φ∗ in the discussion around Fig. 3.2)
at which trajectories are initiated is made explicit. This can be done using the “first
passage time analysis” techniques [257, 258] outlined in Sec. 3.5. By generalising the
methods we explain there, one can derive a hierarchy of ordinary differential equations
f ′′n −v′
v2f ′n = − n
vM2Pl
fn−1 , (4.2.2)
that the moments of the distribution of N satisfy. Note that, as done in the previous
section, we have defined v = V/(24π2M4Pl) to be the dimensionless potential. The
hierarchy is initiated at f0 = 1, and for n ≥ 1 it has to be solved with two boundary
conditions, one related to the fact that all trajectories initiated at φend realise a van-
ishing number of e-folds, and the other one implementing the presence of a reflective
wall at φuv, namely
fn(φend) = 0 , f ′n(φuv) = 0 . (4.2.3)
The formal solution to this problem can be written as
fn(φ) = n
∫ φ
φend
dx
MPl
∫ φuv
x
dy
MPl
e1
v(y)− 1v(x)
fn−1(y)
v(y), (4.2.4)
141

which allows one to calculate the moments iteratively. In practice, this relies on per-
forming integrals of increasing dimension, which quickly becomes numerically heavy
but provides a convenient way to study the first few moments required to calculate the
power spectrum given by Eq. (3.4.14) or the f localNL parameter given by Eq. (3.4.15), see
Refs. [202, 248].
4.2.2 The characteristic function approach
In order to relate the PDF of N to its statistical moments, let us introduce its char-
acteristic function
χN (t, φ) ≡⟨eitN (φ)
⟩, (4.2.5)
which depends on φ and a dummy parameter t, which does not relate to any sort of
time coordinate. By Taylor expanding χN (t, φ) around t = 0, one has χN (t, φ) =∑∞
n=0(it)nfn(φ)/n!. If one applies the differential operator appearing in the left-hand
side of Eq. (4.2.2) to this expansion, and uses Eq. (4.2.2) to replace each term by its
right-hand side, one obtains
(∂2
∂φ2− v′
v2
∂
∂φ+
it
vM2Pl
)χN (t, φ) = 0 . (4.2.6)
At fixed t, this is an ordinary differential equation in φ, so instead of the hierarchy
of coupled differential equations (4.2.2) one now has a set of uncoupled differential
equations to solve, which improves the tractability of the problem. The boundary
conditions (4.2.3), together with the fact that f0 = 1, translate into
χN (t, φend) = 1 ,∂χN∂φ
(t, φuv) = 0 . (4.2.7)
Let us note that the characteristic function of the fluctuation in the number of e-folds,
ζcg = δNcg = N − 〈N〉 = N − f1, can be found by plugging this expression into
142

Eq. (4.2.5), which gives rise to
χζcg (t, φ) = e−if1(φ)tχN (t, φ) . (4.2.8)
Finally, from Eq. (4.2.5), the characteristic function χN can be rewritten as
χN (t, φ) =
∫ ∞
−∞eitNP (N, φ) dN , (4.2.9)
that is to say, the characteristic function is the Fourier transform of the PDF of cur-
vature perturbations. Therefore, the PDF is the inverse Fourier transform of the
characteristic function, i.e.
P (ζcg, φ) =1
2π
∫ ∞
−∞e−it[ζcg+f1(φ)]χN (t, φ) dt , (4.2.10)
where we have used Eq. (4.2.8). Thus, the calculational programme is the following:
solve Eq. (4.2.6) with boundary conditions (4.2.7), calculate f1 by either taking n = 1
and f0 = 1 in Eq. (4.2.4) or by noting that f1(φ) = −i∂χN/∂t(t = 0, φ), calculate the
PDF of curvature perturbations with Eq. (4.2.10), and then the mass fraction of PBHs
with Eq. (1.5.1).
Example: quadratic potential
In order to illustrate this computational programme, let us consider the case of a
quadratic potential
v(φ) = v0
(φ
MPl
)2
. (4.2.11)
In this case, Eq. (4.2.6) together with the boundary conditions (4.2.7) has an exact
solution. Taking the φuv →∞ limit, it is given by
χN (t, φ) =
[v(φ)
v(φend)
] 1−α(t)4 1F1
[α(t)−1
4; 1 + α(t)
2;− 1
v(φ)
]
1F1
[α(t)−1
4; 1 + α(t)
2;− 1
v(φend)
] , (4.2.12)
143

0.0 0.2 0.4 0.6 0.8 1.0
v0N0
2
4
6
8
10
P( v
0N
)
v = 0.5
v = 1
v = 2
v = 4
v = 8
Figure 4.1. Probability distributions of the number of e-folds N , rescaled by v0, realised inthe quadratic potential (4.2.11) between an initial field value φ parametrised by v(φ) givenin the legend, and φend =
√2MPl where inflation ends by slow-roll violation. The values
displayed for v correspond to very high energies far from the observational window of thismodel but this is for illustrative purpose only. When v increases, one can see that the PDFhas a larger mean value, a larger spread and seems to be less Gaussian, which motivates theneed to go beyond Gaussian techniques.
where α(t) =√
1− 4itv0
and 1F1(x; y; z) is the Kummer confluent hypergeometric func-
tion [259, 260]1. The inverse Fourier transform of Eq. (4.2.12) can then be computed
numerically, which gives rise to the PDF displayed in Fig. 4.1. At small v(φ) the
PDF is rather peaked and almost Gaussian, while at large v(φ), it is more spread and
deviates more from a Gaussian distribution. In Secs. 4.3 and 4.4 we will study these
two limits one by one, i.e. the classical limit where the stochastic corrections are small
and the PDF is almost Gaussian, and the stochastic limit where quantum diffusion
dominates the inflaton dynamics.
1Note that these references use the notation M(a, b; z) for the Kummer confluent hypergeometricfunction while we use the notation 1F1(x,y;z).
144

4.2.3 The heat equation approach
Before investigating the classical and stochastic limits, let us note that the problem
can be reformulated in terms of a heat equation for the PDF P (N , φ). Indeed, if one
plugs Eq. (4.2.9) into Eq. (4.2.6), the two first terms apply on P (N , φ) directly, while
the third one is given by itχN =∫∞−∞ dNP∂eitN/∂N = −
∫∞−∞ dNeitN∂P/∂N . Here,
in the first expression, we have simply differentiated Eq. (4.2.9) with respect to N ,
and in the second expression, we have integrated by parts (the boundary terms vanish
since P (N = ±∞, φ) must vanish for the distribution to be normalisable). This gives
rise to the heat equation
(∂2
∂φ2− v′
v2
∂
∂φ− 1
vM2Pl
∂
∂N
)P (N , φ) = 0 . (4.2.13)
Instead of the infinite set of uncoupled differential equations given in Eq. (4.2.6), the
problem is now reformulated in terms of a single, but partial, differential equation. Let
us note that Eq. (4.2.13) does not have the structure of a Fokker-Planck equation, and
should in any case not be confused with the usual Fokker-Planck equation considered
in stochastic inflation which governs the PDF of the field value.2 When plugging the
boundary conditions (4.2.7) into Eq. (4.2.9), one obtains
P (N , φend) = δ(N ) ,∂P
∂φ(N , φuv) = 0 . (4.2.15)
These form the boundary conditions associated to Eq. (4.2.13).
2The Langevin equation (4.1.1) gives rise to Fokker-Planck equation for the probability densityp(N,φ) of the field to be at φ at time N , which, in the Ito interpretation, is given by
∂2
∂φ2[vp(N , φ)] +
∂
∂φ
[v′
vp(N , φ)
]− 1
M2Pl
∂
∂Np(N , φ) = 0 . (4.2.14)
This equation does not coincide with Eq. (4.2.13) for P (N , φ) which governs the probability to realiseN e-folds starting from φ.
145

In order to show that Eq. (4.2.13) has the structure of a heat equation as
announced above, one can introduce a change of field variable
u(φ) =
∫ φ
φend
e− 1v(φ)
dφ
MPl
, (4.2.16)
which allows us to rewrite Eq. (4.2.13) as
(ve−
2v∂2
∂u2− ∂
∂N
)P (N , u) = 0. (4.2.17)
This is a heat equation for a one dimensional medium with diffusivity ve−2/v, where
N plays the role of time and u the role of space. However, let us stress that heat
equations are usually endowed with boundary conditions of a different type as from
those in Eq. (4.2.15), since in standard heat equations, one usually gives the spatial
temperature distribution at an initial time, while Eq. (4.2.15) involves distributions of
times at fixed spatial positions. This is why the numerical methods developed in the
literature to solve heat equations would need to be adapted to this kind of boundary
conditions but they may provide efficient ways to solve the problem at hand, e.g. , in
the context of multi-field inflation.
4.3 Expansion about the classical limit
In the limit of small quantum diffusion, the “classical” limit, one needs to check that
our formulation allows one to recover the standard results recalled in Sec. 4.1 around
Eq. (1.5.3). This is the goal of this section, where we also calculate the leading order
deviation from the standard result in order to best determine its range of validity.
From the heat equation (4.2.17), we saw that the diffusivity increases with v, which
implies that the classical limit has v 1 (this condition is not enough to define the
classical regime as we will see below but it constitutes a fair starting point). We thus
perform an expansion in increasing powers of v, first in the characteristic function
146

approach introduced in Sec. 4.2.2, and then in the heat equation approach introduced
in Sec. 4.2.3. We will see that the former is much more convenient than the latter
which only yields limited results in the classical limit.
4.3.1 The characteristic function approach
In the ordinary differential equation satisfied by the characteristic function, Eq. (4.2.6),
an expansion in v is equivalent to an expansion in the diffusion term, involving ∂2/∂φ2.
Leading order
At leading order (LO) in the classical limit, the diffusion term in Eq. (4.2.6) can be
simply neglected, and one has
(−v′
v
∂
∂φ+
it
M2Pl
)χLO
N (t, φ) = 0 . (4.3.1)
Making use of the first boundary condition in Eq. (4.2.7),3 this equation can be solved
as
χLO
N (t, φ) = exp
[it
∫ φ
φend
v(x)
M2Plv′(x)
dx
]. (4.3.2)
Note that the integral in the argument of the exponential is the classical number of
e-folds, which is also the mean number of e-folds at leading order in the classical limit,
i.e. the leading order saddle point expansion of Eq. (4.2.4) [248],
fLO
1 (φ) =1
M2Pl
∫ φ
φend
v(x)
v′(x)dx . (4.3.3)
This is consistent with the formula given below Eq. (4.2.10), namely f1(φ) =
−i∂χN/∂t(t = 0, φ). As a consequence, Eq. (4.2.8) implies that χδNcg = 1, and hence
its inverse Fourier transform is P LO (δNcg, φ) = δ (δNcg), i.e. a Dirac distribution cen-
tred around δNcg = 0. Thus, at leading order in the classical limit, one simply shuts
3In the expansion about the classical limit, the second boundary condition in Eq. (4.2.7) cannot besatisfied simultaneously with the first condition. This is why the solutions presented here are, strictlyspeaking, only valid in the limit φuv →∞.
147

down quantum diffusion, the dynamics are purely deterministic, δN ≡ 0 and there are
no curvature perturbations.
Next-to-leading order
One thus needs to go to next-to-leading order (NLO) to incorporate curvature pertur-
bations. At NLO, the LO solution (4.3.2) can be used to evaluate the term χ−1∂2χ/∂φ2
in Eq. (4.2.6), which then becomes
∂
∂φχNLO
N − v2
v′
(it
vM2Pl
+1
χLON
∂2χLON
∂φ2
)χNLO
N = 0 . (4.3.4)
Making use of the first boundary condition in Eq. (4.2.7), the solution of this first order
ordinary differential equation is
χNLO
N (t, φ) = exp
∫ φ
φend
[itv(x)
M2Plv′(x)
+v2(x)
v′(x)
1
χLON (x)
∂2χLON
∂φ2(x)
]dx
. (4.3.5)
Notice that if ones replaces LO by an arbitrary nth order and NLO by the (n+ 1)th order
of the classical expansion, this equation is valid at any order since it is nothing but
the iterative solution of Eq. (4.2.6). At NLO, plugging Eq. (4.3.2) into Eq. (4.3.5), one
obtains
χNLO
N (t, φ) = exp[itfNLO
1 (φ)− γNLO
1 vt2], (4.3.6)
where fNLO1 is the mean number of e-folds at NLO [248],
fNLO
1 (φ) =1
M2Pl
∫ φ
φend
dx
(v
v′+v2
v′− v3v′′
v′3
), (4.3.7)
and we have defined
γNLO
1 =1
vM4Pl
∫ φ
φend
dxv4
v′3. (4.3.8)
From this expression, Eq. (4.2.8) implies that χNLOδNcg
(t, φ) = e−γNLO1 vt2 , that is to say χNLO
δN
is a Gaussian and hence its inverse Fourier transform P NLO (ζcg, φ) is also a Gaussian
148

and is given by
P NLO(ζcg, φ) =1√
4πγNLO1 v
exp
(− ζ2
cg
4γNLO1 v
). (4.3.9)
A crucial remark is that at this order, the power spectrum (3.4.14) is given by [202]
Eq. (1.5.5), so that the variance of the Gaussian distribution (4.3.9) reads 2γNLO1 v =
∫ φφendPNLOζ f
′LO1 dx. This precisely matches the standard result recalled above Eq. (1.5.3),
namely that P (ζcg) is a Gaussian PDF with standard deviation given by the integrated
power spectrum⟨ζ2
cg
⟩=∫ kendkPζ(k)d ln k, since d ln k ' dN = f ′1(φ)dφ at leading order
in slow roll.
Next-to-next-to-leading order
In order to study the first non-Gaussian corrections to the standard result, one needs
to go to next-to-next-to-leading order (NNLO). As explained in Sec. 4.3.1, one can
simply increment the order of the iterative relation (4.3.5), i.e. replace LO by NLO and
NLO by NNLO. Plugging in Eq. (4.3.6), and making use of Eq. (4.2.8), this gives rise to
χNNLO
δNcg(t, φ) = exp
(−γNNLO
1 vt2 − iγNNLO
2 v2t3), (4.3.10)
where we have only kept the terms that are consistent at that order and where we have
defined
γNNLO
1 =1
vM4Pl
∫ φ
φend
dx
(v4
v′3+ 6
v5
v′3− 5
v6v′′
v′5
),
γNNLO
2 =2
v2M6Pl
∫ φ
φend
dxv7
v′5.
(4.3.11)
One can already see that since the characteristic function is not a Gaussian; the PDF
is not a Gaussian distribution. Using Eq. (4.2.10), it is given by
P NNLO (δNcg, φ) =1
2π
∫ ∞
−∞dt exp
(−itδNcg − γNNLO
1 vt2 + iγNNLO
2 v2t3). (4.3.12)
In this integral, the second term in the argument of the exponential makes the integrand
become negligible when γNNLO1 vt2 1, i.e. for |t| tc where tc = (γNNLO
1 v)−1/2. When
149

t = ±tc, the ratio between the third and the second terms in the argument of the
exponential of Eq. (4.3.12) is of order (γNNLO2 /γNNLO
1 )√v/γNNLO
1 , i.e. of order√v in an
expansion in v since the γi parameters have been defined to carry no dimension of v
(at least at their leading orders). This is why, over the domain of integration where
most of the contribution to the integral comes from, the third term is negligible and
can be Taylor expanded. One obtains
P NNLO (ζcg, φ) =1√
4πγNNLO1 v
exp
(− ζ2
cg
4γNNLO1 v
)[1− γNNLO
2
8 (γNNLO1 )3 v
ζcg
(6γNNLO
1 v − ζ2cg
)].
(4.3.13)
For the quadratic potential example discussed in Sec. 4.2.2, in Fig. 4.2 we have re-
produced Fig. 4.1 (for different values of v to better illustrate the behaviours of the
classical approximations) where we have superimposed the NLO approximation (4.3.9)
and the NNLO approximation (4.3.13). One can check that these approximations be-
come better at smaller values of v as expected, and that the NNLO approximation
always provides a better fit than the NLO one.
As a consistency check, one can verify that the distribution (4.3.13) yields
the same moments at NNLO order as the ones derived in Ref. [202] by calcu-
lating the integrals (4.2.4) with a saddle-point approximation technique at NNLO.
For the second moment, one has 〈δN2cg〉 =
∫∞−∞ ζ
2cgP
NNLO(ζcg, φ)dζcg = 2γNNLO1 v,
which coincides with Eq. (3.35) of Ref. [202]. Similarly for the third moment,
〈δN3cg〉 =
∫∞−∞ ζ
3cgP
NNLO(ζcg, φ)dζcg = 6γNNLO2 v2, which coincides with Eq. (3.37) of
Ref. [202]. The two methods, i.e. the iterative solution (4.3.5) of the characteristic
function equation and the saddle-point expansion of the integrals (4.2.4), are therefore
equivalent.
Let us also note that the characteristic function, χN (t, φ) defined in Eq. (4.2.5),
is closely related to the cumulant generating function for the probability distribution
KN (τ, φ) = ln〈eτN (φ)〉 =∞∑
n=1
κn(φ)
n!τn . (4.3.14)
150

0.000 0.005 0.010 0.015 0.020 0.025
v0N0
100
200
300
400
500
600
700
P( v
0N
)
v = 0.02
v = 0.03
v = 0.04
v = 0.05
v = 0.06
NLO
NNLO
Figure 4.2. Probability distributions of the number of e-folds N , rescaled by v0, realised inthe quadratic potential (4.2.11) between an initial field value φ parametrised by v(φ) givenin the legend, and φend =
√2MPl where inflation ends by slow-roll violation, as in Fig. 4.1.
The black dashed lines correspond to the NLO (Gaussian) approximation (4.3.9), while thedotted lines stand for the NNLO approximation (4.3.13). The smaller v is, the better theseapproximations are, and the NNLO approximation is substantially better than the NLO one.
By comparing Eqs. (4.2.5) and (4.3.14) indeed, one simply has χN (t, φ) =
exp [KN (it, φ)]. If we now compare Eqs. (4.3.10) and (4.3.14), we can read off the
first cumulants
κ2(φ) = 2vγ1 , κ3(φ) = 6v2γ2 . (4.3.15)
One measure of the deviation from a Gaussian distribution is the skewness of the
distribution which is determined by the ratio of these cumulants
γskew ≡κ3
κ3/22
=3v1/2γ2√2 (γ1)3/2
. (4.3.16)
Since γ2 is non-vanishing at next-to-next-to-leading (and higher) order only, the NNLO
term thus represents the first non-Gaussian correction to the standard Gaussian result
obtained at NLO in the classical limit.
151

At this order, the distribution is positively skewed, which is indeed the case
for all the distributions displayed in Figs. 4.1 and 4.2. One can also note that the
parameter introduced below Eq. (4.3.12), that must be small in order for the classical
expansion to be valid at NNLO, exactly coincides with γskew. The above formulae
are therefore correct in the limit γskew 1 only. Finally, the correcting term in the
brackets of Eq. (4.3.13) can be expressed as γskew
(ζ2
cg/⟨ζ2
cg
⟩)3/2, where we have used
the relation 〈δN2cg〉 = 2γNNLO
1 v given above together with Eq. (4.3.16). This shows that
γskew 1 only ensures the correcting term to be small when ζ2cg is of order
⟨ζ2
cg
⟩,
i.e. around the maximum of the distribution. The classical approximation is therefore
an expansion about the maximum of the distribution that should be expected to fail in
the tail. Since the PBH threshold ζc is usually in the far tail of the distribution (in the
standard calculation recalled in Sec. 4.1, at the level of the observational bounds, one
has⟨ζ2
cg
⟩∼ 10−2 ζ2
c ∼ 1), one may need to go beyond the classical approximation
in such cases.
4.3.2 The heat equation approach
Before moving on to the stochastic limit, let us briefly explain how the heat equa-
tion approach proceeds in the classical limit. At LO, neglecting the diffusion term
in Eq. (4.2.13), one has to solve M2Plv′/v ∂P/∂φ + ∂P/∂N = 0, with the first bound-
ary condition of Eq. (4.2.15). Using the method of characteristics to solve first-order
partial differential equations, one obtains
P LO (N , φ) = δ [N − fLO
1 (φ)] , (4.3.17)
where fLO1 has been defined in Eq. (4.3.3) and corresponds to the classical number of
e-folds, which is also the mean number of e-folds at leading order in the classical limit.
One therefore recovers the result of Sec. 4.3.1. At NLO, one can use Eq. (4.3.17) to
calculate the diffusive term in Eq. (4.2.13) and iterate the procedure. However, by
152

v
end end + well
Figure 4.3. Schematic representation of the single-field stochastic dynamics solved inSec. 4.4, where the potential may be taken to be exactly constant over the “quantum well”regime delimited by φend and φend + ∆φwell. Inflation terminates at φend, where either thepotential becomes very steep or a mechanism other than slow-roll violation ends inflation,and a reflective wall is placed at φend + ∆φwell, which can be seen as the point where the dy-namics become classically dominated and the classical drift prevents the field from escapingthe quantum well.
doing so, one has to solve a first-order partial differential equation with a source term
that involves derivatives of the Dirac distribution. This makes the solving procedure
technically complicated, and we therefore do not pursue this direction further since a
simpler way to obtain the solution was already presented in Sec. 4.3.1. One can already
see the benefit of having two solving procedures at hand, which will become even more
obvious in what follows.
4.4 The stochastic limit
We now consider the opposite limit where the inflaton field dynamics are dominated
by quantum diffusion. This is the case if the potential is exactly flat, since then the
slow-roll classical drift vanishes. We thus consider a potential that is constant between
the two values φend and φend +∆φwell, where ∆φwell denotes the width of this “quantum
well”. Inflation terminates when the field reaches φend (where either the potential is
assumed to become very steep, or a mechanism other than slow-roll violation must
153

be invoked to end inflation), and a reflective wall is located at φend + ∆φwell, which
can be seen as the point where the dynamics become classically dominated so that the
probability for field trajectories to climb up this part of the potential and escape the
quantum well can be neglected. The situation is depicted in Fig. 4.3, and in Sec. 4.5
we will see why these assumptions allow one to study most cases of interest.
4.4.1 The characteristic function approach
If the potential v = v0 is constant, the potential gradient term vanishes in Eq. (4.2.6)
and making use of the boundary conditions (4.2.7), where φuv is replaced by φend +
∆φwell, one obtains
χN (t, φ) =cosh
[α√t µ (x− 1)
]
cosh(α√t µ) . (4.4.1)
In this expression, x ≡ (φ−φend)/∆φwell, α ≡ (i− 1)/√
2 , and we have introduced the
parameter
µ2 =(∆φwell)
2
v0M2Pl
(4.4.2)
which is the ratio between the squared width of the quantum well and its height,
in Planck mass units, and which is the only combination through which these two
quantities appear.
The PDF can be obtained by inverse Fourier transforming Eq. (4.4.1), see
Eq. (4.2.10), which can be done after Taylor expanding the characteristic func-
tion (4.4.1) and inverse Fourier transforming each term in the sum. This leads to
P (N , φ) =1
2√π
µ
N 3/2×
∞∑
n=0
(−1)n [2(n+ 1)− x] e−µ2
4N [2(n+1)−x]2 +∞∑
n=0
(−1)n [2n+ x] e−µ2
4N [2n+x]2
.
(4.4.3)
This PDF is displayed in Fig. 4.4 for different values of x. Interestingly, Eq. (4.4.3)
can be resummed to give a closed form when combined with the result from the heat
equation approach presented below in Sec. 4.4.2. For now, we can derive closed form
154

0.0 0.2 0.4 0.6 0.8 1.0 1.2
N /µ2
0.0
0.5
1.0
1.5
2.0
2.5
3.0
3.5
4.0
P(N
/µ2)
0
0.1
0.2
0.3
0.4
0.5
0.6
0.7
0.8
0.9
1
(φ−φ
end )/∆
φw
ell
Figure 4.4. Probability distributions of the number of e-folds N , rescaled by µ2, realisedin the constant potential depicted in Fig. 4.3 between φ and φend, where different colourscorrespond to different values of φ. When φ approaches φend, the distribution becomes morepeaked and the transparency of the curves is increased for displayed purposes.
expressions at both boundaries of the quantum well, i.e. in the two limits φ ' φend +
∆φwell and φ ' φend.
Reflective boundary of the quantum well
In the case where φ = φend + ∆φwell, or x = 1, i.e. at the reflective boundary of
the quantum well, Eq. (4.4.3) reduces to P (N , φwell) = µ/√πN−3/2
∑∞n=0(−1)n(2n +
1)e−µ2
4N (2n+1)2 . Making use of the elliptic theta functions [261, 262] introduced in Ap-
pendix D, this can be rewritten as
P (N , φ = φend + ∆φwell) =µ
2√πN 3/2
ϑ′1
(0, e−
µ2
N
), (4.4.4)
where ϑ′1 is the derivative (with respect to the first argument) of the first elliptic theta
function, see Eq. (D.0.2).
155

Absorbing boundary of the quantum well
In the case where φ ' φend, or x 1, i.e. at the absorbing boundary of the
quantum well, an approximated formula can be obtained by noting that Eq. (4.4.3)
can be rewritten as P (N , φ) = µ/(2√πN 3/2)[xe−µ
2x2/(4N ) + F (−x) − F (x)], with
F (x) ≡ ∑∞n=0(−1)n[2(n + 1) + x]e−µ2
4N [2(n+1)+x]2 . In the limit where x 1, F (−x) −F (x) ' −2xF ′(0), where F ′(0) = 1/2 − 1/2ϑ4(0, e−µ
2/N ) − µ2/(4N )ϑ′′4(0, e−µ2/4), see
Eq. (D.0.3). This gives rise to
P (N , φ ' φend) ' µx
2√πN 3/2
[e−
µ2x2
4N − 1 + ϑ4
(0, e−
µ2
N
)+
µ2
2N ϑ′′4
(0, e−
µ2
N
)].
(4.4.5)
This approximation is superimposed to the full result (4.4.4) in the left panel of Fig. 4.5,
where one can check that the agreement is excellent even up to x ∼ 0.3.
As a brief aside, let us note how this setup is altered when we include the non-
canonical kinetic terms of DBI inflation (see Sec. 3.5.1 for a brief introduction). The
equation for the characteristic function is modified to give
(∂2
∂φ2− v′
γv2
∂
∂φ+
it
vM2Pl
)χN (t, φ) = 0 . (4.4.6)
In the case of a flat potential at the end of inflation we neglect the term v′/(γv2)
and can then solve (4.2.6) exactly, giving us the exact same equation we find in the
canonical case. This is because the DBI correction is a correction to the classical drift,
but does not affect the amplitude of the quantum fluctuations. This means quantum
diffusion proceeds as it does in the absence of a DBI term, and the solution for the
characteristic function is simply given by Eq. (4.4.1) and our conclusions for a flat
potential do not change for DBI inflation, i.e. in “quantum wells” of a potential we
have stochastic effects dominating.
156

0.0 0.1 0.2 0.3 0.4 0.5
N /µ2
0.0
0.5
1.0
1.5
2.0
2.5
3.0
3.5
4.0P
(N/µ
2)
0
0.1
0.2
0.3
0.4
0.5
0.6
0.7
0.8
0.9
1
(φ−φ
end )/∆
φw
ell
0.0 0.1 0.2 0.3 0.4 0.5
N /µ2
0.0
0.5
1.0
1.5
2.0
2.5
3.0
3.5
4.0
P(N
/µ2)
0
0.1
0.2
0.3
0.4
0.5
0.6
0.7
0.8
0.9
1
(φ−φ
end )/∆
φw
ell
Figure 4.5. Probability distributions of the number of e-folds N , rescaled by µ2, realisedin the constant potential depicted in Fig. 4.3 between φ and φend. In both panels, differentcolours correspond to different values of φ, and the black dashed lines correspond to approx-imations. Left panel: the approximation (4.4.5) is displayed with the black dashed lines.Right panel: the approximation (4.4.13) is displayed with the black dashed lines. These ap-proximations are valid close to the absorbing boundary of the quantum well where inflationends. When φ increases, the approximation becomes worse, and the transparency of thecurves is increased for displayed purposes, but one can see that the approximation (4.4.5) isexcellent up to (φ−φend)/∆φwell ∼ 0.3, and slightly better than the approximation (4.4.13).
4.4.2 The heat equation approach
Let us now move on to the heat equation approach, since combined with the results
of the characteristic function approach, this will allow us to derive a closed form for
the PDF at arbitrary values of x. In the case of a constant potential, the heat equa-
tion (4.2.13) becomes (v0M2Pl∂
2/∂φ2− ∂/∂N)P (N , φ) = 0. The second boundary con-
dition of Eq. (4.2.15), ∂P/∂φ(N , φend + ∆φwell) = 0, leads to a Fourrier decomposition
of the form
P (N , φ) =∞∑
n=0
An (N ) sin
[(π2
+ nπ)x]
+Bn (N ) cos (nπx), (4.4.7)
157

where, by plugging Eq. (4.4.7) into the heat equation (4.2.13), the coefficients An and
Bn must satisfy
∂An∂N
= −π2
µ2
(n+
1
2
)2
An ,∂Bn
∂N= −π
2
µ2n2Bn . (4.4.8)
This leads to
An(N ) = an exp
[−π
2
µ2
(n+
1
2
)2
N], Bn(N ) = bn exp
(−π
2
µ2n2N
), (4.4.9)
where an and bn are coefficients that depend only on n. They can be calculated by
identifying Eqs. (4.4.3) and (4.4.7) in the N → 0 limit. In this limit, in Eq. (4.4.3),
the term with n = 0 of the second sum is the dominant contribution, and using the
fact that e−x2/(4σ)/(2
√πσ )→ δ(x) when σ → 0, hence −xe−x2/(4σ)/(4σ
√πσ )→ δ′(x)
when σ → 0, one has
P (N , φ) −→N→0
−2v0M2Plδ′(φ− φend) . (4.4.10)
In passing, one notes that this expression implies that P (N = 0, φ) = 0 when φ 6= φend,
which is consistent with the continuity of the distribution when N = 0 and with the
fact that the probability to realise a negative number of e-folds obviously vanishes.
The case φ = φend is singular because of the first boundary condition of Eq. (4.2.15),
which explains the singularity in Eq. (4.4.10). The coefficients an and bn can then be
expressed as an =∫ 1
−1dxP (N = 0, φ) sin[(n+1/2)πx] for n ≥ 0 and bn =
∫ 1
−1dxP (N =
0, φ) cos[nπx] for n ≥ 0, where we recall that the link between φ and x is given above
Eq. (4.4.2). This gives rise to an = 2π(n+ 1/2)/µ2 and bn = 0, hence
P (N , φ) =2π
µ2
∞∑
n=0
(n+
1
2
)exp
[−π
2
µ2
(n+
1
2
)2
N]
sin
[xπ
(n+
1
2
)], (4.4.11)
158

which can be written as
P (N , φ) =− π
2µ2ϑ′2
(π
2x, e
−π2µ2N), (4.4.12)
see Eq. (D.0.4). A few comments are in order.
First, let us stress that the results from both methods, the characteristic function
one and the heat equation one, have been necessary to derive this closed form, since
the expression coming from the characteristic function has allowed us to calculate the
coefficients an and bn in the heat equation solution. This further illustrates how useful
it is to have two approaches at hand.
Second, the expansion (4.4.11) is an alternative to the one given in Eq. (4.4.3) for
the PDF. One can numerically check that they are identical, and in Fig. 4.4, P (N , φ) is
displayed as a function ofN for various values of φ. The difference between Eqs. (4.4.3)
and (4.4.11) is that they correspond to expansions around different regions of the PDF.
In Eq. (4.4.3), since one is summing over increasing powers of e−1/N , one is expanding
around N = 0, i.e. on the “left” tail of the distribution. In Eq. (4.4.11) however,
since one is summing over increasing powers of e−N , one is expanding around N =∞,
i.e. on the “right” tail of the distribution. Therefore, if one wants to study the PDF
by truncating the expansion at some fixed order n, one should choose to work with
the expression that better describes the part of the distribution one is interested in,
so that both expressions can a priori be useful (let us stress again that, in the limit
where all terms in the sums are included, both expressions match exactly for all values
of N ).
Third, by plugging x = 1 in Eq. (4.4.12), one obtains an expression for P (N , φ =
φend + ∆φwell) that is an alternative to Eq. (4.4.4) even if both formulae involve elliptic
theta functions. In Appendix D, we show that both expressions are equivalent, due
to identities satisfied by the elliptic theta functions. In fact, a third expression for
159

P (N , φ = φend + ∆φwell) can even be obtained by plugging x = 1 into Eq. (4.4.11) and
the consistency with the two other ones is also shown in Appendix D.
Fourth, an approximated formula for the PDF in the limit φ ∼ φend can be
derived by Taylor expanding Eq. (4.4.12),
P (N , φ ' φend) ' − π2
4µ2xϑ′′2
(0, e−π2µ2N), (4.4.13)
see Eq. (D.0.5). This provides an alternative to the approximation (4.4.5), that is
displayed in the right panel of Fig. 4.5. Numerically, one can check that Eq. (4.4.5) is
slightly better.
Fifth, the PDF of coarse-grained curvature perturbations decays exponentially
as e−ζcg , i.e. much slower than the Gaussian decay e−ζ2cg . Since PBHs form along the
tail of these distributions, we expect their mass fraction to be greatly affected by this
highly non-Gaussian behaviour. More precisely, on the tail, one has
P (ζcg, φ) ∝ e− π2
4µ2ζcg , (4.4.14)
which is given by the dominant mode n = 0 in the expansion (4.4.11). Interestingly, the
decay rate of the distribution is independent of φ. Let us also note that another case
where the PDF decays exponentially is in presence of large local non-Gaussianities,
when the PDF is a χ2 distribution [263, 264].
4.5 Primordial black holes
The formalism developed so far allows one to derive the PDF of coarse-grained cur-
vature perturbations produced during a phase of single-field slow-roll inflation. Let
us now apply this result to the calculation of the mass fraction of PBHs discussed in
Sec. 4.1.
160

4.5.1 Classical limit
In the classical limit detailed in Sec. 4.3, the PDF is approximately Gaussian, see
Eq. (4.3.9), so that the considerations presented in the introduction apply. By plugging
Eq. (4.3.9) into Eq. (1.5.1), one has β = erfc[ζc/(2√vγ1 )], which is consistent with
Eq. (1.5.3) as noted below Eq. (4.3.9). In the β 1 limit, this leads to
vγ1 ' −ζ2
c
4 ln β, (4.5.1)
where from now on, the order at which the γi parameters are calculated is omitted
for simplicity. Approximating γ1 given in Eq. (4.3.8) by γ1 ' (v/v′)3∆φ/M4Pl, where
∆φ = |φ− φend| is the field excursion, one obtains
∣∣∣∣∆φv4
v′3M4Pl
∣∣∣∣ ' −ζ2
c
4 ln β(M). (4.5.2)
In this expression, let us recall that the left-hand side must be evaluated at a value
φ which is related to the PBH mass M by identifying the wavenumber that exits the
Hubble radius during inflation at the time when the inflaton field equals φ, with the
one that re-enters the Hubble radius during the radiation-dominated era when the
mass contained in a Hubble patch equals M . For instance, with ζc = 1, the bound
β < 10−22 leads to the requirement that the left-hand side of Eq. (4.5.2) be smaller
than 0.005, which constrains the inflationary potential.
In passing, let us see how the first non-Gaussian correction derived in Sec. 4.3.1
affects this result. Plugging Eq. (4.3.13) into Eq. (1.5.1), one obtains
β(M) = erfc
(ζc
2√vγ1
)+
γ2
4√vπγ5
1
e− ζ2c
4vγ1
(ζ2
c − 2vγ1
). (4.5.3)
In the β 1 limit, i.e. in the ζ2c vγ1 limit, this reads β ' 2e−ζ
2c /(4vγ1)
√vγ1/π /ζc[1+
γ2ζ3c /(8vγ
31)]. In this regime, one can see that the non-Gaussian correction is in fact
161

10−1 100 101
µ
10−60
10−55
10−50
10−45
10−40
10−35
10−30
10−25
10−20
10−15
10−10
10−5
100β
Observationally excluded
φ = φend + ∆φwell
φ = φend + 10−4∆φwell
10−4 10−3 10−2 10−1 100
(φ− φend)/∆φwell
10−60
10−55
10−50
10−45
10−40
10−35
10−30
10−25
10−20
10−15
10−10
10−5
100
β
Observationally excluded
µ = 1
µ = 0.3
µ = 0.2
µ = 0.16
Figure 4.6. Mass fraction β of primordial black holes in the quantum diffusion dominatedregime. The left panel displays β evaluated at φ = φend + ∆φwell (blue), i.e. at the reflectiveboundary of the quantum well, and at φ = φend + 10−4∆φwell, i.e. close to the absorbingboundary of the quantum well, as a function of µ = ∆φwell/(
√v0 MPl). In the right panel, β
is plotted as a function of φ for a few values of µ. One can see that the mass fraction dependsvery weakly on φ but very strongly on µ. In both panels, we have taken ζc = 1, the solid linescorrespond to the full expression (4.5.4) and the dashed line to the approximation (4.5.5).The shaded region is excluded by observations, the light shaded area roughly corresponds toconstraints for PBH masses between 109g and 1016g, the dark shaded area for PBH massesbetween 1016g and 1050g (see discussion in Sec. 4.1).
larger than the Gaussian leading order, which signals that the non-Gaussian expan-
sion breaks down on the far tail of the distribution. This also suggests that non-
Gaussianities cannot be simply treated at the perturbative level when it comes to
PBH mass fractions [264].
4.5.2 Stochastic limit
Let us now see how the constraint (4.5.2) changes in the presence of large quantum
diffusion, as considered in Sec. 4.4. In this case, the PDF of coarse-grained curvature
perturbations ζcg = δNcg = N − 〈N〉 can be obtained from Eq. (4.4.11),
β(M) =4
π
∞∑
n=0
1(n+ 1
2
) sin
[π
(n+
1
2
)x
]exp
−π2
(n+
1
2
)2 [x(
1− x
2
)+ζcµ2
].
(4.5.4)
162
In this expression, we have replaced 〈N〉 = f1 = µ2x(1−x/2) which can be obtained by
setting the potential to a constant in Eq. (4.2.4). Let us recall that x = (φ−φend)/∆φwell
and that M and φ are related as explained below Eq. (4.5.2). When x = 0, i.e. when
φ = φend, Eq. (4.5.4) yields β = 0, which is consistent with the fact that the PDF of
ζcg is a Dirac distribution in this case.
The mass fraction (4.5.4) depends only on φ, µ and ζc. It is displayed in Fig. 4.6
for ζc = 1, as a function of µ for x = 1, i.e. φ = φend + ∆φwell, and x = 10−4,
i.e. φ = φend + 10−4∆φwell, in the left panel, and as a function of φ for a few values of
µ in the right panel. One can see that β depends only weakly on φ but very strongly
on µ, which is constrained to be at most of order one. More precisely, if one assumes
that ζc µ2 so that ζc is well within the tail of the distribution and one can keep only
the mode n = 0 in Eq. (4.5.4), as was done when deriving Eq. (4.4.14), one has
β(M) ' 8
πsin(πx
2
)e−π2
8[x(2−x)]+ 2ζc
µ2 . (4.5.5)
This expression is superimposed to the full result (4.5.4) in Fig. 4.6 where one can
see that it provides a very good approximation even when the condition ζc µ2 is
not satisfied. This is because, in Eq. (4.5.4), higher terms in the sum are not only
suppressed by higher powers of e−ζ2c /µ
2but also by higher powers of e−π
2x(1−x/2), so
that Eq. (4.5.5) is an excellent proxy for all values of µ except if x is tiny. With x = 1,
it gives rise to
µ2 =∆φ2
well
v0M2Pl
= − 2ζc
1 + 8π2 ln
(π8β) . (4.5.6)
Several comments are in order regarding this result. First, with ζc = 1, β <
10−24 gives rise to µ < 0.21 and β < 10−5 gives rise to µ < 0.47. The requirement that
µ be smaller than one is therefore very generic and rather independent of the level of
the constraint on β or the precise value chosen for ζc. Since v0 needs to be smaller
than 10−10 to satisfy the upper bound [159] on the tensor-to-scalar ratio in the CMB
observational window, this also means that ∆φwell cannot exceed ∼ 10−5MPl.
163

Second, Eq. (4.5.6) should be compared with its classical equivalent, Eq. (4.5.2).
In the left-hand sides of these formulae, the scalings with ∆φ and v are not the same.
In particular, while the PBH mass fraction increases with the energy scale v in the
classical picture, in the stochastic limit, it goes in the opposite direction. One should
also note that when the potential is exactly flat, v′ = 0, the classical result diverges,
but the stochastic one remains finite. In the right-hand sides, the scaling with ζc is
also different, since the shape of the PDF P (ζcg) is not the same (it has a Gaussian
decay in the classical case and an exponential decay in the stochastic one). The
expressions (4.5.2) and (4.5.6) are therefore very different, and thus translate into
very different constraints on the inflationary potential.
Third, as mentioned below Eq. (4.5.4), the mean number of e-folds realised
across the quantum well is of order µ2,
〈N〉 = µ2x(
1− x
2
). (4.5.7)
The conclusion one reaches is therefore remarkably simple: either the region dominated
by stochastic effects is much less than one e-fold long and PBHs are not overproduced
(µ 1), or it is much more than one e-fold long and PBHs are overproduced (µ 1).
Interestingly, heuristic arguments lead to a similar conclusion in Ref. [203], in the
context of hybrid inflation.
Fourth, in terms of the power spectrum, since Eq. (3.4.14) gives Pζ = f ′2/f′1−2f1,
with f1 given above and f2 = µ4x(1 − x2/2 + x3/8)/3 as can be obtained by setting
the potential to a constant in Eq. (4.2.4), one has
Pζ =µ2
3
(2x2 − 4x+ 2
), (4.5.8)
so µ2 is also the amplitude of the power spectrum. With β < 10−22, the con-
straint (4.5.6) on µ translates into Pζ < 1.6×10⁻² for the value of the power spectrum
164

close to the end of inflation. However, contrary to the classical condition Pζ∆N < 10−2
recalled below Eq. (1.5.4), this constraint does not involve the number of e-folds since
here, a single parameter, µ, determines everything: the mean number of e-folds, the
power spectrum amplitude, and the mass fraction.
4.5.3 Recipe for analysing a generic potential
So far, we have calculated the PBH mass fraction produced in the classical limit and
when the inflaton field dynamics are dominated by quantum diffusion. In order to
analyse a generic potential, it remains to determine where both limits apply. This can
be done by comparing the NLO and NNLO results in the classical limit to estimate
the conditions under which the classical expansion is under control. For instance,
comparing Eqs. (4.3.8) and (4.3.11) for γ1, which gives the mass fraction β at NLO
as explained in Sec. 4.5.1, one can see that |γNLO1 − γNNLO
1 | γNLO1 if v 1 and
|v2v′′/v′2| 1. The first condition is always satisfied, since as already pointed out, v
needs to be smaller than 10−10 to satisfy the upper bound [159] on the tensor-to-scalar
ratio in the CMB observational window. The second condition defines our “classicality
criterion” [202]
ηclass ≡∣∣∣∣v2v
′′
v′2
∣∣∣∣ . (4.5.9)
When ηclass 1, the classical expansion is under control, at least at NNLO, and one
can use the results of Sec. 4.5.1. When ηclass 1, one is far from the classical regime,
quantum diffusion dominates the inflaton field dynamics and the results of Sec. 4.5.2
apply. When ηclass is of order one, a full numerical treatment is required. The “recipe”
for analysing a generic potential is therefore the following:
• calculate ηclass given by Eq. (4.5.9) and identify the regions of the potential where
ηclass 1 and ηclass 1;
• in the regions where ηclass 1, make use of the constraint from Eq. (4.5.1);
• in the “quantum wells” defined by ηclass 1, make use of the constraint from
Eq. (4.5.6).
165

In the following, we illustrate this calculational programme with two examples
and check its validity.
4.5.4 Example 1: V ∝ 1 + φp
We first consider the case where PBHs can form at scales that exit the Hubble radius
towards the end of inflation, where the potential can be approximated by a Taylor
expansion around φ = 0 where inflation is assumed to end (φend = 0), so
v = v0
[1 +
(φ
φ0
)p]. (4.5.10)
In this model, inflation does not end by slow-roll violation but another mechanism must
be invoked [265–269]. We also assume that the potential is in the vacuum-dominated
regime for the range of field values relevant for PBH formation, so that φ φ0. A
comprehensive study of this potential is performed in Appendix E where all cases of
interest are systematically identified and investigated. Here, we simply check that the
calculational programme sketched above allows us to recover the main results.
In order to describe the model (4.5.10) in terms of the situation depicted in
Fig. 4.3, one has to assess ∆φwell, which marks the boundary between the classical and
the stochastic regimes. In the vacuum-dominated approximation, Eq. (4.5.9) gives rise
to ηclass ' (p− 1)v0(φ/φ0)−p/p, which is of order one when φ = ∆φwell with
∆φwell ' φ0v1p
0 . (4.5.11)
Since (∆φwell/φ0)p = v0 1, the vacuum-dominated condition is always satisfied at
this transition point. However, the slow-roll conditions are not always met, and in
Appendix E it is shown that slow roll is indeed violated at φ = ∆φwell if φ0/MPl <
v(p−2)/(2p)0 , unless p = 1 for which slow-roll is violated if φ0 < MPl. In such cases, the
expansion (4.5.10) fails to cover the whole quantum well and higher-order terms in the
166
potential must be included for a consistent analysis. Otherwise, we can keep following
the recipe given above.
In the classical regime, φ ∆φwell, Eq. (4.5.1) applies, where vγ1 is
given by Eq. (4.3.8). In the vacuum-dominated approximation, it reads vγ1 'v0(φ0/MPl)
4/(4p3− 3p4)[(φ/φ0)4−3p− (φend/φ0)4−3p]. Neglecting the contribution from
φend, which lies outside the validity range of the classical formula anyway, one can
evaluate this expression at φ = ∆φwell where the power spectrum is maximal, and
combining this with Eq. (4.5.1) leads to
v2p−1
0√|4p3 − 3p4|
(φ0
MPl
)2
' ζc
2√| ln β|
. (4.5.12)
In the stochastic regime, combining Eqs. (4.5.6) and (4.5.11), one has
v2p−1
0
(φ0
MPl
)2
' 2ζc∣∣1 + 8π2 ln
(π8β)∣∣ . (4.5.13)
It is interesting to notice that up to an overall factor of order one, the two con-
straints (4.5.12) and (4.5.13) are very similar, even though they are obtained in very
different regimes that yield very different PDFs for the curvature perturbations.
It is also important to note that the slow-roll conditions given above imply that
v2/p−10 (φ0/MPl)
2 1 except if p = 1. Therefore, if p is different from 1, either PBHs
are too abundant and the model is ruled out, or slow roll is strongly violated before one
exits the classical regime and one needs to go beyond the present formalism to calculate
PBH mass fractions. The case p = 1 is subtle, since Eq. (4.5.9) gives ηclass = 0. One
would thus have to extend the classical expansion of Sec. 4.3 to next-to-next-to-next
to leading order (NNNLO) to determine what the first stochastic correction is and
under which condition the classical approximation holds, and investigate numerically
the regime where it does not. This study is left for future work.
167

10−9 10−8 10−7 10−6 10−5 10−4 10−3 10−2 10−1 100
φ/φ0
10−12
10−10
10−8
10−6
10−4
10−2
100
102
104
106
108
P ζ
∆φ
wel
l/φ
0
full result
slow−roll classical limit
classical limit
stochastic limit
Figure 4.7. Power spectrum of curvature perturbations Pζ produced in the potential (4.5.10)with p = 2, v0 = 10−11, φ0 = 4MPl and φuv = 104φ0 (solid black line). The blue linecorresponds to the slow-roll classical limit (1.5.5), while the green dashed line is obtainedfrom solving the full Klein-Gordon equation. The red line corresponds to the stochastic limitassuming the potential is exactly flat for φ < ∆φwell and that a reflective wall is located atφ = ∆φwell. The value of ∆φwell obtained from requiring ηclass = 1 is displayed with the greyvertical dotted line and delimitates the classical and stochastic regimes.
In passing, let us check that approximating the full potential (4.5.10) as a piece-
wise function consisting of a constant piece and a classical one, separated at φ = ∆φwell,
is numerically justified. In Fig. 4.7, we show the power spectrum computed numerically
from Eqs. (4.2.4) and (3.4.14), which gives Pζ = f ′2/f′1 − 2f1, in the potential (4.5.10)
with p = 2, v0 = 10−11, φ0 = 4MPl and φuv = 104φ0 (solid black line). The blue
line corresponds to the slow-roll classical limit (1.5.5), and the green dashed line is
obtained from solving the full Klein-Gordon equation. The agreement of this solution
with the slow-roll formula confirms that the slow-roll conditions are satisfied for the pa-
rameters used in this example. The red line corresponds to the stochastic limit (4.5.8)
Pζ = 2µ2/3 at φ = 0, where µ is given by Eqs. (4.4.2) and (4.5.11), which yields
Pζ ∼ 2(φ0/MPl)2v
2/p−10 /3. One can see that both limits are correctly reproduced,
168

0.0 0.2 0.4 0.6 0.8 1.0
φ/Mpl
0.90
0.95
1.00
1.05
1.10
v(φ
)/v 0
RMI1 RMI2
RMI3 RMI4
c = 0.8
c = −0.8
φ = φ0
Figure 4.8. The potential (4.5.14) for running-mass inflation (RMI) with φ0 = 0.5MPl.The blue curve takes c = 0.8 and the green curve takes c = −0.8 (these values may not bephysical but they have been chosen to produce a clear plot). RMI is shown to have fourpossible realisations (RMI1, RMI2, RMI3 and RMI4), depending on the sign of c and onwhether φ is initially smaller or larger than φ0. Except for RMI2, the potential flattens asinflation proceeds, which can lead to the formation of PBHs for scales exiting the Hubbleradius towards the end of inflation.
and that the value of ∆φwell obtained in Eq. (4.5.11) from our classicality criterion
ηclass < 1, and displayed with the grey vertical dotted line, indeed separates the two
regimes. In Appendix E, an analytical expression for Pζ in the regime φ ∆φwell is
derived, and one finds Pζ = 2Γ2(1/p)v2/p−10 (φ0/MPl)
2/p2, see Eq. (E.0.11), where Γ is
the gamma function. Up to an overall numerical constant of order one, one recovers the
result obtained from simply assuming the potential to be exactly flat until φ = ∆φwell,
where ηclass = 1, and setting a reflective wall there. This confirms the validity of this
approach.
169

4.5.5 Example 2: running-mass inflation
Let us now consider another example, running-mass inflation (RMI) [270], where the
inflationary potential is given by
v (φ) = v0
1− c
2
[−1
2+ ln
(φ
φ0
)]φ2
M2Pl
. (4.5.14)
In this expression, c is a dimensionless coupling constant assumed to be much smaller
than one, c 1 (more precisely, as discussed in Ref. [271], within supersymmetry,
natural values of c are c ' 10−2 to 10−1 for soft masses values matching the energy
scale of inflation), and φ0 must be sub-Planckian, φ0 MPl.
The potential (4.5.14) is displayed in Fig. 4.8, where one can see that depending
on the sign of c and on whether φ is initially smaller or larger than φ0, inflation can
proceed in four regimes [272], that we denote RMI1, RMI2, RMI3 and RMI4. In RMI1,
c > 0, φ < φ0 and φ decreases towards φ = 0 as inflation proceeds. RMI2 also has
c > 0 but in this case φ > φ0 and φ increases away from φ0 throughout inflation.
RMI3 and RMI4 both have c < 0, but RMI3 has φ < φ0 with φ increasing towards φ0
during inflation, while RMI4 has φ > φ0 and φ decreases towards φ0 during inflation.
In RMI1, RMI3 and RMI4, the potential flattens as inflation proceeds, which may lead
to the production of PBHs at scales that exit the Hubble radius towards the end of
inflation, as studied in Refs. [273–275]. The width of the “quantum well” in these
cases is determined by the condition ηclass > 1, where ηclass is given by Eq. (4.5.9). In
the vacuum-dominated regime, it reads
ηclass 'v0
|c|M2
Pl
φ2
∣∣∣1 + ln(φφ0
)∣∣∣
ln2(φφ0
) . (4.5.15)
For RMI1, the equation ηclass(φwell) = 1 yields φwell/φ0
√| ln(φwell/φ0)| =
√v0/cMPl/φ0, where we have assumed that φwell φ0 so that | ln(φwell/φ0)| 1.
170

This can be solved as
φwell = φ0 exp
[1
2W−1
(−2
v0
c
M2Pl
φ20
)], (4.5.16)
where W−1 is the −1 branch of the Lambert function [276]. The approxima-
tion | ln(φwell/φ0)| 1 is satisfied when the argument of the Lambert function in
Eq. (4.5.16) is much smaller than one, which is typically the case for the values of v0,
c and φ0 considered in the literature [100, 271]. In this limit, one can Taylor expand
the Lambert function according to W−1(−x) ' lnx when x 1, which gives rise to
φwell '√
2v0/cMPl, and hence
∆φwell = |φwell| '√
2v0
cMPl . (4.5.17)
In this expression, we have assumed that inflation terminates at φ = 0 (otherwise, φend
must be subtracted from the right-hand side). Making use of Eq. (4.4.2), this leads to
µ2 ' 2
c 1 . (4.5.18)
The result is remarkably simple since it depends only on the coupling constant c,
and on neither v0 nor φ0. As explained at the beginning of this section, c is always
much smaller than one, which implies that µ 1 and according to the discussion of
Sec. 4.5.2, PBHs are too abundant in this case. One concludes that the stochastic
regime of the potential cannot be explored in RMI1, i.e. φend should be at least of the
order of ∆φwell given in Eq. (4.5.17).
For RMI2, the potential does not flatten as inflation proceeds so the inflaton
field dynamics is never dominated by quantum diffusion for scales smaller than those
probed in the CMB.
For RMI3 and RMI4, assuming that φwell is very close to φ0 so that
| ln(φwell/φ0)| 1, the equation ηclass(φwell) = 1 reduces to φwell/φ0| ln(φwell/φ0)| =
171

√v0/|c|MPl/φ0. This can be solved as
φwell = φ0 exp
[W0
(∓√v0
|c|MPl
φ0
)], (4.5.19)
where W0 is the principal branch of the Lambert function, and its argument comes
with a minus sign in RMI3 and with a plus sign in RMI4. The approximation
| ln(φwell/φ0)| 1 is satisfied when the argument of the Lambert function in
Eq. (4.5.19) is much smaller than one, which is the same condition as the one coming
from φwell φ0 in RMI1. In this limit, one can Taylor expand the Lambert function
as W0(x) ' x when x 1. One obtains φwell ' φ0 ∓MPl
√v0/|c| , and hence
∆φwell = |φwell − φ0| 'MPl
√v0
|c| . (4.5.20)
Up to a factor√
2 , this expression is the same as Eq. (4.5.17). This leads to
µ2 ' 1
|c| 1 , (4.5.21)
and the same conclusions as the ones drawn for RMI1 apply, namely that one cannot
explore the quantum well of the potential without producing too many PBHs, so
|φend − φ0| should be at least of order ∆φwell given in Eq. (4.5.20).
If this is indeed the case, the classical approximation is valid throughout the
entire period of inflation, and Eq. (1.5.5) gives rise to
Pζ ' 2v0
c2
M2Pl
φ2ln−2
(φ
φ0
). (4.5.22)
172

When this expression is evaluated at φwell, given by Eq. (4.5.16) for RMI1 and by
Eq. (4.5.19) for RMI3 and RMI4, one finds
Pζ (φwell) '
4c
in RMI1
2|c| in RMI3 and RMI4
. (4.5.23)
It is interesting to notice that, up to an overall numerical constant of order one, this
also corresponds to the stochastic limit (4.5.8), Pζ ∼ µ2 ∼ 1/c, where one makes
use of Eqs. (4.5.18) and (4.5.21). This is similar to what was found in Sec. 4.5.4.
Since |c| 1, this means that the classical power spectrum is already larger than one
when one enters the quantum well. This implies that, for this model, analyses relying
on the classical formalism only should exclude the quantum well (even if not for the
correct reason) and should therefore be valid. However, let us stress that the approach
developed in this work was necessary in order to check the consistency of the standard
results.
4.6 Conclusions
Let us now summarise the main finding of this chapter. Making use of the stochastic-
δN formalism, we have developed a calculational framework in which the PDF of
the coarse-grained curvature perturbations produced during inflation can be derived
exactly, even in the presence of large quantum backreaction on the inflaton field dy-
namics. More precisely, we have proposed two complementary methods, one based on
solving an ordinary differential equation for the characteristic function of the PDF,
and the other based on solving a heat equation for the PDF directly. We have shown
that depending on the problem one considers, the method to be preferred can vary.
We have then derived a classicality criterion that determines whether the effects of
quantum diffusion are important or not. When this is not the case, i.e. in the classical
limit, we have developed an expansion scheme that not only recovers the standard
173

Gaussian PDF at leading order, but also allows one to calculate the first non-Gaussian
corrections to the usual result. In the opposite limit, i.e. when quantum diffusion plays
the dominant role in the field dynamics, we have found that the PDF follows an elliptic
theta function, whose tail decays only exponentially, and which is fully characterised
by a single parameter, given by µ2 = (∆φwell)2/(v0M
2Pl). This parameter measures the
ratio between the squared width of the quantum well and its height, in Planck mass
units. The mean number of e-folds realised across the quantum well, the amplitude of
the power spectrum, and, if ζc ∼ 1, the inverse log of the PBH mass fraction, are all
of order µ2. Therefore, observational constraints on the abundance of PBHs put an
upper bound on µ2 that is of order one, and imposes that one cannot spend more than
∼ 1 e-fold in regions of the potential dominated by quantum diffusion. For a given
potential, one must therefore determine whether a diffusion dominated quantum well
exists, and check that its width squared is smaller than its height. Finally, we have
illustrated our calculational programme with two examples.
However, it is important to remember that in this chapter we have worked
exclusively in the slow-roll regime. There are cases where slow roll is violated when
scales smaller than those probed in the CMB exit the Hubble radius and the standard
PBH calculation does not apply, as recently pointed out in Refs. [237, 277, 278]. This,
for instance, happens when the inflationary potential has a flat inflection point [236],
around which slow roll is transiently violated and one can enter an ultra slow-roll phase.
Close to such an inflection point, quantum diffusion plays an important role and this
also needs to be included. This requires the formalism presented in this chapter to be
extended beyond the slow-roll approximation [192], and in the next chapter we will
extend the methods presented here into the ultra-slow-roll regime.
174

Chapter 5
Ultra-slow-roll inflation with
quantum diffusion
In this chapter, we will develop the stochastic formalism of inflation (see Sec. 3) into the
regime of ultra-slow-roll (USR) inflation. Since the submission of this thesis, the work
in this chapter work has been continued and (eventually) submitted for publication in
[279]. This was done in collaboration with Vennin, Wands, Assadullahi.
In slow roll, the stochastic-δN formalism has been used to reconstruct the full
probability distribution function for the primordial density field [238, 280] finding large
deviations from a Gaussian distribution in the nonlinear tail of the distribution, as
described in chapter 4. However, it has recently become clear that there are physical
situations of interest in which stochastic effects are important but also where slow
roll is violated. This is commonly seen in the discussion of primordial black holes
(PBHs) from inflationary models with a flat portion of the potential near the end
of inflation [175–177, 236, 237]. When the potential is very flat, the inflaton can
be subject to large stochastic diffusion [238], as well being kicked off the slow-roll
attractor and violating the associated approximations. This can lead to a phase of
USR inflation [181, 182], which we have seen can be stable [180] if certain conditions
are met (see Chapter 2).
175

Here we will extend the characteristic function approach introduced in chapter
4 to the (USR) regime. We will reconstruct the probability distribution of curvature
perturbations in specific cases, and discuss possible consequences for PBH production
during such a phase of USR inflation.
This chapter is organised as follows: In Sec. 5.1, we discuss the USR system we
are considering and explain how we build a stochastic formalism for this regime. In
Sec. 5.2, we develop the characteristic function formalism that we originally introduced
in Chapter 4 to be used in USR, and in Sec. 5.3 we show how this can be solved
iteratively in the “classical limit”, where quantum diffusion provides a subdominant
contribution to the dynamics of the inflaton. In Sec. 5.4, we solve the USR system in the
late-time limit, where the classical velocity of the inflaton has completely decayed and
the dynamics are purely quantum diffusion. Then, in Sec. 5.5, we solve the stochastic
limit, where there is a small, but non-vanishing, classical velocity, and also discuss the
implications this can have on primordial black hole production. Finally, in Sec. 5.6,
we present some concluding remarks.
5.1 Stochastic ultra-slow-roll inflation
Let us briefly review the USR regime for inflation, before we discuss the stochastic
formalism in this regime. USR is realised when the gradient of the inflaton potential
becomes negligible with respect to the Hubble damping in the equation of motion
(1.3.10), so V ′(φ)/3Hφ→ 0.
In this limit, the classical equation of motion (1.3.10) becomes friction-
dominated and can be simplified to
φ+ 3Hφ ' 0 , (5.1.1)
176
which gives the classical USR solution φ = φine−3N , and hence
φ = φin + 3H(φin − φ) , (5.1.2)
This USR evolution is dependent on the initial conditions of the inflaton field and its
velocity, unlike in slow roll where the slow-roll trajectory is an attractor independent
of the initial velocity
These solutions are classical background solutions, and do not yet include the
effect of quantum diffusion on the inflaton’s evolution. We assume that the inflaton
classically decreases (φ < 0) towards a minimum field value φend where inflation ends.
However quantum diffusion can in principle probe arbitrarily large field values. We will
assume that at sufficiently large field values the potential becomes sufficiently steep
that the potential gradient cannot be neglected and the resulting classical drift towards
φend dominates over the quantum diffusion. We therefore impose a cut-off at large field
values by imposing a reflective boundary at a maximum value φwell. We refer to the
flat portion of a potential, as a “quantum well” [238], which has a finite width
∆φwell = φwell − φend . (5.1.3)
We can use the classical equation (5.1.2) to calculate the critical velocity, which
is the minimum velocity the system needs at φin in order to exactly reach the endpoint
φend purely through classical USR motion. Hence from Eq. (5.1.2), with φ → 0 as
φ→ φend, we have
φin
∣∣∣∣crit
= −3H (φin − φend) . (5.1.4)
This is the classical velocity needed to reach φend from a given initial point in the
quantum well. Let us define pcrit to be the classical velocity needed to traverse the
177
entire quantum well, from φwell to φend, under classical motion alone, so that
pcrit = −3H∆φwell . (5.1.5)
To take into account quantum kicks, we use stochastic inflation, where in USR
we can evaluate the general Langevin equations (3.1.13) and (3.1.14) for a flat potential
[177] to find
dφ
dN=
p
H+H
2πξ(N) , (5.1.6)
dp
dN= −3p , (5.1.7)
where p = dφ/dt (in the background) and H is the Hubble parameter. This is valid for
a flat potential V ′ = 0 and where we neglect the noise associated with p as it is second
order in the coarse-graining parameter, see [177] for details of this. We will treat this
as a 2−dimensional problem, and hence regard φ and p as independent variables. A
sketch of the setup we are considering is displayed in Fig. 5.1.
From here, in order to reduce the number of parameters needed to describe this
USR system, we make the change of variables
φ→ x =φ− φend
∆φwell
, p→ y =p
pcrit
, (5.1.8)
where pcrit is given by (5.1.5). Using these variables, the Langevin equations (5.1.6)
and (5.1.7) becomedx
dN= −3y +
√2
µξ(N)
dy
dN= −3y ,
(5.1.9)
178

Figure 5.1. A sketch of the ultra-slow-roll scenario. The inflaton moves on the flat potentialthrough a classical velocity, denoted by the blue arrow, and by quantum diffusion, denotedby the magenta arrows. Inflation ends at φ = φend and there is a reflective wall at φ = φwell,which in practice should be thought of as a point where the potential becomes steep enoughthat the classical drift pushes us towards φend.
where we have assumed H2 ' V0/(3M2Pl) is constant1 and defined the dimensionless
parameter
µ2 =8π2
H2∆φwell
2 , (5.1.11)
as in Chapter 4. In these variables, our entire problem is specified with only one
parameter, namely µ, along with the initial state (xin, yin). Note that x ∈ [0, 1], and
for yin < 1 the field would not cross the quantum well under purely classical motion
and will become dominated by the quantum diffusion at some time, while for yin ≥ 1
1In our (x, y) variables, the Hubble parameter is given by
H2 =V0
3M2Pl − 9
2∆φwell2y2
, (5.1.10)
and hence the assumption H ' constant is equivalent to y < MPl/∆φwell, i.e. we assume the quantumwell is not “too” wide.
179

the field would cross the well classically and for large enough2 values of yin it may never
become diffusion dominated.
5.2 Characteristic function formalism
In this section we discuss the characteristic function formalism developed in chapter 4
and extend the analysis for USR inflation.
5.2.1 First passage time analysis
While we use the same first passage time analysis techniques as in chapter 4, here we
present an alternative (but equivalent) way of deriving the relevant equations [202].
We begin by deriving a 2D Fokker–Planck equation for the system (5.1.6), which is
the equation governing the moments of the probability distribution of the number of
e-folds P (N) (these calculations are demonstrated in Appendix F). and we find this
to be∂P
∂N=
[3 + 3y
(∂
∂x+
∂
∂y
)+
1
µ2
∂2
∂x2
]P
≡ LFP · P .(5.2.1)
2In fact, if one is only interested in a USR regime that is inflating (as opposed to USR non-inflation), then there exists a maximum value for the variable y. This can be seen by first noting thatH = φ2/(2M2
Pl), and hence
H2 =φ2
2ε1M2Pl
. (5.1.12)
This in turn allows us to write
y =
√2ε1 MPl
3∆φwell, (5.1.13)
where we have taken a minus sign when taking√H2 (since φ < 0 and H > 0), and hence imposing
inflation (ε1 < 1) gives a maximum value of y to be
ymax =
√2MPl
3∆φwell. (5.1.14)
In particular, we see that if one considers the extreme case an infinitely wide, flat potential thenymax → 0, and hence this case is described by free diffusion in (5.1.9). This makes sense, since theclassical velocity needed to traverse an infinitely wide well is infinite, pcrit →∞ in (5.1.5).
180

As detailed in [247], the equation that gives the moments of the PDF, defined as
fn(xi, y) = 〈N n〉(xini = xi, y), is then given by
L†FP · fn(xi, y) = −nfn−1(xi, y) , (5.2.2)
where L†FP is the adjoint Fokker–Planck operator, and hence the moments of P are
given by the recursive relation
[1
µ2
∂2
∂x2− 3y
(∂
∂x+
∂
∂y
)]fn = −nfn−1 , (5.2.3)
with n ≥ 1 and f0 = 1, and boundary conditions
fn(0, y) = 0 ,∂fn∂x
(1, y) = 0 , (5.2.4)
i.e. all trajectories initiated at xin = 0 realise a vanishing number of e-folds, and we
implement the presence of a reflective wall at x = 1.
5.2.2 Characteristic function
We again make use of the characteristic function χN (t;x, y), given by Eq. (4.2.5),
which is the (inverse) Fourier transform of the probability distrution of the number
of e-folds, see Eq. (4.2.10), where we see that the dummy variable t has become the
number of e-folds N in this transformation. The characteristic function of curvature
perturbations, defined by ζcg = δNcg = N − 〈N〉, can then be found via Eq. (4.2.8),
where the mean number of e-folds 〈N〉 (x, y) is given by
〈N〉(x, y) = f1(x, y) = −i ∂χN∂t
∣∣∣∣t=0
, (5.2.5)
181

and the PDF of curvature fluctuation through the Fourier transform
P (ζcg;x, y) =1
2π
∫ ∞
−∞e−it[ζcg−〈N〉(x)]χN (t;x, y) dt . (5.2.6)
In fact, the characteristic function generates all the moments of the associated proba-
bility distribution and the nth moment is given by
fn(x, y) = i−n∂n
∂tnχN (t;x, y)
∣∣∣∣t=0
. (5.2.7)
If we combine the definition of the characteristic function (4.2.5) with the equation of
motion for the moments (5.2.3), we find an equation for the characteristic function in
USR, namely [1
µ2
∂2
∂x2− 3y
(∂
∂x+
∂
∂y
)+ it
]χN (t;x, y) = 0 . (5.2.8)
This is still a second order PDE, but is now uncoupled and must be solved at each
fixed t, rather than being a tower of coupled PDEs for each moment of the distribution
that becomes increasingly more difficult to solve, as (5.2.3) does. The system (5.2.8)
also comes endowed with initial conditions given by
χN (t, 0, y) = 1 ,∂χN∂x
(t, 1, y) = 0 . (5.2.9)
We do not have the general analytic solution for the USR characteristic function given
by (5.2.8), but we can study this equation in certain simplifying limits. We will first give
the “classical limit” in which the classical drift dominates over the quantum diffusion in
Sec. 5.3, and we will then go on to consider the “stochastic limit” in which the quantum
diffusion dominates. In Sec. 5.4 we solve (5.2.8) analytically in the “late-time limit”
in which the velocity y has completely decayed and we simply have the inflaton freely
diffusing on its potential, and in Sec. 5.5 we include first-order corrections due to a
small classical velocity y.
182

5.3 Classical limit
In this section, we expand the characteristic function about its classical limit, in which
the stochastic diffusion in negligible in comparison to the classical drift.
5.3.1 Leading order
Let us first solve the leading order classical limit of equation (5.2.8). This corresponds
to neglecting the second derivative term, which originates from the quantum diffusion,
and so the classical limit of the equation is
[−3y
(∂
∂x+
∂
∂y
)+ it
]χN (t;x, y) = 0 , (5.3.1)
along with the initial condition χN (t, 0, y) = 1. This PDE can then be solved (see
Appendix F.3 for details) and gives the classical limit of the characteristic function to
be
χN∣∣cl
(t;x, y) =
(1− x
y
)− it3
. (5.3.2)
Note that this solution does not satisfy the second boundary condition x = 1, but this
is not necessary in the classical limit as there is no diffusion. We can use now this to
calculate the leading order of specific moments fn(x, y) of the PDF P (N ;x, y). For
instance, the mean number of e-folds, given by (5.2.5), is found to be
〈N〉(x, y)∣∣cl
= −1
3ln
[1− x
y
], (5.3.3)
which we note matches the classical limit found in [177] (see equation (4.5) in their
paper). Note that from (4.2.8), we find that χζcg = 1 and hence from (5.2.6) we have
P (ζcg) = δ(ζcg), or in terms of e-folds
P (N ;x, y) = δ(N − 〈N〉(x, y)
∣∣cl
). (5.3.4)
183

This is exactly as one would expect at leading order in the classical limit, since we
have completely neglected quantum diffusion and so any trajectory in the system will
realise the same, deterministic number of e-folds.
5.3.2 Next-to-leading order
We can now use our classical solution to perform an expansion about the classical so-
lution, i.e. for small quantum diffusion. We do this by using the leading-order classical
solution as the source term for the next-to-leading order (NLO) solution, i.e.
[−3y
(∂
∂x+
∂
∂y
)+ it
]χN (t;x, y)
∣∣∣NLO
= − 1
µ2
∂2
∂x2χN (t;x, y)
∣∣∣cl. (5.3.5)
Inputting the classical solution (5.3.2), the differential equation we need to solve be-
comes
[−3y
(∂
∂x+
∂
∂y
)+ it
]χN (t;x, y)
∣∣∣NLO
= − 1
y2
it
3µ2
(1 +
it
3
)(1− x
y
)−2− it3
, (5.3.6)
subject to the initial conditions (5.2.9). Solving this PDE using the same methods as
before (see Appendix F.3.1), we find the next-to-leading order solution to be
χN
∣∣∣∣NLO
=
(1− x
y
)− it3
1− it
3
(1 +
it
3
) 13
ln[1− x
y
]
µ2(y − x)2
=
(1− x
y
)− it3
[1 +
it
3
(1 +
it
3
) 〈N〉∣∣cl
µ2(y − x)2
].
(5.3.7)
This procedure can be iterated to higher orders, where one can use the expression of
the characteristic function at order (N)nLO to evaluate the second derivative term in
(5.2.8) and then solve this equation for the characteristic function at order (N)n+1LO.
184

Once again we can calculate the mean number of e-folds using (5.2.5) and we find
〈N〉(x, y)∣∣∣NLO
= −1
3ln
[1− x
y
] [1− 1
3µ2 (y − x)2
]
= 〈N〉∣∣cl
[1− 1
3µ2 (y − x)2
],
(5.3.8)
where the correction to the classical solution is of order µ−2, and once again µ is the
only parameter that controls the expression.
We can also calculate the power spectrum at leading order using
Pζ =dδN 2
d〈N〉 =(δN 2)′
〈N〉′ , (5.3.9)
where δN 2 = 〈N 2〉 − 〈N〉2, and in the second equality where a prime is a derivative
with respect to the classical number of e-folds. Making use of (5.2.7) and noting that
〈N 2〉(x, y) = f2(x, y), we have
〈N 2〉 =2 〈N〉
∣∣cl
9µ2 (y − x)2 + 〈N〉∣∣cl
2
[1− 2
3µ2(y − x)2
], (5.3.10)
and hence
δN 2 =2
9µ2(y − x)2〈N〉
∣∣cl
[1−
〈N〉∣∣cl
µ2(y − x)2
]. (5.3.11)
Thus, we find the power spectrum to be
Pζ(x, y) ' 2
9µ2 (y − x)2 , (5.3.12)
at leading order in µ−2. Here we see that the correction to the power spectrum is of
the same order of the correction to the mean number of e-folds (5.3.8), and hence in
the classical limit of our system, the power spectrum remains small.
185
5.4 Late-time limit
If we consider the late-time limit of our USR system, which relates to trajectories that
experience a long time in the USR regime, then we expect the (classical) velocity y
to become negligible since y = yine−3N decays exponentially. The late-time limit thus
corresponds to y ≈ 0, and (5.2.8) becomes
1
µ2
∂2
∂x2χN (t;x, y) = −itχN (t;x, y) . (5.4.1)
This is equivalent to free diffusion on a flat potential (i.e. the inflaton enters the
quantum well with no classical velocity), which has previously been studied in chapter
4, and we note that in this zero velocity limit, we recover the slow-roll Langevin
equations for a flat potential. This means that, despite what one may be concerned
with, it is not inconsistent to use the slow-roll Langevin equation on an exactly flat
potential. In fact, one should consider this as working in the small velocity, or late
time, limit of the full USR system. Classically this limit is not well-defined, since
the inflaton will remain at rest if there is no classical velocity present, but when one
considers quantum diffusion this effectively “regularises” the problem and gives a well-
defined system.
The solution for the characteristic function defined by (5.4.1) is then given by
Eq. (4.4.1), where it is interesting to note that this late-time (y → 0) limit of the USR
problem is equivalent to the slow-roll problem studied in Sec. 4.4. The PDF of the
number of e-folds is then the inverse Fourier transform of the characteristic function,
and is given by Eq. (4.4.11), which we rewrite here for convenience
P (N , φ) =2π
µ2
∞∑
n=0
(n+
1
2
)exp
[−π
2
µ2
(n+
1
2
)2
N]
sin
[xπ
(n+
1
2
)]. (5.4.2)
This PDF is plotted in the left hand side of Fig. 5.2 for µ = 1.
186

0.0 0.5 1.0 1.5 2.0
N0.0
0.5
1.0
1.5
2.0
2.5
3.0P
( N)
full analytic solution
leading order only
0.0 0.5 1.0 1.5 2.0
N10−3
10−2
10−1
100
P( N
)
full analytic solution
leading order only
Figure 5.2. The PDF (5.4.2) is plotted in black. The cyan dashed line is only the leadingorder term in (5.4.2), corresponding to the n = 0 term, and we see the exponential decayof the tail of the distribution. The left hand plot uses a linear scale for the y-axis while theright hand plot uses a log scale.
Let us note that (5.4.2) is an expansion in powers of ∝ e−N , that is, we are
expanding about N = ∞ which is the tail on the right-hand side of the distribution
(describing large values of N ) in Fig. 5.2. In particular, we see that the tail of the
distribution decays exponentially, and not as a Gaussian, which is the approximation
that is often used in the study of the formation of primordial black holes. To illustrate
this point, we also plot just the leading order exponential of the PDF in the right hand
plot of Fig. 5.2, which corresponds to the n = 0 term in (5.4.2). That is, we plot
P (N , φ)
∣∣∣∣n=0
=π
µ2exp
[− π2
4µ2N]
sin[πx
2
], (5.4.3)
and we see that on the tail this is perfectly sufficient to explain the decay of the
distribution.
An interesting observation about the late time limit is that it is independent
of the initial velocity yin and hence all trajectories tend to the same behaviour in the
large-N limit. This means that once the classical velocity has become negligible, we
187

can model the late-time behaviour as free diffusion using (5.4.2) from the field value at
which the velocity vanishes. That is, the decay rate of the PDF at late times is given
by the width of the USR region once y → 0.
We can also calculate the mean number of e-folds from (4.4.1) to be
〈N (x)〉 = µ2x(
1− x
2
), (5.4.4)
which, in USR, gives 〈N〉 for an initial field value φ and zero initial velocity.
5.5 Stochastic USR limit
In order to understand the dynamics of the inflaton in the stochastic limit, we will
expand Eq. (5.2.8) in the limit of small classical velocity y. This corresponds to the
quantum diffusion dominating over the classical drift during USR inflation.
5.5.1 Stochastic limit expansion
In the stochastic, small-y limit, let us Taylor expand the characteristic function as
χN (x, y, t) = χN (x, 0, t) + yf(x, t) , (5.5.1)
where χN (x, 0, t) is given by (4.4.1). At leading order in the stochastic USR (small-y)
limit we have
[1
µ2
∂2
∂x2− (3− it)
]f(x, t) = 3
∂
∂xχN (x, 0, t)
= 3α√t µ
sinh[α√t µ(x− 1)
]
cosh[α√t µ] ,
(5.5.2)
with boundary conditions
f(0, t) = 0 ,∂f
∂x(1, t) = 0 . (5.5.3)
188

One can check that this is solved via
f(x, t) = C1(t)e√
3−it µx + C2(t)e−√
3−it µx − α√t µ
sinh[α√t µ(x− 1)
]
cosh[α√t µ] , (5.5.4)
for some C1(t) and C2(t) to be found using the boundary conditions (5.5.3). Doing
this allows us to calculate f completely, which we find to be
f(x, t) =−i√t µ√
3− it cosh(α√t µ)
cosh(√
3− it µ)√
t sinh(√
3− it µx)
−α∗√
3− it sinh(α√t µ)
cosh[√
3− it µ(x− 1)]
−α∗√
3− it cosh(√
3− it µ)
sinh[α√t µ(x− 1)
],
(5.5.5)
where α∗ is the complex conjugate of α. Recall at this point that
χN (x, y, t) = χN (x, 0, t) + yf(x, t) , (5.5.6)
where each of these terms is given above. As we have done before, we can find the
mean number than e-folds using (5.2.5), and then find
〈N〉 (x, y) =µ2
2
(2x− x2 − 2y + 2xy
)
+µy
cosh(√
3 µ)µ cosh
[√3 µ (x− 1)
]− 1√
3sinh
[√3 µx
],
(5.5.7)
which, as expected, reduces to (5.4.4) when y = 0. Here, x and y denote the initial
values of these variables when the USR regime begins. The expression (5.5.7) is dis-
played as a function of the initial velocity yin in Fig. 5.3 and compared with a numerical
simulation of many realisation of the Langevin equations (5.1.6)-(5.1.7) for µ = 1. We
use this value for µ as we have seen in Chapter 4 that this provides an upper limit for µ
if we want to satisfy PBH constraints. The number of numerical simulation used varies
between 106 and 108 depending on the value of the initial velocity, and the ensemble
189

average of the number of e-folds elapsed in each of the realisations is displayed with
the blue bars. These bars correspond to an estimate of the 2σ statistical error, which is
presence due to using a finite number of realisations, and we estimate this error using
the jackknife resampling method, which we now describe.
For a sample of n trajectories, the central limit theorem states that the statistical
error on this sample scales as 1/√n , and so we can write the standard deviation as
σ = λ/√n . We now need to find λ, and to do this we divide our set of realisations
into nsub subsamples, each of size n/nsub. In each subsample, we then compute the
mean number of e-folds 〈N〉(nsub) for that subsample and then compute the standard
deviation σn/nsubacross the set of values of 〈N〉(nsub) that are obtained. This give us
λ =√n/nsub σn/nsub
, and hence σn = σnsub/√nsub . In practice, we take nsub = 100
and evaluate the statistical error using this formula to give the error bars displayed in
subsequent figures.
We see in Fig. 5.3 that our small-y approximation matches the simulations very
well for yin < 1 and our classical formula (5.3.3), which is displayed with the black
dashed line in the right hand panel, matches the simulation very well for yin 1, so
both limits here are well understood.
5.5.2 Implications for primordial black holes
In the stochastic (small-y) limit, we have expanded to find the characteristic function,
and our goal now is to find the PDF associated to this characteristic function. Following
[280], we now want to find the poles of χN , given as Λn = it, so that we can expand
χN as
χN =∑
n
an(x)
Λn − it+ g(t, x) , (5.5.8)
where g(t, x) is some regular function, and an(x) is the residual associated to Λn which
can be found via
an(x) = −i[∂
∂tχ−1N (t = −iΛn, x, y)
]−1
. (5.5.9)
190

0.0 0.2 0.4 0.6 0.8 1.0yin
0.0
0.2
0.4
0.6
0.8
1.0〈N〉
small velocity appr.
stochastic sampling
10−2 10−1 100 101 102
yin
0.0
0.1
0.2
0.3
0.4
0.5
0.6
〈N〉
small velocity appr.
class appr.
stochastic sampling
Figure 5.3. The mean number of e-folds is plotted as a function of the initial veloicty yin,for µ = 1. The solid black curves are the small-y approximation (5.5.7), the dashed blackcurve corresponds to the classical result (5.3.3), and the blue bars are reconstructed from alarge number of realisations of the Langevin equations (5.1.9). The size of the bars is the 2σestimate for the statistical error, which are found using a jackknife procedure explained inthe main text. In the right hand plot we see that the transition between the two differentlimiting cases that we have considered happens at around yin = 1, as we expect.
After doing this expansion, it will then be simple to find the PDF, which is given by
P (N ) =∑
n
an(x)e−ΛnN . (5.5.10)
Both terms in χN (i.e. in Eq. (5.5.1)) have the term cosh(α√t µ)
in their denominator,
which has associated poles at
cosh(α√t µ)
= cos(iα√t µ)
= cos(√
it µ)
= 0 , (5.5.11)
i.e. when
it =π2
µ2
(n+
1
2
)2
≡ Λ(1)n . (5.5.12)
191

The corresponding residual is then given by
a(1)n =
π
µ2
(n+
1
2
)2 sin
[π
(n+
1
2
)x
]− π(2n+ 1)y cos
[π
(n+
1
2
)x
]
+(−1)n 2π2
(n+ 1
2
)2y
µ2
√3µ2 − π2
(n+ 1
2
)2cosh
[µ
√3− π2(n+ 1
2)2
µ2
]
×
(−1)n
√3µ2 − π2(
(n+
1
2
)2
cosh
µ(x− 1)
√
3− π2(n+ 1
2
)2
µ2
−π(n+
1
2
)sinh
µx
√
3− π2(n+ 1
2
)2
µ2
.
(5.5.13)
The NLO term f(x, y) also features the term cosh(√
3− it µ) in its denominator, which
has a pole at
it = 3 +π2
µ2
(n+
1
2
)2
≡ Λ(2)n = Λ(1)
n + 3 , (5.5.14)
with associated residue
a(2)n =
2(−1)ny
µ2
sin[(n+ 1
2
)πx]
cos
[√3µ2 + π2
(n+ 1
2
)2]−3µ2 − π2
(n+
1
2
)2
+π(−1)n(n+
1
2
)√3µ2 + π2
(n+
1
2
)2
sin
√
3µ2 + π2
(n+
1
2
)2 .
(5.5.15)
Then the PDF is given by
P (N ;x, y) =∑
i=1,2
∞∑
n=0
a(i)n (x, y)e−Λ
(i)n N =
∞∑
n=0
[a(1)n + a(2)
n e−3N ] e−Λ(1)n N , (5.5.16)
where each of these terms is given above.
Note that the presence of the classical velocity does not change the location
of the poles that are present at leading order in this calculation, but rather adds a
second set of poles. This new set of poles do not contribute at leading order since
192

0.0 0.5 1.0 1.5 2.0
N0.0
0.5
1.0
1.5
2.0
2.5
3.0P
small velocity appr.yin = 0
yin = 0.1
yin = 0.3
yin = 0.5
0.0 0.5 1.0 1.5 2.0 2.5 3.0
N10−4
10−3
10−2
10−1
100
P
small velocity appr.yin = 0
yin = 0.3
yin = 0.5
Figure 5.4. The probability distribution P of the number of e-folds N for several differentvalues of the initial velocity yin. In the left panel we use a linear scale of the vertical axis,and in the right panel we use a logarithmic axis (the value yin = 0.1 is not shown in the rightpanel for display convenience), and in both plots we take the value µ = 1. The black curvescorrespond to the small-y expression (5.5.16), which for yin = 0 is equivalent to the slow-rollsolution (5.4.2), while the error bars are reconstructed from a large number of realisationsof the Langevin equations (5.1.9), with Gaussian kernel density of width N = 0.005. Thesize of the bars is the 2σ estimate for the statistical error, which are found using a jackknifeprocedure explained in the main text. We see that our analytic approximation provide a verygood fit to the simulations for all values of yin taken.
their associated residuals vanish when y = 0, and so their contribution to (5.5.16)
vanishes. As such, a classical velocity does not change the decay rate of the PDF,
and only provides a small correction to the amplitude of the PDF (as the residuals
are suppressed by the factor of e−3N ). Our formula (5.5.16) is compared to numerical
simulations of the USR Langevin equation in Fig. 5.4, where we can see that it provides
a very good fit of the PDF, even for reasonably large values of yin. On the tail of the
distribution we see that the error bars become larger, and this is because realisations
that experience the larger numbers of e-folds of inflation become rarer, and hence the
statistics are based on a fewer numbers of trajectories. However, we still see that the
decay rate of the tail of the distribution is still independent of the initial velocity yin.
193

0.0 0.2 0.4 0.6 0.8 1.0yin
0.000
0.005
0.010
0.015
0.020
0.025
0.030
0.035
0.040β
small velocity appr.
stochastic sampling
10−2 10−1 100 101
yin
10−6
10−5
10−4
10−3
10−2
10−1
100
β
small velocity appr.
stochastic sampling
Figure 5.5. The PBH mass fraction β in a flat potential is plotted as a function of the initalvelocity yin, for µ = 1. The black curves are the small-y approximation (5.5.17), while theblue bars are reconstructed from a large number of numerical simulations of the Langevinequations (5.1.9). The size of the bars is the 2σ estimate for the statistical error, estimatedusing a jackknife procedure.
From here, we can calculate the mass fraction β of primordial black holes using
Eq. (1.5.1), and here it is found to be
β =∑
i=1,2
∞∑
n=0
1
Λ(i)n
a(i)n (x, y)e−Λ
(i)n [〈N〉(x)+ζc]
=∞∑
n=0
[a
(1)n
Λ(1)n
+a
(2)n
Λ(1)n + 3
e−3[〈N〉(x)+ζc]
]e−Λ
(1)n [〈N〉(x)+ζc] .
(5.5.17)
This expression is compared to the results of numerical realisations of our USR
Langvin equations (5.1.9) in Fig. 5.5. In practice, for the numerical realisations, we
take a conservative value for the critical value of the curvature perturbation ζc = 1, and
then to obtain β we take the number of realisations that produce more e-folds than the
mean value plus ζc and divide this by the total number of realisations. When β becomes
very small we must compute a very large number of realisations in order to avoid being
dominated by statistical noise (in practice we must produce many more realisations
than 1/β), and hence this becomes very numerically expensive and we therefore do not
194

calculate values of β smaller than ∼ 10−6. In our numerical simulations, for yin > 6
we produced 107 realisations and exactly none of these experienced more than 〈N〉+ 1
e-folds of inflation, and hence we can only place an upper bound of ∼ 10−7 for these
values of the initial velocity.
5.6 Discussion
We have seen that in USR inflation we can find the PDF of curvature fluctuations by
solving for the characteristic function from Eq. (5.2.8), along with initial conditions
(5.2.9), and then perform an inverse Fourier transform to find the PDF. In turn,
through (1.5.1), this tells us how much of the Universe is contained in PBHs at the
time of their formation. However, solving this system with the given initial conditions
is not possible in general, and so we inform our study by considering limiting cases of
this system.
In the classical limit, i.e. when the classical velocity dominates over the stochas-
tic diffusion, the system becomes solvable in an iterative way, to as high an order
as one requires. In the opposite limit, when the stochastic term dominates, we have
performed an expansion in the small classical velocity and found the NLO solution in
this limit. In this case, both the PDF and the PBH mass fraction can be compared to
numerical simulations, and we see consistent results.
This work demonstrates that we have a good understanding of these two limiting
cases for USR inflation, but the question of which of these limits is physically relevant,
or if both can be realised in practice, remains. If we consider the Starobinsky model
of inflation, see for example Sec. 2.4.1, then the initial velocity in the USR phase is
given by the slow-roll attractor that proceeds it. On the other hand, as we have seen in
Sec. 2.4.2, for a cubic inflection point model a transition from slow roll into ultra-slow
roll actually ends inflation, and hence an inflating USR regime must start in USR.
This means that we can, a priori, give the inflaton any initial velocity that we want
195

(provided it is less than the limit given by (5.1.14)), and hence both of the limits we
have considered may be applicable. We leave further study of these specific examples
for future work.
In the next, and final, chapter, we present a brief summary of the work in this
thesis, as well as outlining some directions of future work which build on these results.
196
Chapter 6
Conclusions
6.1 Summary
In this thesis, we have covered several aspects of cosmological inflation. We began
by introducing the necessary background cosmology, including the FLRW Universe
and the Hot Big Bang model of the Universe. We explained how an early period
of accelerated expansion of the Universe can solve the classical problems of this Big
Bang model, and introduced the slow-roll approximations of inflation, which are both
simplifying of the dynamics and physically motivated. We then showed how large
curvature fluctuations during inflation can later collapse into dense objects, such as
primordial black holes, once inflation has ended. This is interesting because we saw
that primordial black holes might solve several open problems that persist in modern
cosmology, including the nature of dark matter and the origin of supermassive black
holes at high (z ∼ 7) redshifts. We also showed that in situations where a significant
number of primordial black holes can be produced, the usual slow-roll approximations
break down, and we may enter a phase so ultra-slow-roll inflation.
In Chapter 2 we performed a stability analysis of ultra-slow-roll inflation, since
it is often stated in the literature that this regime is always unstable and short-lived.
We performed this analysis in terms of the dimensionless field acceleration parameter,
197

f = 1 − δ in Eq. (2.2.1), that quantifies the acceleration of the inflaton field relative
to the Hubble friction term in the Klein-Gordon equation. We saw that ultra-slow-roll
inflation is stable (d|δ|/dt < 0) for a scalar field rolling down a convex potential (V < 0
and V,φφ > 0) if the condition
MPl
d2V
dφ2>
∣∣∣∣dV
dφ
∣∣∣∣ (6.1.1)
is satisfied.
We then compared our analytical results against numerical examples. For the
Starobinsky model (2.4.1) where the potential is made of two linear pieces, the con-
dition (2.5.1) is never fulfilled, since V,φφ = 0, and ultra-slow-roll inflation is never
stable. It lasts for a number of e-folds of order one. We also analysed the case of
a potential (2.4.6) with a flat inflection point at φ = 0, V ∝ 1 + (φ/φ0)3, where we
found that ultra-slow roll is stable in the range 0 < φ < MPl, i.e. when approaching
the inflection point. When φ0 MPl the ultra-slow-roll regime is always short lived,
but when φ0 MPl it can last for a large number of e-folds. In fact, if one considers
for instance a potential of the form V ∝ 1 + αeβφ/MPl , with αβ 1 and β 1, there
is even an infinite phase of classical ultra-slow roll for φ < 0.
However, this was a purely classical analysis and we expect a very flat potential
to require a complete stochastic treatment to be fully understood. This stochastic
formalism was introduced in Chapter 3, and we discussed the requirements for this
formalism to be valid. These requirements are well-known to be satisfied in slow-roll
inflation, but had not previously been explored beyond the slow-roll regime. This
motivated us to explicitly check these conditions in Chapter 3.
One of the key assumptions made by the stochastic formalism for non-test fields
is the separate universe approach, which pictures the universe on super-Hubble scales
as causally disconnected regions that evolve under local FLRW dynamics. While the
separate universe approach is known to be valid within slow roll, its status once slow
roll is violated was not so clear. By showing that the dynamics of super-Hubble fluc-
198

tuations can be recovered by perturbing the background FLRW equations of motion,
we demonstrated that this approach is in fact valid and does not require slow roll.
Subtleties also arise regarding the gauge in which the stochastic equations are
written. The time variable that is usually used in the Langevin equation is the loga-
rithmic expansion, i.e. the number of e-folds N , and this variable is left unperturbed,
which means we are implicitly working in a gauge in which the expansion is uniform.
However, the field fluctuations, which determine the correlations of the noises, are usu-
ally quantised in the spatially-flat gauge, where they coincide with the gauge-invariant
Sasaki–Mukhanov scalar field perturbations, Q. We therefore have to perform a gauge
transformation from the spatially-flat to the uniform-N gauge before evaluating the
stochastic noise due to quantum field fluctuations. We calculated this transformation
and showed that it is proportional to the non-adiabatic pressure perturbation. Since
this vanishes on large scales in the presence of a dynamical attractor, such as in slow
roll, the gauge transformation becomes trivial in that case (i.e. the two gauges coincide
on super-Hubble scales). We also examined the case of ultra-slow roll, where we found
that the gauge transformation is also trivial, despite the fact that ultra-slow roll in
this case is not a dynamical attractor in phase space. Finally, we studied the (lin-
ear piece-wise) Starobinsky model, where the dynamics interpolates between a phase
of ultra-slow-roll and slow-roll inflation, and found that the same conclusions apply.
Thus, in all three cases, the gauge transformation that is required prior to evaluating
the noise correlators in stochastic inflation turns out to be trivial on super-Hubble
scales, and stochastic inflation as usually formulated can be applied without further
refinements.
In order to consider the formation of primordial black holes, we require the full
probability distribution of curvature perturbations, and this can be found using the
stochastic-δN formalism. We described how the first few moments of this distribution
can be calculated in an iterative manner, but further work was required to calculate
the full distribution, including the tail, accurately. In Chapter 4, we introduced a
199
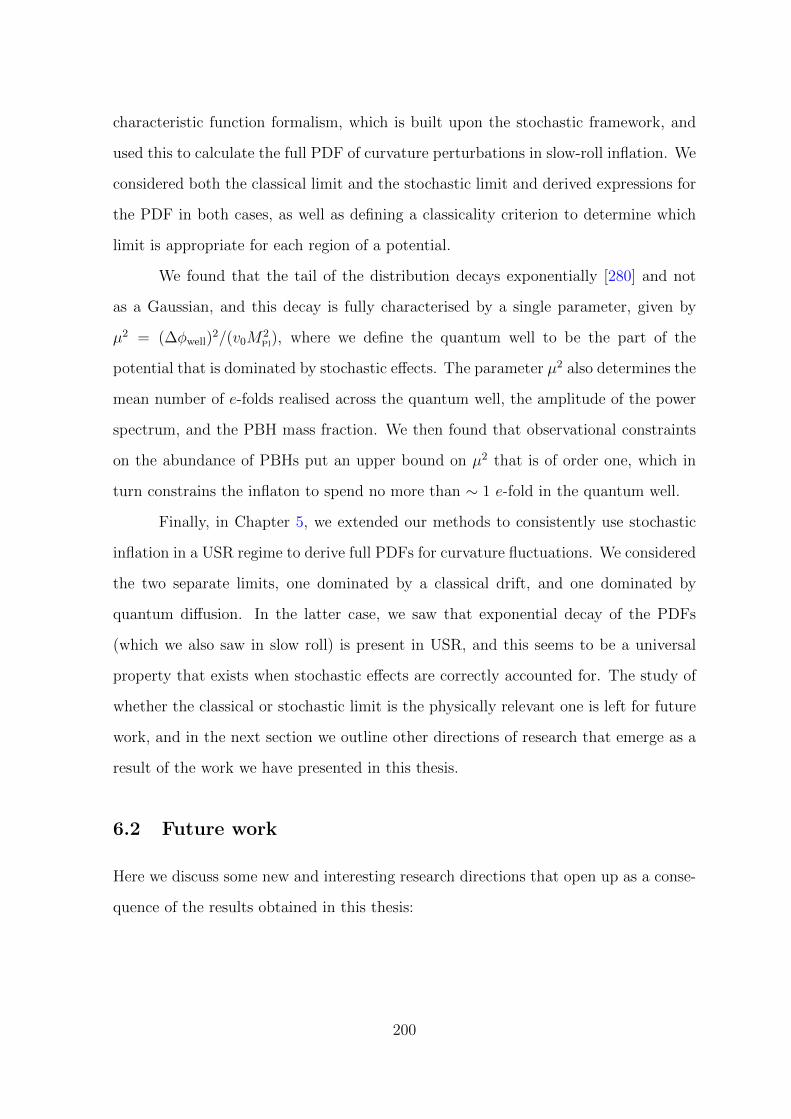
characteristic function formalism, which is built upon the stochastic framework, and
used this to calculate the full PDF of curvature perturbations in slow-roll inflation. We
considered both the classical limit and the stochastic limit and derived expressions for
the PDF in both cases, as well as defining a classicality criterion to determine which
limit is appropriate for each region of a potential.
We found that the tail of the distribution decays exponentially [280] and not
as a Gaussian, and this decay is fully characterised by a single parameter, given by
µ2 = (∆φwell)2/(v0M
2Pl), where we define the quantum well to be the part of the
potential that is dominated by stochastic effects. The parameter µ2 also determines the
mean number of e-folds realised across the quantum well, the amplitude of the power
spectrum, and the PBH mass fraction. We then found that observational constraints
on the abundance of PBHs put an upper bound on µ2 that is of order one, which in
turn constrains the inflaton to spend no more than ∼ 1 e-fold in the quantum well.
Finally, in Chapter 5, we extended our methods to consistently use stochastic
inflation in a USR regime to derive full PDFs for curvature fluctuations. We considered
the two separate limits, one dominated by a classical drift, and one dominated by
quantum diffusion. In the latter case, we saw that exponential decay of the PDFs
(which we also saw in slow roll) is present in USR, and this seems to be a universal
property that exists when stochastic effects are correctly accounted for. The study of
whether the classical or stochastic limit is the physically relevant one is left for future
work, and in the next section we outline other directions of research that emerge as a
result of the work we have presented in this thesis.
6.2 Future work
Here we discuss some new and interesting research directions that open up as a conse-
quence of the results obtained in this thesis:
200

First, in slow roll, we have shown that the effects of quantum diffusion on the
PDF of curvature perturbations and on the mass fraction of PBHs can be dramatic in
regions of the potential where the classical approximation breaks down. This implies
that some of the constraints on inflationary models derived in the literature, from
non-observations of PBHs and using only the classical approximation, may have to be
revised. This could have important consequences for these models.
Next, it has been shown [247, 248] that in the presence of multiple fields, the
effects of quantum diffusion can be even more drastic. Formation of PBHs in multi-
field models of inflation, such as hybrid inflation [203, 246, 281–283], would therefore
be interesting to study with the stochastic techniques developed in this thesis.
There are also other astrophysical objects for which the knowledge of the full
probability distribution of cosmological perturbations produced during inflation is im-
portant, such as ultra-compact mini-halos [284]. Using our results to calculate the
abundance of such objects is another interesting prospect.
Warm inflation [285–287] is a phenomenological model of the early universe that
describes the decay of the inflaton into the standard model particles during inflation,
rather than during a separate reheating phase after inflation. The decay of the inflaton
is described as a thermal dissipation, which can be studied using standard stochastic
techniques (see, for example, Ref. [288]). It would therefore be interesting to apply our
new stochastic methods to study quantum diffusion in warm inflation, both in slow roll
and USR, and also to consider the effects of the thermal dissipation on the production
of curvature perturbations, and hence on the formation of PBHs.
One can also incorporate stochastic effects in collapsing models of the universe
(see, eg, [289]), and the conditions we explained in Chapter 3 also need to be tested
in such a scenario. This has not been explored before and it would therefore also
be interesting to explicitly test the validity of the stochastic formalism in collapsing
models.
201

Finally, as discussed in Chapter 5 and mentioned above, it is important to apply
the USR stochastic formalism that we have developed to realistic models that lead to
PBH production, such as [176, 236]. This will be interesting to see the effects of
stochastic USR inflation on the formation of PBHs, although we expect it to greatly
increase the formation rate of these rare objects, similarly to the slow-roll case, and
limit the length of time the inflaton can spend on a flat potential without violating
observational constraints.
We can see there are still many exciting areas to explore regarding perturbations
from inflation, the stochastic formalism, and primordial black holes. We have made
substantial progress understanding curvature fluctuations using the non-perturbative
techniques of the stochastic-δN formalism, as well as extending our understanding of
stochastic inflation and the formation of primordial black holes when quantum effects
are fully accounted for. We have opened up many exciting areas to continue to research
in the future.
202

Appendix A
FLRW Christoffel symbols and
Einstein tensor
Recall the the FLRW metric, given in (1.1.1), is
ds2 = gµνdxµdxν = −dt2 + a2(t)
[dr2
1−Kr2+ r2dθ2 + r2 sin2 θdφ2
]. (A.0.1)
In order to define the Ricci tensor of this metric we must first define the Christoffel
symbols to be
Γλµν =1
2gλσ (∂νgσµ + ∂µgσν − ∂σgµν) , (A.0.2)
which are symmetric in their lower indices, so Γλµν = Γλνµ. Plugging in the metric
components from (A.0.1) we find the non-vanishing Christoffel symbols for the FLRW
203

metric to be
Γ011 =
aa
1−Kr2; Γ0
22 = aar2; Γ033 = aar2 sin2 θ
Γ110 = Γ1
01 =a
a; Γ1
11 =Kr
1−Kr2; Γ1
22 = −r(1−Kr2); Γ133 = −r(1−Kr2) sin2 θ;
Γ220 = Γ2
02 =a
a; Γ2
21 = Γ212 =
1
r; Γ2
33 = − sin θ cos θ;
Γ330 = Γ3
03 =a
a; Γ3
31 = Γ313 =
1
r; Γ3
32 = Γ323 = cot θ ,
(A.0.3)
where the indices denote the coordinates through (0, 1, 2, 3) = (t, r, θ, φ). The Ricci
tensor is then defined in terms of Christoffel symbols as
Rµν = ∂λΓλµν − ∂νΓλµλ + ΓρµνΓ
λρλ − ΓρµλΓ
λρν , (A.0.4)
and in the FLRW metric the non-zero components can be computed to be
R00 = −3a
a,
R11 =(aa+ 2a2 + 2k)
1−Kr2,
R22 =(aa+ 2a2 + 2K
)r2 ,
R33 =(aa+ 2a2 + 2K
)r2 sin2 θ .
(A.0.5)
We can also compute the Ricci scalar R = gµνRµν = Rµν to be
R = −6
(a
a+
(a
a
)2
+K
a2
). (A.0.6)
204

Finally, let us explicitly give the non-zero components for the Einstein tensor Gµν =
Rµν − (R/2)gµν , which are found to be
G00 = 3
[(a
a
)2
+K
a2
],
G11 = −[(
a
a
)2
+2a
a+K
a2
]a2
1−Kr2,
G22 = −[(
a
a
)2
+2a
a+K
a2
]a2r2 ,
G33 = −[(
a
a
)2
+2a
a+K
a2
]a2r2 sin2 θ .
(A.0.7)
205

Appendix B
Sasaki–Mukhanov equation
In this appendix, we derive the general expression (1.3.48) for z′′/z in the Sasaki–
Mukhanov equation and discuss both the slow-roll and the ultra-slow-roll limits.
Deriving the general expression
We start with the Sasaki–Mukhanov variable
vk = zζk , (B.0.1)
where
z = a√
2ε1 MPl , (B.0.2)
and vk obeys the Sasaki–Mukhanov equation
v′′k +
(k2 − z′′
z
)vk = 0 . (B.0.3)
Note that in the spatially flat gauge, we have vk = aδφk = aQk. Let us also reiterate
the notation we use here: ˙ = ddt
(t is proper time) and ′ = ddη
(η is conformal time), so
ddη
= a ddt
. Combining
ε1 = − H
H2= 1− H
′
H2(B.0.4)
206

with the Friedmann equation (2.1.2), one obtains ε1 = φ2/(2M2PlH
2), and z can be
rewritten as
z =aφ
H. (B.0.5)
This allows us to calculate
z′
z=a
zz = a
(a
a+φ
φ− H
H
). (B.0.6)
In terms of the slow-roll parameter ε1 and the relative acceleration parameter f defined
in Eq. (2.2.1), this reads
z′
z= aH (1− 3f + ε1) . (B.0.7)
In order to calculate z′′/z, notice that
(z′
z
)′=z′′
z− z′2
z2, (B.0.8)
where the left-hand side can be derived from Eq. (B.0.7),
(z′
z
)′= a
d
dt
(z′
z
)= a2H (1− 3f + ε1)
(a
a+H
H+
ε1 − 3f
1− 3f + ε1
). (B.0.9)
Derivating ε1 = φ2/(2M2PlH
2) with respect to time, and making use of the Klein–
Gordon equation (1.3.10), we have
ε1 = 2Hε1 (ε1 − 3f) , (B.0.10)
and from Eq. (2.2.1) we can calculate
f
H= µ+ (f − 1) (ε1 + 3f) . (B.0.11)
207

where the dimensionless mass parameter µ is defined in Eq. (1.3.47). Thus we can
evaluate Eq. (B.0.9) as
(z′
z
)′= a2H2
(1 + 6f + 3ε1 − 3µ+ ε21 − 9f 2 − 6fε1
). (B.0.12)
Combining this with Eqs. (B.0.7) and (B.0.8), we find
z′′
z= a2H2
(2 + 5ε1 − 3µ− 12fε1 + 2ε21
), (B.0.13)
which is an exact expression that makes no approximations.
Slow-roll limit
In the slow-roll regime,
ε1 ' εV1 ≡M2
Pl
2
(V,φV
)2
, (B.0.14)
ε2 ' εV2 ≡ 2M2Pl
[(V,φV
)2
− V,φφV
], (B.0.15)
H2 ' V
3M2Pl
, (B.0.16)
and hence
µ 'M2Pl
V,φφV
(B.0.17)
ε2 ' 4ε1 − 2µ . (B.0.18)
At leading order in the slow-roll parameters, we therefore see that (B.0.13) reduces to
z′′
z' a2H2
[2− ε1 +
3
2ε2 +O
(ε2)]
, (B.0.19)
208

where we note that, since f = 2ε1−ε26
[180], terms of order O(fε1) are neglected at first
order. In order to write (B.0.13) as an explicit function of conformal time, note that
η =
∫dt
a=
∫da
a2H(a)= − 1
aH+
∫ε1da
a2H, (B.0.20)
where we have integrated by parts to get the last equality. From Eq. (B.0.10), we have
ε1ε1
= 2H (ε1 − 3f) , (B.0.21)
and thus we can again integrate by parts to find
∫ε1da
a2H= − ε1
aH+
∫da
a2H
ε1ε1
ε1H
+O(ε21)
= − ε1aH
+O(ε21, fε1
). (B.0.22)
Therefore, from Eq. (B.0.20),
η ' − 1
aH(1 + ε1) (B.0.23)
at first order in slow roll, and Eq. (B.0.13) becomes
z′′
z' 2
η2
(1 +
3
2ε1 +
3
4ε2
), (B.0.24)
as announced in the main text.
Near ultra-slow-roll limit
In the ultra-slow-roll regime, the field acceleration parameter is close to one and it is
convenient to parameterise
f = 1− δ , (B.0.25)
where |δ| 1. In terms of δ, Eq. (B.0.13) becomes
z′′
z= a2H2
(2− 7ε1 + 2ε21 + 12δε1 − 3µ
). (B.0.26)
209

In order to derive an explicit expression in terms of the conformal η using Eq. (B.0.20),
we note from Eq. (B.0.10) that we have
ε1ε1
= 2H (ε1 − 3f) = −6H(
1− δ − ε13
). (B.0.27)
This allows us to again integrate by parts in Eq. (B.0.20) and find
∫ε1da
a2H= −1
7
ε1aH
+O(ε1δ, ε
21
), (B.0.28)
and hence
η = − 1
aH
(1 +
1
7ε1
)+O
(ε1δ, ε
21
). (B.0.29)
Thus, in ultra-slow roll, Eq. (B.0.13) becomes
z′′
z=
1
η2
[2− 3µ− 3
7ε1 (15 + 2µ)
]+O
(ε1δ, ε
21
). (B.0.30)
If the effective mass parameter µ is small, the leading-order behaviour is the same as
in conventional slow roll, but it differs if µ is of order one or larger.
210

Appendix C
First slow-roll correction in
ultra-slow roll
In this section, we solve Eq. (3.3.36) perturbatively in ε1∗, in order to check that the
leading-order solutions given in Sec. 3.3.4 are indeed consistent. We still consider the
case of an exactly flat potential, so that δ = µ = 0, and Eq. (B.0.30) reads
z′′
z=
1
η2
(2− 45
7ε1
)=
1
η2
[2− 45
7ε1∗
(η
η∗
)6]. (C.0.1)
At first order in ε1∗, the comoving Hubble parameter is given by Eq. (B.0.29), namely
H = −1
η
[1 +
1
7ε1 +O(ε21)
]. (C.0.2)
Unlike the slow-roll case, this cannot be integrated to find a(η), but we can instead
perform an expansion in powers of ε1∗ to find
a(η) = − 1
H∗η
[1− 1
42(ε1 − ε1∗) +O(ε21)
]. (C.0.3)
In order to solve Eq. (3.3.36) perturbatively, we first note that the leading order
solution is simply the ν = 32
solution already given in Eq. (3.3.51). To find the first
211

correction to this, we introduce
vk =e−ikη√
2k
(1− i
kη
)[1 + ε1∗fk(η)] , (C.0.4)
for some function fk(η). If we substitute Eq. (C.0.4) back into Eq. (3.3.36) and solve
the resultant differential equation for f(η), we find that
f ′k(η) = −45
28
1
k3
η2
η6∗
e2ikη
(kη − i)2
[e−2ikη
(7i− 14kη − 14ik2η2 + 8k3η3 + 2ik4η4
)
−e−2ikηstart(7i− 14kηstart − 14ik2η2
start + 8k3η3start + 2ik4η4
start
)],
(C.0.5)
where the integration constant ηstart must be chosen such that
ε1start = ε1∗
(ηstart
η∗
)6
< 1 . (C.0.6)
Combining Eqs. (C.0.3) and (C.0.4) at leading order in ε1∗, recalling that vk = aQk,
we can then calculate
Q′kQk
= − ikη
η − ik
+ ε1∗
[1
7η
(η
η∗
)6
− f ′k
], (C.0.7)
where f ′k is given by Eq. (C.0.5). Note that at leading order in ε1∗, this reduces to
Eq. (3.3.52), as expected. We also see that the source function (3.3.34) becomes
Sk = −√ε12
QkMPl
3
η− ikη
η − ik
− ε1∗[
3
7η
(η
η∗
)6
− f ′k
]+O(ε21∗)
. (C.0.8)
This implies that
Qk = − H∗√2k
e−ikη[η − i
k+O(ε1∗)
]
Sk = −√ε1∗2
Q
MPl
(η
η∗
)3 [3
η− ikη
η − ik
+O(ε1∗)
].
(C.0.9)
212

Making use of Eq. (3.3.35), we thus find
αk ' −iH∗√ε1∗
6MPl
k−52 (kη)4 [1 +O(ε1∗)] , (C.0.10)
of which Eq. (3.3.54) indeed captures the leading order. The situation is therefore
different than in slow roll where the leading order result vanishes and the dominant
contribution comes from the decaying mode. This is because, as stressed above, the
presence of a dynamical attractor in slow roll makes the non-adiabatic pressure per-
turbation vanish, which is not the case in ultra-slow roll.
213

Appendix D
Elliptic theta functions
In Sec. 4.4, the PDF of coarse-grained curvature perturbations is expressed in terms
of elliptic theta functions. In this appendix, we define these special functions and give
some of their properties that are relevant for the considerations of Sec. 4.4. There are
four elliptic theta functions, defined as [261, 262]
ϑ1 (z, q) = 2∞∑
n=0
(−1)nq(n+ 12)
2
sin [(2n+ 1) z] ,
ϑ2 (z, q) = 2∞∑
n=0
q(n+ 12)
2
cos [(2n+ 1) z] ,
ϑ3 (z, q) = 1 + 2∞∑
n=1
qn2
cos (2nz) ,
ϑ4 (z, q) = 1 + 2∞∑
n=1
(−1)nqn2
cos (2nz) .
(D.0.1)
By convention, ϑ′i denotes the derivative of ϑi with respect to its first argument z. For
instance, one has
ϑ′1 (z, q) = 2∞∑
n=0
(−1)nq(n+ 12)
2
(2n+ 1) cos [(2n+ 1) z] , (D.0.2)
214

which appears in Eq. (4.4.4). As another example, one has
ϑ′′4 (z, q) = −8∞∑
n=1
(−1)nqn2
n2 cos (2nz) , (D.0.3)
which is used in Eq. (4.4.5). As a third example, one has
ϑ′2 (z, q) = −2∞∑
n=0
q(n+ 12)
2
(2n+ 1) sin [(2n+ 1) z] , (D.0.4)
which appears in Eq. (4.4.12). As a last example, one has
ϑ′′2 (z, q) = −2∞∑
n=0
q(n+ 12)
2
(2n+ 1)2 cos [(2n+ 1) z] , (D.0.5)
which is used in Eq. (4.4.13). The function ϑi(z, q) is noted EllipticTheta[i,z,q]
in Mathematica and ϑ′i(z, q) is noted EllipticThetaPrime[i,z,q].
Let us now show that the different expressions for P (N , φ = φend + ∆φwell) ob-
tained in Sec. 4.4 in the stochastic dominated regime are equivalent. A first expression
is given by Eq. (4.4.4), a second expression can be derived by plugging x = 1 into
Eq. (4.4.11) and making use of Eq. (D.0.2), and a third expression is given by plugging
x = 1 in Eq. (4.4.12). The three formulae are equivalent if
(µ√πN
)3
ϑ′1
(0, e−
µ2
N
)= ϑ′1
(0, e−π2µ2N)
= −ϑ′2(π
2, e−π2µ2N). (D.0.6)
The first equality in Eq. (D.0.6) can be shown from the Jacobi identity for a modular
transformation of the first elliptic theta function, see Eq. (20.7.30) of Ref. [290],
(−iτ)12 ϑ1
(z, eiπτ
)= −ie− z
2
πτ ϑ1
(−zτ,−e− iπτ
). (D.0.7)
215

By taking τ = i/(aπ) and differentiating Eq. (D.0.7) with respect to z, one obtains
(πa)12 ϑ′1
(z, e−
1a
)= −2iz
aeaz
2
ϑ1
(−iπaz, e−π2a
)+ aπeaz
2
ϑ′1
(−iπaz, e−π2a
). (D.0.8)
Taking z = 0, one recovers the first equality in Eq. (D.0.6). The second equality in
Eq. (D.0.6) simply follows from Eqs. (D.0.2) and (D.0.4).
216

Appendix E
Detailed analysis of the model
V ∝ 1 + φp
In this appendix, we present a detailed analysis of the model discussed in Sec. 4.5.4,
where the inflationary potential is of the form
v(φ) = v0
[1 +
(φ
φ0
)p]. (E.0.1)
In order to use the slow-roll approximation, one needs to check that the slow-roll
conditions [291], M2Pl(v
′/v)2 1, M2Pl|v′′/v| 1, and M4
Pl|v′′′v′/v2| 1, are satisfied.
Here, we use the three first slow-roll conditions only, since these are the only ones
currently constrained by observations. In order to satisfy the third condition, one
requires a condition involving the position of φ with respect to
φsr1 ≡ φ0
(φ0
MPl
) 2p−2
, (E.0.2)
i.e. φ φsr1 if p > 2 and φ φsr1 if p < 2. The second slow-roll condition reduces to
an equivalent condition. If p = 1, there is no such condition and if p = 2, it reduces to
217

φ0 MPl. The first condition constrains the position of φ with respect to
φsr2 ≡ φ0
(φ0
MPl
) 1p−1
, (E.0.3)
namely φ φsr2 if p > 1 and φ φsr2 if p < 1 (if p = 1, it reduces to φ0 MPl).
As explained in Sec. 4.5.4, quantum diffusion plays an important role when
ηclass 1, where ηclass is given in Eq. (4.5.9), which leads to φ ∆φwell, where
∆φwell = φ0v1p
0 , (E.0.4)
see Eq. (4.5.11). Hereafter, we work in the vacuum-dominated regime, in which φ φ0
and v ' v0. Making use of Eq. (4.5.6), this gives rise to
µ2 =
(φ0
MPl
)2
v2p−1
0 . (E.0.5)
In the classical regime, i.e. when φ ∆φwell, the power spectrum is given by
Eq. (1.5.5), which gives rise to
Pζ |cl =2v0
p2
(φ0
MPl
)2(φ0
φ
)2p−2
. (E.0.6)
Thus we see that the classical power spectrum is larger than unity when φ < φPζ |cl>1
if p > 1, and φ > φPζ |cl>1 if p < 1, where
φPζ |cl>1 = φ0
[2v0
p2
(φ0
MPl
)2] 1
2p−2
. (E.0.7)
The number of e-folds realised between φ and φend can also be calculated in the classical
regime using Eq. (1.5.5), and one obtains
Nend −N 'φ2
0
p(p− 2)M2Pl
[(φ0
φend
)p−2
−(φ0
φ
)p−2]. (E.0.8)
218

Note that this expression is singular for p = 2, and this case is treated separately
in Sec. E.1. Combining Eqs. (E.0.7) and (E.0.8), one can rewrite the classical power
spectrum as
Pζ |cl =2v0
p2
(φ0
MPl
)2[p(2− p)M2
Pl
φ20
(Nend −N) +
(φ0
φend
)p−2] 2p−2
p−2
. (E.0.9)
In the stochastic regime, i.e. when φ ∆φwell, the mean number of e-folds can
be computed from Eq. (4.2.4) for f1. In the limit φuv → ∞, and taking φ ∆φwell,
one obtains
〈N〉 = Γ
(1
p
)φ0
pM2Plv
1− 1p
0
(φ− φend) . (E.0.10)
Similarly, using Eq. (4.2.4) for f2, and the formula Pζ = f ′2/f′1− 2f1 from Eq. (3.4.14),
the power spectrum is given by
Pζ(φ) =2
p2Γ2
(1
p
)v
2p−1
0
(φ0
MPl
)2
. (E.0.11)
E.1 Case p = 2
We first consider the case of p = 2, where the slow-roll conditions reduce to φ0 MPl.
Let us also note that Eq. (E.0.8) is singular for p = 2, and that it should be replaced
by
Nend −N 'φ2
0
2M2Pl
ln
(φ
φend
). (E.1.1)
As noted in Sec. 4.5.4, the constant value found for the power spectrum in the stochas-
tic limit, Eq. (E.0.11), corresponds (up to an order one prefactor) to the classical
power spectrum (E.0.9) evaluated at ∆φwell. Therefore, when φ decreases, the stochas-
tic and the classical result coincide until φ becomes smaller than ∆φwell, where the
stochastic power spectrum saturates to a constant value and the classical power spec-
trum continues to increase. Since the slow-roll condition implies that φ0 MPl, the
219

power spectrum is always larger than one in this regime. This can be also seen from
φPζ |cl>1 < ∆φwell, as can be checked explicitly from Eqs. (E.0.4) and (E.0.7).
Furthermore, the number of e-folds (E.0.10) spent in the stochastic regime is of
order 〈N〉 =√π /2(φ0/MPl)
2, which is larger than unity. It is interesting to note that
both the amplitude of the power spectrum and the number of e-folds during which the
stochastic regime depend only on φ0. PBHs are therefore overproduced in this case.
E.2 Case p > 2
We now consider values of p such that p > 2. In this case, the slow-roll condition
that is the strictest depends on whether φ0 is sub-Planckian or super-Planckian. More
precisely, since 2/(p− 2) > 1/(p− 1) for p > 2, if φ0 < MPl, then φsr1 < φsr2 and the
slow-roll condition is given by φ φsr1, and if φ0 > MPl then φsr2 < φsr1 and it is given
by φ φsr2.
E.2.1 Case p > 2 and φ0 > MPl
In this case, the slow-roll condition reads φ φsr2. Making use of Eqs. (E.0.3), (E.0.4)
and (E.0.7), one can show that
∆φwell < φPζ |cl>1 < φsr2 . (E.2.1)
As a consequence, when stochastic effects become important, the classical power spec-
trum is already larger than one and so quantum diffusion cannot “rescue” the model
in this case. Stochastic effects do reduce the amount of power, but not soon enough
to keep the amount of PBH below the observationally constrained level.
E.2.2 Case p > 2 and φ0 < MPl
In this case, the slow-roll condition reads φ φsr1. Two sub-cases need to be distin-
guished.
220

Case p > 2 and vp−22p
0 < φ0/MPl < 1
In this case, Eqs. (E.0.2), (E.0.4) and (E.0.7) lead to
∆φwell < φPζ |cl>1 < φsr1 . (E.2.2)
The situation is therefore very similar to the case p > 2 and φ0 > MPl, and quantum
diffusion does not sufficiently suppress PBH production.
Case p > 2 and φ0/MPl < vp−22p
0
In this case, Eqs. (E.0.2), (E.0.4) and (E.0.7) give a reversed hierarchy, namely
φsr1 < φPζ |cl>1 < ∆φwell . (E.2.3)
In the region where the slow-roll approximation applies, φ φsr1, the classical power
spectrum is therefore always larger than one. However this region is dominated by
stochastic effects since φsr1 < ∆φwell. In the stochastic regime, the expressions we have
previously derived receive a contribution from φ > φsr1 since we are integrating beyond
∆φwell, and are therefore inconsistent in this case. Intuitively, one may think that the
violation of slow roll induces the suppression of the noise amplitude in the Langevin
equation (4.1.1) so that ∆φwell should in fact be replaced with φsr1. The situation is
then similar to the one sketched in Fig. 4.3, and from Eqs. (4.4.2) and (E.0.2), one has
µ2 ∼ φ2sr1
v0M2Pl
=1
v0
(φ0
MPl
) 2pp−2
. (E.2.4)
Since the condition under which this case is defined is φ0/MPl < vp−22p
0 , one has µ2 < 1,
and PBHs are not overproduced in this case.
221

E.3 Case 1 < p < 2
In this case, slow roll is valid in the range
φsr1 φ φsr2 . (E.3.1)
Note that this condition implies that φsr1 φsr2, which is the case only if φ0 MPl.
One then has φsr2 φ0, so this range extends beyond the vacuum-dominated regime,
and the interval of interest is in fact
φsr1 φ φ0 . (E.3.2)
Two sub-cases need to be distinguished.
E.3.1 Case 1 < p < 2 and φ0/MPl < vp−22p
0
In this case, Eqs. (E.0.2), (E.0.3), (E.0.4) and (E.0.7) give rise to
φPζ |cl>1 < ∆φwell < φsr1 < φ0 < φsr2 . (E.3.3)
This means that in the region of interest given by Eq. (E.3.2), the classical approxi-
mation is valid and predicts that PBHs are not overproduced.
E.3.2 Case 1 < p < 2 and φ0/MPl > vp−22p
0
In this case, Eqs. (E.0.2), (E.0.3), (E.0.4) and (E.0.7) give rise to
φsr1 < ∆φwell < φPζ |cl>1 < φ0 < φsr2 . (E.3.4)
The situation is therefore similar to the case p > 2 and φ0 > MPl described in Sec. E.2.1,
and quantum diffusion does not sufficiently suppress PBH production.
222

E.4 Case 0 < p < 1
If one takes p < 1, contrary to the previous cases, the condition for the classical power
spectrum to be larger than one is φ > φPζ |cl>1, where φPζ |cl>1 is given by Eq. (E.0.7).
Furthermore, in this case, the slow-roll conditions read φ φsr1 and φ φsr2, and
which of these conditions is the strictest depends on whether φ0 is sub- or super-
Planckian.
E.4.1 Case 0 < p < 1 and φ0 < MPl
In this case the slow-roll condition reads
φ φsr1 . (E.4.1)
Since p < 1, φ0 < MPl implies that φ0/MPl < vp−22p
0 and from Eqs. (E.0.2), (E.0.4) and
(E.0.7), one has
∆φwell < φsr1 < φPζ |cl>1 . (E.4.2)
In this case, stochastic effects cannot play an important role in the slow-roll region of
the potential, where the power spectrum is smaller than one provided φ < φPζ |cl>1.
E.4.2 Case 0 < p < 1 and φ0 > MPl
In this case the slow-roll condition reads
φ φsr2 , (E.4.3)
and two sub-cases need to be distinguished.
Case 0 < p < 1 and φ0
MPl> v
p−22p
0
From Eqs. (E.0.3), (E.0.4) and (E.0.7), one has
φPζ |cl>1 < φsr2 < ∆φwell . (E.4.4)
223

In the classical region of the potential, φ > ∆φwell, the power spectrum is much larger
than one and PBHs are overproduced. In the stochastic region of the potential, φsr2 <
φ < ∆φwell, assuming φsr2 ∆φwell, µ2 is given by Eq. (E.0.5), which is much larger
than one for φ0 > MPl and p < 2. Therefore PBHs are also too abundant in this part
of the potential, and this case is observationally excluded.
Case 0 < p < 1 and 1 < φ0
MPl< v
p−22p
0
From Eqs. (E.0.3), (E.0.4) and (E.0.7), one has
∆φwell < φsr2 < φPζ |cl>1 . (E.4.5)
This case is similar to the one where 0 < p < 1 and φ0 < MPl, and stochastic effects
do not play an important role in the slow-roll region of the potential.
E.5 Case p = 1
Finally, let us consider the case p = 1. The slow-roll approximation is valid throughout
the entire vacuum-dominated region of the potential provided
φ0 MPl. (E.5.1)
This case is however more subtle than the previous ones, since from Eq. (4.5.9), one
has
ηclass ≡ 0 . (E.5.2)
This means that the first stochastic correction in the classical expansion presented in
Sec. 4.3 vanishes. This does not imply that quantum diffusion never plays a role since
higher-order terms can still spoil the classical result, but this suggests that our classi-
cality criterion fails in this case to identify where stochastic effects become important.
224

This is why no clear conclusion can be drawn in this case. In practice, one
should extend the classical expansion of Sec. 4.3 to next-to-next-to-next to leading
order (NNNLO) at least to determine what the first stochastic correction is and under
which condition the classical approximation holds, and investigate numerically the
cases where it does not. We leave these considerations for future work.
225

Appendix F
Deriving the Fokker–Planck
equation
F.1 Ultra-slow roll
In order to find the Fokker–Planck equation related to the USR system outlined here,
we use the general derivation that is explained in [292, 293]. For a general multi-variate
system of Langevin equations given by
dyidt
= Ai(y1, ..., yn, t) +∑
k
Bik(y1, ..., yn, t)ξk(t) , (F.1.1)
where 〈ξi(t)〉 = 0 and 〈ξi(t1)ξj(t2)〉 = 2Dδijδ(t1 − t2), the general Fokker–Planck
equation for P (y1, ..., yn, t) is given by
∂
∂tP = −
∑
i
∂
∂yi
[Ai +D
∑
jk
Bjk∂Bik
∂yj
]P
+D∑
ij
∂2
∂yi∂yj
[∑
k
BikBjk
]P
.
(F.1.2)
226

For the system given by (5.1.6) and (5.1.7), we have
Aφ =v
H, Av = −3v ,Bφφ =
H
2π, D =
1
2, (F.1.3)
all other coefficients are zero, and we take t = N . Hence, in the case of USR inflation,
the general equation (F.1.2) becomes
∂P
∂N=
[3− v
H
∂
∂φ+ 3v
∂
∂v+H2
8π2
∂2
∂φ2
]P
≡ LFP · P ,(F.1.4)
where LFP is the Fokker–Planck operator and we have used the fact that H is inde-
pendent of φ from
3M2PlH
2 = V0 +1
2v2 . (F.1.5)
As detailed in App A of [247], the equation that gives the moments of the PDF,
defined as fn(φi) = 〈N n〉(φini = φi), is given by
L†FP · fn(φi) = −nfn−1(φi) , (F.1.6)
where L†FP is the adjoint FP operator. Hence, we need to find the adjoint of (F.1.4).
In general, for an operator given by
L · u(x) =∑
n
an(x)Dnu(x) , (F.1.7)
the adjoint operator is given by
L† · u(x) =∑
n
(−1)nDn [an(x)u(x)] . (F.1.8)
227

Applying this to (F.1.4), we find that
L†FP · P =
[v
H
∂
∂φ− 3v
∂
∂v+H2
8π2
∂2
∂φ2
]P , (F.1.9)
Hence, for USR inflation, the moments of P are given by
[H2
8π2
∂2
∂φ2+
v
H
∂
∂φ− 3v
∂
∂v
]fn(φ, v) = −nfn−1(φ, v) , (F.1.10)
with n ≥ 1 and f0 = 1, and boundary conditions
fn(φend, v) = 0 ,∂fn∂φ
(φuv, v) = 0 , (F.1.11)
i.e. all trajectories initiated at φend realise a vanishing number of e-folds, and the other
one implementing the presence of a reflective wall at φuv.
F.2 Slow roll
Let us also, for comparison to the ultra-slow-roll case, briefly outline the method of
deriving the Fokker–Planck equation for the multi-field, slow-roll system
dφidN
= − V,φi3H2
+H
2πξ(N) (F.2.1)
where we have D fields (so 0 ≤ i ≤ D) moving in a potential V (φi). Following the
method outlined in the previous section, we have
Ai = − V,φi3H2
, Bii =H
2π, (F.2.2)
228

and all Bij = 0 for i 6= j. Hence, the Fokker–Planck equation corresponding to this
system is then
∂P
∂N=∑
i
∂
∂φi
[V,φi3H2
P
]+
1
2
∑
i
∂2
∂φ2i
[(H
2π
)2
P
]
=∑
i
∂
∂φi
[V,φiVM2
PlP
]+∑
i
∂2
∂φ2i
[V
3M2Pl
1
8π2P
],
(F.2.3)
where in the last equality we have used 3M2PlH
2 = V in slow roll. Finally, for simplicity,
we define the dimensionless potential
υ =V
24π2M4Pl
, (F.2.4)
and hence the Fokker-Planck equation becomes
∂P
∂N=∑
i
∂
∂φi
[υ,φiυM2
PlP]
+∑
i
∂2
∂φ2i
[M2
PlυP]. (F.2.5)
F.3 Leading order classical characteristic function
In order to use the method of characteristics, we parameterise with a parameter u
such that φ = φ(u) and v = v(u), and hence χN (t, u) = χN (t, φ(u), v(u)). By then
comparing the total derivative
dχNdu
=∂χN∂φ
∂φ
∂u+∂χN∂v
∂v
∂u, (F.3.1)
with our known classical PDE (5.3.1)
1
H
∂χN∂φ− 3
∂χN∂v
+it
vχN = 0 , (F.3.2)
we are motivated to choose
∂φ
∂u=
1
H,∂v
∂u= −3 . (F.3.3)
229

Hence we have
φ = φ0 +u
H, v = v0 − 3u , (F.3.4)
for some parameters φ0 and v0 that set the characteristic lines we are following. Note
that we have also assumed the H can be approximated as constant for now, as done
in [177]. Under this change of variables, our classical equation becomes
dχNdu
= − it
v0 − 3uχN . (F.3.5)
This is solved by
χN = χ0(φ0, v0) [v0 − 3u]it3 , (F.3.6)
where χ0 is an arbitrary function of our parameters φ0 and v0. We are free to choose
one of these parameters, so let us simply choose v0 = 0, and hence for each given (φ, v),
we have
φ0 = φ+v
3H, u = −v
3. (F.3.7)
Using this, we can transform back to our original variables and find
χN (t, φ, v) = χ0
(φ+
v
3H
)vit3 . (F.3.8)
To find the unknown function χ0 we use our initial condition χN (t, φend, v) = 1. With
this, we obtain our final solution to be
χN (t, φ, v)|cl = [v + 3H(φ− φend)]−it3 v
it3 (F.3.9)
230

F.3.1 Classical NLO solution
By again choosing the same characteristic curves (F.3.4), and choosing v0 = 0 as before,
the solution is given by
χN (t, φ, v)∣∣∣NLO
=
[χ1
(φ+
v
3H
)+ ln v
iH4t
8π2
(1 +
it
3
)[v + 3H (φ− φend)]−2− it
3
]vit3 ,
(F.3.10)
where χ1 is some arbitrary function to be determined by the initial conditions. This
initial condition gives us
χ1
(φend +
v
3H
)= v−
it3
[1− iH4t
8π2
(1 +
it
3
)ln v
v2
](F.3.11)
Setting X = φend + v3H
lets us find χ1(X), and hence
χN (t, φ, v)∣∣∣NLO
= vit3 [v + 3H (φ− φend)]−
it3
[1− iH4t
8π2
(1 +
it
3
)ln[1 + 3H
v(φ− φend)
]
[v + 3H (φ− φend)]2
].
(F.3.12)
231

Bibliography
[1] E. W. Kolb and M. S. Turner, The Early Universe, Front. Phys. 69 (1990) 1–547.
[2] P. J. E. Peebles, Principles of physical cosmology, Princeton, USA: Univ. Pr. (1993)
718 p (1994) .
[3] A. R. Liddle, An introduction to modern cosmology, Chichester, UK: Wiley (1998)
129 p (1998) .
[4] A. R. Liddle and D. H. Lyth, Cosmological inflation and large scale structure,
Cambridge, UK: Univ. Pr. (2000) 400 p (2000) .
[5] S. Dodelson, Modern Cosmology. Academic Press, Amsterdam, 2003.
[6] V. Mukhanov, Physical Foundations of Cosmology. Cambridge University Press,
Oxford, 2005.
[7] D. H. Lyth and A. R. Liddle, The primordial density perturbation: Cosmology,
inflation and the origin of structure, Cambridge, UK: Cambridge Univ. Pr. (2009)
497 p (2009) .
[8] P. Peter and J.-P. Uzan, Primordial Cosmology. Oxford Graduate Texts. Oxford
University Press, 2013.
[9] J. L. Bernal, L. Verde and A. G. Riess, The trouble with H0, JCAP 1610 (2016) 019,
[1607.05617].
[10] HST collaboration, W. L. Freedman et al., Final results from the Hubble Space
Telescope key project to measure the Hubble constant, Astrophys. J. 553 (2001)
47–72, [astro-ph/0012376].
232

[11] W. L. Freedman, B. F. Madore, V. Scowcroft, C. Burns, A. Monson, S. E. Persson
et al., Carnegie Hubble Program: A Mid-infrared Calibration of the Hubble Constant,
apj 758 (Oct, 2012) 24, [1208.3281].
[12] C. L. Bennett, D. Larson, J. L. Weiland, N. Jarosik, G. Hinshaw, N. Odegard et al.,
Nine-year wilkinson microwave anisotropy probe (wmap) observations: Final maps
and results, The Astrophysical Journal Supplement Series 208 (sep, 2013) 20.
[13] Planck collaboration, Y. Akrami et al., Planck 2018 results. I. Overview and the
cosmological legacy of Planck, 1807.06205.
[14] A. G. Riess et al., A 2.4% Determination of the Local Value of the Hubble Constant,
Astrophys. J. 826 (2016) 56, [1604.01424].
[15] LIGO Scientific, Virgo, 1M2H, Dark Energy Camera GW-E, DES,
DLT40, Las Cumbres Observatory, VINROUGE, MASTER collaboration,
B. P. Abbott et al., A gravitational-wave standard siren measurement of the Hubble
constant, Nature 551 (2017) 85–88, [1710.05835].
[16] N. Hogg. Personal communication.
[17] Planck collaboration, N. Aghanim et al., Planck 2018 results. VI. Cosmological
parameters, 1807.06209.
[18] D. A. Kirzhnits and A. D. Linde, Macroscopic Consequences of the Weinberg Model,
Phys. Lett. 42B (1972) 471–474.
[19] D. A. Kirzhnits, Weinberg model in the hot universe, JETP Lett. 15 (1972) 529–531.
[20] L. Dolan and R. Jackiw, Symmetry Behavior at Finite Temperature, Phys. Rev. D9
(1974) 3320–3341.
[21] S. Weinberg, Gauge and Global Symmetries at High Temperature, Phys. Rev. D9
(1974) 3357–3378.
[22] D. A. Kirzhnits and A. D. Linde, A Relativistic phase transition, Sov. Phys. JETP
40 (1975) 628.
233
[23] D. A. Kirzhnits and A. D. Linde, Symmetry Behavior in Gauge Theories, Annals
Phys. 101 (1976) 195–238.
[24] M. Dine, R. G. Leigh, P. Y. Huet, A. D. Linde and D. A. Linde, Towards the theory of
the electroweak phase transition, Phys. Rev. D46 (1992) 550–571, [hep-ph/9203203].
[25] C. Amsler, M. Doser, M. Antonelli, D. M. Asner, K. S. Babu, H. Baer et al., Review
of Particle Physics, Physics Letters B 667 (Sept., 2008) 1–6.
[26] A. D. Sakharov, Violation of CP Invariance, C asymmetry, and baryon asymmetry of
the universe, Pisma Zh. Eksp. Teor. Fiz. 5 (1967) 32–35.
[27] R. A. Alpher, H. Bethe and G. Gamow, The origin of chemical elements, Phys. Rev.
73 (1948) 803–804.
[28] G. M. Fuller, G. J. Mathews and C. R. Alcock, The Quark - Hadron Phase
Transition in the Early Universe: Isothermal Baryon Number Fluctuations and
Primordial Nucleosynthesis, Phys. Rev. D37 (1988) 1380.
[29] A. Coc, E. Vangioni-Flam, P. Descouvemont, A. Adahchour and C. Angulo, Updated
Big Bang nucleosynthesis confronted to WMAP observations and to the abundance of
light elements, Astrophys. J. 600 (2004) 544–552, [astro-ph/0309480].
[30] M. Pospelov and J. Pradler, Big Bang Nucleosynthesis as a Probe of New Physics,
Ann. Rev. Nucl. Part. Sci. 60 (2010) 539–568, [1011.1054].
[31] D. Kasen, B. Metzger, J. Barnes, E. Quataert and E. Ramirez-Ruiz, Origin of the
heavy elements in binary neutron-star mergers from a gravitational wave event,
Nature (2017) , [1710.05463].
[32] A. A. Penzias and R. W. Wilson, A Measurement of excess antenna temperature at
4080-Mc/s, Astrophys. J. 142 (1965) 419–421.
[33] J. D. Bowman, A. E. E. Rogers, R. A. Monsalve, T. J. Mozdzen and N. Mahesh, An
absorption profile centred at 78 megahertz in the sky-averaged spectrum, Nature 555
(2018) 67–70, [1810.05912].
234

[34] J. E. Gunn and B. A. Peterson, On the Density of Neutral Hydrogen in Intergalactic
Space., apj 142 (Nov., 1965) 1633–1636.
[35] SDSS collaboration, R. H. Becker et al., Evidence for Reionization at Z 6:
Detection of a Gunn-Peterson trough in a Z = 6.28 Quasar, Astron. J. 122 (2001)
2850, [astro-ph/0108097].
[36] R. Barkana and A. Loeb, In the beginning: The First sources of light and the
reionization of the Universe, Phys. Rept. 349 (2001) 125–238, [astro-ph/0010468].
[37] E. T. Vishniac, Reionization and Small-Scale Fluctuations in the Microwave
Background, apj 322 (Nov., 1987) 597.
[38] Supernova Search Team collaboration, A. G. Riess et al., Observational evidence
from supernovae for an accelerating universe and a cosmological constant, Astron. J.
116 (1998) 1009–1038, [astro-ph/9805201].
[39] Supernova Cosmology Project collaboration, S. Perlmutter et al.,
Measurements of Ω and Λ from 42 high redshift supernovae, Astrophys. J. 517 (1999)
565–586, [astro-ph/9812133].
[40] W. Rindler, Visual horizons in world models, mnras 116 (Jan., 1956) 662.
[41] C. W. Misner, The Isotropy of the Universe, apj 151 (Feb., 1968) 431.
[42] S. Hawking and W. Israel, General Relativity: an Einstein Centenary Survey, .
[43] T. Wrase, Cosmology and particle physics: Lecture notes,
https://www.lehigh.edu/ tiw419/files/2019S-Lecture-09.pdf.
[44] G. ’t Hooft, Magnetic Monopoles in Unified Gauge Theories, Nucl. Phys. B79 (1974)
276–284.
[45] A. M. Polyakov, Particle Spectrum in the Quantum Field Theory, JETP Lett. 20
(1974) 194–195.
[46] H. Georgi and S. L. Glashow, Unity of All Elementary Particle Forces, Phys. Rev.
Lett. 32 (1974) 438–441.
235

[47] J. C. Pati and A. Salam, Lepton Number as the Fourth Color, Phys. Rev. D10 (1974)
275–289.
[48] A. J. Buras, J. R. Ellis, M. K. Gaillard and D. V. Nanopoulos, Aspects of the Grand
Unification of Strong, Weak and Electromagnetic Interactions, Nucl. Phys. B135
(1978) 66–92.
[49] A. H. Guth and S. H. H. Tye, Phase Transitions and Magnetic Monopole Production
in the Very Early Universe, Phys. Rev. Lett. 44 (1980) 631.
[50] M. B. Einhorn, D. L. Stein and D. Toussaint, Are Grand Unified Theories Compatible
with Standard Cosmology?, Phys. Rev. D21 (1980) 3295.
[51] Ya. B. Zeldovich and M. Yu. Khlopov, On the Concentration of Relic Magnetic
Monopoles in the Universe, Phys. Lett. 79B (1978) 239–241.
[52] J. Preskill, Cosmological Production of Superheavy Magnetic Monopoles, Phys. Rev.
Lett. 43 (1979) 1365.
[53] A. Rajantie, Introduction to Magnetic Monopoles, Contemp. Phys. 53 (2012)
195–211, [1204.3077].
[54] A. A. Starobinsky, A New Type of Isotropic Cosmological Models Without
Singularity, Phys. Lett. B91 (1980) 99–102.
[55] K. Sato, First Order Phase Transition of a Vacuum and Expansion of the Universe,
Mon.Not.Roy.Astron.Soc. 195 (1981) 467–479.
[56] A. H. Guth, The Inflationary Universe: A Possible Solution to the Horizon and
Flatness Problems, Phys.Rev. D23 (1981) 347–356.
[57] A. D. Linde, A New Inflationary Universe Scenario: A Possible Solution of the
Horizon, Flatness, Homogeneity, Isotropy and Primordial Monopole Problems,
Phys.Lett. B108 (1982) 389–393.
[58] A. Albrecht and P. J. Steinhardt, Cosmology for Grand Unified Theories with
Radiatively Induced Symmetry Breaking, Phys.Rev.Lett. 48 (1982) 1220–1223.
[59] A. D. Linde, Chaotic Inflation, Phys.Lett. B129 (1983) 177–181.
236

[60] V. F. Mukhanov and G. Chibisov, Quantum Fluctuation and Nonsingular Universe.,
JETP Lett. 33 (1981) 532–535.
[61] V. F. Mukhanov and G. Chibisov, The Vacuum energy and large scale structure of
the universe, Sov.Phys.JETP 56 (1982) 258–265.
[62] A. A. Starobinsky, Dynamics of Phase Transition in the New Inflationary Universe
Scenario and Generation of Perturbations, Phys.Lett. B117 (1982) 175–178.
[63] A. H. Guth and S. Pi, Fluctuations in the New Inflationary Universe, Phys.Rev.Lett.
49 (1982) 1110–1113.
[64] S. Hawking, The Development of Irregularities in a Single Bubble Inflationary
Universe, Phys.Lett. B115 (1982) 295.
[65] J. M. Bardeen, P. J. Steinhardt and M. S. Turner, Spontaneous Creation of Almost
Scale - Free Density Perturbations in an Inflationary Universe, Phys.Rev. D28
(1983) 679.
[66] S. Alexander, R. H. Brandenberger and D. A. Easson, Brane gases in the early
universe, Phys. Rev. D62 (2000) 103509, [hep-th/0005212].
[67] J. Martin, P. Peter, N. Pinto Neto and D. J. Schwarz, Passing through the bounce in
the ekpyrotic models, Phys. Rev. D65 (2002) 123513, [hep-th/0112128].
[68] P. J. Steinhardt, N. Turok and N. Turok, A Cyclic model of the universe, Science
296 (2002) 1436–1439, [hep-th/0111030].
[69] R. Kallosh, L. Kofman and A. D. Linde, Pyrotechnic universe, Phys. Rev. D64
(2001) 123523, [hep-th/0104073].
[70] J. Magueijo, New varying speed of light theories, Rept. Prog. Phys. 66 (2003) 2025,
[astro-ph/0305457].
[71] R. Brandenberger, Matter Bounce in Horava-Lifshitz Cosmology, Phys. Rev. D80
(2009) 043516, [0904.2835].
[72] Planck collaboration, Y. Akrami et al., Planck 2018 results. X. Constraints on
inflation, 1807.06211.
237

[73] G. Hinshaw, D. Larson, E. Komatsu, D. N. Spergel, C. L. Bennett, J. Dunkley et al.,
Nine-year Wilkinson Microwave Anisotropy Probe (WMAP) Observations:
Cosmological Parameter Results, apjs 208 (Oct., 2013) 19, [1212.5226].
[74] J. Dunkley et al., The Atacama Cosmology Telescope: likelihood for small-scale CMB
data, JCAP 1307 (2013) 025, [1301.0776].
[75] Atacama Cosmology Telescope collaboration, J. L. Sievers et al., The Atacama
Cosmology Telescope: Cosmological parameters from three seasons of data, JCAP
1310 (2013) 060, [1301.0824].
[76] Z. Hou, C. L. Reichardt, K. T. Story, B. Follin, R. Keisler, K. A. Aird et al.,
Constraints on Cosmology from the Cosmic Microwave Background Power Spectrum
of the 2500 deg2 SPT-SZ Survey, apj 782 (Feb., 2014) 74, [1212.6267].
[77] K. T. Story, C. L. Reichardt, Z. Hou, R. Keisler, K. A. Aird, B. A. Benson et al., A
Measurement of the Cosmic Microwave Background Damping Tail from the
2500-Square-Degree SPT-SZ Survey, apj 779 (Dec., 2013) 86, [1210.7231].
[78] CMBPol Study Team collaboration, D. Baumann et al., CMBPol Mission
Concept Study: Probing Inflation with CMB Polarization, AIP Conf. Proc. 1141
(2009) 10–120, [0811.3919].
[79] B. P. Crill et al., SPIDER: A Balloon-borne Large-scale CMB Polarimeter, Proc.
SPIE Int. Soc. Opt. Eng. 7010 (2008) 70102P, [0807.1548].
[80] A. Kogut, D. J. Fixsen, D. T. Chuss, J. Dotson, E. Dwek, M. Halpern et al., The
Primordial Inflation Explorer (PIXIE): a nulling polarimeter for cosmic microwave
background observations, jcap 2011 (July, 2011) 025, [1105.2044].
[81] T. Matsumura et al., Mission design of LiteBIRD, 1311.2847.
[82] PRISM collaboration, P. Andre et al., PRISM (Polarized Radiation Imaging and
Spectroscopy Mission): A White Paper on the Ultimate Polarimetric Spectro-Imaging
of the Microwave and Far-Infrared Sky, 1306.2259.
[83] eLISA collaboration, P. A. Seoane et al., The Gravitational Universe, 1305.5720.
238

[84] L. Iacconi, M. Fasiello, H. Assadullahi, E. Dimastrogiovanni and D. Wands,
Interferometer Constraints on the Inflationary Field Content, JCAP 2003 (2020)
031, [1910.12921].
[85] G. Obied, H. Ooguri, L. Spodyneiko and C. Vafa, De Sitter Space and the
Swampland, 1806.08362.
[86] E. Palti, The Swampland: Introduction and Review, Fortsch. Phys. 67 (2019)
1900037, [1903.06239].
[87] G. N. Remmen and S. M. Carroll, Attractor Solutions in Scalar-Field Cosmology,
Phys. Rev. D88 (2013) 083518, [1309.2611].
[88] C. Gordon, D. Wands, B. A. Bassett and R. Maartens, Adiabatic and entropy
perturbations from inflation, Phys. Rev. D63 (2001) 023506, [astro-ph/0009131].
[89] K. A. Malik and D. Wands, Cosmological perturbations, Phys. Rept. 475 (2009) 1–51,
[0809.4944].
[90] M. Sasaki, Large Scale Quantum Fluctuations in the Inflationary Universe, Prog.
Theor. Phys. 76 (1986) 1036.
[91] V. F. Mukhanov, Quantum Theory of Gauge Invariant Cosmological Perturbations,
Sov. Phys. JETP 67 (1988) 1297–1302.
[92] V. Mukhanov and S. Winitzki, Introduction to quantum effects in gravity. Cambridge
University Press, 2007.
[93] S. Weinberg, The Cosmological Constant Problem, Rev. Mod. Phys. 61 (1989) 1–23.
[94] BICEP2, Keck Array collaboration, P. A. R. Ade et al., BICEP2 / Keck Array x:
Constraints on Primordial Gravitational Waves using Planck, WMAP, and New
BICEP2/Keck Observations through the 2015 Season, Phys. Rev. Lett. 121 (2018)
221301, [1810.05216].
[95] R. Kallosh, A. Linde and D. Roest, Superconformal Inflationary α-Attractors, JHEP
11 (2013) 198, [1311.0472].
239

[96] S. Ferrara, R. Kallosh, A. Linde and M. Porrati, Minimal Supergravity Models of
Inflation, Phys. Rev. D88 (2013) 085038, [1307.7696].
[97] K. Freese, J. A. Frieman and A. V. Olinto, Natural inflation with pseudo -
Nambu-Goldstone bosons, Phys. Rev. Lett. 65 (1990) 3233–3236.
[98] F. C. Adams, J. R. Bond, K. Freese, J. A. Frieman and A. V. Olinto, Natural
inflation: Particle physics models, power law spectra for large scale structure, and
constraints from COBE, Phys. Rev. D47 (1993) 426–455, [hep-ph/9207245].
[99] L. Boubekeur and D. H. Lyth, Hilltop inflation, JCAP 0507 (2005) 010,
[hep-ph/0502047].
[100] J. Martin, C. Ringeval, R. Trotta and V. Vennin, The Best Inflationary Models After
Planck, JCAP 1403 (2014) 039, [1312.3529].
[101] J. Martin, C. Ringeval and V. Vennin, How Well Can Future CMB Missions
Constrain Cosmic Inflation?, JCAP 1410 (2014) 038, [1407.4034].
[102] R. R. Caldwell and M. Kamionkowski, The Physics of Cosmic Acceleration, Ann.
Rev. Nucl. Part. Sci. 59 (2009) 397–429, [0903.0866].
[103] J. Martin, Everything You Always Wanted To Know About The Cosmological
Constant Problem (But Were Afraid To Ask), Comptes Rendus Physique 13 (2012)
566–665, [1205.3365].
[104] Supernova Cosmology Project collaboration, M. Kowalski et al., Improved
Cosmological Constraints from New, Old and Combined Supernova Datasets,
Astrophys. J. 686 (2008) 749–778, [0804.4142].
[105] BOSS collaboration, S. Alam et al., The clustering of galaxies in the completed
SDSS-III Baryon Oscillation Spectroscopic Survey: cosmological analysis of the DR12
galaxy sample, Mon. Not. Roy. Astron. Soc. 470 (2017) 2617–2652, [1607.03155].
[106] M. S. Linton, A. Pourtsidou, R. Crittenden and R. Maartens, Variable sound speed in
interacting dark energy models, JCAP 1804 (2018) 043, [1711.05196].
240

[107] T. Clifton, P. G. Ferreira, A. Padilla and C. Skordis, Modified Gravity and
Cosmology, Phys. Rept. 513 (2012) 1–189, [1106.2476].
[108] A. Joyce, L. Lombriser and F. Schmidt, Dark Energy Versus Modified Gravity, Ann.
Rev. Nucl. Part. Sci. 66 (2016) 95–122, [1601.06133].
[109] B. S. Wright, K. Koyama, H. A. Winther and G.-B. Zhao, Investigating the
degeneracy between modified gravity and massive neutrinos with redshift-space
distortions, JCAP 06 (2019) 040, [1902.10692].
[110] M. Kenna-Allison, A. E. G’umr’ukc’uoglu and K. Koyama, Stable Cosmology in
Generalised Massive Gravity, 1912.08560.
[111] E. J. Copeland, M. Sami and S. Tsujikawa, Dynamics of dark energy, Int. J. Mod.
Phys. D15 (2006) 1753–1936, [hep-th/0603057].
[112] K. Freese, Review of Observational Evidence for Dark Matter in the Universe and in
upcoming searches for Dark Stars, EAS Publ. Ser. 36 (2009) 113–126, [0812.4005].
[113] F. Zwicky, Republication of: The redshift of extragalactic nebulae, General Relativity
and Gravitation 41 (Jan., 2009) 207–224.
[114] V. C. Rubin and W. K. Ford, Jr., Rotation of the Andromeda Nebula from a
Spectroscopic Survey of Emission Regions, Astrophys. J. 159 (1970) 379–403.
[115] G. Bertone and D. Hooper, History of dark matter, Rev. Mod. Phys. 90 (2018)
045002, [1605.04909].
[116] M. Viel, J. S. Bolton and M. G. Haehnelt, Cosmological and astrophysical constraints
from the Lyman α forest flux probability distribution function, mnras 399 (Oct.,
2009) L39–L43, [0907.2927].
[117] E. Corbelli and P. Salucci, The Extended Rotation Curve and the Dark Matter Halo
of M33, Mon. Not. Roy. Astron. Soc. 311 (2000) 441–447, [astro-ph/9909252].
[118] P. Bhattacharjee, S. Chaudhury and S. Kundu, Rotation Curve of the Milky Way out
to ∼ 200 kpc, Astrophys. J. 785 (2014) 63, [1310.2659].
241

[119] K. Freese, Status of Dark Matter in the Universe, Int. J. Mod. Phys. 1 (2017)
325–355, [1701.01840].
[120] J. A. Tyson, G. P. Kochanski and I. P. Dell’Antonio, Detailed mass map of
CL0024+1654 from strong lensing, Astrophys. J. 498 (1998) L107,
[astro-ph/9801193].
[121] SDSS collaboration, J. K. Adelman-McCarthy et al., The Fourth Data Release of the
Sloan Digital Sky Survey, Astrophys. J. Suppl. 162 (2006) 38–48,
[astro-ph/0507711].
[122] D. Clowe, M. Bradac, A. H. Gonzalez, M. Markevitch, S. W. Randall, C. Jones et al.,
A direct empirical proof of the existence of dark matter, Astrophys. J. 648 (2006)
L109–L113, [astro-ph/0608407].
[123] C. Skordis, D. F. Mota, P. G. Ferreira and C. Boehm, Large Scale Structure in
Bekenstein’s theory of relativistic Modified Newtonian Dynamics, Phys. Rev. Lett. 96
(2006) 011301, [astro-ph/0505519].
[124] P. van Dokkum et al., A galaxy lacking dark matter, Nature 555 (2018) 629–632,
[1803.10237].
[125] Planck collaboration, N. Aghanim et al., Planck 2018 results. V. CMB power
spectra and likelihoods, 1907.12875.
[126] G. Jungman, M. Kamionkowski and K. Griest, Supersymmetric dark matter, Phys.
Rept. 267 (1996) 195–373, [hep-ph/9506380].
[127] G. Steigman, B. Dasgupta and J. F. Beacom, Precise Relic WIMP Abundance and its
Impact on Searches for Dark Matter Annihilation, Phys. Rev. D86 (2012) 023506,
[1204.3622].
[128] Fermi-LAT collaboration, M. Ackermann et al., Dark Matter Constraints from
Observations of 25 Milky Way Satellite Galaxies with the Fermi Large Area
Telescope, Phys. Rev. D89 (2014) 042001, [1310.0828].
242

[129] XENON collaboration, E. Aprile et al., First Dark Matter Search Results from the
XENON1T Experiment, Phys. Rev. Lett. 119 (2017) 181301, [1705.06655].
[130] R. D. Peccei and H. R. Quinn, CP conservation in the presence of pseudoparticles,
prl 38 (June, 1977) 1440–1443.
[131] R. D. Peccei and H. R. Quinn, Constraints imposed by CP conservation in the
presence of pseudoparticles, prd 16 (Sept., 1977) 1791–1797.
[132] L. Di Luzio, M. Giannotti, E. Nardi and L. Visinelli, The landscape of QCD axion
models, 2003.01100.
[133] H.-Y. Cheng, The Strong CP Problem Revisited, Phys. Rept. 158 (1988) 1.
[134] R. D. Peccei, The Strong CP problem and axions, Lect. Notes Phys. 741 (2008) 3–17,
[hep-ph/0607268].
[135] J. E. Kim and G. Carosi, Axions and the Strong CP Problem, Rev. Mod. Phys. 82
(2010) 557–602, [0807.3125].
[136] J. M. Pendlebury, K. F. Smith, R. Golub and J. Byrne, Search for a Neutron Electric
Dipole Moment, Phys. Lett. 136B (1984) 327–330.
[137] K. A. Olive and Particle Data Group, Review of Particle Physics, Chinese Physics C
38 (Aug., 2014) 090001.
[138] C. E. Aalseth et al., The CERN Axion Solar Telescope (CAST), Nucl. Phys. Proc.
Suppl. 110 (2002) 85–87.
[139] P. W. Graham, I. G. Irastorza, S. K. Lamoreaux, A. Lindner and K. A. van Bibber,
Experimental Searches for the Axion and Axion-Like Particles, Ann. Rev. Nucl. Part.
Sci. 65 (2015) 485–514, [1602.00039].
[140] F. Melia and H. Falcke, The supermassive black hole at the galactic center, Annual
Review of Astronomy and Astrophysics 39 (2001) 309–352,
[https://doi.org/10.1146/annurev.astro.39.1.309].
[141] O. Shemmer, H. Netzer, R. Maiolino, E. Oliva, S. Croom, E. Corbett et al.,
Near-infrared spectroscopy of high-redshift active galactic nuclei. i. a
243

metallicity–accretion rate relationship, The Astrophysical Journal 614 (oct, 2004)
547–557.
[142] Event Horizon Telescope collaboration, K. Akiyama et al., First M87 Event
Horizon Telescope Results. I. The Shadow of the Supermassive Black Hole,
Astrophys. J. 875 (2019) L1, [1906.11238].
[143] Y.-X. Li et al., Formation of z˜6 quasars from hierarchical galaxy mergers, Astrophys.
J. 665 (2007) 187–208, [astro-ph/0608190].
[144] F. I. Pelupessy, T. Di Matteo and B. Ciardi, How rapidly do supermassive black hole
seeds grow at early times?, Astrophys. J. 665 (2007) 107–119, [astro-ph/0703773].
[145] N. YOSHIDA, Formation of the first generation of stars and blackholes in the
universe, Proceedings of the Japan Academy, Series B 95 (2019) 17–28.
[146] E. Banados et al., An 800-million-solar-mass black hole in a significantly neutral
Universe at redshift 7.5, Nature 553 (2018) 473–476, [1712.01860].
[147] M. C. Begelman, M. Volonteri and M. J. Rees, Formation of supermassive black holes
by direct collapse in pregalactic halos, Mon. Not. Roy. Astron. Soc. 370 (2006)
289–298, [astro-ph/0602363].
[148] D. Spolyar, K. Freese and P. Gondolo, Dark matter and the first stars: a new phase
of stellar evolution, Phys. Rev. Lett. 100 (2008) 051101, [0705.0521].
[149] K. Freese, P. Bodenheimer, P. Gondolo and D. Spolyar, Dark Stars: the First Stars
in the Universe may be powered by Dark Matter Heating, AIP Conf. Proc. 1166
(2009) 33–38, [0812.4844].
[150] J. Garcıa-Bellido, Massive Primordial Black Holes as Dark Matter and their detection
with Gravitational Waves, J. Phys. Conf. Ser. 840 (2017) 012032, [1702.08275].
[151] T. Harada, C.-M. Yoo, K. Kohri, K.-i. Nakao and S. Jhingan, Primordial black hole
formation in the matter-dominated phase of the Universe, Astrophys. J. 833 (2016)
61, [1609.01588].
244

[152] J. Adamek, C. T. Byrnes, M. Gosenca and S. Hotchkiss, WIMPs and stellar-mass
primordial black holes are incompatible, Phys. Rev. D 100 (2019) 023506,
[1901.08528].
[153] B. Carr, F. Kuhnel and M. Sandstad, Primordial Black Holes as Dark Matter, Phys.
Rev. D94 (2016) 083504, [1607.06077].
[154] A. M. Green, Microlensing and dynamical constraints on primordial black hole dark
matter with an extended mass function, Phys. Rev. D94 (2016) 063530, [1609.01143].
[155] S. Clesse and J. GarcAa-Bellido, Seven Hints for Primordial Black Hole Dark Matter,
Phys. Dark Univ. 22 (2018) 137–146, [1711.10458].
[156] S. Bird, I. Cholis, J. B. Munoz, Y. Ali-Ha’imoud, M. Kamionkowski, E. D. Kovetz
et al., Did LIGO detect dark matter?, Phys. Rev. Lett. 116 (2016) 201301,
[1603.00464].
[157] M. Sasaki, T. Suyama, T. Tanaka and S. Yokoyama, Primordial Black Hole Scenario
for the Gravitational-Wave Event GW150914, Phys. Rev. Lett. 117 (2016) 061101,
[1603.08338].
[158] Planck collaboration, P. A. R. Ade et al., Planck 2015 results. XIII. Cosmological
parameters, Astron. Astrophys. 594 (2016) A13, [1502.01589].
[159] Planck collaboration, P. Ade et al., Planck 2015 results. XX. Constraints on
inflation, 1502.02114.
[160] S. Hawking, Gravitationally collapsed objects of very low mass, Mon. Not. Roy.
Astron. Soc. 152 (1971) 75.
[161] B. J. Carr and S. W. Hawking, Black holes in the early Universe, Mon. Not. Roy.
Astron. Soc. 168 (1974) 399–415.
[162] B. J. Carr, The Primordial black hole mass spectrum, Astrophys. J. 201 (1975) 1–19.
[163] I. Zaballa, A. M. Green, K. A. Malik and M. Sasaki, Constraints on the primordial
curvature perturbation from primordial black holes, JCAP 0703 (2007) 010,
[astro-ph/0612379].
245

[164] T. Harada, C.-M. Yoo and K. Kohri, Threshold of primordial black hole formation,
Phys. Rev. D88 (2013) 084051, [1309.4201].
[165] S. Young, C. T. Byrnes and M. Sasaki, Calculating the mass fraction of primordial
black holes, JCAP 1407 (2014) 045, [1405.7023].
[166] B. J. Carr, The primordial black hole mass spectrum, ApJ 201 (Oct., 1975) 1–19.
[167] M. W. Choptuik, Universality and scaling in gravitational collapse of a massless
scalar field, Phys. Rev. Lett. 70 (1993) 9–12.
[168] J. C. Niemeyer and K. Jedamzik, Near-critical gravitational collapse and the initial
mass function of primordial black holes, Phys. Rev. Lett. 80 (1998) 5481–5484,
[astro-ph/9709072].
[169] F. Kuhnel, C. Rampf and M. Sandstad, Effects of Critical Collapse on Primordial
Black-Hole Mass Spectra, Eur. Phys. J. C76 (2016) 93, [1512.00488].
[170] I. B. Khriplovich, A. A. Pomeransky, N. Produit and G. Yu. Ruban, Can one detect
passage of small black hole through the Earth?, Phys. Rev. D77 (2008) 064017,
[0710.3438].
[171] B. J. Carr, K. Kohri, Y. Sendouda and J. Yokoyama, New cosmological constraints
on primordial black holes, Phys. Rev. D81 (2010) 104019, [0912.5297].
[172] B. Carr, M. Raidal, T. Tenkanen, V. Vaskonen and H. Veermae, Primordial black
hole constraints for extended mass functions, 1705.05567.
[173] B. Carr, K. Kohri, Y. Sendouda and J. Yokoyama, Constraints on Primordial Black
Holes, 2002.12778.
[174] V. F. Mukhanov, Gravitational Instability of the Universe Filled with a Scalar Field,
JETP Lett. 41 (1985) 493–496.
[175] M. Biagetti, G. Franciolini, A. Kehagias and A. Riotto, Primordial Black Holes from
Inflation and Quantum Diffusion, 1804.07124.
[176] J. M. Ezquiaga and J. Garcıa-Bellido, Quantum diffusion beyond slow-roll:
implications for primordial black-hole production, 1805.06731.
246

[177] H. Firouzjahi, A. Nassiri-Rad and M. Noorbala, Stochastic Ultra Slow Roll Inflation,
1811.02175.
[178] C. T. Byrnes, P. S. Cole and S. P. Patil, Steepest growth of the power spectrum and
primordial black holes, JCAP 06 (2019) 028, [1811.11158].
[179] M. Braglia, D. K. Hazra, L. Sriramkumar and F. Finelli, Generating primordial
features at large scales in two field models of inflation, 2004.00672.
[180] C. Pattison, V. Vennin, H. Assadullahi and D. Wands, The attractive behaviour of
ultra-slow-roll inflation, JCAP 1808 (2018) 048, [1806.09553].
[181] S. Inoue and J. Yokoyama, Curvature perturbation at the local extremum of the
inflaton’s potential, Phys. Lett. B524 (2002) 15–20, [hep-ph/0104083].
[182] W. H. Kinney, Horizon crossing and inflation with large eta, Phys. Rev. D72 (2005)
023515, [gr-qc/0503017].
[183] J. Martin, H. Motohashi and T. Suyama, Ultra Slow-Roll Inflation and the
non-Gaussianity Consistency Relation, Phys.Rev. D87 (2013) 023514, [1211.0083].
[184] H. Motohashi, A. A. Starobinsky and J. Yokoyama, Inflation with a constant rate of
roll, JCAP 1509 (2015) 018, [1411.5021].
[185] A. Karam, L. Marzola, T. Pappas, A. Racioppi and K. Tamvakis, Constant-Roll
(Quasi-)Linear Inflation, JCAP 1805 (2018) 011, [1711.09861].
[186] Z. Yi and Y. Gong, On the constant-roll inflation, JCAP 1803 (2018) 052,
[1712.07478].
[187] M. J. P. Morse and W. H. Kinney, Large-η Constant-Roll Inflation Is Never An
Attractor, 1804.01927.
[188] A. D. Linde, Fast roll inflation, JHEP 11 (2001) 052, [hep-th/0110195].
[189] D. S. Salopek and J. R. Bond, Nonlinear evolution of long wavelength metric
fluctuations in inflationary models, Phys. Rev. D42 (1990) 3936–3962.
[190] A. R. Liddle, P. Parsons and J. D. Barrow, Formalizing the slow roll approximation
in inflation, Phys. Rev. D50 (1994) 7222–7232, [astro-ph/9408015].
247

[191] V. Vennin, Horizon-Flow off-track for Inflation, Phys. Rev. D89 (2014) 083526,
[1401.2926].
[192] J. Grain and V. Vennin, Stochastic inflation in phase space: Is slow roll a stochastic
attractor?, JCAP 1705 (2017) 045, [1703.00447].
[193] Y.-F. Cai, X. Chen, M. H. Namjoo, M. Sasaki, D.-G. Wang and Z. Wang, Revisiting
non-Gaussianity from non-attractor inflation models, JCAP 1805 (2018) 012,
[1712.09998].
[194] K. Dimopoulos, Ultra slow-roll inflation demystified, Phys. Lett. B775 (2017)
262–265, [1707.05644].
[195] L. Anguelova, P. Suranyi and L. C. R. Wijewardhana, Systematics of Constant Roll
Inflation, JCAP 1802 (2018) 004, [1710.06989].
[196] O. Seto, J. Yokoyama and H. Kodama, What happens when the inflaton stops during
inflation, Phys. Rev. D61 (2000) 103504, [astro-ph/9911119].
[197] S. M. Leach, M. Sasaki, D. Wands and A. R. Liddle, Enhancement of superhorizon
scale inflationary curvature perturbations, Phys. Rev. D64 (2001) 023512,
[astro-ph/0101406].
[198] D. Wands, Duality invariance of cosmological perturbation spectra, Phys. Rev. D60
(1999) 023507, [gr-qc/9809062].
[199] H.-Y. Chang and R. J. Scherrer, Inflection Point Quintessence, Phys. Rev. D88
(2013) 083003, [1306.4662].
[200] A. A. Starobinsky, Spectrum of adiabatic perturbations in the universe when there are
singularities in the inflation potential, JETP Lett. 55 (1992) 489–494.
[201] A. A. Starobinsky, Stochastic de Sitter (inflationary) stage in the early Universe,
Lect. Notes Phys. 246 (1986) 107–126.
[202] V. Vennin and A. A. Starobinsky, Correlation Functions in Stochastic Inflation, Eur.
Phys. J. C75 (2015) 413, [1506.04732].
248

[203] J. Garcia-Bellido, A. D. Linde and D. Wands, Density perturbations and black hole
formation in hybrid inflation, Phys. Rev. D54 (1996) 6040–6058,
[astro-ph/9605094].
[204] O. Ozsoy, S. Parameswaran, G. Tasinato and I. Zavala, Mechanisms for Primordial
Black Hole Production in String Theory, 1803.07626.
[205] Y. Nambu and M. Sasaki, Stochastic Stage of an Inflationary Universe Model, Phys.
Lett. B205 (1988) 441–446.
[206] Y. Nambu and M. Sasaki, Stochastic Approach to Chaotic Inflation and the
Distribution of Universes, Phys. Lett. B219 (1989) 240–246.
[207] H. E. Kandrup, Stochastic inflation as a time-dependent random walk, Phys. Rev. D
39 (Apr, 1989) 2245–2252.
[208] K.-i. Nakao, Y. Nambu and M. Sasaki, Stochastic Dynamics of New Inflation, Prog.
Theor. Phys. 80 (1988) 1041.
[209] Y. Nambu, Stochastic Dynamics of an Inflationary Model and Initial Distribution of
Universes, Prog.Theor.Phys. 81 (1989) 1037.
[210] S. Mollerach, S. Matarrese, A. Ortolan and F. Lucchin, Stochastic inflation in a
simple two field model, Phys.Rev. D44 (1991) 1670–1679.
[211] A. D. Linde, D. A. Linde and A. Mezhlumian, From the Big Bang theory to the
theory of a stationary universe, Phys. Rev. D49 (1994) 1783–1826, [gr-qc/9306035].
[212] A. A. Starobinsky and J. Yokoyama, Equilibrium state of a selfinteracting scalar field
in the De Sitter background, Phys. Rev. D50 (1994) 6357–6368, [astro-ph/9407016].
[213] C. Pattison, V. Vennin, H. Assadullahi and D. Wands, Stochastic inflation beyond
slow roll, JCAP 1907 (2019) 031, [1905.06300].
[214] H. Casini, R. Montemayor and P. Sisterna, Stochastic approach to inflation. 2.
Classicality, coarse graining and noises, Phys. Rev. D59 (1999) 063512,
[gr-qc/9811083].
249

[215] S. Matarrese, M. A. Musso and A. Riotto, Influence of superhorizon scales on
cosmological observables generated during inflation, JCAP 0405 (2004) 008,
[hep-th/0311059].
[216] M. Liguori, S. Matarrese, M. Musso and A. Riotto, Stochastic inflation and the lower
multipoles in the CMB anisotropies, JCAP 0408 (2004) 011, [astro-ph/0405544].
[217] B. L. Hu, J. P. Paz and Y. Zhang, Quantum origin of noise and fluctuations in
cosmology, in The Origin of Structure in the Universe Chateau de Pont d’Oye,
Belgium, April 27-May 2, 1992, pp. 227–251, 1992. gr-qc/9512049.
[218] D. Polarski and A. A. Starobinsky, Semiclassicality and decoherence of cosmological
perturbations, Class. Quant. Grav. 13 (1996) 377–392, [gr-qc/9504030].
[219] J. Lesgourgues, D. Polarski and A. A. Starobinsky, Quantum to classical transition of
cosmological perturbations for nonvacuum initial states, Nucl. Phys. B497 (1997)
479–510, [gr-qc/9611019].
[220] C. Kiefer and D. Polarski, Why do cosmological perturbations look classical to us?,
Adv. Sci. Lett. 2 (2009) 164–173, [0810.0087].
[221] J. Martin and V. Vennin, Quantum Discord of Cosmic Inflation: Can we Show that
CMB Anisotropies are of Quantum-Mechanical Origin?, Phys. Rev. D93 (2016)
023505, [1510.04038].
[222] M. Revzen, P. A. Mello, A. Mann and L. M. Johansen, Bell’s inequality violation
with non-negative Wigner functions, Physical Review A 71 (Feb, 2005) 022103,
[quant-ph/0405100].
[223] J. Martin and V. Vennin, Bell inequalities for continuous-variable systems in generic
squeezed states, Phys. Rev. A93 (2016) 062117, [1605.02944].
[224] J. Martin and V. Vennin, Obstructions to Bell CMB Experiments, Phys. Rev. D96
(2017) 063501, [1706.05001].
250

[225] M. Sasaki and E. D. Stewart, A General analytic formula for the spectral index of the
density perturbations produced during inflation, Prog.Theor.Phys. 95 (1996) 71–78,
[astro-ph/9507001].
[226] D. Wands, K. A. Malik, D. H. Lyth and A. R. Liddle, A New approach to the
evolution of cosmological perturbations on large scales, Phys.Rev. D62 (2000) 043527,
[astro-ph/0003278].
[227] D. H. Lyth and D. Wands, Conserved cosmological perturbations, Phys.Rev. D68
(2003) 103515, [astro-ph/0306498].
[228] G. I. Rigopoulos and E. P. S. Shellard, The separate universe approach and the
evolution of nonlinear superhorizon cosmological perturbations, Phys. Rev. D68
(2003) 123518, [astro-ph/0306620].
[229] D. H. Lyth and Y. Rodriguez, The Inflationary prediction for primordial
non-Gaussianity, Phys.Rev.Lett. 95 (2005) 121302, [astro-ph/0504045].
[230] E. M. Lifshitz and I. M. Khalatnikov, About singularities of cosmological solutions of
the gravitational equations. I, ZhETF 39 (1960) 149.
[231] A. A. Starobinsky, Isotropization of arbitrary cosmological expansion given an
effective cosmological constant, JETP Lett. 37 (1983) 66–69.
[232] G. Comer, N. Deruelle, D. Langlois and J. Parry, Growth or decay of cosmological
inhomogeneities as a function of their equation of state, Phys.Rev. D49 (1994)
2759–2768.
[233] I. Khalatnikov, A. Y. Kamenshchik and A. A. Starobinsky, Comment about
quasiisotropic solution of Einstein equations near cosmological singularity,
Class.Quant.Grav. 19 (2002) 3845–3850, [gr-qc/0204045].
[234] D. Cruces, C. Germani and T. Prokopec, Failure of the stochastic approach to
inflation in constant-roll and ultra-slow-roll, 1807.09057.
251

[235] T. Fujita, M. Kawasaki, Y. Tada and T. Takesako, A new algorithm for calculating
the curvature perturbations in stochastic inflation, JCAP 1312 (2013) 036,
[1308.4754].
[236] J. Garcia-Bellido and E. Ruiz Morales, Primordial black holes from single field models
of inflation, 1702.03901.
[237] C. Germani and T. Prokopec, On primordial black holes from an inflection point,
1706.04226.
[238] C. Pattison, V. Vennin, H. Assadullahi and D. Wands, Quantum diffusion during
inflation and primordial black holes, JCAP 1710 (2017) 046, [1707.00537].
[239] J. Martin and L. Sriramkumar, The scalar bi-spectrum in the Starobinsky model: The
equilateral case, JCAP 1201 (2012) 008, [1109.5838].
[240] A. A. Starobinsky, Multicomponent de Sitter (Inflationary) Stages and the
Generation of Perturbations, JETP Lett. 42 (1985) 152–155.
[241] M. Sasaki and T. Tanaka, Superhorizon scale dynamics of multiscalar inflation,
Prog.Theor.Phys. 99 (1998) 763–782, [gr-qc/9801017].
[242] D. H. Lyth, K. A. Malik and M. Sasaki, A General proof of the conservation of the
curvature perturbation, JCAP 0505 (2005) 004, [astro-ph/0411220].
[243] P. Creminelli and M. Zaldarriaga, Single field consistency relation for the 3-point
function, JCAP 0410 (2004) 006, [astro-ph/0407059].
[244] K. Enqvist, S. Nurmi, D. Podolsky and G. Rigopoulos, On the divergences of
inflationary superhorizon perturbations, JCAP 0804 (2008) 025, [0802.0395].
[245] T. Fujita, M. Kawasaki and Y. Tada, Non-perturbative approach for curvature
perturbations in stochastic-δN formalism, 1405.2187.
[246] M. Kawasaki and Y. Tada, Can massive primordial black holes be produced in mild
waterfall hybrid inflation?, JCAP 1608 (2016) 041, [1512.03515].
[247] H. Assadullahi, H. Firouzjahi, M. Noorbala, V. Vennin and D. Wands, Multiple
Fields in Stochastic Inflation, JCAP 1606 (2016) 043, [1604.04502].
252

[248] V. Vennin, H. Assadullahi, H. Firouzjahi, M. Noorbala and D. Wands, Critical
Number of Fields in Stochastic Inflation, Phys. Rev. Lett. 118 (2017) 031301,
[1604.06017].
[249] E. Silverstein and D. Tong, Scalar speed limits and cosmology: Acceleration from
D-cceleration, Phys. Rev. D70 (2004) 103505, [hep-th/0310221].
[250] M. Alishahiha, E. Silverstein and D. Tong, DBI in the sky, Phys. Rev. D70 (2004)
123505, [hep-th/0404084].
[251] G. R. Dvali and S. H. H. Tye, Brane inflation, Phys. Lett. B450 (1999) 72–82,
[hep-ph/9812483].
[252] C. P. Burgess, M. Majumdar, D. Nolte, F. Quevedo, G. Rajesh and R.-J. Zhang, The
Inflationary brane anti-brane universe, JHEP 07 (2001) 047, [hep-th/0105204].
[253] S. Kachru, R. Kallosh, A. D. Linde, J. M. Maldacena, L. P. McAllister and S. P.
Trivedi, Towards inflation in string theory, JCAP 0310 (2003) 013,
[hep-th/0308055].
[254] L. Lorenz, J. Martin and J. Yokoyama, Geometrically Consistent Approach to
Stochastic DBI Inflation, Phys. Rev. D82 (2010) 023515, [1004.3734].
[255] X. Chen, S. Sarangi, S. H. Henry Tye and J. Xu, Is brane inflation eternal?, JCAP
0611 (2006) 015, [hep-th/0608082].
[256] W. Zhang, “Introduction to Ito’s Lemma.”
http://pi.math.cornell.edu/~web6720/Wendy_slides.pdf.
[257] L. Bachelier, Theorie de la speculation. Gauthier-Villars, 1900.
[258] I. Gihman and A. Skorohod, Stochastic Differential Equations. Springer Verlag,
Berlin Heidelberg New York, 1972, p.108.
[259] F. W. Olver, D. W. Lozier, R. F. Boisvert and C. W. Clark, Ch. 13 in NIST
Handbook of Mathematical Functions. Cambridge University Press, New York, NY,
USA, 1st ed., 2010.
253

[260] M. Abramowitz and I. A. Stegun, Ch. 13 in Handbook of mathematical functions with
formulas, graphs, and mathematical tables. National Bureau of Standards,
Washington, US, ninth ed., 1970.
[261] F. W. Olver, D. W. Lozier, R. F. Boisvert and C. W. Clark, Ch. 20 in NIST
Handbook of Mathematical Functions. Cambridge University Press, New York, NY,
USA, 1st ed., 2010.
[262] M. Abramowitz and I. A. Stegun, Ch. 16 in Handbook of mathematical functions with
formulas, graphs, and mathematical tables. National Bureau of Standards,
Washington, US, ninth ed., 1970.
[263] S. Young and C. T. Byrnes, Primordial black holes in non-Gaussian regimes, JCAP
1308 (2013) 052, [1307.4995].
[264] S. Young, D. Regan and C. T. Byrnes, Influence of large local and non-local bispectra
on primordial black hole abundance, JCAP 1602 (2016) 029, [1512.07224].
[265] A. D. Linde, Axions in inflationary cosmology, Phys. Lett. B259 (1991) 38–47.
[266] A. D. Linde, Hybrid inflation, Phys.Rev. D49 (1994) 748–754, [astro-ph/9307002].
[267] E. J. Copeland, A. R. Liddle, D. H. Lyth, E. D. Stewart and D. Wands, False
vacuum inflation with Einstein gravity, Phys. Rev. D49 (1994) 6410–6433,
[astro-ph/9401011].
[268] S. Renaux-Petel and K. Turzynski, Geometrical Destabilization of Inflation, Phys.
Rev. Lett. 117 (2016) 141301, [1510.01281].
[269] S. Renaux-Petel, K. Turzynski and V. Vennin, Geometrical destabilization, premature
end of inflation and Bayesian model selection, 1706.01835.
[270] E. D. Stewart, Flattening the inflaton’s potential with quantum corrections, Phys.
Lett. B391 (1997) 34–38, [hep-ph/9606241].
[271] J. Martin, C. Ringeval and V. Vennin, Encyclopaedia Inflationaris, Phys. Dark Univ.
5-6 (2014) 75–235, [1303.3787].
254

[272] L. Covi and D. H. Lyth, Running mass models of inflation, and their observational
constraints, Phys. Rev. D59 (1999) 063515, [hep-ph/9809562].
[273] S. M. Leach, I. J. Grivell and A. R. Liddle, Black hole constraints on the running
mass inflation model, Phys. Rev. D62 (2000) 043516, [astro-ph/0004296].
[274] M. Drees and E. Erfani, Running-Mass Inflation Model and Primordial Black Holes,
JCAP 1104 (2011) 005, [1102.2340].
[275] Y. Akrami, F. Kuhnel and M. Sandstad, Uncertainties in primordial black-hole
constraints on the primordial power spectrum, 1611.10069.
[276] F. W. Olver, D. W. Lozier, R. F. Boisvert and C. W. Clark, Sec. 4.13 in NIST
Handbook of Mathematical Functions. Cambridge University Press, New York, NY,
USA, 1st ed., 2010.
[277] K. Kannike, L. Marzola, M. Raidal and H. Veermae, Single Field Double Inflation
and Primordial Black Holes, 1705.06225.
[278] H. Motohashi and W. Hu, Primordial Black Holes and Slow-roll Violation,
1706.06784.
[279] C. Pattison, V. Vennin, D. Wands and H. Assadullahi, Ultra-slow-roll inflation with
quantum diffusion, 2101.05741.
[280] J. M. Ezquiaga, J. Garcıa-Bellido and V. Vennin, The exponential tail of inflationary
fluctuations: consequences for primordial black holes, JCAP 2003 (2020) 029,
[1912.05399].
[281] E. Bugaev and P. Klimai, Curvature perturbation spectra from waterfall transition,
black hole constraints and non-Gaussianity, JCAP 1111 (2011) 028, [1107.3754].
[282] E. Bugaev and P. Klimai, Formation of primordial black holes from non-Gaussian
perturbations produced in a waterfall transition, Phys. Rev. D85 (2012) 103504,
[1112.5601].
255

[283] S. Clesse and J. Garcıa-Bellido, Massive Primordial Black Holes from Hybrid
Inflation as Dark Matter and the seeds of Galaxies, Phys. Rev. D92 (2015) 023524,
[1501.07565].
[284] S. Shandera, A. L. Erickcek, P. Scott and J. Y. Galarza, Number Counts and
Non-Gaussianity, Phys. Rev. D88 (2013) 103506, [1211.7361].
[285] A. Berera and L.-Z. Fang, Thermally induced density perturbations in the inflation
era, Phys. Rev. Lett. 74 (1995) 1912–1915, [astro-ph/9501024].
[286] A. Berera, Warm inflation, Phys. Rev. Lett. 75 (1995) 3218–3221,
[astro-ph/9509049].
[287] A. Berera, I. G. Moss and R. O. Ramos, Warm Inflation and its Microphysical Basis,
Rept. Prog. Phys. 72 (2009) 026901, [0808.1855].
[288] M. Bellini, Warm inflation with back reaction: A Stochastic approach, Class. Quant.
Grav. 17 (2000) 145–151, [gr-qc/9910073].
[289] T. Miranda, E. Frion and D. Wands, Stochastic collapse, JCAP 2001 (2020) 026,
[1910.10000].
[290] “NIST Digital Library of Mathematical Functions.”
http://dlmf.nist.gov/20.7E30, Release 1.0.14 of 2016-12-21.
[291] A. R. Liddle and D. H. Lyth, Cosmological Inflation and Large-Scale Structure.
Cambridge University Press, 2000, 10.1017/CBO9781139175180.
[292] H. Risken and H. Haken, The Fokker-Planck Equation: Methods of Solution and
Applications Second Edition. Springer, 1989.
[293] J. L. Garcia-Palacios, Introduction to the theory of stochastic processes and Brownian
motion problems, arXiv e-prints (Jan., 2007) cond–mat/0701242,
[cond-mat/0701242].
256


![Physics Beyond the Standard Model With Pulsar Timing Arrays · 2019-05-20 · to cosmological scales due to the expansion of the Universe [4{9]. In a cosmological setting, and for](https://img.pdfslide.us/doc/110x75/5f77e107f51b825581734ee9/physics-beyond-the-standard-model-with-pulsar-timing-arrays-2019-05-20-to-cosmological.jpg)