Embed Size (px)
Citation preview

InterMarket Perspective
To find our Research on Bloomberg, please type -IMKP <GO> www.jamapunji.pk
Research Entity Number –REP-085
ANALYST CERTIFICATION AND REQUIRED DISCLOSURES BEGIN ON PAGE 17 & 18
10 July 2017
Syed Waqas Imam
+92-21-111-467-000 Ext: 102
• We initiate coverage on Pak Elektron Ltd (PAEL) with a Buy rating and Dec’17 TP of
PkR120/sh (25% upside). PAEL offers a unique combination of exposure to rising
consumer demand, and infrastructure growth in the power sector. We forecast 3yr
earnings CAGR of 15% (CY16-19F). Our TP implies a target P/E of 11.2x on CY17F EPS.
• PAEL’s appliances division – with second largest market share is well positioned to
capitalize on rapidly growing refrigerator sales in Pakistan, bolstered by close
competitors being in transition and a protective backdrop. Importantly, with greater
appliance sales, PAEL will sustain strong margins and improve cash-flows.
• Also, PAEL’s dominant position in the electrical equipment market will make it a
significant contributor to rapid infrastructure development in the power sector amidst
an unprecedented investment boom. Burgeoning participation from ADB and WB in
this investment cycle will further improve risk profile of sales to power sector.
Well-aligned to turnaround in Energy sector & Consumer demand
PAEL is a unique growth story with exposure to two high-growth markets in Pakistan –
appliances and electrical equipment, which are both enjoying conducive macro backdrop,
surging demand and weak competition. We initiate coverage with a Buy rating and Dec’17
TP of PkR120/sh (25% potential upside). We forecast 3yr earnings CAGR of 15% which is
backed by (i) double-digit sales growth in both appliances and sales divisions, (ii) increasing
share of appliances sales to overall revenue, which will not only lift margins but also improve
cash-flows, and (iii) healthy EBITDA margins in tandem with sales growth which will fuel
swift deleveraging. With more than half its business in the Consumer sector, we find PAEL’s
valuations undemanding at a CY17F P/E of 9.0x (PEG: 0.6x).
Topline to be pushed by a more prominent appliances segment
Favorable macros (low inflation and interest rates), turnaround in power supply, high GDP
growth, and very low penetration (around 40% of total population) all support double-digit
sales growth of appliances in Pakistan. Of greatest importance is the improved energy
availability in tandem with low power tariff, which have improved economics for cooling
appliances (refrigerators, deep freezers and A/C splits) for the masses at large. In addition to
demand growth, local producers of white goods are protected from imports with a sticky
25% duty along with freight advantages in case of refrigerators. In this backdrop, PAEL
enjoys 26% market share in the key Refrigerator market; we expect its appliances sales to
grow at a CAGR of 18% over CY16-19F. Additionally, we expect CY17 to be a very good year
for PAEL where appliances sales are expected to jump 31% largely due to weak competition
– as per channel checks Dawlance’s restructuring post acquisition by Arcelik disrupted
supplies at the beginning of year. That said, we expect growth to normalize CY18 onwards.
Reforms and investments to drive Power division’s revenues
The power sector will see massive influx of investments – both in generation and
transmission & distribution (T&D) – and PAEL, being a major supplier of electrical equipment
(esp. transformers), is set to significantly elevate sales. CPEC related power projects will
trigger investment in T&D network, because the existing one is often cited as inadequate to
support greater supply. GoP focus on energy sector reforms and curbing blackouts has been
crucial, underlying this turnaround. A revival of privatization of distribution companies, akin
to K-Electric, will be the next big trigger (potentially post elections). Another key growth
area will be EPC contracting where PAEL can see increased order flows amid growing
housing and commercial projects.
Valuation & Risks
We have valued PAEL on a blend of DCF, relative P/E and relative EV/EBITDA valuations. We
have used a WACC of 12.4% and terminal growth rate of 4%. Our target price offers a
potential upside of 25%. Risks include (i) PKR depreciation, (ii) slowdown in execution of
power sector projects, (iii) stronger competition, and (iv) working capital constraints.
Demand drivers are well-entrenched; initiate with Buy
Pak Elektron Ltd
Initiation of coverage
Pak Elektron Limited
Price (PkR/sh) 96.00
TP (PkR/sh) 120.00
Stance Buy
Upside 25.0%
Fwd D/Y 3.1%
Total Return 28.1%
Bloomberg / Reuters PAEL PA / PKEL.KA
Mkt Cap (US$mn) 455.8
52wk Hi-Low (PkR/sh) 123.73/65.02
3m Avg. Daily Vol ('000 shrs) 4,490
3m Avg. Traded Val (US$mn) 4.69
PAEL - Valuation Snapshot
Key Ratios CY15A CY16A CY17F CY18F CY19F
EPS (PkR) 5.79 7.35 10.72 10.60 11.17
EPS Growth 28.5% 26.9% 45.9% -1.1% 5.4%
PER (x) 16.6 13.1 9.0 9.1 8.6
PBV (X) 2.4 1.9 1.6 1.4 1.3
DPS (PkR) 1.00 3.00 3.00 3.00 3.00
DY (%) 1.0% 3.1% 3.1% 3.1% 3.1%
ROE (%) 23.4% 21.2% 23.4% 19.9% 18.2%
EV/EBITDA (x) 10.2 9.1 7.1 6.8 6.1 Source: IMS Research
PAEL - Price Performance
1M 3M 12M FYTD CYTD
Absolute % (18.5) 2.9 47.6 (13.0) 34.7
Rel. Index % (8.6) 8.5 28.5 (10.1) 40.1
Abs. (PRs) (21.8) 2.7 31.0 (14.3) 24.7
Index Abs. (%) (9.8) (5.6) 19.1 (2.9) (5.4)
Source: IMS Research
2 | P a g e
Perspective
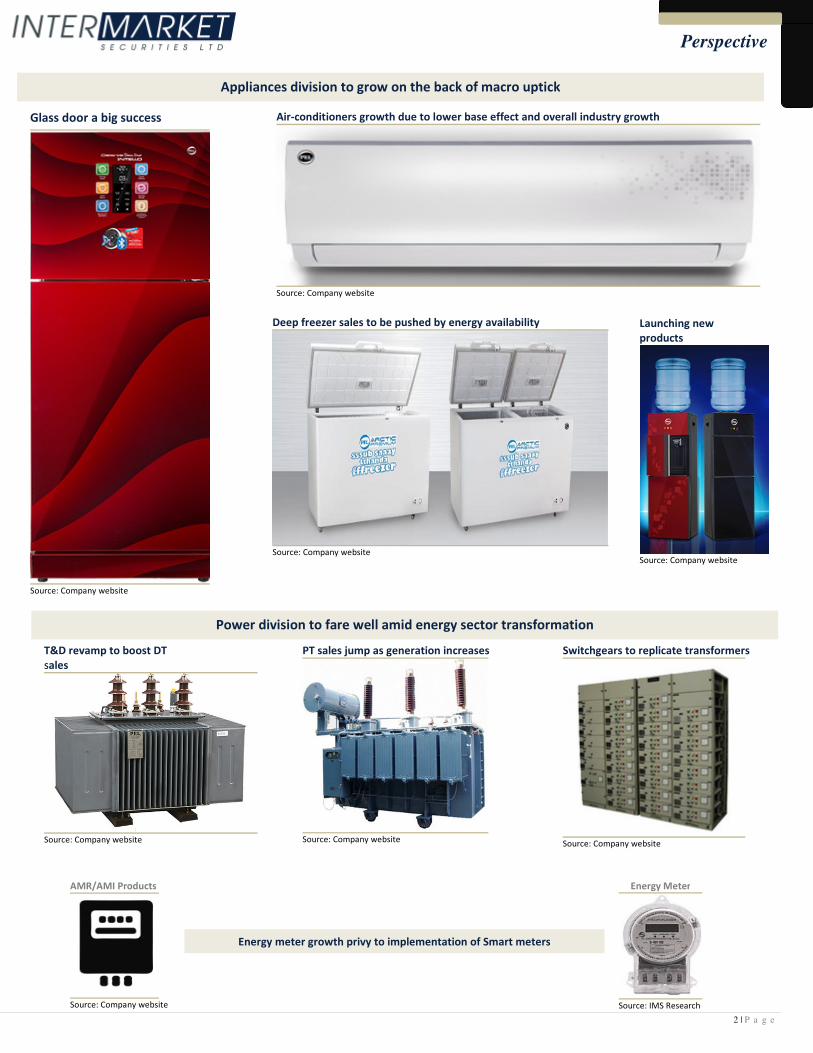
Deep freezer sales to be pushed by energy availability
Source: Company website
Glass door a big success
Source: Company website
Air-conditioners growth due to lower base effect and overall industry growth
Source: Company website
Launching new
products
Source: Company website
Appliances division to grow on the back of macro uptick
Energy meter growth privy to implementation of Smart meters
T&D revamp to boost DT
sales
Source: Company website
PT sales jump as generation increases
Source: Company website
Switchgears to replicate transformers
Source: Company website
AMR/AMI Products
Source: Company website
Energy Meter
Source: IMS Research
Power division to fare well amid energy sector transformation
3 | P a g e
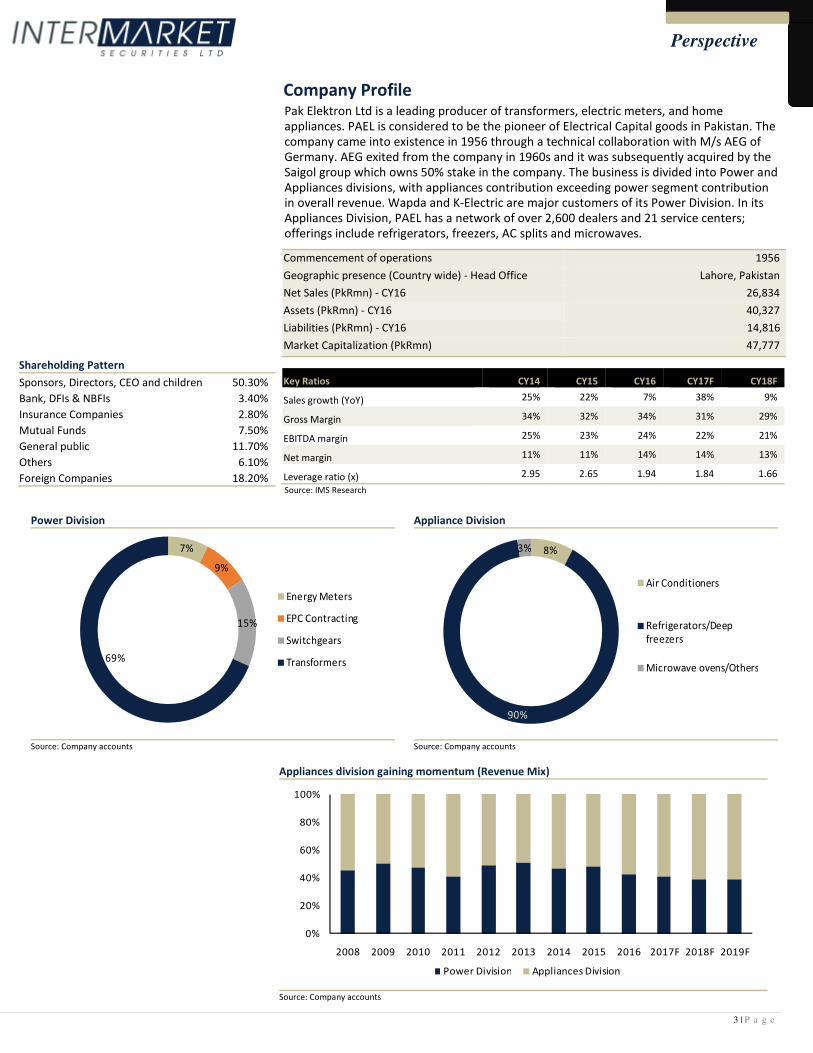
Perspective Company Profile Pak Elektron Ltd is a leading producer of transformers, electric meters, and home
appliances. PAEL is considered to be the pioneer of Electrical Capital goods in Pakistan. The
company came into existence in 1956 through a technical collaboration with M/s AEG of
Germany. AEG exited from the company in 1960s and it was subsequently acquired by the
Saigol group which owns 50% stake in the company. The business is divided into Power and
Appliances divisions, with appliances contribution exceeding power segment contribution in overall revenue. Wapda and K-Electric are major customers of its Power Division. In its
Appliances Division, PAEL has a network of over 2,600 dealers and 21 service centers;
offerings include refrigerators, freezers, AC splits and microwaves.
Shareholding Pattern
Sponsors, Directors, CEO and children 50.30%
Bank, DFIs & NBFIs 3.40%
Insurance Companies 2.80%
Mutual Funds 7.50%
General public 11.70%
Others 6.10%
Foreign Companies 18.20%
Commencement of operations 1956
Geographic presence (Country wide) - Head Office Lahore, Pakistan
Net Sales (PkRmn) - CY16 26,834
Assets (PkRmn) - CY16 40,327
Liabilities (PkRmn) - CY16 14,816
Market Capitalization (PkRmn) 47,777
Power Division
7%
9%
15%
69%
Energy Meters
EPC Contracting
Switchgears
Transformers
Source: Company accounts
Appliance Division
8%
90%
3%
Air Conditioners
Refrigerators/Deep
freezers
Microwave ovens/Others
Source: Company accounts
Appliances division gaining momentum (Revenue Mix)
0%
20%
40%
60%
80%
100%
2008 2009 2010 2011 2012 2013 2014 2015 2016 2017F 2018F 2019F
Power Division Appliances Division
Source: Company accounts
Key Ratios CY14 CY15 CY16 CY17F CY18F
Sales growth (YoY) 25% 22% 7% 38% 9%
Gross Margin 34% 32% 34% 31% 29%
EBITDA margin 25% 23% 24% 22% 21%
Net margin 11% 11% 14% 14% 13%
Leverage ratio (x) 2.95 2.65 1.94 1.84 1.66
Source: IMS Research

4 | P a g e
Perspective Topline to be pushed by a more prominent appliances segment
Favorable macros (low inflation and interest rates), turnaround in power supply, high
GDP growth, and very low penetration (40%) all support double-digit sales growth of
appliances in Pakistan. Of greatest importance is the improved energy availability in
tandem with low power tariff, which have improved economics for cooling appliances
(refrigerators, deep freezers and A/C splits) for the masses at large. In addition to
demand growth, local producers of white goods are protected from imports with a sticky
25% duty and freight advantages in case of refrigerators. In this backdrop, PAEL enjoys
26% market share in the key Refrigerator market; we expect its appliances sales to grow
at a CAGR of 18% over CY16-19F. Additionally, we expect CY17 to be a very good year for
PAEL where appliances sales are expected to jump 31 % largely due to weak competition
– as per channel checks Dawlance’s restructuring post acquisition by Arcelik disrupted
supplies at the beginning of year. That said, we expect growth to normalize CY18
onwards.
PAEL is a major player in the Appliances market PAEL is well positioned to capture the growing demand of white goods in Pakistan. It is one
of the leading manufacturers of home appliances in Pakistan, especially in refrigerators
and deep freezers. Currently, PAEL boasts a decent market share of 26%/11% in
refrigerators/deep freezers. It is also a producer of Air conditioners and Microwaves which
constitute a small portion of sales but exhibit growing demand amid rising consumerism.
PAEL’s strength lies in its widespread distribution network. The company has a total 2,600
appliances dealers' spread across the country but majorly concentrated in Punjab with
71% of the total dealers in the province. An extensive retail network is imperative in order
to penetrate the different segments especially in the case of consumer durables.
Moreover, the company places immense importance on R&D; glass-door technology and
energy saving inverter refrigerators are shining success examples of constant strive to
innovate and retain the market share in the industry.
PAEL is the second largest producer of refrigerators in Pakistan…
Dawlance
32%
PEL
26%
Haier
13%
Orient
20%
Waves
2% Others
7%
Source: Company accounts
…but has lower prominence in the Deep freezers market
PEL, 11%
Waves , 28%
Varioline, 26%
Haier, 21%
Dawlance,
11%
Others, 3%
Source: Company accounts

5 | P a g e
Perspective Energy sector woes had long delayed realizing of underlying demand Pakistan is a population of 180mn with penetration of refrigerators of about 40%
compared to over 80% in major centers of the Asia Pacific region. The chronic power
shortages of about 3000MW have delayed the true demand of appliances in rural areas as
appliances were long perceived as luxury items rather than a necessity. The insufficient
rural electrification has been a major hindrance in the penetration of white goods,
especially refrigerators and Air conditioners. Furthermore, expensive electricity (35% on
furnace oil and diesel) coupled with a period of low economic growth over the period
2007-14 hindered the demand for white goods. With the blackout-focused PML-N winning
elections in 2013 and oil prices plunge dragging power tariff along, the energy situation
has markedly improved.
What has changed? Since the PML-N government has taken the reigns, the energy availability has improved in
relative terms as generation was immediately ramped up by greater utilization of the
generation capacity. This was abetted by (i) GoP settlement of circular debt in 2013, (ii)
commencement of LNG imports, and (iii) low oil prices.
Going forward, the energy deficit will likely be bridged by a wave of new power plants (up
to 10,000MW is priority CPEC projects only), where increase in rural electrification should
improve dramatically in the next 3-5years. Power availability will improve in the wake of
heavy investments through CPEC projects, LNG supply from Qatar, and government’s focus
on reducing power outages in the run-up to elections.
PAEL - Distribution map
Source: PAEL
6 | P a g e
Perspective
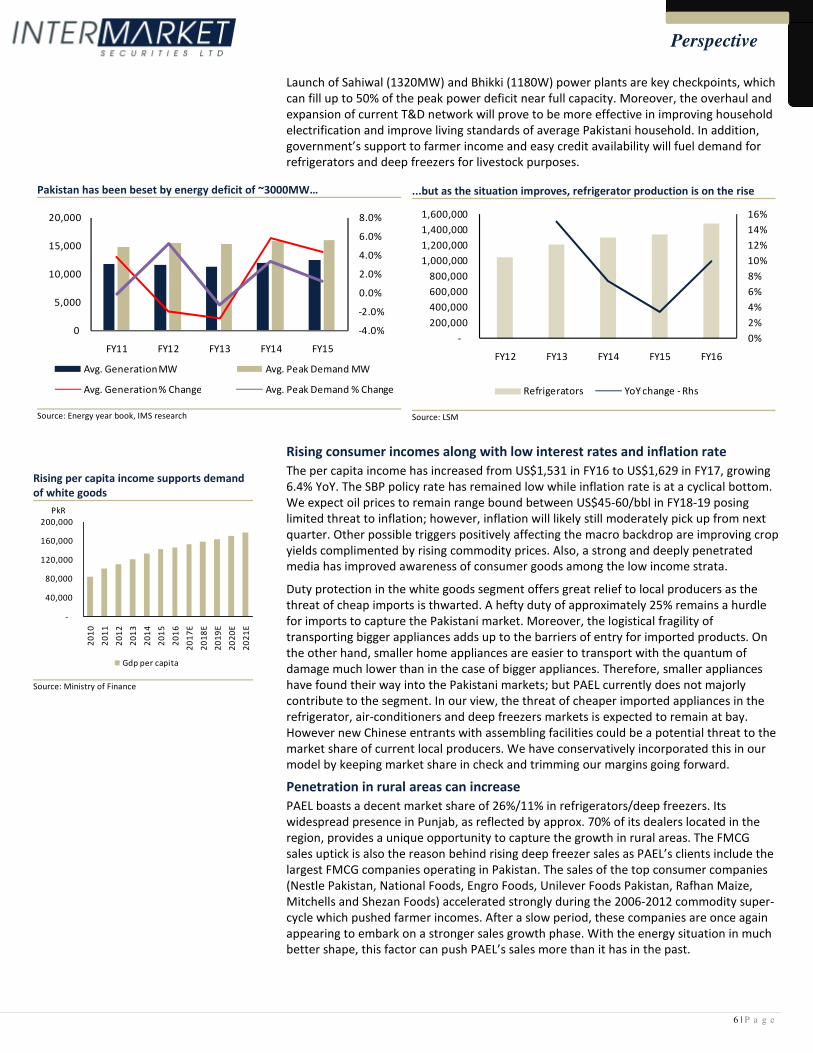
Launch of Sahiwal (1320MW) and Bhikki (1180W) power plants are key checkpoints, which
can fill up to 50% of the peak power deficit near full capacity. Moreover, the overhaul and
expansion of current T&D network will prove to be more effective in improving household
electrification and improve living standards of average Pakistani household. In addition,
government’s support to farmer income and easy credit availability will fuel demand for
refrigerators and deep freezers for livestock purposes.
Rising consumer incomes along with low interest rates and inflation rate
The per capita income has increased from US$1,531 in FY16 to US$1,629 in FY17, growing
6.4% YoY. The SBP policy rate has remained low while inflation rate is at a cyclical bottom.
We expect oil prices to remain range bound between US$45-60/bbl in FY18-19 posing
limited threat to inflation; however, inflation will likely still moderately pick up from next
quarter. Other possible triggers positively affecting the macro backdrop are improving crop
yields complimented by rising commodity prices. Also, a strong and deeply penetrated
media has improved awareness of consumer goods among the low income strata.
Duty protection in the white goods segment offers great relief to local producers as the
threat of cheap imports is thwarted. A hefty duty of approximately 25% remains a hurdle
for imports to capture the Pakistani market. Moreover, the logistical fragility of
transporting bigger appliances adds up to the barriers of entry for imported products. On
the other hand, smaller home appliances are easier to transport with the quantum of
damage much lower than in the case of bigger appliances. Therefore, smaller appliances
have found their way into the Pakistani markets; but PAEL currently does not majorly
contribute to the segment. In our view, the threat of cheaper imported appliances in the
refrigerator, air-conditioners and deep freezers markets is expected to remain at bay.
However new Chinese entrants with assembling facilities could be a potential threat to the
market share of current local producers. We have conservatively incorporated this in our
model by keeping market share in check and trimming our margins going forward.
Penetration in rural areas can increase
PAEL boasts a decent market share of 26%/11% in refrigerators/deep freezers. Its
widespread presence in Punjab, as reflected by approx. 70% of its dealers located in the
region, provides a unique opportunity to capture the growth in rural areas. The FMCG
sales uptick is also the reason behind rising deep freezer sales as PAEL’s clients include the
largest FMCG companies operating in Pakistan. The sales of the top consumer companies
(Nestle Pakistan, National Foods, Engro Foods, Unilever Foods Pakistan, Rafhan Maize,
Mitchells and Shezan Foods) accelerated strongly during the 2006-2012 commodity super-
cycle which pushed farmer incomes. After a slow period, these companies are once again
appearing to embark on a stronger sales growth phase. With the energy situation in much
better shape, this factor can push PAEL’s sales more than it has in the past.
Rising per capita income supports demand
of white goods
-
40,000
80,000
120,000
160,000
200,000
20
10
20
11
20
12
20
13
20
14
20
15
20
16
20
17
E
20
18
E
20
19
E
20
20
E
20
21
E
PkR
Gdp per capita
Source: Ministry of Finance
...but as the situation improves, refrigerator production is on the rise
0%
2%
4%
6%
8%
10%
12%
14%
16%
-
200,000
400,000
600,000
800,000
1,000,000
1,200,000
1,400,000
1,600,000
FY12 FY13 FY14 FY15 FY16
Refrigerators YoY change - Rhs
Source: LSM
Pakistan has been beset by energy deficit of ~3000MW…
-4.0%
-2.0%
0.0%
2.0%
4.0%
6.0%
8.0%
0
5,000
10,000
15,000
20,000
FY11 FY12 FY13 FY14 FY15
Avg. Generation MW Avg. Peak Demand MW
Avg. Generation % Change Avg. Peak Demand % Change
Source: Energy year book, IMS research

7 | P a g e
Perspective
Competitors in transition
PAEL’s sharp increase in sales and profitability is attributed to the temporary pruning of
market share of its biggest competitor, Dawlance. As per industry sources, Dawlance’s
market share will temporarily decline as it is recalibrating its supply chain in a post-
acquisition scenario (Dawlance was recently acquired by Turkey’s Arcelik). PAEL as the
second largest player in the refrigerator market will be in a sweet spot to capture the
market share of Dawlance. However, once Dawlance regains its market share, PAEL market
share will also normalize thereafter. PAEL tends to dominate in the smaller size
refrigerators market (7cft, 8cft) while Dawlance remains a preferred choice of customers in
the larger-size refrigerators. As a result, PAEL is able to charge higher prices than Dawlance
and others in this category; whereas Dawlance's prices tend to be higher in larger-size
refrigerators.
The market for Air-conditioners has revived
We foresee an upsurge in the overall market for air-conditioners, and PAEL will benefit in
tandem. Overall segment production grew by 21% in FY16, the highest among the home
appliances according to LSM numbers. Much of the growth is attributed to generic factors
such as improving economic backdrop but the linchpin of growth in Air-conditioners has
been the shift in lifestyle. Rural to Urban migration coupled with the growth of corporate
Pakistan has led to greater usage of Air-conditioners. Moreover, rising consumer incomes
is causing greater AC adoption than ever before.
Historically, PAEL used to be the market leader in the window AC category but the
transition from window AC to split AC diluted its advantage in that market due to influx of
imports. Since the transition, PAEL’s market share has considerably fallen while the market
Air-Conditioners prices range (PkR)
25,000 50,000 75,000 100,000 125,000 150,000
Pael
Dawlance
LG
Gree
Mitsubishi
Haier
Orient
Kenwood
PkR/Unit
Source: IMS Research
Refrigerators price ranges (PkR)
- 20,000 40,000 60,000 80,000 100,000 120,000 140,000 160,000
Dawlance
PAEL
HAIER
ORIENT
Samsung
Electrolux
Kenwood
Changhong Ruba
Waves
PkR/Unit
Source: IMS Research
Air conditioners market share
5.0%
20.0%
20.0%
15.0%
22.0%
4.0%
12.0%
2.0%
PEL
Orient
Haier
Dawlance
Digital world
Changhong
R&I
Others
Source: Company Accounts

8 | P a g e
Perspective
remains highly oligopolistic as the big-four producers capture 77% of the market. PAEL has
lagged behind mainly due to less variety in its product line while the competitors
flourished on the back of sleek designs and adoption of inverter technology much before it
was mainstream. Air-conditioners account for just 8% of PAEL’s appliances division
revenues which suggests that the company’s R&D force has been greatly applied to
refrigerators.
Nevertheless, the increase in the overall pie suggests that the company will be able to
record an impressive growth even at the same level of market share. But the slowdown at
Dawlance’s end means that PAEL will be able to push its market share in the near term. In
addition, the launch of inverter series is met with high ratings of approval and the lower
base in CY16 suggest that the category can double sales, in our view.
Others appliances to post growth via introduction of newer products Other appliances account for just 2% of PAEL’s revenues particularly given greater degree
of competition from local and international brands. Imports in this category are rife as
shipping these is more cost-effective way of transportation than in case of refrigerators.
PAEL management, however, remains upbeat in capturing a bigger market share in the
category by launching a new range of products in the home appliances category and
leveraging on its existing strong brand recognition. The company plans to launch washing
machines and water dispensers as part of its new product strategy by the end of 2017.
Expanding the product line in the small home appliances category is not very rewarding as
margins tend to be low due to high level of competition with a variety of brands competing
in the segment. The small home appliances category is extremely useful in pushing bigger
appliances by bundling the two as a retail strategy to attract a wide reception of
customers. We have conservatively increased utilization of other appliances by 1% every
year (much slower than GDP).

9 | P a g e
Perspective Reforms and investments to drive Power division’s revenues
The power sector will see massive influx of investments in next 3years – both on
generation and the transmission & distribution (T&D) fronts. PAEL, being a major
supplier of electrical equipment (esp. transformers), is set to significantly elevate sales in
this backdrop. CPEC related power projects will trigger investment in T&D network,
because the existing one is often cited as inadequate to support greater supply. GoP
focus on energy sector reforms and curbing blackouts has been crucial, underlying this
turnaround. A revival of privatization of distribution companies, akin to K-Electric, will be
the next big trigger (potentially post elections). A key growth area will be EPC
contracting (growing at 27% 5-yr CAGR) where PAEL can see increased order flows amid
growing housing and commercial projects.
PAEL well placed to play improvement in power sector For the best part of the previous decade, the power sector was heavily underinvested (esp.
on the T&D side) with the demand-supply deficit peaking at 3,000MW (1/4th of overall
demand). The period between 2009 and 2016 was mired with chronic blackouts, which
were more acute in the North of the country. The energy sector until recent years was
plagued by circular debt, expensive electricity based on import Fuel, and poor
management at the state owned distribution companies (DISCOs) with high line losses and
non-recoveries.
The PML-N government’s efforts in overhauling the energy sector has improved the
scenario where low oil prices and an IMF program also enabled better management of
cashflows. Build-up of circular debt has decelerated to an extent by directly managing the
payment discipline between fuel suppliers, power producers and distributors. The DISCOs
have thus been able to reduce line losses and improve recovery rates to a great extent.
The Ministry of Power & Water has hinted at adding up to 10,000MW of electricity to the
national grid by 2020 as per the notified list of upcoming IPPs, along with up-gradation of
existing transmission lines. The Matiari-Lahore 660 kV HVDC transmission line project is
underway with expected commissioning date by end of 2019. As a result, large investment
is going into the sector for up gradation and expansion of existing transmission lines.
Normally, demand for power transformers is realized immediately then demand for
distribution transformers follows. By international standards (also applicable in Pakistan)
for every 1MW of electricity added, about 3MW of transformers is required for
transmission. Applying this to planned power addition in FY18-21, we estimate crude
demand for 30,000 MVA of transformers due to new power plants. If PAEL maintains its
market share of 81% in power transformers, then estimated demand would be 24,300MVA
over the next four years, which is 3.5x the full capacity of producing transformers.
In our view, another impetus could be the revival of the privatization program, from which
the overhauling of DISCOs can be expected. K-Electric is a shining example of this.
However, we believe that a fresh privatization campaign will only be restarted post
elections. Nonetheless, we project transformer sales to jump in 2018 as the correlation
between transformer sales and election years is very high. It is imperative for the
government to spend more in order to curb power outages in a bid to be reelected.
PAEL is dominant in transformers market In the power transformer market, the market share is divided among only two players with
PAEL capturing as much as 80% of the demand. PAEL is the leading producer in the
distribution transformers category as well with a 40% market share. We project the
utilization of the transformers capacity to be above 80% given the anticipated demand.
Sales to WAPDA exhibit low credit worthiness which could aggravate working capital
problems but increasing sales to projects undertaken by ADB and World Bank serve as a
mitigating factor. We project sales CAGR of 10.5% for the next 3 years. Considering the
demand for transformers, PAEL will likely need to incur a Capex to expand its capacity in
order to maintain its healthy market share.
Transformer production is strong (LSM)
-
5,000
10,000
15,000
20,000
25,000
30,000
35,000
FY1
2
FY1
3
FY1
4
FY1
5
FY1
6
FY1
7T
D-M
ar
Units
Source: Ministry of finance
Demand for transformers will rise given the
GoP's focus; PAEL is the market leader in the
segment

10 | P a g e
Perspective Switchgears to follow the transformer trajectory The switchgears demand replicates the growth pattern for transformer sales. As more
housing and industrial projects keep emerging, the demand for switchgears will move in
tandem. The last 5-yr average utilization in switchgear segment was a meagre 24%.
Therefore, a surge in the demand of switchgears could easily be fulfilled by PAEL
considering it has the leading market share (25%) in the switchgear segment. We have
incorporated a modest growth of 3% in the utilization rate of switchgear capacity.
Meters The smart-metering project pushed by ADB will be the biggest impetus for PAEL’s energy
meter sales. The ADB has earmarked US$1.5bn investment over 10 years for the smart
meters and billing system projects. In the first phase, the ADB has offered US$400mn for
installing smart meters in Lahore and Islamabad electricity distribution companies.
However, the project has seen many delays. We have remained conservative in our
approach as the smart metering project could be subject to further delays given its recent
trend. Currently, PAEL holds 18% market share in the keenly contested market for meters.
PAEL’s utilization rate in the category has hovered around 74%. We project a CAGR of
approx. 9% for the next 3 years.
Engineering Procurement and Construction (EPC) The outlook for EPC segment of the power division remains optimistic due to a greater
number of housing schemes and mega construction projects like malls and new industrial
units being set-up in the country. All the above mentioned projects involve setting up of
customized grid stations and electrification. The revenue materialization of the segment is
based on the number of orders in hand. The dynamics of the project vary as the
requirements are customized and specific in nature to the client. Currently, the
management expects a healthy rise in the revenues from the sector as they have been
working on projects worth PkR 4-5 bn.
Power transformers market share
PEL
81%
HEC
19%
Source: Company accounts
Distributor transformer market share
PEL, 40%
Transfo
Power, 24%
JF
industries, 8%
Elmetec, 10%
Pan power, 7%
Source: Company accounts
Energy meters market share
PEL, 18%
Creative, 19%
Micor
Tech, 16%
KBK, 15%
Accurate, 9%
Escorts, 8%
Others, 15%
Source: Company accounts
Switchgear market share
PEL, 25%
Siddiqsons,
20%
FICO, 18%
Schneider, 16
%
Siemens, 10%
Pem
Pak, 11%
Source: Company accounts

11 | P a g e
Perspective Margins to normalize in the medium term
Over 2013-16, PAEL’S gross margins jumped 5ppt to 34%(ex-depreciation and
amortization) due to plunge in global commodity prices which the company did not pass
onto customers because of high pricing power amid strong demand for both power
equipment and appliances. This was also supported by weak competition in the Power
division (as Siemens decided to exit the market) and product development in the
Appliances division (glass-door refrigerators and inverter ACs). Also, equally importantly,
the PKR was mostly stable or depreciated only slightly after adjusting steeply in 2013.
Commodity prices remain a key determinant of PAEL’s margins. Broadly speaking, PAEL’s
margins are affected mostly by – Steel, Copper, ABS Plastics (petrochemical, derivative of
crude oil) and such inputs as compressors and transformer oil.
For oil, Bloomberg consensus estimates suggest oil prices are likely to remain low. This is
due to OPEC and Russia’s production cuts not proving completely fruitful due to rebound
in shale production. That leaves the demand side with a lot of weight to lift. Further, steel
prices staged a rebound in 2HCY16 but then followed a descending trajectory owing to a
surge in iron ore production. In addition China, the biggest producer of steel, has been
reluctant to cut steel production amid depressed demand worldwide. Steel prices will
likely remain range bound in the short term until demand recovers. Overall growth in steel
demand will remain modest because of slowdown in China, consumer of 45% of global
steel.
Since appliances segment is characterized by high competition, we assume that some
margin attrition will be inevitable in this segment, going forward. This puts PAEL’s margins
at risk, mostly from PkR depreciation. However, the only scenario which will avert margin
attrition would be that the local producers simultaneously increase prices across- the-
board on all appliances. In our view, power division gross margins will continue to sustain
at current levels but the growing contribution from the appliances division revenues
lowers the resultant impact from the division. Conventionally, margins in the appliances
division tend to be higher than margins in the power division.
Lastly, currency movement is another important determinant of the margins as 70% of the
Raw materials are imported. Steel and Compressor fittings (mostly power division) are
imported from Europe whereas ABS is imported from China. If PAEL is able to pass-on the
effect of the rupee depreciation, they will be able to maintain the current level of margins.
In our view, power division allows the company to pass-on the effect, though with lagged
effect; whereas, the pass-on in the appliance division is checked by competition. However,
due to low localization of most players in the appliances industry, they will likely increase
prices together. This is supported by the fact that while PAEL did not materially reduce
prices amid commodity down cycle, its competitors did not either. High demand period
will also keep price competition limited. Nonetheless, in our estimates gross margins may
normalize tow ards 25% in the long run, which is well below current margins of over 31%
and close to 15-years’ average.
2HCY16 rally reversed in 1HCY17
350
450
550
650
750
Jul-
16
Sep
-16
No
v-1
6
Jan
-17
Mar
-17
Ma
y-1
7
Jul-
17
HRC (US$/m.t) CRC (US$/m.t)
Source: IMS Research, Bloomberg
Rupee depreciation is a risk
60
70
80
90
100
110
120
Jan
-08
No
v-0
8
Sep
-09
Jul-
10
May
-11
Mar
-12
Feb
-13
De
c-1
3
Oc
t-1
4
Au
g-1
5
Jun
-16
May
-17
USD/PkR
USD/PkR
Source: IMS Research, Bloomberg
Gross margins to normalize
0%
5%
10%
15%
20%
25%
30%
35%
40%
2012 2013 2014 2015 2016 2017F 2018F 2019F
Source: IMS Research, Company accounts

12 | P a g e
Perspective
Further Rights issue seem unlikely in near term
PAEL is a consumer proxy as the appliances division constitutes a major portion of the revenues. The stock, however, has mostly trailed at a discount to the consumer sector average P/E. Although the company’s appliances division is directly exposed to the consumer, the sales concentrate in the 2nd Quarter and the 4th Quarter every year. The uneven distribution of revenues derails working capital management leading to liquidity crunch. PAEL has consecutively issued 3 rights in the last three years in order to control the growing illiquidity and working capital problems. The rights issue were fully subscribed at all times but raises concerns regarding the cash conversion cycle.
Date Announced Right Premium (Rs) Ex-Date Total rights issue PKR
15-Aug-13 120% 2.5 29-Aug-13 1.828bn
22-Sep-14 35% 10 9-Oct-14 2.064bn
4-Jan-16 25% 30 22-Jan-16 3.981bn
Sales registered a steep growth following the rights issue as the company was able to ramp up its production by effectively managing inventory with the additional cash flow. Sales growth coupled with higher gross margins drove profitability in the years when rights were issued. The working capital financing from rights issue enabled the company to cut its short term borrowings which led to lower than usual finance costs.
However, amid sharp sales growth, we project short-term borrowing to also jump considerably as a result. Moreover, the company has followed a deleveraging regime since the internal cash generation has relatively improved post-2013. The company has repaid 57% of the long term debt outstanding in 2013 over the course of last 3yrs, bringing Debt-to-Capital down to 37% from 69% in 2012. Therefore, short-term borrowing can easily mitigate the growing working capital issue, undermining the need for a capital call, in our view.
Working capital issues to persist but remain under-control
Cash flows have inherently remained under pressure due to PAEL’s exposure to certain factors. The company imports majority of its Raw material which increases exposure to currency risk, which has worsened over time. Moreover, company’s biggest client in the power division is WAPDA which is effectively a risky credit client given the problem of circular debt prevalent in the sector. The cash blocked in the receivables results in the working capital drain but we project a rise in the operational cash flows as the appliances segment constitutes a higher percentage of the total revenues than before. Appliances segment exhibits a relatively smaller cash cycle as bulk of the sales through PAEL’s own outlets are cash-based.
On balance, we think that the cash flow issues are likely to persist as we do not suspect any material changes in the cash conversion cycle in the near term. In addition, ex-WAPDA discos will still be the biggest buyer of power transformers and hence, we believe that the customer base would not witness a material change. On the other hand, we foresee that growing contribution from exporting income could improve the working capital issue in the future. The word from the management is that the exports are likely to follow a similar trend but the company will be seeking to increase their exports.
Working capital is still a problem
-6,000
-4,000
-2,000
0
2,000
4,000
0
5,000
10,000
15,000
20,000
25,000
30,000
35,000
40,000
2008 2009 2010 2011 2012 2013 2014 2015 2016 2017F
(PkRmn)
Working Capital Revenue Cash flow - Rhs
Source: IMS Research, Company accounts
Gradual deleveraging but STB on the rise
10%
20%
30%
40%
50%
0
2,000
4,000
6,000
8,000
20
13
20
14
20
15
20
16
20
17
F
20
18
F
(PkRmn)
Short term borrowing (Lhs)
Debt to Asset ratio Source: IMS Research, Company Accounts
13 | P a g e
Perspective
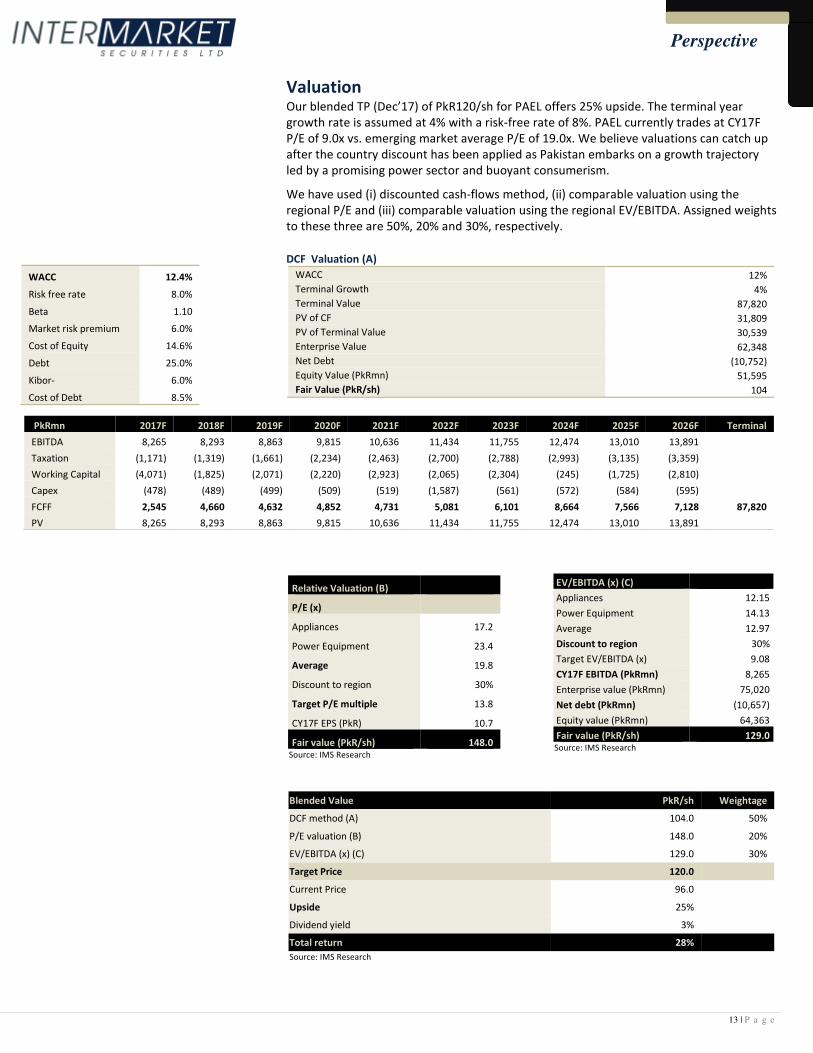
Valuation Our blended TP (Dec’17) of PkR120/sh for PAEL offers 25% upside. The terminal year
growth rate is assumed at 4% with a risk-free rate of 8%. PAEL currently trades at CY17F
P/E of 9.0x vs. emerging market average P/E of 19.0x. We believe valuations can catch up
after the country discount has been applied as Pakistan embarks on a growth trajectory
led by a promising power sector and buoyant consumerism.
We have used (i) discounted cash-flows method, (ii) comparable valuation using the
regional P/E and (iii) comparable valuation using the regional EV/EBITDA. Assigned weights
to these three are 50%, 20% and 30%, respectively.
DCF Valuation (A)
WACC 12%
Terminal Growth 4%
Terminal Value 87,820
PV of CF 31,809
PV of Terminal Value 30,539
Enterprise Value 62,348
Net Debt (10,752)
Equity Value (PkRmn) 51,595
Fair Value (PkR/sh) 104
PkRmn 2017F 2018F 2019F 2020F 2021F 2022F 2023F 2024F 2025F 2026F Terminal
EBITDA 8,265 8,293 8,863 9,815 10,636 11,434 11,755 12,474 13,010 13,891
Taxation (1,171) (1,319) (1,661) (2,234) (2,463) (2,700) (2,788) (2,993) (3,135) (3,359)
Working Capital (4,071) (1,825) (2,071) (2,220) (2,923) (2,065) (2,304) (245) (1,725) (2,810)
Capex (478) (489) (499) (509) (519) (1,587) (561) (572) (584) (595)
FCFF 2,545 4,660 4,632 4,852 4,731 5,081 6,101 8,664 7,566 7,128 87,820
PV 8,265 8,293 8,863 9,815 10,636 11,434 11,755 12,474 13,010 13,891
WACC 12.4%
Risk free rate 8.0%
Beta 1.10
Market risk premium 6.0%
Cost of Equity 14.6%
Debt 25.0%
Kibor- 6.0%
Cost of Debt 8.5%
Relative Valuation (B)
P/E (x)
Appliances 17.2
Power Equipment 23.4
Average 19.8
Discount to region 30%
Target P/E multiple 13.8
CY17F EPS (PkR) 10.7
Fair value (PkR/sh) 148.0 Source: IMS Research
EV/EBITDA (x) (C)
Appliances 12.15
Power Equipment 14.13
Average 12.97
Discount to region 30%
Target EV/EBITDA (x) 9.08
CY17F EBITDA (PkRmn) 8,265
Enterprise value (PkRmn) 75,020
Net debt (PkRmn) (10,657)
Equity value (PkRmn) 64,363
Fair value (PkR/sh) 129.0 Source: IMS Research
Blended Value PkR/sh Weightage
DCF method (A) 104.0 50%
P/E valuation (B) 148.0 20%
EV/EBITDA (x) (C) 129.0 30%
Target Price 120.0
Current Price 96.0
Upside 25%
Dividend yield 3%
Total return 28%
Source: IMS Research

14 | P a g e
Perspective
ELECTRICAL CAPITAL GOODS - REGIONAL PEERS
APPLIANCES - REGIONAL PEERS
symbol Company MkT Cap
(US$) MN
PE (x) PB (x) EV/EBITDA (x) ROE
2017F 2018F 2017F 2018F 2017F 2018F 2017F 2018F
PKEL.KA Pakistan Elektron Limited 456.0 9.0 9.1 1.6 1.4 7.1 6.8 23% 20%
002202.SZ Xinjiang Goldwind Science & Technology - H 5,761 11.6 10.6 1.8 1.6 10.4 9.1 15% 15%
BHEL.NS Bharat Heavy Electricals (BHEL) 5,130 26.9 18.7 0.9 0.9 14.5 9.9 3% 5%
601727.SS Shanghai Electric Group Company Limited - H 13,326 40.0 41.7 1.8 1.8 13.9 13.2 4% 4%
600875.SS Dongfang Electric Corporation Limited - H 3,164 n.m n.m 0.9 0.9 1.9 1.6 0% 1%
0658.HK China High Speed Transmission 1,811 11.0 10.4 1.0 0.9 7.1 7.0 9% 9%
JKS JinkoSolar Holding Co., Ltd. 634 10.2 8.8 0.6 0.6 11.3 6.8 6% 6%
3898.HK Zhuzhou CSR Times Electric Co., Ltd. 5,870 12.4 11.2 2.2 1.9 9.8 8.8 18% 17%
RLIN.NS Reliance Infrastructure Ltd 2,064 8.6 8.0 0.6 0.5 9.1 7.4 6% 6%
000400.SZ XJ Electric 2,684 15.3 13.6 2.2 1.9 11.5 10.5 14% 14%
002475.SZ Luxshare Precision Industry 9,121 30.0 24.8 4.9 4.2 22.0 16.6 15% 17%
600089.SS TBEA Co Ltd 5,551 15.1 12.8 1.5 1.3 11.9 10.6 10% 10%
600312.SS Pinggao Electric 2,834 13.7 12.0 2.0 1.8 10.9 9.9 14% 15%
600406.SS Nari Technology 6,481 26.2 22.5 4.4 2.9 22.8 19.6 17% 13%
600835.SS Shanghai Mechanical & Electrical Industry 2,926 12.8 11.8 1.8 1.6 3.6 3.3 14% 14%
601179.SS China XD 4,177 22.1 19.3 1.4 1.4 11.5 10.2 6% 7%
601222.SS Jiangsu Linyang Energy 2,000 18.8 15.2 1.6 1.4 11.0 8.7 8% 9%
HVEL.BO Havells India Ltd 4,591 43.9 36.2 8.8 7.6 27.6 22.7 20% 21%
Weighted Average
23.4 21.1 2.6 2.3 14.1 12.0 11% 11% Source: Thomson Reuters, IMS Research
symbol Company MkT Cap
(US$) MN
PE (x) PB (x) EV/EBITDA (x) ROE
2017F 2018F 2017F 2018F 2017F 2018F 2017F 2018F
PKEL.KA Pakistan Elektron Limited 456.0 9.0 9.1 1.6 1.4 7.1 6.8 23% 20%
051900.KS LG Household & Health Care Ltd 13,118 23.9 21.1 4.9 4.1 15.5 14.0 21% 19%
6752.T Panasonic (6752) 30,176 18.0 15.5 1.9 1.8 5.6 5.0 10% 11%
6753.T Sharp (6753) 17,835 56.0 37.3 5.2 4.5 16.2 14.1 8% 12%
6758.T Sony (6758) 47,360 19.7 16.6 1.8 1.6 6.0 5.4 8% 10%
GE General Electric Co. 228,475 14.5 14.9 3.2 3.1 14.3 13.8 19% 21%
ELUXb.ST Electrolux 9,419 15.6 14.3 3.9 4.4 7.9 7.5 25% 30%
000333.SZ Midea Group 39,736 15.0 13.8 3.7 3.1 13.2 11.4 23% 23%
000651.SZ Gree Electric Appliance 33,985 12.1 11.7 3.7 3.3 7.7 6.9 29% 28%
600690.SS Qingdao Haier Co., Ltd. 12,717 13.7 12.2 2.6 2.1 10.1 9.1 19% 18%
600690.SS Hisense Electric Co., 12,717 13.7 12.2 2.6 2.1 10.1 9.1 19% 18%
000100.SZ TCL Corporation 6,305 14.2 12.8 1.6 1.4 10.0 8.8 11% 11%
000921.SZ Hisense Kelon Electrical Holdings 2,818 10.9 11.6 3.3 2.7 9.5 9.3 31% 24%
1169.HK Haier Electronics Group Co., Ltd. 7,152 15.3 13.7 2.3 2.0 9.0 8.0 15% 15%
0751.HK Skyworth Digital 1,776 7.9 6.8 0.8 0.7 5.6 4.7 10% 11%
HVEL.BO Havells India Ltd 4,591 43.9 36.2 8.8 7.6 27.6 22.7 20% 21%
VOLT.BO Voltas 2,404 29.3 24.9 4.8 4.2 24.1 20.3 16% 17%
Weighted Average
17.2 15.8 3.2 2.9 12.1 11.2 18% 19%
Source: Thomson Reuters, IMS Research

15 | P a g e
Perspective
Risks
Rupee Depreciation
PAEL imports 70% of its raw materials from abroad which creates a concern whenever the
PkR comes under pressure. The concerns circling around the external account increases
the probability of the currency depreciation going forward, which means an increase in
costs may be on the cards. Margins in appliances division will be subject to minor attrition
as the effect cannot be readily passed-on due to intense price competition. Since
appliances segment will constitute a major proportion of the total revenues, margin
attrition in the segment company will be more visible than in the past. . A mitigating factor
could be low location among all appliances companies in Pakistan due to which all will
increase prices simultaneously.
Competition (Arcelik and new)
The competition in appliances industry is stiff owing to many players. With the entry of
Arcelik (leading appliances brand in Turkey with a market share of 50% in refrigerators) via
Dawlance (already a leader), enhancement of the product line and advanced technology
appliances are very likely in our view. We foresee a greater challenge for the local
companies as a leading European Brand has entered the market with greater product
variation and technology. Newer brands like Singer could potentially also hurt the PAEL’s
share in the refrigerator and deep freezer segment.
Slowdown of investment in power sector
PAEL’s growth story in the power division is reliant on heavy investment in the power
sector currently underway. Our thesis banks upon the massive investment planned for the
sector in the upcoming years. However, delays in materialization of power sector projects
could hinder the growth trajectory of this segment and could result in a potential
slowdown. PAEL’s significant chunk of transformer sales are driven by state-owned power
distribution companies.
Working Capital constraints
Working capital constraints remain a major concern given which has led to the company
issuing frequent rights in recent past. The working capital will grow considering the sales
growth projections but if the cash conversion replicates the historical trend, its
implications can potentially be slower sales (losing share to competitors), heavy leverage
subverting potential for inorganic and even a capital call. Moreover, persistent illiquidity
will also dent the sales growth assumed in our model as inventory management will be
disrupted, causing bottle-necks in the supply of goods.
16 | P a g e
Perspective
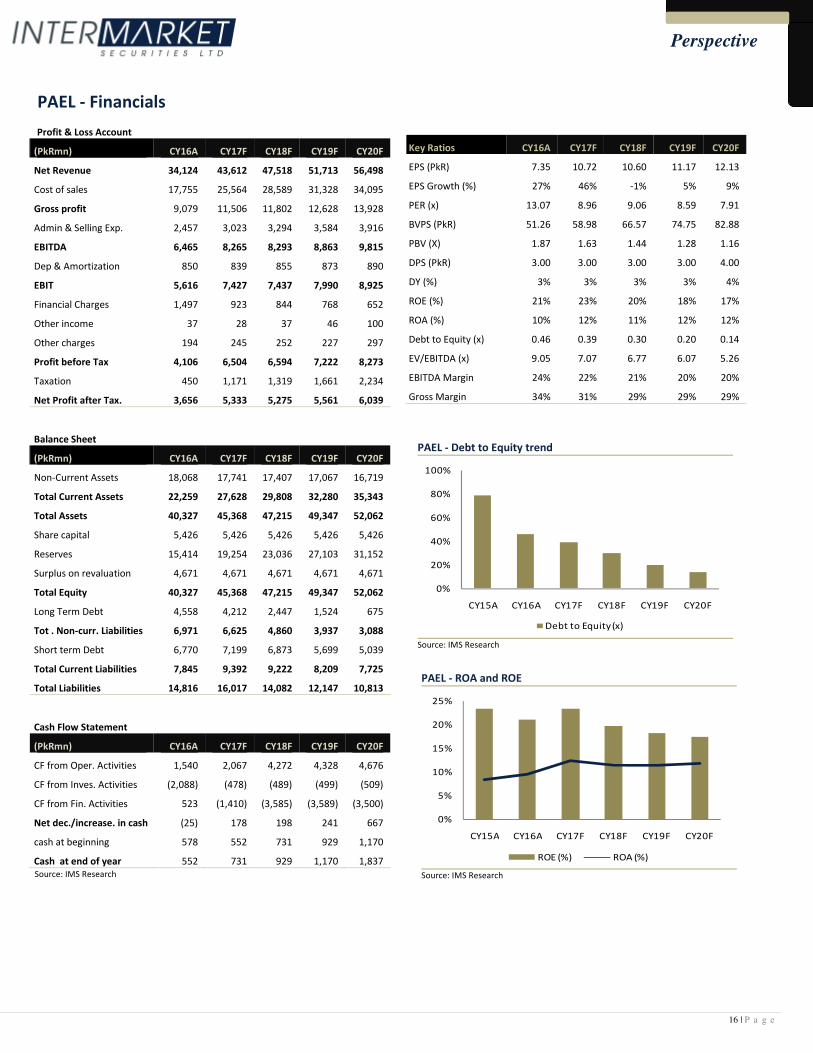
PAEL - Financials
Profit & Loss Account
(PkRmn) CY16A CY17F CY18F CY19F CY20F
Net Revenue 34,124 43,612 47,518 51,713 56,498
Cost of sales 17,755 25,564 28,589 31,328 34,095
Gross profit 9,079 11,506 11,802 12,628 13,928
Admin & Selling Exp. 2,457 3,023 3,294 3,584 3,916
EBITDA 6,465 8,265 8,293 8,863 9,815
Dep & Amortization 850 839 855 873 890
EBIT 5,616 7,427 7,437 7,990 8,925
Financial Charges 1,497 923 844 768 652
Other income 37 28 37 46 100
Other charges 194 245 252 227 297
Profit before Tax 4,106 6,504 6,594 7,222 8,273
Taxation 450 1,171 1,319 1,661 2,234
Net Profit after Tax. 3,656 5,333 5,275 5,561 6,039
Balance Sheet
(PkRmn) CY16A CY17F CY18F CY19F CY20F
Non-Current Assets 18,068 17,741 17,407 17,067 16,719
Total Current Assets 22,259 27,628 29,808 32,280 35,343
Total Assets 40,327 45,368 47,215 49,347 52,062
Share capital 5,426 5,426 5,426 5,426 5,426
Reserves 15,414 19,254 23,036 27,103 31,152
Surplus on revaluation 4,671 4,671 4,671 4,671 4,671
Total Equity 40,327 45,368 47,215 49,347 52,062
Long Term Debt 4,558 4,212 2,447 1,524 675
Tot . Non-curr. Liabilities 6,971 6,625 4,860 3,937 3,088
Short term Debt 6,770 7,199 6,873 5,699 5,039
Total Current Liabilities 7,845 9,392 9,222 8,209 7,725
Total Liabilities 14,816 16,017 14,082 12,147 10,813
Cash Flow Statement
(PkRmn) CY16A CY17F CY18F CY19F CY20F
CF from Oper. Activities 1,540 2,067 4,272 4,328 4,676
CF from Inves. Activities (2,088) (478) (489) (499) (509)
CF from Fin. Activities 523 (1,410) (3,585) (3,589) (3,500)
Net dec./increase. in cash (25) 178 198 241 667
cash at beginning 578 552 731 929 1,170
Cash at end of year 552 731 929 1,170 1,837
Source: IMS Research
Key Ratios CY16A CY17F CY18F CY19F CY20F
EPS (PkR) 7.35 10.72 10.60 11.17 12.13
EPS Growth (%) 27% 46% -1% 5% 9%
PER (x) 13.07 8.96 9.06 8.59 7.91
BVPS (PkR) 51.26 58.98 66.57 74.75 82.88
PBV (X) 1.87 1.63 1.44 1.28 1.16
DPS (PkR) 3.00 3.00 3.00 3.00 4.00
DY (%) 3% 3% 3% 3% 4%
ROE (%) 21% 23% 20% 18% 17%
ROA (%) 10% 12% 11% 12% 12%
Debt to Equity (x) 0.46 0.39 0.30 0.20 0.14
EV/EBITDA (x) 9.05 7.07 6.77 6.07 5.26
EBITDA Margin 24% 22% 21% 20% 20%
Gross Margin 34% 31% 29% 29% 29%
PAEL - Debt to Equity trend
0%
20%
40%
60%
80%
100%
CY15A CY16A CY17F CY18F CY19F CY20F
Debt to Equity (x)
Source: IMS Research
PAEL - ROA and ROE
0%
5%
10%
15%
20%
25%
CY15A CY16A CY17F CY18F CY19F CY20F
ROE (%) ROA (%)
Source: IMS Research
17 | P a g e
Perspective
I, Syed Waqas Imam, certify that the views expressed in the report reflect my personal views about the subject securities. I also certify
that no part of my compensation was, is, or will be, directly or indirectly, related to the specific recommendations made in this report.
I further certify that I do not have any beneficial holding of the specific securities that I have recommendations on in this report.
Ratings Guide* Total Return
Buy More than 15%
Neutral Between 0% - 15%
Sell Below 0% *Based on 12 month horizon unless stated otherwise in the report. Total Return is sum of any Upside/Downside (percentage
difference between the Target Price and Market Price) and Dividend Yield.
Valuation Methodology: We use multiple valuation methodologies in arriving at a Target Price including, but not limited to, Discounted
Cash Flow (DCF), Dividend Discount Model (DDM) and relative multiples based valuations.
Risks: Please refer to page 15.
Disclaimer: Intermarket Securities Limited has produced this report for private circulation only. The information, opinions and estimates
herein are not direct at, or intended for distribution to or use by, any person or entity in any jurisdiction where doing so would be
contrary to law or regulation or which would subject Intermarket Securities Limited to any additional registration or licensing
requirement within such jurisdiction. The information and statistical data herein have been obtained from sources we believe to be
reliable where such information has not been independently verified and we make no representation or warranty as to its accuracy,
completeness and correctness. This report makes use of forward looking statements that are based on assumptions made and
information currently available to us and those are subject to certain risks and uncertainties that could cause the actual results to differ
materially. No part of the compensation of the author(s) of this report is related to the specific recommendations or views contained in
this report.
This report is not a solicitation or any offer to buy or sell any of the securities mentioned herein. It is meant for information purposes
only and does not take into account the particular investment objectives, financial situation or needs of individual recipients. Before
acting on any information in this report, you should consider whether it is suitable for your particular circumstances and, if appropriate,
seek professional advice. Neither Intermarket Securities Limited nor any of its affiliates or any other person associated with the company
directly or indirectly accepts any liability whatsoever for any direct or consequential loss arising from any use of this report or the
information contained herein.
Subject to any applicable law and regulations, Intermarket Securities Limited, its affiliates or group companies or individuals connected
with Intermarket Securities Limited directly or indirectly may have used the information contained herein before publication and may
have positions in, or may from time to time purchase or sell or have a material interest in any of the securities mentioned or may
currently or in future have or have had a relationship with, or may provide investment banking, capital markets and/or other services to,
the entities mentioned herein, their advisors and/or any other connected parties.

18 | P a g e
Perspective
NOTICE TO US INVESTORS
This report was prepared, approved, published and distributed by Intermarket Securities Limited (IMS) located outside of the United
States (a “non-US Group Company”). This report is distributed in the U.S. by LXM LLP USA, a U.S. registered broker dealer, on behalf of
IMS only to major U.S. institutional investors (as defined in Rule 15a-6 under the U.S. Securities Exchange Act of 1934 (the “Exchange
Act”)) pursuant to the exemption in Rule 15a-6 and any transaction effected by a U.S. customer in the securities described in this
report must be effected through LXM LLP USA.
Neither the report nor any analyst who prepared or approved the report is subject to U.S. legal requirements or the Financial Industry
Regulatory Authority, Inc. (“FINRA”) or other regulatory requirements pertaining to research reports or research analysts. No non-US
Group Company is registered as a broker-dealer under the Exchange Act or is a member of the Financial Industry Regulatory Authority,
Inc. or any other U.S. self-regulatory organization.
Analyst Certification. Each of the analysts identified in this report certifies, with respect to the companies or securities that the
individual analyses, that (1) the views expressed in this report reflect his or her personal views about all of the subject companies and
securities and (2) no part of his or her compensation was, is or will be directly or indirectly dependent on the specific
recommendations or views expressed in this report. Please bear in mind that (i) IMS is the employer of the research analyst(s)
responsible for the content of this report and (ii) research analysts preparing this report are resident outside the United States and are
not associated persons of any US regulated broker-dealer and that therefore the analyst(s) is/are not subject to supervision by a US
broker-dealer, and are not required to satisfy the regulatory licensing requirements of FINRA or required to otherwise comply with US
rules or regulations regarding, among other things, communications with a subject company, public appearances and trading securities
held by a research analyst account.
Important US Regulatory Disclosures on Subject Companies. This material was produced by Analysis of IMS solely for information
purposes and for the use of the recipient. It is not to be reproduced under any circumstances and is not to be copied or made available
to any person other than the recipient. It is distributed in the United States of America by LXM LLP USA and elsewhere in the world by
IMS or an authorized affiliate of IMS. This document does not constitute an offer of, or an invitation by or on behalf of IMS or its
affiliates or any other company to any person, to buy or sell any security. The information contained herein has been obtained from
published information and other sources, which IMS or its Affiliates consider to be reliable. None of IMS accepts any liability or
responsibility whatsoever for the accuracy or completeness of any such information. All estimates, expressions of opinion and other
subjective judgments contained herein are made as of the date of this document. Emerging securities markets may be subject to risks
significantly higher than more established markets. In particular, the political and economic environment, company practices and
market prices and volumes may be subject to significant variations. The ability to assess such risks may also be limited due to
significantly lower information quantity and quality. By accepting this document, you agree to be bound by all the foregoing provisions.
LXM LLP USA assumes responsibility for the research reports content in regards to research distributed in the U.S. LXM LLP USA or its
affiliates has not managed or co-managed a public offering of securities for the subject company in the past 12 months, has not
received compensation for investment banking services from the subject company in the past 12 months, does not expect to receive
and does not intend to seek compensation for investment banking services from the subject company in the next 3 months. LXM LLP
USA has never owned any class of equity securities of the subject company. There are not any other actual, material conflicts of
interest of LXM LLP USA at the time of the publication of this research report. As of the publication of this report LXM LLP USA, does
not make a market in the subject securities.