Embed Size (px)
Citation preview

Supported by
Survey data compiled by
IMRG UK Consumer Home
Delivery Review 2016
The IMRG – Blackbay UK Consumer Home Delivery Review 2016 is a study of
online fulfilment requirements. As well as exploring customer satisfaction, this
documents anticipates UK consumers’ expectations and needs.

2 | www.imrg.org
Contents
1. Introduction ............................................................................................................................ 3
2. Executive summary ................................................................................................................ 4
Blackbay observes ......................................................................................................................... 6
3. Overall perception and satisfaction ......................................................................................... 7
4. Shopper motivation and behaviour....................................................................................... 10
5. Delivery destination and location .......................................................................................... 11
6. Delivery performance ........................................................................................................... 13
7. Future improvements ............................................................................................................ 15
8. Delivery information ............................................................................................................. 19
9. Alternative delivery point / click and collect solutions ...........................................................22
10. Premium services ............................................................................................................... 26
11. Signature on delivery.......................................................................................................... 28
12. Mobile devices ................................................................................................................... 29
13. Cross-border........................................................................................................................ 30
14. Returns ................................................................................................................................ 32
15. Packaging and damage ....................................................................................................... 35
16. Environmental perception................................................................................................... 37
17. Sample profile summary ..................................................................................................... 38
About the Author ..................................................................................................................... 40
About IMRG ............................................................................................................................. 40
About eDigitalResearch ........................................................................................................... 40
About Blackbay ........................................................................................................................ 41
Additional Reference Sources ................................................................................................... 41
ANNEX 1 – Full data and charts ................................................................................................ 43

3 | www.imrg.org
1. Introduction
Welcome to the IMRG UK Consumer Home Delivery Review 2016, the eighth in the series, which is once
again supported by Blackbay, the mobility solutions provider whose consistent involvement in this
survey has again allowed us to expand the scope of our work.
“Blackbay is committed to our ongoing support for the Consumer Home Delivery Review. The delivery
market is in a constant cycle of change with consumer demands increasing and the desire for transparent,
consistent and fast delivery expected as the new standard of delivery.”
Over recent years we have been careful to maintain the same structure to the survey so that we can
develop trend data and we can now offer a view over a period up to eight years for some measures, to
show how consumer perceptions and behaviours have changed and how expectations and future needs
for online delivery are evolving.
However, to keep the survey current and relevant we make minor changes to a few questions and add a
small number of new ones each year to ensure that we capture consumer opinion of more recent
developments. Where appropriate, we have noted any significant changes in methodology and context
and the trend tables and graphs also show how long each question has been included.
Each section of the report picks up a particular theme and identifies the contributing survey questions;
which have been designed to provide different perspectives on the same area to help produce the most
robust analysis. The full survey results and supporting charts can be found in annex 1 but in each section
we have identified the specific questions that cross-refer to produce our analysis and to help readers
navigate the report.
We have also sought to incorporate appropriate
parallel research from other independent sources
where this covers the same area as our own data in
order to provide ever deeper and more objective
insight.
Taking this approach, we believe we have created the
most neutral and complete insight of UK consumers’
views in the area of e-retail delivery. Details of the
additional data sources are individually referenced in
the main commentary and in footnotes.
We are pleased to report that this year the survey
base from which we have obtained our results is
consistent with last years’ survey with over 1280 adult
consumers represented. (Question 1).
We are once again grateful for the support of
eDigitalResearch (edr), part of MARU Group whose
expertise provided the means by which we were able
to reach out to UK consumers and capture the results reported here.
0
200
400
600
800
1000
1200
1400
1600
1800
2000
Households -Online Shoppers
Number ofresidents
Residents over18
Survey Base
2012/13 2013/14 2014/15 2015/16

4 | www.imrg.org
2. Executive summary
The IMRG – Blackbay UK Consumer Home Delivery Review 2016 presents an eight-year ‘deep-dive’ view
of the developing expectations and perceptions of UK shoppers and tracks what is overall a very
positive story during that period. However, as the industry meets one consumer challenge,
expectations and situations change to present others so this is an evolving landscape.
The key findings of this years’ survey are summarised below.
Overall UK shoppers are relatively satisfied with the quality of e-retail delivery and it is consistently
becoming less of a barrier to shopping online. It would seem that most shoppers are confident that
both UK and non-UK retailers will provide a good delivery service supported by the fact that the
considerable majority of orders always arrive when expected.
However, there is no room to be complacent because, as services and delivery offers improve, so too
customer’s expectations increase. The two main ongoing concerns remain:
The additional cost of delivery, often only discovered at check-out, causing basket
abandonment
The inconvenience of not being home when the delivery comes and the frustration of not being
able to anticipate delivery within a certain time frame
Clearly, if additional cost is a concern then shoppers will be reluctant to pay a premium for enhanced
delivery services and this years’ survey confirms this to be the case. For any service enhancement, the
maximum that most would be prepared to consider is £2 but in many cases the expectation is that there
will be no additional cost to the consumer.
This presents a challenge because delivery to home is still the preferred option for the majority of
shoppers but we are seeing a perceptible change with alternative delivery locations being more
frequently considered. Awareness of and developments in specific neighbour delivery, safe-place
delivery and click & collection solutions are filtering through to consumers and an increasing proportion
of our respondents have used and will use them. Retailers wishing to provide a good delivery
experience should therefore look at providing a good range of delivery options over and above simply
the speed of delivery.
However, the most important requirement for shoppers when it comes to making their online delivery
experience more convenient is to be kept informed. This starts with providing good delivery
information during the browsing stage of the shopping experience. Shoppers don’t want to look too
hard to find out when they will be able to get delivery, how much it might cost and if there are any
exceptions. This information should certainly be signposted from the home page and ideally every
product page because leaving it to check-out can easily lose the sale.
Once in transit shoppers want to be kept up to date and the two most important times for this are the
day before delivery is due and the morning of delivery, confirming the expected time window. This is
highly appreciated even if the carrier does not give the option to defer delivery to another day or divert
to another location, although when this can be done so much the better.

5 | www.imrg.org
With the rise in alternative delivery and safe-place delivery another information need has started to
emerge with almost every survey respondent confirming that they would like the carrier to be able to
confirm that their delivery instructions have been followed.
The majority of customers confirm that they would like to sign for their orders but as this is not always
possible, delivery compliance, perhaps supported by image capture, will become increasingly important
as consumers embrace ‘recipient not present’ solutions going forward.
So it appears that the UK’s e-retail industry has the ability to keep pace with the developing
expectations of UK shoppers. Most of the solutions required to meet these needs already exist and
retailers need simply to deploy them…… except in one area.
Where we do see a worrying gap developing is in the area of returns.
UK shoppers confirm for outbound deliveries:
That 68% believe a good delivery experience would encourage them to shop again with a given
retailer
AND
That 84% are satisfied with the delivery services they receive
HOWEVER
For returns, UK shoppers tell us:
That 74% consider a good returns service important when selecting the retailers, they will shop
with
YET
Only 61% are satisfied with the returns service they receive
The ability to drop off the return or have it collected are important and the solutions to enable this are
in place. However, the main thing customers want is again, information. Access to real-time tracking,
updates on the status of their return and conformation of return are all required to keep customers
happy and loyal.
The IMRG Blackbay UK Consumer Home Delivery Review 2016 confirms that we are moving in the right
direction to keep up with the ever changing needs of UK shoppers, but also that we can never slow the
pace of innovation and deployment.
6 | www.imrg.org
Blackbay observes
Over the past eight years we have seen the market continue to make improvements in delivering to
meet evolving consumer expectation. However, despite these improvements, the message is still clear
– consumers want predictability, in both delivery and in communication throughout the entire delivery
journey.
There is an ever increasing requirement to provide information and transparency of processes
throughout the physical supply chain to allow consumers to accurately anticipate delivery. Moving
items without information increases risk, adds complexity, raises costs and ultimately detracts from the
overall customer experience.
Whilst many organisations have improved when communicating information to their customers, this is
yet to be achieved as an industry standard.
Retailers and delivery companies with a commitment to customer experience are enabling consumers
to provide helpful delivery instructions, track a delivery, change a delivery time or location up until the
final minutes of delivery, deliver during a specific time slot, deliver to a safe place/neighbour and
provide assurance that the delivery has been made as required.
They are treating the customer as an individual, not an address by allowing the customer to specify
their delivery preferences as relates to their needs on an order by order basis, without suggesting that
information is a premium service offering.
This market continues to evolve, and with the arrival of new delivery players, traditional last mile
delivery methods and expectations will continue to be challenged by the consumer. However, all of this
requires investment but although the consumer is not currently prepared to pay significantly more for
delivery, accurate and efficient first time delivery drives out cost and drives in revenue to create the
necessary return on that investment.
That said, in other geographic markets where Blackbay operates, we have seen an acceptance of
paying more for delivery when the delivery experience is high and also that more consumers are
prepared to pay as awareness increases.
Only once delivery transparency
and delivery interaction is enabled
to a consistent and reliable
standard in the UK, that meets the
ever increasing expectation of
consumer will we see the levels of
efficiency and customer
satisfaction that will lead to a
sustainable delivery environment
and where there is a greater
acceptance by consumers to pay
for additional delivery services.

7 | www.imrg.org
3. Overall perception and satisfaction
The analysis in this section is supported by questions relating to UK Delivery - 2, 3, 4, 4.1, 5, 6, 8, 13
and 14. The specific data and supporting charts are provided in annex 1
We always start the survey by establishing whether shoppers are prepared to ‘trust’ online to get their
goods when and where they want them or have more faith in the physical shopping trip. Over the life of
the survey we have seen ‘delivery’ as a barrier to online shopping undergo a steady decline and this year
the trend continues.
This reinforces the belief that online delivery service performance and delivery solution enhancements
continue to drive improved consumer confidence.
Traditionally the two main reasons for shoppers not using online for a particular purchase are the
additional cost of delivery and the risk that they may miss the delivery but not being at home, so
incurring additional inconvenience and cost. Both things they might avoid by simply going to the shop
in the first place.
0.0%
10.0%
20.0%
30.0%
40.0%
50.0%
60.0%
70.0%
2008/09 2009/10 2010/11 2011/12 2012/13 2013/14 2014/15 2015/16
Do delivery concerns ever prevent you from shopping online?
Yes No Linear (Yes)
8 | www.imrg.org
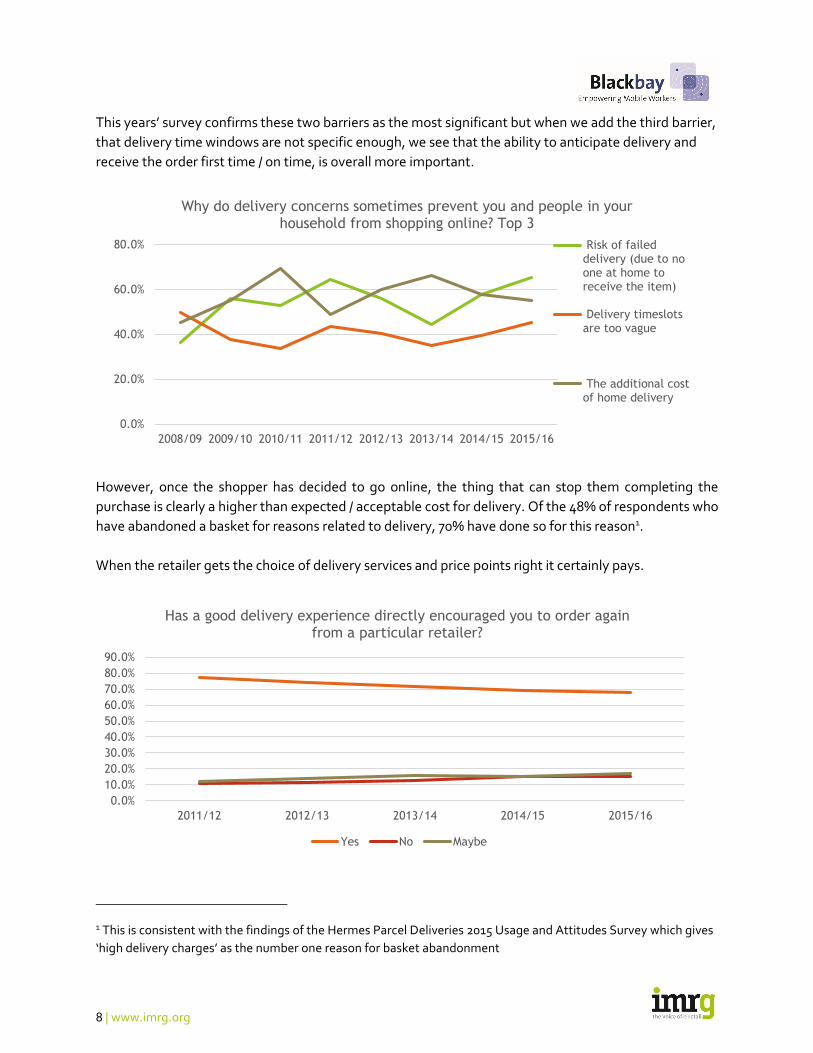
This years’ survey confirms these two barriers as the most significant but when we add the third barrier,
that delivery time windows are not specific enough, we see that the ability to anticipate delivery and
receive the order first time / on time, is overall more important.
However, once the shopper has decided to go online, the thing that can stop them completing the
purchase is clearly a higher than expected / acceptable cost for delivery. Of the 48% of respondents who
have abandoned a basket for reasons related to delivery, 70% have done so for this reason1.
When the retailer gets the choice of delivery services and price points right it certainly pays.
1 This is consistent with the findings of the Hermes Parcel Deliveries 2015 Usage and Attitudes Survey which gives
‘high delivery charges’ as the number one reason for basket abandonment
0.0%
20.0%
40.0%
60.0%
80.0%
2008/09 2009/10 2010/11 2011/12 2012/13 2013/14 2014/15 2015/16
Why do delivery concerns sometimes prevent you and people in your household from shopping online? Top 3
Risk of faileddelivery (due to noone at home toreceive the item)
Delivery timeslotsare too vague
The additional costof home delivery
0.0%
10.0%
20.0%
30.0%
40.0%
50.0%
60.0%
70.0%
80.0%
90.0%
2011/12 2012/13 2013/14 2014/15 2015/16
Has a good delivery experience directly encouraged you to order again from a particular retailer?
Yes No Maybe

9 | www.imrg.org
The survey shows that 68% of shoppers saying that a good delivery
experience; of which choice and price are part, will encourage them to
shop again with a retailer2 & 3. However, the fact that this measure is
showing a downward trend suggests that shoppers are generally
confident that most retailers will provide a good service. This
view is supported by an improving 84% satisfaction level for
outbound delivery and an 85% view that orders are generally
delivered on time / first time.
When shoppers’ delivery expectations are not met however, it
is once again ‘not at home’ and ‘had to collect’ that sit far above
all other reasons for dissatisfaction which goes to prove that
creating solutions that create a delivery coincidence for the
shopper, parcel and delivery agent remains a high priority for solutions
providers and retailers in order to keep up with customer expectations and
create an ever improving shopper experience.
2 This experience begins even before purchase. The MetaPack Delivering Consumer Choice Report 2015 advises
that 66% of its respondents (all geographic markets) have chosen one retailer over another because they provided more delivery options 3 The eDigitalResearch and IMRG Customer Behaviour Report – 2015 confirms that 66% of UK consumers feel
that delivery and returns policies will affect who they shop with online
0.0% 10.0% 20.0% 30.0% 40.0% 50.0% 60.0%
No one is home to receive / item would not fitthrough the letter box / could not be left
No one at home to receive / Signature required /could not be left
Delivery didn't arrive as advised at time of order
Online tracking and actual delivery don't match(delivery did not arrive when advised to expect)
Parcel delivered to the Post office / depot and hadto be collected
Address inaccurate / redirected
Delivery failed completely
Item was broken
Other (please specify)
All my online orders have been delivered as Iexpected
If orders have not been delivered to your expectation, what have been the most common reasons?
2015/16 2014/15

10 | www.imrg.org
4. Shopper motivation and behaviour
The analysis in this section is supported by questions:
Black Friday - 7, 7.1 and 7.2
Cost - 17.4, 28, 30, 30.1 and 30.2
Convenience – 29 and see sections 7 and 9
Speed – see section 10
The specific data and supporting charts are provided in annex 1
Black Friday
This year, for the first time we asked how shoppers were influenced by retailer promotions over the
Black Friday period.
Perhaps conditioned by the
experience of Black Friday 2014,
two-thirds of our respondents say
that they did not buy online
specifically as a result of retailers’
promotions over the same period
in 2015.
Those that did were also prepared
to wait a little longer for their
orders rather than pay a premium.
Price
Taking further the theme of pricing of delivery services, the survey continues to show that additional
premiums can be a barrier.
Not only do high delivery prices cause basket abandonment and dissuade shoppers from upgrading to
faster services during peak promotion time, we will also see that shoppers:
Are generally not prepared to pay to receive pre-delivery information
Are reluctant to pay more than £1 for a click & collect service
Will rarely pay more than £2 extra for a time-slot delivery service
Despite being in favour of environmentally friendly delivery solutions, would be unlikely to pay
much extra to use them. Perhaps £20 per year?
These pricing behaviours are covered in context in the sections that follow
Speed and convenience
The need for speed and convenience and how these drive shopper behaviour are covered fully and in
context in sections 7, 9 and 10.
87.0%
13.0%
If Yes - Were you prepared to accept an extended delivery time?
Yes No

11 | www.imrg.org
5. Delivery destination and location
The analysis in this section is supported by questions 10, 11, 12, 12.1, 12.2, 12.3 and 20. The specific
data and supporting charts are provided in annex 1.
Consistent with all previous years, Home remains the preferred delivery destination for all shoppers4
but looking deeper into the data we see some subtle yet interesting trends developing. The chart below
helps to illustrate.
4 The IPC Online Shopper Survey – January 2016 reports that on average, across 17 geographic markets (including
UK) home delivery is the preference for 75% of consumers
0.0%
10.0%
20.0%
30.0%
40.0%
50.0%
60.0%
70.0%
80.0%
90.0%
100.0%
2012/13 2013/14 2014/15 2015/16
Where do you normally have items delivered?
Home
Home – only order items that will fit through the letter box
Home – to a nominated 'safeplace' (shed, porch, locked box etc.)
Work
Friend/Relative's house (including neighbour)
Post Office ('Local Collect')
Alternative delivery location, (e.g convenience store, petrol station, locker box)
To the retailers store ('Click & Collect', 'Reserve & Collect' etc.)

12 | www.imrg.org
This shows us a slight decline in the ‘Home’ preference over the past 4 years5 offset against perceptible
increases in the preference for:
Click & collect from the retailer’s store – purple line – now 23%
Delivery to a friend / relative / neighbour – red line – now 16.5%
Third party click & collect - alternative delivery location – green line – now 14%
Over the past 4 years these service options have become more widely available and so more familiar to
and increasingly conveniently located for shoppers.
The rise in ‘neighbour’ delivery is also as a result of shoppers being able to specify more, which
neighbour will take in orders on their behalf. Two-thirds of or respondents said they would prefer to
specify exactly where the order was to be left rather than leave it to the delivery agents discretion.
The increased popularity of neighbour delivery is further evidenced by the comparison below which also
shows that this option is up on last year and that 80% would be happy for a neighbour to sign for goods
on their behalf6.
However, neighbour, safe-place or alternative location delivery should not be seen as an easy option for
delivery companies because almost unanimously, shoppers expect the delivery company to be able to
prove that they have followed the instructions provided.
5 The 2015 Hermes Parcel Deliveries Usage and Attitudes Survey reports a similar trend year-on-year:
Delivery to home (signed for) – down 4%
Delivery to home (not signed for) - down 7%
Neighbour – no change
Click & collect from retailers store – up 90%
Third party click & collect – parcel shop (up 120%), locker (up 66%) although these options start from a very low base
6 The 2015 Hermes Parcel Deliveries Usage and Attitudes Survey reports ‘parcel left with neighbour’ as the
preferred alternative delivery option if not home when delivery arrives – 39% of respondents
0.0% 5.0% 10.0% 15.0% 20.0% 25.0% 30.0% 35.0% 40.0% 45.0%
2014/15
2015/16
Preferred safe-place location Other
Alternative location – Petrol Station, Convenience store, etc.
Secure locker box at your homeaddress
Neighbour
Porch
Shed / Garage

13 | www.imrg.org
6. Delivery performance
The analysis in this section is supported by questions 13, 14, 15 and 16. The specific data and
supporting charts are provided in annex 1.
As previously explained, in excess of 85% of survey respondents believe that their online orders are
typically delivery at the first attempt and within the promised delivery timescale and this has been
consistently so for the past three years7.
The underlying reason for this consistent level of satisfaction can been demonstrated by looking at the
actual on time delivery performance of the UK’s carriers over this period.
Source: IMRG – MetaPack Delivery Index March 2016
With the exception of December 2014, when Black Friday sales disrupted the UK logistics supply chain,
the industry has maintained a high standard in this respect.
The main perceived reasons for a failed delivery are, as
indicated before - ‘no-one at home’:
The item was too big to leave / fit through the
letterbox / could not be left (no safe place) – 50%
Signature required – 46%
7 The most recent Hermes Parcel Deliveries Usage and Attitudes Survey (2015) confirms that 72% of its UK
respondents would strongly agree that the delivery services used by retailers, are improving
80.0%
82.0%
84.0%
86.0%
88.0%
90.0%
92.0%
94.0%
96.0%
Oct Nov Dec Jan Feb Mar Apr May Jun Jul Aug Sep
2013 - 2014 2014 - 2015 2015 - 2016
Year on Year Quality of Service
14 | www.imrg.org
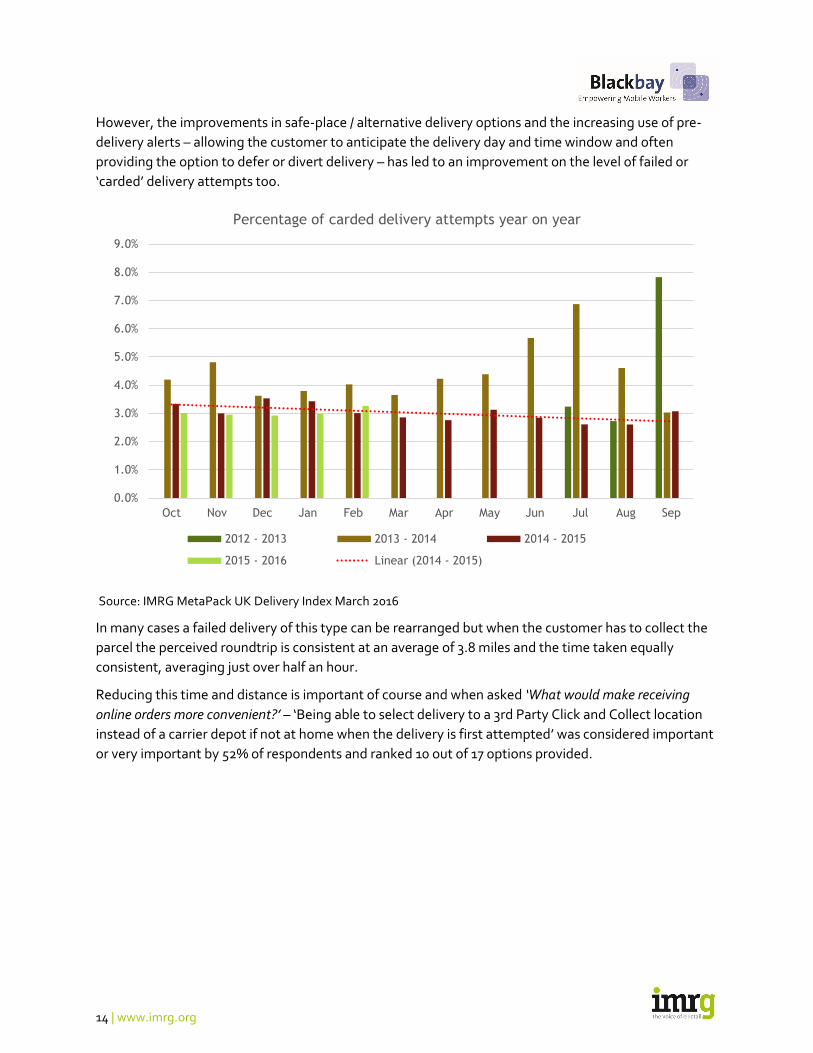
However, the improvements in safe-place / alternative delivery options and the increasing use of pre-
delivery alerts – allowing the customer to anticipate the delivery day and time window and often
providing the option to defer or divert delivery – has led to an improvement on the level of failed or
‘carded’ delivery attempts too.
Source: IMRG MetaPack UK Delivery Index March 2016
In many cases a failed delivery of this type can be rearranged but when the customer has to collect the
parcel the perceived roundtrip is consistent at an average of 3.8 miles and the time taken equally
consistent, averaging just over half an hour. Reducing this time and distance is important of course and when asked ‘What would make receiving
online orders more convenient?’ – ‘Being able to select delivery to a 3rd Party Click and Collect location
instead of a carrier depot if not at home when the delivery is first attempted’ was considered important
or very important by 52% of respondents and ranked 10 out of 17 options provided.
0.0%
1.0%
2.0%
3.0%
4.0%
5.0%
6.0%
7.0%
8.0%
9.0%
Oct Nov Dec Jan Feb Mar Apr May Jun Jul Aug Sep
Percentage of carded delivery attempts year on year
2012 - 2013 2013 - 2014 2014 - 2015
2015 - 2016 Linear (2014 - 2015)

15 | www.imrg.org
7. Future improvements
The analysis in this section is supported by questions 29, 29.1, 31 and 42. The specific data and
supporting charts are provided in annex 1.
Recognising that e-retail delivery can never meet the expectations of all shoppers all of the time, we
always seek to understand what improvements consumers would like to see, in order to make their
shopping experience more convenient and the solutions they value the most.
With eight years’ data in some cases we can also track the change in perception and use of different
solutions
Clearly the services selected by the majority of respondents as being important or very important, are
likely to have the most impact and here we consistently see the same seven options producing two
clear themes:
1. The ability to specify
2. Information
The chart below illustrates the trend for options contributing to these themes over the life of the
survey, showing those that score as ‘important’ or ‘very important’ with greater than 60% of
respondents.
0.0%
10.0%
20.0%
30.0%
40.0%
50.0%
60.0%
70.0%
80.0%
90.0%
2008/09 2009/10 2010/11 2011/12 2012/13 2013/14 2014/15 2015/16
Options scoring 60%+
Being able to add specific delivery instructions to your order
Being able to choose a specific delivery day
Being able to choose a specific delivery time slot
Clear delivery information prior to ordering
An 'in transit' SMS or e mail to advise when delivery can be expected
An 'in transit' SMS or e mail giving the ability to change the delivery day orlocation

16 | www.imrg.org
To these themes we should now add the use of alternative delivery locations because:
They are also a means of specifying an exact location and time for receiving a parcel
They provide clear time and place delivery information
They are all increasing in popularity
0.0%
10.0%
20.0%
30.0%
40.0%
50.0%
60.0%
70.0%
2008/09 2009/10 2010/11 2011/12 2012/13 2013/14 2014/15 2015/16
Alternative Delivery Options
Delivery to a ‘safeplace’ I specify when ordering (shed / garage, secure box, neighbour, etc)
Being able to select delivery to a 3rd Party Click and Collect location instead of a carrier depotif I am not at home when the delivery is first attempted?
Being able to select a 3rd Party Click and Collect location (staffed location or locker location) asyour delivery address at time of order [Previously 1st option was PUDO and 2nd was Locker]
Being able to select In Store 'Click and Collect' (delivery to the retailers local store for you tocollect) at time of order

17 | www.imrg.org
On the other hand, some more traditional specified delivery options are less in demand. Specifically,
those requiring a premium delivery charge and a decision made at the point of order, when the delivery
should be made.
0.0%
10.0%
20.0%
30.0%
40.0%
50.0%
60.0%
70.0%
80.0%
90.0%
2008/09 2009/10 2010/11 2011/12 2012/13 2013/14 2014/15 2015/16
'Premium' Delivery Options
Being able to choose a specific delivery day
Being able to choose a Saturday morning delivery option
Being able to choose a Sunday delivery option
Being able to choose an evening delivery option
Being able to choose a specific delivery time slot
Being able to choose a same day delivery within a given time limit

18 | www.imrg.org
Looking to the future it seems that UK consumers have yet to be convinced by some embryonic
delivery solutions8 & 9.
8 The 2015 Hermes Parcel Deliveries Usage and Attitudes Survey reports the appeal of new delivery innovations
for UK shoppers as:
Drones – 18% would be prepared to see drones make deliveries to remote areas
Car boot – 8% would be prepared to have delivery to their car with access allowed through a security code
9 The MetaPack Delivering Consumer Choice Report 2015 reports the appeal of new delivery innovations for
shoppers in all of the geographic markets it covered as:
Delivery by drone – 16%
Pick up at train station – 16%
Delivery to car boot – 11%
23.8%
25.6%
18.0%
15.2%
18.1%
22.8%
58.0%
56.3%
0.0% 20.0% 40.0% 60.0% 80.0% 100.0% 120.0% 140.0%
2014/15
2015/16
Looking to the future, would you be prepared to...
Have parcels deliveredby 'drone'
Have parcels deliveredto the boot of your car(at home or elsewhere)
Have parcels deliveredto a railway station foryou to collect
None of the above

19 | www.imrg.org
8. Delivery information
The analysis in this section is supported by questions 3, 9, 12.3, 17, 17.1, 17.2, 17.3, 17.4, 29 and 33.
The specific data and supporting charts are provided in annex 1.
In this section we examine the importance customers place on good delivery and returns information
both before they order and during the delivery and returns phases.
Pre-order information
Generally, the inability to find appropriate delivery information acts as a barrier to online shopping for a
relatively small and declining proportion of our survey base when compared to other issues.
The chart above suggests that retailers are improving when it comes to promoting this information in
the right place and at the right time. With returns information it is harder to say whether the trend is in
the right downward direction because we do not have as much historic data but it would be surprising if
retailers were not displaying this information in similar ways?
A positive downward trend for this measure is crucial because when asked ‘What would make receiving
online orders more convenient?’, survey respondents rate ‘clear delivery information prior’ to ordering
as important or very important and priority 3 out of 17 options offered10. In addition, a third look for
delivery and returns information even before they start to browse a web site and another third will do
before they confirm their order11.
10 The MetaPack Delivering Consumer Choice Report 2015 confirms that 79% of its UK respondents would like to
see delivery options displayed on the product page
11 The MetaPack Delivering Consumer Choice Report 2015 reports that as much as 76% across all age
demographics and geographic markets look at the retailers returns policy before they complete their order
0.0%
5.0%
10.0%
15.0%
20.0%
25.0%
2008/09 2009/10 2010/11 2011/12 2012/13 2013/14 2014/15 2015/16
Why do delivery concerns sometimes prevent you and people in your household from shopping online?
Can't easily find delivery information
Can't easily find returns information
Linear ( Can't easily find delivery information )

20 | www.imrg.org
Pre-delivery information
Once the order has been placed,
unsurprisingly a consistently
high proportion of shoppers
value being kept informed
about the progress of its
delivery.
However, perhaps the most
important thing to note is that
shoppers consider all of the
information options we
suggested as important or very
important.
As the chart below shows, this
view is consistently held over
the past few years.
This is confirmed by our question ‘What would make receiving online orders more convenient?’, with
‘access to online tracking’ and ‘an 'in transit' SMS or e mail to advise when delivery can be expected’
ranking priority 1 (of 17) and 2 (of 17) respectively in terms of being important or very important.
70.0% 72.0% 74.0% 76.0% 78.0% 80.0% 82.0% 84.0% 86.0%
Would you like to receive information about the progress of your delivery?
Yes Linear (Yes)
0.0% 20.0% 40.0% 60.0% 80.0% 100.0%
Informing you about the progress of your order
Informing the dispatch date and tracking number
Warning in advance if there is a problem / delaywith delivery
Confirming the expected delivery the day beforedelivery
Confirming the expected time (slot) when youcan expect delivery
Informing you of a failed delivery
What parts of the delivery process would you be happy to be updated on?
2015/16 2014/15 2013/14

21 | www.imrg.org
A pre-delivery alert still ranks as number 2 even without the ability to interact with the carrier and be
able to defer (to another day) or divert (to another place). However, this defer / divert option on its own
ranks 6 (of 17).
Receipt of the alert by email or SMS are equally acceptable and with 86% of our sample accessing
emails via their smartphones, virtually ubiquitous as both can support the interactive functions to defer
/ divert12.
What is interesting however, is the
timing of such messages with most
valued being ‘the day before
delivery – no time specified’ (55%)
and ‘on the morning of delivery –
time window specified’ (62%). An
update within an hour of delivery
was, in comparison seen as
important or very important by only
25% of our respondents13.
Despite the importance to the
customer of such a facility, we
should not rely on being to recover
any cost from the customer with
almost 50% refusing to consider
even a small (10p) charge.
12 One challenge for retailers and carriers wishing to provide this facility is the capture of accurate contact details.
Some shoppers will still not provide an accurate or regularly used email or mobile phone number because of
concerns about sharing personal data. An estimated 38% of online consumers claim that nothing could incentivise
them to share personal information - Informatica’s ‘The State of the Data Nation’ research – January 2016
13 This approximate priority ranking is confirmed by the 2015 Hermes Parcel Deliveries Usage and Attitudes
Survey reports where UK shoppers score, as important, real time information about the progress of delivery (83%)
above pre-advice within 1 to 2 hours of delivery (SMS – 79% and email 71%)
22 | www.imrg.org
9. Alternative delivery point / click and collect solutions
The analysis in this section is supported by questions 11, 12.1, 12.2, 12.3, 20, 22, 22.1, 23, 24, 25,
26, 27, 28, 29 and 29.1. The specific data and supporting charts are provided in Annex 1.
Additional information about click & collect can be found in the IMRG Collect+ UK Click & Collect
Review.
With 55% of our responding households reporting that there will not or may not be someone at home
to accept a delivery and with more than 80% declaring home as their preferred delivery location, there
is often a need for contingency.
When it comes to identifying the options available 53% do not have a safe-place adjacent to their home
or a trusted neighbour to rely on. Of those that do, the majority do use a neighbour (40%), a shed (23%)
or a porch (20%) and two-thirds of our responding households would prefer to be able to specify exactly
their safe-place rather than leave it to the delivery agent’s discretion.
The issue of ‘delivery compliance’ is becoming increasingly high
profile and it only takes one error to tarnish the retailer / customer
relationship or the carrier brand. A staggering 95% of our
respondents confirm that they would like the delivery company to be
able to confirm / demonstrate that they have followed the safe-place
instructions provided. Fortunately, solutions now exist to enable
retailers to have a high level of control in this area.
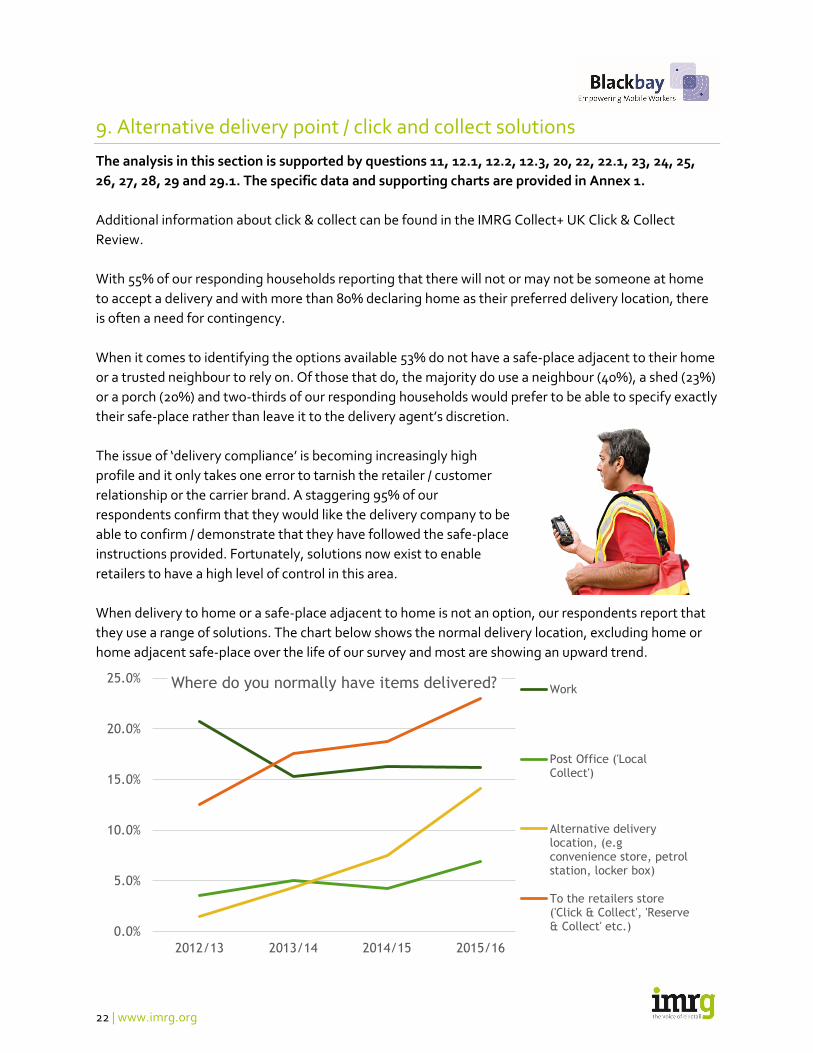
When delivery to home or a safe-place adjacent to home is not an option, our respondents report that
they use a range of solutions. The chart below shows the normal delivery location, excluding home or
home adjacent safe-place over the life of our survey and most are showing an upward trend.
0.0%
5.0%
10.0%
15.0%
20.0%
25.0%
2012/13 2013/14 2014/15 2015/16
Where do you normally have items delivered? Work
Post Office ('LocalCollect')
Alternative deliverylocation, (e.gconvenience store, petrolstation, locker box)
To the retailers store('Click & Collect', 'Reserve& Collect' etc.)

23 | www.imrg.org
The exception is Work with the increased concerns about security and facilities management causing
many employers to frown on this practice, so limiting its growth as an alternative delivery location.
In its place are the ‘in store’ and ‘third party’ click & collect solutions which 67% of our respondents have
said they have had occasion to use and a further 8% intend to do so in the future1415. Of those who
already have:
91% have used the ‘in store’ version, collecting from retailers nearest outlet
35% have collected from a convenience store, petrol station etc
Breaking this down further we can see that although the retailers store is clearly the number 1 choice,
all other options have a part to play.
14 This is consistent with the 2015 Hermes Parcel Deliveries Usage and Attitudes Survey – UK shoppers:
Aware and used – 64%
Aware and likely to use – 16%
15 This is consistent with the MetaPack Delivering Consumer Choice Report 2015 which reports that 74% of its UK
respondents have used click collect in some form
39.32%
18.93%
40.78%
21.36%
70.63%
9.22%
If you could opt for an alternative delivery address / location where would you be likely to choose?
Local newsagent
Petrol station
Convenience store
Secure locker box near to a regular route youtravel
The retailers store (Click & Collect)
Other

24 | www.imrg.org
The motivation for using the ‘in store’ option and the reasons it is most popular are revealed below.
Consistently we can see that ‘in store’ click& collect is used, not because of not being able to receive
delivery at home but because of the other main barrier to online shopping – the additional cost of home
delivery.
Shoppers recognise that the cost of their order is the product and delivery combined and that, when a
delivery charge is to be applied, avoiding this charge is the same as receiving discount. As a result,
shoppers (now taking the extra time and effort to collect their order), will not refund this discount by
way of a click & collect premium.
40% of respondents would not pay any click & collect premium at all and although 60% of respondents
might pay up to £1 extra for a no-hassle collection, as soon as this becomes £2 the figure drops to 34%.
We can also see that this collection ideally has to be combined with other high street activity – trip
chaining. Clearly shoppers recognise that the most convenient way of receiving an online order is
having it delivered to their home but when they do make the cost motivated decision to collect, the
collection location has to be in keeping with their routine.
0.0%
10.0%
20.0%
30.0%
40.0%
50.0%
60.0%
70.0%
80.0%
90.0%
100.0%
Delivery is free /cheaper than home
delivery?
You are rarely athome to receive a
home delivery?
You can examine /try on yourpurchase?
It is easier to returnand get a credit ifthe goods are not
wanted?
You are able tocombine this with
other shoppingactivity?
If you ever use in store Click & Collect / Reserve & Collect, is it because…
2012/13 2013/14 2014/15 2015/16

25 | www.imrg.org
This applies to ‘third party’ click & collect as well with most regular users of these services always using
the same place.
Most (65%) prefer a staffed location although a third have no real preference as long as it is
conveniently located and open when they pass by.
We are able to convert ‘conveniently located’ into round trip distance with 76% of respondents thinking
it is acceptable to travel up to 2 miles but a quarter would not go more than a mile out of their way.
Overall click & collect options, as a means of making the whole delivery experience more convenient
rank:
In store – 8 out of 17 options provided
Third-party – 14 out of 17 options provided
45.1%
51.8%
37.3%
29.1%
0.0%
10.0%
20.0%
30.0%
40.0%
50.0%
60.0%
2014/15 2015/16
When using a third party click and collect location (convenience store, petrol station etc), do you have a regular/preferred location?
Yes - I always use the sameone
No - I use different ones
No - I have only used thisonce / use it veryinfrequently

26 | www.imrg.org
10. Premium services
The analysis in this section is supported by questions 17.4, 28, 30, 30.1, 30.2, 48.1and 48.2. The
specific data and supporting charts are provided in annex 1.
In the context of this survey, premium services are those which the customer can choose at checkout
and which allows them to specify the delivery service they require for a particular order. Typically, this
will be a nominated day or timed service and could include assured next day or same day delivery. We
have covered click & collect and shoppers’ attitudes to it as a premium service in the previous section.
Of course sometimes retailers will offer next day delivery as a standard service, perhaps at no additional
cost (as a marketing and conversion tool), but our focus here is where the customer requires a specific
service and where there is the likelihood that a premium will be asked for.
First of all, we asked our survey group how they would rank certain delivery options without reference
to any additional charges. What would make [be important or very important] receiving online orders more
convenient? As regards to services we might consider ‘premium’ our 2016 results are, in priority order:
Being able to choose a specific delivery day – ranked 4 out of 17 options provided
Being able to choose a specific delivery time slot - ranked 5 out of 17 options provided
Being able to choose an evening delivery option - ranked 9 out of 17 options provided
Being able to choose a Saturday morning delivery option - ranked 12 out of 17 options provided
Being able to choose a same day delivery within a given time limit - ranked 15 out of 17 options
provided
Being able to choose a Sunday delivery option - ranked 16 out of 17 options provided
This ranking may provide retailers a useful guide when prioritising the additional service options they
wish to offer to their customers?
In support of this we can also provide some indication of use with the following chart.
0.0% 10.0% 20.0% 30.0% 40.0%
Same Day Delivery selected at the time ororder
Weekend Delivery selected at the time ororder
Evening Delivery selected at the time ororder
Time Slot Delivery selected at the time ororder
For some of these options, how often have you used the following? (Often or Always)
2015/16 2014/15

27 | www.imrg.org
In addition, we can
reference the actual use of
premium services from the
IMRG MetaPack UK Delivery
Index.
The chart shows the
proportion of UK delivery
volume sent by premium
services for February 2016.
This allocation does not
change significantly through
the year other than in
December where there is an
increase in the use of Next
Day services as the Christmas deadline approaches.
This allocation may show less use for time slot, weekend, same day and evening services than the
previous chart and rankings suggest but we now need to take account of the impact of premium
charges.
In this respect our research shows that there is a clear tipping point above which UK shoppers are
unwilling to go.
Using time slot delivery as an example, there is a significant fall in apparent demand as soon as the
shopper is asked to pay more than a £2 premium.
In terms of what shoppers think is an acceptable timeslot, two-thirds of respondents would accept 2
hours but for three hours the acceptance level drops to 16% suggesting that even if a customer is
prepared to pay the £2 figure, it must be in return for a 2-hour delivery window.
0.0%
20.0%
40.0%
60.0%
80.0%
100.0%
120.0%
How much would you be willing to pay to specify the time slot
Proportion preparedto pay £1 - £2
Proportion preparedto pay more than £2
Linear (Proportionprepared to paymore than £2)
0.0%
5.0%
10.0%
15.0%
20.0%
25.0%
30.0%
35.0%
40.0%
45.0%
Use of premium services as a proportion of all UK deliveries

28 | www.imrg.org
11. Signature on delivery
The analysis in this section is supported by questions 18, 19, 20 and 21. The specific data and
supporting charts are provided in annex 1.
One reason for using a premium service
might be to ensure that someone is home to
sign for the goods on arrival and it is clear
that most shoppers expect to sign for their
orders at least some of the time with only
8.3% saying that they would be generally
happy for even valuable goods to be left
without signature.
However, a proxy signature from a
neighbour is acceptable for 70% and a PIN-
based confirmation of delivery would suit 63%.
The tipping point above which a significant majority of consumers would want a signature or some
other proof of delivery is £30 where 54% have this expectation, rising to 83% at £50.
0.0% 20.0% 40.0% 60.0% 80.0% 100.0%
More than £10
More than £20
More than £30
More than £40
More than £50
More than £75
More than £100
I expect to sign regardless of value
Over what value would you expect to sign for goods -cumulative proportion
2015/16 2014/15

29 | www.imrg.org
12. Mobile devices
The analysis in this section is supported by questions 32, 33 and 34. The specific data and
supporting charts are provided in annex 1.
We have seen in section 7 that shoppers are very
keen to receive information about the progress of
their delivery and that email and SMS messaging are
the preferred routes with another 4.5% wishing to
use a smartphone app.
With 83% of respondents owning a smartphone and
86% accessing their emails on their mobile devices it
is clear that these are integral to the online delivery
process and experience.
This is consistently confirmed with the majority of
consumers expecting to see at least the same
delivery options when shopping on their mobile
devices as they would find on the retailer’s main
website.
In addition some of our respndents suggested further
enhancements they might value, the most frequently
mentioned relating to:
Real time track and trace
Real time ‘divert to neighbour’ option
Recommending parcel shop or locker locations where
the parcel could be taken if home delivery is
inconvenient
The ability to provide last minute delivery instructions
/ safe-place – perhaps with an image sent by return to
show that delivery has been made as requested
10.74%
81.25%
8.01%
If you were ordering online via your mobile, would you expect
more / different delivery options?
Yes
No
Maybe

30 | www.imrg.org
13. Cross-border
The analysis in this section is supported by questions 35, 36, 37, 38, 39, 39.1 and 40. The specific
data and supporting charts are provided in annex 1.
Additional information relating to cross-border ordering by UK consumers can be found in the E-
Commerce Worldwide UK Passport.
In the UK we recognise that we have a thriving e-retail cross-border export market with an estimated
18%16 of all orders dispatched by UK retailers going to non-UK consumers. We also have an experienced
and knowledgeable consumer base so it is no surprise that an increasing proportion of UK shoppers
have purchased online from abroad17 & 18.
The most popular sources of such orders appear to be Europe (local) and the US (English language and
popular global brands) but Asian retailers are close behind19.
16 IMRG MetaPack Delivery Index 17 The eDigitalResearch and IMRG Customer Behaviour Report – 2015 advises:
69% of UK consumers will shop cross-border to find better prices
47% of UK consumers will shop cross-border to find the product they want
56% of UK consumers do not mind where the retailer is located as long as they sell right product at the right price
18 The 2015 Hermes Parcel Deliveries Usage and Attitudes Survey reports a 5% year-on-year increase to 84% of its UK sample base 19 See annex 1 – question 37 and the 2015 Hermes Parcel Deliveries Usage and Attitudes Survey reports the top
five countries for UK shoppers as:
USA – 46%
China – 44%
Germany -22%
France – 12%
Japan – 9%
0.0%
10.0%
20.0%
30.0%
40.0%
50.0%
60.0%
70.0%
2012/13 2013/14 2014/15 2015/16
Have you ever bought goods from a ‘non UK’ web site?
Yes No Linear (Yes)
31 | www.imrg.org
This rising trend is driven by the fact that most UK shoppers have had positive experiences when buying
cross-border with almost 90% prepared to do so again and, for those who have yet to but cross-border,
35% have no problems with doing so and are likely to in the future20 & 21.
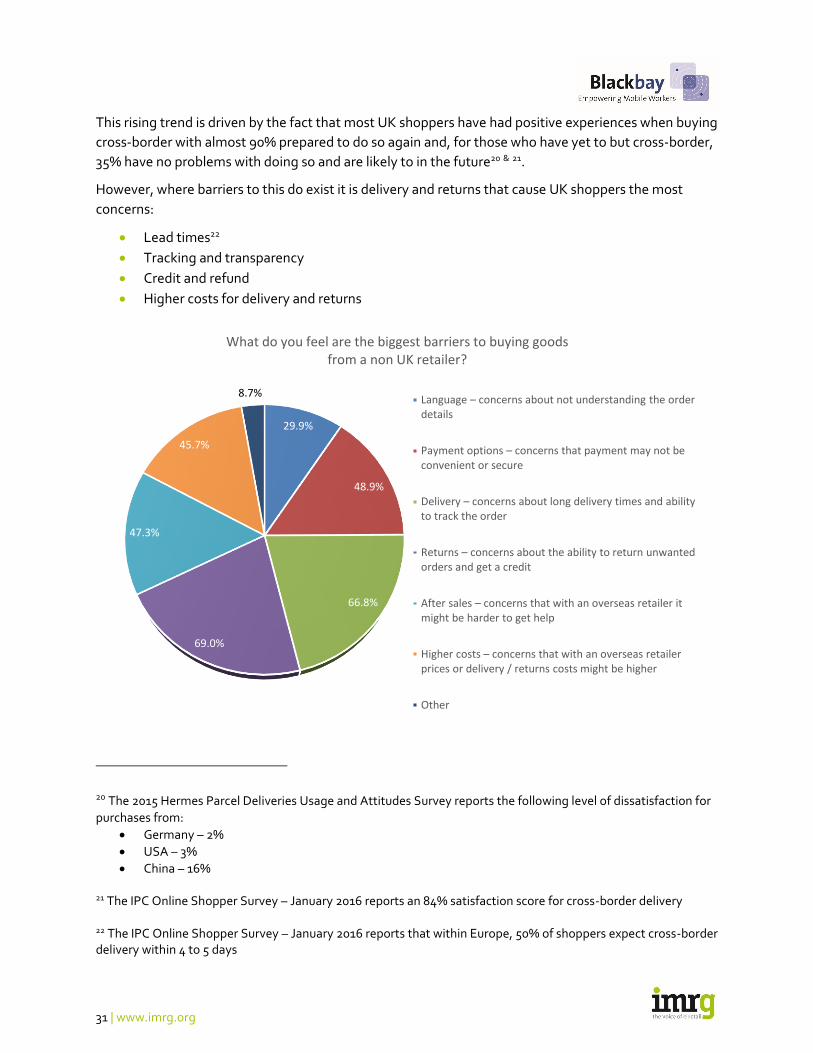
However, where barriers to this do exist it is delivery and returns that cause UK shoppers the most
concerns:
Lead times22
Tracking and transparency
Credit and refund
Higher costs for delivery and returns
20 The 2015 Hermes Parcel Deliveries Usage and Attitudes Survey reports the following level of dissatisfaction for
purchases from:
Germany – 2%
USA – 3%
China – 16%
21 The IPC Online Shopper Survey – January 2016 reports an 84% satisfaction score for cross-border delivery 22 The IPC Online Shopper Survey – January 2016 reports that within Europe, 50% of shoppers expect cross-border delivery within 4 to 5 days
29.9%
48.9%
66.8%
69.0%
47.3%
45.7%
8.7%
What do you feel are the biggest barriers to buying goods from a non UK retailer?
Language – concerns about not understanding the order details
Payment options – concerns that payment may not be convenient or secure
Delivery – concerns about long delivery times and ability to track the order
Returns – concerns about the ability to return unwanted orders and get a credit
After sales – concerns that with an overseas retailer it might be harder to get help
Higher costs – concerns that with an overseas retailer prices or delivery / returns costs might be higher
Other

32 | www.imrg.org
14. Returns
The analysis in this section is supported by questions 3, 41, 41.1, 42 and 43. The specific data and
supporting charts are provided in annex 1.
In section 3 we saw that UK shoppers are generally satisfied with the service they receive on delivery
and in the previous section we confirm that this also applies to those orders sent by non-UK retailers.
However, then it comes to returns a different picture emerges. Although three-quarters of our
respondents rate the quality of the return service as ‘important’ or ‘very important’ when selecting the
retailer23 they will shop with, satisfaction with returns does not match that of delivery.
Retailers should consider that during the returns process the customer feels they are carrying all of the
risk24:
They have paid for their order and possibly delivery
They may have had to pay or the return carriage
They do not have any goods to show for their outlay
23 The MetaPack Delivering Consumer Choice Report 2015 confirms that consistently across all ages and regions,
81% of consumers would shop more with a retailer who makes returns easier 24 The UK’s SME e-retailers recognise the importance of a good returns process. They believe it will make consumers more likely to be more satisfied with their service (49%), more likely to order in the first place (45%) and more likely to become repeat customers (40%). Royal Mail annual tracker survey into the expectations and ambitions of UK SME’s – January 2016
71.8%67.7%
61.0% 60.7%
0.0%
10.0%
20.0%
30.0%
40.0%
50.0%
60.0%
70.0%
80.0%
2012/13 2013/14 2014/15 2015/16
Overall, how happy are you with the Returns services for online shopping parcels?
Proportion ofrespondents scoring over7 where 10 is 'Extremelysatisfied'
Linear (Proportion ofrespondents scoring over7 where 10 is 'Extremelysatisfied')

33 | www.imrg.org
Until a credit or replacement has been received the customer is understandably anxious and the sooner
this anxiety is removed, the happier the customer will be and the more likely to return to shop again in
the future. This anxiety is demonstrated by the fact that UK shoppers consider that the two most
important elements in improving returns are:
Confirmation that the parcel has been safely returned
Access to real-time tracking information to show the status of the parcel
The next most important element is being able to quickly and conveniently hand the return over and
here 74% of respondents prefer to have access to a convenient drop-off point.
0% 20% 40% 60% 80% 100%
Access to a convenient drop off location
A collection service when you have to be there
A collection service where you can specify thecollection time slot
A collection service where you don't have to bethere. Goods left in a 'safe place'
Access to tracking information to confirm safe arrivalof your return
Confirmation that your return parcel has beenreceived
How important would the following aspects be in making a returns service more convenient for you?
2015/16 2014/15
0.0% 10.0% 20.0% 30.0% 40.0%
Drop the parcel off at the Post Office
Drop the parcel off at a staffed 3rd Party 'Click andCollect' location
Drop the parcel off at an unstaffed / locker 3rdParty 'Click and Collect' location
Have the parcel collected
Take the parcel directly to the retailers local store
I have no preference how I make a return
When making a return, do you prefer it when you can...
2015/16 2014/15

34 | www.imrg.org
Not surprisingly the most frequently used drop off location is the Post Office but an increasing
proportion will use a manned parcel store rather than go back to the retailer’s store although this likely
excludes returns made at the same time an order is picked up as an in-store click & collect.
The 2015 Hermes Parcel Deliveries Usage and Attitudes Survey is consistent with our findings and
confirms of its UK respondents that the locations most preferred for returns are Post Office – 46%,
parcel shop – 17%, retailer’s store – 5%. The chart below shows how the UK differs from the German
market where parcel shops are much more popular.
The fact that parcel shops are more popular for returns - than the retailer’s store which is far more
popular for collections - shows that when a return is a separate transaction, the convenience of the
handover point is all important.
We can also see that as collection services become available for returns the more popular they will
become, although demand for collected returns will depend on additional cost and whether a specified
time collection is available rather than relying on someone being home at any time of day or leaving the
goods in a safe place.
46%
17%
14%
5%
2%
44%
39%
3% 3% 3%
0%
5%
10%
15%
20%
25%
30%
35%
40%
45%
50%
Post Office Parcel store Depot Retailers store Other (inc lockers)
Location most preferred for returns
UK Germany

35 | www.imrg.org
15. Packaging and damage
The analysis in this section is supported by questions 44, 44.1, 45, 46 and 46.1. The specific data
and supporting charts are provided in annex 1.
Consumers recollection of when they have received a damaged order appears to be improving
according to the long term trend we see below and although there may have been some slippage in the
past two years, the recollection of this damage being within the past 12 months, is down from 66% last
year to 59% this year.
Retailers, supported by their packaging partners are increasingly recognising the importance of getting
packaging right in respect of:
Safe arrival and the need to replace or refund
damaged items
Materials cost
Distribution cost, especially with postal parcels
and cross-border deliveries where the format and
size of parcels can increase the cost of delivery
Brand
Customer perception and experience25
Environment
25 The 2015 Hermes Parcel Deliveries Usage and Attitudes Survey reports that 65% of its UK respondents do not
like wasteful packaging
0.0%
10.0%
20.0%
30.0%
40.0%
50.0%
60.0%
70.0%
2008/09 2009/10 2010/11 2011/12 2012/13 2013/14 2014/15 2015/16
Have you ever received an item that was damaged?
Yes No Linear (Yes)

36 | www.imrg.org
However, most of our respondents (42%) consider that the likely reason for the damage they
experienced was inappropriate packaging.
The second most perceived reason for damage was handling by the delivery agent (that being the
opinion of 40% of our respondents), which once again confirms the importance of delivery compliance
– the ability to ensure that the delivery agent takes all due care and that the carrier is able to
demonstrate this to the retailer and the retailer to the customer.
62.9%
37.9%
47.7%
23.4%
3.9%Too little
Too much
Too big for the item it contained
Too big so that it prevented the item goingthrough letterbox when it otherwise wouldhave
Other

37 | www.imrg.org
16. Environmental perception
The analysis in this section is supported by questions 47, 48, 48.1 and 48.2. The specific data and
supporting charts are provided in annex 1.
Although respondents have reported that the main perceived reasons for damage is inappropriate
packaging, the trend in the perception of this does continue to improve.
This positively contributes to consumers’ perception of ‘online’ as an environmentally positive way of
shopping. However, although this is the view of most respondents (54%) the gap between online
shopping and shopping in the high street is much reduced over the past two years, perhaps as the lines
blur with the increase in click & collect / omni-channel shopping?
Almost three-quarters of respondents would consider favouring an environmentally sustainable
delivery channel should one be available, only 30% would pay for this and the vast majority would limit
their investment to £10 per annum (63%) and only about 20% would be prepared to pay more than £20.
It would appear that if any environmentally sustainable delivery solutions are to seek consumer funding
for support, it will not be significant.
0.0%
10.0%
20.0%
30.0%
40.0%
50.0%
60.0%
70.0%
2008/09 2009/10 2010/11 2011/12 2012/13 2013/14 2014/15 2015/16
Have you ever received an item with inappropriate packaging?
Yes No Linear (No)
38 | www.imrg.org
17. Sample profile summary
The analysis in this section is supported by questions 49 to 55. The specific data and supporting
charts are provided in annex 1.
The respondent sample is consistent and within the acceptable norm of the UK population and can
therefore be considered valid both statistically and demographically. Points to note from this year’s
survey profile are as follows:
Over the life of the survey the number of single person households has risen slightly but overall,
low occupant responses (one or two person households) is consistent at about 57%
The proportion of household occupants that are adult consumers remains consistent at circa
three quarters of residents – 77% this year
The average age of respondents is consistent year-on-year at an estimated 48
The majority of respondents are women and in line with every other year at 56%
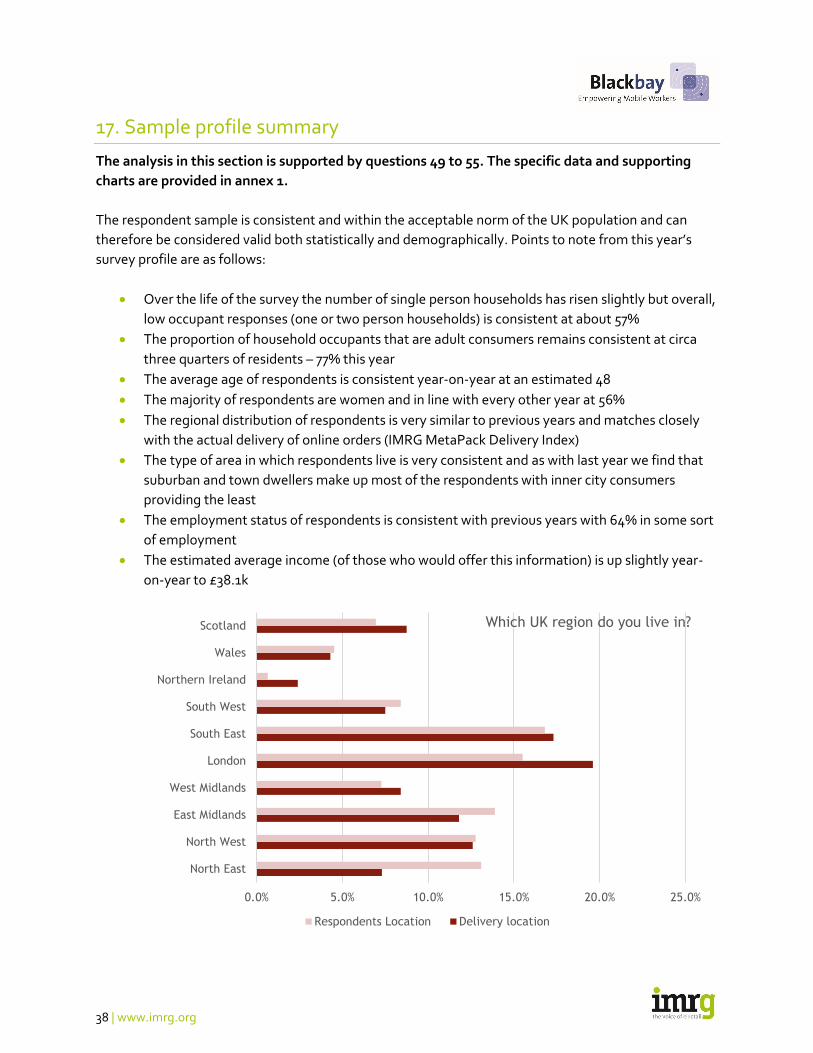
The regional distribution of respondents is very similar to previous years and matches closely
with the actual delivery of online orders (IMRG MetaPack Delivery Index)
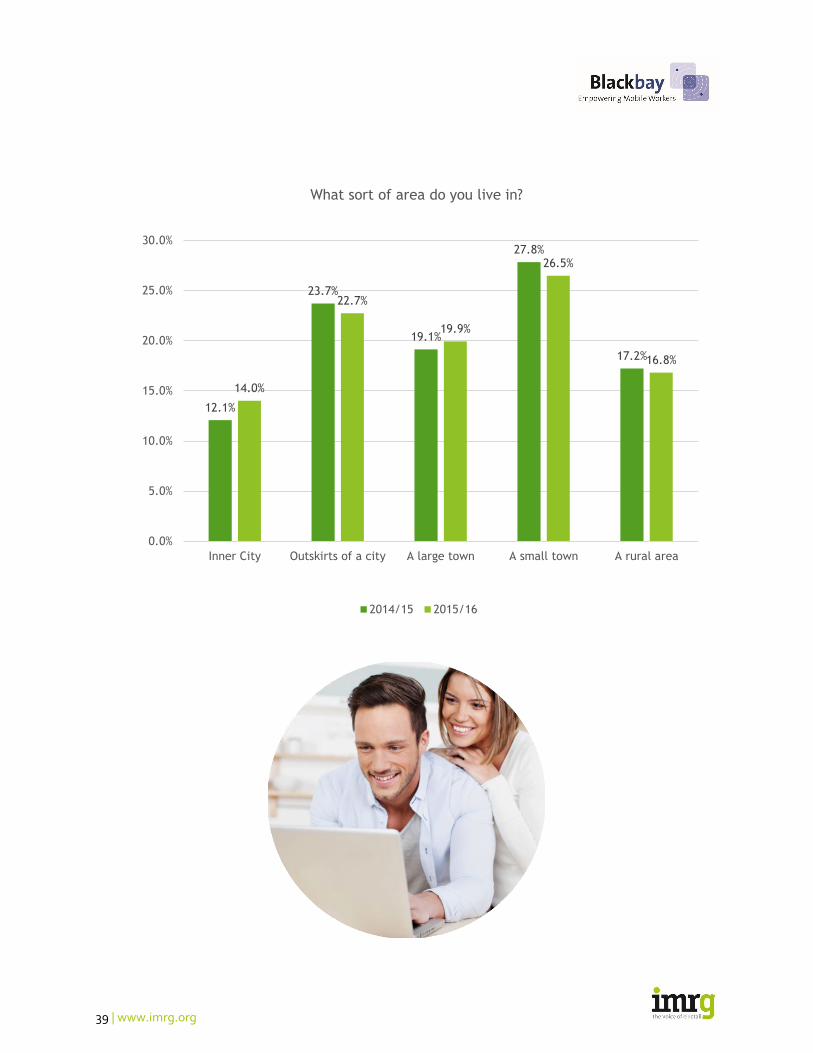
The type of area in which respondents live is very consistent and as with last year we find that
suburban and town dwellers make up most of the respondents with inner city consumers
providing the least
The employment status of respondents is consistent with previous years with 64% in some sort
of employment
The estimated average income (of those who would offer this information) is up slightly year-
on-year to £38.1k
0.0% 5.0% 10.0% 15.0% 20.0% 25.0%
North East
North West
East Midlands
West Midlands
London
South East
South West
Northern Ireland
Wales
Scotland Which UK region do you live in?
Respondents Location Delivery location
39 | www.imrg.org
12.1%
23.7%
19.1%
27.8%
17.2%
14.0%
22.7%
19.9%
26.5%
16.8%
0.0%
5.0%
10.0%
15.0%
20.0%
25.0%
30.0%
Inner City Outskirts of a city A large town A small town A rural area
What sort of area do you live in?
2014/15 2015/16

40 | www.imrg.org
About the Author
Andrew is retained by IMRG as its head of e-logistics to run its e-retail delivery
and logistics programme for the benefit of all IMRG members. He is also the
founder of the strategic e-retail and postal consultancy Spiral4… and has a
unique background in the in the world of parcels, packets and postal logistics
with over 35 years’ experience gained from the commercial sector and the
regulatory environment.
He is a member of the Chartered Institute of Logistics and Transport and the
Institute of Direct Marketing and is a recognised expert on the UK postal and e-
retail home delivery markets. He can be contacted at
[email protected] or [email protected].
About IMRG
For over 20 years, IMRG (Interactive Media in Retail Group) has been the voice of
e-retail in the UK. We are a membership community comprising businesses of all
sizes – multichannel and pure-play, SME and multinational, and solution
providers to industry.
We support our members through a range of activities – including market tracking and insight,
benchmarking and best practice sharing. Our indexes provide in-depth intelligence on online sales,
mobile sales, delivery trends and over 40 additional KPIs.
Our goal is to ensure our members have the information and resources they need to succeed in rapidly-
evolving markets – both domestically and internationally.
About eDigitalResearch
At eDigitalResearch (edr), we empower business decisions through
customer insight. By combining our proprietary SaaS technology with
focused insight and thought leadership, we’re able to provide a truly unique solution – from real-time
closed-loop customer feedback to Panels and Communities.
We’re world leaders in Voice of the Customer programmes and a proud part of MARU Group – a
technology enabled professional services firm delivering information and insight. As part of MARU,
we’re pioneering technology focused feedback and combining with deep thinking and an emphasis on
actionable outputs for organisations.
MARU Group is an international insights pioneer with technology firmly at its heart. We’re growing –
and as maru/edr, we’re delivering on our client promise of fast and strategic customer feedback.

41 | www.imrg.org
About Blackbay
Blackbay delivers business transformation through innovative mobility solutions in the courier, express and parcel
markets. The company has significant experience in this market, solutions to a growing list of premium clients
including Australia Post, DHL, APC Overnight, Fastway, Staples, Office Depot, Toll and many more.
Blackbay currently supports over 150,000 mobile workers and manages in excess of 6,000,000 deliveries per day.
Its strength is in delivering last-mile mobility solutions that enable organisations to improve the delivery
experience for consumers through real-time track and trace and delivery process management.
Blackbay’s mobility platform combines unparalleled logistics expertise with extensive experience in developing
and deploying mobile solutions to provide a platform that ensures efficient and quick development, and the
flexibility to adapt to customer’s specific business processes and mobility needs.
The platform utilises an extensive library of processes and features enabling organisations to create their own
applications including configuration of screens, process flows and logic. The platform is mobile OS agnostic
ensuring configured applications have platform specific UI for iOS, Android and Windows Phone.
The company’s configurable flagship solution for T&L organisations, powered by the platform, delivers a
comprehensive proof of delivery (PoD) and tracking solution that enables transport and logistics (T&L)
organisations to improve efficiency, reduce cost, drive new revenues and increase customer satisfaction.
Drivers and depot workers are able to react to customer needs as they occur, while constantly keeping
operations, management and customers informed with real- time updates on the performance of drivers,
vehicles and progress of pick-ups and deliveries for recipients.
Among the solution benefits, the platform also enables:
Faster time to market with configurable framework
Seamless integration with 3rd Party systems in the logistics market
Increased control and ability to adapt to market demands
Ability to leverage proven industry expertise in Transport and Logistics market
Flexible deployments in the cloud or on premise
Blackbay has enabled customers to derive the
following benefits:
65 minutes saved per driver per day, the equivalent of 6,500 hours per annum
Successful 1st time delivery rate of 98.9% saving £0.70 per parcel
€3 additional revenue received per survey at the doorstep
In respect of the findings within the IMRG UK Consumer Home Delivery Review, Blackbay supports a number of
solutions to improve delivery performance and consumer satisfaction and perceptions:
For more information, visit: www.blackbay.com or follow Blackbay on Twitter @BlackbayLtd

42 | www.imrg.org
Additional Reference Sources
Hermes Parcel Deliveries 2015 Usage and Attitudes Survey – 2070 UK consumer interviews –
July / August 2015
IPC Online Shopper Survey – January 2016 – 4075 respondents – 17 countries – September /
October 2015
MetaPack Delivery Consumer Choice – 2015 – survey of 3,000 adult consumers – UK, US,
France, Germany, Spain, Netherlands
eDigitalResearch and IMRG Customer Behaviour Report – 2015 – 2000 UK consumers
IMRG – Collect+ Click & Collect Review 2016
IMRG - MetaPack Delivery Index
43 | www.imrg.org
ANNEX 1 – Full data and charts
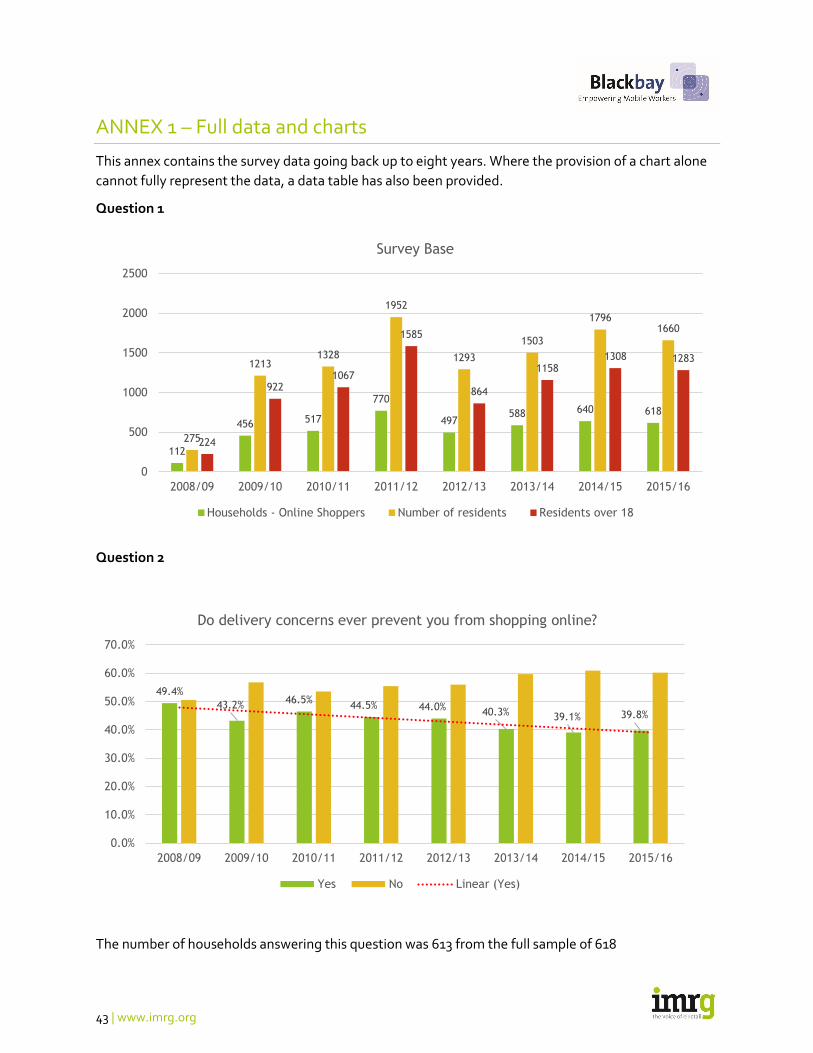
This annex contains the survey data going back up to eight years. Where the provision of a chart alone
cannot fully represent the data, a data table has also been provided.
Question 1
Question 2
The number of households answering this question was 613 from the full sample of 618
112
456 517
770
497588 640 618
275
12131328
1952
1293
1503
17961660
224
9221067
1585
864
11581308 1283
0
500
1000
1500
2000
2500
2008/09 2009/10 2010/11 2011/12 2012/13 2013/14 2014/15 2015/16
Survey Base
Households - Online Shoppers Number of residents Residents over 18
49.4%
43.2%46.5%
44.5% 44.0%40.3% 39.1% 39.8%
0.0%
10.0%
20.0%
30.0%
40.0%
50.0%
60.0%
70.0%
2008/09 2009/10 2010/11 2011/12 2012/13 2013/14 2014/15 2015/16
Do delivery concerns ever prevent you from shopping online?
Yes No Linear (Yes)

44 | www.imrg.org
Question 3
0.0% 20.0% 40.0% 60.0% 80.0%
Risk of failed delivery (due to no one at hometo receive the item)
No convenient delivery option available
Delivery is too slow
Delivery timeslots are too vague
The risk that goods may not arrive on time
The additional cost of home delivery
Can't easily find delivery information
Can't easily find returns information
Delivery is limited to the cardholder's address
Order acceptance cut off time (i.e. Orderbefore 2pm for delivery)
The risk and possible inconvenience of havingto return the order
Other (Please specify)
Why do delivery concerns sometimes prevent you and people in your household from shopping online?
2015/16
2014/15
2013/14
2012/13
2011/12
2010/11
2009/10
2008/09

45 | www.imrg.org
3. Why do delivery concerns sometimes prevent you and people in your household from shopping online? 20
08
/09
200
9/1
0
2010
/11
2011
/12
2012
/13
2013
/14
2014
/15
2015
/16
Risk of failed delivery (due to no one at home to receive the item)
36.4%
56.3%
53.0%
64.2%
56.2%
44.4%
58.0%
65.2%
No convenient delivery option available 45.5
% 40.3
% 35.3
% 36.4
% 39.5
% 41.0
% 34.0
% 41.0
%
Delivery is too slow 29.6
% 29.7
% 38.4
% 27.6
% 35.2
% 38.5
% 32.0
% 33.6
%
Delivery timeslots are too vague 50.0
% 37.5
% 33.6
% 43.3
% 40.5
% 35.1
% 39.6
% 45.5
%
The risk that goods may not arrive on time
43.2%
39.6%
46.6%
42.7%
46.7%
37.0%
28.8%
40.2%
The additional cost of home delivery 45.5
% 55.2
% 69.3
% 48.8
% 60.0
% 66.1
% 57.6
% 55.3
%
Can't easily find delivery information 18.2
% 13.5
% 14.2
% 12.4
% 17.1%
21.1%
7.6% 11.5
%
Can't easily find returns information 23.6
% 12.0
% 17.2
%
Delivery is limited to the cardholder's address
27.3%
20.8%
17.7% 20.3
% 16.7
% 16.5
% 10.4
% 16.4
%
Order acceptance cut off time (i.e. Order before 2pm for delivery)
9.1% 9.9% 9.5% 8.2% 7.6% 6.5% 7.2% 8.2%
The risk and possible inconvenience of having to return the order
28.3
% 41.2
% 34.8
%
Other (Please specify) 6.0% 9.7% 9.5% 5.9% 4.4% 7.4%
The number of households answering this question was 244 from the full sample of 618

46 | www.imrg.org
Question 4
The number of households answering this question was 612 from the full sample of 618
Question 4.1
The number of households answering this question was 293 from the full sample of 618
46.2% 43.0% 47.9%
53.8% 57.0% 52.1%
0.0%
20.0%
40.0%
60.0%
80.0%
100.0%
120.0%
2013/14 2014/15 2015/16
Have you or people in your household ever abandoned an online purchase at the check-out stage specifically because of delivery
concerns or issues?
No
Yes
27.0% 25.5% 76.6% 13.9% 6.9%
37.2% 27.3% 70.3% 14.7% 6.5%
0%
10%
20%
30%
40%
50%
60%
70%
80%
90%
100%
No convenientdelivery option
available
Deliverytimeslots are too
vague
The additionalcost of delivery
Delivery islimited to thecardholder's
address
Other (Pleasespecify)
Why have you or people in your household ever abandoned an online purchase at the check-out stage because of delivery
concerns or issues?
2015/16
2014/15

47 | www.imrg.org
Question 5
The number of households answering this question was 617 from the full sample of 618
Question 6
The number of households answering this question was 618 from the full sample of 618
77.4%
74.1%
71.9%
69.4%
67.75%
10.5%
11.7%
12.4%
15.3%
14.91%
12.1%
14.2%
15.6%
15.3%
17.34%
0.0% 20.0% 40.0% 60.0% 80.0% 100.0% 120.0%
2011/12
2012/13
2013/14
2014/15
2015/16
Has a good delivery experience directly encouraged you to order again from a particular retailer?
Yes No Maybe
18.1%
35.4%
35.9%
34.5%
26.8%
29.4%
68.6%
47.1%
44.3%
45.4%
55.6%
51.8%
13.3%
17.5%
19.7%
20.1%
17.6%
18.8%
0.0% 10.0% 20.0% 30.0% 40.0% 50.0% 60.0% 70.0% 80.0% 90.0% 100.0%
2010/11
2011/12
2012/13
2013/14
2014/15
2015/16
Has a customer review about a company's delivery service influenced your choice of retailer?
Yes
No
Maybe

48 | www.imrg.org
Question 7
The number of households answering this question was 617 from the full sample of 618
Question 7.1
The number of households answering this question was 216 from the full sample of 618
35.2%
64.8%
Have you or anyone in your household made an online purchase specifically as a result of a Black Friday discount?
Yes No
87.0%
13.0%
If Yes - Were you prepared to accept an extended delivery time?
Yes No

49 | www.imrg.org
Question 7.2
The number of households answering this question was 28 from the full sample of 618
Question 8
The number of households answering this question was 613 from the full sample of 618
71.0%
82.1%86.8%
83.7% 82.8% 82.1% 82.0% 84.0%
0.0%
20.0%
40.0%
60.0%
80.0%
100.0%
Overall, how satisfied are you with the delivery of your online shopping items?
Percentage ofrespondentsscoring 7 andabove
21.4%
78.6%
If No - Were you prepared to pay an additional delivery premium to get your purchase more quickly?
Yes No

50 | www.imrg.org
Question 9
The number of households answering this question was 616 from the full sample of 618
0.0% 10.0% 20.0% 30.0% 40.0% 50.0% 60.0%
Before you start shopping
After you have addedproducts to your
shopping cart
You don't – you just go to checkout and then see
what delivery options are offered
When do you look for (expect to see) delivery information?
2015/16 2014/15 2013/14 2012/13 2011/12 2010/11 2009/10 2008/09

51 | www.imrg.org
Question 10
The number of households answering this question was 612 from the full sample of 618
Yes No Some days 'No' or 'Some days'
2009/10 45.1% 17.5% 37.4% 54.9%
2010/11 44.7% 18.6% 36.7% 55.3%
2011/12 44.5% 21.3% 34.2% 55.5%
2012/13 46.4% 18.0% 35.6% 53.6%
2013/14 50.3% 15.1% 34.6% 49.7%
2014/15 51.3% 14.2% 34.5% 48.7%
2015/16 44.9% 18.3% 36.8% 55.1%
0.0%
10.0%
20.0%
30.0%
40.0%
50.0%
60.0%Is there normally someone at home to receive deliveries during normal
working / delivery hours?

52 | www.imrg.org
Question 11
The number of households answering this question was 618 from the full sample of 618
0.0% 20.0% 40.0% 60.0% 80.0% 100.0%
Home
Home – only order items that will fit through the
letter box
Home – to a nominated 'safeplace' (shed, porch,
locked box etc.)
Work
Friend/Relative's house(including neighbour)
Post Office ('LocalCollect')
Alternative deliverylocation, (e.g
convenience store,…
To the retailers store('Click & Collect',
'Reserve & Collect' etc.)
A range of the above
Other (please specify)
Where do you normally have items delivered?
2015/16
2014/15
2013/14
2012/13
2011/12
2010/11
2009/10
2008/09
89.3%
86.1%84.8%
79.5%
83.9%
87.3%
84.4%
80.6%
74.0%
76.0%
78.0%
80.0%
82.0%
84.0%
86.0%
88.0%
90.0%
2008/09 2009/10 2010/11 2011/12 2012/13 2013/14 2014/15 2015/16
Home as the normal delivery location

53 | www.imrg.org
Question 12
The number of households answering this question was …. from the full sample of 618
Question 12.1
The number of households answering this question was 288 from the full sample of 618
48.9%
52.3%
49.6%
51.0%
52.7%
48.3% 48.4%
53.0%
42.0%
44.0%
46.0%
48.0%
50.0%
52.0%
54.0%
2008/09 2009/10 2010/11 2011/12 2012/13 2013/14 2014/15 2015/16
Do you have somewhere safe that parcels can be left when no one is home?
Yes
No
Linear (No)
Shed /Garage
Porch Neighbour
Securelocker box atyour home
address
Alternative location –
Petrol Station,
Convenience store, etc.
Other
2008/09 20.0% 60.0% 4.4% 6.7% 33.3%
2009/10 24.5% 23.6% 36.3% 2.8% 1.9% 10.6%
2010/11 23.0% 21.8% 39.3% 3.2% 2.0% 10.7%
2011/12 25.6% 21.5% 36.6% 2.5% 0.8% 13.0%
2012/13 28.8% 25.7% 35.4% 2.7% 1.3% 6.2%
2013/14 18.3% 21.0% 49.0% 1.7% 3.3% 6.7%
2014/15 24.2% 25.2% 38.2% 0.0% 0.9% 11.5%
2015/16 22.9% 19.8% 40.6% 1.7% 0.7% 14.2%
0.0%
10.0%
20.0%
30.0%
40.0%
50.0%
60.0%
70.0% Where is that?

54 | www.imrg.org
Question 12.2
The number of households answering this question was 288 from the full sample of 618
Question 12.3
The number of households answering this question was 285 from the full sample of 618
62.5%
37.5%
Would you like to be able to specify a particular safe-place / neighbour at time of order or are you happy for the delivery
agent to use their descretion at time of delivery?
Specify Delivery agents discretion
94.4%
5.6%
Would you like the delivery company to be able to confirm / demonstrate that they have followed your safe-place
instructions?
Yes Not necessary

55 | www.imrg.org
Question 13
The number of households answering this question was 617 from the full sample of 618
Question 14
72.2%
82.7% 81.6%
43.4%47.9%
86.4% 85.7% 85.1%
0.0%
20.0%
40.0%
60.0%
80.0%
100.0%
2008/09 2009/10 2010/11 2011/12 2012/13 2013/14 2014/15 2015/16
Are your deliveries typically delivered successfully on the first attempt/expected day?
Yes No Linear (Yes)
0.0% 10.0% 20.0% 30.0% 40.0% 50.0% 60.0% 70.0%
No one is home to receive / item would not fitthrough the letter box / could not be left
No one at home to receive / Signature required /could not be left
Delivery didn't arrive as advised at time of order
Online tracking and actual delivery don't match(delivery did not arrive when advised to expect)
Parcel delivered to the Post office / depot and hadto be collected
Address inaccurate / redirected
Delivery failed completely
Item was broken
Other (please specify)
What is the most frequent reason deliveries are not successful on the first attempt?
2015/16
2014/15
2013/14

56 | www.imrg.org
14. If orders have not been delivered to your expectation, what have been the most common reasons? Please tick all that apply
2013/14 2014/15 2015/16
No one is home to receive / item would not fit through the letter box / could not be left
63.3% 48.1% 50.6%
No one at home to receive / Signature required / could not be left
53.2% 40.5% 46.3%
Delivery didn't arrive as advised at time of order 40.5% 21.4% 24.3%
Online tracking and actual delivery don't match (delivery did not arrive when advised to expect)
25.3% 12.8% 14.9%
Parcel delivered to the Post office / depot and had to be collected
35.4% 26.6% 30.3%
Address inaccurate / redirected 6.3% 3.3% 2.6%
Delivery failed completely 9.1% 11.2%
Item was broken 8.8% 8.6%
Other (please specify) 6.3% 4.8% 5.0%
All my online orders have been delivered as I expected
18.4% 14.4%
The number of households answering this question was …. from the full sample of 618
Question 15
0.0% 10.0% 20.0% 30.0% 40.0% 50.0% 60.0%
Less than 1 mile
1-5 miles
6-10 miles
11-20 miles
More than 20 miles
If a delivery fails, how far do you have to travel to collect an item (round trip)?
2015/16
2014/15
2013/14
2012/13
2011/12
2010/11
2009/10
2008/09

57 | www.imrg.org
The number of households answering this question was 614 from the full sample of 618
Question 16
The number of households answering this question was 617 from the full sample of 618
Question 17
The number of households answering this question was 616 from the full sample of 618
76.0%
82.6% 84.8% 84.0% 81.7%84.5% 83.4%
0.0%
10.0%
20.0%
30.0%
40.0%
50.0%
60.0%
70.0%
80.0%
90.0%
2009/10 2010/11 2011/12 2012/13 2013/14 2014/15 2015/16
Would you like to receive information about the progress of your delivery?
Yes No Maybe Linear (Yes)
0.0% 10.0% 20.0% 30.0% 40.0% 50.0%
Less than 10 minutes
Up to 30 minutes
Up to 45 minutes
Up to one hour
Two hours or longer
Three hours or more
How long does it take you to collect an item?
2015/16
2014/15
2013/14
2012/13
2011/12
2010/11
2009/10
2008/09

58 | www.imrg.org
Question 17.1
The number of households answering this question was 599 from the full sample of 618
Informingyou about
the progressof your order
Informingthe dispatch
date andtrackingnumber
Warning inadvance ifthere is aproblem /delay withdelivery
Confirmingthe expecteddelivery theday before
delivery
Confirmingthe expected
time (slot)when you
can expectdelivery
Informingyou of afailed
delivery
2009/10 72.3% 83.8% 88.1% 80.6% 84.0%
2010/11 77.1% 84.3% 87.9% 82.6% 83.4%
2011/12 71.7% 88.0% 90.8% 83.7% 81.4% 88.0%
2012/13 76.1% 84.0% 89.3% 82.7% 81.2% 85.9%
2013/14 69.7% 83.9% 85.8% 81.2% 80.7% 83.0%
2014/15 75.4% 85.6% 88.0% 82.5% 82.8% 87.7%
2015/16 73.3% 81.0% 85.6% 78.0% 78.6% 86.5%
0.0%
10.0%
20.0%
30.0%
40.0%
50.0%
60.0%
70.0%
80.0%
90.0%
100.0%
What parts of the delivery process would you be happy to be updated on?

59 | www.imrg.org
Question 17.2
The number of households answering this question was 593 from the full sample of 618
SMS E Mail
Using a purpose
built ‘tracking app’ on a
smart phone
Going to theretailer'sweb site
Going to thecarrier's web
siteTelephone
2008/09
2009/10 24.0% 68.2% 7.8%
2010/11 23.1% 67.5% 9.4%
2011/12 34.5% 56.1% 2.2% 1.1% 6.1%
2012/13 44.2% 48.3% 1.9% 0.9% 4.7%
2013/14 45.5% 43.5% 3.5% 1.6% 1.6% 4.2%
2014/15 38.3% 48.9% 4.0% 2.1% 2.9% 3.7%
2015/16 45.03% 44.18% 4.55% 2.87% 1.69% 1.69%
0.0%
10.0%
20.0%
30.0%
40.0%
50.0%
60.0%
70.0%
80.0%
Would you prefer to receive this information by:

60 | www.imrg.org
Question 17.3
The number of households answering this question was 599 from the full sample of 618
Question 17.4
The number of households answering this question was 599 from the full sample of 618
40.9%
46.5%
12.6%
58.6%54.9%
25.2%
1.9%
54.9%
61.9%
25.7%
2.5%
0.0%
10.0%
20.0%
30.0%
40.0%
50.0%
60.0%
70.0%
The day before delivery – no time
specified
On the morning of delivery – time
window specified
An update withinone hour of
delivery
None of the above
When receiving pre-delivery alerts, of the following options, which would be the most convenient for you?
2013/14
2014/15
2015/16
46.1%
60.3%
67.4%
72.9%
66.1%
43.5%
46.7%
0.0%
10.0%
20.0%
30.0%
40.0%
50.0%
60.0%
70.0%
80.0%
2009/10 2010/11 2011/12 2012/13 2013/14 2014/15 2015/16
Would you pay a small (10p) fee for such a service?
Yes No Maybe Linear (No)
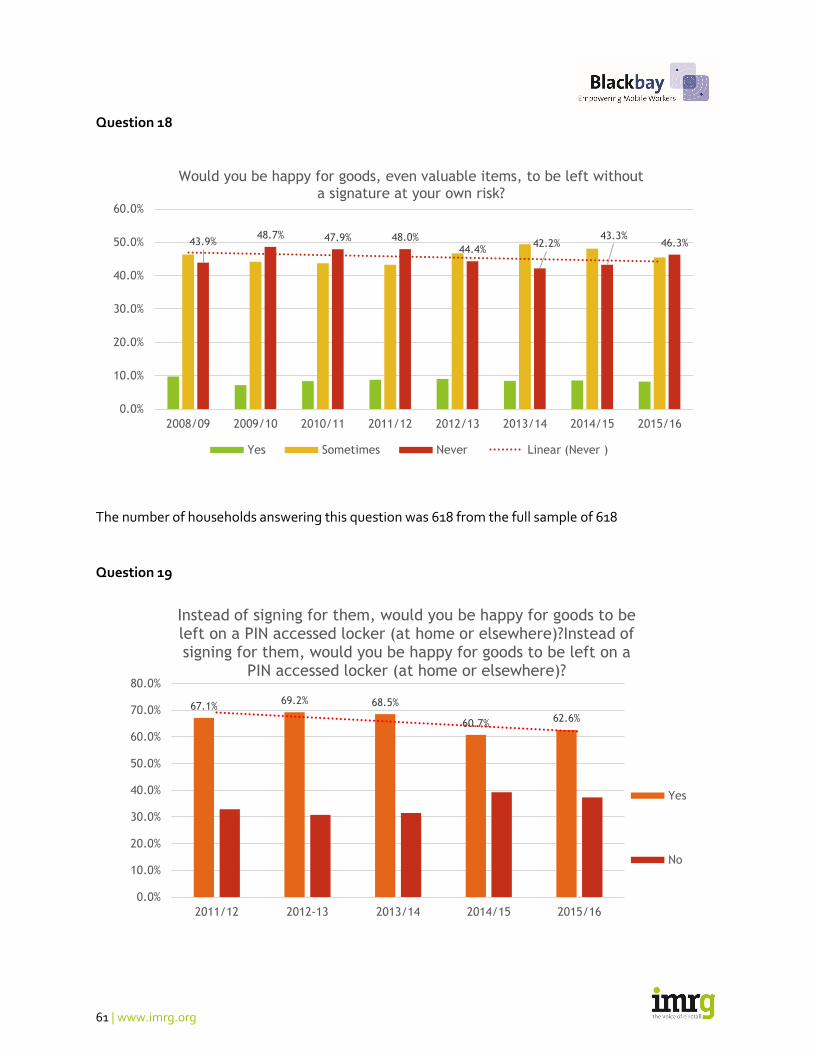
61 | www.imrg.org
Question 18
The number of households answering this question was 618 from the full sample of 618
Question 19
43.9%48.7% 47.9% 48.0%
44.4%42.2%
43.3%46.3%
0.0%
10.0%
20.0%
30.0%
40.0%
50.0%
60.0%
2008/09 2009/10 2010/11 2011/12 2012/13 2013/14 2014/15 2015/16
Would you be happy for goods, even valuable items, to be left without a signature at your own risk?
Yes Sometimes Never Linear (Never )
67.1%69.2% 68.5%
60.7%62.6%
0.0%
10.0%
20.0%
30.0%
40.0%
50.0%
60.0%
70.0%
80.0%
2011/12 2012-13 2013/14 2014/15 2015/16
Instead of signing for them, would you be happy for goods to be left on a PIN accessed locker (at home or elsewhere)?Instead of signing for them, would you be happy for goods to be left on a
PIN accessed locker (at home or elsewhere)?
Yes
No

62 | www.imrg.org
The number of households answering this question was 618 from the full sample of 618
Question 20
The number of households answering this question was 618 from the full sample of 618
Question 21
79.6%83.9% 83.6%
86.4%83.1%
86.4%
80.3% 79.0%
0.0%
10.0%
20.0%
30.0%
40.0%
50.0%
60.0%
70.0%
80.0%
90.0%
100.0%
2008/09 2009/10 2010/11 2011/12 2012/13 2013/14 2014/15 2015/16
Would you be happy for a neighbour to sign on your behalf?
Yes No Linear (Yes)
0.0% 5.0% 10.0% 15.0% 20.0% 25.0% 30.0% 35.0%
More than £10
More than £20
More than £30
More than £40
More than £50
More than £75
More than £100
I expect to sign regardless of value
I would never expect to sign for goods
Over what value would you expect to have to sign for goods?
2015/16 2014/15 2013/14 2012/13 2011/12 2010/11 2009/10 2008/09

63 | www.imrg.org
21. Over what value would you expect to have to sign for goods? 20
08
/09
200
9/1
0
2010
/11
2011
/12
2012
/13
2013
/14
2014
/15
2015
/16
More than £10 2.2% 8.5% 7.0% 6.5% 9.0% 8.3% 6.7% 3.6%
More than £20 10.0% 13.2% 13.8% 10.2% 15.5% 14.1% 13.9% 13.9%
More than £30 13.3% 14.4% 15.4% 14.4% 12.6% 12.7% 15.2% 15.2%
More than £40 5.6% 8.5% 7.6% 6.5% 6.9% 6.5% 6.1% 5.2%
More than £50 20.0% 21.8% 26.4% 22.8% 24.3% 25.8% 22.5% 23.9%
More than £75 2.2% 2.5% 2.6% 3.8% 1.9% 2.6% 2.5% 1.9%
More than £100 17.8% 11.4% 10.8% 10.0% 11.1% 10.5% 10.5% 13.3%
I expect to sign regardless of value
28.9% 19.7% 15.0% 25.2% 18.2% 18.6% 20.3% 21.4%
I would never expect to sign for goods
1.6% 0.7% 0.6% 0.9% 2.2% 1.6%
The number of households answering this question was 618 from the full sample of 618
Question 22
The number of households answering this question was 617 from the full sample of 618
63.4%66.8%
9.8%7.8%
24.7% 23.5%
2.0% 1.9%
0.0%
10.0%
20.0%
30.0%
40.0%
50.0%
60.0%
70.0%
80.0%
2014/15 2015/16
Have you, or those in your household, ever used Click and Collect services (either from the retailers store or a third party network)
instead of having orders delivered to home?
Yes
No - but I intend to useit in the future
No
I don't know what this is
Linear (Yes)

64 | www.imrg.org
Question 22.1
The number of households answering this question was 412 from the full sample of 618
Question 23
The number of households answering this question was 412 from the full sample of 618
91.9% 91.02%
25.1%
34.47%
0.0%
20.0%
40.0%
60.0%
80.0%
100.0%
2014/15 2015/16
What click and collect options have you previously used? Please tick all that apply
From a retailersstore
From a third partylocation (e.g.Petrol station,Conveniencestore)
Localnewsagent
Petrolstation
Conveniencestore
Securelocker boxnear to a
regular routeyou travel
The retailersstore (Click& Collect)
Other
2008/09 24.6% 12.3% 21.1% 12.3% 29.8%
2009/10 18.4% 9.6% 12.3% 7.6% 15.0%
2010/11 20.0% 6.6% 11.4% 9.0% 11.6%
2011/12 17.7% 6.8% 12.2% 15.2% 12.9%
2012/13 21.3% 7.1% 11.5% 11.3% 16.3% 7.3%
2013/14 20.7% 8.5% 13.5% 6.9% 18.1% 5.4%
2014/15 40.6% 21.7% 41.4% 24.1% 70.9% 2.7%
2015/16 39.32% 18.93% 40.78% 21.36% 70.63% 9.22%
0.0%
10.0%
20.0%
30.0%
40.0%
50.0%
60.0%
70.0%
80.0%If you could opt for an alternative delivery address / location where
would you be likely to choose?

65 | www.imrg.org
Question 24
The number of households answering this question was 375 from the full sample of 618
Question 25
The number of households answering this question was 141 from the full sample of 618
Delivery is free/ cheaper thanhome delivery?
You are rarelyat home to
receive a homedelivery?
You canexamine / try
on yourpurchase?
It is easier toreturn and get a
credit if thegoods are not
wanted?
You are able tocombine thiswith othershoppingactivity?
2012/13 91.7% 23.3% 18.3% 40.0% 61.7%
2013/14 57.3% 16.4% 10.7% 15.0% 31.8%
2014/15 79.9% 19.8% 15.3% 27.3% 41.8%
2015/16 78.7% 27.2% 14.7% 29.3% 46.7%
0.0%
10.0%
20.0%
30.0%
40.0%
50.0%
60.0%
70.0%
80.0%
90.0%
100.0%If you ever use in store Click & Collect / Reserve & Collect, is it
because…
45.1%
51.8%
37.3%
29.1%
0.0%
10.0%
20.0%
30.0%
40.0%
50.0%
60.0%
2014/15 2015/16
When using a third party click and collect location (convenience store, petrol station etc), do you have a regular/preferred location?
Yes - I always use thesame one
No - I use different ones
No - I have only usedthis once / use it veryinfrequently

66 | www.imrg.org
Question 26
The number of households answering this question was 142 from the full sample of 618
Question 27
The number of households answering this question was 411 from the full sample of 618
65.7% 64.8%
2.0% 2.1%
32.4% 33.1%
0.0%
10.0%
20.0%
30.0%
40.0%
50.0%
60.0%
70.0%
2014/15 2015/16
When using a third party click and collect location, do you prefer...
A staffed (convenience store,petrol station) location
An unstaffed locker location
I have no preference as longas its convenient
< 1 mile 2–5 miles 6–10 miles 11–20 miles 21 miles or over
2008/09 54.0% 35.6% 6.9% 3.5%
2009/10 47.0% 43.6% 7.6% 1.1% 0.7%
2010/11 51.0% 39.2% 8.2% 1.6% 0.0%
2011/12 36.7% 35.4% 6.9% 0.3% 0.3%
2012/13 35.1% 37.2% 7.5% 0.8% 0.0%
2013/14 37.2% 34.5% 6.0% 1.7% 0.5%
2014/15 20.7% 53.9% 18.7% 4.9% 1.7%
2015/16 24.3% 54.0% 15.8% 4.4% 1.5%
0.0%
10.0%
20.0%
30.0%
40.0%
50.0%
60.0%
If you could choose to have your parcel delivered to an alternative delivery location how far would you be prepared to travel to collect it
(round trip)?
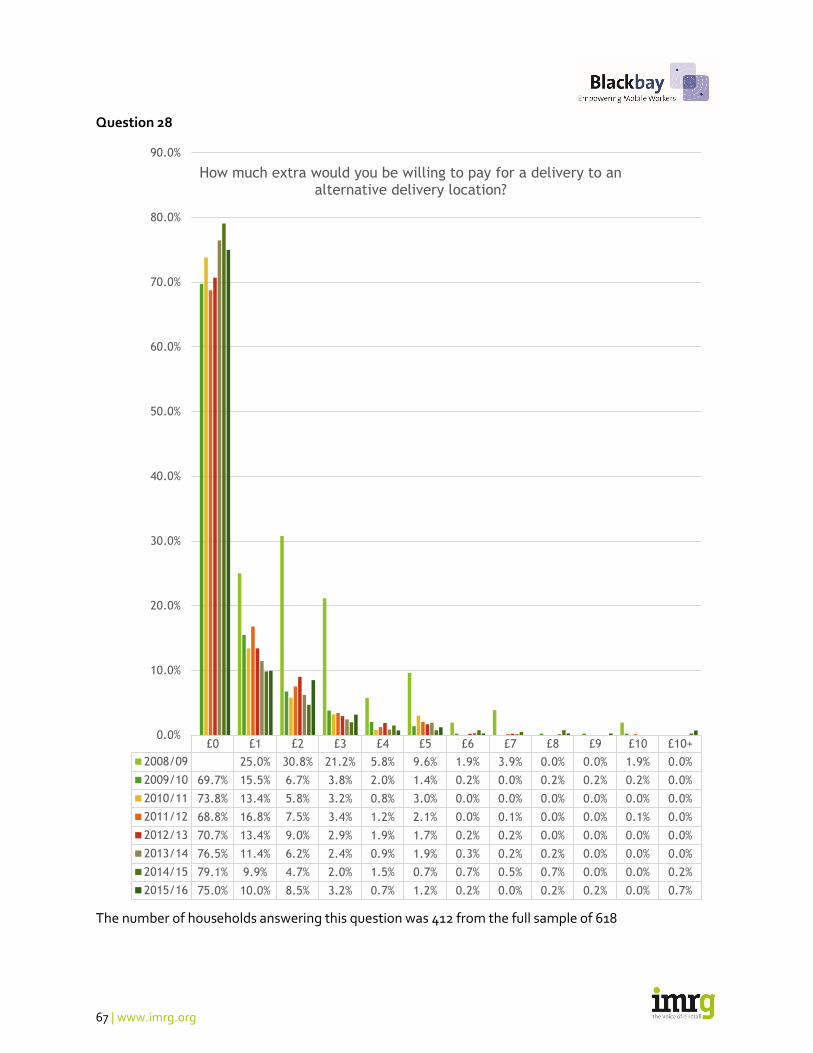
67 | www.imrg.org
Question 28
The number of households answering this question was 412 from the full sample of 618
£0 £1 £2 £3 £4 £5 £6 £7 £8 £9 £10 £10+
2008/09 25.0% 30.8% 21.2% 5.8% 9.6% 1.9% 3.9% 0.0% 0.0% 1.9% 0.0%
2009/10 69.7% 15.5% 6.7% 3.8% 2.0% 1.4% 0.2% 0.0% 0.2% 0.2% 0.2% 0.0%
2010/11 73.8% 13.4% 5.8% 3.2% 0.8% 3.0% 0.0% 0.0% 0.0% 0.0% 0.0% 0.0%
2011/12 68.8% 16.8% 7.5% 3.4% 1.2% 2.1% 0.0% 0.1% 0.0% 0.0% 0.1% 0.0%
2012/13 70.7% 13.4% 9.0% 2.9% 1.9% 1.7% 0.2% 0.2% 0.0% 0.0% 0.0% 0.0%
2013/14 76.5% 11.4% 6.2% 2.4% 0.9% 1.9% 0.3% 0.2% 0.2% 0.0% 0.0% 0.0%
2014/15 79.1% 9.9% 4.7% 2.0% 1.5% 0.7% 0.7% 0.5% 0.7% 0.0% 0.0% 0.2%
2015/16 75.0% 10.0% 8.5% 3.2% 0.7% 1.2% 0.2% 0.0% 0.2% 0.2% 0.0% 0.7%
0.0%
10.0%
20.0%
30.0%
40.0%
50.0%
60.0%
70.0%
80.0%
90.0%
How much extra would you be willing to pay for a delivery to an alternative delivery location?

68 | www.imrg.org
Question 29
0.0% 10.0% 20.0% 30.0% 40.0% 50.0% 60.0% 70.0% 80.0% 90.0%
Being able to add specific delivery instructions toyour order
Being able to choose a specific delivery day
Being able to choose a Saturday morning deliveryoption
Being able to choose a Sunday delivery option
Being able to choose an evening delivery option
Being able to choose a specific delivery time slot
Being able to choose a same day delivery within agiven time limit
Delivery to a ‘safeplace’ I specify when ordering (shed / garage, secure box, neighbour, etc)
Being able to select delivery to a 3rd Party Clickand Collect location instead of a carrier depot if…
Clear delivery information prior to ordering
Being able to select a 3rd Party Click and Collectlocation (staffed location or locker location) as…
Being able to select In Store 'Click and Collect'(delivery to the retailers local store for you to…
A call centre contact to handle delivery queries
A call centre to help me rearrange a delivery
An 'in transit' SMS or e mail to advise whendelivery can be expected
An 'in transit' SMS or e mail giving the ability tochange the delivery day or location
Access to online order tracking
What would make receiving deliveries more convenient?
2015/16 2014/15 2013/14 2012/13 2011/12 2010/11 2009/10 2008/09
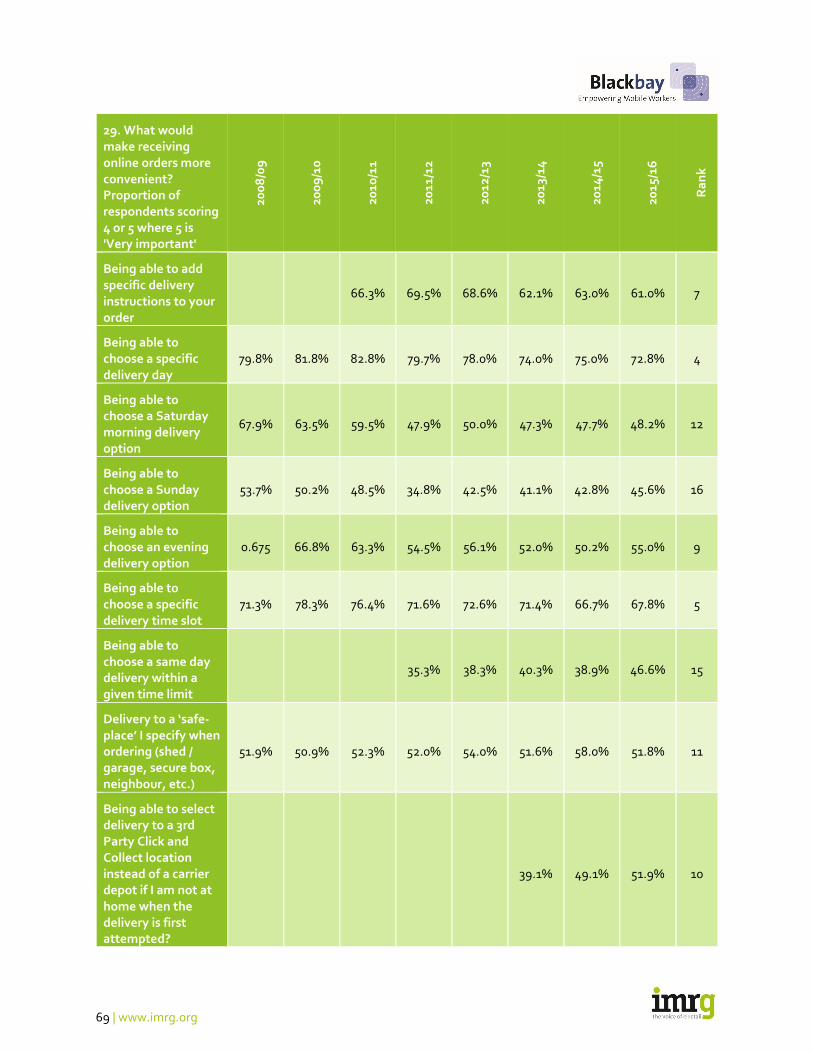
69 | www.imrg.org
29. What would make receiving online orders more convenient? Proportion of respondents scoring 4 or 5 where 5 is 'Very important'
200
8/0
9
200
9/1
0
2010
/11
2011
/12
2012
/13
2013
/14
2014
/15
2015
/16
Ra
nk
Being able to add specific delivery instructions to your order
66.3% 69.5% 68.6% 62.1% 63.0% 61.0% 7
Being able to choose a specific delivery day
79.8% 81.8% 82.8% 79.7% 78.0% 74.0% 75.0% 72.8% 4
Being able to choose a Saturday morning delivery option
67.9% 63.5% 59.5% 47.9% 50.0% 47.3% 47.7% 48.2% 12
Being able to choose a Sunday delivery option
53.7% 50.2% 48.5% 34.8% 42.5% 41.1% 42.8% 45.6% 16
Being able to choose an evening delivery option
0.675 66.8% 63.3% 54.5% 56.1% 52.0% 50.2% 55.0% 9
Being able to choose a specific delivery time slot
71.3% 78.3% 76.4% 71.6% 72.6% 71.4% 66.7% 67.8% 5
Being able to choose a same day delivery within a given time limit
35.3% 38.3% 40.3% 38.9% 46.6% 15
Delivery to a ‘safe-place’ I specify when ordering (shed / garage, secure box, neighbour, etc.)
51.9% 50.9% 52.3% 52.0% 54.0% 51.6% 58.0% 51.8% 11
Being able to select delivery to a 3rd Party Click and Collect location instead of a carrier depot if I am not at home when the delivery is first attempted?
39.1% 49.1% 51.9% 10

70 | www.imrg.org
29. What would make receiving online orders more convenient? Proportion of respondents scoring 4 or 5 where 5 is 'Very important'
200
8/0
9
200
9/1
0
2010
/11
2011
/12
2012
/13
2013
/14
2014
/15
2015
/16
Ra
nk
Clear delivery information prior to ordering
82.5% 73.3% 71.7% 73.7% 75.1% 73.0% 73.9% 73.3% 3
Being able to select a 3rd Party Click and Collect location (staffed location or locker location) as your delivery address at time of order [Previously 1st option was PUDO and 2nd was Locker]
47.5% 46.6% 43.7% 37.5% 45.2% 36.7%
42.8% 46.8% 14
22.4% 24.4% 21.6% 27.9% 34.3% 30.8%
Being able to select In-Store 'Click and Collect' (delivery to the retailer’s local store for you to collect) at time of order
41.1% 37.5% 49.4% 50.1% 55.0% 58.9% 8
A call centre contact to handle delivery queries
44.3% 43.7% 49.3% 46.6% 47.9% 48.5% 46.9% 45.1% 17
A call centre to help me rearrange a delivery
53.1% 53.5% 51.2% 50.8% 50.4% 50.3% 47.9% 13
An 'in transit' SMS or e mail to advise when delivery can be expected
70.0% 74.7% 66.4% 74.7% 76.4% 2
An 'in transit' SMS or e mail giving the ability to change the delivery day or location
60.8% 65.6% 67.3% 6
Access to online order tracking
74.1% 77.7% 79.6% 85.2% 80.3% 75.4% 78.3% 78.3% 1

71 | www.imrg.org
0.0%
10.0%
20.0%
30.0%
40.0%
50.0%
60.0%
70.0%
80.0%
90.0%
2008/09 2009/10 2010/11 2011/12 2012/13 2013/14 2014/15 2015/16
Options scoring 60%+
Being able to add specific delivery instructions to your order
Being able to choose a specific delivery day
Being able to choose a specific delivery time slot
Clear delivery information prior to ordering
An 'in transit' SMS or e mail to advise when delivery can be expected
An 'in transit' SMS or e mail giving the ability to change the delivery day orlocation
0.0%
10.0%
20.0%
30.0%
40.0%
50.0%
60.0%
70.0%
2008/09 2009/10 2010/11 2011/12 2012/13 2013/14 2014/15 2015/16
Alternative Delivery Options
Delivery to a ‘safeplace’ I specify when ordering (shed / garage, secure box, neighbour, etc)
Being able to select delivery to a 3rd Party Click and Collect location instead of a carrierdepot if I am not at home when the delivery is first attempted?
Being able to select a 3rd Party Click and Collect location (staffed location or lockerlocation) as your delivery address at time of order [Previously 1st option was PUDO and 2ndwas Locker]Being able to select In Store 'Click and Collect' (delivery to the retailers local store for you tocollect) at time of order

72 | www.imrg.org
0.0%
10.0%
20.0%
30.0%
40.0%
50.0%
60.0%
70.0%
80.0%
90.0%
2008/09 2009/10 2010/11 2011/12 2012/13 2013/14 2014/15 2015/16
Delivery Information and Tracking
Clear delivery information prior to ordering
An 'in transit' SMS or e mail to advise when delivery can be expected
An 'in transit' SMS or e mail giving the ability to change the delivery day orlocation
0.0%
10.0%
20.0%
30.0%
40.0%
50.0%
60.0%
70.0%
80.0%
90.0%
2008/09 2009/10 2010/11 2011/12 2012/13 2013/14 2014/15 2015/16
'Premium' Delivery Options
Being able to choose a specific delivery day
Being able to choose a Saturday morning delivery option
Being able to choose a Sunday delivery option
Being able to choose an evening delivery option
Being able to choose a specific delivery time slot

73 | www.imrg.org
The number of households answering question 29 was 618 from the full sample of 618
0.0%
10.0%
20.0%
30.0%
40.0%
50.0%
60.0%
70.0%
80.0%
90.0%
2008/09 2009/10 2010/11 2011/12 2012/13 2013/14 2014/15 2015/16
Specify In Advance
Being able to add specific delivery instructions to your order
Being able to choose a specific delivery day
Being able to choose a Saturday morning delivery option
Being able to choose a Sunday delivery option
Being able to choose an evening delivery option
Being able to choose a specific delivery time slot
Being able to choose a same day delivery within a given time limit
Delivery to a ‘safeplace’ I specify when ordering (shed / garage, secure box, neighbour, etc)
Being able to select delivery to a 3rd Party Click and Collect location instead of a carrier depotif I am not at home when the delivery is first attempted?

74 | www.imrg.org
Question 29.1
The number of households answering this question was 618 from the full sample of 618
Question 30
The number of households answering this question was 616 from the full sample of 618
38.9% 58.1% 59.6%51.2%
55.9% 59.4%54.8% 54.4%
0.0%
20.0%
40.0%
60.0%
80.0%
2008/09 2009/10 2010/11 2011/12 2012/13 2013/14 2014/15 2015/16
Would you be happy to pay for a delivery service where you could specify the time slot?
Yes No Linear (Yes)
The optionto addspecificdelivery
instructionsto yourorder
A 3rd PartyClick andCollect
location asyour
deliveryaddress at
time oforder
In Store'Click andCollect'
(delivery tothe
retailerslocal storefor you tocollect)
An 'intransit' SMSor e mail tochange the
deliveryday or
location
Same DayDelivery
selected atthe time or
order
WeekendDelivery
selected atthe time or
order
EveningDelivery
selected atthe time or
order
Time SlotDelivery
selected atthe time or
order
2013/14 42.6% 16.4% 36.9% 31.6%
2014/15 40.0% 21.4% 39.4% 31.6% 20.0% 23.6% 20.5% 33.3%
2015/16 17.15% 13.11% 15.5% 15.2% 12.9% 12.1% 11.0% 16.7%
0.0%
5.0%
10.0%
15.0%
20.0%
25.0%
30.0%
35.0%
40.0%
45.0%For some of these options, how often have you used the following?
(Often or Always)

75 | www.imrg.org
Question 30.1
The number of households answering this question was 281 from the full sample of 618
1 hour 2 hours 3 hours 4 hoursMore than 4
hours
2008/09 19.2% 65.4% 3.9% 1.9% 9.6%
2009/10 21.4% 51.8% 14.0% 9.7% 3.2%
2010/11 22.2% 50.5% 14.8% 9.2% 3.4%
2011/12 19.7% 56.8% 13.7% 7.3% 2.5%
2012/13 27.7% 51.9% 12.8% 5.5% 2.1%
2013/14 27.8% 51.4% 11.7% 6.8% 2.3%
2014/15 36.3% 49.8% 9.7% 3.1% 1.0%
2015/16 35.6% 48.4% 8.9% 4.3% 2.8%
0.0%
10.0%
20.0%
30.0%
40.0%
50.0%
60.0%
70.0%
If you could specify a delivery time slot what would you consider an acceptable time slot?

76 | www.imrg.org
Question 30.2
The number of households answering this question was 280 from the full sample of 618
2008/09 2009/10 2010/11 2011/12 2012/13 2013/14 2014/15 2015/16
Less than £1 1.9% 27.3% 27.7% 28.9% 27.0% 41.5% 26.3% 22.5%
£1–£2 26.4% 42.6% 42.6% 39.7% 45.0% 40.3% 48.8% 45.0%
£3–£4 45.3% 16.4% 20.3% 20.6% 22.3% 12.3% 16.6% 20.0%
£5–£6 13.2% 9.8% 7.9% 10.3% 4.7% 5.1% 5.9% 7.5%
£7–£8 7.6% 2.7% 1.0% 0.3% 0.5% 0.0% 1.0% 2.1%
£9–£10 0.0% 1.1% 0.5% 0.0% 0.5% 0.8% 1.0% 2.1%
Over £10 5.7% 0.0% 0.0% 0.3% 0.0% 0.0% 0.3% 0.7%
0.0%
10.0%
20.0%
30.0%
40.0%
50.0%
60.0%How much would you be willing to pay to specify the time slot?
0.0%
20.0%
40.0%
60.0%
80.0%
100.0%
120.0%
2008/09 2009/10 2010/11 2011/12 2012/13 2013/14 2014/15 2015/16
Proportion prepared to pay £1 - £2 Proportion prepared to pay more than £2

77 | www.imrg.org
Question 31
The number of households answering this question was 618 from the full sample of 618
Question 32
The number of households answering this question was 615 from the full sample of 618
23.8%25.6%
18.0%15.2%
18.1%
22.8%
58.0%56.3%
0.0%
10.0%
20.0%
30.0%
40.0%
50.0%
60.0%
70.0%
2014/15 2015/16
Looking to the future, would you be prepared to...
Have parcels delivered by 'drone'
Have parcels delivered to the boot of your car (at home or elsewhere)
Have parcels delivered to a railway station for you to collect
None of the above
80.3%
19.7%
83.3%
16.7%
0.0%
10.0%
20.0%
30.0%
40.0%
50.0%
60.0%
70.0%
80.0%
90.0%
Yes No
Do you own a smartphone device?

78 | www.imrg.org
Question 33
The number of households answering this question was 510 from the full sample of 618
Question 34
The number of households answering this question was 512 from the full sample of 618
49.03%55.89%
59.33%
83.9% 85.88%
0.0%
20.0%
40.0%
60.0%
80.0%
100.0%
2011/12 2012/13 2013/14 2014/15 2015/16
Do you access your emails on a mobile device?
Yes No Linear (Yes)
Yes No Maybe
2011/12 4.86% 77.97% 17.16%
2012/13 4.18% 84.52% 11.30%
2013/14 5.19% 81.14% 13.67%
2014/15 8.4% 81.6% 10.0%
2015/16 10.74% 81.25% 8.01%
0.0%
10.0%
20.0%
30.0%
40.0%
50.0%
60.0%
70.0%
80.0%
90.0%
If you were ordering online via your mobile, would you expect more / different delivery options?
2011/12 2012/13 2013/14 2014/15 2015/16

79 | www.imrg.org
Question 35
The number of households answering this question was …. from the full sample of 618
Question 36
The number of households answering this question was 393 from the full sample of 618
55.02% 55.08%58.3%
65.1%
44.98% 44.92%41.7%
34.9%
0.0%
10.0%
20.0%
30.0%
40.0%
50.0%
60.0%
70.0%
2012/13 2013/14 2014/15 2015/16
Have you ever bought goods from a ‘non UK’ web site?
Yes No Linear (Yes)
5.1%
8.3%
15.9%
28.2%
32.8%
9.7%
5.6%
8.9%
13.0%
35.1%
26.0%
11.5%
0.0%
5.0%
10.0%
15.0%
20.0%
25.0%
30.0%
35.0%
40.0%
At least once amonth
Every 1-2months
Every 2-3months
1-2 times a year Once a year orless
I've only orderedfrom non UK
websites once inthe past
How frequently do you and those in your household buy from a non UK website?
2014/15 2015/16
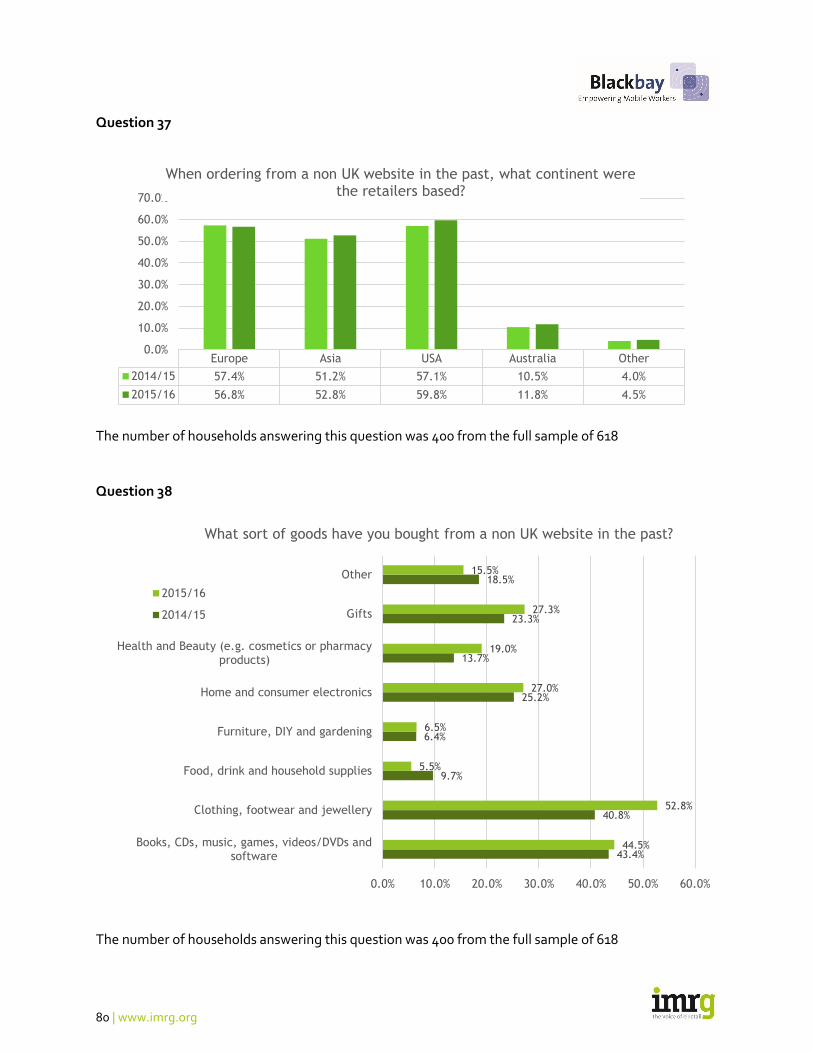
80 | www.imrg.org
Question 37
The number of households answering this question was 400 from the full sample of 618
Question 38
The number of households answering this question was 400 from the full sample of 618
Europe Asia USA Australia Other
2014/15 57.4% 51.2% 57.1% 10.5% 4.0%
2015/16 56.8% 52.8% 59.8% 11.8% 4.5%
0.0%
10.0%
20.0%
30.0%
40.0%
50.0%
60.0%
70.0%
When ordering from a non UK website in the past, what continent were the retailers based?
43.4%
40.8%
9.7%
6.4%
25.2%
13.7%
23.3%
18.5%
44.5%
52.8%
5.5%
6.5%
27.0%
19.0%
27.3%
15.5%
0.0% 10.0% 20.0% 30.0% 40.0% 50.0% 60.0%
Books, CDs, music, games, videos/DVDs andsoftware
Clothing, footwear and jewellery
Food, drink and household supplies
Furniture, DIY and gardening
Home and consumer electronics
Health and Beauty (e.g. cosmetics or pharmacyproducts)
Gifts
Other
What sort of goods have you bought from a non UK website in the past?
2015/16
2014/15

81 | www.imrg.org
Question 39
The number of households answering this question was 396 from the full sample of 618
Question 39.1
The number of households answering this question was 211 from the full sample of 618
0.0% 10.0% 20.0% 30.0% 40.0% 50.0% 60.0% 70.0% 80.0% 90.0% 100.0%
Yes
No
Yes No
2015/16 87.9% 12.1%
2014/15 90.3% 9.7%
2013/14 89.1% 10.9%
2012/13 87.8% 12.2%
Would you buy goods from a 'non UK' web site again?
42.5%
36.0%33.1%
35.5%
57.5%
64.0%66.9%
64.5%
0.0%
10.0%
20.0%
30.0%
40.0%
50.0%
60.0%
70.0%
80.0%
2012/13 2013/14 2014/15 2015/16
Would you consider buying goods from a 'non UK' website in the future? (of those who have not yet purchased cross-border)
Yes No Linear (Yes)

82 | www.imrg.org
Question 40
The number of households answering this question was 184 from the full sample of 618
Language –concerns about not
understanding the order
details
Payment options –concerns
that payment
may not be convenient or secure
Delivery –concerns
about long delivery
times and ability to track the
order
Returns –concerns about the ability to
return unwanted orders and get a credit
After sales –concerns
that with an overseas retailer it might be
harder to get help
Higher costs – concerns
that with an overseas retailer prices or delivery /
returns costs might be higher
Other
2012/13 25.8% 52.3% 62.6% 59.4% 48.4% 47.7% 7.7%
2013/14 23.3% 51.0% 62.4% 64.9% 52.5% 55.9% 5.4%
2014/15 37.4% 53.7% 59.3% 59.8% 48.6% 55.6% 6.5%
2015/16 29.9% 48.9% 66.8% 69.0% 47.3% 45.7% 8.7%
0.0%
10.0%
20.0%
30.0%
40.0%
50.0%
60.0%
70.0%
80.0%
What do you feel are the biggest barriers to buying goods from a non UK retailer?

83 | www.imrg.org
Question 41
The number of households answering this question was 616 from the full sample of 618
Question 41.1
The number of households answering this question was 617 from the full sample of 618
38.6%
63.0% 64.2%
59.5%
71.8%67.7% 61.0%
60.7%
0.0%
10.0%
20.0%
30.0%
40.0%
50.0%
60.0%
70.0%
80.0%
2008/09 2009/10 2010/11 2011/12 2012/13 2013/14 2014/15 2015/16
Overall, how happy are you with the Returns services for online shopping parcels?
72.0% 73.0% 74.0% 75.0% 76.0% 77.0% 78.0% 79.0%
2014/15
2015/16
How important is the quality of the returns service to you and those in your household when selecting the retailers you will shop with?
Proportion of respondents scoring over 7 where 10 is 'Very important'
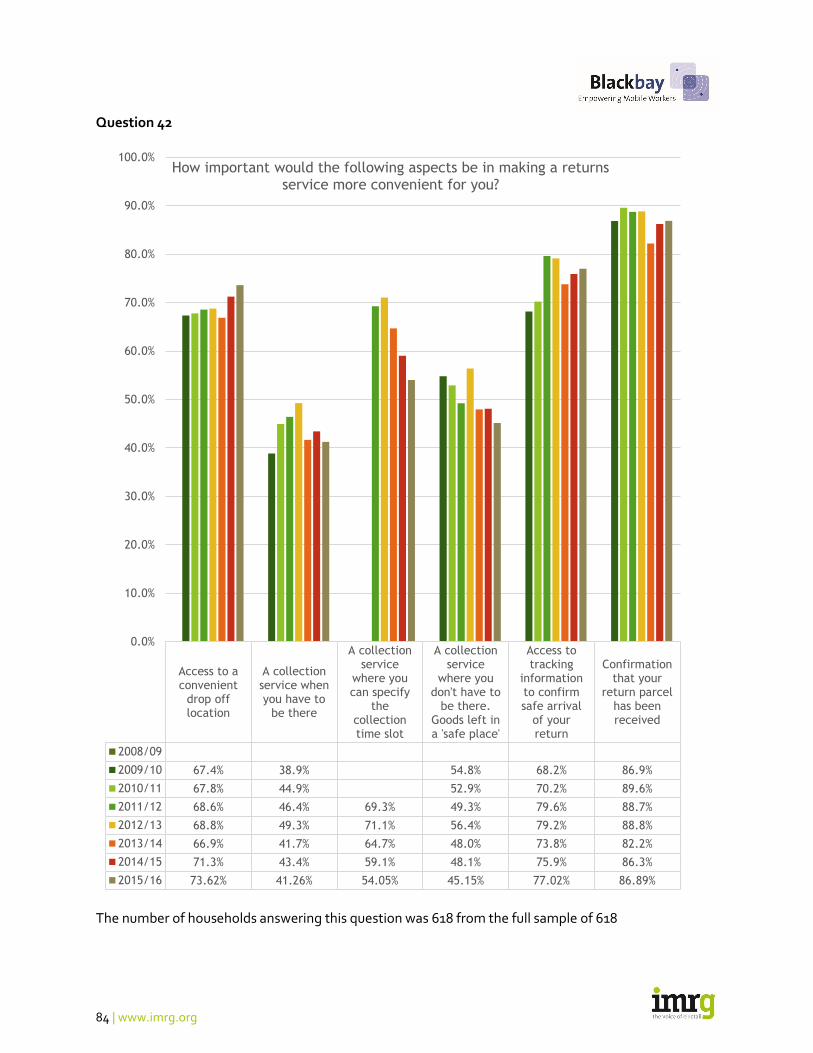
84 | www.imrg.org
Question 42
The number of households answering this question was 618 from the full sample of 618
Access to aconvenient
drop offlocation
A collectionservice whenyou have to
be there
A collectionservice
where youcan specify
thecollectiontime slot
A collectionservice
where youdon't have to
be there.Goods left ina 'safe place'
Access totracking
informationto confirmsafe arrival
of yourreturn
Confirmationthat your
return parcelhas beenreceived
2008/09
2009/10 67.4% 38.9% 54.8% 68.2% 86.9%
2010/11 67.8% 44.9% 52.9% 70.2% 89.6%
2011/12 68.6% 46.4% 69.3% 49.3% 79.6% 88.7%
2012/13 68.8% 49.3% 71.1% 56.4% 79.2% 88.8%
2013/14 66.9% 41.7% 64.7% 48.0% 73.8% 82.2%
2014/15 71.3% 43.4% 59.1% 48.1% 75.9% 86.3%
2015/16 73.62% 41.26% 54.05% 45.15% 77.02% 86.89%
0.0%
10.0%
20.0%
30.0%
40.0%
50.0%
60.0%
70.0%
80.0%
90.0%
100.0%How important would the following aspects be in making a returns
service more convenient for you?

85 | www.imrg.org
Question 43
The number of households answering this question was 614 from the full sample of 618
Question 44
The number of households answering this question was 616 from the full sample of 618
44.1% 44.8%
61.5%
53.6%58.1% 59.0%
54.5%50.3%
0.0%
10.0%
20.0%
30.0%
40.0%
50.0%
60.0%
70.0%
2008/09 2009/10 2010/11 2011/12 2012/13 2013/14 2014/15 2015/16
Have you ever received an item that was damaged?
Yes No Linear (Yes)
31.3%
12.8%
2.7%
31.8%
8.5%
13.0%
28.8%
18.9%
2.0%
27.7%
8.8%
13.8%
0.0%
5.0%
10.0%
15.0%
20.0%
25.0%
30.0%
35.0%
Drop the parceloff at the Post
Office
Drop the parceloff at a staffed3rd Party 'Click
and Collect'location
Drop the parceloff at an
unstaffed /locker 3rd Party
'Click andCollect' location
Have the parcelcollected
Take the parceldirectly to theretailers local
store
I have nopreference howI make a return
When making a return, do you prefer it when you can...
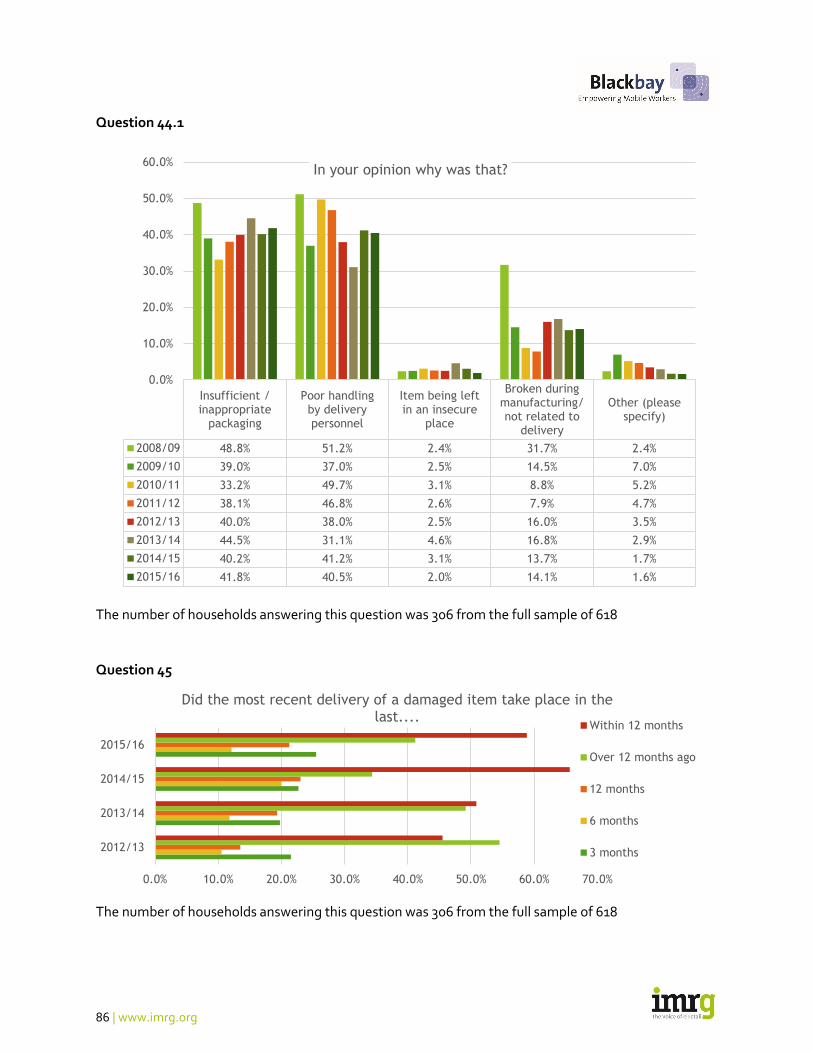
86 | www.imrg.org
Question 44.1
The number of households answering this question was 306 from the full sample of 618
Question 45
The number of households answering this question was 306 from the full sample of 618
Insufficient /inappropriate
packaging
Poor handlingby deliverypersonnel
Item being leftin an insecure
place
Broken duringmanufacturing/not related to
delivery
Other (pleasespecify)
2008/09 48.8% 51.2% 2.4% 31.7% 2.4%
2009/10 39.0% 37.0% 2.5% 14.5% 7.0%
2010/11 33.2% 49.7% 3.1% 8.8% 5.2%
2011/12 38.1% 46.8% 2.6% 7.9% 4.7%
2012/13 40.0% 38.0% 2.5% 16.0% 3.5%
2013/14 44.5% 31.1% 4.6% 16.8% 2.9%
2014/15 40.2% 41.2% 3.1% 13.7% 1.7%
2015/16 41.8% 40.5% 2.0% 14.1% 1.6%
0.0%
10.0%
20.0%
30.0%
40.0%
50.0%
60.0%In your opinion why was that?
0.0% 10.0% 20.0% 30.0% 40.0% 50.0% 60.0% 70.0%
2012/13
2013/14
2014/15
2015/16
Did the most recent delivery of a damaged item take place in the last....
Within 12 months
Over 12 months ago
12 months
6 months
3 months

87 | www.imrg.org
Question 46
The number of households answering this question was 616 from the full sample of 618
Question 46.1
The number of households answering this question was 256 from the full sample of 618
53.9%58.9% 59.1% 56.6% 56.6%
62.3% 63.9%58.4%
0.0%
10.0%
20.0%
30.0%
40.0%
50.0%
60.0%
70.0%
2008/09 2009/10 2010/11 2011/12 2012/13 2013/14 2014/15 2015/16
Have you ever received an item with inappropriate packaging?
Yes No Linear (No)
Too little Too muchToo big for the
item itcontained
Too big so thatit prevented
the item goingthrough
letterbox whenit otherwisewould have
Other
2008/09 58.5% 31.7% 28.8% 39.0% 9.8%
2009/10 72.0% 33.0% 5.5% 25.8% 2.8%
2010/11 71.7% 35.1% 3.9% 18.5% 2.0%
2011/12 71.0% 19.3% 29.9% 20.6% 2.2%
2012/13 73.8% 30.5% 39.0% 19.8% 2.7%
2013/14 68.3% 28.0% 44.0% 28.0% 4.6%
2014/15 69.3% 28.6% 35.5% 16.5% 5.6%
2015/16 62.9% 37.9% 47.7% 23.4% 3.9%
0.0%
10.0%
20.0%
30.0%
40.0%
50.0%
60.0%
70.0%
80.0%Was the packaging?

88 | www.imrg.org
Question 47
The number of households answering this question was 616 from the full sample of 618
Question 48
The number of households answering this question was 617 from the full sample of 618
56.2%58.0%
72.9%69.6%
63.6% 63.5%
54.0% 54.4%
0.0%
10.0%
20.0%
30.0%
40.0%
50.0%
60.0%
70.0%
80.0%
2008/09 2009/10 2010/11 2011/12 2012/13 2013/14 2014/15 2015/16
Which do you think is more environmentally friendly?
Shopping online
Shopping in thehigh street
Linear(Shoppingonline)
78.7%
68.6%64.2% 62.7% 68.7% 62.9% 68.3%
72.1%
0.0%
10.0%
20.0%
30.0%
40.0%
50.0%
60.0%
70.0%
80.0%
90.0%
2008/09 2009/10 2010/11 2011/12 2012/13 2013/14 2014/15 2015/16
Distribution contributes significantly to the UK’s carbon footprint. If a carbon–friendly delivery alternative was available, would you choose it
over a traditional method?
Yes No Linear (Yes)
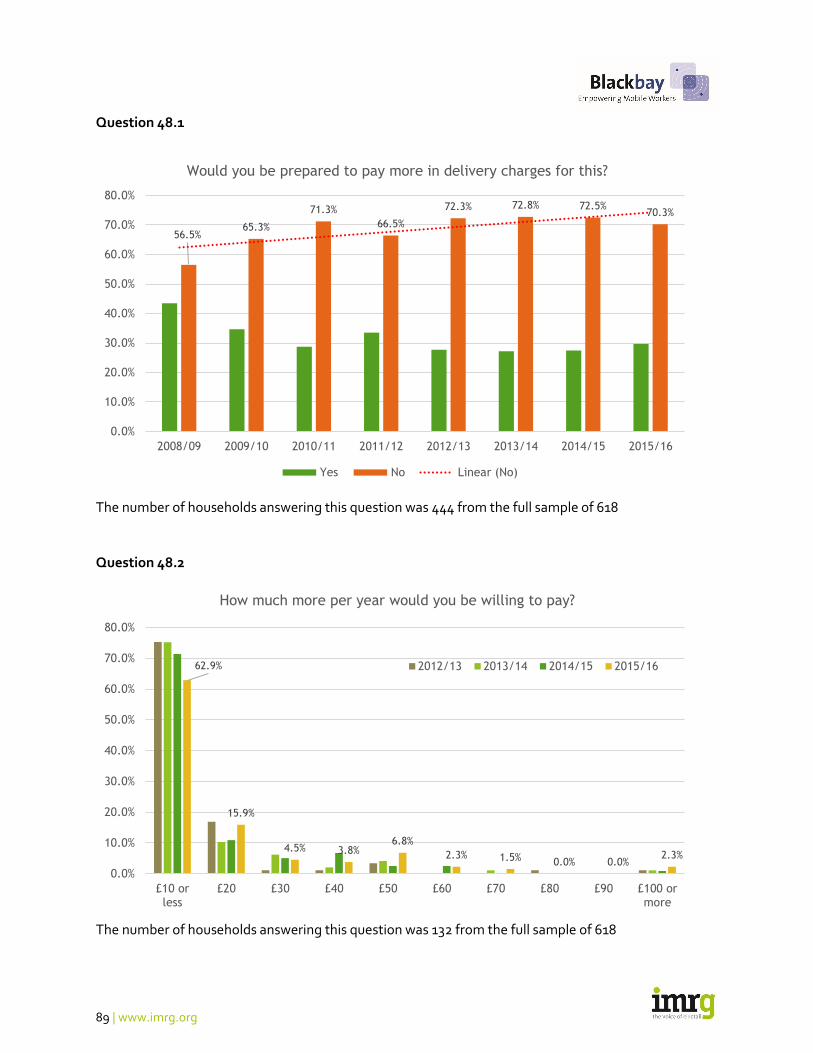
89 | www.imrg.org
Question 48.1
The number of households answering this question was 444 from the full sample of 618
Question 48.2
The number of households answering this question was 132 from the full sample of 618
56.5%65.3%
71.3%
66.5%
72.3% 72.8% 72.5%70.3%
0.0%
10.0%
20.0%
30.0%
40.0%
50.0%
60.0%
70.0%
80.0%
2008/09 2009/10 2010/11 2011/12 2012/13 2013/14 2014/15 2015/16
Would you be prepared to pay more in delivery charges for this?
Yes No Linear (No)
62.9%
15.9%
4.5% 3.8%6.8%
2.3% 1.5% 0.0% 0.0%2.3%
0.0%
10.0%
20.0%
30.0%
40.0%
50.0%
60.0%
70.0%
80.0%
£10 orless
£20 £30 £40 £50 £60 £70 £80 £90 £100 ormore
How much more per year would you be willing to pay?
2012/13 2013/14 2014/15 2015/16

90 | www.imrg.org
Question 49
Question 49.1
17.1%
40.8%
15.7% 16.5%
5.7%
2.7%0.6% 0.6% 0.0% 0.3%
0.0%
5.0%
10.0%
15.0%
20.0%
25.0%
30.0%
35.0%
40.0%
45.0%
Just me 2 3 4 5 6 7 8 9 10 ormore
How many people are there in your household?
68.5%
14.5%10.9%
2.8% 2.2%0.3% 0.2% 0.3% 0.2% 0.0% 0.2%
0.0%
10.0%
20.0%
30.0%
40.0%
50.0%
60.0%
70.0%
80.0%
None 1 2 3 4 5 6 7 8 9 10 ormore
How many of these are under 18?

91 | www.imrg.org
Question 50
Question 51
44.4%
55.6%
Gender
Male Female
0.0%
4.7%
17.9%
22.4%
21.3%
19.6%
14.2%
Age of respondent
Under 18
18–24
25–34
35–44
45–54
55–64
65+

92 | www.imrg.org
Question 52
Question 52.1
97.6%
2.4%
Do you live in the UK?
Yes No
7.30%
12.60%
11.80%
8.40%
19.60%
17.30%
7.50%
2.40%
4.30%
8.74%
13.09%
12.76%
13.89%
7.27%
15.51%
16.80%
8.40%
0.65%
4.52%
6.95%
0.0% 5.0% 10.0% 15.0% 20.0% 25.0%
North East
North West
EastMidlands
WestMidlands
London
South East
South West
NorthernIreland
Wales
Scotland
Which UK region do you live in?
Respondents Location
Location spread of UKdeliveries

93 | www.imrg.org
Question 52.2
Question 53
12.1%
23.7%
19.1%
27.8%
17.2%
14.0%
22.7%
19.9%
26.5%
16.8%
0.0%
5.0%
10.0%
15.0%
20.0%
25.0%
30.0%
Inner City Outskirts of a city A large town A small town A rural area
What sort of area do you live in?
2014/15 2015/16
43.3%
11.5%9.1%
4.6%1.7%
17.8%
7.2%3.8%
0.9%
0.0%
5.0%
10.0%
15.0%
20.0%
25.0%
30.0%
35.0%
40.0%
45.0%
50.0%
What is your employment status?

94 | www.imrg.org
Question 54
Question 55
0.9% 1.2% 1.9% 1.6%
8.1%
9.8%
7.6%
12.0%
4.0%5.6%
11.7%
0.3%
2.6%
0.2%1.7%
11.8%
19.0%
0.0%
2.0%
4.0%
6.0%
8.0%
10.0%
12.0%
14.0%
16.0%
18.0%
20.0%
What is your occupation?
7.8%
16.3% 16.3%
12.9%
11.6%
6.4%
3.6%2.5%
1.4%2.0%
5.3%
13.8%
0.0%
2.0%
4.0%
6.0%
8.0%
10.0%
12.0%
14.0%
16.0%
18.0%
What is your annual household income before tax and deductions?