Embed Size (px)
Citation preview
Impurity transport due to electromagnetic drift wave turbulence
S. Moradi, I. Pusztai, A. Mollen, and T. FulopDepartment of Applied Physics, Nuclear Engineering, Chalmers University of Technology and Euratom-VRAssociation, Goteborg, Sweden
(Received 2 November 2011; accepted 26 January 2012; published online 5 March 2012)
Finite b effects on impurity transport are studied through local linear gyrokinetic simulations with
GYRO [J. Candy and E. Belli, General Atomics Report No. GA-A26818, 2011]; in particular, we
investigate the parametric dependences of the impurity peaking factor (zero-flux density gradient)
and the onset of the kinetic ballooning modes (KBMs). We find that electromagnetic effects even
at low b can have significant impact on the impurity transport. The KBM instability threshold
depends on the plasma parameters, particularly strongly on plasma shape. We have shown that
magnetic geometry significantly influences the results, and the commonly used s-a model overesti-
mates the KBM growth rates and ITG stabilization at high b. In the b range, where the KBM is the
dominant instability the impurity peaking factor is strongly reduced, with very little dependence on
b and the impurity charge. VC 2012 American Institute of Physics.
[http://dx.doi.org/10.1063/1.3688876]
I. INTRODUCTION
Impurity transport is a critical issue in burning plasma
regimes due to possible fuel dilution and radiative cooling in
the core. Impurity transport due to electrostatic microinst-
abilities has been widely studied in previous works; how-
ever, the impact of electromagnetic effects at finite b on the
transport of impurities has not received as much attention.
Here b ¼ 8phpi=B2, where hpi is the volume average kinetic
pressure and B is the toroidal magnetic field. In the view of
an increasing interest in high b operation scenarios, such as
hybrid scenarios for ITER (Refs. 1, 2), the question of finite
b effects on the impurity transport deserves further
investigation.
Previous works have reported b scaling of the eigenfre-
quency and turbulence mode structures both with gyro-fluid3
as well as gyrokinetic4–10 models. It has been found that
electromagnetic effects have stabilizing influence on the ion
temperature gradient (ITG) modes. However, at finite ion
temperature gradient and below the ideal magnetohydrody-
namic (MHD) ballooning mode threshold, b < bMHD, a
branch of kinetic ballooning modes (KBMs) (in some older
work, the name AITG has been used to refer to the KBM
[Ref. 11]) can become destabilized. It has been shown that
the ITG modes, driven by the rB-curvature and ion pressure
gradient, are essentially an electrostatic instability, whereas
KBMs are electromagnetic instabilities due to the perpendic-
ular interchange dynamics coupling to parallel Alfven wave
dynamics.
From the experimental side, effects of finite b on the
transport of light impurities such as helium and tritium have
been explored, and a reduction in diffusivities of the light
impurities as b increases has been reported.12,13 Theoretical
studies have confirmed these observations qualitatively, and
it has been shown that an increase in b will result in a stabili-
zation of the ITG modes leading to significant reduction of
the impurity diffusivities.14 However, this study shows that
for low impurity charges, the ratio of the convective velocity
to the diffusivity (peaking factor) is not strongly affected by
an increase in b, while it increases in magnitude with
increasing b for heavy impurities. Therefore, an increase in
b is predicted to cause peaking of the heavy impurity pro-
files. It has to be noted that in this study, no KBMs were
present for the whole range of b considered. However, recent
metal impurity transport control experiments in JET H-mode
plasmas with be& 0:004 (at the inner mid-radius) have
shown much lower peaking of nickel impurity in the plasma
core (normalized radius q < 0:5) than further out; in particu-
lar, a sign change of the peaking factor (zero-flux density
gradient) from positive to negative has been observed for
inner radii.15 Here, the effective normalized electron pres-
sure is defined as be ¼ 8pneTe=B2; note that for Ti ¼ Te, we
have b ¼ 2be. These results could not be explained within
the framework of an electrostatic transport model, since the
most unstable modes under these conditions are predicted to
be ITG modes, and impurity driven transport due to electro-
static ITG modes always leads to positive peaking factors. In
the present paper, we investigate the impact of finite beffects on the transport of impurities. Our study concludes,
however, that at the experimentally relevant b, comparable
peaking factors are expected from midradius towards the
core.
The onset of the KBM instability is also studied. KBMs
propagate in the ion diamagnetic direction and can be destabi-
lized above a critical value of be (which we denote by bcrite ).
We find that for typical experimental parameters, be is well
below bcrite in the core of tokamaks; however, electromagnetic
effects even at low be can have significant impact on the im-
purity transport, and an electrostatic treatment in the core can
give misleading results. The quasilinear impurity transport is
computed using the gyrokinetic code GYRO.16,17 All the sim-
ulations are performed in the flux-tube (local) limit. Our
results show that for the considered plasma parameters, two
possible modes can be unstable depending on the normalized
electron pressure; ITG modes dominate in the region
be. 0:015, whereas KBM dominates for be& 0:015.
1070-664X/2012/19(3)/032301/9/$30.00 VC 2012 American Institute of Physics19, 032301-1
PHYSICS OF PLASMAS 19, 032301 (2012)
brought to you by COREView metadata, citation and similar papers at core.ac.uk
provided by Chalmers Publication Library
Consistently with previous studies, we also observe the stabi-
lization of ITG modes by electromagnetic effects as be
increases. For the experimentally relevant parameters used in
our study, the KBM stability threshold bcrite is about a factor
three higher than the experimental value of be. The sensitivity
of this threshold on the various plasma parameters has been
analyzed here, and it is found that it is highly sensitive to the
plasma shape and magnetic geometry; however, other effects
such as collisions and the gradients of density and tempera-
tures may also lead to significant change in the KBM thresh-
old. The importance of plasma shape on the onset of the
KBM instability and plasma confinement properties was
reported in Ref. 18, where the results from a series of b scal-
ing experiments performed at ASDEX-U and DIII-D toka-
maks are discussed. In Ref. 18, gyrokinetic analysis with
GYRO code is presented, and it is shown that as be is
increased, the most unstable mode changes from ITG at low
be to microtearing at intermediate values of be and to KBM
at high values of be. In the KBM branch, they observe signifi-
cantly higher growth rates increasing strongly with be in com-
parison to the ITG and micro-tearing branches. In the present
work, however, no micro-tearing mode is observed for the
whole range of be considered, and more interestingly, the
growth rates of the KBM is comparable to that of the ITG
mode with no strong increase with increase of be.
The be scaling of the impurity peaking factor shows two
branches in connection with the two branches of the unstable
modes present. The peaking factor increases with be in the
ITG branch, but it exhibits only a very weak be dependence
in the KBM branch. The peaking factor values in the KBM
branch are significantly lower, about half of those in the ITG
branch, with negligible charge dependence. In the ITG
branch, stronger dependence on the impurity charge is
expected and this dependence increases as be increases; how-
ever, for heavy impurities with lower charge to mass ratio
such as tungsten, lower peaking factors with very little be de-
pendence is observed.
The remainder of the paper is organized as follows. In
Sec. II, the model for calculating the quasilinear impurity
flux and the peaking factor is presented. In Sec. III, the para-
metric dependences of the peaking factor are analyzed by
presenting scans over relevant parameters such as charge
number and temperature and density scale lengths. Also, the
scans for magnetic shear, safety factor, and collisions are
demonstrated. Finally, the results are discussed and summar-
ized in Sec. IV.
II. IMPURITY FLUX AND PEAKING FACTOR
The quasilinear impurity particle flux is given by
Cz ¼ �kh
B=ð
d3vgz J0ðzzÞ/� � J0ðzzÞvkdA�k
c
��
þ v?k?
J1ðzzÞdB�k
c
��; (1)
where =½�� denotes imaginary part, kh is the poloidal
wave-number, B is the equilibrium magnetic field, gz is the
non-adiabatic part of the perturbed impurity distribution
function, J0 and J1 are the Bessel functions of the first kind,
zz ¼ k?v?=xcz, k? ¼ kh
ffiffiffiffiffiffiffiffiffiffiffiffiffiffiffiffiffi1þ s2h2
p, s is the magnetic shear,
h is the ballooning angle, xcz ¼ ZeB=ðc mzÞ is the cyclotron
frequency, and /�, dA�k, and dB�k are the complex conjugates
of the perturbed electrostatic potential and the transverse and
compressional magnetic perturbations, respectively.
In order to find the impurity peaking factor, we make a
scan in a=Lnz at a fixed a=Lne and vary a=Lni in order to satisfy
the quasi-neutrality condition. Using an interpolation scheme,
we then search for the a=Lnz corresponding to zero flux. Here,
Lna ¼ �½@ðln naÞ=@r��1and LTa ¼ �½@ðln TaÞ=@r��1
are the
density and temperature scale lengths and a is the outermost
minor radius.
In the calculations presented in this section, we have
used two sets of local profile parameters given in Table I.
Here, qtor is defined as
qtor ¼ffiffiffiffiffiffiffiffiffiffiffiffiffiffiffiffiffiffiffiffiffiffivtðrÞ=vtðaÞ
p; (2)
where 2pvt is the toroidal flux, and qs is the ion sound Lar-
mor radius. To take into account the plasma shape, we have
used a Miller-type local equilibrium model available in
GYRO, see Refs. 19 and 20. Typical JET parameters for
plasma shape and magnetic geometry are used, and the cor-
responding values are given in Table II.
In this table, be is calculated in CGS units following the
expression:
be ¼8pðne½1019=m3� 10�6 1019ÞðTe½keV� 1:6022 10�9Þ
ð104 Bunit½T�Þ2;
(3)
where Bunit is defined as the effective field strength, see Refs.
19 and 20,
Bunit ¼1
r
dvt
dr: (4)
The safety factor is q ¼ dvt=dw, with 2pw being the poloidal
flux, and the magnetic shear is s ¼ ðr=qÞdq=dr. Furthermore,
e is the inverse aspect ratio, j is the elongation, d is the trian-
gularity, f is flux surface squareness, and Zmag is the eleva-
tion of the flux surface. The convention of defining be in
terms of Bunit is specific to GYRO and not to gyrokinetic
codes in general. We note that Bunit in shaped plasmas is not
equal to the on-axis magnetic field �B, because the effective
TABLE I. Input parameters for densities, temperatures and their gradients.
qtor r ne½1019=m3� Te½keV� a=Lne a=LTi a=LTe Ti=Te qs=a
case 1 0.3 0.347 3.0 7.0 1.5 2.5 2.0 0.85 0.0035
case 2 0.5 0.555 2.5 3.8 1.0 3.0 1.5 0.84 0.0028
TABLE II. Input parameters for plasma shape and magnetic geometry.
be 1=e Bunit½T� s q j d f Zmag
case 1 0.0047 3.36 4.22 0.56 1.29 1.31 0.024 0.0053 0.22
case 2 0.0016 3.34 4.68 1.06 1.91 1.36 0.058 �0.0023 0.21
032301-2 Moradi et al. Phys. Plasmas 19, 032301 (2012)
radius r is defined as the half width of the flux surface at the
elevation of its centroid, and thus the toroidal flux inside a
given flux surface is generally not equal to r2p �B. Since for
elongated flux surfaces (j > 1), the area of the cross section
of the flux surface is larger than pr2 and the effective field is
roughly j times larger than the on-axis field. It is important
that it is be, defined with the effective field, that matters for
the stability of KBMs, and it is reduced by approximately a
factor of 1=j2 compared to a be defined with �B. This should
be taken into account when the experimental be is compared
to gyrokinetic simulations.
The normalized poloidal wave number is fixed to
khqs ¼ 0:3. These are the baseline cases in our study, and
these parameters will be used unless otherwise stated. The
impurities are assumed to be present in trace quantities, in
the sense that Znz=ne � 1 (nz=ne ¼ 2� 10�3 is used in the
simulations). These cases are taken from nickel laser blow
off experiments at JET, featuring the injection of Radio Fre-
quency (RF) power at ITER relevant collisionalities
(�eff < 0:2) (shot number 68383).15
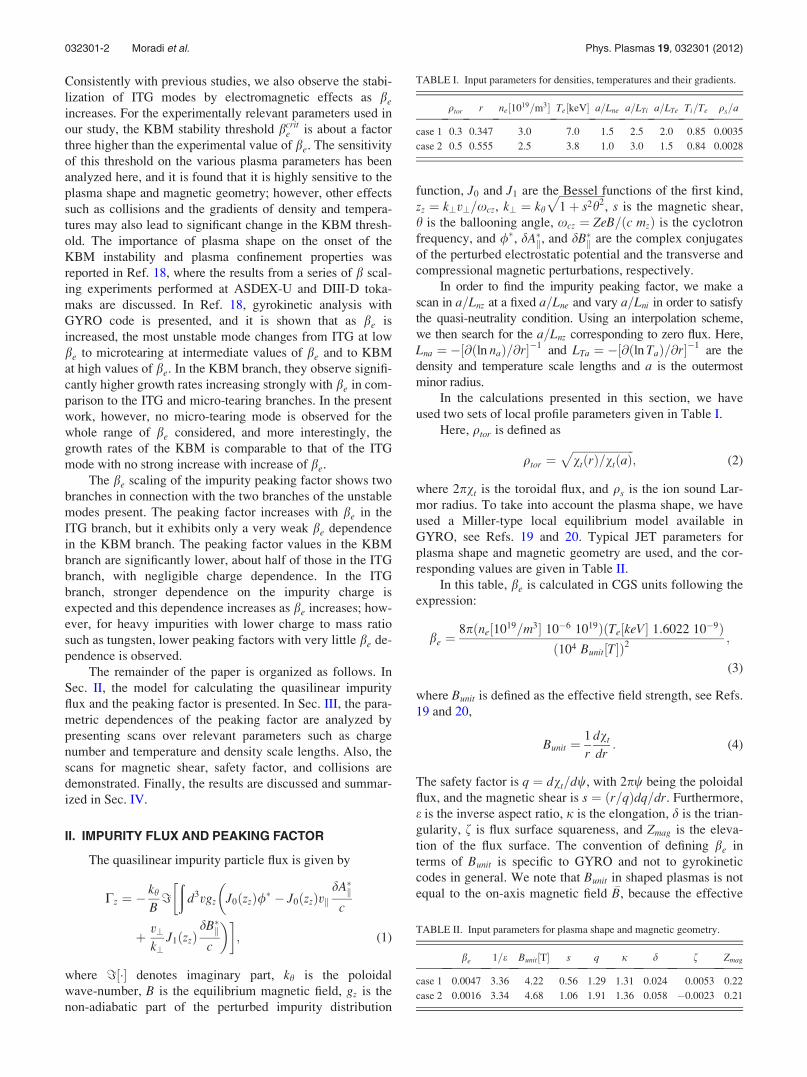
Figure 1 shows the growth rates and real frequencies of
the unstable modes for the baseline parameters of case 1.
These results are obtained using the eigenvalue solver method
in the GYRO code.17 As can be seen in this figure, the ITG
mode is the most unstable mode for be < 0:015 with a subdo-
minant KBM present for the interval of 0:01 < be < 0:015.
For be > 0:015, the most unstable mode present is the KBM
and the ITG mode coexists as a subdominant mode having
positive growth rate even at be ¼ 0:02. No trapped electron
(TE) mode is unstable, in this case, for the whole range of be
considered. The real frequency of the KBM branch is signifi-
cantly higher than that of the ITG branch; however, the maxi-
mal growth rates are comparable for the two modes.
To demonstrate how important the proper choice of the
model geometry is in our analysis, we have considered a test
case using a model based on s-a geometry available in GYRO.
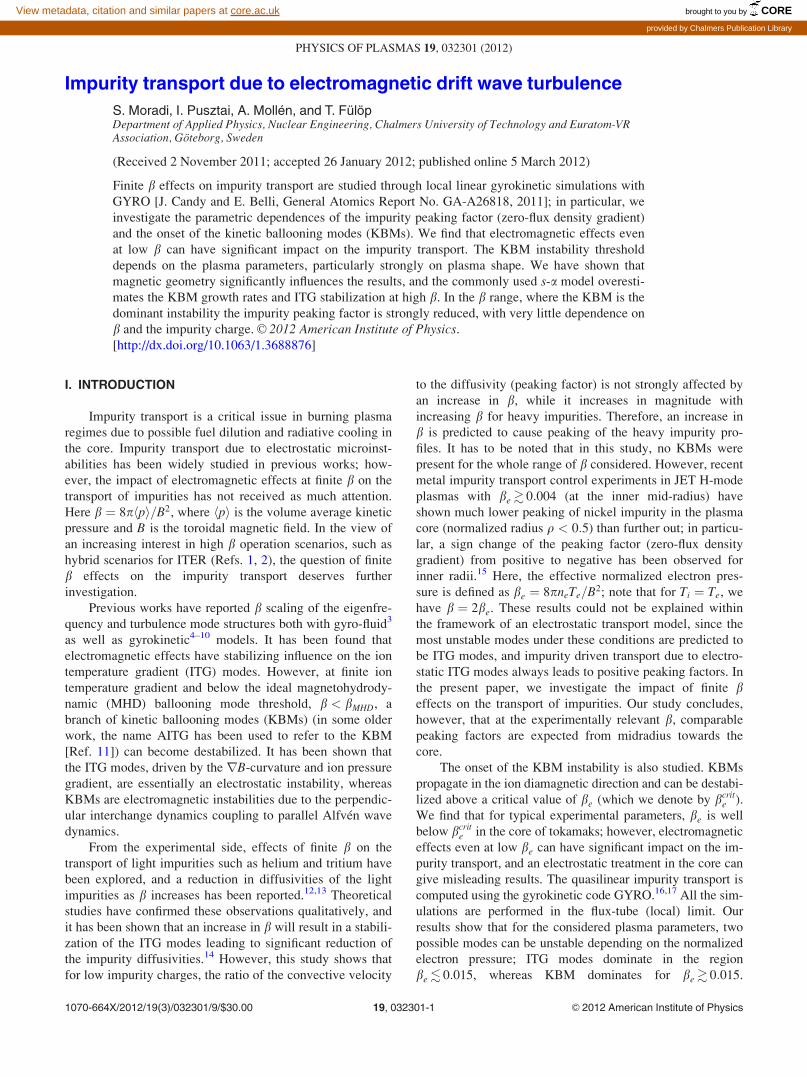
The results are shown in Fig. 2, which shows the growth rates
and real frequencies of the unstable modes for the baseline pa-
rameters of case 1. Here, the so called generalized magnetohy-
drodynamic a parameter is defined as (see Ref. 20)
ap ¼ �q2R0
8p
B2unit
dp
drcp; (5)
where R0 is the effective major radius, r is the minor radius,
and p ¼P
a naTa is the total plasma pressure. cp is the geo-
metric pressure gradient scaling parameter which allows an
artificial adjustment of ap without modifying the background
gradients as presented in Ref. 7. The connection between the
two geometry models: Miller-type local equilibrium and s-ageometry are explained in details in Ref. 20. In short, s-amodel can be recovered from a Miller-type local equilibrium
by taking the limit r=R0 ! 0. As seen in Fig. 2, the results
are significantly different between the two models. With the
s-a model, the onset of the KBM has not changed, but its
growth rate is now significantly higher than that of the ITG
mode and it is strongly increasing with be. Also, the ITG
mode is completely stabilized for be > 0:012, whilst it still
coexists as a subdominant mode with a Miller-type model as
shown in Fig. 1. Since the s-a model is less accurate in defin-
ing the plasma shape, and as it is shown later that plasma
shape and magnetic geometry have significant impact on the
results, in the remainder of the present paper, we only use
the Miller-type model.
Even though the results shown in Fig. 1 indicate that two
branches of unstable modes can coexist in a certain range of
be, in the following, we only consider the most unstable
mode for calculating the impurity peaking factor. We adopted
this simplification, because linear theory does not provide the
absolute magnitude of the perturbed quantities, and accord-
ingly, the fluxes driven by the different branches cannot be
compared (or simply added together). This approximation is
expected to be valid in the limits where the ratio of the ITG
and TE mode growth rates is not close to unity.
FIG. 1. (Color online) Real and imaginary parts of the eigenfrequency
xþ ic as function of be obtained using the eigenvalue solver method in
GYRO for the baseline case 1 using a model based on the Miller-type local
equilibrium model. Red lines (with circle markers) represent the real part;
blue lines (triangle markers) correspond to the imaginary part of the eigen-
value. Solid lines correspond to the ITG branch and dashed lines represent
the KBM branch. The frequencies are normalized to cs=a. The vertical line
represents the experimental value of be.
FIG. 2. (Color online) Real and imaginary parts of the eigenfrequency
xþ ic as function of be obtained using the eigenvalue solver method in
GYRO for the baseline case 1 using a model based on s-a geometry. Red
lines (with circle markers) represent the real part; blue lines (triangle
markers) correspond to the imaginary part of the eigenvalue. Solid lines cor-
respond to the ITG branch and dashed lines represent the KBM branch. The
frequencies are normalized to cs=a. The vertical line represents the experi-
mental value of be.
032301-3 Electromagnetic drift wave turbulence Phys. Plasmas 19, 032301 (2012)
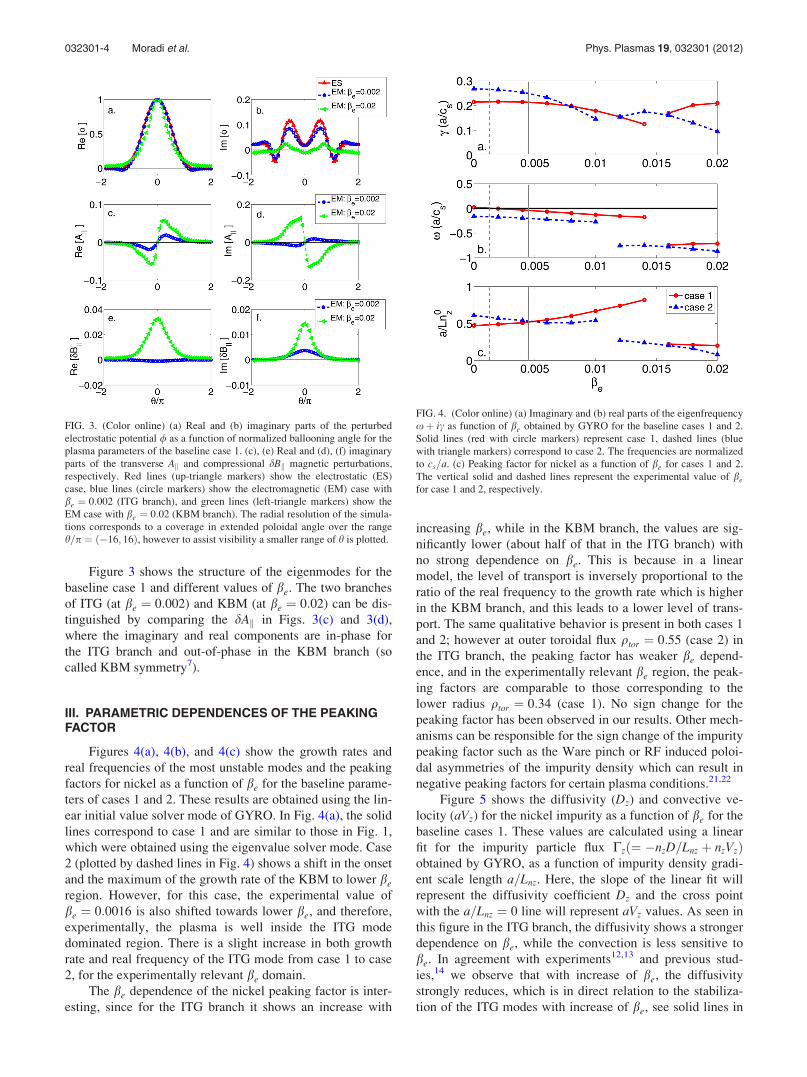
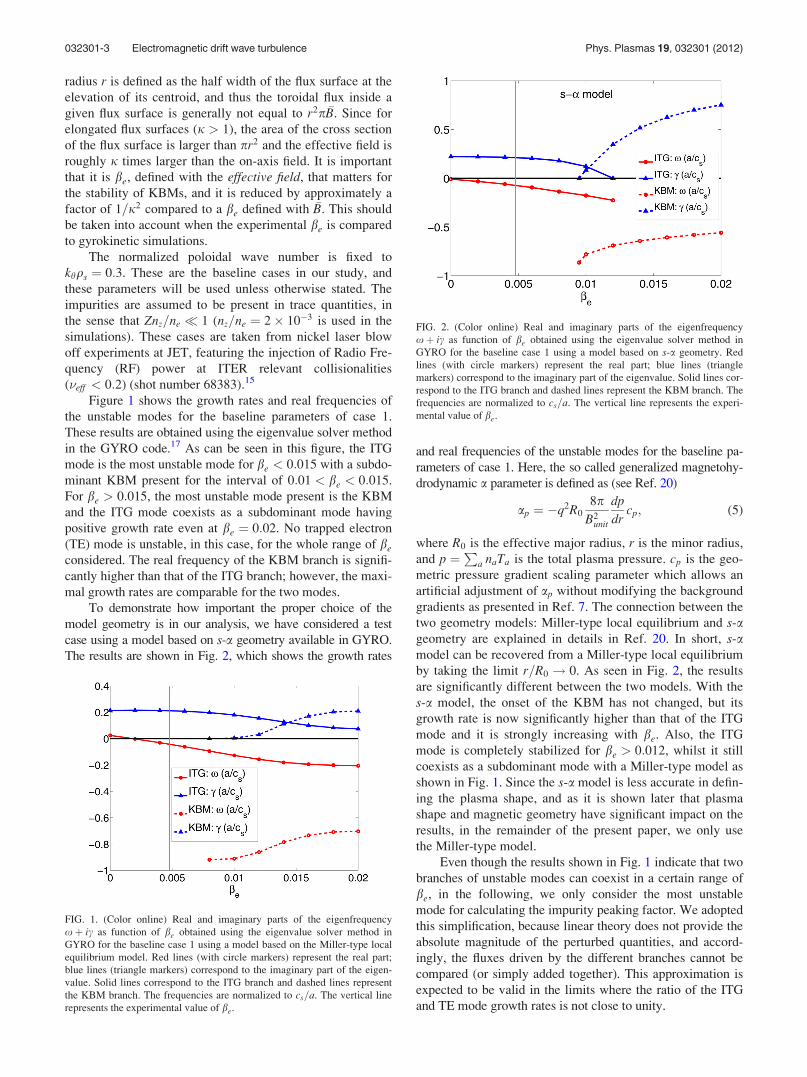
Figure 3 shows the structure of the eigenmodes for the
baseline case 1 and different values of be. The two branches
of ITG (at be ¼ 0:002) and KBM (at be ¼ 0:02) can be dis-
tinguished by comparing the dAk in Figs. 3(c) and 3(d),
where the imaginary and real components are in-phase for
the ITG branch and out-of-phase in the KBM branch (so
called KBM symmetry7).
III. PARAMETRIC DEPENDENCES OF THE PEAKINGFACTOR
Figures 4(a), 4(b), and 4(c) show the growth rates and
real frequencies of the most unstable modes and the peaking
factors for nickel as a function of be for the baseline parame-
ters of cases 1 and 2. These results are obtained using the lin-
ear initial value solver mode of GYRO. In Fig. 4(a), the solid
lines correspond to case 1 and are similar to those in Fig. 1,
which were obtained using the eigenvalue solver mode. Case
2 (plotted by dashed lines in Fig. 4) shows a shift in the onset
and the maximum of the growth rate of the KBM to lower be
region. However, for this case, the experimental value of
be ¼ 0:0016 is also shifted towards lower be, and therefore,
experimentally, the plasma is well inside the ITG mode
dominated region. There is a slight increase in both growth
rate and real frequency of the ITG mode from case 1 to case
2, for the experimentally relevant be domain.
The be dependence of the nickel peaking factor is inter-
esting, since for the ITG branch it shows an increase with
increasing be, while in the KBM branch, the values are sig-
nificantly lower (about half of that in the ITG branch) with
no strong dependence on be. This is because in a linear
model, the level of transport is inversely proportional to the
ratio of the real frequency to the growth rate which is higher
in the KBM branch, and this leads to a lower level of trans-
port. The same qualitative behavior is present in both cases 1
and 2; however at outer toroidal flux qtor ¼ 0:55 (case 2) in
the ITG branch, the peaking factor has weaker be depend-
ence, and in the experimentally relevant be region, the peak-
ing factors are comparable to those corresponding to the
lower radius qtor ¼ 0:34 (case 1). No sign change for the
peaking factor has been observed in our results. Other mech-
anisms can be responsible for the sign change of the impurity
peaking factor such as the Ware pinch or RF induced poloi-
dal asymmetries of the impurity density which can result in
negative peaking factors for certain plasma conditions.21,22
Figure 5 shows the diffusivity (Dz) and convective ve-
locity (aVz) for the nickel impurity as a function of be for the
baseline cases 1. These values are calculated using a linear
fit for the impurity particle flux Czð¼ �nzD=Lnz þ nzVzÞobtained by GYRO, as a function of impurity density gradi-
ent scale length a=Lnz. Here, the slope of the linear fit will
represent the diffusivity coefficient Dz and the cross point
with the a=Lnz ¼ 0 line will represent aVz values. As seen in
this figure in the ITG branch, the diffusivity shows a stronger
dependence on be, while the convection is less sensitive to
be. In agreement with experiments12,13 and previous stud-
ies,14 we observe that with increase of be, the diffusivity
strongly reduces, which is in direct relation to the stabiliza-
tion of the ITG modes with increase of be, see solid lines in
FIG. 3. (Color online) (a) Real and (b) imaginary parts of the perturbed
electrostatic potential / as a function of normalized ballooning angle for the
plasma parameters of the baseline case 1. (c), (e) Real and (d), (f) imaginary
parts of the transverse Ak and compressional dBk magnetic perturbations,
respectively. Red lines (up-triangle markers) show the electrostatic (ES)
case, blue lines (circle markers) show the electromagnetic (EM) case with
be ¼ 0:002 (ITG branch), and green lines (left-triangle markers) show the
EM case with be ¼ 0:02 (KBM branch). The radial resolution of the simula-
tions corresponds to a coverage in extended poloidal angle over the range
h=p ¼ ð�16; 16Þ, however to assist visibility a smaller range of h is plotted.
FIG. 4. (Color online) (a) Imaginary and (b) real parts of the eigenfrequency
xþ ic as function of be obtained by GYRO for the baseline cases 1 and 2.
Solid lines (red with circle markers) represent case 1, dashed lines (blue
with triangle markers) correspond to case 2. The frequencies are normalized
to cs=a. (c) Peaking factor for nickel as a function of be for cases 1 and 2.
The vertical solid and dashed lines represent the experimental value of be
for case 1 and 2, respectively.
032301-4 Moradi et al. Phys. Plasmas 19, 032301 (2012)
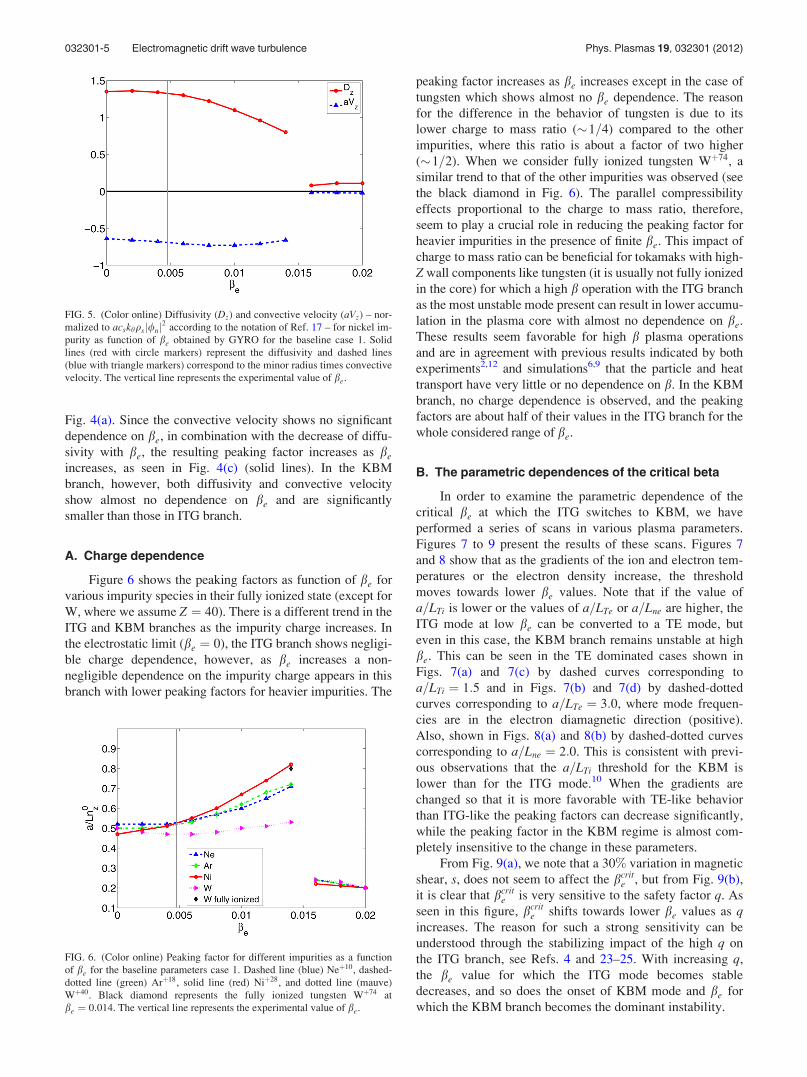
Fig. 4(a). Since the convective velocity shows no significant
dependence on be, in combination with the decrease of diffu-
sivity with be, the resulting peaking factor increases as be
increases, as seen in Fig. 4(c) (solid lines). In the KBM
branch, however, both diffusivity and convective velocity
show almost no dependence on be and are significantly
smaller than those in ITG branch.
A. Charge dependence
Figure 6 shows the peaking factors as function of be for
various impurity species in their fully ionized state (except for
W, where we assume Z ¼ 40). There is a different trend in the
ITG and KBM branches as the impurity charge increases. In
the electrostatic limit (be ¼ 0), the ITG branch shows negligi-
ble charge dependence, however, as be increases a non-
negligible dependence on the impurity charge appears in this
branch with lower peaking factors for heavier impurities. The
peaking factor increases as be increases except in the case of
tungsten which shows almost no be dependence. The reason
for the difference in the behavior of tungsten is due to its
lower charge to mass ratio (�1=4) compared to the other
impurities, where this ratio is about a factor of two higher
(�1=2). When we consider fully ionized tungsten Wþ74, a
similar trend to that of the other impurities was observed (see
the black diamond in Fig. 6). The parallel compressibility
effects proportional to the charge to mass ratio, therefore,
seem to play a crucial role in reducing the peaking factor for
heavier impurities in the presence of finite be. This impact of
charge to mass ratio can be beneficial for tokamaks with high-
Z wall components like tungsten (it is usually not fully ionized
in the core) for which a high b operation with the ITG branch
as the most unstable mode present can result in lower accumu-
lation in the plasma core with almost no dependence on be.
These results seem favorable for high b plasma operations
and are in agreement with previous results indicated by both
experiments2,12 and simulations6,9 that the particle and heat
transport have very little or no dependence on b. In the KBM
branch, no charge dependence is observed, and the peaking
factors are about half of their values in the ITG branch for the
whole considered range of be.
B. The parametric dependences of the critical beta
In order to examine the parametric dependence of the
critical be at which the ITG switches to KBM, we have
performed a series of scans in various plasma parameters.
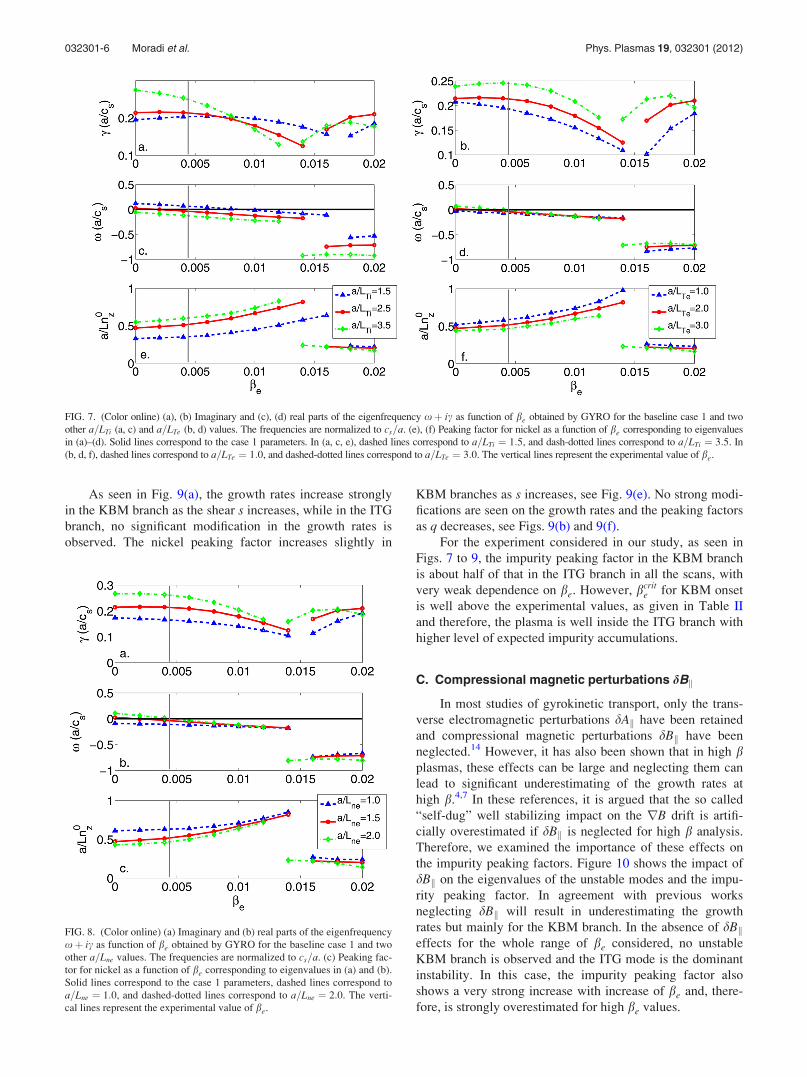
Figures 7 to 9 present the results of these scans. Figures 7
and 8 show that as the gradients of the ion and electron tem-
peratures or the electron density increase, the threshold
moves towards lower be values. Note that if the value of
a=LTi is lower or the values of a=LTe or a=Lne are higher, the
ITG mode at low be can be converted to a TE mode, but
even in this case, the KBM branch remains unstable at high
be. This can be seen in the TE dominated cases shown in
Figs. 7(a) and 7(c) by dashed curves corresponding to
a=LTi ¼ 1:5 and in Figs. 7(b) and 7(d) by dashed-dotted
curves corresponding to a=LTe ¼ 3:0, where mode frequen-
cies are in the electron diamagnetic direction (positive).
Also, shown in Figs. 8(a) and 8(b) by dashed-dotted curves
corresponding to a=Lne ¼ 2:0. This is consistent with previ-
ous observations that the a=LTi threshold for the KBM is
lower than for the ITG mode.10 When the gradients are
changed so that it is more favorable with TE-like behavior
than ITG-like the peaking factors can decrease significantly,
while the peaking factor in the KBM regime is almost com-
pletely insensitive to the change in these parameters.
From Fig. 9(a), we note that a 30% variation in magnetic
shear, s, does not seem to affect the bcrite , but from Fig. 9(b),
it is clear that bcrite is very sensitive to the safety factor q. As
seen in this figure, bcrite shifts towards lower be values as q
increases. The reason for such a strong sensitivity can be
understood through the stabilizing impact of the high q on
the ITG branch, see Refs. 4 and 23–25. With increasing q,
the be value for which the ITG mode becomes stable
decreases, and so does the onset of KBM mode and be for
which the KBM branch becomes the dominant instability.
FIG. 5. (Color online) Diffusivity (Dz) and convective velocity (aVz) – nor-
malized to acskhqsj/nj2 according to the notation of Ref. 17 – for nickel im-
purity as function of be obtained by GYRO for the baseline case 1. Solid
lines (red with circle markers) represent the diffusivity and dashed lines
(blue with triangle markers) correspond to the minor radius times convective
velocity. The vertical line represents the experimental value of be.
FIG. 6. (Color online) Peaking factor for different impurities as a function
of be for the baseline parameters case 1. Dashed line (blue) Neþ10, dashed-
dotted line (green) Arþ18, solid line (red) Niþ28, and dotted line (mauve)
Wþ40. Black diamond represents the fully ionized tungsten Wþ74 at
be ¼ 0:014. The vertical line represents the experimental value of be.
032301-5 Electromagnetic drift wave turbulence Phys. Plasmas 19, 032301 (2012)
As seen in Fig. 9(a), the growth rates increase strongly
in the KBM branch as the shear s increases, while in the ITG
branch, no significant modification in the growth rates is
observed. The nickel peaking factor increases slightly in
KBM branches as s increases, see Fig. 9(e). No strong modi-
fications are seen on the growth rates and the peaking factors
as q decreases, see Figs. 9(b) and 9(f).
For the experiment considered in our study, as seen in
Figs. 7 to 9, the impurity peaking factor in the KBM branch
is about half of that in the ITG branch in all the scans, with
very weak dependence on be. However, bcrite for KBM onset
is well above the experimental values, as given in Table II
and therefore, the plasma is well inside the ITG branch with
higher level of expected impurity accumulations.
C. Compressional magnetic perturbations dBk
In most studies of gyrokinetic transport, only the trans-
verse electromagnetic perturbations dAk have been retained
and compressional magnetic perturbations dBk have been
neglected.14 However, it has also been shown that in high bplasmas, these effects can be large and neglecting them can
lead to significant underestimating of the growth rates at
high b.4,7 In these references, it is argued that the so called
“self-dug” well stabilizing impact on the rB drift is artifi-
cially overestimated if dBk is neglected for high b analysis.
Therefore, we examined the importance of these effects on
the impurity peaking factors. Figure 10 shows the impact of
dBk on the eigenvalues of the unstable modes and the impu-
rity peaking factor. In agreement with previous works
neglecting dBk will result in underestimating the growth
rates but mainly for the KBM branch. In the absence of dBkeffects for the whole range of be considered, no unstable
KBM branch is observed and the ITG mode is the dominant
instability. In this case, the impurity peaking factor also
shows a very strong increase with increase of be and, there-
fore, is strongly overestimated for high be values.
FIG. 7. (Color online) (a), (b) Imaginary and (c), (d) real parts of the eigenfrequency xþ ic as function of be obtained by GYRO for the baseline case 1 and two
other a=LTi (a, c) and a=LTe (b, d) values. The frequencies are normalized to cs=a. (e), (f) Peaking factor for nickel as a function of be corresponding to eigenvalues
in (a)–(d). Solid lines correspond to the case 1 parameters. In (a, c, e), dashed lines correspond to a=LTi ¼ 1:5, and dash-dotted lines correspond to a=LTi ¼ 3:5. In
(b, d, f), dashed lines correspond to a=LTe ¼ 1:0, and dashed-dotted lines correspond to a=LTe ¼ 3:0. The vertical lines represent the experimental value of be.
FIG. 8. (Color online) (a) Imaginary and (b) real parts of the eigenfrequency
xþ ic as function of be obtained by GYRO for the baseline case 1 and two
other a=Lne values. The frequencies are normalized to cs=a. (c) Peaking fac-
tor for nickel as a function of be corresponding to eigenvalues in (a) and (b).
Solid lines correspond to the case 1 parameters, dashed lines correspond to
a=Lne ¼ 1:0, and dashed-dotted lines correspond to a=Lne ¼ 2:0. The verti-
cal lines represent the experimental value of be.
032301-6 Moradi et al. Phys. Plasmas 19, 032301 (2012)
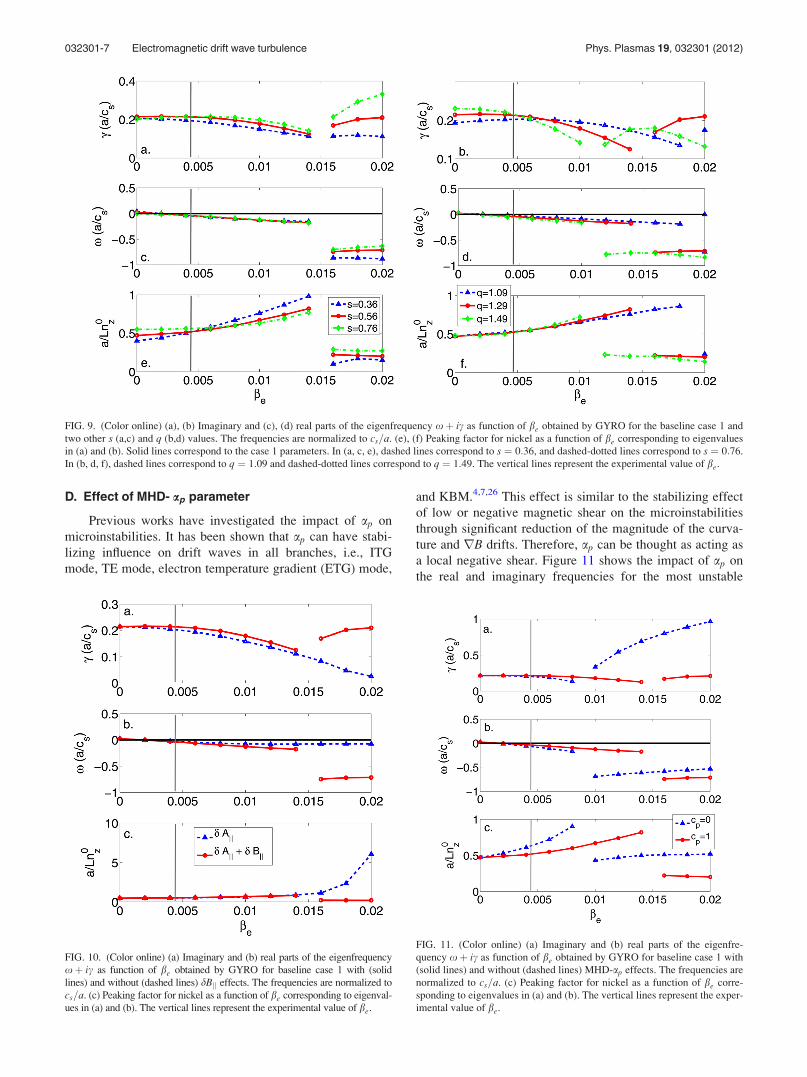
D. Effect of MHD- ap parameter
Previous works have investigated the impact of ap on
microinstabilities. It has been shown that ap can have stabi-
lizing influence on drift waves in all branches, i.e., ITG
mode, TE mode, electron temperature gradient (ETG) mode,
and KBM.4,7,26 This effect is similar to the stabilizing effect
of low or negative magnetic shear on the microinstabilities
through significant reduction of the magnitude of the curva-
ture and rB drifts. Therefore, ap can be thought as acting as
a local negative shear. Figure 11 shows the impact of ap on
the real and imaginary frequencies for the most unstable
FIG. 10. (Color online) (a) Imaginary and (b) real parts of the eigenfrequency
xþ ic as function of be obtained by GYRO for baseline case 1 with (solid
lines) and without (dashed lines) dBk effects. The frequencies are normalized to
cs=a. (c) Peaking factor for nickel as a function of be corresponding to eigenval-
ues in (a) and (b). The vertical lines represent the experimental value of be.
FIG. 9. (Color online) (a), (b) Imaginary and (c), (d) real parts of the eigenfrequency xþ ic as function of be obtained by GYRO for the baseline case 1 and
two other s (a,c) and q (b,d) values. The frequencies are normalized to cs=a. (e), (f) Peaking factor for nickel as a function of be corresponding to eigenvalues
in (a) and (b). Solid lines correspond to the case 1 parameters. In (a, c, e), dashed lines correspond to s ¼ 0:36, and dashed-dotted lines correspond to s ¼ 0:76.
In (b, d, f), dashed lines correspond to q ¼ 1:09 and dashed-dotted lines correspond to q ¼ 1:49. The vertical lines represent the experimental value of be.
FIG. 11. (Color online) (a) Imaginary and (b) real parts of the eigenfre-
quency xþ ic as function of be obtained by GYRO for baseline case 1 with
(solid lines) and without (dashed lines) MHD-ap effects. The frequencies are
normalized to cs=a. (c) Peaking factor for nickel as a function of be corre-
sponding to eigenvalues in (a) and (b). The vertical lines represent the exper-
imental value of be.
032301-7 Electromagnetic drift wave turbulence Phys. Plasmas 19, 032301 (2012)
modes and on impurity peaking factor, where ap varies from
0.076 in the ITG branch (be ¼0.002) to 0.76 in the KBM
branch (be ¼ 0:02). As seen here by comparing the cases
with (solid lines) and without (dashed lines) MHD-a effects,
ap has a significant stabilizing impact on the KBM growth
rates, but interestingly, the ITG growth rates are even
enhanced when the MHD-a is retained. However, ap has the
same effect regarding the peaking factors both in the ITG
and the KBM regions; Fig. 11(c) shows a strong reduction in
both ITG and KBM branches when ap effects are included.
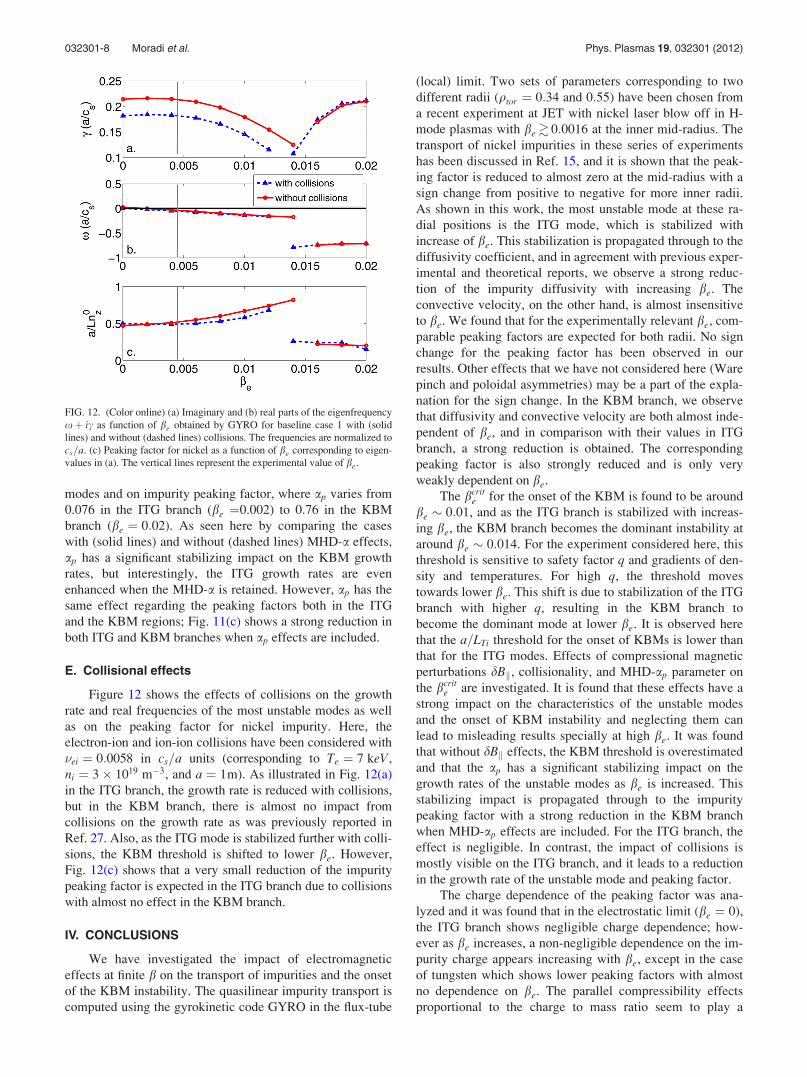
E. Collisional effects
Figure 12 shows the effects of collisions on the growth
rate and real frequencies of the most unstable modes as well
as on the peaking factor for nickel impurity. Here, the
electron-ion and ion-ion collisions have been considered with
�ei ¼ 0:0058 in cs=a units (corresponding to Te ¼ 7 keV,
ni ¼ 3� 1019 m�3, and a ¼ 1m). As illustrated in Fig. 12(a)
in the ITG branch, the growth rate is reduced with collisions,
but in the KBM branch, there is almost no impact from
collisions on the growth rate as was previously reported in
Ref. 27. Also, as the ITG mode is stabilized further with colli-
sions, the KBM threshold is shifted to lower be. However,
Fig. 12(c) shows that a very small reduction of the impurity
peaking factor is expected in the ITG branch due to collisions
with almost no effect in the KBM branch.
IV. CONCLUSIONS
We have investigated the impact of electromagnetic
effects at finite b on the transport of impurities and the onset
of the KBM instability. The quasilinear impurity transport is
computed using the gyrokinetic code GYRO in the flux-tube
(local) limit. Two sets of parameters corresponding to two
different radii (qtor ¼ 0:34 and 0:55) have been chosen from
a recent experiment at JET with nickel laser blow off in H-
mode plasmas with be& 0:0016 at the inner mid-radius. The
transport of nickel impurities in these series of experiments
has been discussed in Ref. 15, and it is shown that the peak-
ing factor is reduced to almost zero at the mid-radius with a
sign change from positive to negative for more inner radii.
As shown in this work, the most unstable mode at these ra-
dial positions is the ITG mode, which is stabilized with
increase of be. This stabilization is propagated through to the
diffusivity coefficient, and in agreement with previous exper-
imental and theoretical reports, we observe a strong reduc-
tion of the impurity diffusivity with increasing be. The
convective velocity, on the other hand, is almost insensitive
to be. We found that for the experimentally relevant be, com-
parable peaking factors are expected for both radii. No sign
change for the peaking factor has been observed in our
results. Other effects that we have not considered here (Ware
pinch and poloidal asymmetries) may be a part of the expla-
nation for the sign change. In the KBM branch, we observe
that diffusivity and convective velocity are both almost inde-
pendent of be, and in comparison with their values in ITG
branch, a strong reduction is obtained. The corresponding
peaking factor is also strongly reduced and is only very
weakly dependent on be.
The bcrite for the onset of the KBM is found to be around
be � 0:01, and as the ITG branch is stabilized with increas-
ing be, the KBM branch becomes the dominant instability at
around be � 0:014. For the experiment considered here, this
threshold is sensitive to safety factor q and gradients of den-
sity and temperatures. For high q, the threshold moves
towards lower be. This shift is due to stabilization of the ITG
branch with higher q, resulting in the KBM branch to
become the dominant mode at lower be. It is observed here
that the a=LTi threshold for the onset of KBMs is lower than
that for the ITG modes. Effects of compressional magnetic
perturbations dBk, collisionality, and MHD-ap parameter on
the bcrite are investigated. It is found that these effects have a
strong impact on the characteristics of the unstable modes
and the onset of KBM instability and neglecting them can
lead to misleading results specially at high be. It was found
that without dBk effects, the KBM threshold is overestimated
and that the ap has a significant stabilizing impact on the
growth rates of the unstable modes as be is increased. This
stabilizing impact is propagated through to the impurity
peaking factor with a strong reduction in the KBM branch
when MHD-ap effects are included. For the ITG branch, the
effect is negligible. In contrast, the impact of collisions is
mostly visible on the ITG branch, and it leads to a reduction
in the growth rate of the unstable mode and peaking factor.
The charge dependence of the peaking factor was ana-
lyzed and it was found that in the electrostatic limit (be ¼ 0),
the ITG branch shows negligible charge dependence; how-
ever as be increases, a non-negligible dependence on the im-
purity charge appears increasing with be, except in the case
of tungsten which shows lower peaking factors with almost
no dependence on be. The parallel compressibility effects
proportional to the charge to mass ratio seem to play a
FIG. 12. (Color online) (a) Imaginary and (b) real parts of the eigenfrequency
xþ ic as function of be obtained by GYRO for baseline case 1 with (solid
lines) and without (dashed lines) collisions. The frequencies are normalized to
cs=a. (c) Peaking factor for nickel as a function of be corresponding to eigen-
values in (a). The vertical lines represent the experimental value of be.
032301-8 Moradi et al. Phys. Plasmas 19, 032301 (2012)
crucial role in reducing the peaking factor for heavier impur-
ities in the presence of finite be effects. This impact of
charge to mass ratio can be beneficial for tokamaks with
high-Z wall components like tungsten for which lower accu-
mulations in the core can be possible in high b plasma opera-
tions. In the KBM branch, no charge dependence is
observed.
In conclusion, in the core of H-mode plasmas where be
can be high enough for the ITG modes to be strongly stabi-
lized, the impurity diffusivity is reduced. However, since the
impurity convective velocity is almost independent of be, the
corresponding peaking factor increases with be. For not fully
ionized heavy impurities like tungsten, however, lower peak-
ing factors and no dependence on be is expected. In the view
of the new all tungsten divertor at the JET tokamak, b scal-
ing experiments are needed in order to confirm these results.
The KBM instability threshold can be much lower than the
ideal MHD threshold depending on the plasma parameters
and particularly strongly on plasma shape. Due to the impor-
tance of the magnetic geometry, the model geometry used in
the gyrokinetic simulations can affect the results signifi-
cantly, and the commonly used s-a model overestimates the
KBM growth rates and ITG stabilization at high b.
ACKNOWLEDGMENTS
The authors would like to thank J. Candy for the valua-
ble comments and for providing the GYRO code. This work
was funded by the European Communities under Association
Contract between EURATOM and Vetenskapsradet. The
views and opinions expressed herein do not necessarily
reflect those of the European Commission.
1M. Shimada, D. J. Campbell, V. Mukhovatov, M. Fujiwara, N. Kirneva,
K. Lackner, M. Nagami, V. D. Pustovitov, N. Uckan, and J. Wesley Inter-
national Tokamak Physics Activity Topical Group Chairs, Cochairs and
Chapter Coordinators: N. Asakura, A. E. Costley, A. J. H. Donne, E. J.
Doyle, A. Fasoli, C. Gormezano, Y. Gribov, O. Gruber, T. C. Hender, W.
Houlberg, S. Ide, Y. Kamada, A. Leonard, B. Lipschultz, A. Loarte, K.
Miyamoto, V. Mukhovatov, T. H. Osborne, A. Polevoi, and A. C. C. Sips,
Nucl. Fusion 47, S1 (2007).
2D. C. McDonald, L. Laborde, J. C. DeBoo, F. Ryter, M. Brix, C. D. Chal-
lis, P. de Vries, C. Giroud, J. Hobrik, D. Howell, E. Joffrin, T. C. Luce, J.
Mailloux, V. Pericoli-Ridolfini, A. C. C. Sips, K. Thomsen, and JET
EFDA Contributors, Plasma Phys. Controlled Fusion 50, 124013 (2008).3P. B. Snyder and G. W. Hammett, Phys. Plasmas 8, 744 (2001).4C. Bourdelle, W. Dorland, X. Garbet, G. W. Hammett, M. Kotschen-
reuther, G. Rewoldt, and E. J. Synakowski, Phys. Plasmas 7, 2881 (2003).5J. Y. Kim, W. Horton, and J. Q. Dong, Phys. Fluids B 5, 4030 (1993).6J. Candy, Phys. Plasmas 12, 072307 (2005).7E. A. Belli and J. Candy, Phys. Plasmas 17, 112314 (2010).8F. Jenko and W. Dorland, Plasma Phys. Controlled Fusion 43, A141 (2001).9M. J. Pueschel, M. Kammerer, and F. Jenko, Phys. Plasmas 15, 102310
(2008).10G. Zhao and L. Chen, Phys. Plasmas 9, 861 (2002).11J. Dong, Nucl. Fusion 39, 1041 (1999).12C. C. Petty, T. C. Luce, D. C. McDonald, J. Mandrekas, M. R. Wade, J.
Candy, J. G. Cordey, V. Drozdov, T. E. Evans, J. R. Ferron, R. J. Groeb-
ner, A. W. Hyatt, G. L. Jackson, R. J. La Haye, T. H. Osborne, and R. E.
Waltz, Phys. Plasmas 11, 2514 (2004).13K.-D. Zastrow, J. M. Adams, Yu Baranov, P. Belo, L. Bertalot, J. H. Brzo-
zowski, C. D. Challis, S. Conroy, M. de Baar, P. de Vries, P. Dumortier, J.
Ferreira, L. Garzotti, T. C. Hender, E. Joffrin, V. Kiptily, J. Mailloux, D.
C. McDonald, R. Neu, M. O’Mullane, M. F. F. Nave, J. Ongena, S. Popo-
vichev, M. Stamp, J. Stober, D. Stork, I. Voitsekhovitch, M. Valovic, H.
Weisen, A. D. Whiteford, A. Zabolotsky, and JET EFDA Contributors,
Plasma Phys. Controlled Fusion 46, B255 (2004).14T. Hein, C. Angioni, E. Fable, and J. Candy, Phys. Plasmas 17, 102309
(2010).15M. Valisa, L. Carraro, I. Predebon, M. E. Puiatti, C. Angioni, I. Coffey, C.
Giroud, L. Lauro Taroni, B. Alper, M. Baruzzo, P. Belo daSilva, P. Bur-
atti, L. Garzotti, D. Van Eester, E. Lerche, P. Mantica, V. Naulin, T. Tala,
M. Tsalas, and JET-EFDA contributors, Nucl. Fusion 51, 033002 (2011).16J. Candy and R. E. Waltz, J. Comput. Phys. 186, 545 (2003).17J. Candy and E. Belli, General Atomics Report No. GA-A26818, 2011.18C. F. Maggi, R. J. Groebner, C. Angioni, T. Hein, L. D. Horton, C. Konz,
A. W. Leonard, C. C. Petty, A. C. C. Sips, P. B. Snyder, J. Candy, R. E.
Waltz, ASDEX Upgrade, and DIII-D teams, Nucl. Fusion 50, 025023
(2010).19R. E. Waltz and R. L. Miller, Phys. Plasmas 6, 4265 (1999).20J. Candy, Plasma Phys. Controlled Fusion 51, 105009 (2009).21T. Fulop and S. Moradi, Phys. Plasmas 18, 030703 (2011).22S. Moradi, T. Fulop, A. Mollen, and I. Pusztai, Plasma Phys. Controlled
Fusion 53, 115008 (2011).23K. H. Burrell, Phys. Plasmas 4, 1499 (1997).24X. Garbet, C. Bourdelle, G. T. Hoang, P. Maget, S. Benkadda, P. Beyer,
C. Figarella, I. Voitsekovitch, O. Agullo, and N. Bian, Phys. Plasmas 8,
2793 (2011).25J. E. Kinsey, R. E. Waltz, and J. Candy, Phys. Plasmas 13, 022305 (2006).26C. Bourdelle, Nucl. Fusion 45, 110 (2005).27G. Rewoldt, W. M. Tang, and R. J. Hastie, Phys. Fluids 30, 807 (1987).
032301-9 Electromagnetic drift wave turbulence Phys. Plasmas 19, 032301 (2012)